Introduction
A precise knowledge of the fluid flow and aerosol transport dynamics in the respiratory is essential for assessing respiratory health and the efficient design of the targeted drug delivery devices. Inhalation therapy is usually used to treat chronic obstructive pulmonary diseases and bronchial asthma (Murphy et al., 2000). Inhalation is preferable to oral delivery and injection for drug absorption due to the lung’s effective absorption area and thin epithelial cells (Sakagami, 2006). The benefit of this method is the administration of medications that are hard to be absorbed, such as peptides, which cannot be absorbed from the gastrointestinal tract. Inhalation can be roughly classified into two types, including metered dosage inhalation and dry powder inhalation (Newman, 2005; Telko et al., 2005). The therapeutic activity of inhalation therapy is the inhaled drugs deposited in the respiratory system (Rahman et al., 2022; Sécher et al., 2019). For targeted drug delivery to the specific position of the airways, it is essential to understand the airflow characteristics, drug transport and deposition within the specific area along the airway. Realistic airway models are employed to analyse airflow dynamics and related aerosol deposition through computational fluid-particle dynamics (Koullapis et al., 2018). For the microparticle size drug delivery, particles mostly deposit in the oral airways because of inertial impaction and strong turbulence dispersion in the mouth-throat region (Kleinstreuer et al., 2008). The airway wall is considered a fully trapped wall for the boundary condition of the particle-wall interaction, as the layers of mucus always cover the inner wall of the airways (Garcia et al., 2007). Most of the available studies on particle deposition in the lung mostly used the computational fluid dynamics-discrete phase model (CFD-DPM). Standard Euler-Lagrange methods are usually used for the CFD-DPM as these methods are reliable in such situations for estimating aerosol transport in airways. However, the CFD-DPM model is limited to the transport but the interaction between the fluid, particle, and wall surfaces (Vulović et al., 2018). The particle-to-particle and particle-to-wall collisions are the key factors that significantly affect particle passage and deposition in airway bifurcations, especially when significant levels of aerosols are breathed or dense pharmaceutical particle suspensions are supplied for targeting the lung (Feng et al., 2014).
The computational fluid dynamics-discrete element method (CFD-DEM) is one of the appropriate techniques to analyse the realistic transport behaviour of aerosol in airways. The CFD-DEM method can accurately analyse the individual particle’s motion and particle collision behaviour inside the respiratory system (Chen et al., 2012; Branco Junior et al., 2015). An idealised pulmonary airway model was applied to examine the properties of particle transportation and deposition under the CFD-DEM (Chen et al., 2012). The study did not analyse the comprehensive interaction behaviour, particle deposition and deposition hot spot in airways. Almost all of the available studies only focused on investigating airflow patterns and particle deposition within realistic and idealised airways. They used the CFD-DPM approach instead of the CFD-DEM method. A comprehensive investigation of using CFD-DEM with two-way coupling for dense particle suspension flow in a realistic lung model is required to understand the particle motion in airways. Therefore, this study aims to develop a modelling framework for CFD-DEM and analyse the deposition behaviour of the inhaled aerosol in realistic airways for the first time. To understand how particle deposition behaves in the respiratory system and their reachability, the CFD-DEM model is employed in computational simulations in the current study by using the realistic central part of the human lung airway. The CFD-DEM model analyses particle transport quantitatively while taking spherical particles and their interactions with the surface of the human respiratory system. This study compares the effect of the particle-particle interaction on the airflow characteristic and particle deposition between the realistic lung model and the non-realistic lung model. Furthermore, the effect of particle-particle interaction on the airflow patterns and particle deposition is also compared to the case without particle interaction.
Methodology
Geometrical Generation
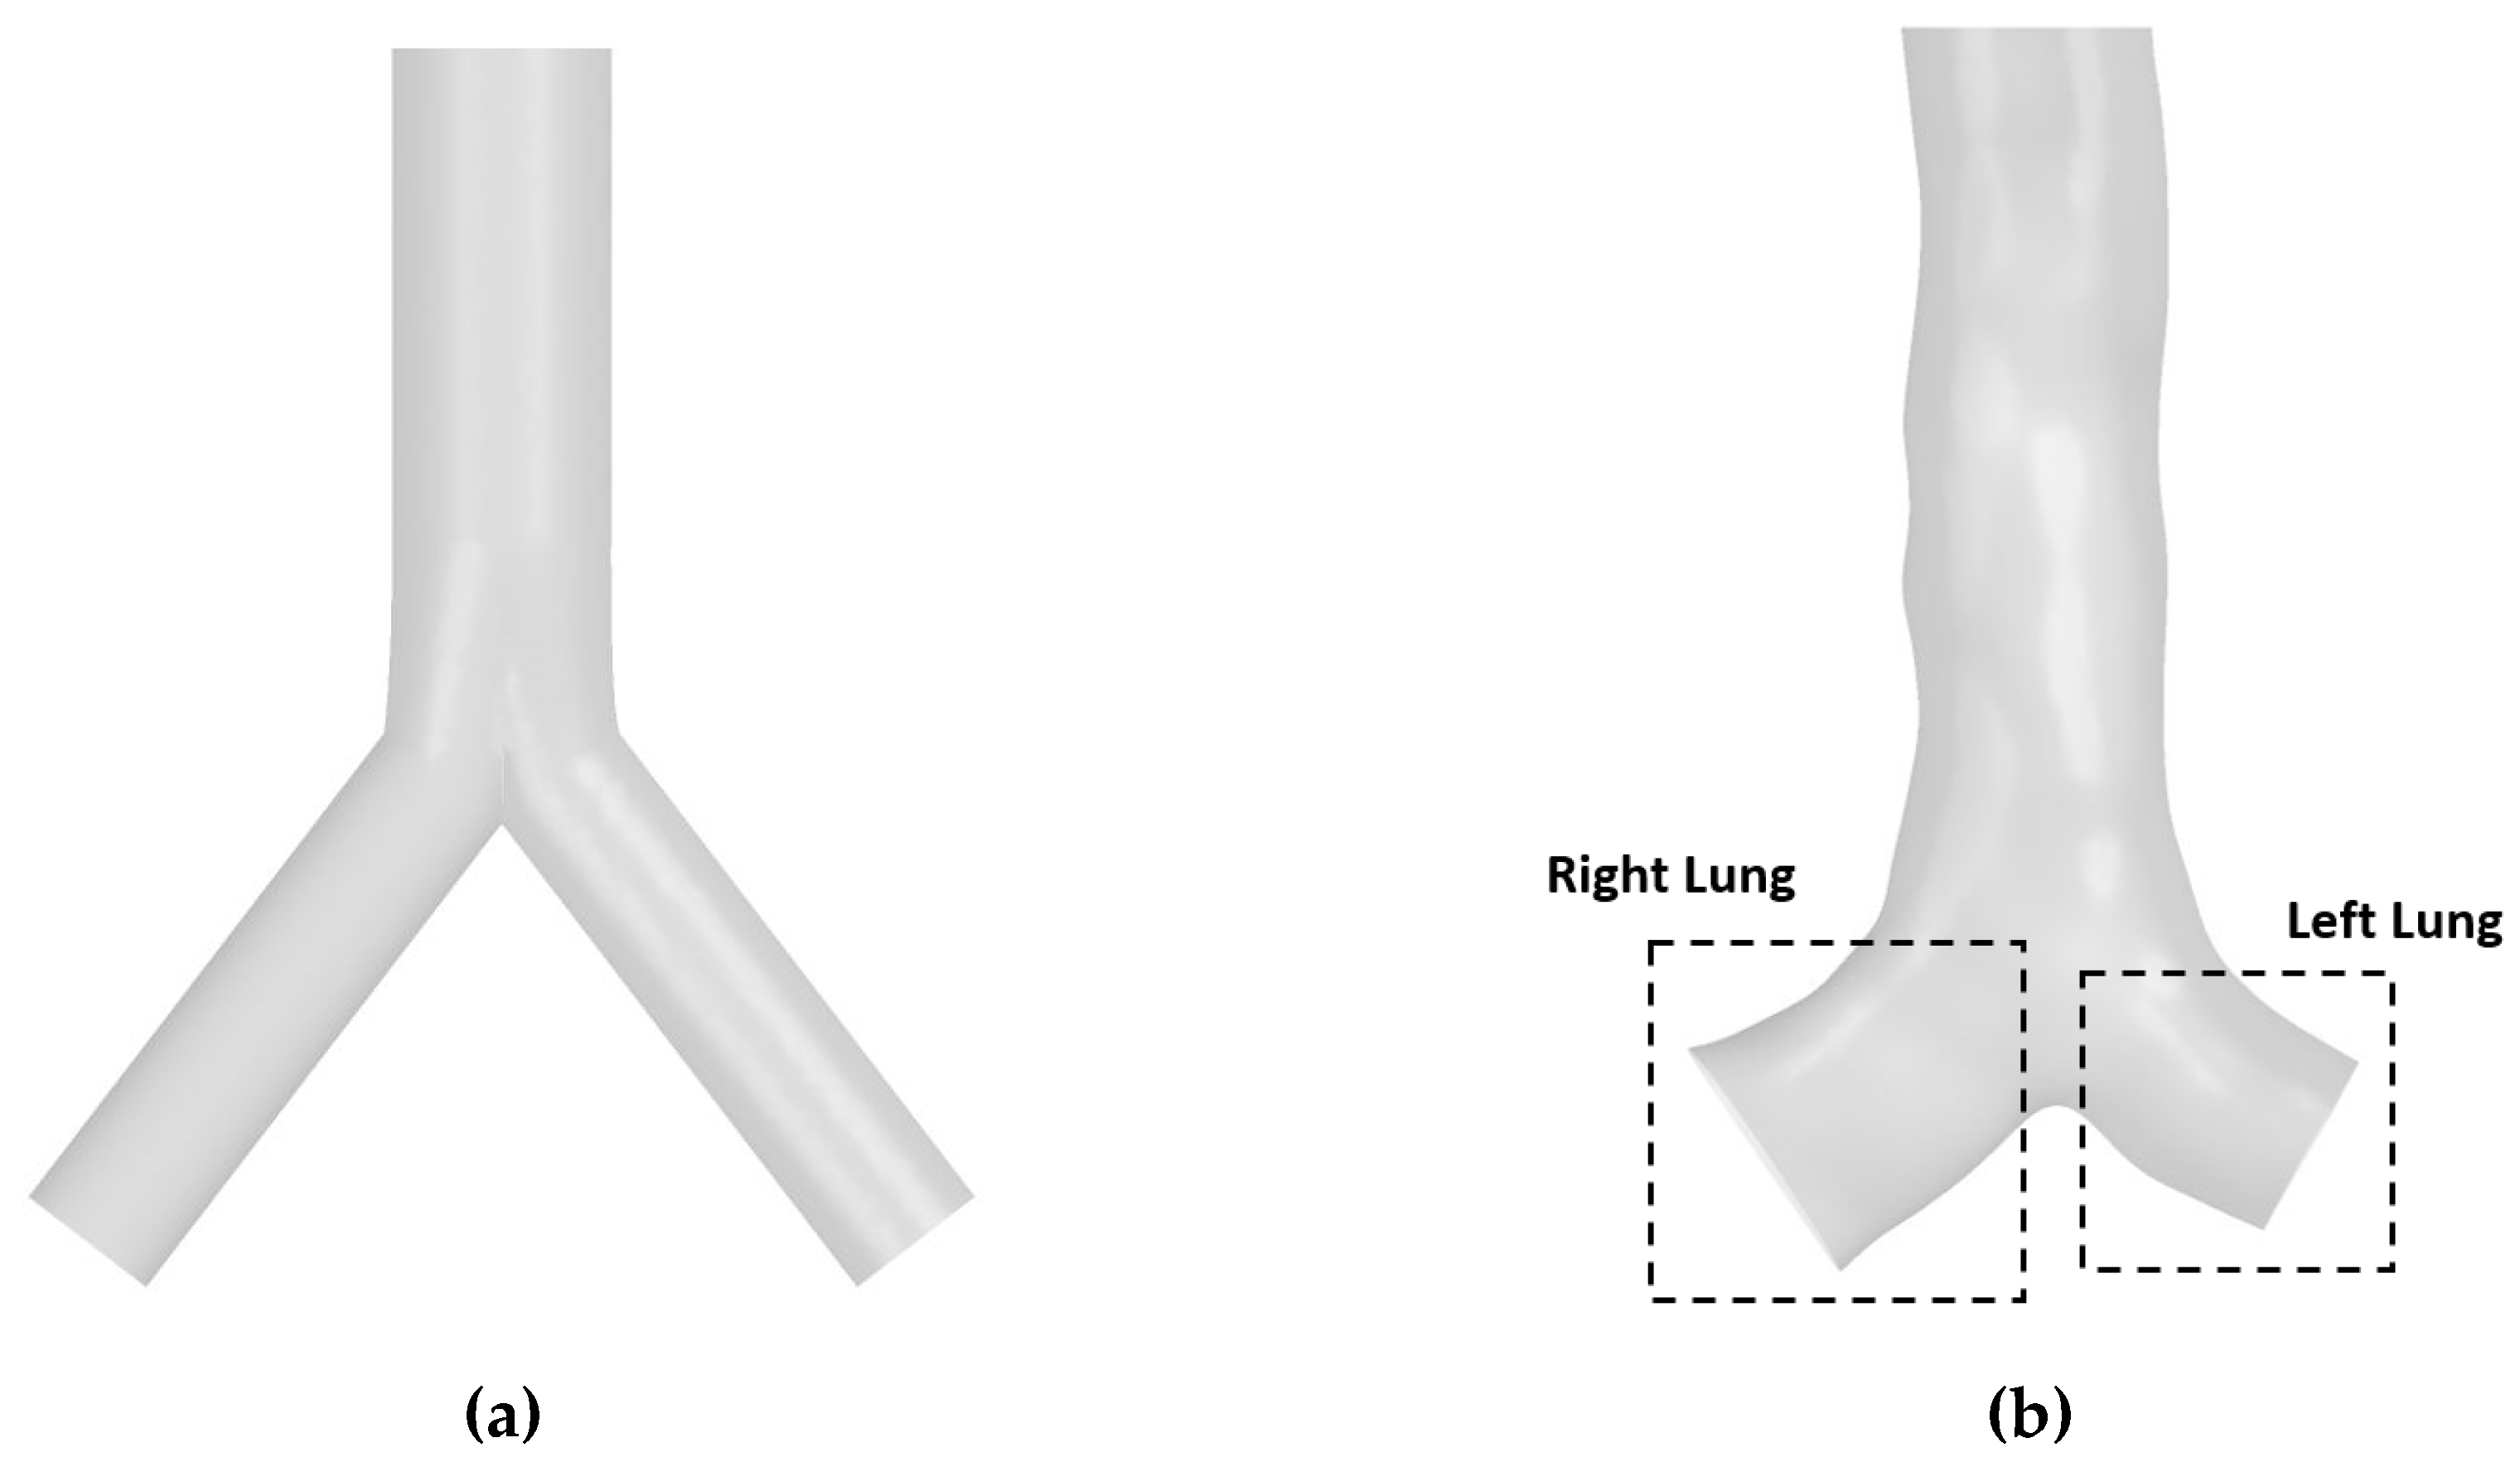
Two geometrical lung models of the central airway were employed in this study and presented in
Figure 1. These included the idealised model and the realistic model. The idealised lung model of the central airway was created by using SolidWorks based on Weibel’s dimension (Weibel 1963). For the realistic model, the three-dimensional model of a central airway was created from the CT image of the upper airway from 51 years healthy male, which was used in the previous study (Islam et al., 2019).
Figure 1a illustrates the symmetric lung model for a non-realistic case, while
Figure 1b presents the realistic model of the lung at the central airway.
Mesh Generation and Validation
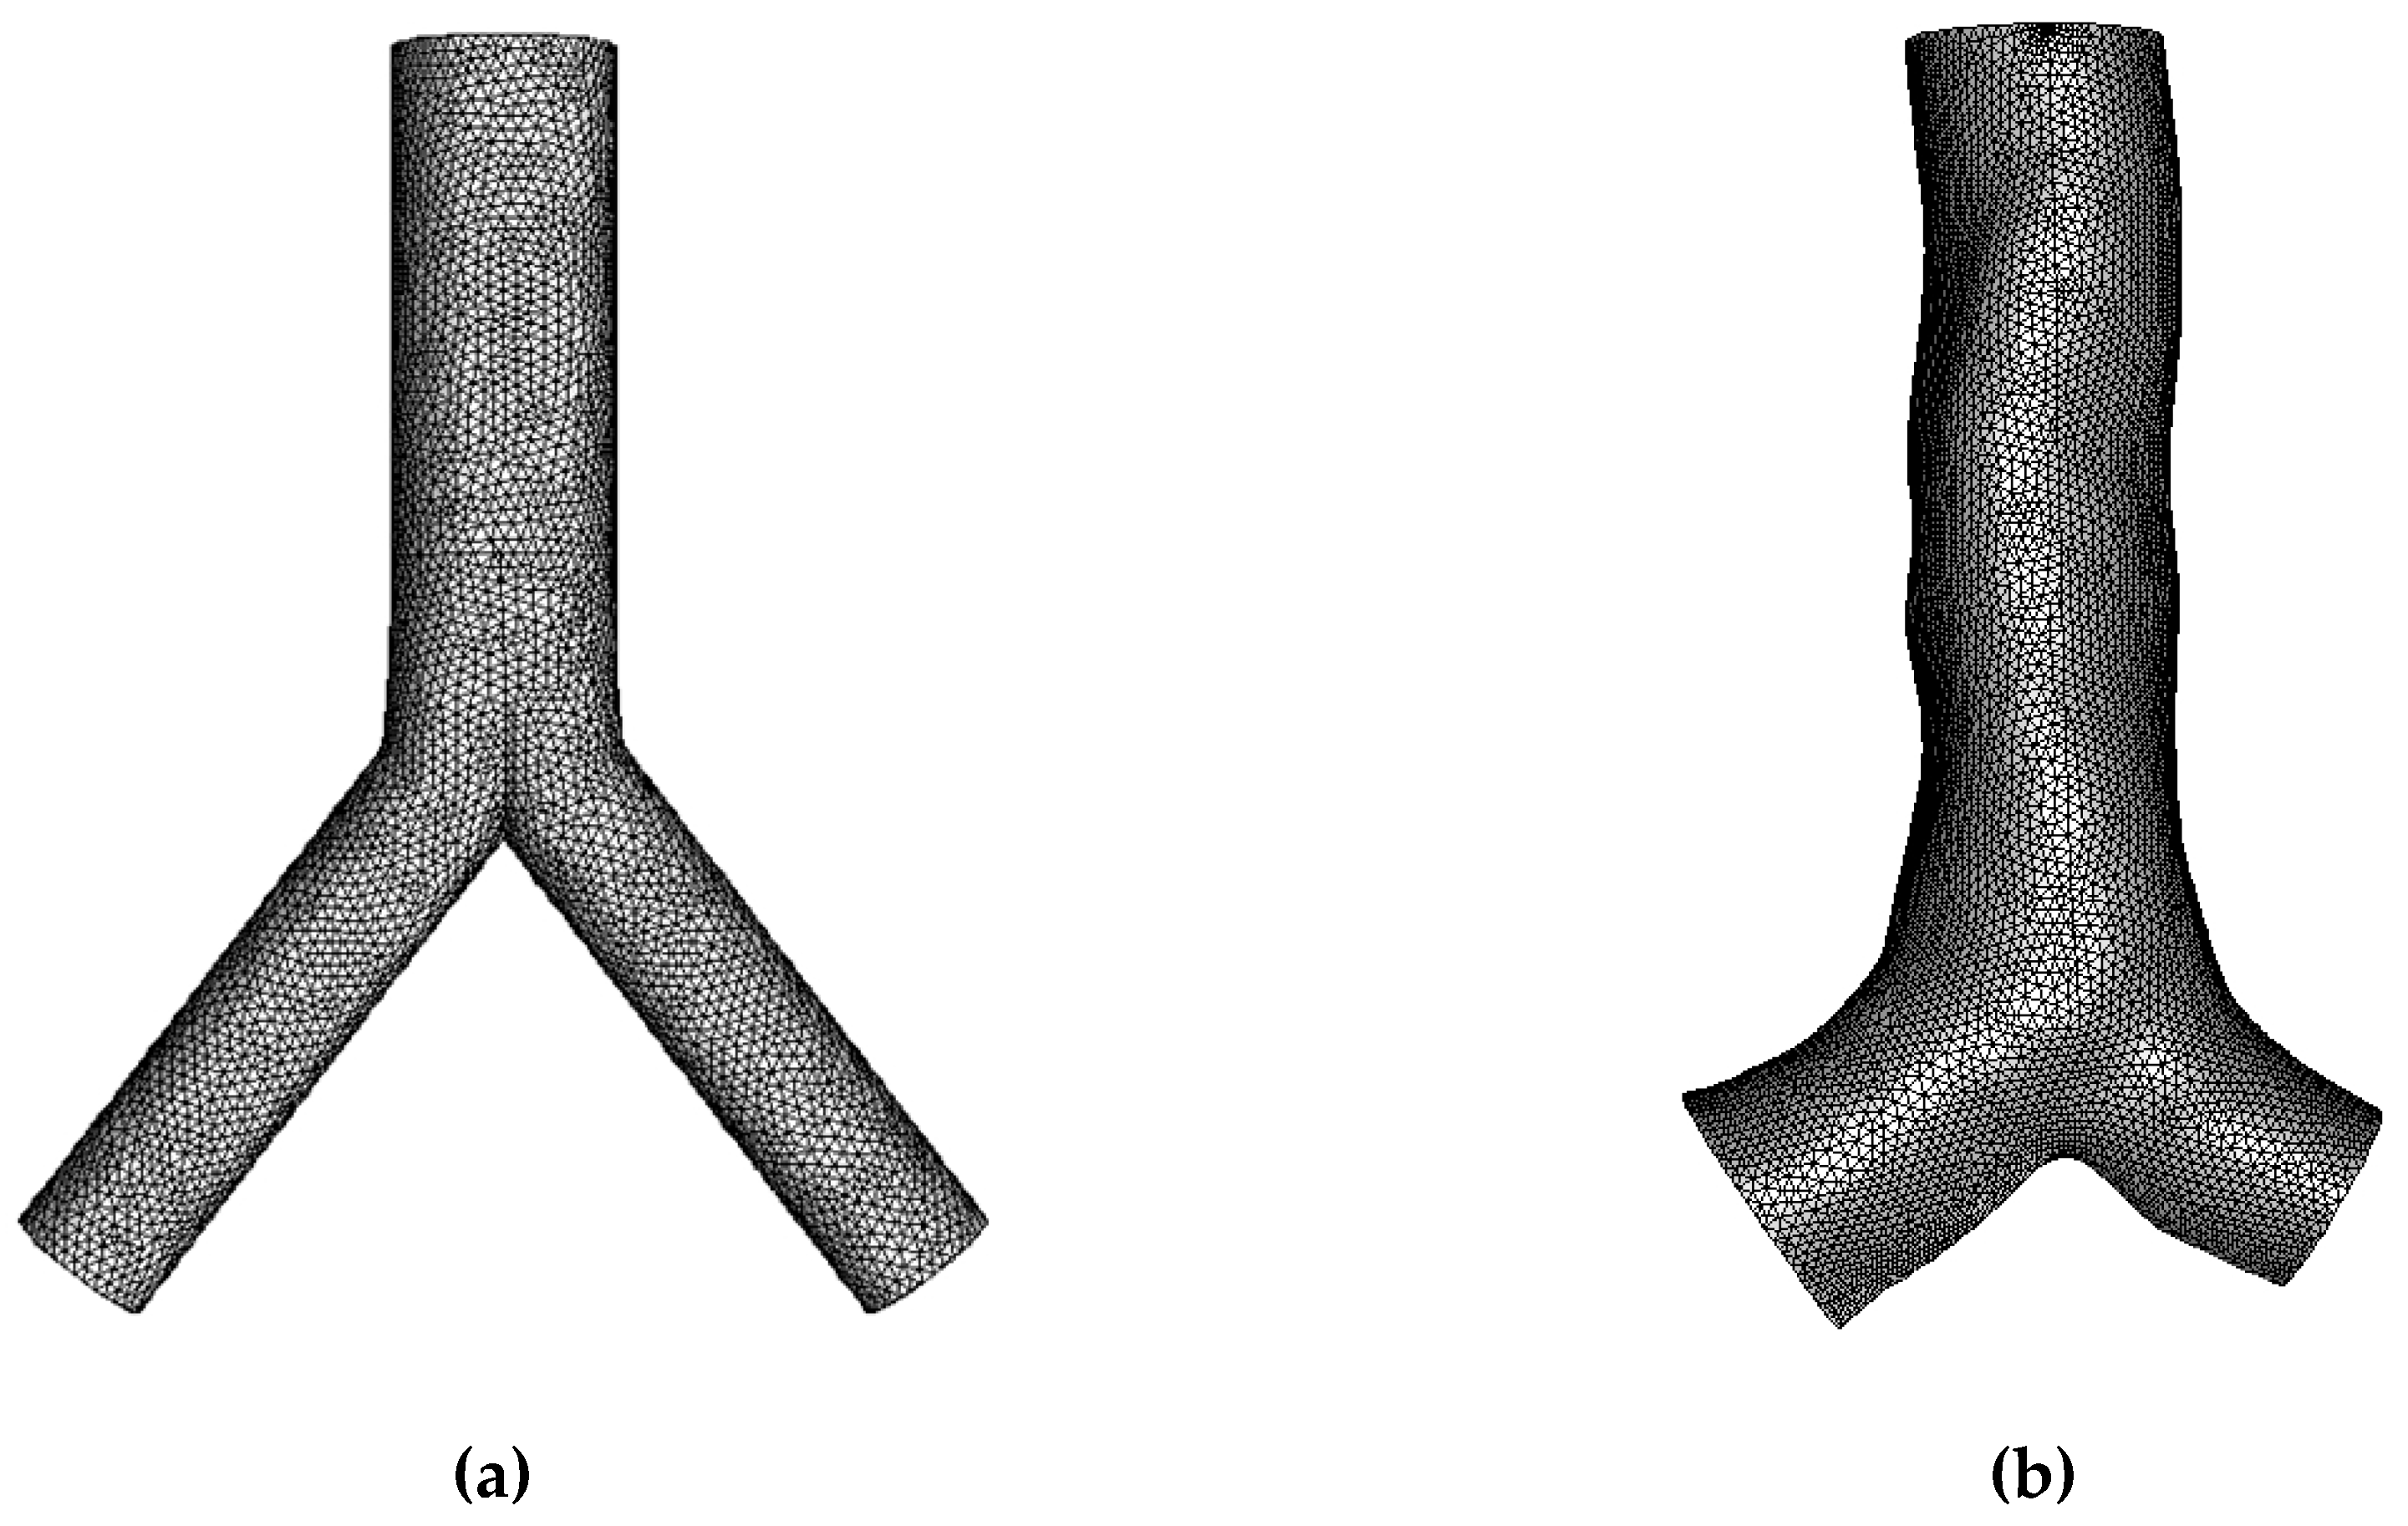
The commercial software ANSYS was used to create unstructured tetrahedral elements with the inclusion of an inflation layer for the mesh treatment at the wall. The mesh quality is checked, and the orthogonal quality (minimum) is 0.19 for the final mesh. The grid refinement test was performed under various parameters. The results from this test indicated that all of the values from selected parameters were stable at 7.2 million computation elements. More details regarding mesh generation and mesh test can be found in the author’s previous work (Islam et al., 2019). The unstructured mesh for the final model is presented in
Figure 2.
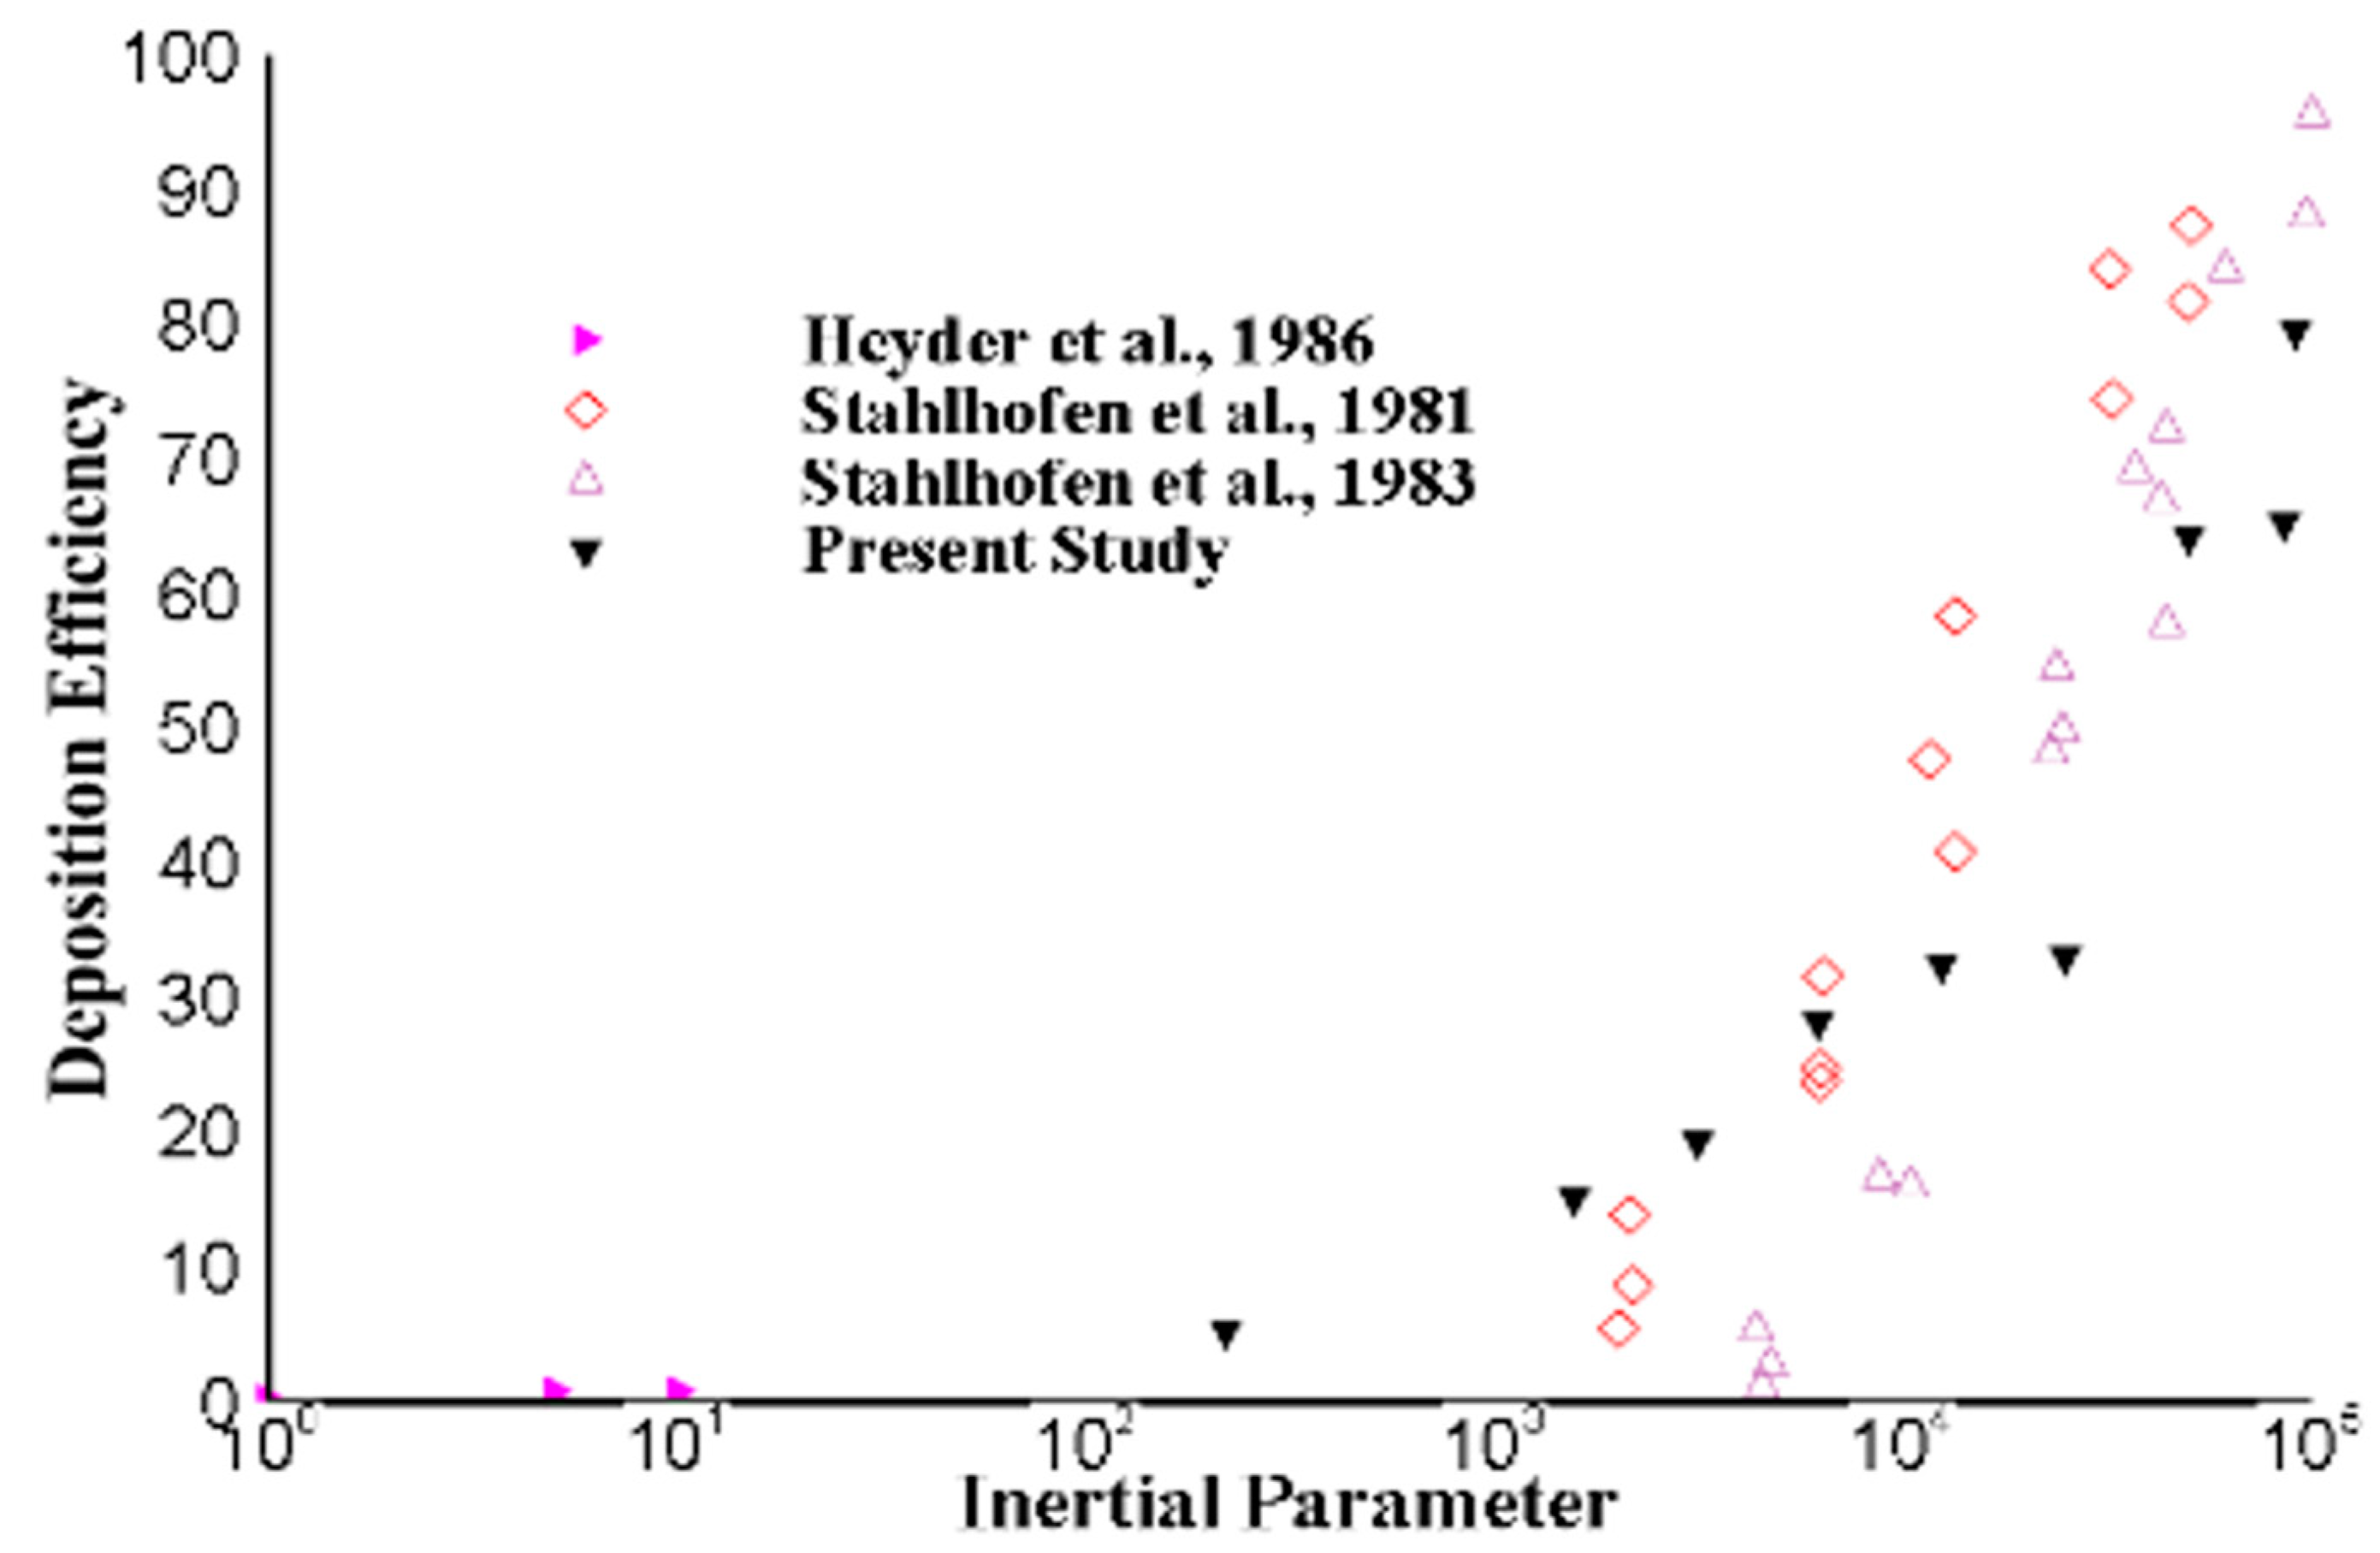
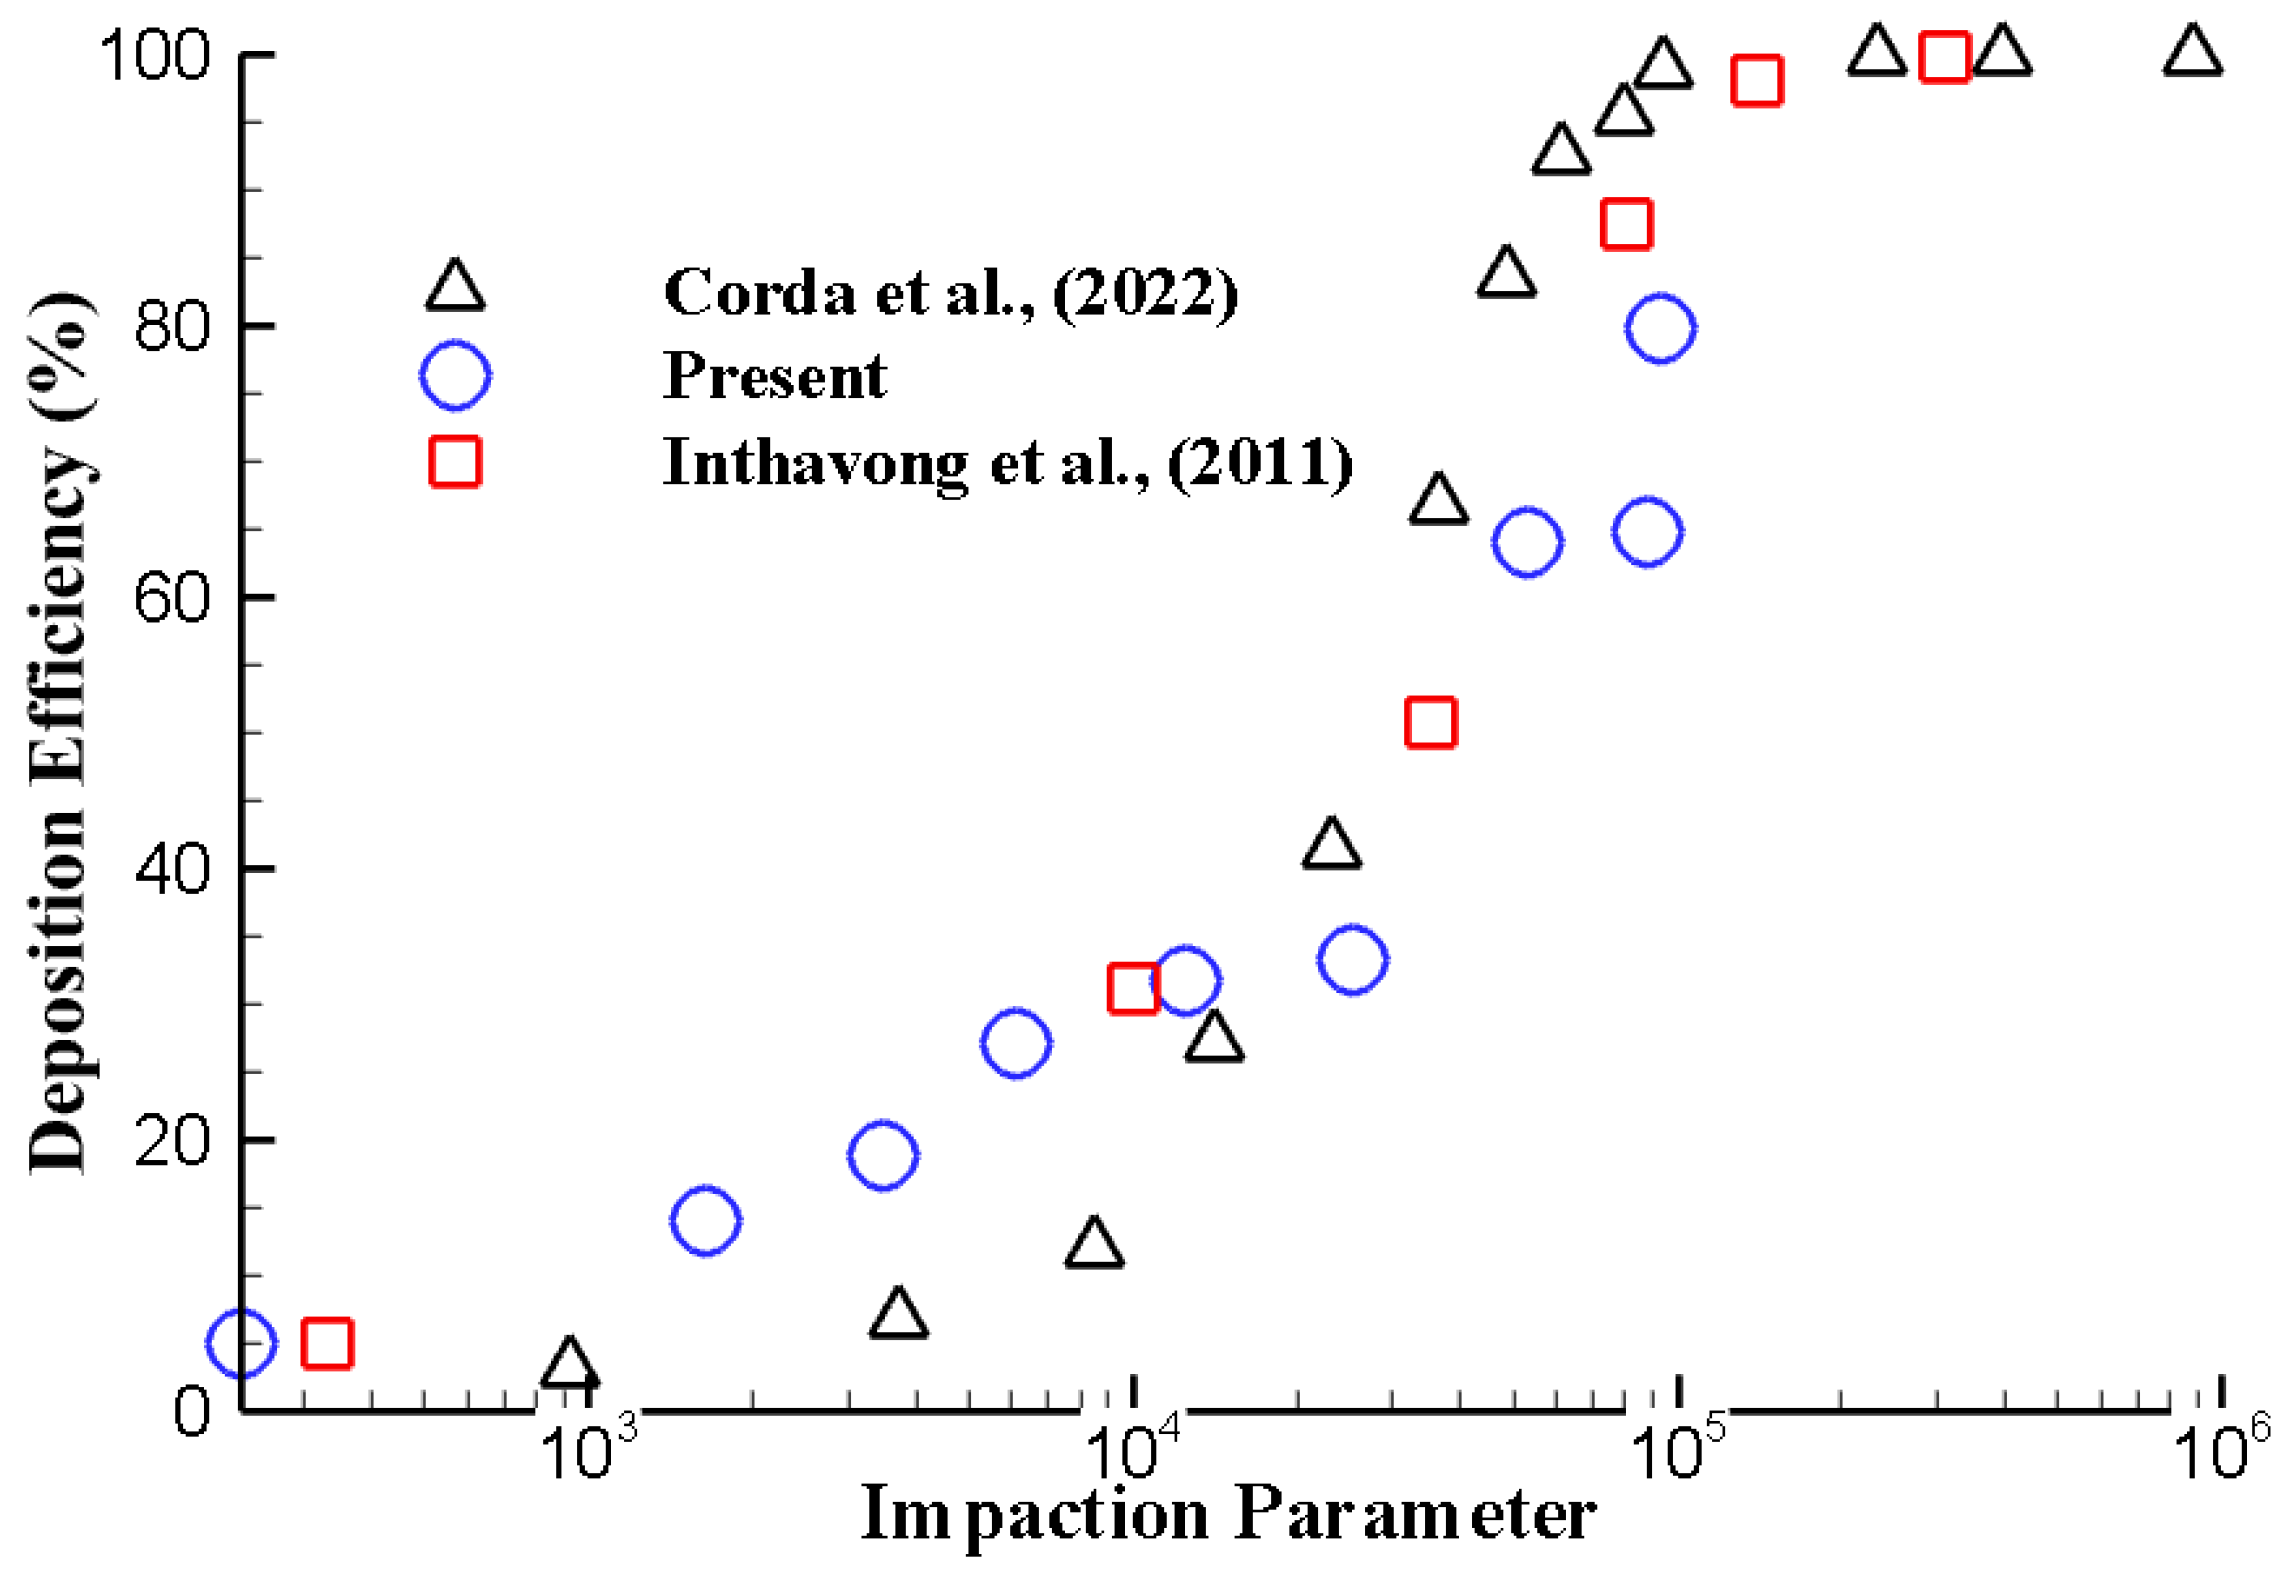
Figure 3 and
Figure 4 show the DE of the microparticle at the extrathoracic airway as a function of the inertial parameter. The DE for different inertial parameter values agrees well with the available literature.
Numerical Methods
The numerical simulation from this study was performed by using ANSYS Fluent. A double precision and pressure-based solver was used for the numerical calculations. The particle interaction effects on the flow patterns are analysed. A comprehensive aerosol deposition for different parameters was presented. The CFD-DEM is used by considering the fluid flow as the continuous phase for the CFD and particles as discrete particles for DEM.
The equations for the continuous flow inside the airways are;
where
is static pressure,
is gravitational body force, and
is external body force for particle interaction, which is given by (Chen et al., 2012);
where
is the particle drag force,
refers to the particle number in the computational cell, and
is the cell volume.
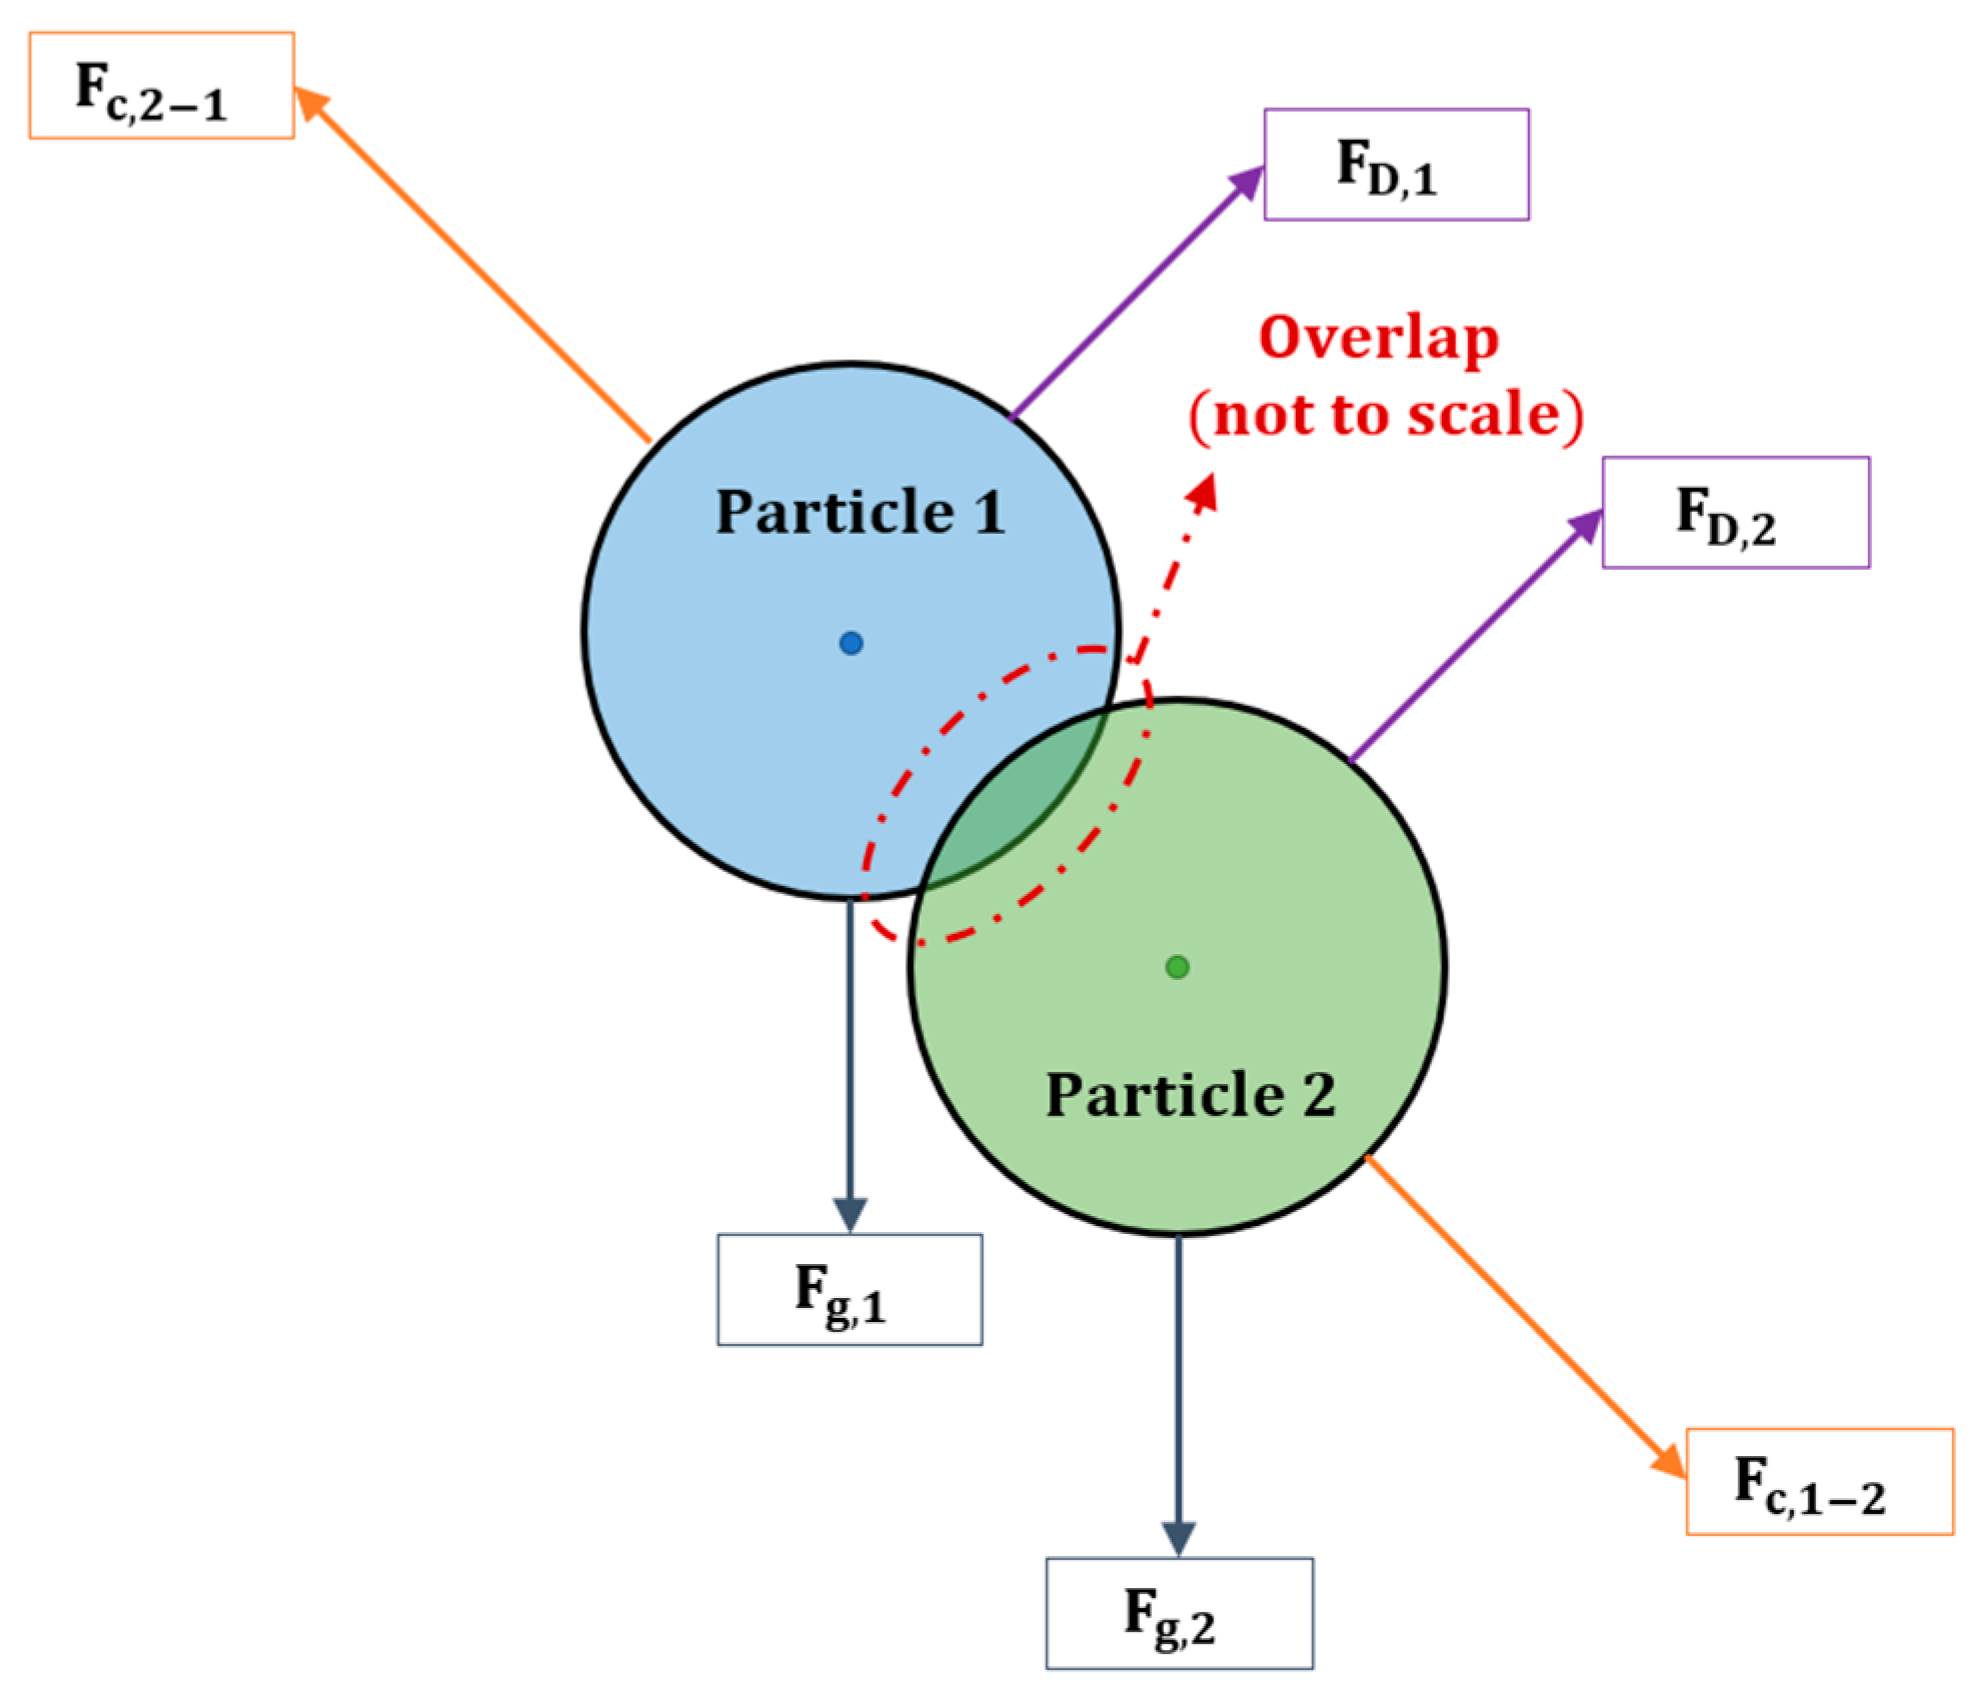
The rotational and translational motions of the particle in DEM are governed by its collision with neighbouring particles, surrounding fluid and wall. Newton’s second law of motion is used as the governing equation for DEM (Zhu et al., 2007). The present study employs the soft-sphere approach (
Figure 5) developed by Cundall & Strack (1979). The motions of individual particles are determined by Equations (4) and (5)
where
,
,
, and
refer to the mass, moment, particles translational and rotational velocities, respectively.
denotes the vector from the centre of particle
to a contact point where
is used.
and
are normal contact force and tangential contact force.
refers to the rolling friction torque.
In the soft sphere approach, the force acting on the colliding particles was calculated through the overlap or deformation of the interacting particles. The particle transport equation was integrated, and the spring constant was used to determine the particle interaction. The value of the spring constant depends on the coefficient of restitution, colliding particle’s relative velocity, and the collision period (Islam et al., 2020).
To calculate the particle contact forces, three techniques, the spring collision law, the spring-dashpot collision law, and the friction collision law, were used. The spring constant is the key parameter for these three techniques. The spring constant (K) can be written as;
where parcel diameter is
,
and
are the relative velocity and mass of the colliding particles, respectively.
εD is allowable overlap fraction. The collision time scale can be defined as
, where
is the parcel mass which is defined by
.
The spring collision law is basically based on a unit vector (
) is determined for two particles through the following equation;
where
and
are the particle 1 and 2 position, respectively. The overlap (
) between two particles during contacting should be less than zero, which is calculated by the following equation;
where and
are the particle 1 and 2 radius, respectively.
From this technique, the force on particle 1 (
) is calculated by using K, which should be greater than zero. For the force on particle 2 (
), it is dependent on Newton’s third law. The force on particle 1 and 2 can be calculated using Equations (9) and Equation (10), respectively.
A dashpot term (
) from the spring-dashpot collision law was defined with K and the coefficient of restitution. The force of the colliding particles can be calculated based on the reduced mass and loss factor of the particles;
The particle collision timescale (
) and damping coefficient (
) were determined based on the following equations;
The particle 1 and particle 2 relative velocity is defined as;
Based on this technique, the force on particle 1 was defined as Equation (13), while the force on particle 2 is still based on Equation (9).
is calculated based on Equation (10).
The friction collision law was calculated for Coulomb friction (
);
where, friction coefficient is
and
is the force that is normal to the surface.
The
depends on the relative tangential velocity (
).
Sticking friction coefficient is
, gliding coefficient is
, velocity limit friction coefficient is
, gliding velocity is
. The properties used for the DEM and DPM model are listed in
Table 1.
Under the DEM model, the injection file was applied for the initial locations of released particles along the domain. The boundary conditions were taken as the velocity inlet and the pressure outlet. The initial velocities at the inlet are various based on the daily physical activities, including 15 lpm, 30 lpm, and 60 lpm. This study’s selected sizes of spherical particle include 1 µm, 5 µm, and 10 µm.
Table 2 presents the physical input properties of the fluid (air) and aerosol.
The average total particle count per injection is 1,016 particles for all numerical simulations. The wall boundary condition was set as a stationary and no-slip wall. A trap condition to catch the particle when touching the walls. The convergence criteria was set as 0.0001.
Machine Learning Method
Machine learning (ML) regression has been widely adopted in CFD simulations due to its ability to significantly reduce cost and time. CFD simulation takes significant amount of computational time depending on the computational mesh and complexity of the model. With ML regression, however, engineers can develop accurate models much faster. By leveraging algorithms that learn from past simulations and use statistical methods to make predictions, machine learning regression can reduce the number of simulations required and therefore, the time and cost associated with CFD simulations.
In the present study, there are three independent variables (particle size, flow rate and interaction) and one dependent variable (deposition efficiency). Thus, the functional form of the model is given as:
In this study, four ML regression models are used for the particle transport analysis. These models are Multi-layer perceptron (MLP), Random Forest (RF), Gaussian Process Regression (GPR) and k-nearest neighbours (k-NN) Islam et al. (2022).
GPR (Rasmussen et al., 2006) is a powerful tool for modelling and predicting complex systems. GPR is a probabilistic, non-parametric approach to regression that provides a flexible framework for modelling nonlinear relationships between variables. The method involves defining a prior distribution over functions and updating this prior based on observed data. The resulting posterior distribution over functions can then be used to make predictions at new input locations. GPR has been successfully applied in a wide range of fields, including robotics, computer vision, finance, and environmental science. The method has been shown to be particularly effective in settings where the underlying relationship between variables is complex and difficult to model using traditional methods.
RF Regression is a popular machine learning algorithm used for predicting numerical values. It belongs to the family of ensemble methods, where multiple decision trees are trained on randomly sampled subsets of the data, and their predictions are combined to make the final prediction. The algorithm is robust to overfitting and can handle high-dimensional data with complex nonlinear relationships. It has been applied in various fields such as finance, healthcare, and environmental science. A study by Wang et al. (2020) used random forest regression to predict the short-term load forecasting of power systems, achieving better performance than other traditional methods. Another study by Nazari et al. (2021) used random forest regression to predict the protein solubility, which is a critical factor in the development of biopharmaceuticals. Overall, Random Forest Regression is a powerful and versatile tool for predicting numerical values in various domains.
KNN regression is a popular non-parametric regression technique used in machine learning for predicting a continuous outcome variable based on the values of its neighboring data points. In KNN regression, the prediction is made by computing the average of the K closest neighbors’ output values. The optimal value of K is determined through cross-validation. KNN regression has been applied in various fields such as finance, healthcare, and transportation. However, it has limitations in handling high-dimensional data and requires large amounts of data to avoid overfitting. Overall, KNN regression is a simple yet effective method for regression tasks.
MLP (Mukherjee et al. 2022): is a type of artificial neural network (ANN) that has been widely used for regression tasks. MLP consists of multiple layers of interconnected nodes, each performing a nonlinear transformation on its inputs. The output of each layer is then passed as input to the next layer until the final layer, which produces the output of the network. The learning algorithm of MLP is based on backpropagation, which adjusts the weights of the connections between nodes to minimize the error between the network’s output and the desired output. Several studies have investigated the performance of MLP in regression tasks, including comparison with other regression techniques. For example, a study by Liu et al. (2020) compared MLP with support vector regression (SVR) and showed that MLP outperformed SVR in predicting daily solar radiation. Another study by Shalbaf et al. (2021) compared MLP with linear regression and showed that MLP had a higher accuracy in predicting the price of residential properties.
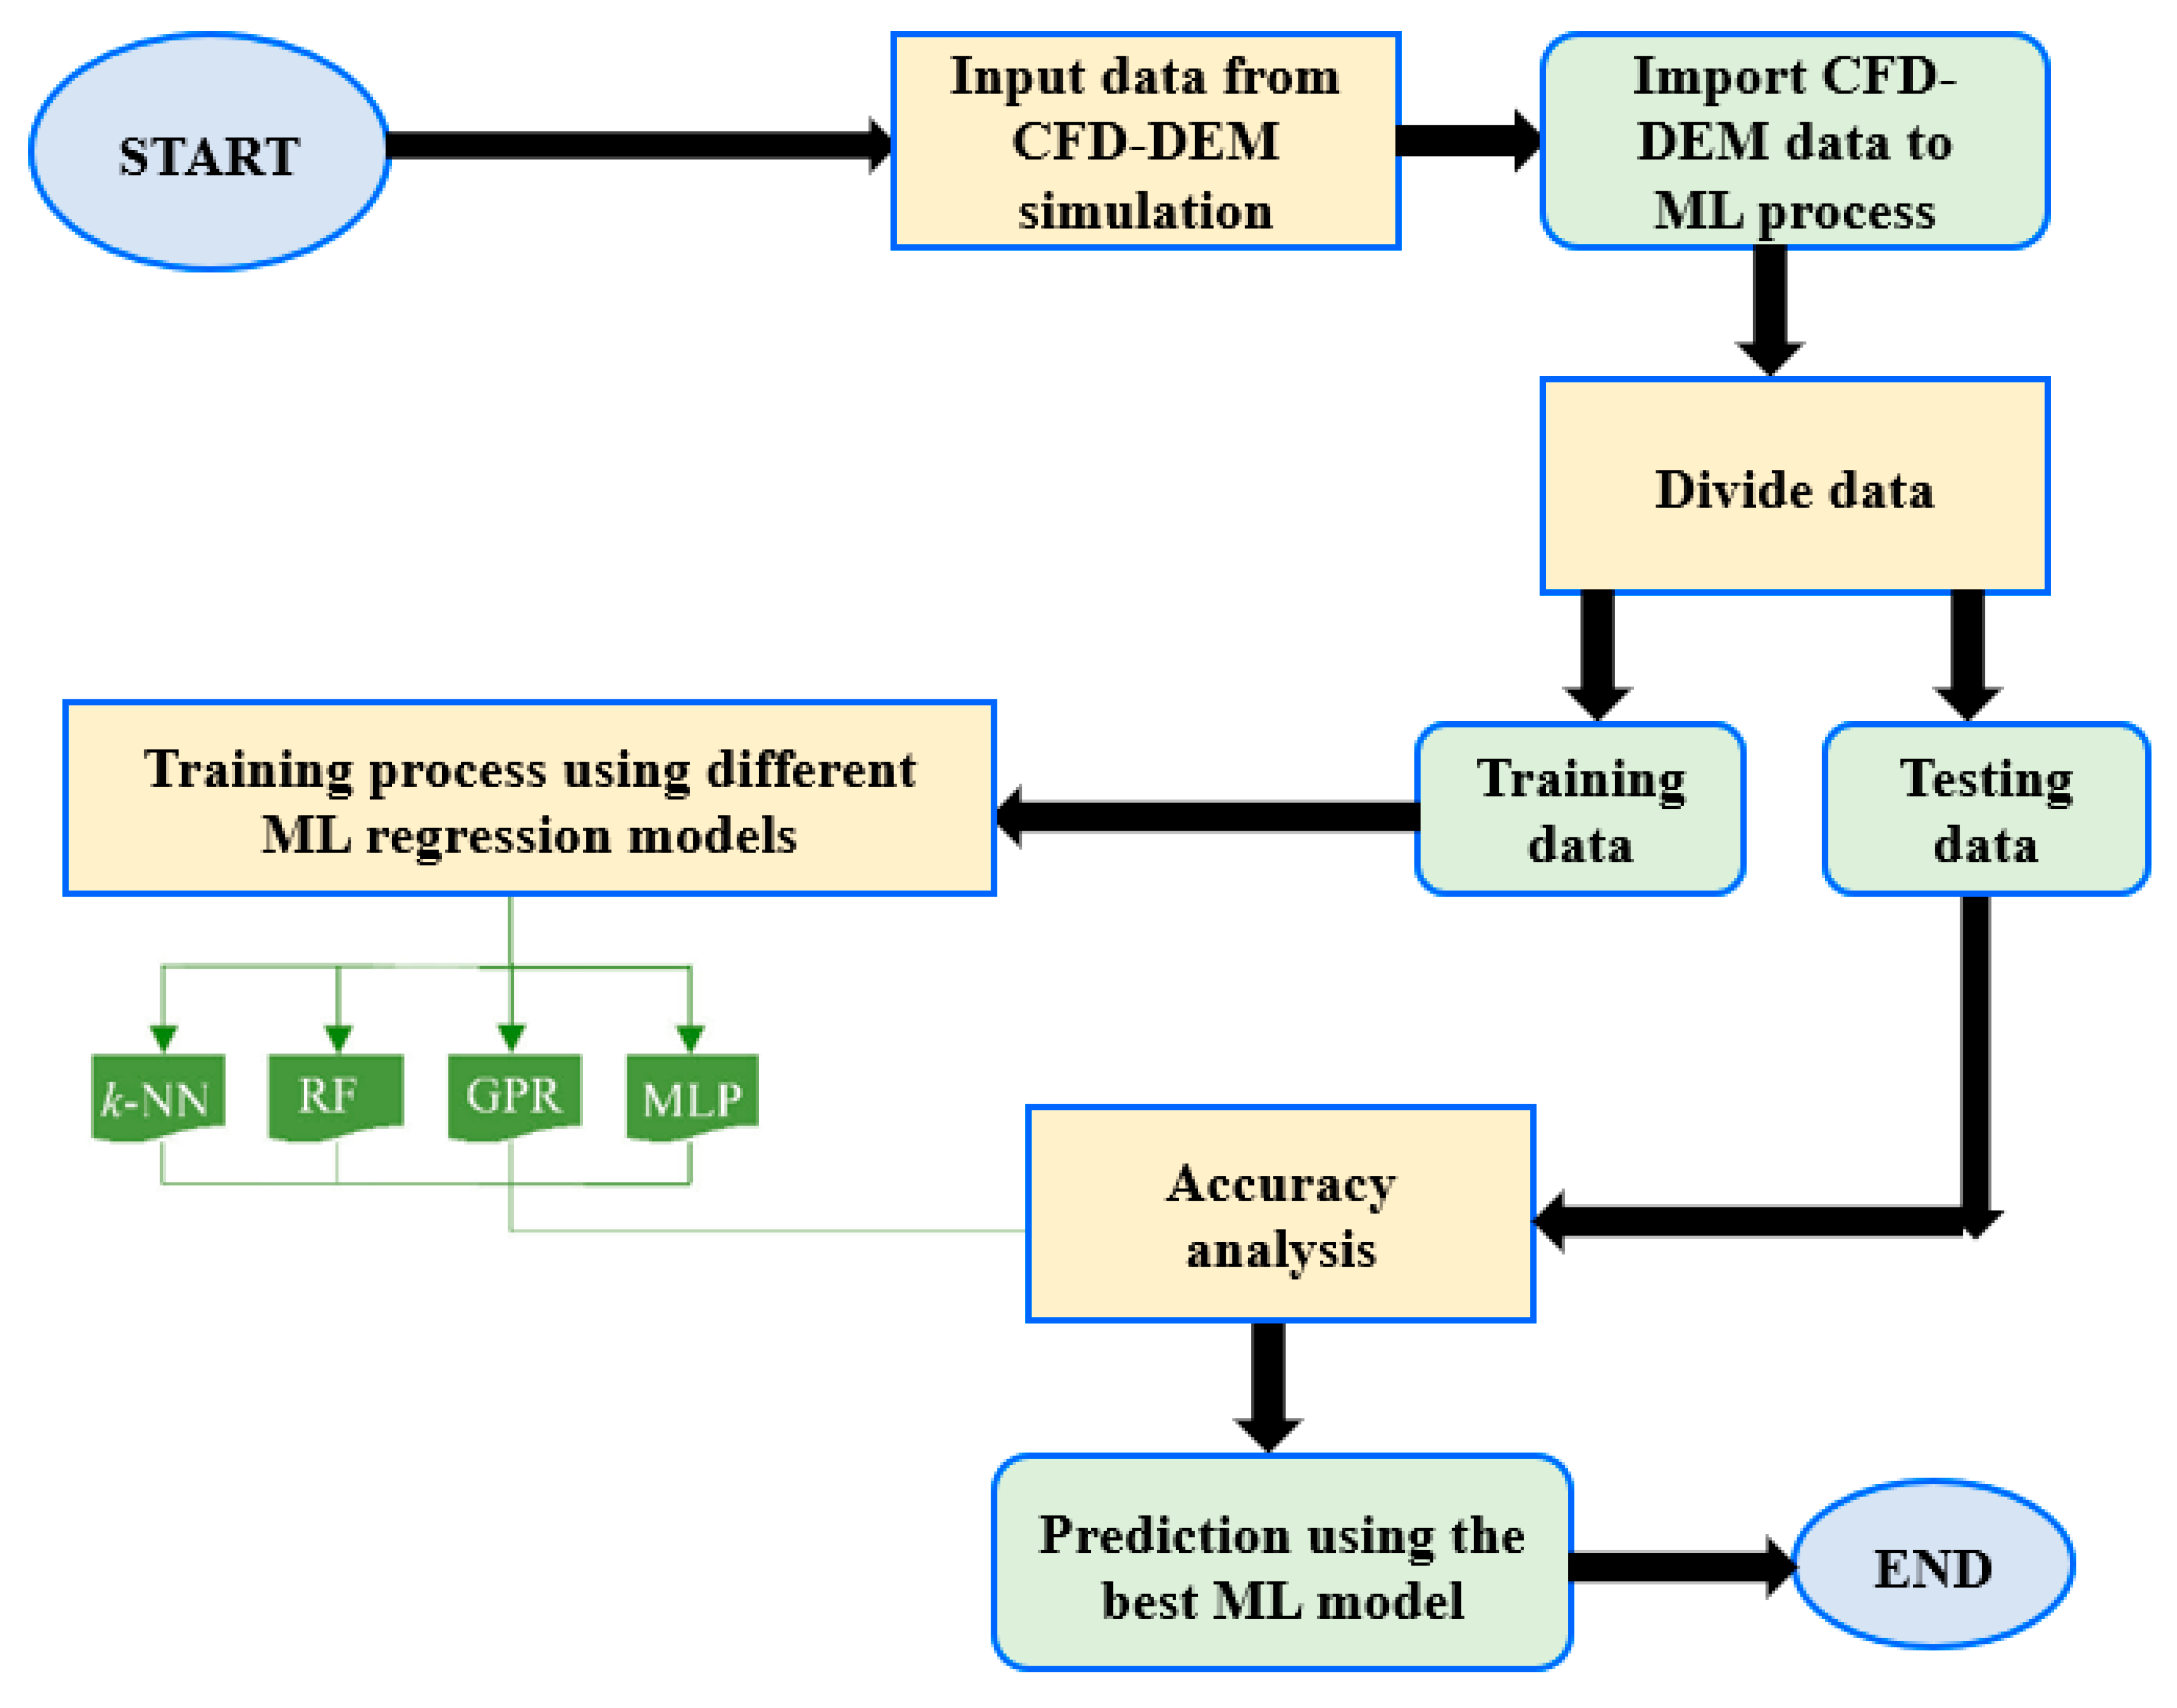
Figure 6.
ML methodological flowchart for deposition prediction using ML algorithm.
Figure 6.
ML methodological flowchart for deposition prediction using ML algorithm.
The present investigation followed the recommendation of Nguyen et al. (2021) to assign 80% of the data for training and 20% for validating the ML models. Random selection of the training and testing data was done to ensure that the datasets represent typical samples of the original dataset.
The performance of the ML algorithm is evaluated using correlation coefficient (
R) given as follows:
where
Mi is the observed value,
Ei is the estimated value, and
Mavg and
Eavg are the average value of observed and estimated values, respectively.
Scikit-learn’s GridsearchCV tool is utilized to identify the key hyper-parameters for ML models, which are computed based on the fitting accuracy of the ML models. The hyper-parameters are:
| No. |
MLAs |
Hyper-Parameters |
|
|
|
|
|
| 1 |
k-NN |
No. of Neighbors: |
2 |
| 2 |
RF |
No. of estimators: |
8 |
| 3 |
GPR |
Kernel type:
No. of restarts optimizer |
DotProduct (sigma=1) + RBF(length scale=1), 2 |
| 4 |
MLP |
Sizes of Hidden layer:
No. of hidden layers:
Max iterations:
learning rate: |
(100,)
1
10000
0.0001 |
Results and Discussion
1.1. Velocity Analysis
The velocity analysis in this section focuses on comparing the flow characteristics between the different lung geometries and selected parameters of the DEM model.
1.1.1. Velocity Analysis for Non-Realistic Model and Realistic Model
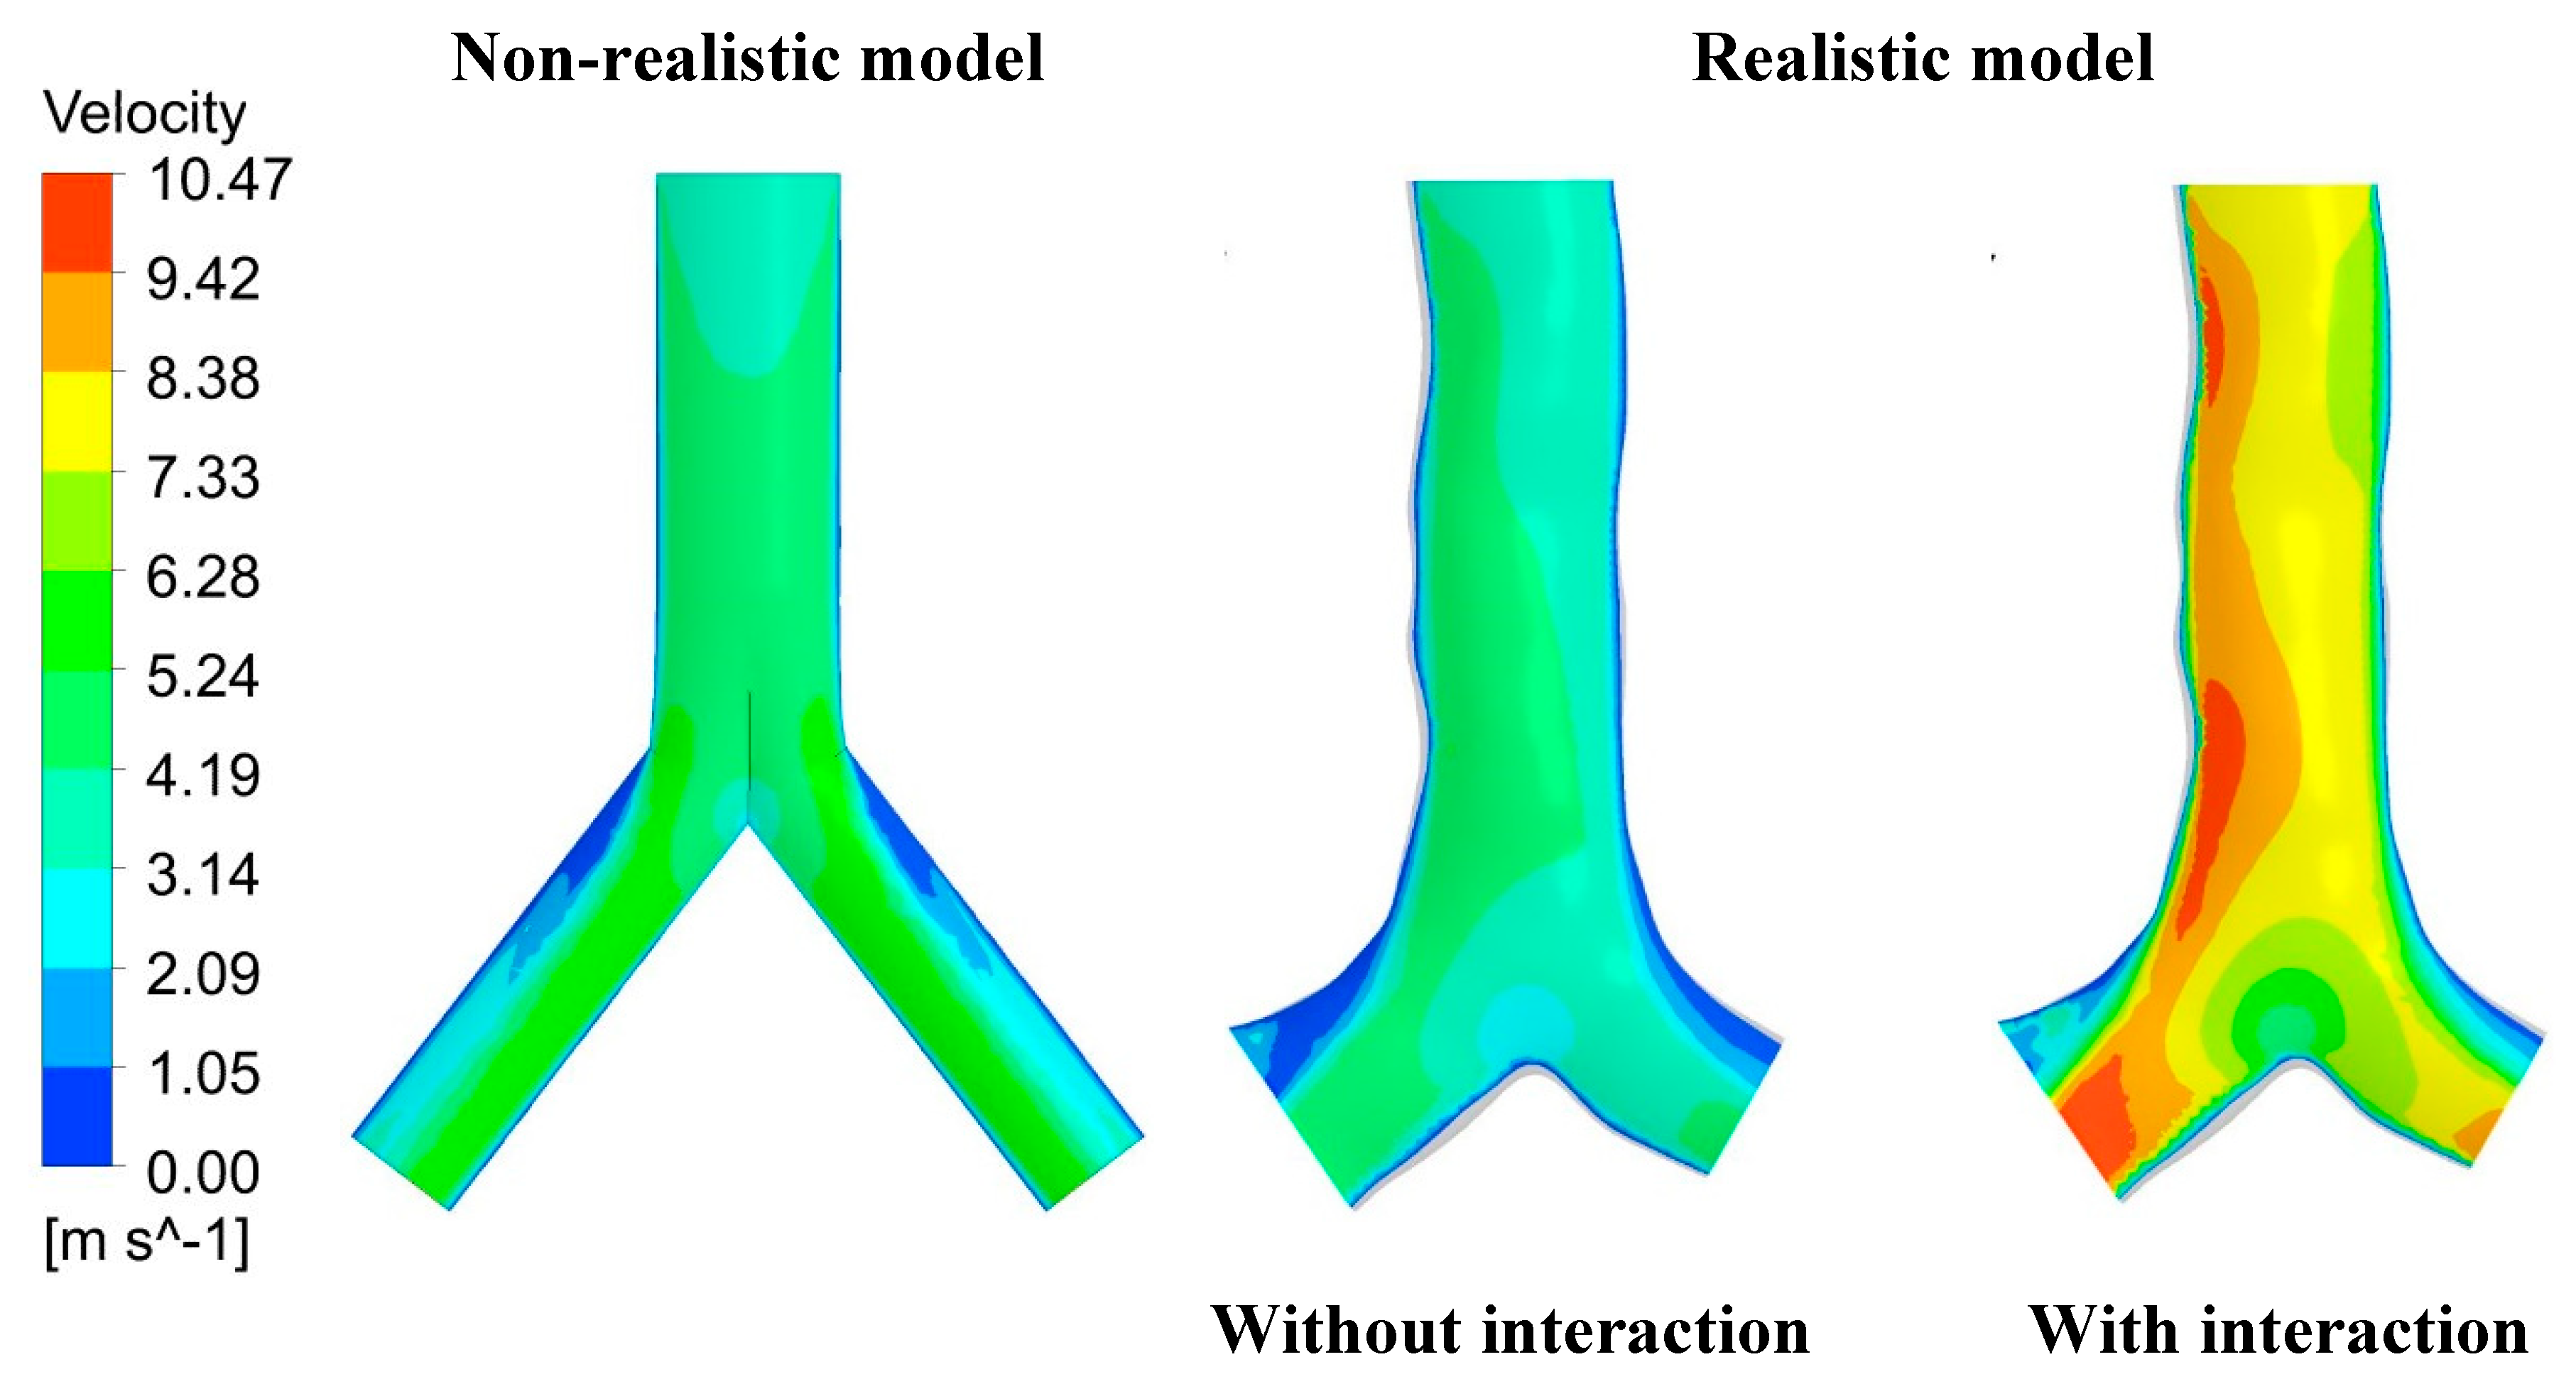
Figure 6 presents the comparison of velocity magnitude along the velocity contour at the X-Y plane between the non-realistic model and the realistic model under the 60 lpm flow rate. Furthermore, the difference in flow velocity between particle interaction and without particle interaction is also presented in this figure. From this figure, the lower and lowest velocity magnitudes were found at nearly the upper wall of the left and right sides of these models. Considering the flow pattern inside the bifurcation between these models, the flow patterns from the realistic model with and without particle interaction are similar, but these patterns are different from the non-realistic model case. This is because of the change of cross-sectional area in the realistic model, which generates the vortices during fluid flows inside the bifurcation. A highly asymmetric anatomical model from a realistic case significantly generates a higher flow distribution during flowing inside the bifurcation. However, the velocity magnitude of the bifurcation between the non-realistic model and the realistic model without particle interaction is quite similar, as the maximum velocity magnitude from these two models is lower than 7.33 m/s. The higher and highest velocity magnitudes were observed at the realistic model with particle interaction case nearly the wall of the right lung side (larger than the left lung side) at 9.42 m/s to 10.47 m/s, while the velocity magnitudes at other areas are around 7.33 m/s to 8.38 m/s. In the real situation during inhalation, the inhaled particle can collide with each other. When having particle-particle interaction, the flow in that area will become more complex and turbulent. This can support the velocity pattern on the realistic model with particle interaction case that particle-particle interaction generates a high-velocity magnitude along the bifurcation. The details of particle-particle interaction are provided in the particle analysis section.
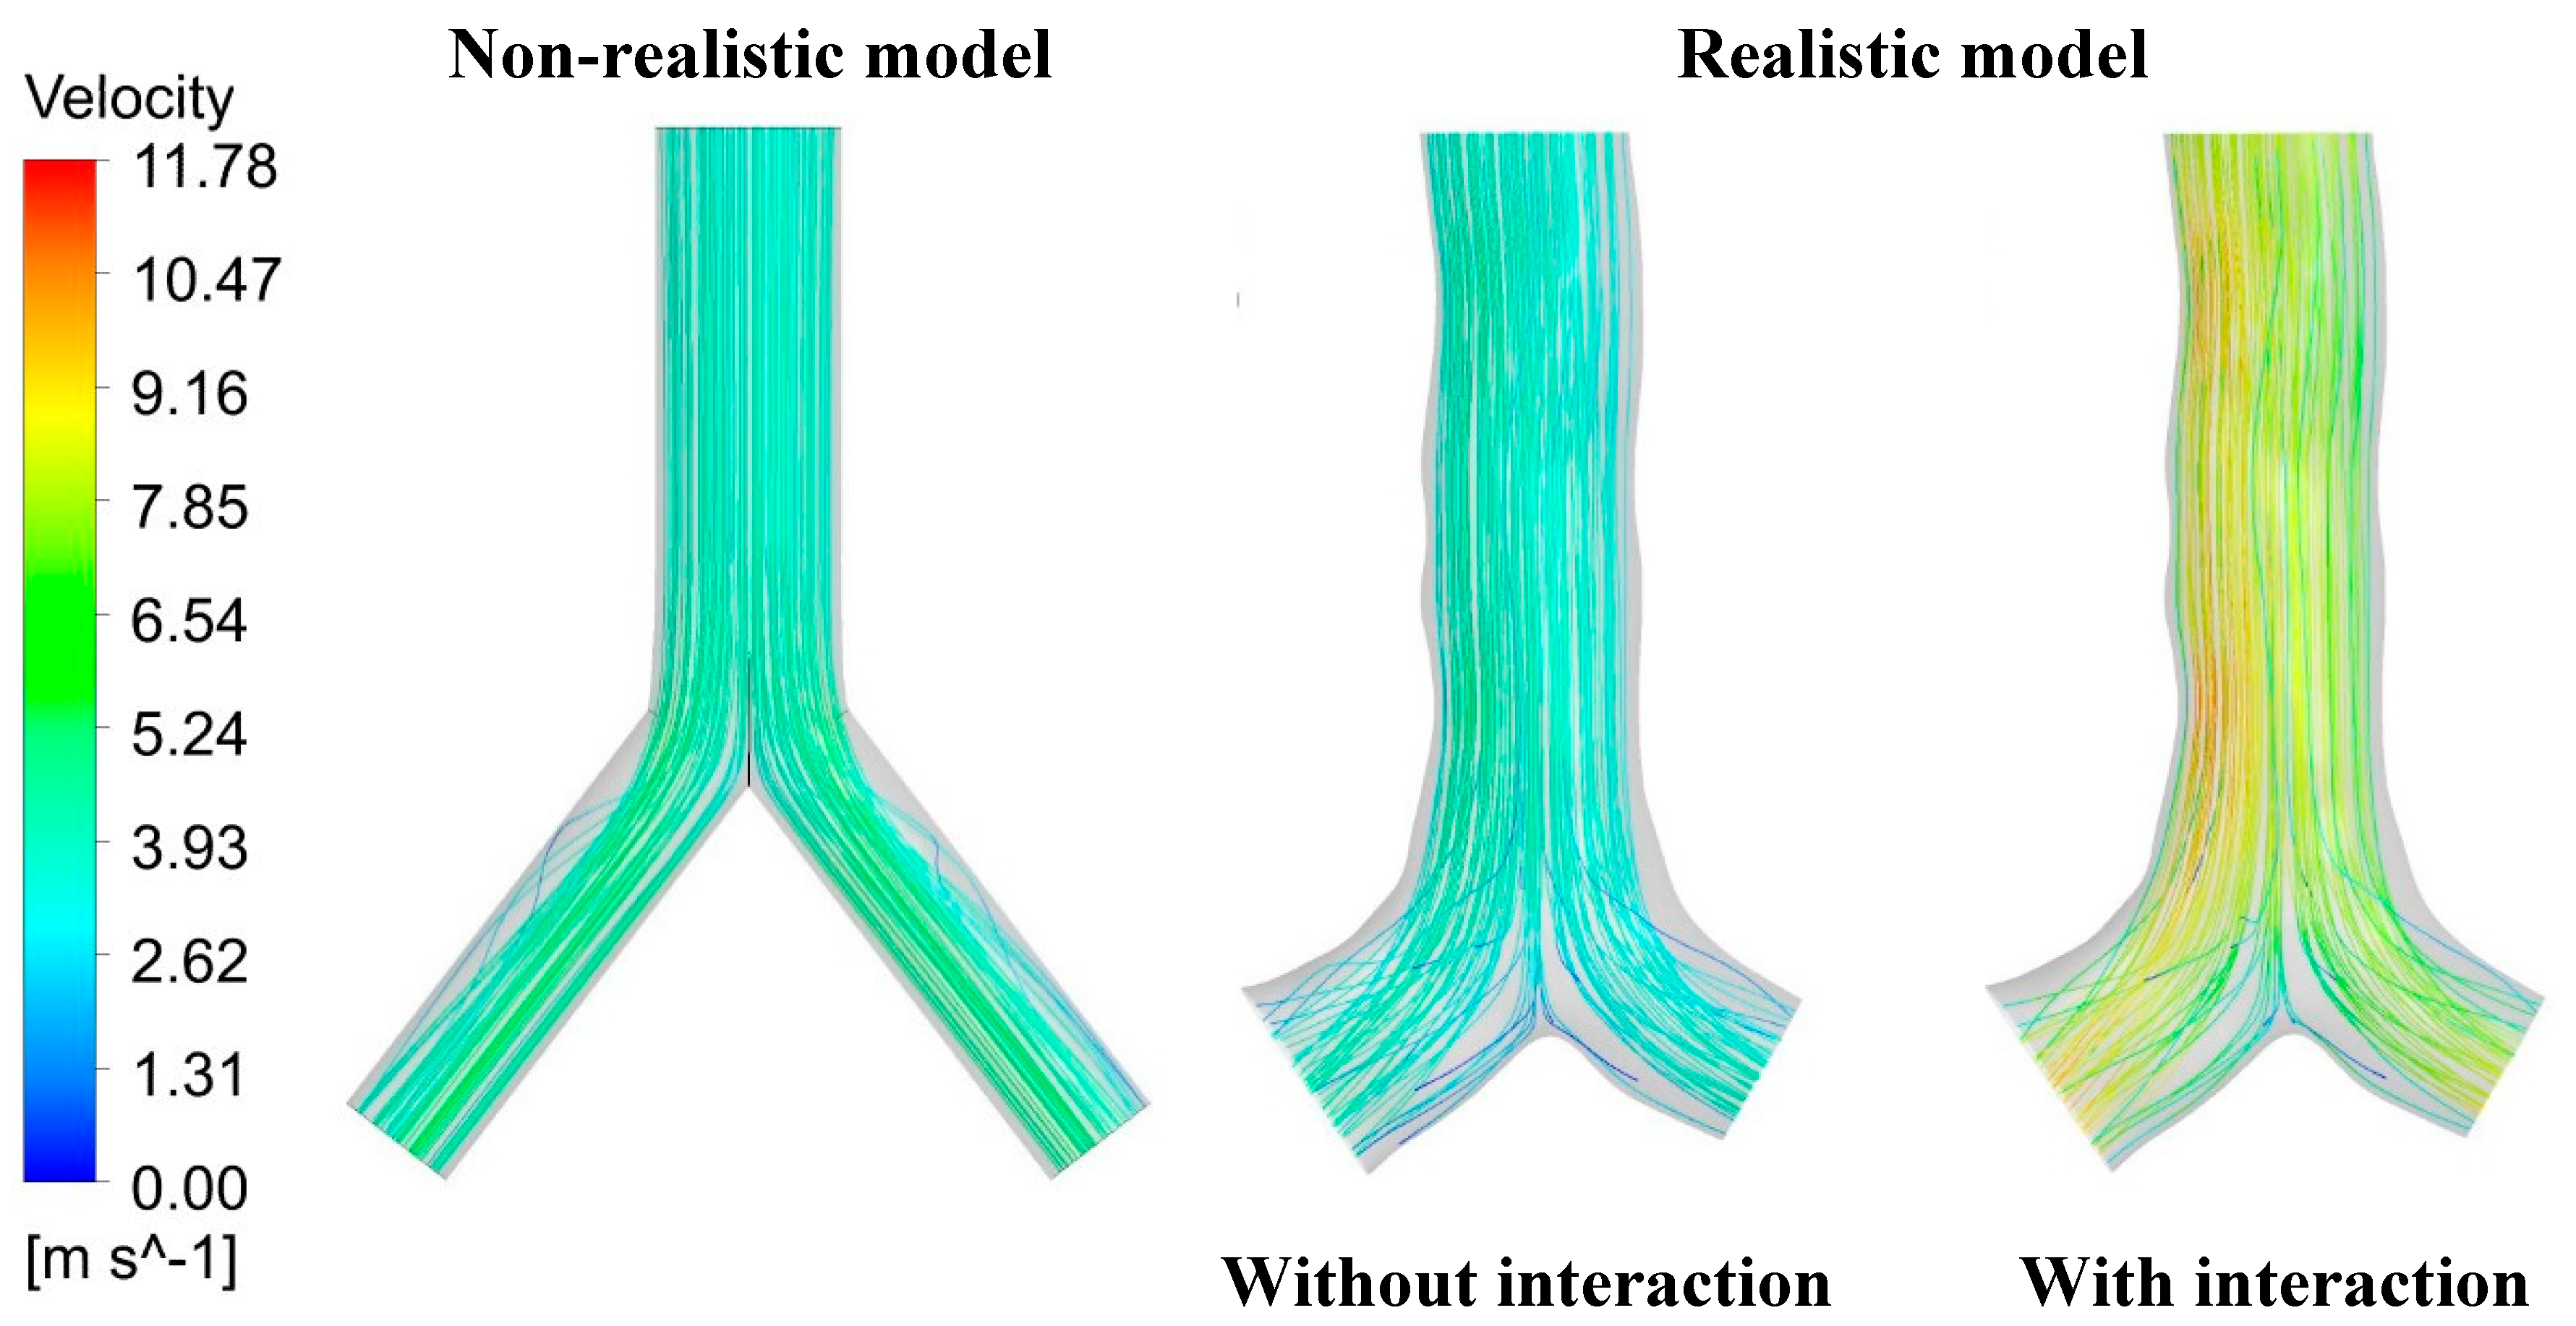
Velocity streamline for all three cases under the 60 lpm flow rate is presented in
Figure 7 to provide a better understanding of the flow field dynamics inside the lung airway. From this figure, it is clear that particle-particle interaction significantly generates a higher flow velocity inside the domain compared to other cases. The highest velocity magnitude at 11.78 m/s was found in this case, while the highest velocity magnitude from other cases was observed to be lower than 7.85 m/s. From the non-realistic model, the highest flow was found at the central area of the left lung and right lung, while the lowest flow was found at nearly the wall of the airway. However, for the realistic model, the highest flow was observed on the right side instead. This can be because the complex structure of the realistic model affects the change in flow patterns during passing the airway.
1.1.2. Velocity Analysis for Various Selected Parameters of the Discrete Element Method (DEM)
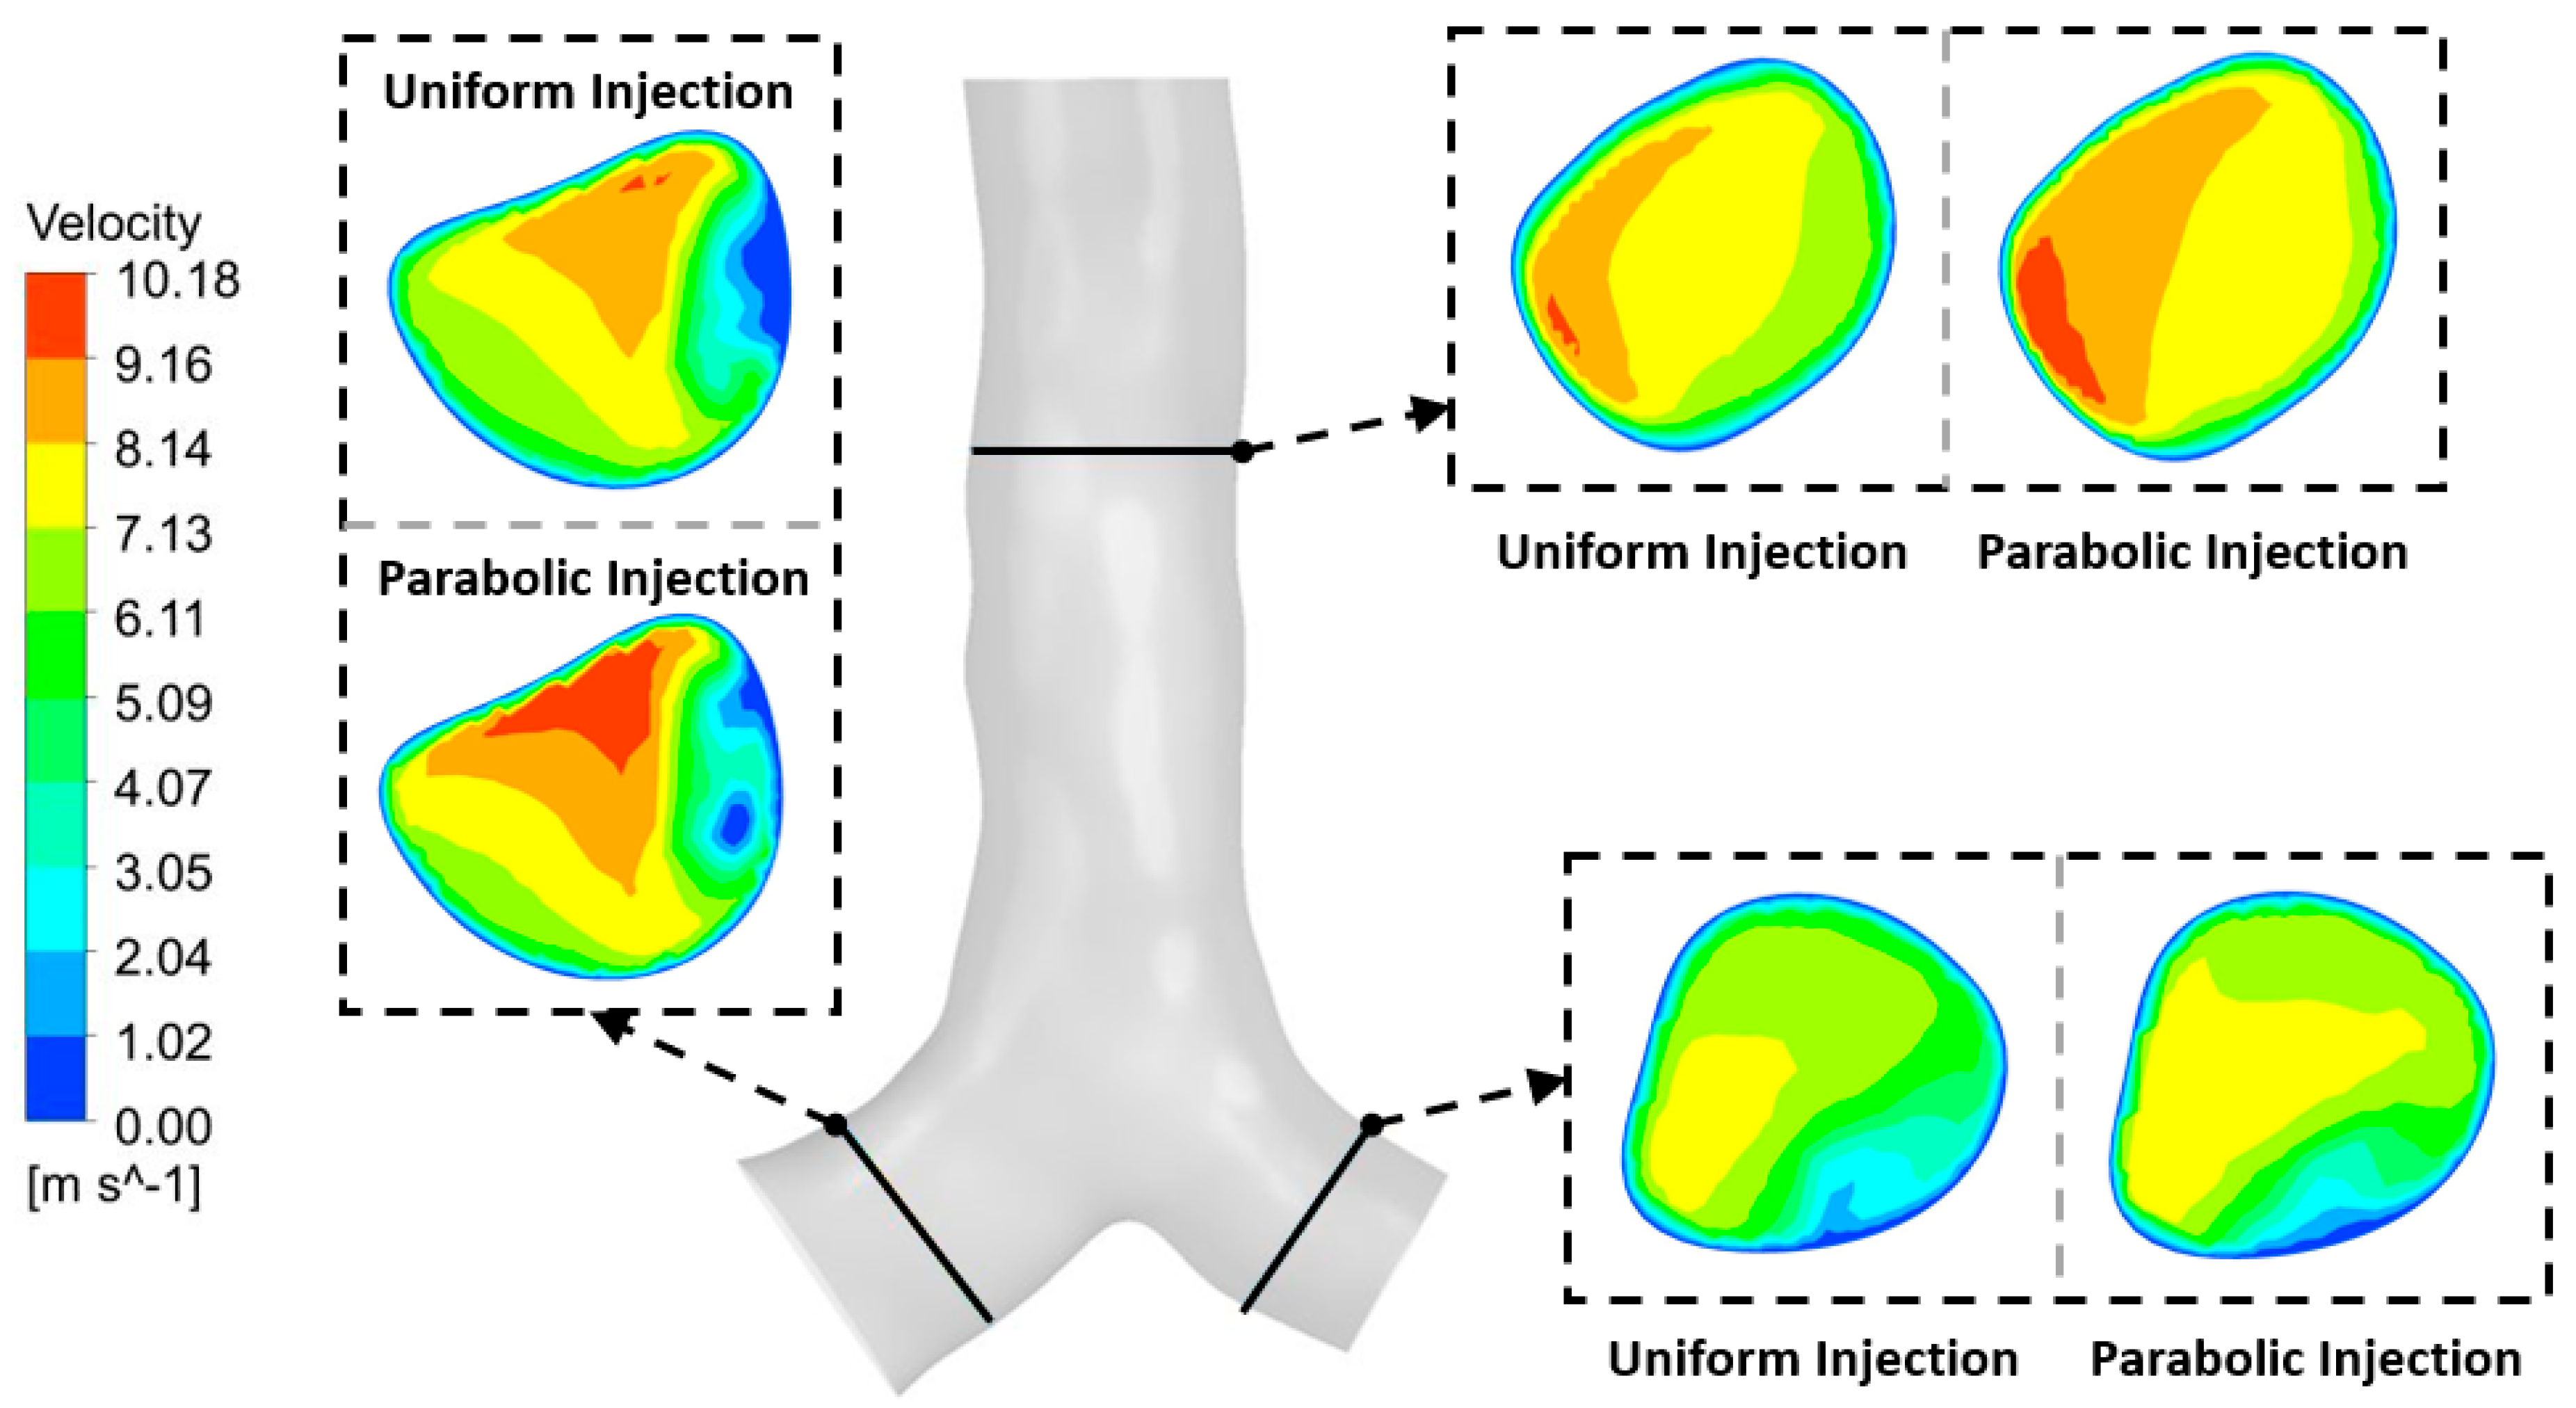
In general, during inhalation, the flow field in the mouth-throat area is usually a uniform flow and becomes a parabolic flow at the trachea and upper airways (Gemci et al., 2008). In the CFD simulation, the airway walls were set as the no-slip boundary condition. This leads to having a parabolic flow in this field (Chen et al., 2021). The velocity contours at three selected locations are created and provided in
Figure 8 under the DEM model with the flow rate at 60 lpm. A lower velocity magnitude usually locates at the wall of bifurcation for all selected locations. The higher velocity magnitude was found at the top and left planes (representing the right lung due to having a larger size than the other side). The maximum velocity magnitude from the left lung is lower than 8.14 m/s. However, the maximum velocity magnitude from another two locations is 10.18 m/s. The parabolic injection method significantly generates a higher flow velocity for all selected locations, which results in the difference in flow patterns, especially at the right lung side.
The DEM is a numerical method that is used to model the interaction between individual particles and boundaries. When using DEM, the spring constant (k) in the contract force model of DEM is usually reduced for calculation time or calculation cost purposes. However, the reduction in spring constant significantly changes the agglomeration behaviour of cohesive particles (Toshitsugu & Kimiaki 2018).
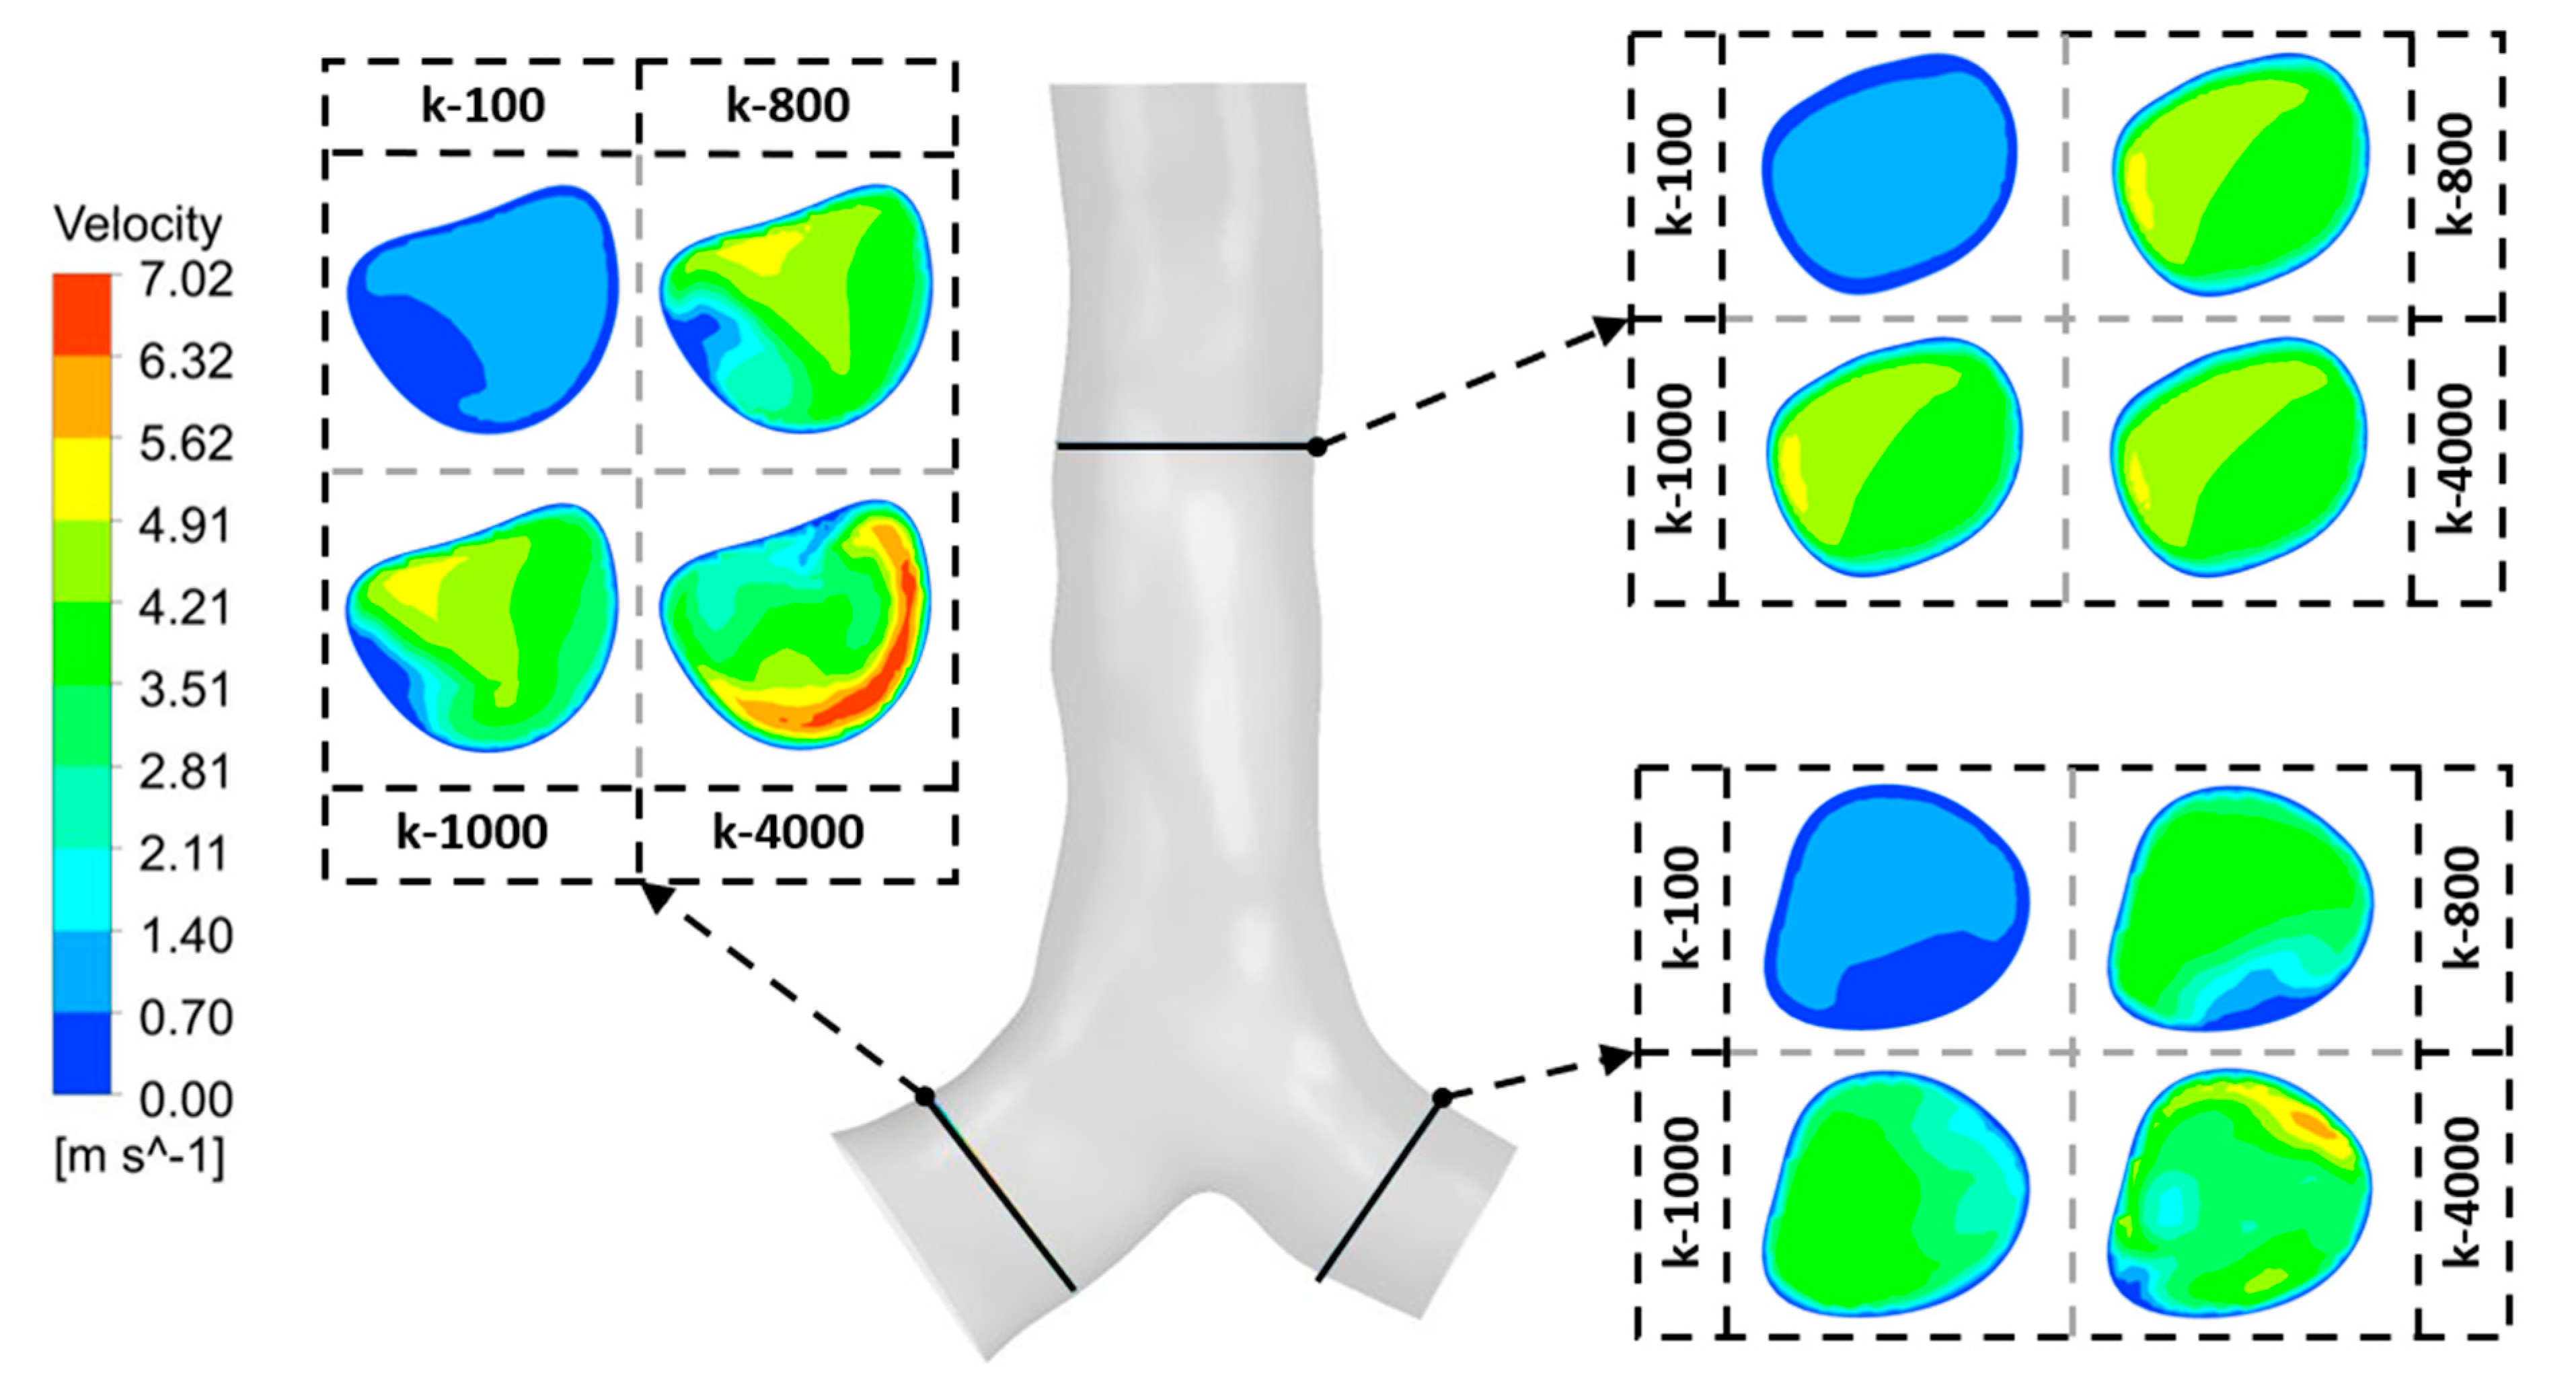
Four selected spring constants are used as the input parameters under the flow rate at 60 lpm to understand the effect of the spring constant on the flow patterns.
Figure 9 presents the velocity contours at three selected locations under different spring constants, including k-100, k-800, k-1000, and k-400. A higher spring constant significantly generates a higher flow velocity for all locations. From the spring constant at 100, the maximum velocity was lower than 1.40 m/s for all locations. The velocity fields are similar for the spring constant at 800 and 1000 from the upper part (top plane) and right lung (left plane), while the velocity fields are different at the left lung (right plane). However, the maximum velocity magnitude from these two constants still does not exceed 5.62 m/s. The highest spring constant at 4000 significantly causes the difference in velocity patterns, especially at the right lung (left plane). The maximum velocity at 7.02 m/s was found on this side near the right wall, while the second highest value at 6.32 m/s was found at the right wall of the left lung (right plane).
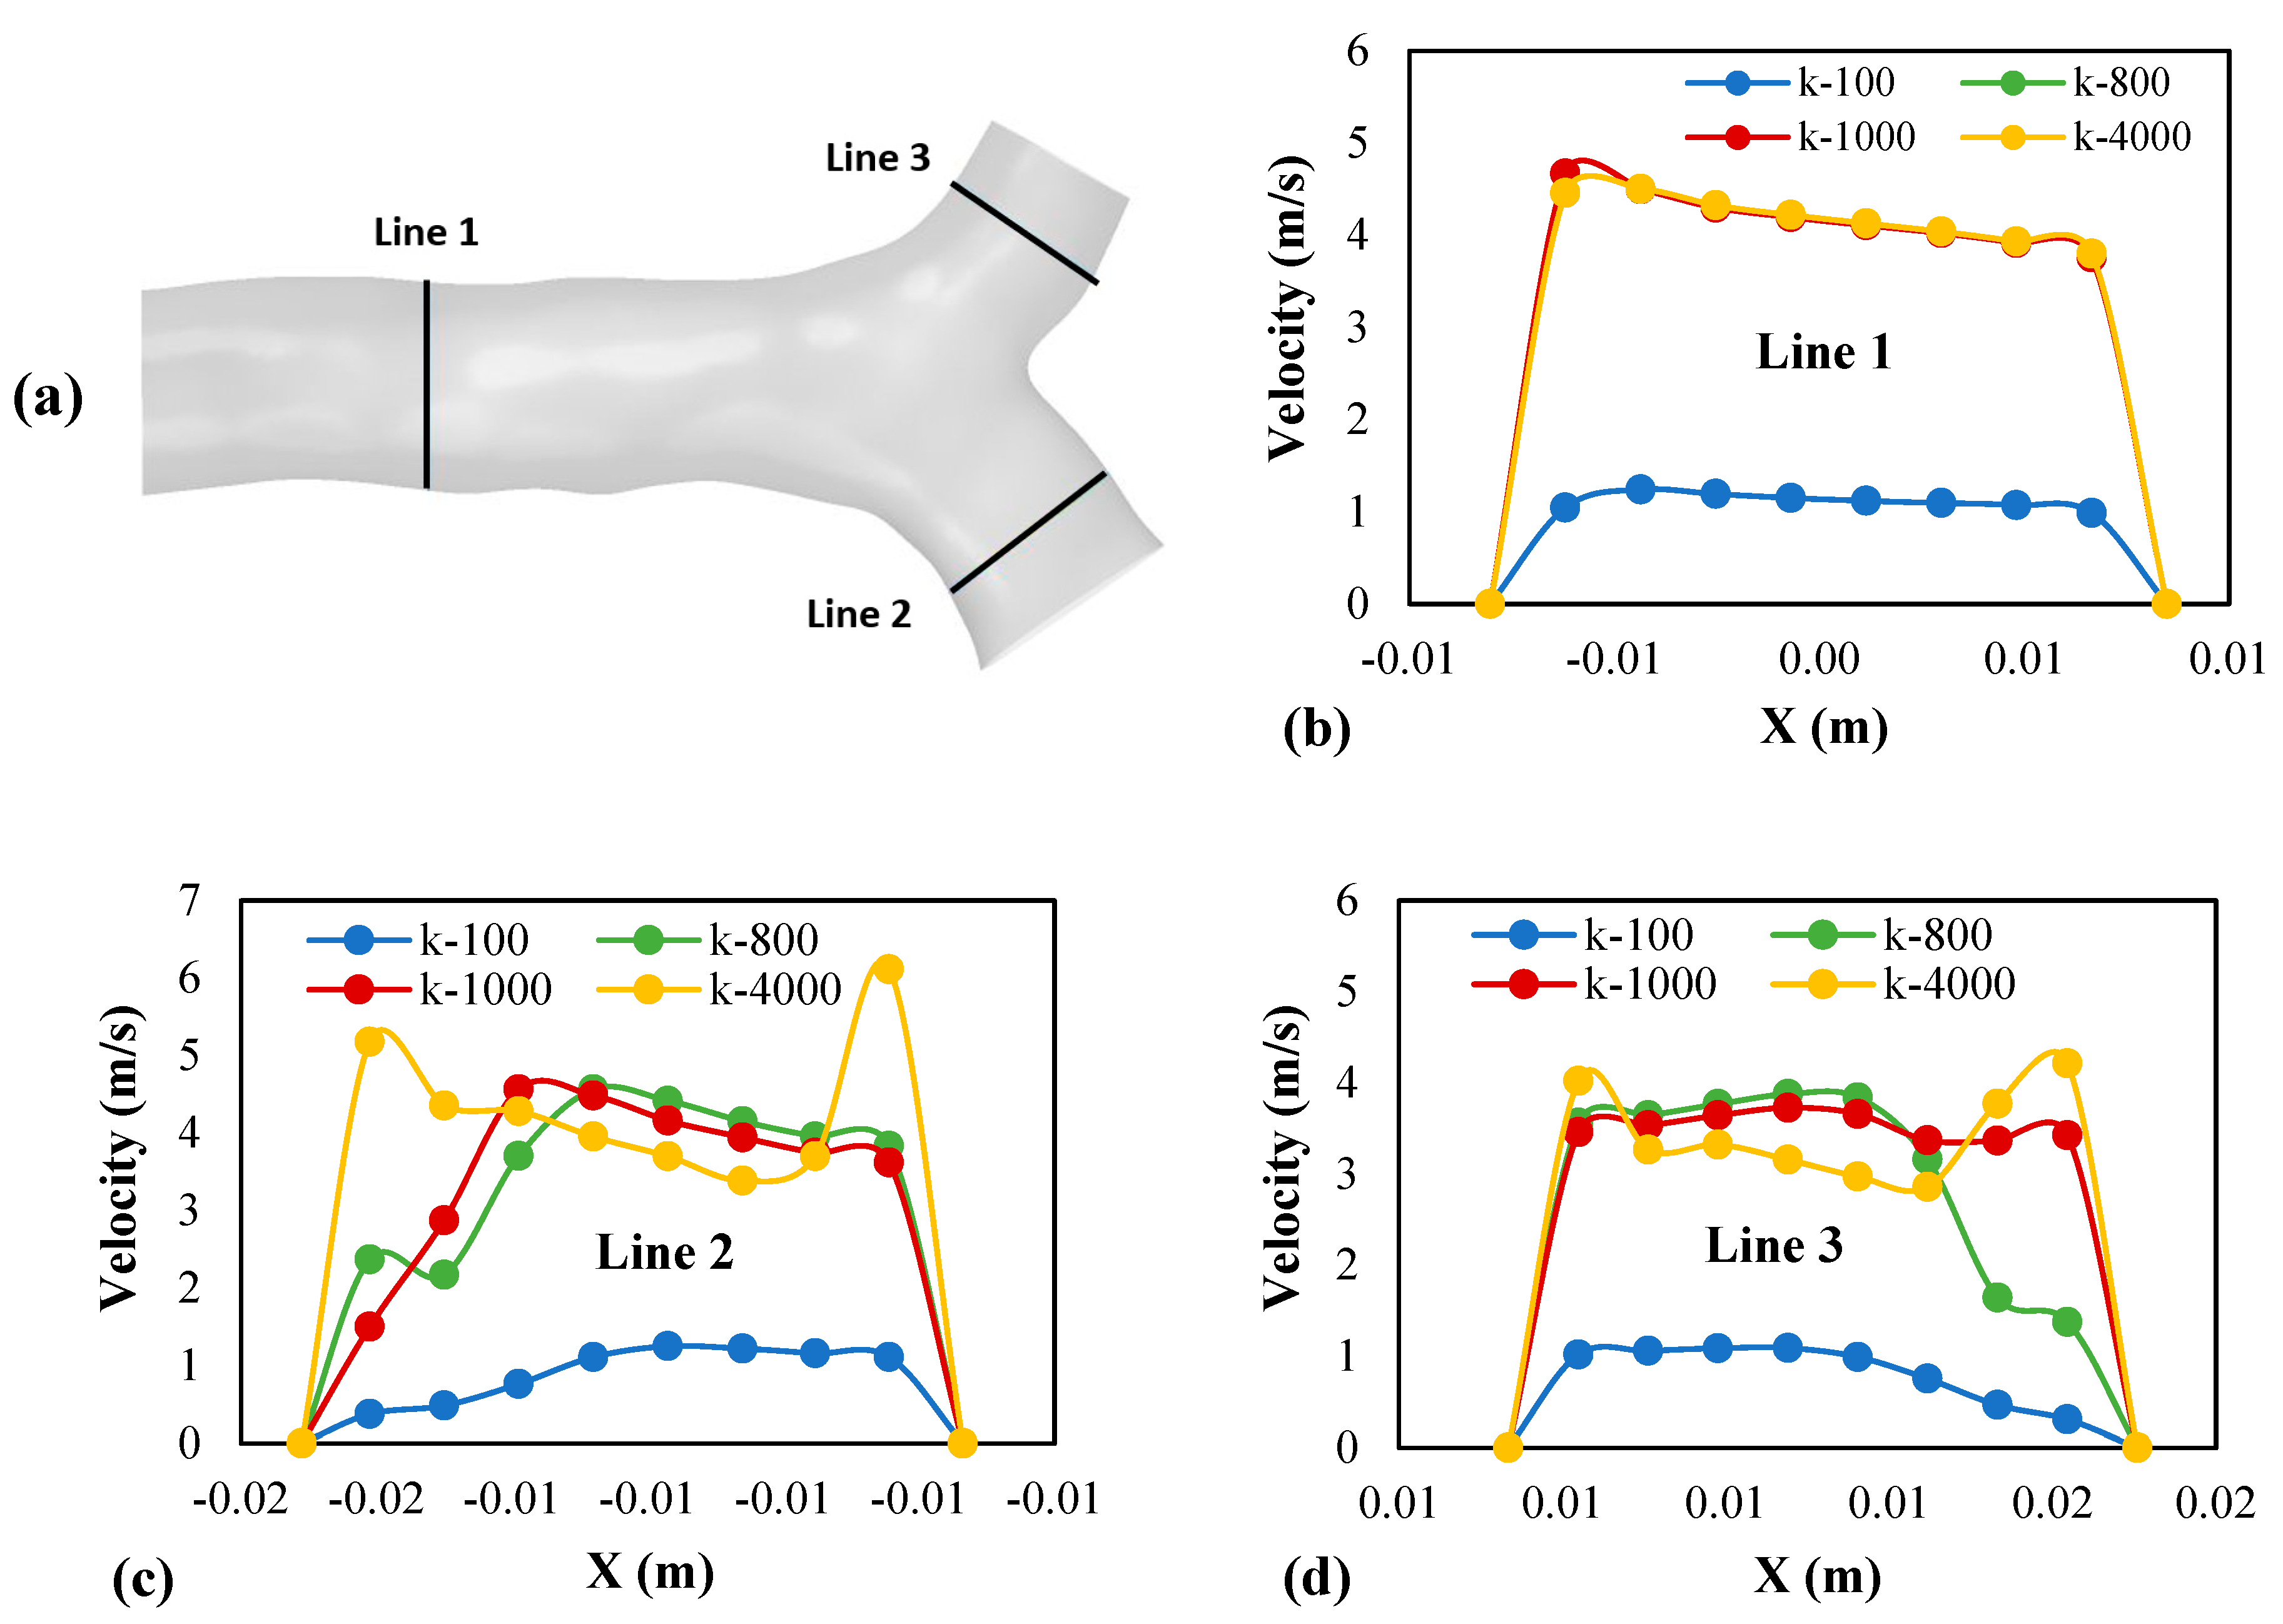
The velocity profile is plotted at the same selected location from
Figure 9 and presented in
Figure 10 under the flow rate at 60 lpm. The velocity profile represents the variation in velocity on a line at the right angles to the original flow’s flow direction. This profile demonstrates the velocity magnitude and the change in the flow direction, which is caused by the different shapes within the domain (Larpruenrudee et al., 2021). The flow’s behaviour during transportation through the domain is easy to be evaluated. The velocity profile was plotted from the wall at the selected location to another side of the wall, as shown in
Figure 10a.
Figure 10b,c present the velocity profiles from Lines 1-3, respectively. From
Figure 10, the flow pattern from Line 1 is a uniform flow for all spring constants, while Line 2 and Line 3 have a parabolic flow pattern. Furthermore, the velocity magnitude from the spring constant at 100 is significantly lower than other spring constants. From Line 1 (
Figure 10b), the trend of the velocity profile is similar to the spring constant at 800 to 4000. However, at the right lung (Line 2) and left lung (Line 3), the trend of the velocity profile is totally different, especially at the 4000 spring constant, which becomes more fluctuated near the wall. The discussion of the spring constants on particle deposition is provided in the particle analysis section.
1.2. Pressure Analysis
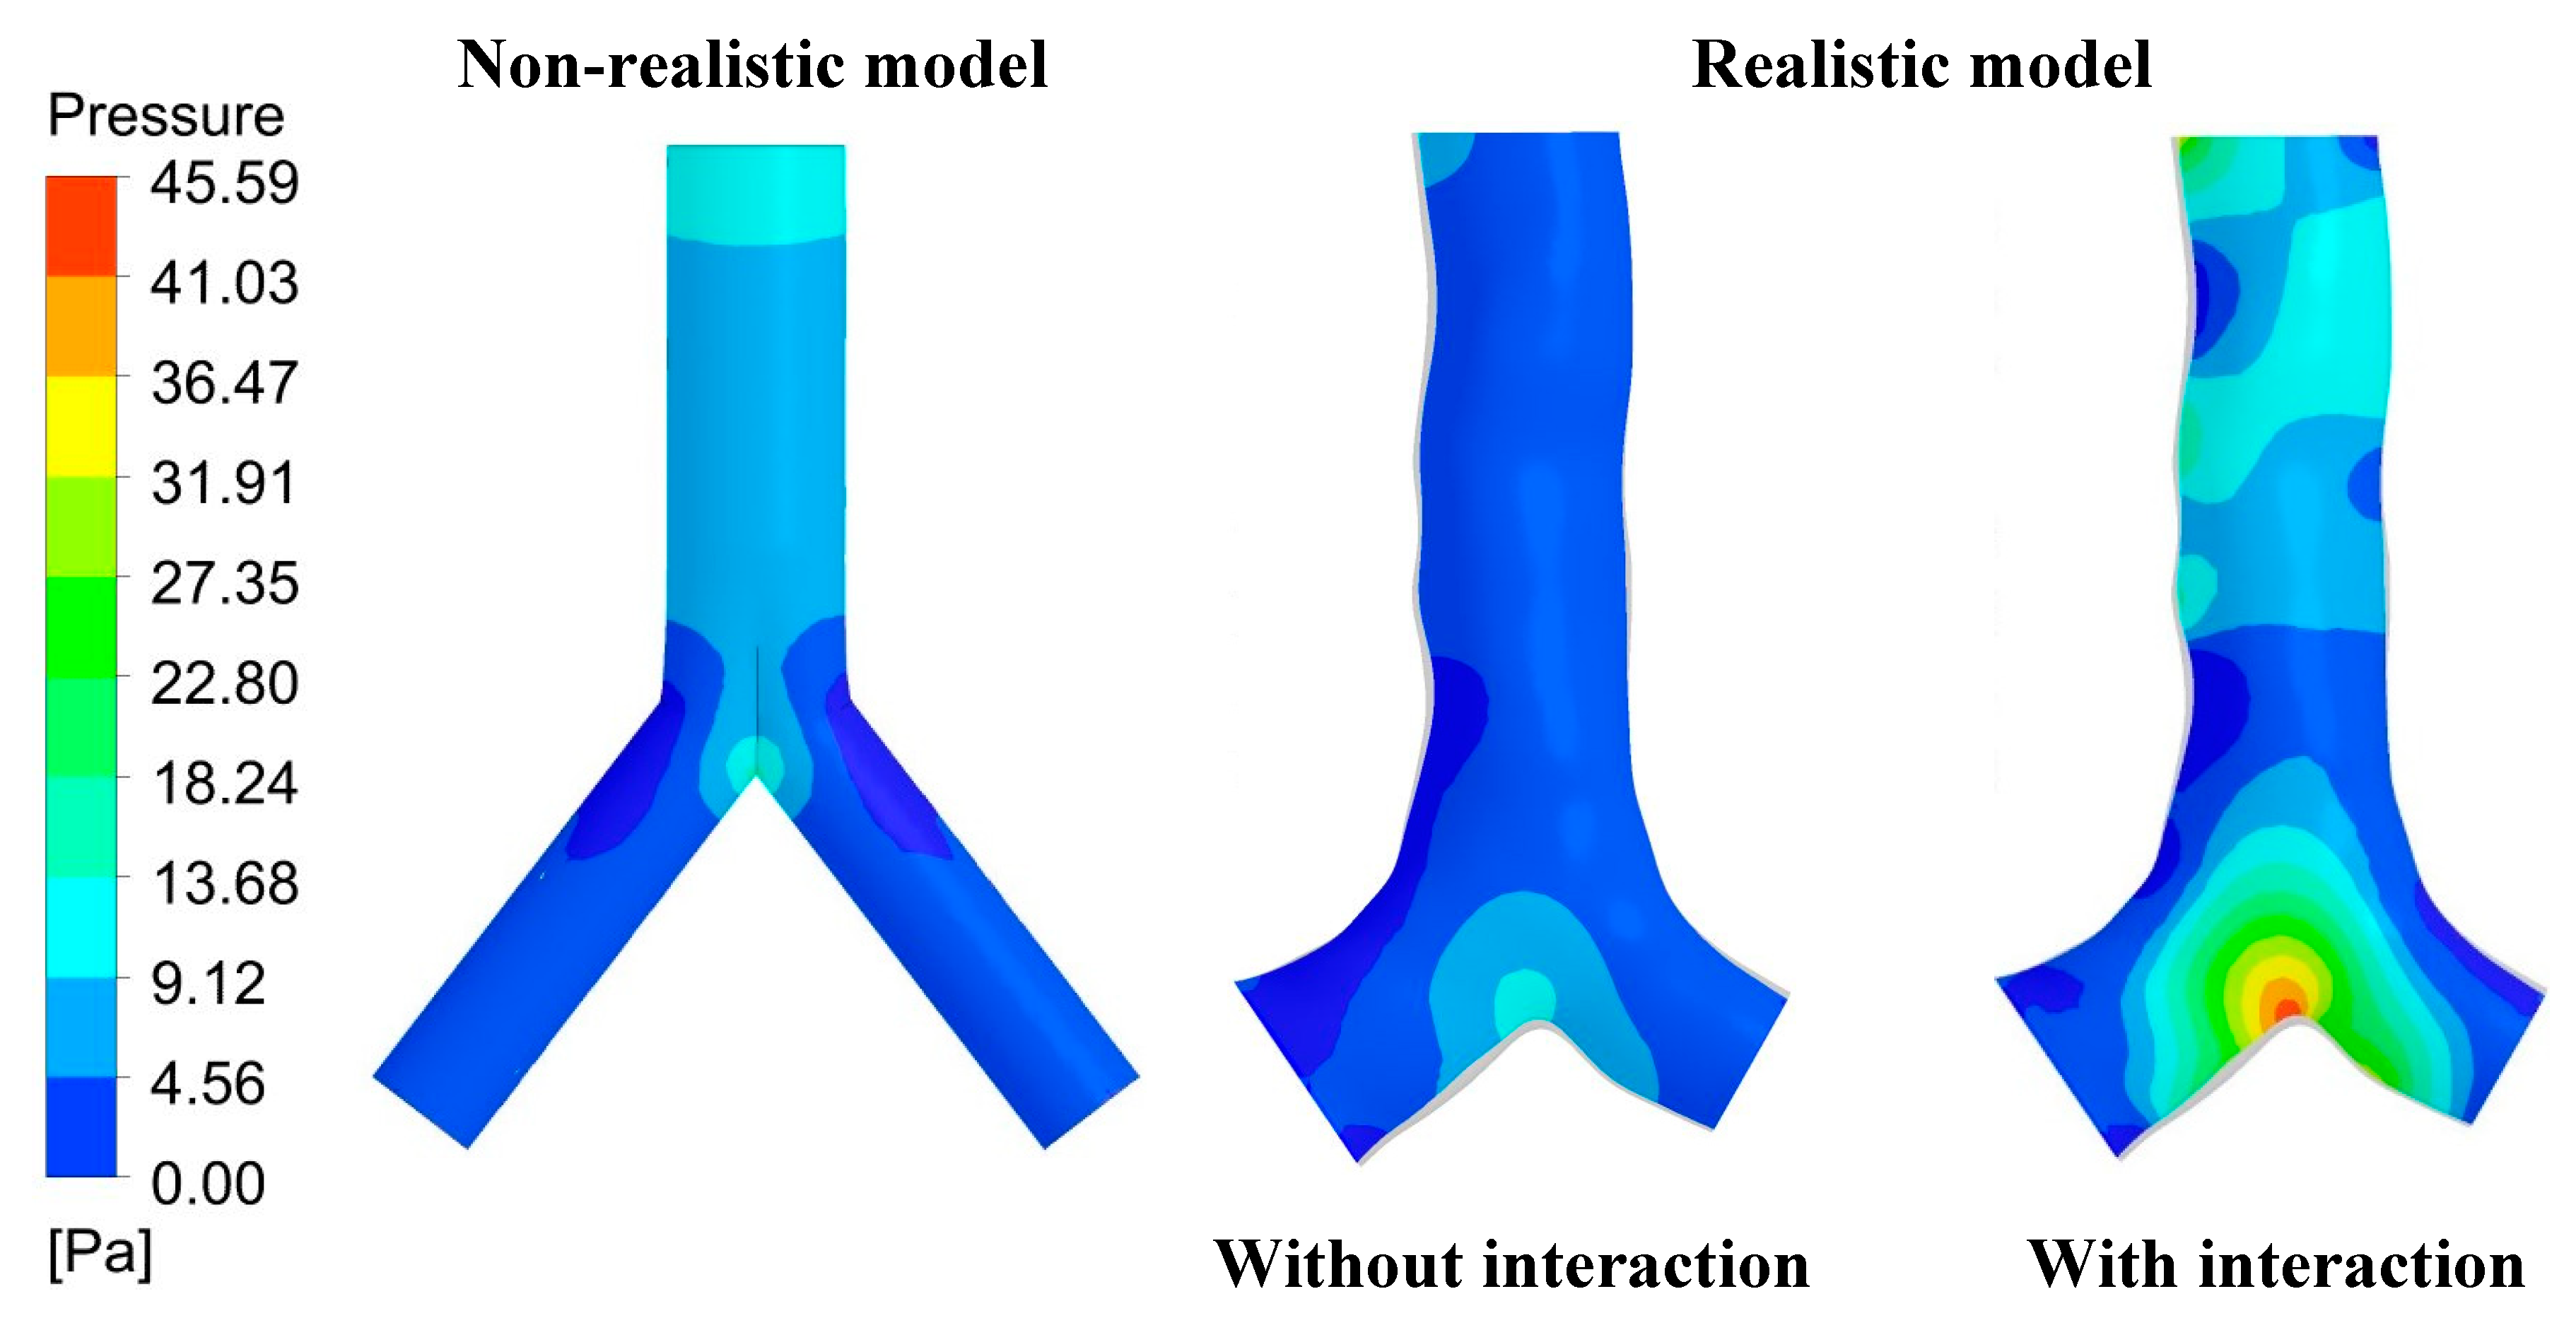
The pressure variations inside the non-realistic and realistic lung airway are investigated and presented in
Figure 11 as the pressure contour under the flow rate at 60 lpm. The pressure variation changed due to fluid flows inside the domain. This figure clearly shows that the pressure patterns between these three cases are different, especially in the non-realistic lung model. From the non-realistic model, the higher pressure was found at the inlet and the bifurcation area, while the left lung and right lung were found to have a lower pressure. From the realistic model without particle interaction, the higher pressure was observed at the left edge of the inlet and the bifurcation area, while around nearly the right lung wall was found to have a lower pressure. However, the maximum pressure magnitude from these two cases is still lower than 13.68 Pa. When having particle interaction, a higher pressure was observed from several locations of the realistic model, especially at the left edge of the inlet and the bifurcation area. The highest pressure at 45.59 Pa was noticed at the bifurcation area in this case.
Figure 6, the particle-particle interaction significantly affects the flow pattern inside the domain, which results in the change of pressure variation for this case compared to other cases without having particle interaction.
1.3. Wall Shear Analysis
The shear stress on the wall of the lung airway is analysed and presented in
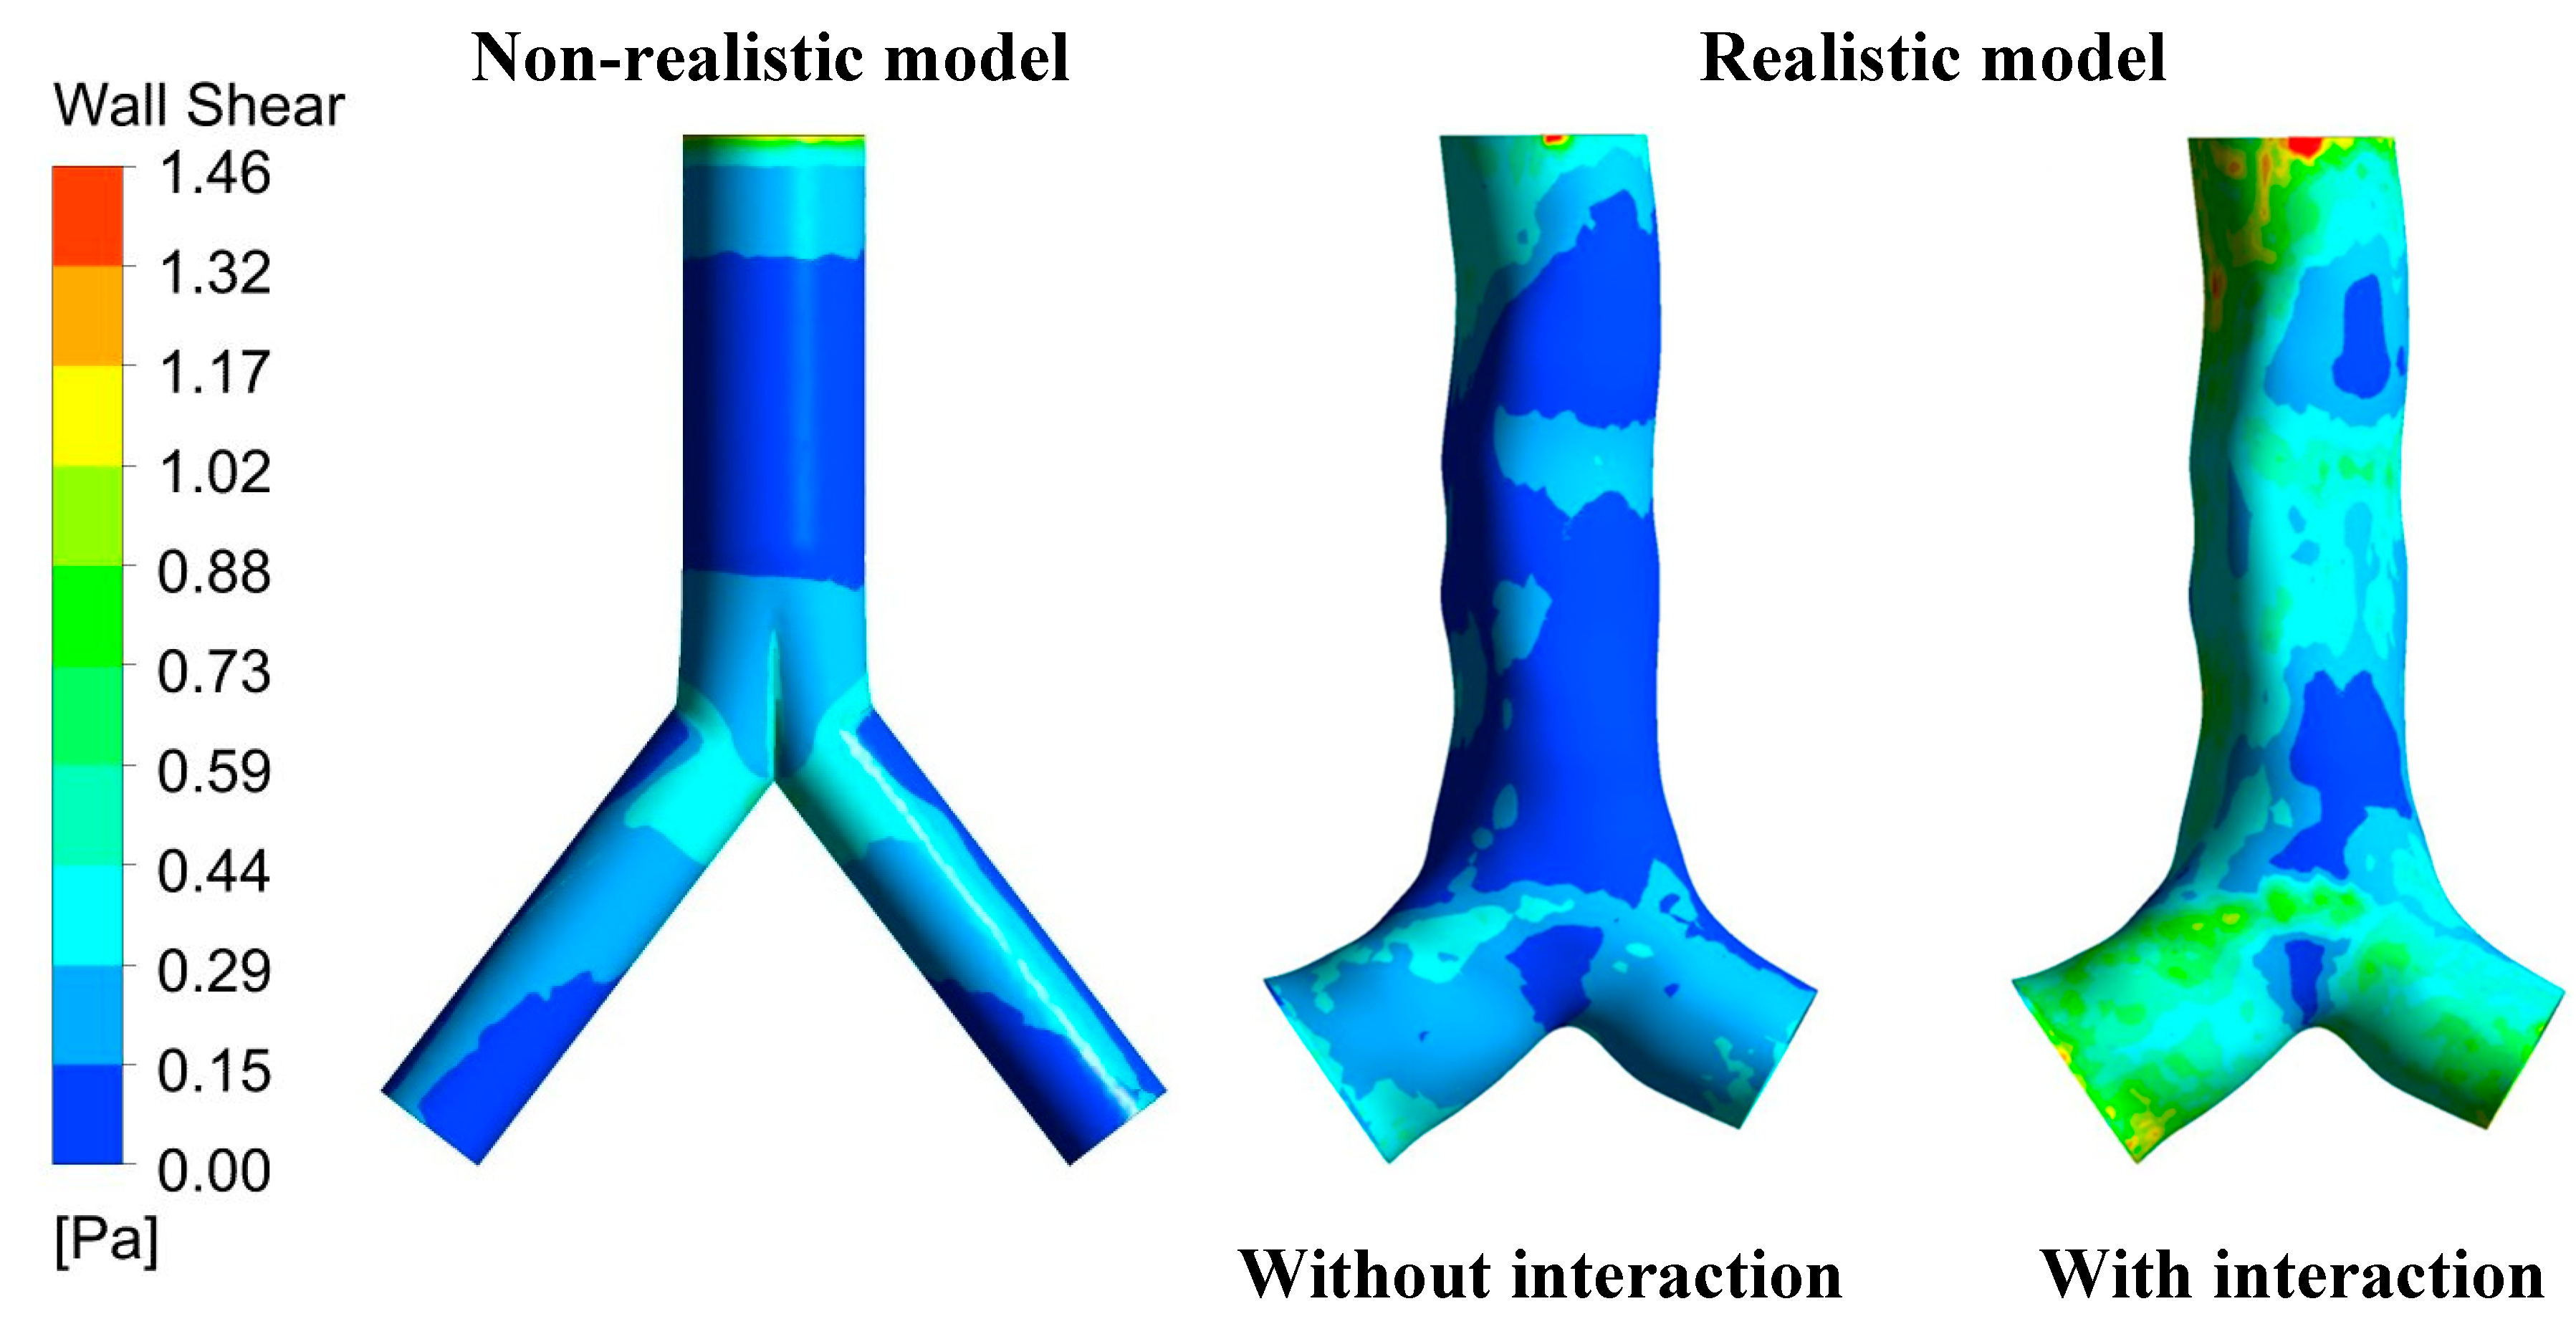
Figure 12 under the comparison between non-realistic and realistic cases with 60 lpm flow rate. Wall shear stress refers to the shear stress of fluid which is usually occurring in the layer next to the wall of a domain (Larpruenrudee et al., 2021). The fluid flows fastest at the central area of the domain and flows the slowest close to the wall of the domain. Due to the complicated structure of the realistic model, the variation of shear stress on the wall from this model is different from the non-realistic model. However, the highest wall shear stress at 1.46 locates at the inlet area for all cases. The highest wall shear stress from other areas is still lower than 0.88 for the non-realistic model and realistic model without particle-particle interaction. At the right lung and left lung, the highest wall shear stress at 1.32 was found from the realistic model with particle-particle interaction.
2. Particle Analysis
Particle transport and deposition within the lung airways play an essential role in drug delivery. The comprehensive analysis of particle distribution and motion during transport within the human lung airways is significant for obtaining accurate particle transport and deposition results. The numerical calculation from the DEM is based on Newton’s second law, which will calculate the individual element’s motion. The advantages of DEM are to consider friction, contact plasticity, gravity, cohesion and other interactions and to record the information (position, velocity, forces exerted on) of each particle during the simulation (Chen et al., 2012). Therefore, this section proposes a comprehensive analysis of particle transport and deposition under the DEM model for various initial inlet conditions.
2.1. Particle with Interaction and without Interaction
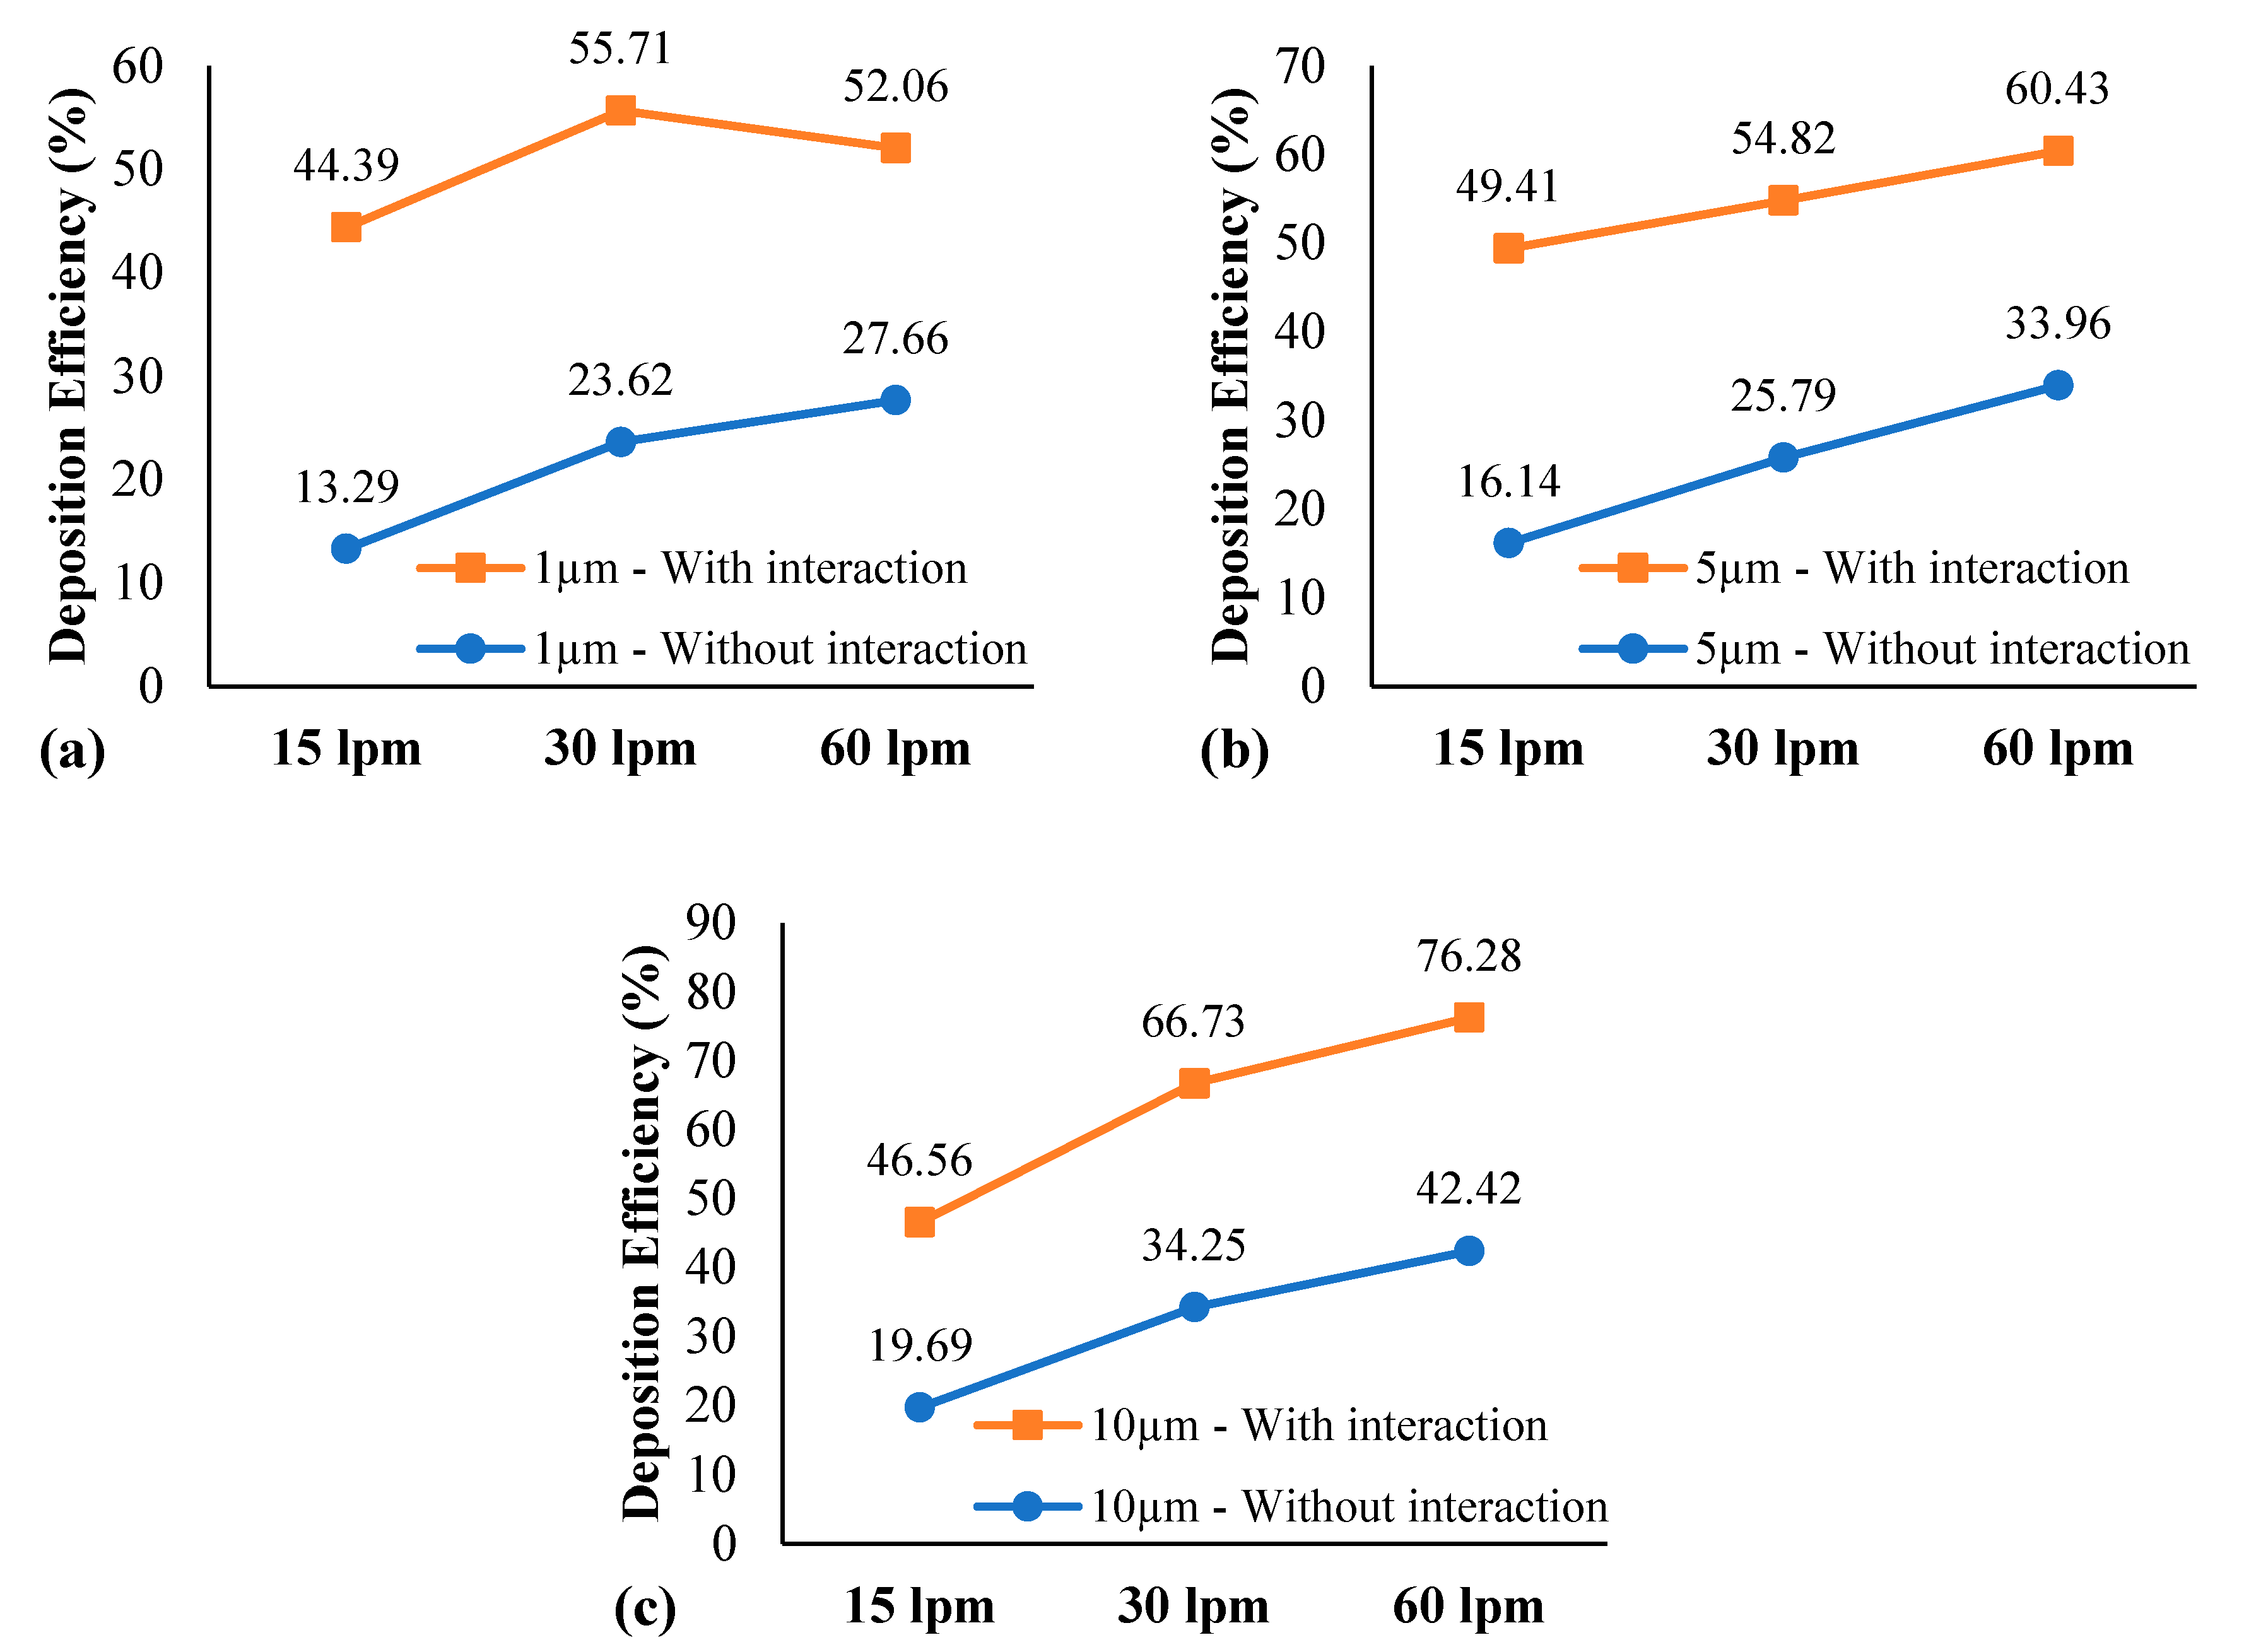
The comparison of particle transport and deposition within the bifurcation for various flow rates and particle sizes is analysed and presented as the particle DE (DE) in
Figure 13. The numerical simulations were proposed based on the realistic lung model with and without particle-particle interaction.
Figure 13a–c illustrates the DE from particle size as 1–10 µm, respectively. For the DE in this study, it refers to the percentage of total particles trapped during transportation through the domain which is divided by the total number of injected particles from the inlet of the domain. The remaining particles are classified as the escaped particles, which travel from the outlet of the right and left lungs. The DE is dependent on the particle diameter, flow rate, and density (Islam et al., 2021). For the microparticle, a greater particle diameter usually has a higher DE rate, while a higher flow rate generally results in a higher DE rate.
At 15 lpm flow rate, the maximum DE was found 20% and 50% for the case without particle interaction and with particle interaction, respectively. For the 30 lpm flow rate, the maximum DE was observed 35% and 67% from the case without particle interaction and with particle interaction, respectively. For the highest flow rate at 60 lpm, the maximum DE was around 42% for the case without particle interaction and around 76% for the case with particle interaction. The results from the present study also support the above discussion that a higher flow rate results in a higher DE for both particle-particle with and without interaction and all particle sizes.
The effect of particle size on the DE rate, summarised based on the following discussions. For particle size at 1 µm (
Figure 13a), the maximum DE from the case without particle interaction and with particle interaction was found 30% and 56%, respectively. From the particle size at 5 µm (
Figure 13b) and 10 µm (
Figure 13c), the maximum DE from the case without particle interaction was observed 34% and 43%, respectively. However, for the particle size at 5 µm and 10 µm from the particle interaction cases, the maximum DE was around 60% and 76%, respectively. A higher particle diameter results in a higher DE for all flow rates. The larger particle has higher inertia which influences the overall deposition (van Ertbruggen et al., 2004; Ma & Lutchen 2009). The CFD-DEM model reports that the DE from the case with particle interaction is significantly higher than the case without particle interaction, especially the case with 15 lpm flow rate and 1 µm particle diameter.
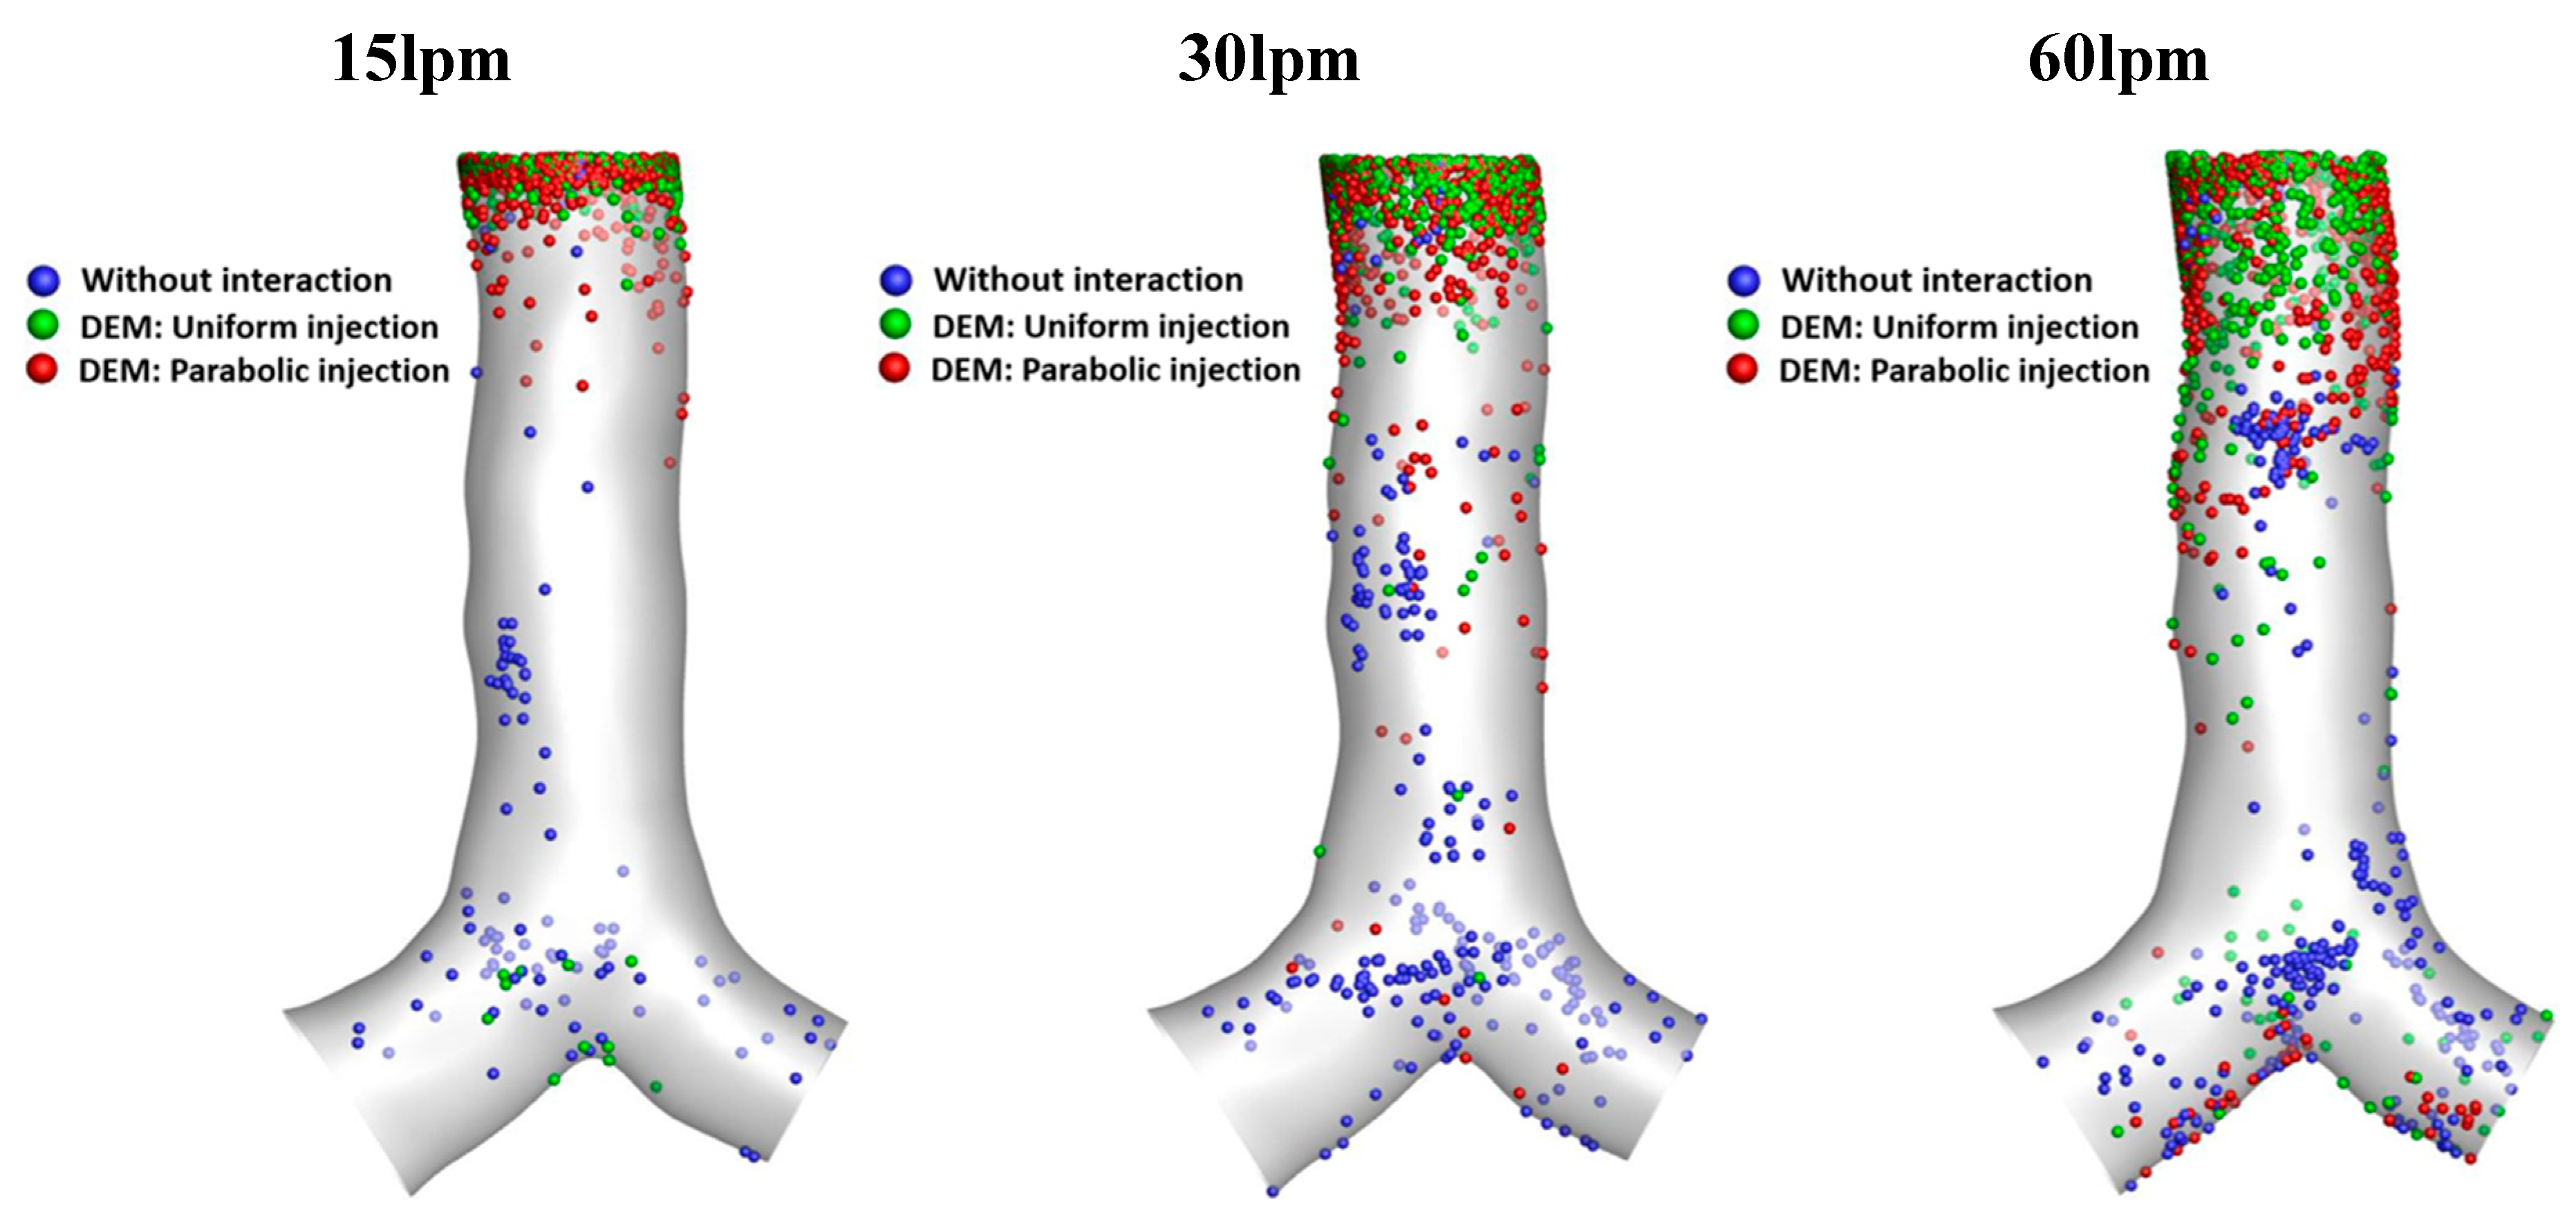
To support the discussion of the DE from the case with and without particle interaction (refer to
Figure 13), the particle deposition scenario was performed and presented in
Figure 14. The blue particles refer to the case without particle interaction. The green particles and red particles refer to the case with particle interaction for uniform and parabolic injection of the fluid flow, respectively. A higher flow rate results in a higher particle deposition along the lung airway. Without particle interaction (blue particles), fewer particles are trapped at the inlet area, while most particles are trapped at the bifurcation. However, the cases with particle interaction have a higher particle deposition around the inlet area for both uniform injections (green particles) and parabolic injections (red particles).
2.2. Particle Interaction for Uniform Injection and Parabolic Injection
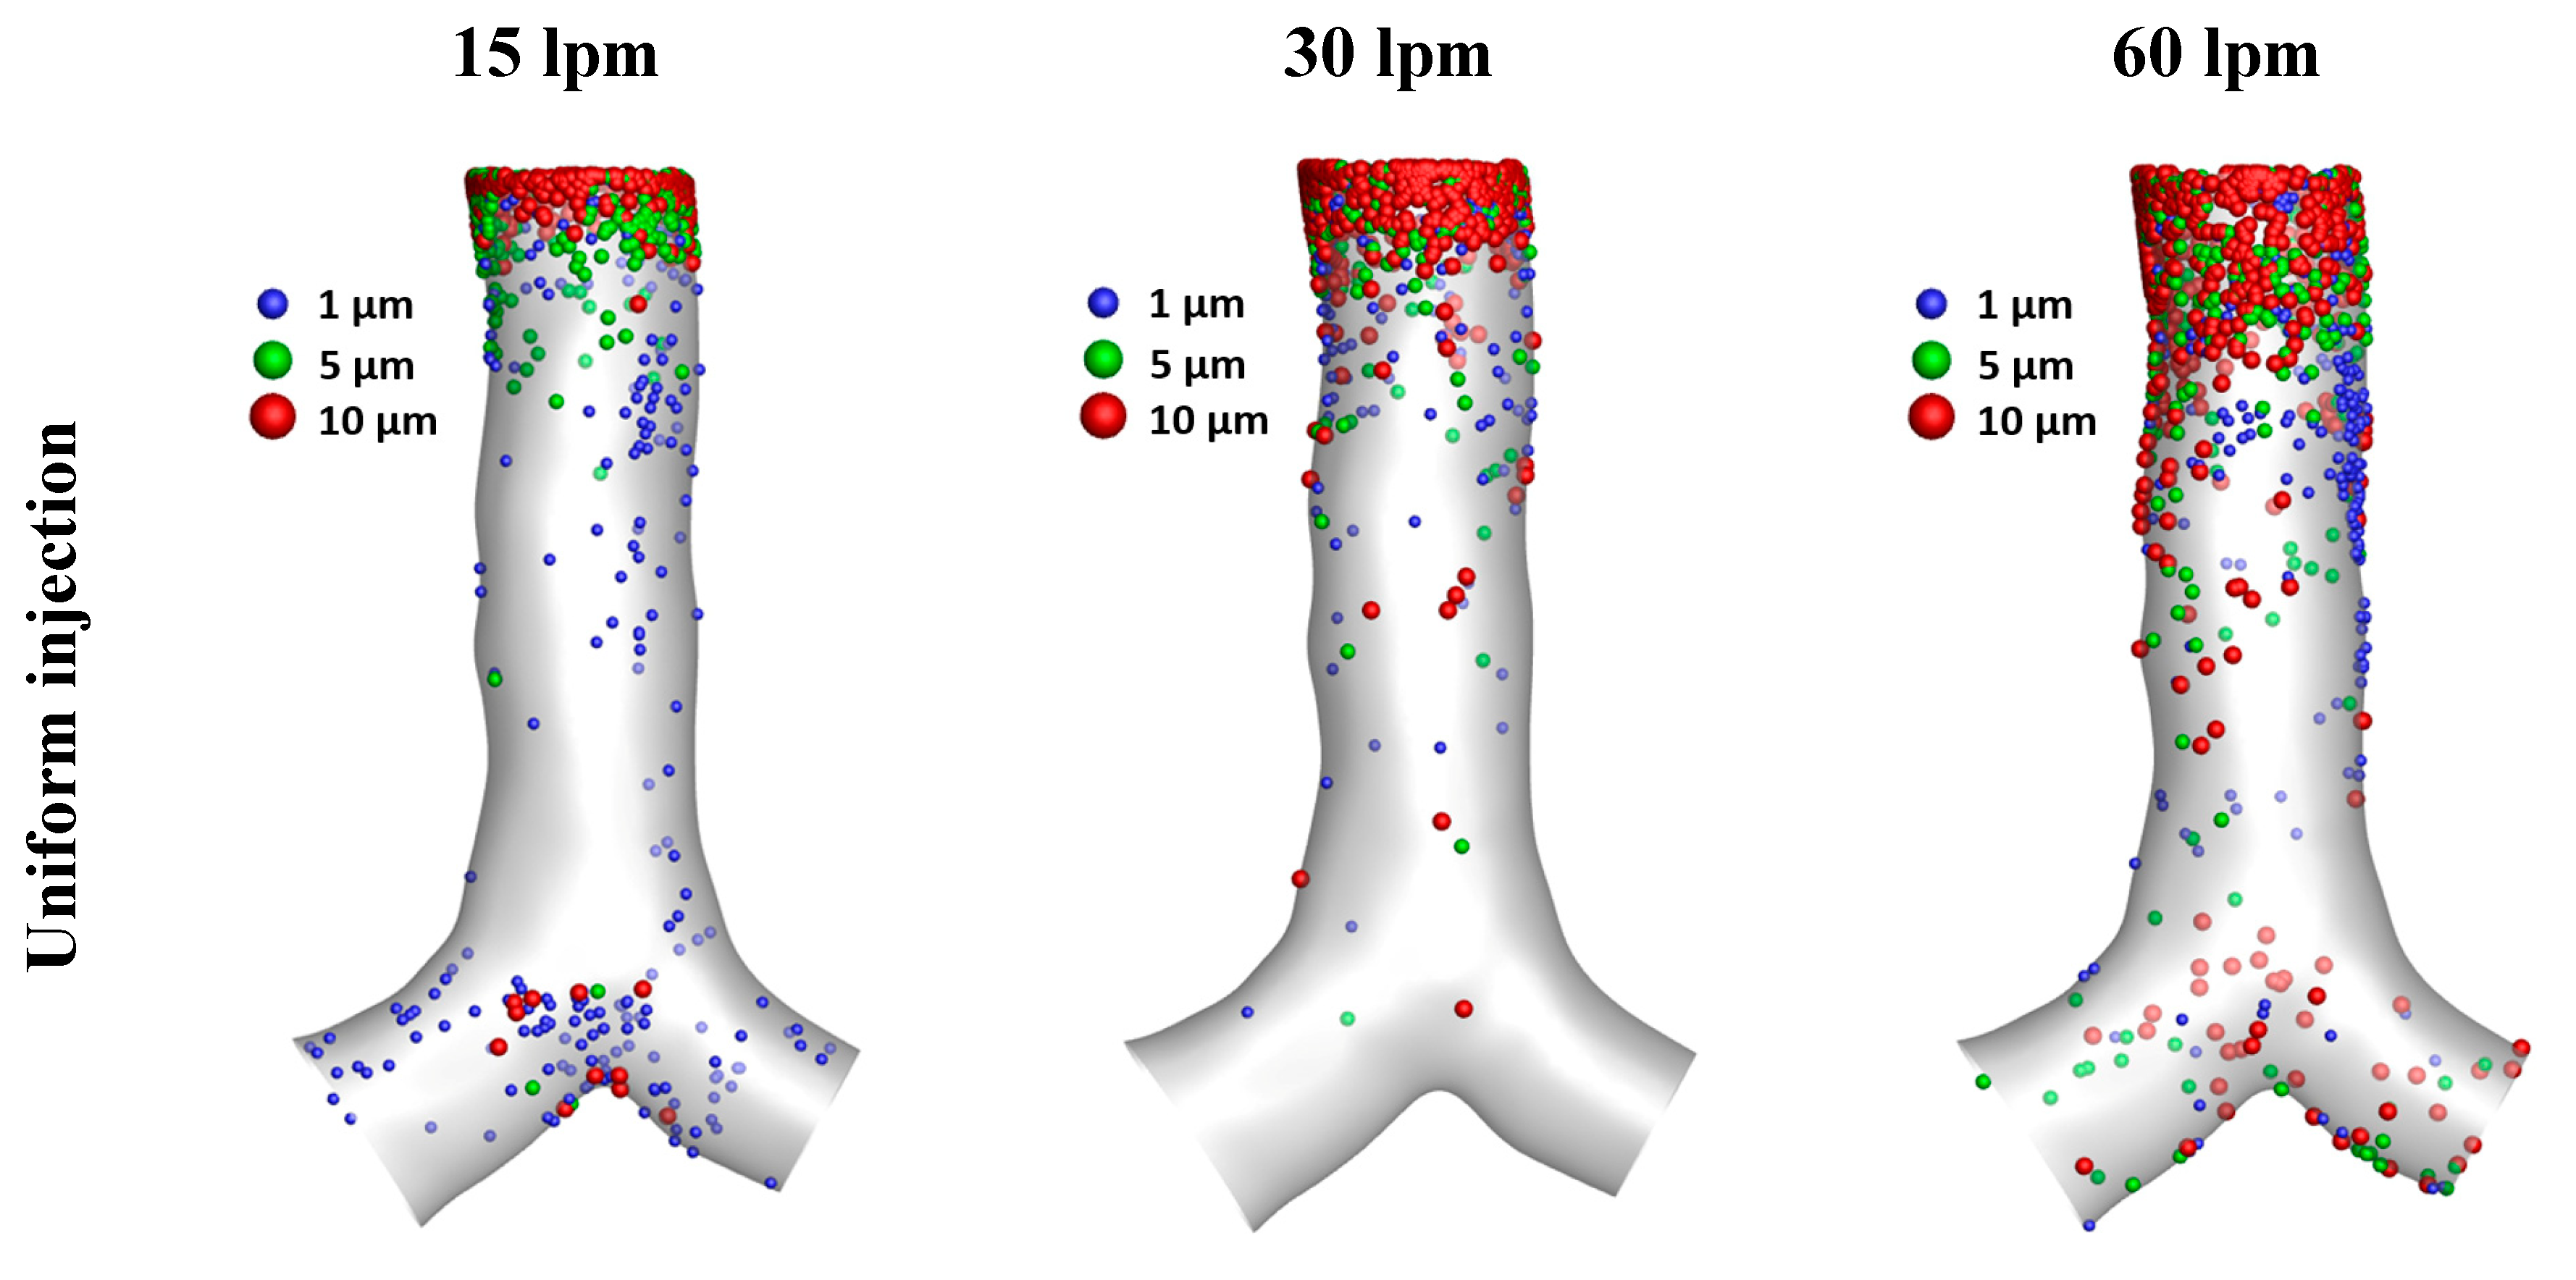
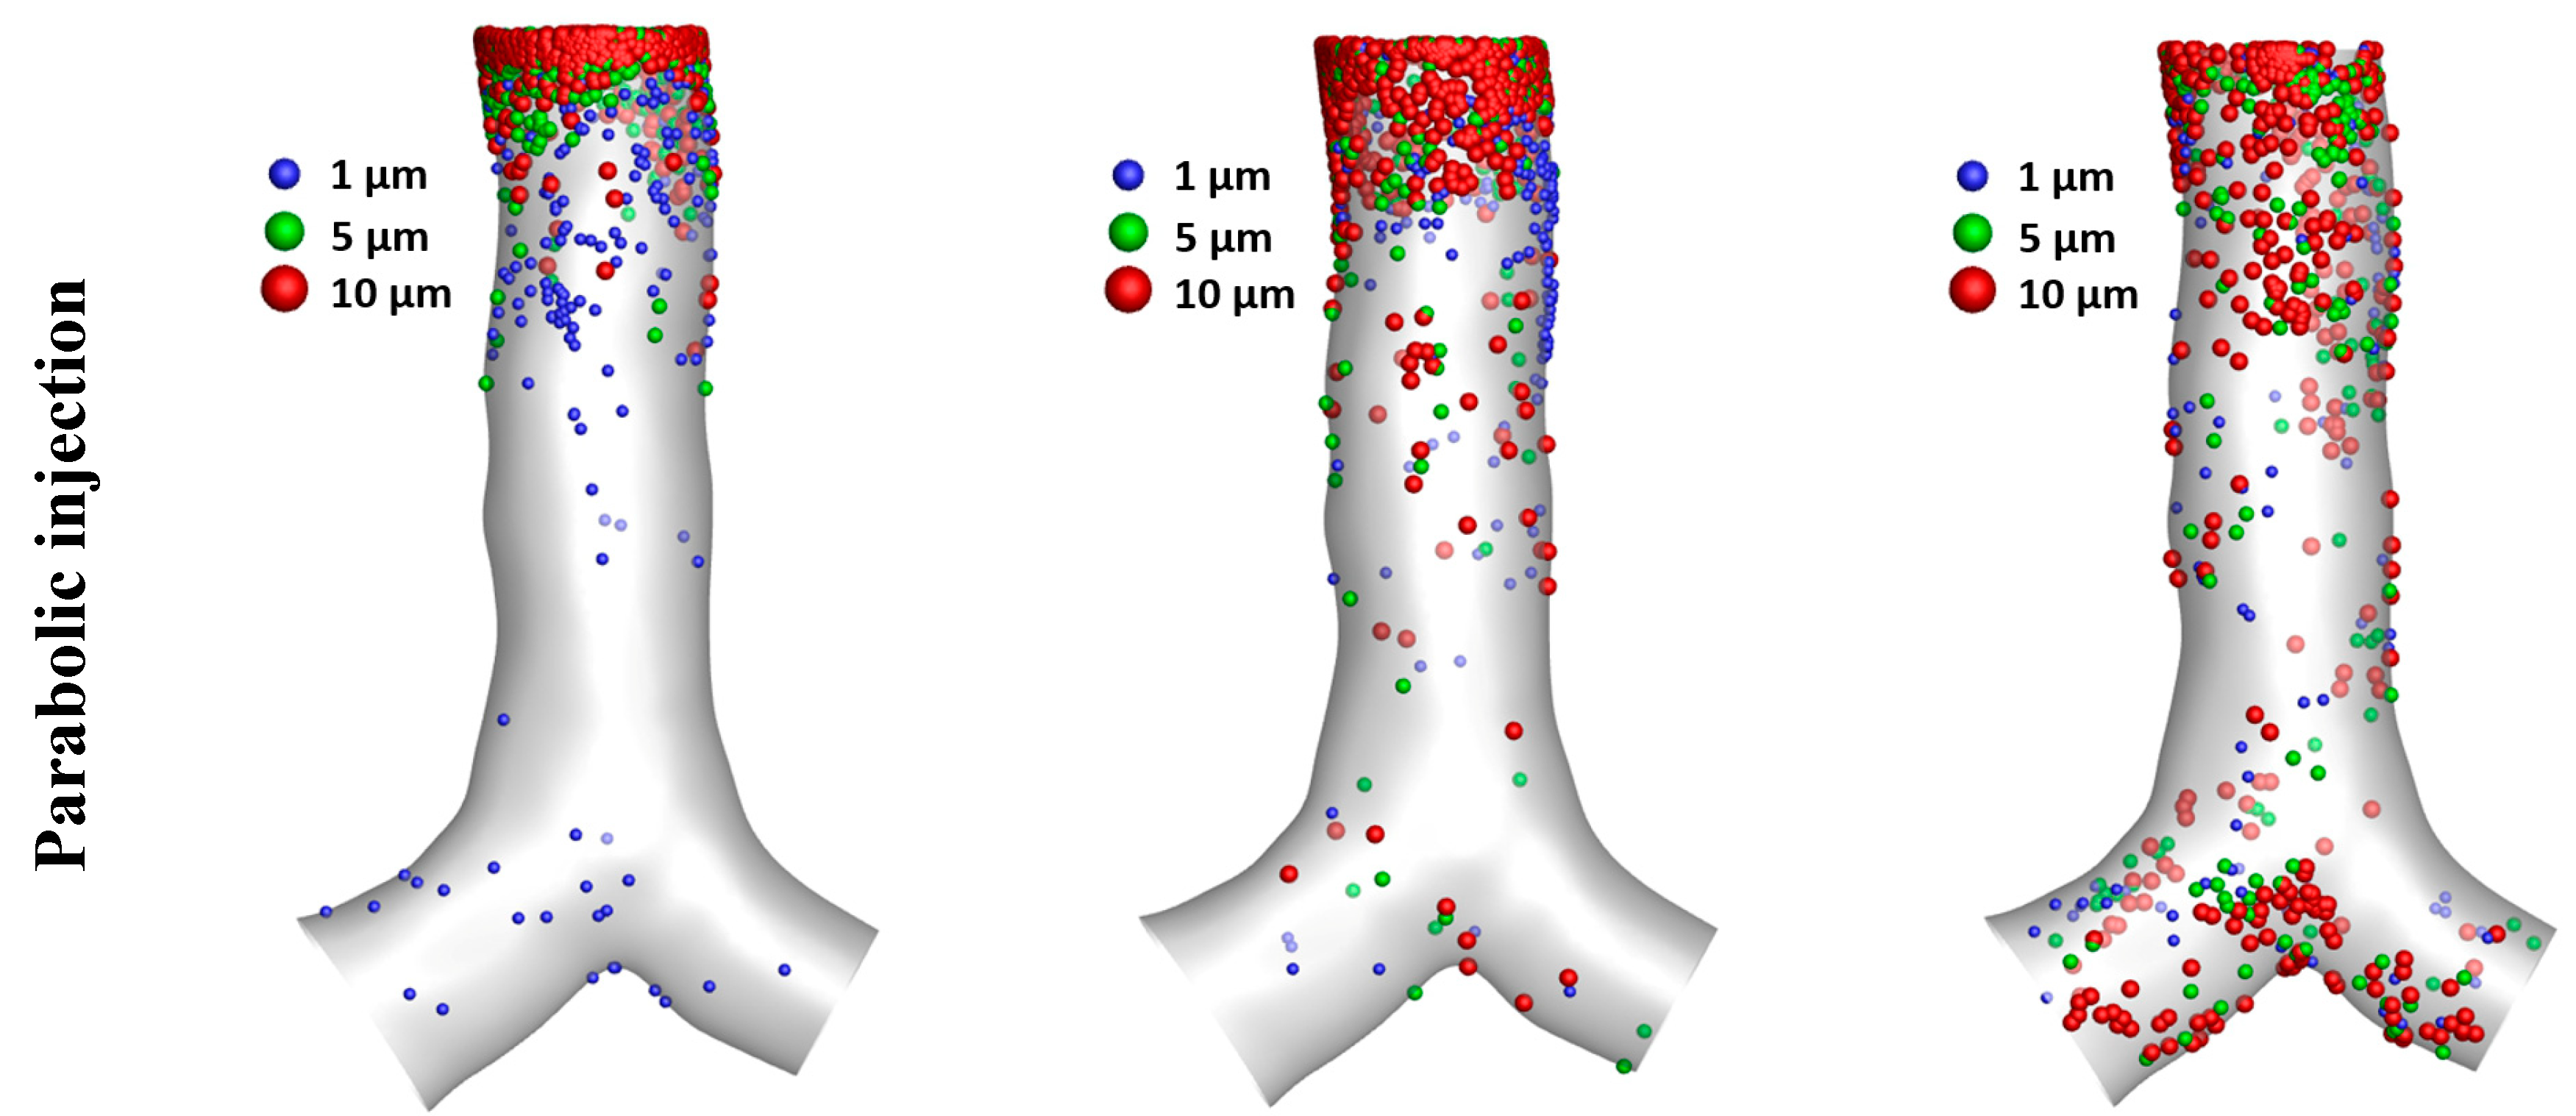
The particle deposition scenarios from various flow rates and particle sizes were performed and presented (in
Figure 15) under the uniform and parabolic injection of fluid flow.
Figure 15, reports most particles (all sizes) are usually trapped at the inlet area for all flow rates. Larger particle size is generally trapped at the inlet area, which results in a lower deposition at other areas, especially the particle size at 10 µm. However, a higher particle density concentration around the inlet area was found in the parabolic injection cases compared to uniform injection cases for all flow rates and particle sizes.
2.3. Particle Interaction for Different Initial Parameters
Table 2 shows the DE for different spring constants at 15 L/min flow rate. The overall DE shows an increasing trend with the spring constant. The numerical results report that the interaction between the particles is higher for the high spring constant values. When the interaction is higher, more particles deviate from the air streamline and increase the overall DE. At k = 50, the lowest DE is observed, while the highest DE is reported for k = 1000.
Table 2.
Particle DE for various spring constants at 15 lpm flow rate and 10 µm.
Table 2.
Particle DE for various spring constants at 15 lpm flow rate and 10 µm.
| Particle DE (%) |
|---|
| k = 50 |
k = 100 |
k = 200 |
k = 300 |
k = 400 |
k = 500 |
k = 800 |
k = 1000 |
| 42.98 |
58.36 |
49.80 |
54.44 |
63.48 |
66.73 |
73.13 |
76.87 |
The numerical results report that the spring constant values influence the flow pattern. A higher spring constant will result in a higher velocity flow along the lung airway.
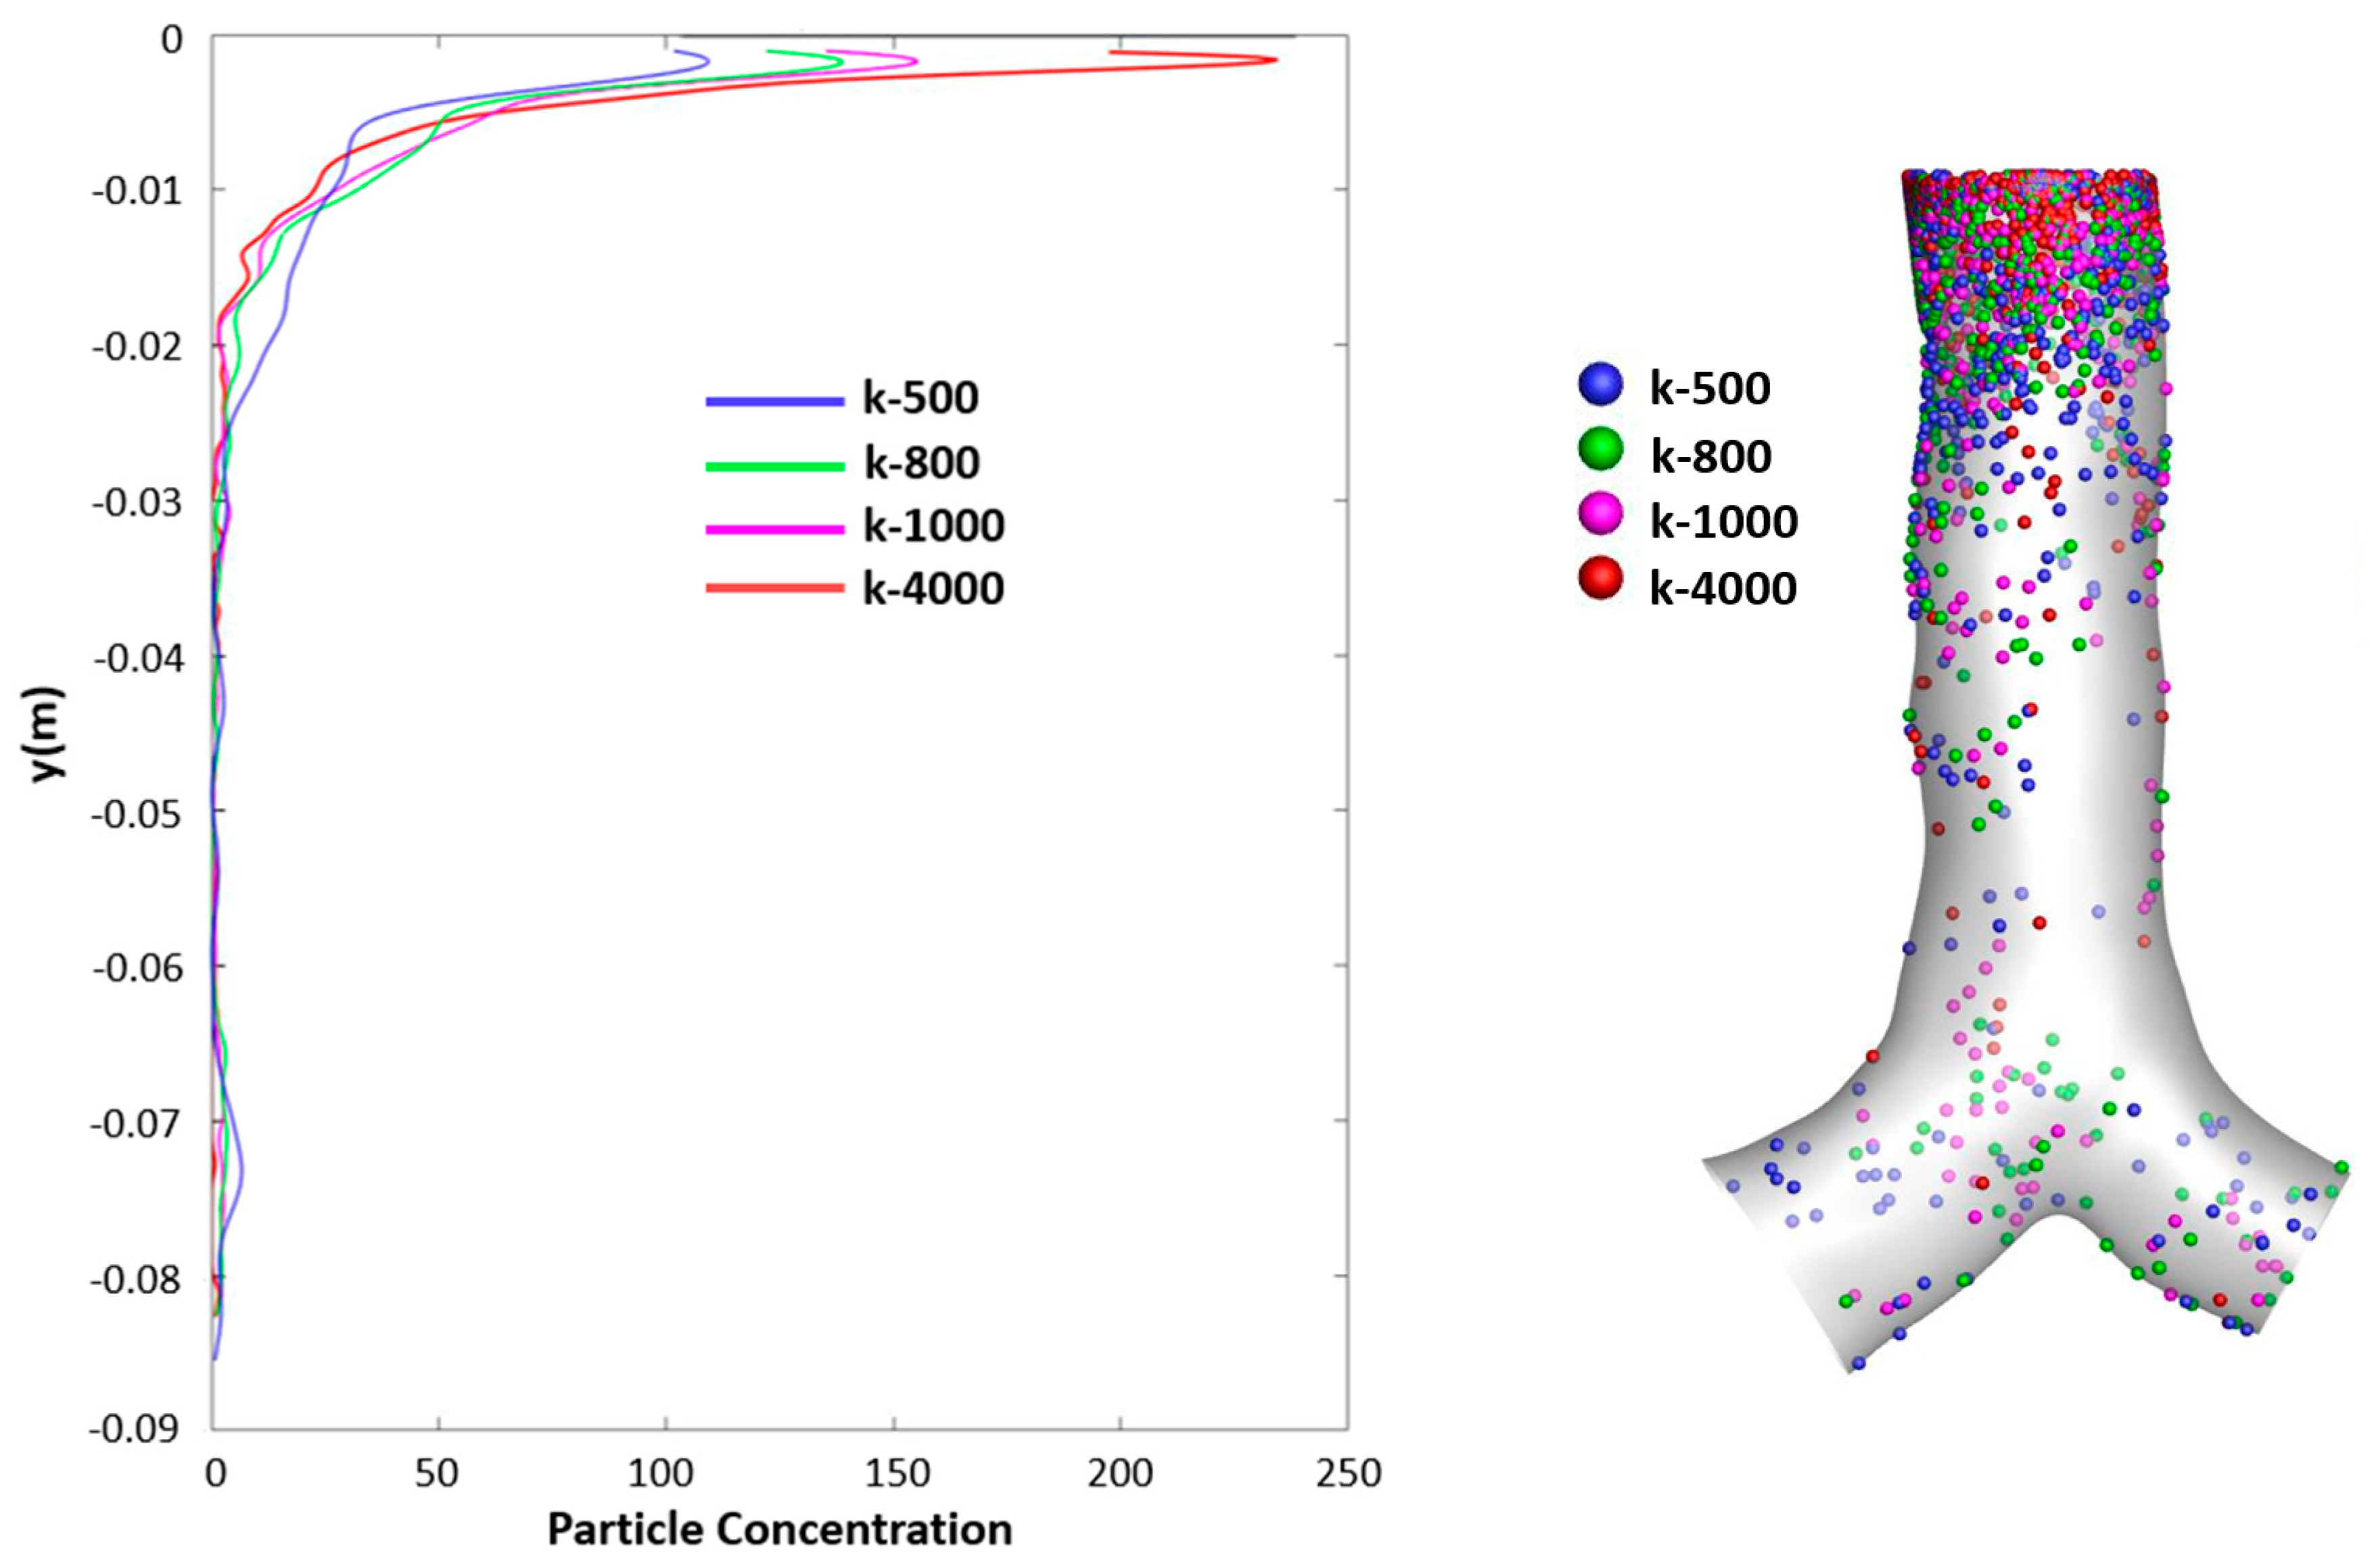
Figure 16 presents the particle deposition concentration (
Figure 16a) and deposition scenario (
Figure 16b) for various selected spring constants under the 15 lpm flow rate and 10 µm of particle size. The results from
Figure 16 could support the velocity flow pattern from
Figure 8 that the highest spring constant at 4000 has the highest particle density, while the lowest spring constant at 500 has the lowest particle deposition. From all cases, around the inlet area has a higher particle concentration.
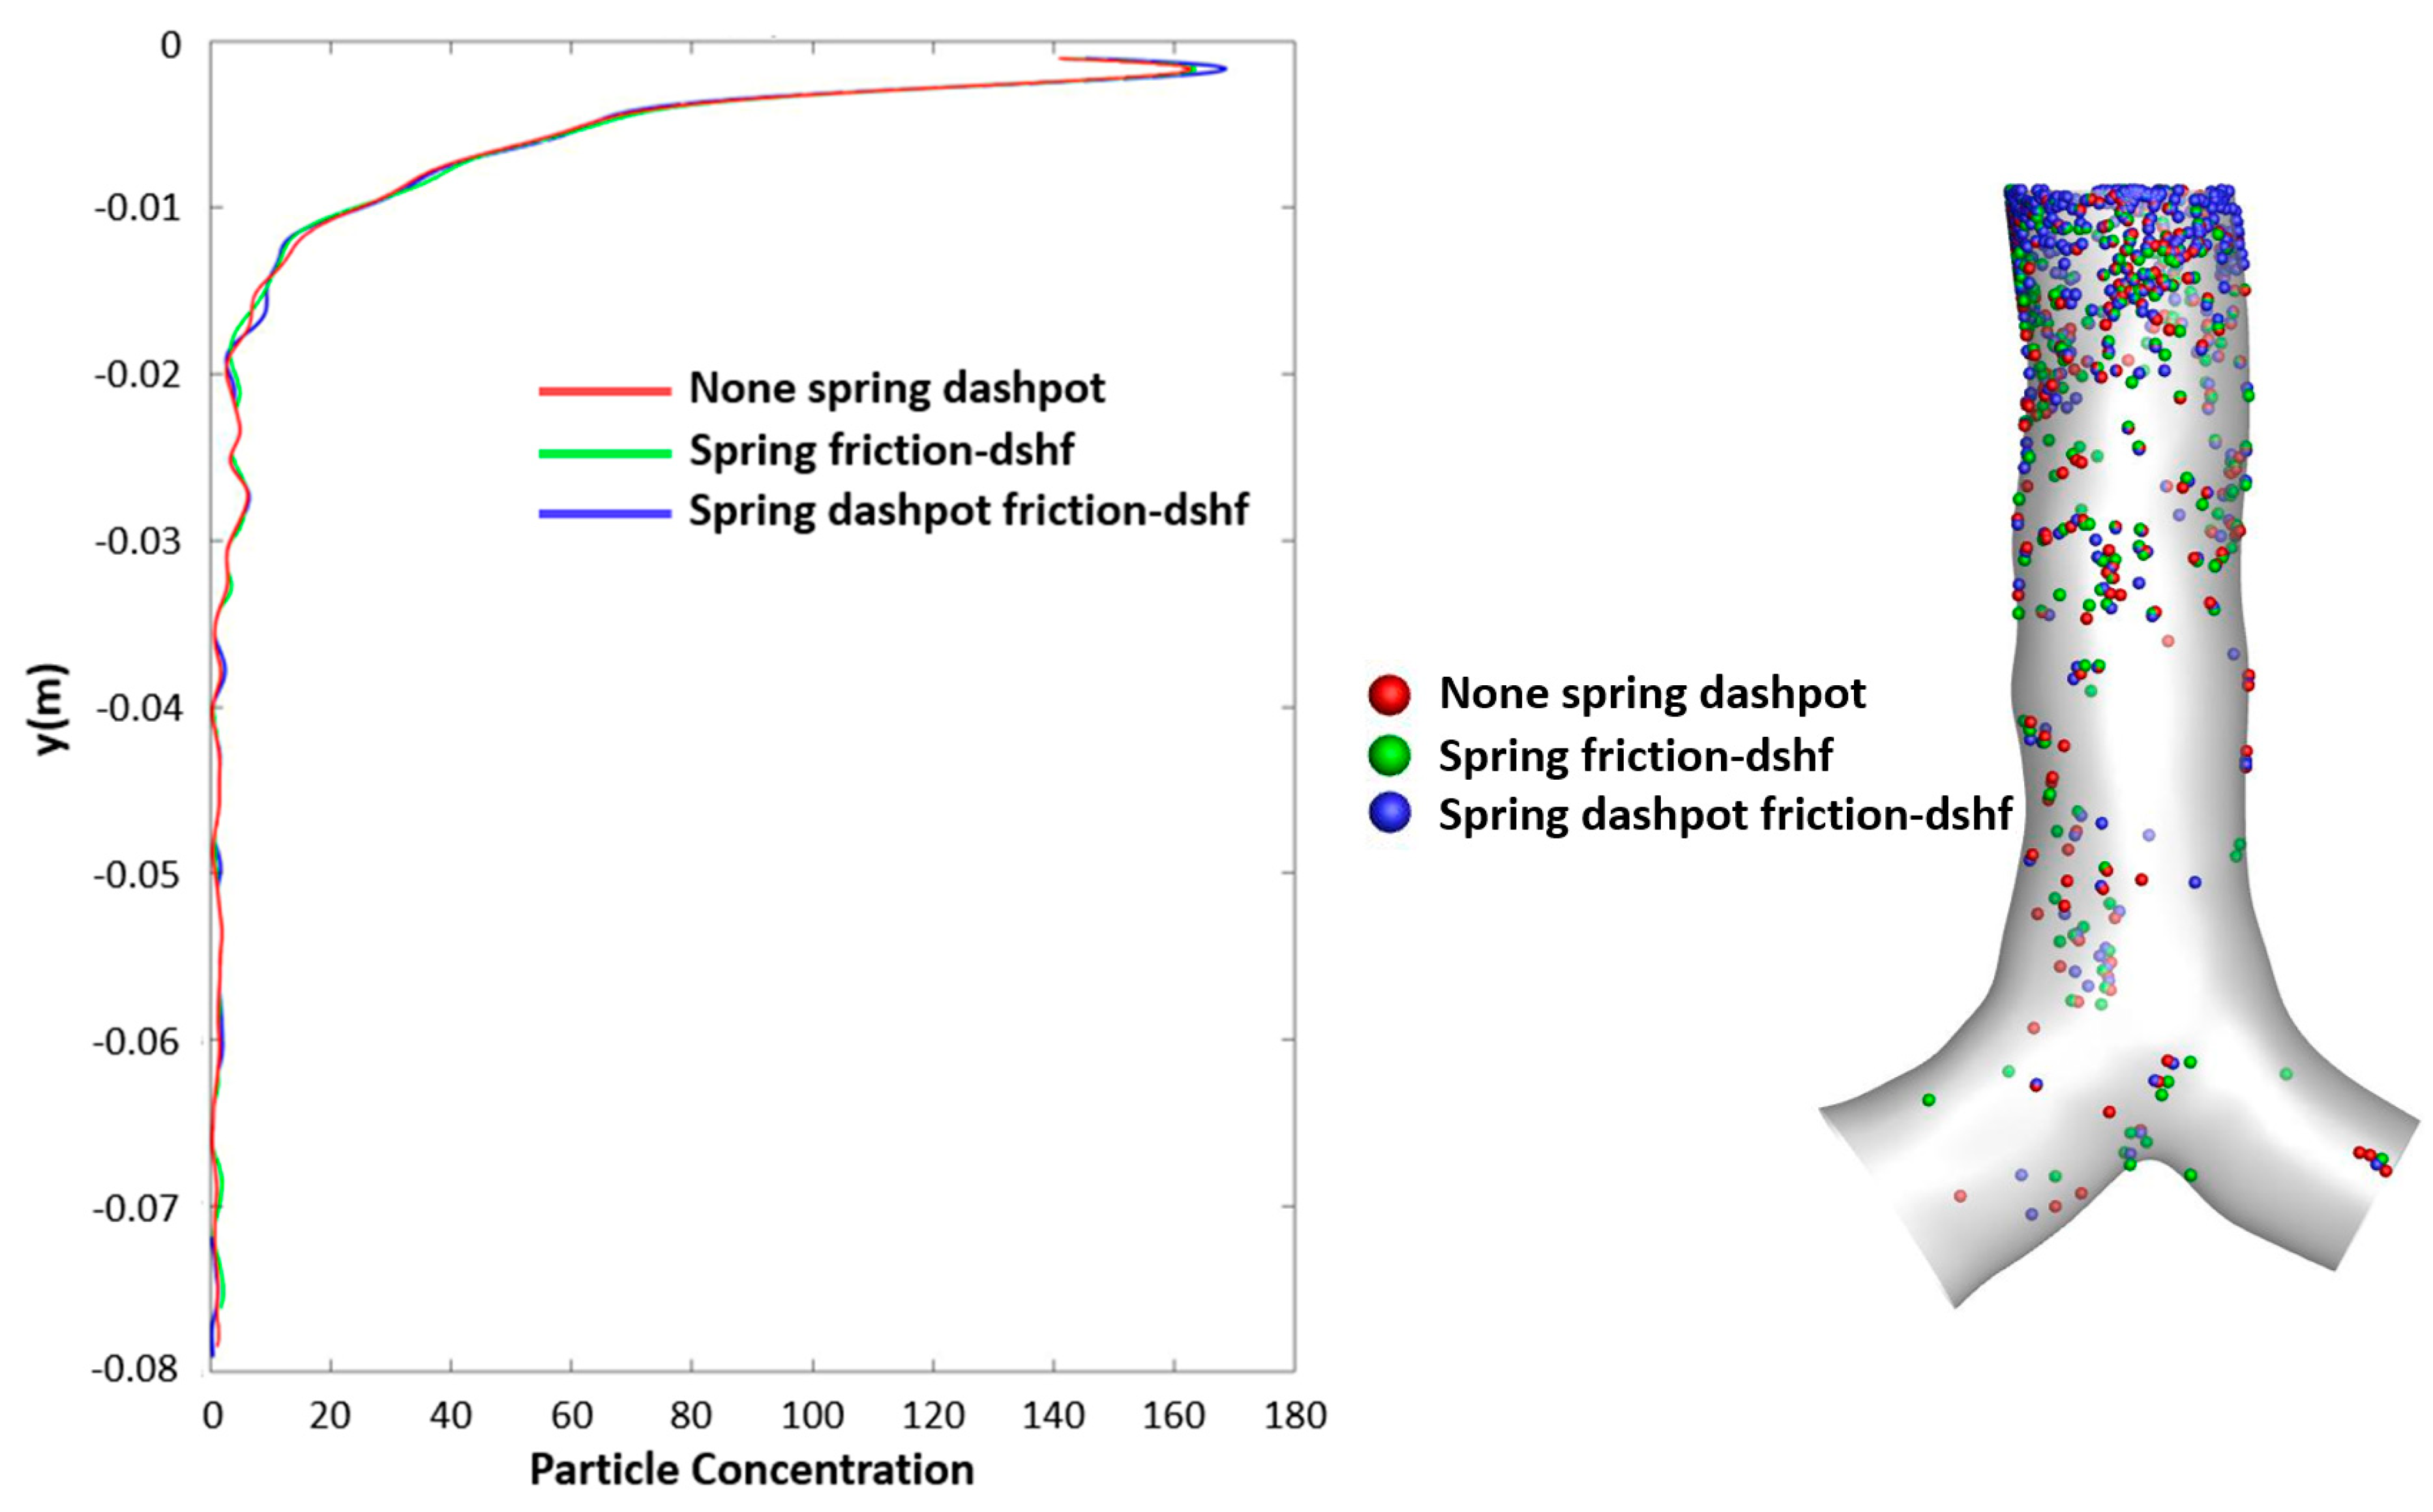
Figure 17 presents the particle deposition concentration (
Figure 17a) and deposition scenario (
Figure 17b) for different interaction methods at 15 lpm flow rate under the particle size at 10 µm. These methods include the none spring dashpot (red line and red particle), spring friction-dshf (green line and green particle), and spring dashpot friction-dshf (blue line and blue particle). The trend of particle deposition concentration is similar for all cases that have a higher particle deposition at the inlet area. However, from the inlet area, the particle deposition concentration from the spring dashpot friction-dshf case (blue colour) was found higher than another two cases.
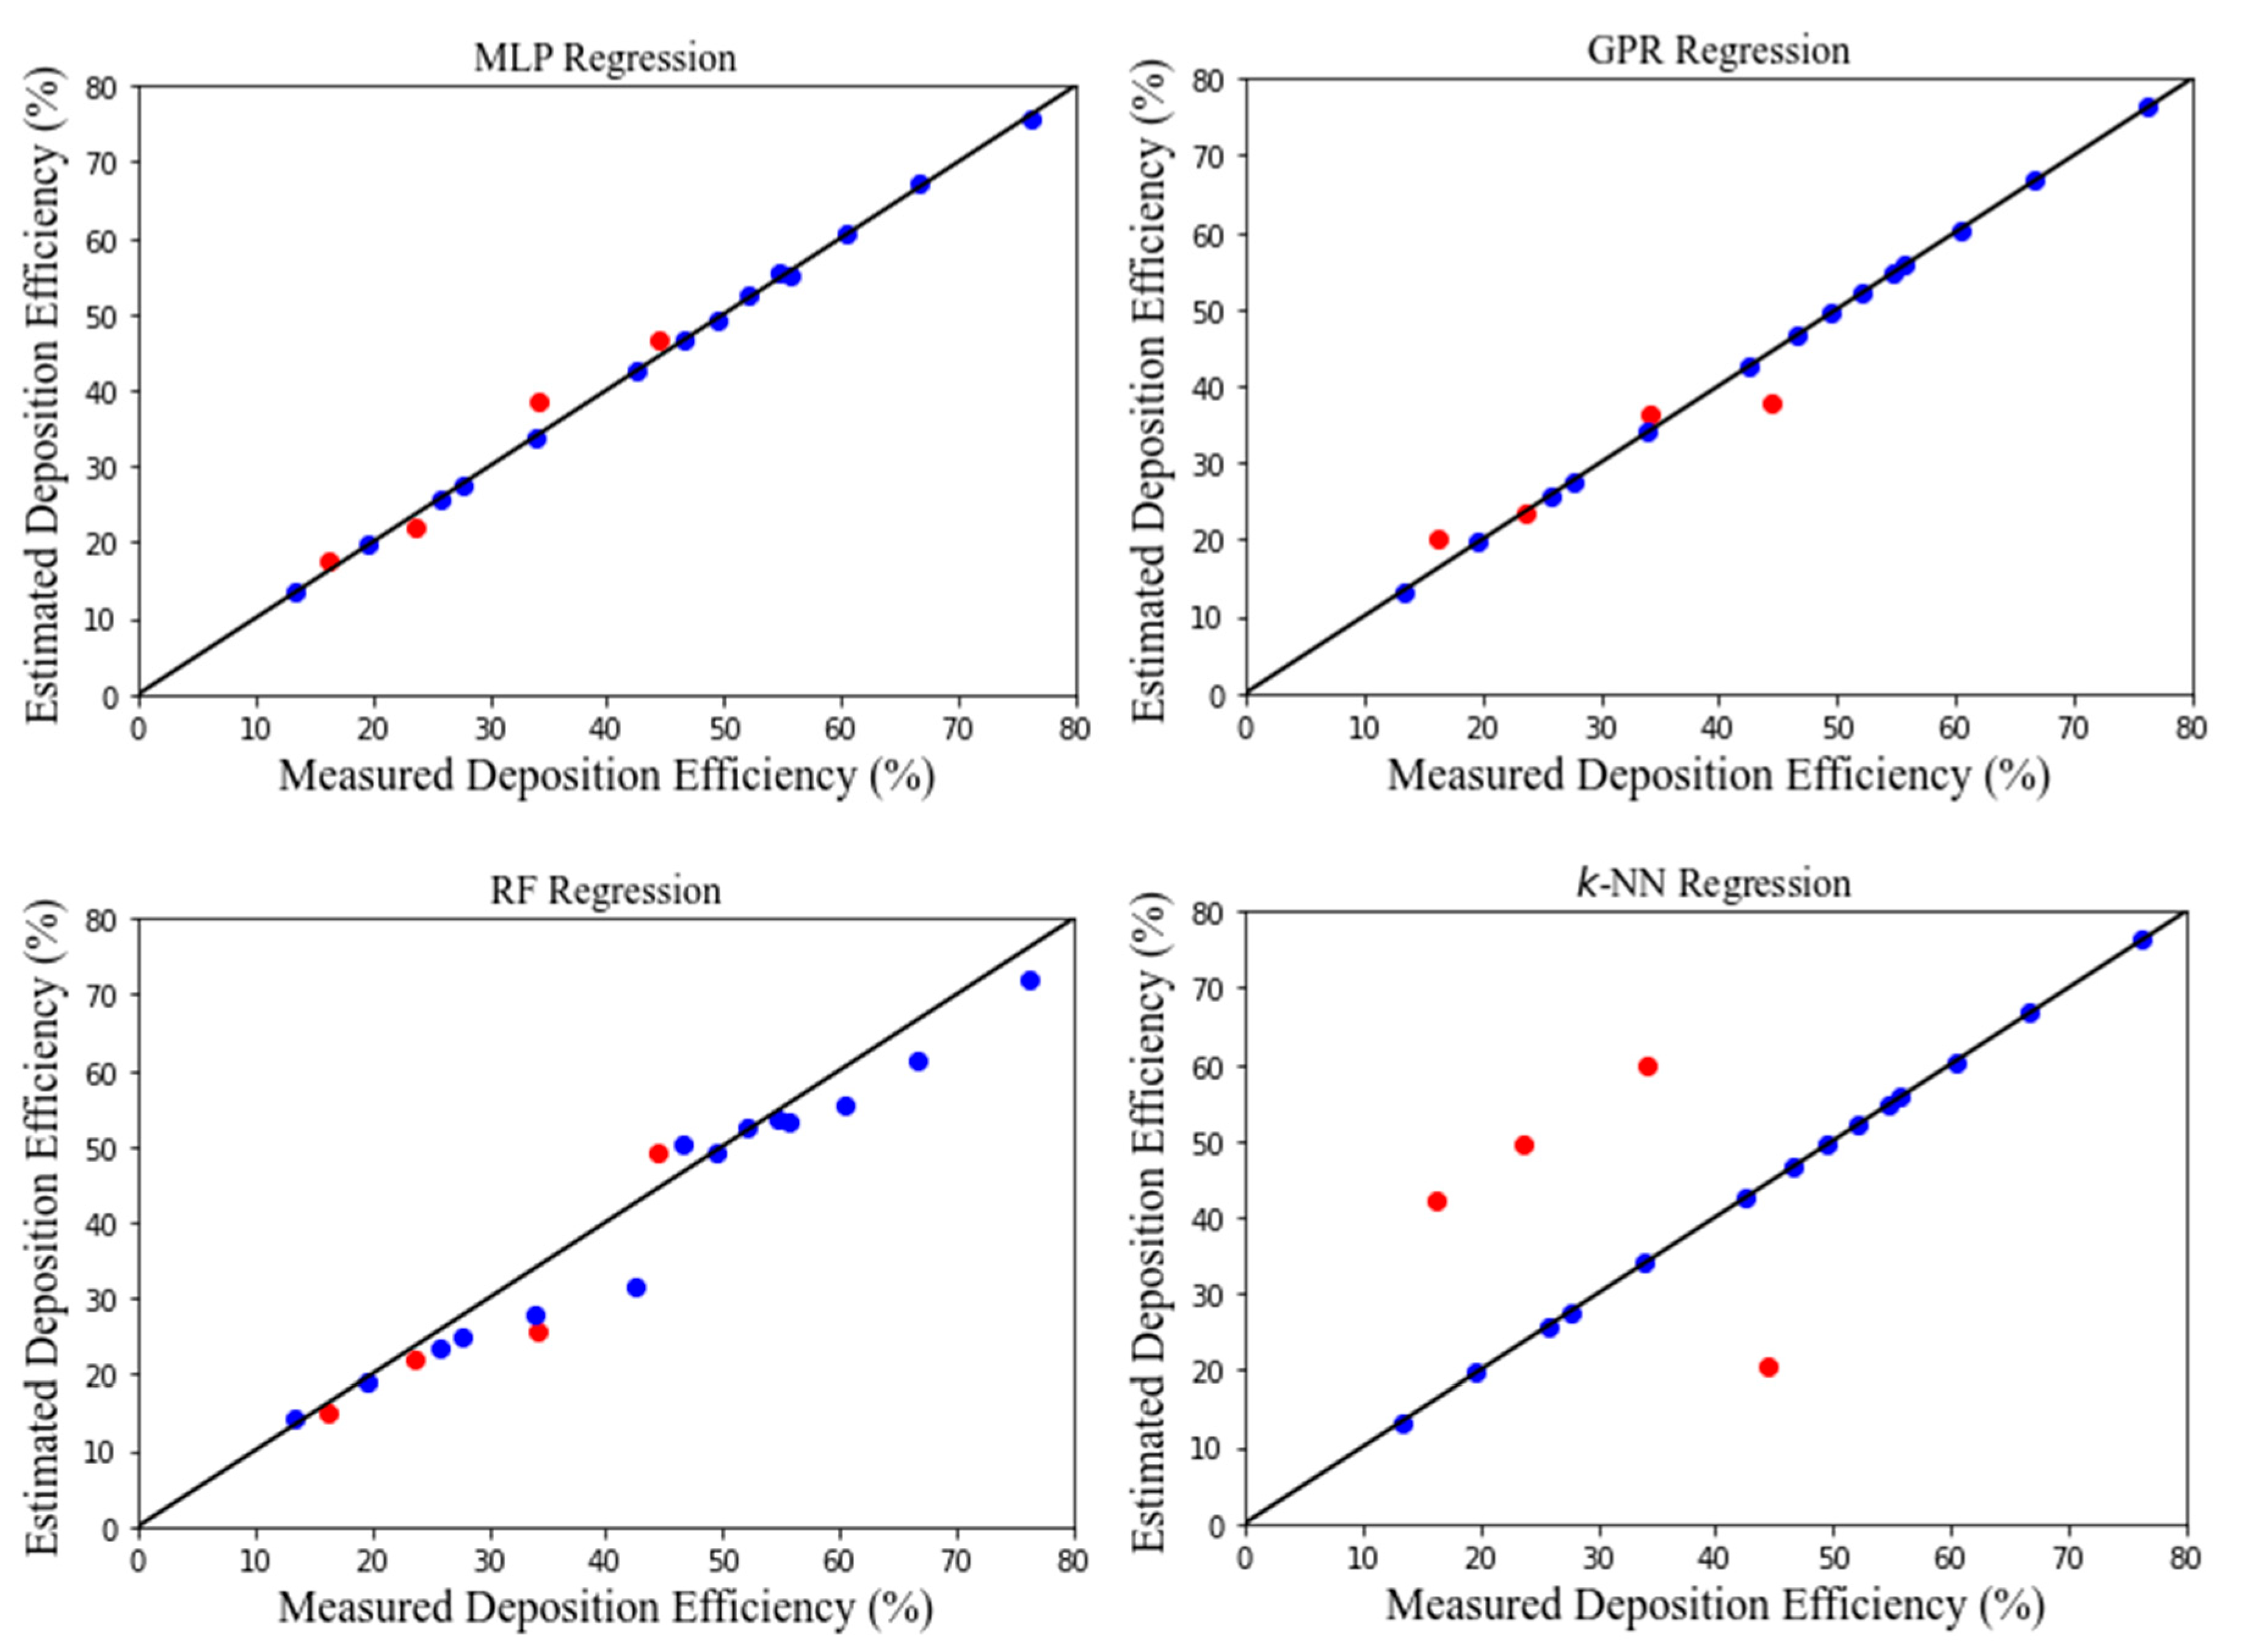
The performance of ML regression models is shown in
Figure 18. It is apparent that there is a high level of agreement between the predicted and measured values for MLP and GPR models. The agreement for RF and k-NN models was not that high. The correlation coefficient (R) value for the estimation of deposition efficiency is 0.994 for MLP model while 0.999 for GPR model, which again suggest high level of accuracy of the MLP and GPR model. Consequently, owing to higher R value, MLP model is selected for further studies.
DE Prediction Using ML Regression Model
In
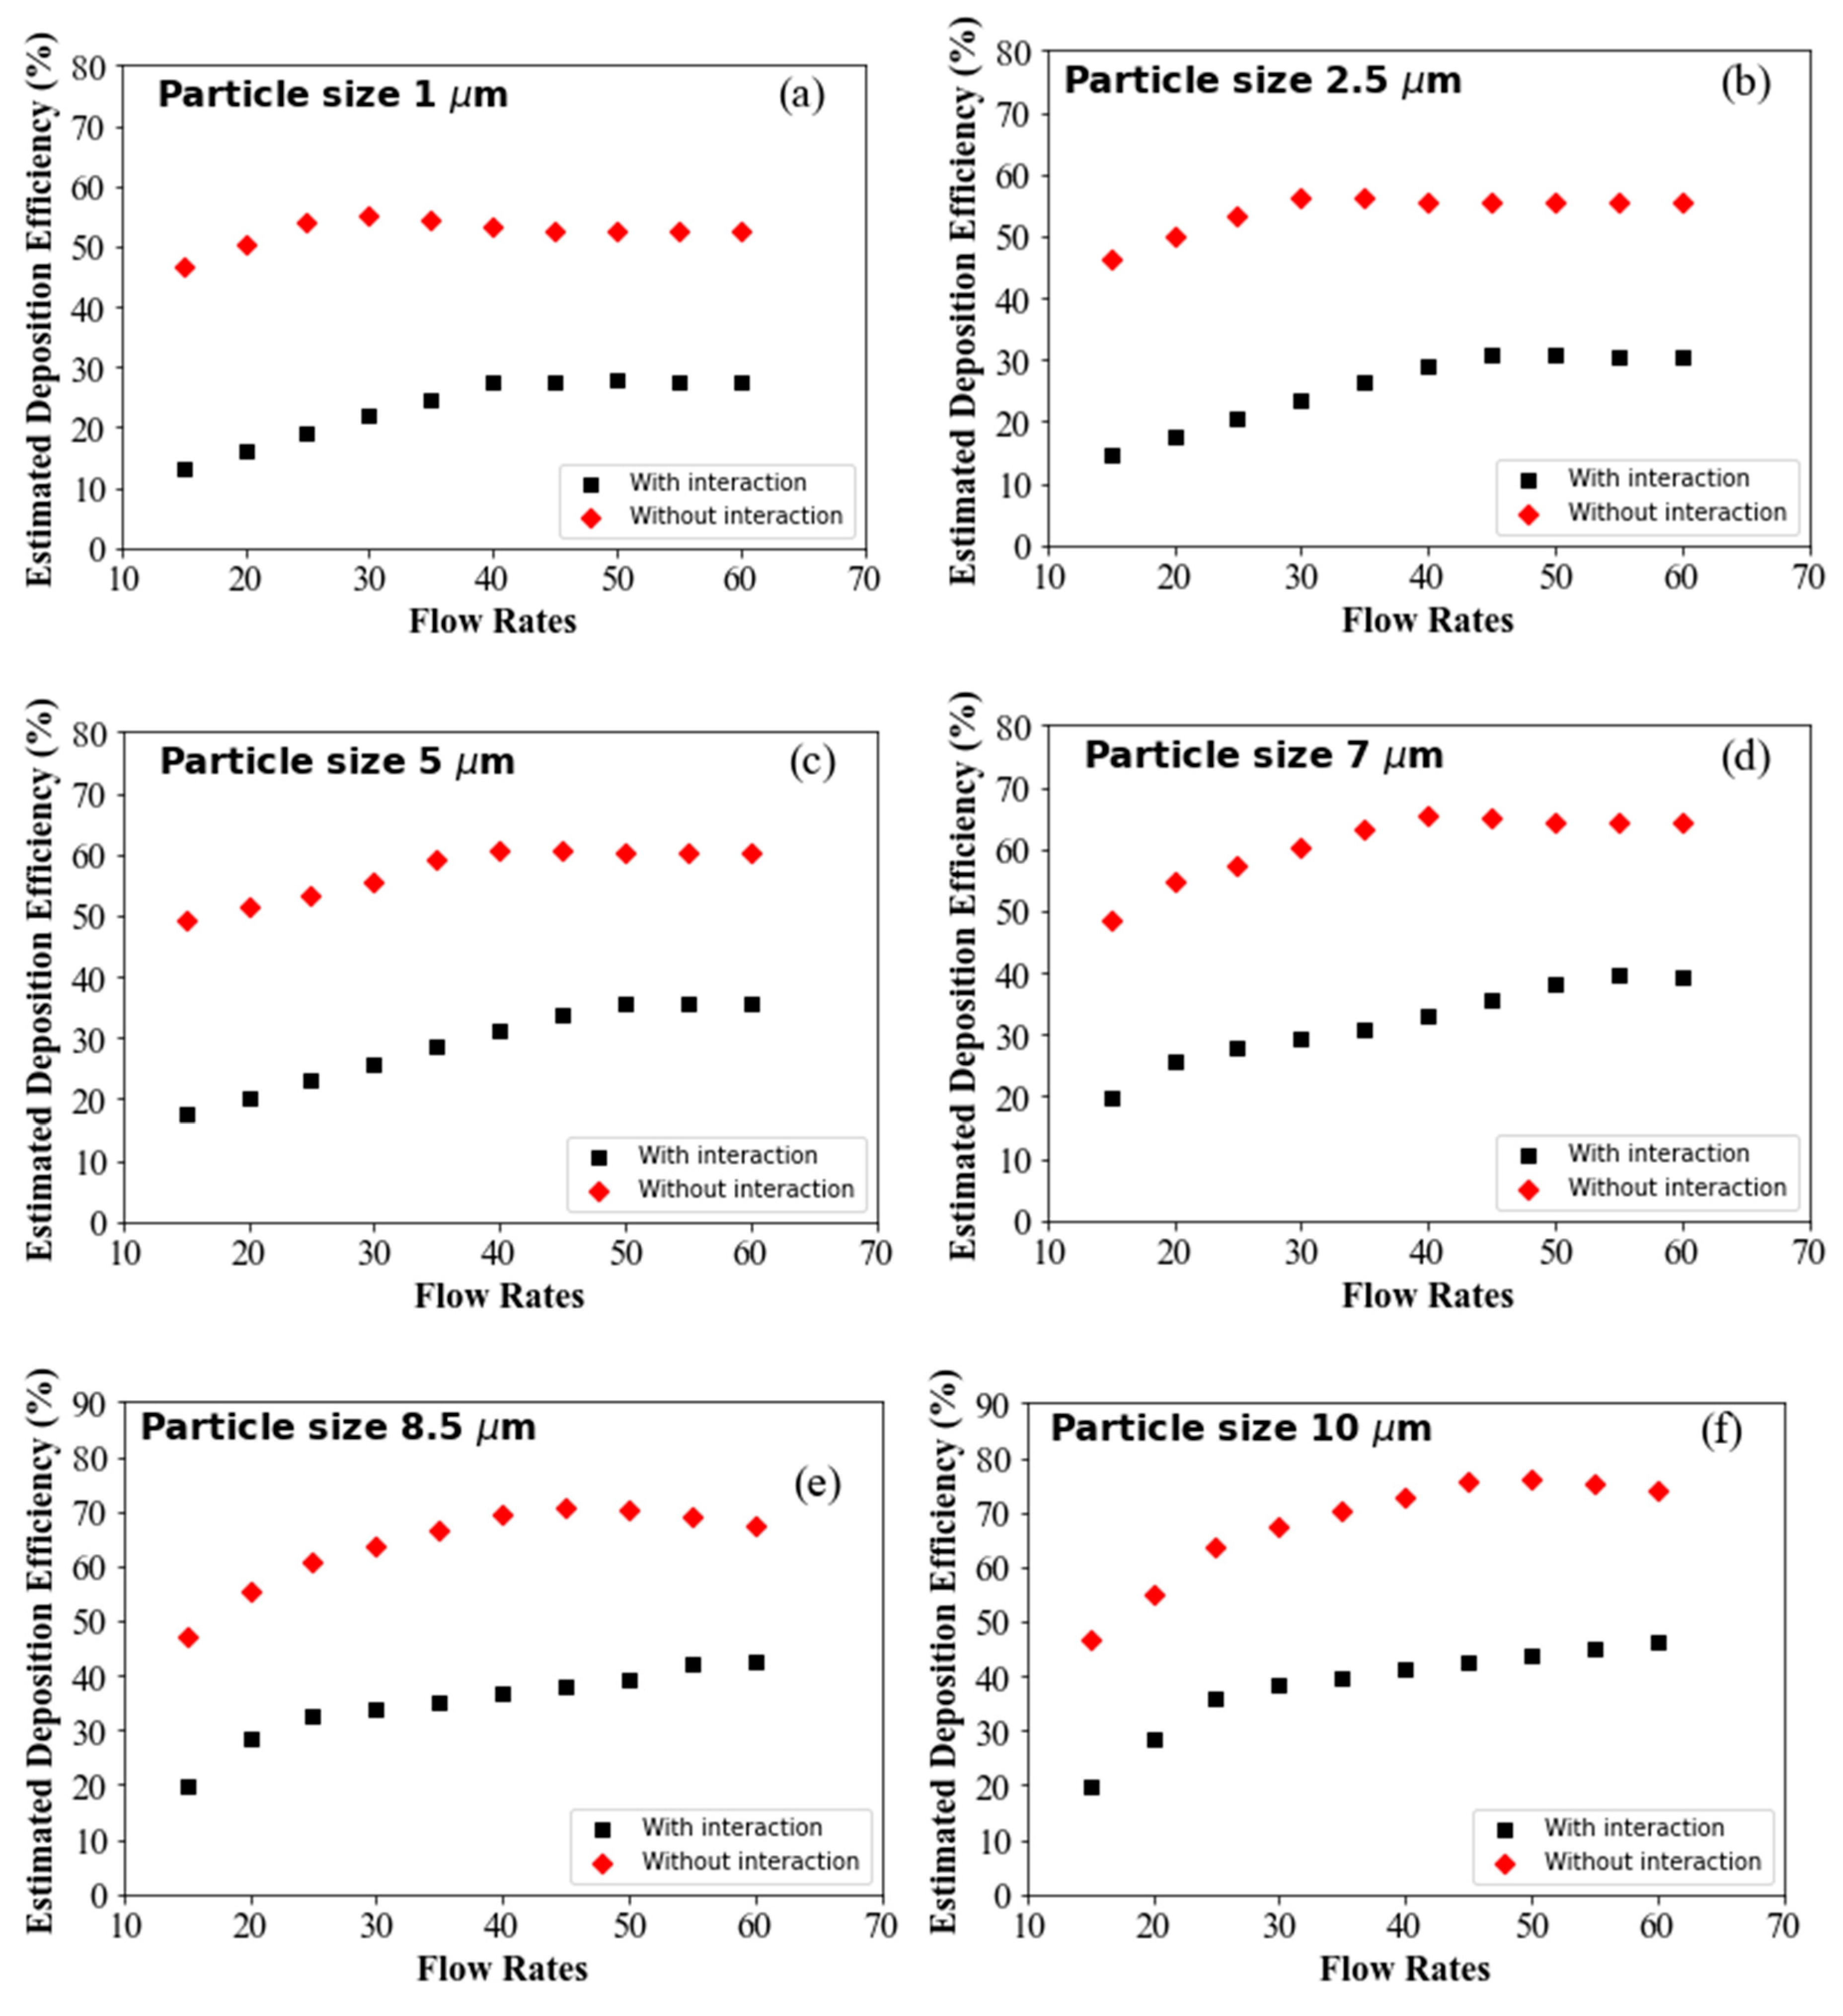
Figure 19a, the DE of 1-µm diameter particles at varying flow rates is presented. A higher overall DE is observed with interaction for 1-µm particles compared to the without interaction, regardless of flow rates. For particles of micron size, transport and deposition are affected by inertia. Larger particles at high flow rates deviate from the air streamline and collide with the airway wall, leading to trapping on its highly viscous surface. Aerosols, on the other hand, follow the air streamline at low flow rates, minimizing overall DE at the upper airways. DE with and without interaction first increases with flow rates reaches a maximum value and then decreases slightly. Fig. 19b–f shows a similar DE trend for particles of different diameters. For larger diameter particles, such as 7-µm, 8.5-µm, and 10-µm, DE is significantly higher than for smaller particles. As particle size increases, so does particle inertia, making impaction the dominant mechanism for larger particles at high flow rates, which affects overall DE.
Conclusions
The CFD-DEM model analysed the flow and particle transport in the upper airway of an idealised and realistic airway model. Different inhalation methods and interaction methods are employed to analyse the particle transport behaviour. The key findings of the CFD-DEM model are listed below;
The fluid flow field for the particle-particle interaction model is found significantly complex than the without-interaction model. The CFD model shows a uniform flow field in the upper part of the airways, while the CFD-DEM model shows the flow field is highly complex in the upper airways;
The velocity profile for CFD-DEM model at various selected positions of the first bifurcation is highly complex than the CFD model. The uniform and parabolic inhalation method also shows the variation of the flow profiles;
The higher value of the spring constant significantly influences the flow fields. With the high spring constant value, multiple vortices are generated at the upper airways;
The overall DE for the particle-particle interaction model is higher than the without-interaction model. The DE also increases with the flow rate and particle diameter irrespective of the CFD and CFD-DEM models;
Inhalation and injection method influences the DE in upper airways. For larger diameter aerosol and parabolic injection method, higher DE is observed at the upper part of the airways than uniform injection;
For a high spring constant value, the particle-particle interaction is found significantly higher at the upper part of the first bifurcation. Higher deposition concentration is observed at the upper part of the airway, and the opposite scenario is observed for the lower spring constant value.
The particle-particle interaction and DE at the upper part of the first bifurcation are found higher for the spring dashpot friction-dshf method than other interaction methods.
The study employed different interaction and injection methods and analysed the flow fields and particle transport in upper airways. The findings of this study would improve the knowledge of particle interaction in airways. The present study and a more case-specific study would improve the knowledge of the CFD-DEM and particle transport behaviour in upper airways.
Data Availability Statement
Data will be available upon request.
Acknowledgment
The authors acknowledge the iHPC support at UTS. The funding from the Australian Research Council (ARC DP210101353) is highly acknowledged.
Conflicts of Interest
No conflicts of interest associated with this study.
References
- Chen, W.; Chang, C.; Mutuku, J.K.; Lam, S.S.; Lee, W. Aerosol deposition and airflow dynamics in healthy and asthmatic human airways during inhalation. J. Hazard. Mater. 2021, 416, 125856. [Google Scholar] [CrossRef] [PubMed]
- Chen, X.; Zhong, W.; Zhou, X.; Jin, B.; Sun, B. CFD-DEM simulation of particle transport and deposition in pulmonary airway. Powder Technol. 2012, 228, 309–318. [Google Scholar] [CrossRef]
- Corda, J.V.; Shenoy, B.S.; Ahmad, K.A.; Lewis, L.; Prakashini, K.; Khader, S.A.; Zuber, M.J.C.M. Nasal airflow comparison in neonates, infant and adult nasal cavities using computational fluid dynamics. J Comput. Methods Programs Biomed. 2022, 214, 106538. [Google Scholar] [CrossRef] [PubMed]
- Cundall, P.A.; Strack, O.D.L. A discrete numerical model for granular assemblies. Geotechnique 1979, 29, 47–65. [Google Scholar] [CrossRef]
- Feng, Y.; Kleinstreuer, C. Micron-particle transport, interactions and deposition in triple lung-airway bifurcations using a novel modeling approach. J. Aerosol Sci. 2014, 71, 1–15. [Google Scholar] [CrossRef]
- Garcia, G.J.; Bailie, N.; Martins, D.A.; Kimbell, J.S. Atrophic rhinitis: A CFD study of air conditioning in the nasal cavity. J. Appl. Physiol. 2007, 103, 1082–1092. [Google Scholar] [CrossRef]
- Ghahramani, E.; Abouali, O.; Emdad, H.; Ahmadi, G. Numerical analysis of stochastic dispersion of micro-particles in turbulent flows in a realistic model of human nasal/upper airway. J. Aerosol Sci. 2014, 67, 188–206. [Google Scholar] [CrossRef]
- Gemci, T.; Ponyavin, V.; Chen, Y.; Chen, H.; Collins, R. Computational model of airflow in upper 17 generations of human respiratory tract. J. Biomech. 2008, 41, 2047–2054. [Google Scholar] [CrossRef]
- Heyder, J.; Gebhart, J.; Rudolf, G.; Schiller, C.F.; Stahlhofen, W. Deposition of particles in the human respiratory tract in the size range 0.005–15 μm. J. Aerosol Sci. 1986, 17, 811–825. [Google Scholar] [CrossRef]
- Inthavong, K.; Zhang, K.; Tu, J. Numerical modelling of nanoparticle deposition in the nasal cavity and the tracheobronchial airway. Comput. Methods Biomech. Biomed. Eng. 2011, 14, 633–643. [Google Scholar] [CrossRef]
- Islam, M.; Larpruenrudee, P.; Hossain, S.; Rahimi-Gorji, M.; Gu, Y.; Saha, S.; Paul, G. Polydisperse Aerosol Transport and Deposition in Upper Airways of Age-Specific Lung. Int. J. Environ. Res. Public Health 2021, 18, 6239. [Google Scholar] [CrossRef] [PubMed]
- Islam, M.S.; Saha, S.C.; Sauret, E.; Ong, H.; Young, P.; Gu, Y. Euler–Lagrange approach to investigate respiratory anatomical shape effects on aerosol particle transport and deposition. Toxicol. Res. Appl. 2019, 3, 2397847319894675. [Google Scholar] [CrossRef]
- Islam, M.S.; Paul, G.; Ong, H.X.; Young, P.M.; Gu, Y.T.; Saha, S.C. A review of respiratory anatomical development, air flow characterisation and particle deposition. Int. J. Environ. Res. Public Health 2020, 17, 380. [Google Scholar] [CrossRef]
- Kleinstreuer, C.; Zhang, Z.; Li, Z. Modeling airflow and particle transport/deposition in pulmonary airways. Respir. Physiol. Neurobiol. 2008, 163, 128–138. [Google Scholar] [CrossRef] [PubMed]
- Koullapis, P.; Hofemeier, P.; Sznitman, J.; Kassinos, S.C. An efficient computational fluid-particle dynamics method to predict deposition in a simplified approximation of the deep lung. Eur. J. Pharm. Sci. 2018, 113, 132–144. [Google Scholar] [CrossRef]
- Larpruenrudee, P.; Islam, M.S.; Paul, G.; Paul, A.R.; Gu, Y.T.; Saha, S.C. Model for Pharmaceutical aerosol transport through stenosis airway. In Handbook of Lung Targeted Drug Delivery Systems: Recent Trends and Clinical Evidences; CRC Press: Boca Raton, FL, USA, 2021; pp. 91–128. [Google Scholar]
- Ma, B.; Lutchen, K.R. CFD simulation of aerosol deposition in an anatomically based human large-medium airway model. Ann. Biomed. Eng. 2009, 37. [Google Scholar] [CrossRef]
- Murphy, K.R.; Eivindson, A.; Pauksens, K.; Stein, W.J.; Tellier, G.; Watts, R.; Léophonte, P.; Sharp, S.J.; Loeschel, E. Efficacy and safety of inhaled zanamivir for the treatment of influenza in patients with asthma or chronic obstructive pulmonary disease. Clin. Drug Investig. 2000, 20, 337–349. [Google Scholar] [CrossRef]
- Newman, S.P. Principles of metered-dose inhaler design. Respir. Care 2005, 50, 1177–1190. [Google Scholar]
- Rahman, M.M.; Zhao, M.; Islam, M.S.; Dong, K.; Saha, S.C. Nanoparticle transport and deposition in a heterogeneous human lung airway tree: An efficient one path model for CFD simulations. Eur. J. Pharm. Sci. 2022, 177, 106279. [Google Scholar] [CrossRef]
- Sakagami, M. In vivo, in vitro and ex vivo models to assess pulmonary absorption and disposition of inhaled therapeutics for systemic delivery. Adv. Drug Deliv. Rev. 2006, 58, 1030–1060. [Google Scholar] [CrossRef]
- Sécher, T.; Mayor, A.; Heuzé-Vourc’h, N. Inhalation of immuno-therapeutics/-prophylactics to fight respiratory tract infections: An appropriate drug at the right place! Front. Immunol. 2019, 10, 2760. [Google Scholar] [CrossRef]
- Stahlhofen, W.; Gebhart, J.; Heyder, J. Biological variability of regional deposition of aerosol particles in the human respiratory tract. Am. Ind. Hyg. Assoc. J. 1981, 42, 348–352. [Google Scholar] [CrossRef] [PubMed]
- Stahlhofen, W.; Gebhart, J.; Rudolf, G.; Scheuch, G. Measurement of lung clearance with pulses of radioactively-labelled aerosols. J. Aerosol Sci. 1986, 17, 333–336. [Google Scholar] [CrossRef]
- Telko, M.J.; Hickey, A.J. Dry powder inhaler formulation. Respir. Care 2005, 50, 1209–1227. [Google Scholar] [PubMed]
- Toshitsugu, T.; Kimiaki, W. DEM simulation of granular flow (reduction of calculation cost by reducing spring constant). J. Soc. Powder Technol. 2018, 55, 455–460. [Google Scholar] [CrossRef]
- Van Ertbruggen, C.; Hirsch, C.; Paiva, M. Anatomically based three-dimensional model of airways to simulate flow and particle transport using computational fluid dynamics. J. Appl. Physiol. (1985) 2005, 98, 970–980. [Google Scholar] [CrossRef]
- Vulović, A.; Šušteršič, T.; Cvijić, S.; Ibrić, S.; Filipović, N. Coupled in silico platform: Computational fluid dynamics (CFD) and physiologically-based pharmacokinetic (PBPK) modelling. Eur. J. Pharm. Sci. 2018, 113, 171–184. [Google Scholar] [CrossRef]
- Weibel, E.R. Morphometry of the Human Lung; Springer Verlag and Academic Press: New York, NY, USA, 1963. [Google Scholar]
- Zhu, H.P.; Zhou, Z.Y.; Yang, R.Y.; Yu, A.B. Discrete particle simulation of particulate systems: Theoretical developments. Chem. Eng. Sci. 2007, 62, 3378–3396. [Google Scholar] [CrossRef]
Figure 1.
Geometrical models of central airway. (a) idealised model and (b) CT-based model.
Figure 1.
Geometrical models of central airway. (a) idealised model and (b) CT-based model.
Figure 2.
Unstructured mesh of central airway. (a) idealised model and (b) CT-based model.
Figure 2.
Unstructured mesh of central airway. (a) idealised model and (b) CT-based model.
Figure 3.
Deposition efficiency (DE) comparison at extrathoracic airway in terms of inertial parameter with available literature (Heyder et al., 1986; Stahlhofen et al., 1981; Stahlhofen et al., 1986).
Figure 3.
Deposition efficiency (DE) comparison at extrathoracic airway in terms of inertial parameter with available literature (Heyder et al., 1986; Stahlhofen et al., 1981; Stahlhofen et al., 1986).
Figure 4.
Deposition efficiency (DE) at extrathoracic airway in terms of impaction parameter with available literature (Corda et al., 2022; Inthavong et al., 2011).
Figure 4.
Deposition efficiency (DE) at extrathoracic airway in terms of impaction parameter with available literature (Corda et al., 2022; Inthavong et al., 2011).
Figure 5.
Particle-particle interaction and soft sphere approach.
Figure 5.
Particle-particle interaction and soft sphere approach.
Figure 6.
Velocity contour at X-Y Plane for 60 lpm flow rate between non-realistic model and realistic model.
Figure 6.
Velocity contour at X-Y Plane for 60 lpm flow rate between non-realistic model and realistic model.
Figure 7.
Velocity streamline for 60 lpm flow rate between non-realistic model and realistic model.
Figure 7.
Velocity streamline for 60 lpm flow rate between non-realistic model and realistic model.
Figure 8.
Velocity contour at three selected locations for different injection methods with 60 lpm flow rate.
Figure 8.
Velocity contour at three selected locations for different injection methods with 60 lpm flow rate.
Figure 9.
Velocity contour at three selected locations for different spring constants with 60 lpm flow rate.
Figure 9.
Velocity contour at three selected locations for different spring constants with 60 lpm flow rate.
Figure 10.
Velocity profile at three selected locations for different spring constants with 60 lpm flow rate. (a) selected locations of three lines, (b) velocity profile at line 1, (c) velocity profile at line 2, and (d) velocity profile at line 3.
Figure 10.
Velocity profile at three selected locations for different spring constants with 60 lpm flow rate. (a) selected locations of three lines, (b) velocity profile at line 1, (c) velocity profile at line 2, and (d) velocity profile at line 3.
Figure 11.
Pressure contour at X-Y Plane for 60 lpm flow rate between non-realistic model and realistic model.
Figure 11.
Pressure contour at X-Y Plane for 60 lpm flow rate between non-realistic model and realistic model.
Figure 12.
Wall shear stress contour at X-Y Plane for 60 lpm flow rate between non-realistic model and realistic model.
Figure 12.
Wall shear stress contour at X-Y Plane for 60 lpm flow rate between non-realistic model and realistic model.
Figure 13.
Particle DE between particle interaction and without interaction for various flow rates. (a) particle size at 1 µm, (b) particle size at 5 µm, and (c) particle size at 10 µm.
Figure 13.
Particle DE between particle interaction and without interaction for various flow rates. (a) particle size at 1 µm, (b) particle size at 5 µm, and (c) particle size at 10 µm.
Figure 14.
Particle deposition scenario for different injection methods for various flow rates with particle size at 10 µm.
Figure 14.
Particle deposition scenario for different injection methods for various flow rates with particle size at 10 µm.
Figure 15.
Particle deposition scenario between uniform injection and parabolic injection with spring constant at k-800.
Figure 15.
Particle deposition scenario between uniform injection and parabolic injection with spring constant at k-800.
Figure 16.
Particle deposition concentration and deposition scenario for different spring constants at 15 lpm flow rate. (a) particle deposition concentration and (b) particle deposition scenario.
Figure 16.
Particle deposition concentration and deposition scenario for different spring constants at 15 lpm flow rate. (a) particle deposition concentration and (b) particle deposition scenario.
Figure 17.
Particle deposition concentration and deposition scenario for different interaction methods at 15 lpm flow rate. (a) particle deposition concentration and (b) particle deposition scenario.
Figure 17.
Particle deposition concentration and deposition scenario for different interaction methods at 15 lpm flow rate. (a) particle deposition concentration and (b) particle deposition scenario.
Figure 18.
Scatter diagrams of estimated and measured deposition efficiency with and without interaction using ML regression models.
Figure 18.
Scatter diagrams of estimated and measured deposition efficiency with and without interaction using ML regression models.
Figure 19.
DE prediction using ML prediction model for different flow rates, (a) 1-µm particle, (b) 2.5-µm particle, (c) 5-µm particle, (d) 7-µm particle, (e) 8.5-µm particle, and (f) 10-µm particle.
Figure 19.
DE prediction using ML prediction model for different flow rates, (a) 1-µm particle, (b) 2.5-µm particle, (c) 5-µm particle, (d) 7-µm particle, (e) 8.5-µm particle, and (f) 10-µm particle.
Table 1.
DEM and DPM properties used in the study.
Table 1.
DEM and DPM properties used in the study.
| Parameter |
Values |
| Spring-dashpot (n/m) |
100–4000 |
| Spring-dashpot: η |
0.9 |
| Friction-dshf: µstick
|
0.5 |
| Friction-dshf: µglide
|
0.2 |
| Friction-dshf: µlimit
|
0.1 |
| Friction-dshf: vglide (m/s) |
1 |
| Friction-dshf: vlimit (m/s) |
10 |
| Friction-dshf: slopelimit (m/s) |
100 |
| Particle time step size (s) |
0.0001 |
| DEM Edge scale factor |
1.5 |
| Particle maximum velocity (m/s) |
100 |
| Maximum number of steps |
50,000,000 |
| Step length factor |
5 |
Table 2.
Properties of air and aerosol.
Table 2.
Properties of air and aerosol.
| Properties |
Air |
Aerosol |
| Density (kg/m3) |
1.225 |
1100 |
| Viscosity (kg/m-s) |
1.7893 × 10⁻⁵
|
- |
|
Disclaimer/Publisher’s Note: The statements, opinions and data contained in all publications are solely those of the individual author(s) and contributor(s) and not of MDPI and/or the editor(s). MDPI and/or the editor(s) disclaim responsibility for any injury to people or property resulting from any ideas, methods, instructions or products referred to in the content. |
© 2023 by the authors. Licensee MDPI, Basel, Switzerland. This article is an open access article distributed under the terms and conditions of the Creative Commons Attribution (CC BY) license (http://creativecommons.org/licenses/by/4.0/).
