Introduction
The words "shore" and "coast" are mostly used synonymously, but they are different concepts. Hill (2013) used two simple definitions to differentiate between them. He defined the shore as the land bordering the sea, and the coast as the side of the land next to the sea (
Figure 1). The coastal zone is an important place in the lives of humankind, and this importance cannot be seen more clearly than in night-light satellite images. These space-images show how humans tend to live next to the sea, or in places where the sea is easily accessible (Albanai, 2021a, 2021d). Nowadays, more than half of the earth’s population lives in what can be classed as coastal areas (McGranahan et al., 2007; Hill, 2013). Just a short look back in time, looking at the history of humankind compared to the earth’s age, we can notice that the beginnings of human stability and settlement were near the banks of rivers and coasts. All the features of coastal areas have made it crucial for humanity.
Geographers and cartographers have long since been involved in coastal studies; many have been active in trying to delineate the shoreline. This process is not as easy as it seems. The sea level varies every day according to the tidal forces. Therefore, it is necessary first to define the shoreline for mapping. Scientists differ in their methods for determining the shoreline, but geographers tend to rely on the high tide line (Lipakis et al., 2008). In the United States, there is a law that states that the shoreline is the line of the highest water level (Gens, 2010). There is also the term coastline, which refers to the line where the water and land touch (Gens, 2010). However, the term shoreline is more specific; it is often used to determine the borderline of water separating from land.
Methods used to map the shoreline have evolved with the development of geography. Ancient studies relied on the mapping of the shoreline by field surveys, which are often limited in scope. As approaches have developed, topographic maps and aerial photographs have emerged. Aerial photography can contain large areas, and cover much of what the topographic maps contain. The satellite data was the latest source used in the mapping of the shoreline; the spatial data provided by satellite imagery has facilitated a great leap in shoreline mapping, especially in studies related to shoreline change and coastal erosion. These satellites provide constant coverage of the earth’s surface, which makes them a reliable source for this type of study. Satellite images have also increased the accuracy of topographic maps. The accuracy of satellite images for shoreline mapping varies according to their spectral and spatial resolution. The spectral resolution is the ability of a sensor to define fine wavelength intervals, or the ability of a sensor to resolve the energy received in a spectral bandwidth to characterize different constituents of Earth’s surface (Gibson, 2000). The spatial resolution is a measure of the area or size of the smallest dimension on the Earth’s surface over which an independent measurement can be made by the sensor (Gibson, 2000). In more simple words, it is the size of the image pixels. Nowadays, all these methods are still used in mapping the shoreline because of its effectiveness and importance; most studies rely on the integration of information from these sources.
Many methods have been applied to delineate the shoreline using satellite images. In general, two techniques can be used. One of them is to delineate the shoreline automatically using quantitative methods. This depends on the spectral behaviour of water and land. For example, Near Infrared Radiation is extremely useful for separating land from water, because it is reflected strongly by land, and absorbed strongly by water. Thus, it is effective as a tool to delineate the shoreline (Frazier et al., 2000; Lohani & Mason, 1999). Studies came later, proving that using more than one band increases the accuracy of shoreline mapping (Ryu et al., 2002); this is a technique known as band ratios, which can enhance the spectral differences between bands. Dividing one spectral band by another produces an image that provides relative band intensities. The image thus enhances the spectral differences between bands (Harris Geospatial product, 2018). Several studies have used this method, and one of the most important indicators used in mapping the shoreline is the Normalized Difference Water Index, or NDWI (McFeeters, 2013; Rokni et al., 2014; Al-Mutari, 2017).
Another method is digitizing the shoreline manually using qualitative methods. This technique depends on visual analysis of the sources, whether they be satellite image, aerial photography or topographic map. It also shows great results in delineating the shoreline (Ford, 2013; Meyer et al., 2016). Studies have later proven that using both quantitative and qualitative methods can increase the accuracy of shoreline delineation (Aedla et al., 2015; Cenci et al., 2017). Overall, the choice of shoreline mapping method depends on the type of the shoreline, the available sources and the purpose of the study.
This study aims to map the shoreline of Failaka Island in Kuwait using open source data. Data from Landsat 8 and Aster satellites were used. Many quantitative and qualitative methods have been applied to delineate most accurately the shoreline. The study also aims to verify the mapped shorelines using open source high-resolution images.
Study Area
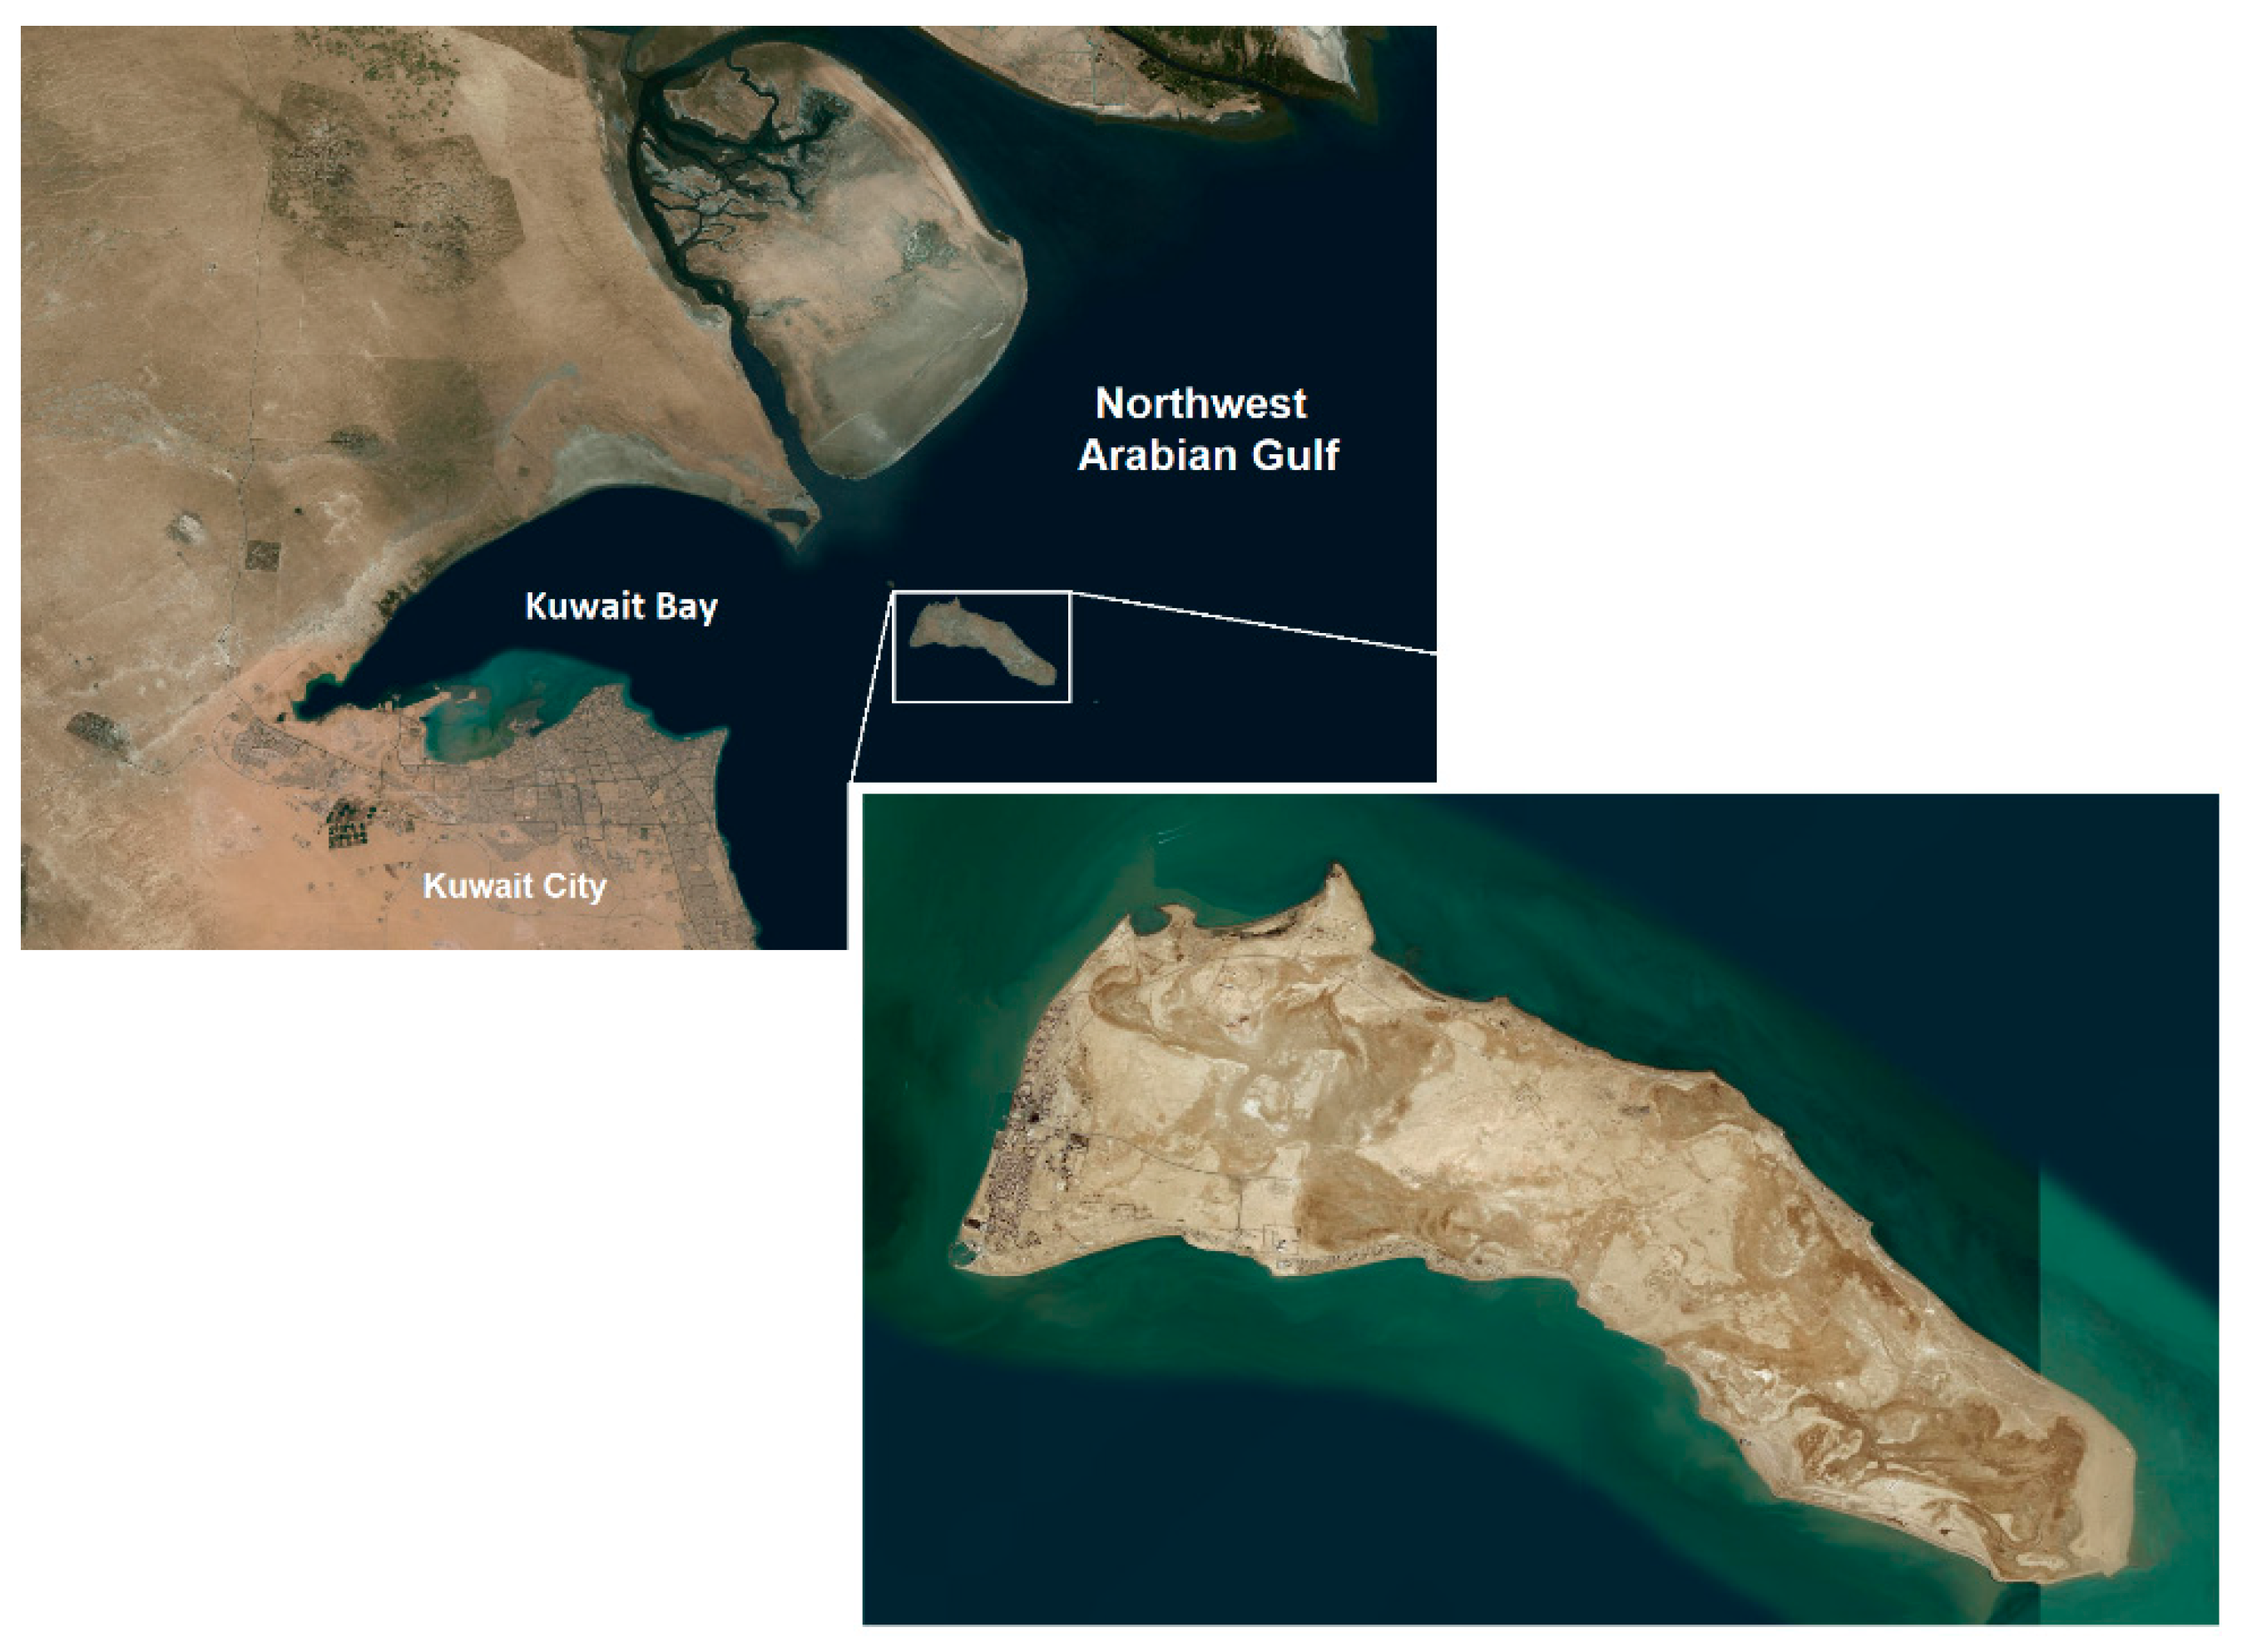
Failaka Island (
Figure 2) is located in the state of Kuwait, a country located in the north-western reaches of the Arabian/Persian Gulf (Albanai, 2021e; Hassan et al., 2021), and north-eastern side of the Arabian Pennunsela (Albanai, 2021; Albanai et al., 2022; Albanai, Karam, et al., 2022). The island is located on the entrance of Kuwait Bay, about 20
from the mainland of Kuwait (Albanai, 2020). The depth range around the island does not exceed 12 meters below sea level (Albanai, 2021c, 2021b; Albanai et al., 2022). Failaka has a total area of around 46
, and a shoreline of approximately 38
in length (Albanai, 2019). The Kuwaiti Government is planning to develop the island, as it is mostly free of people now. The island was habitable before the Gulf War in 1990 (it accommodated around 3,500 civilians). The people left behind them a small destroyed urban area on the western side of the island (Al-Sarawi et al., 1996). The island is considered a flat land with some sabkha and few small spread hills. The highest areas on Failaka may reach 9 meters above sea level. Tides and waves are the most physical forces that effect Failaka coastal zone. Additionally, anthropogenic forces can be seen clearly in the urban area and beaches (Al-Sarawi et al., 1996). Based on Al-Sarawi et al.'s (1996) study, many different geomorphologic features can be seen on the island such as sabkha, wetland, sandy beach and hard rocks among others.
Material & Methods
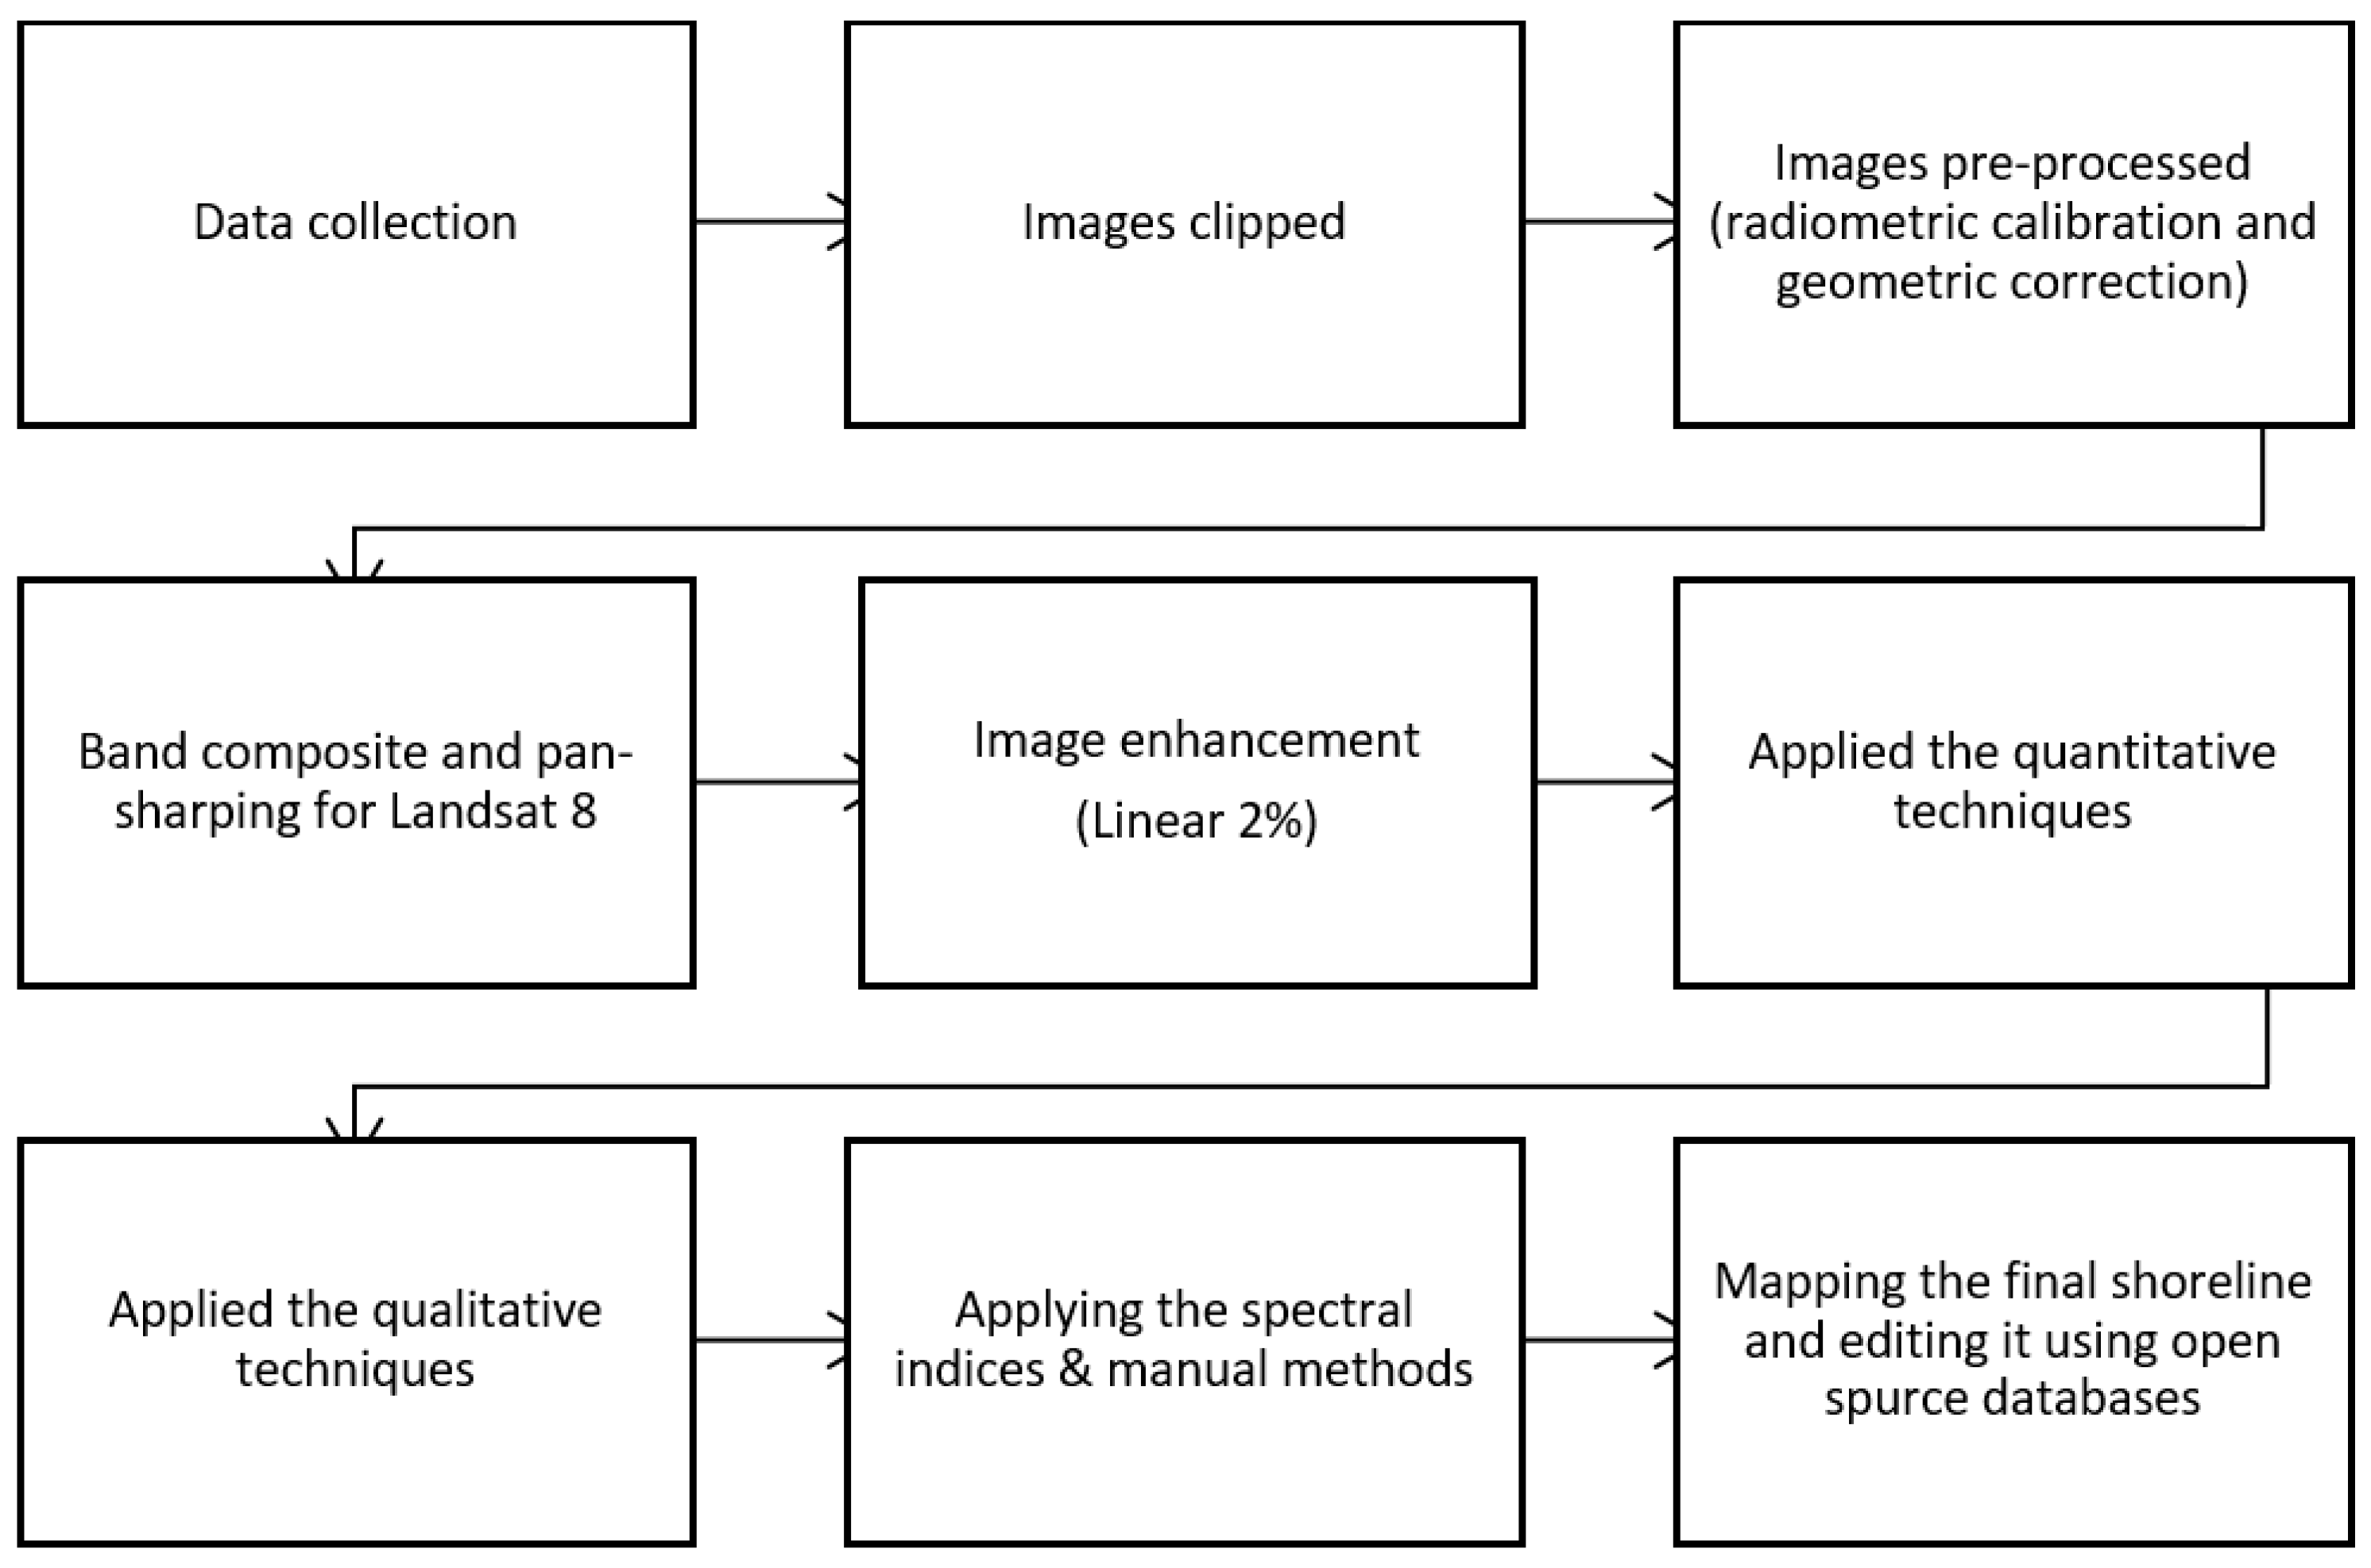
Figure 3 shows a summary of the overall methodology. Multiple sources have been used and techniques applied to find the most accurate estimation of the shoreline of Failaka Island. The study depended on the satellite images as the main source for mapping the shoreline. Landsat 8 image, taken at high tide on 25 August 2014, was used (
Table 1). An Advanced Spaceborne Thermal Emission and Reflection Radiometer (Aster) Image taken at high tide on 17 July 2012 was also used (
Table 2). Both images were freely downloaded from the United States Geological Survey site (USGS, 2018a).
For pre-processing, the required spectral bands of both images have extracted. Then, the images were calibrated radiometrically using ENVI 5.2. The radiometric calibration process changes the pixels values from a digital number to the radiance. This process helps us to detect the spectral signature of the land cover, and is necessary to class and analyse the earth’s features (Albanai, 2019). Both Aster and Landsat 8 images were projected on the local coordinate system WGS_1984_UTM_Zone_39N.
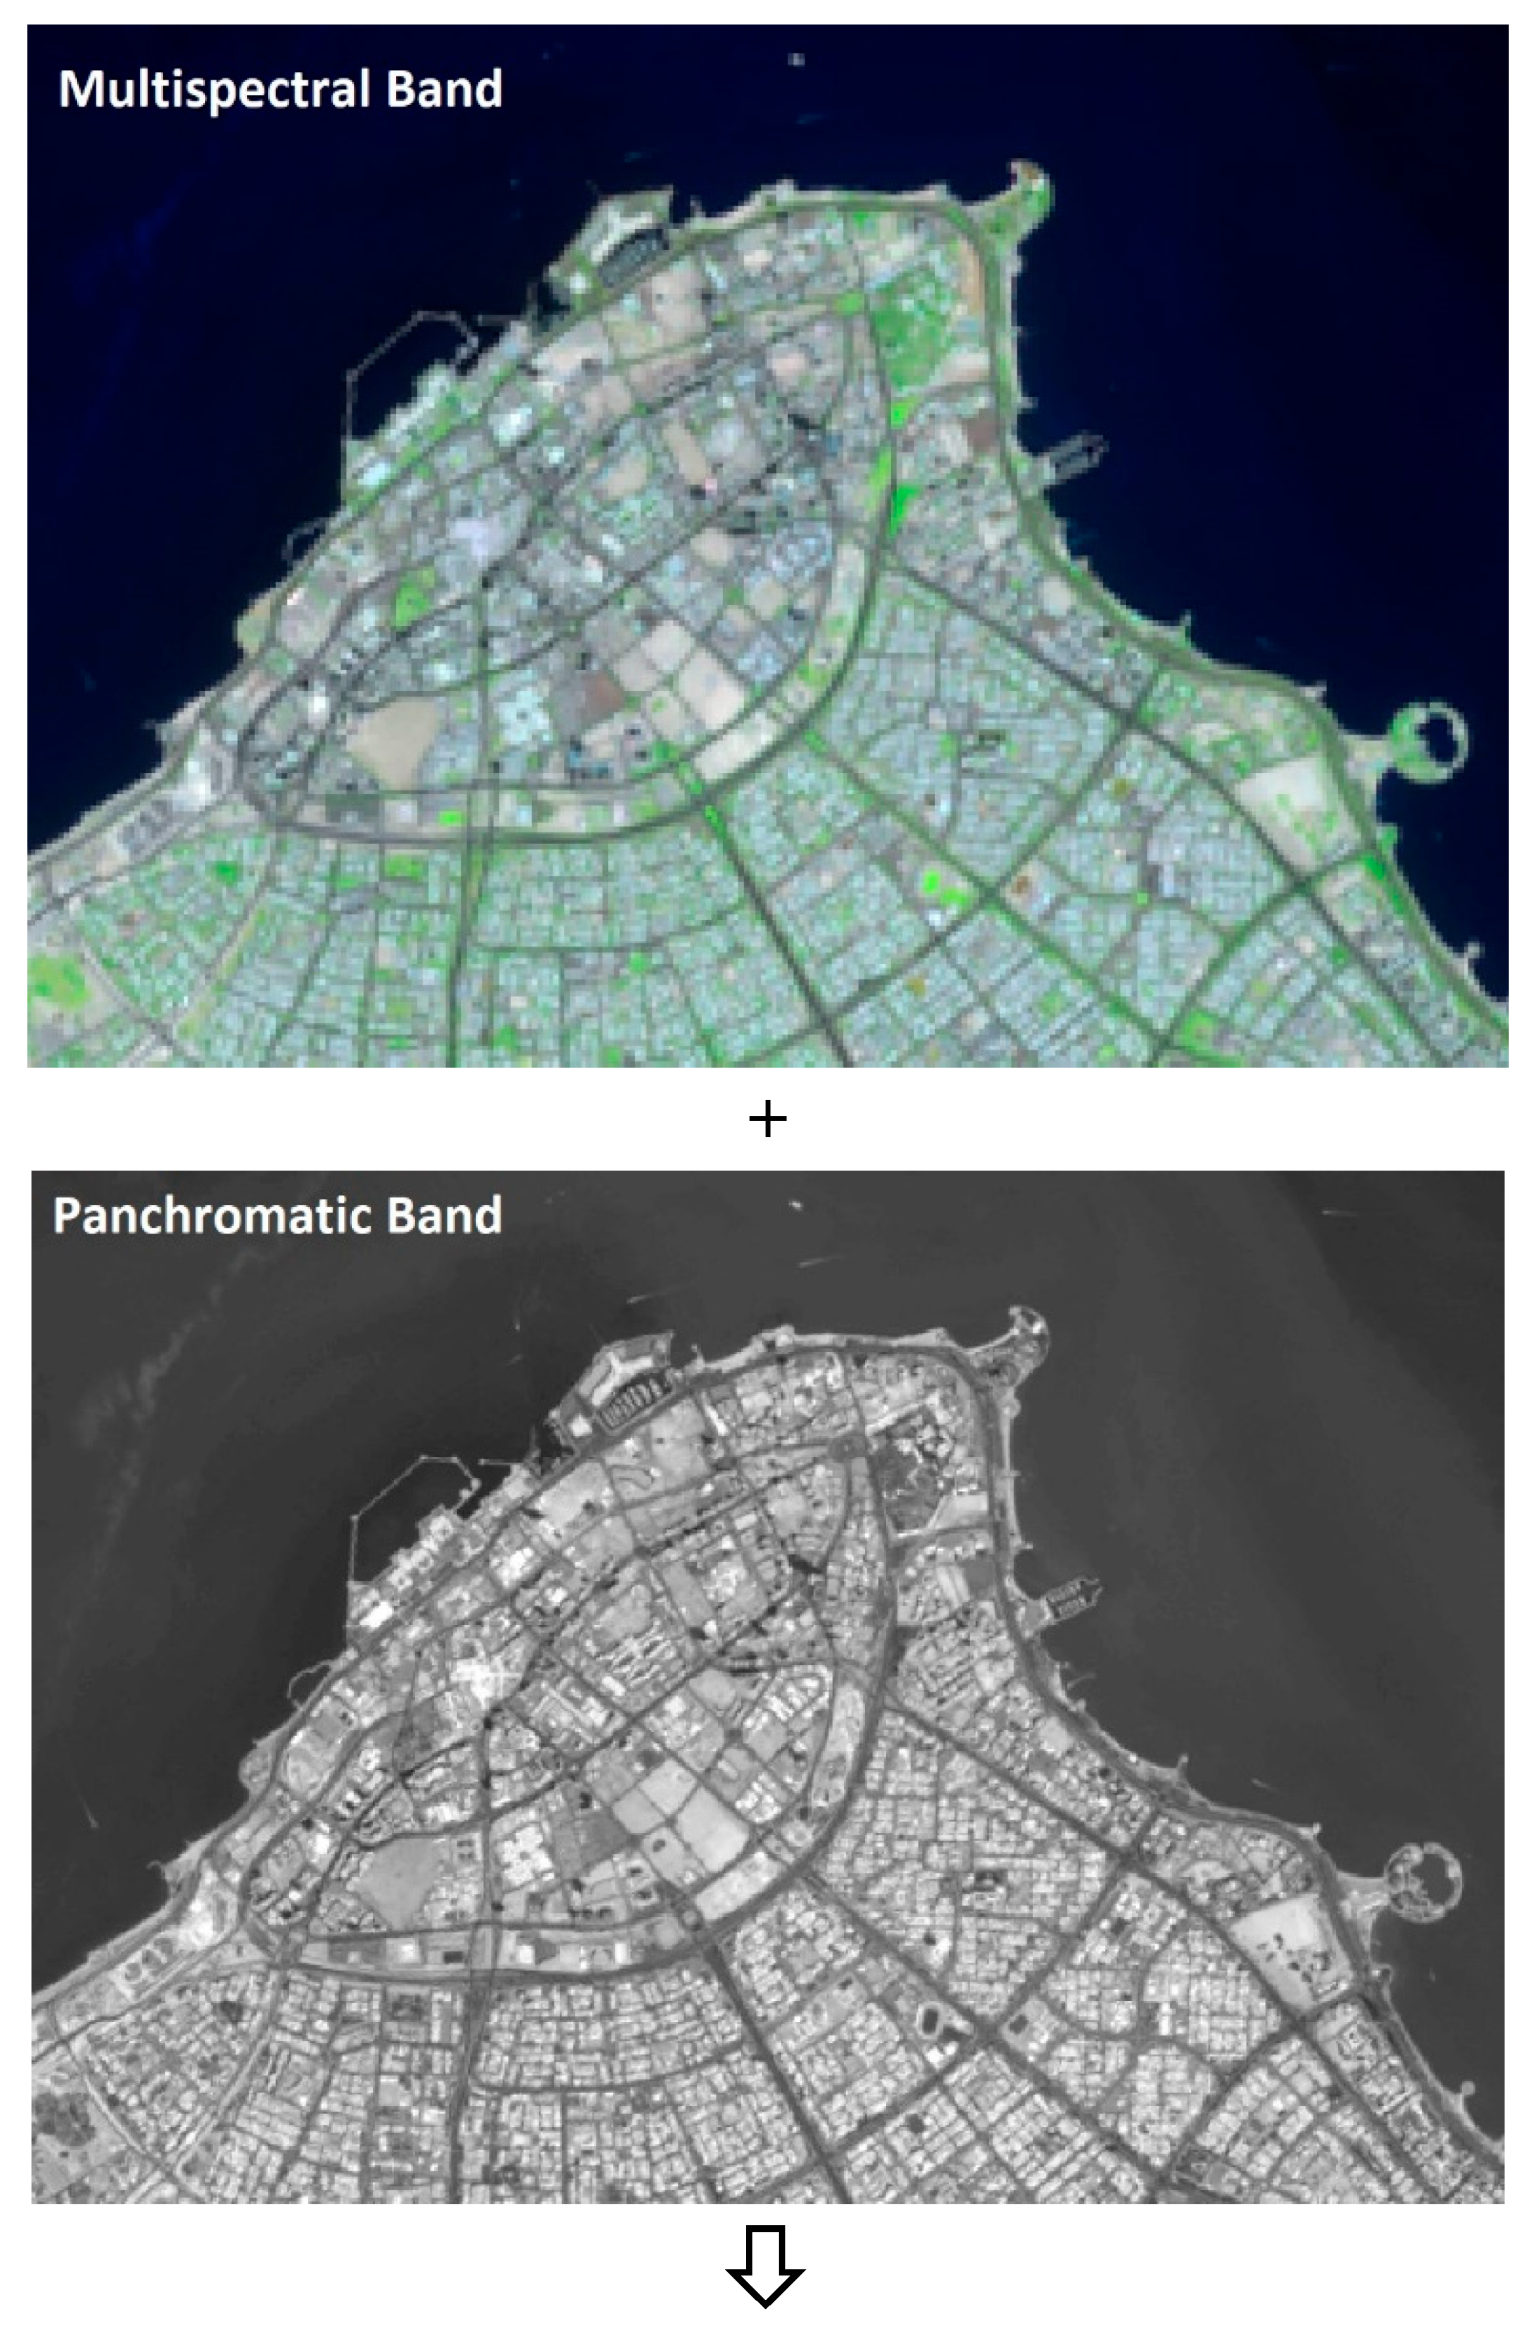
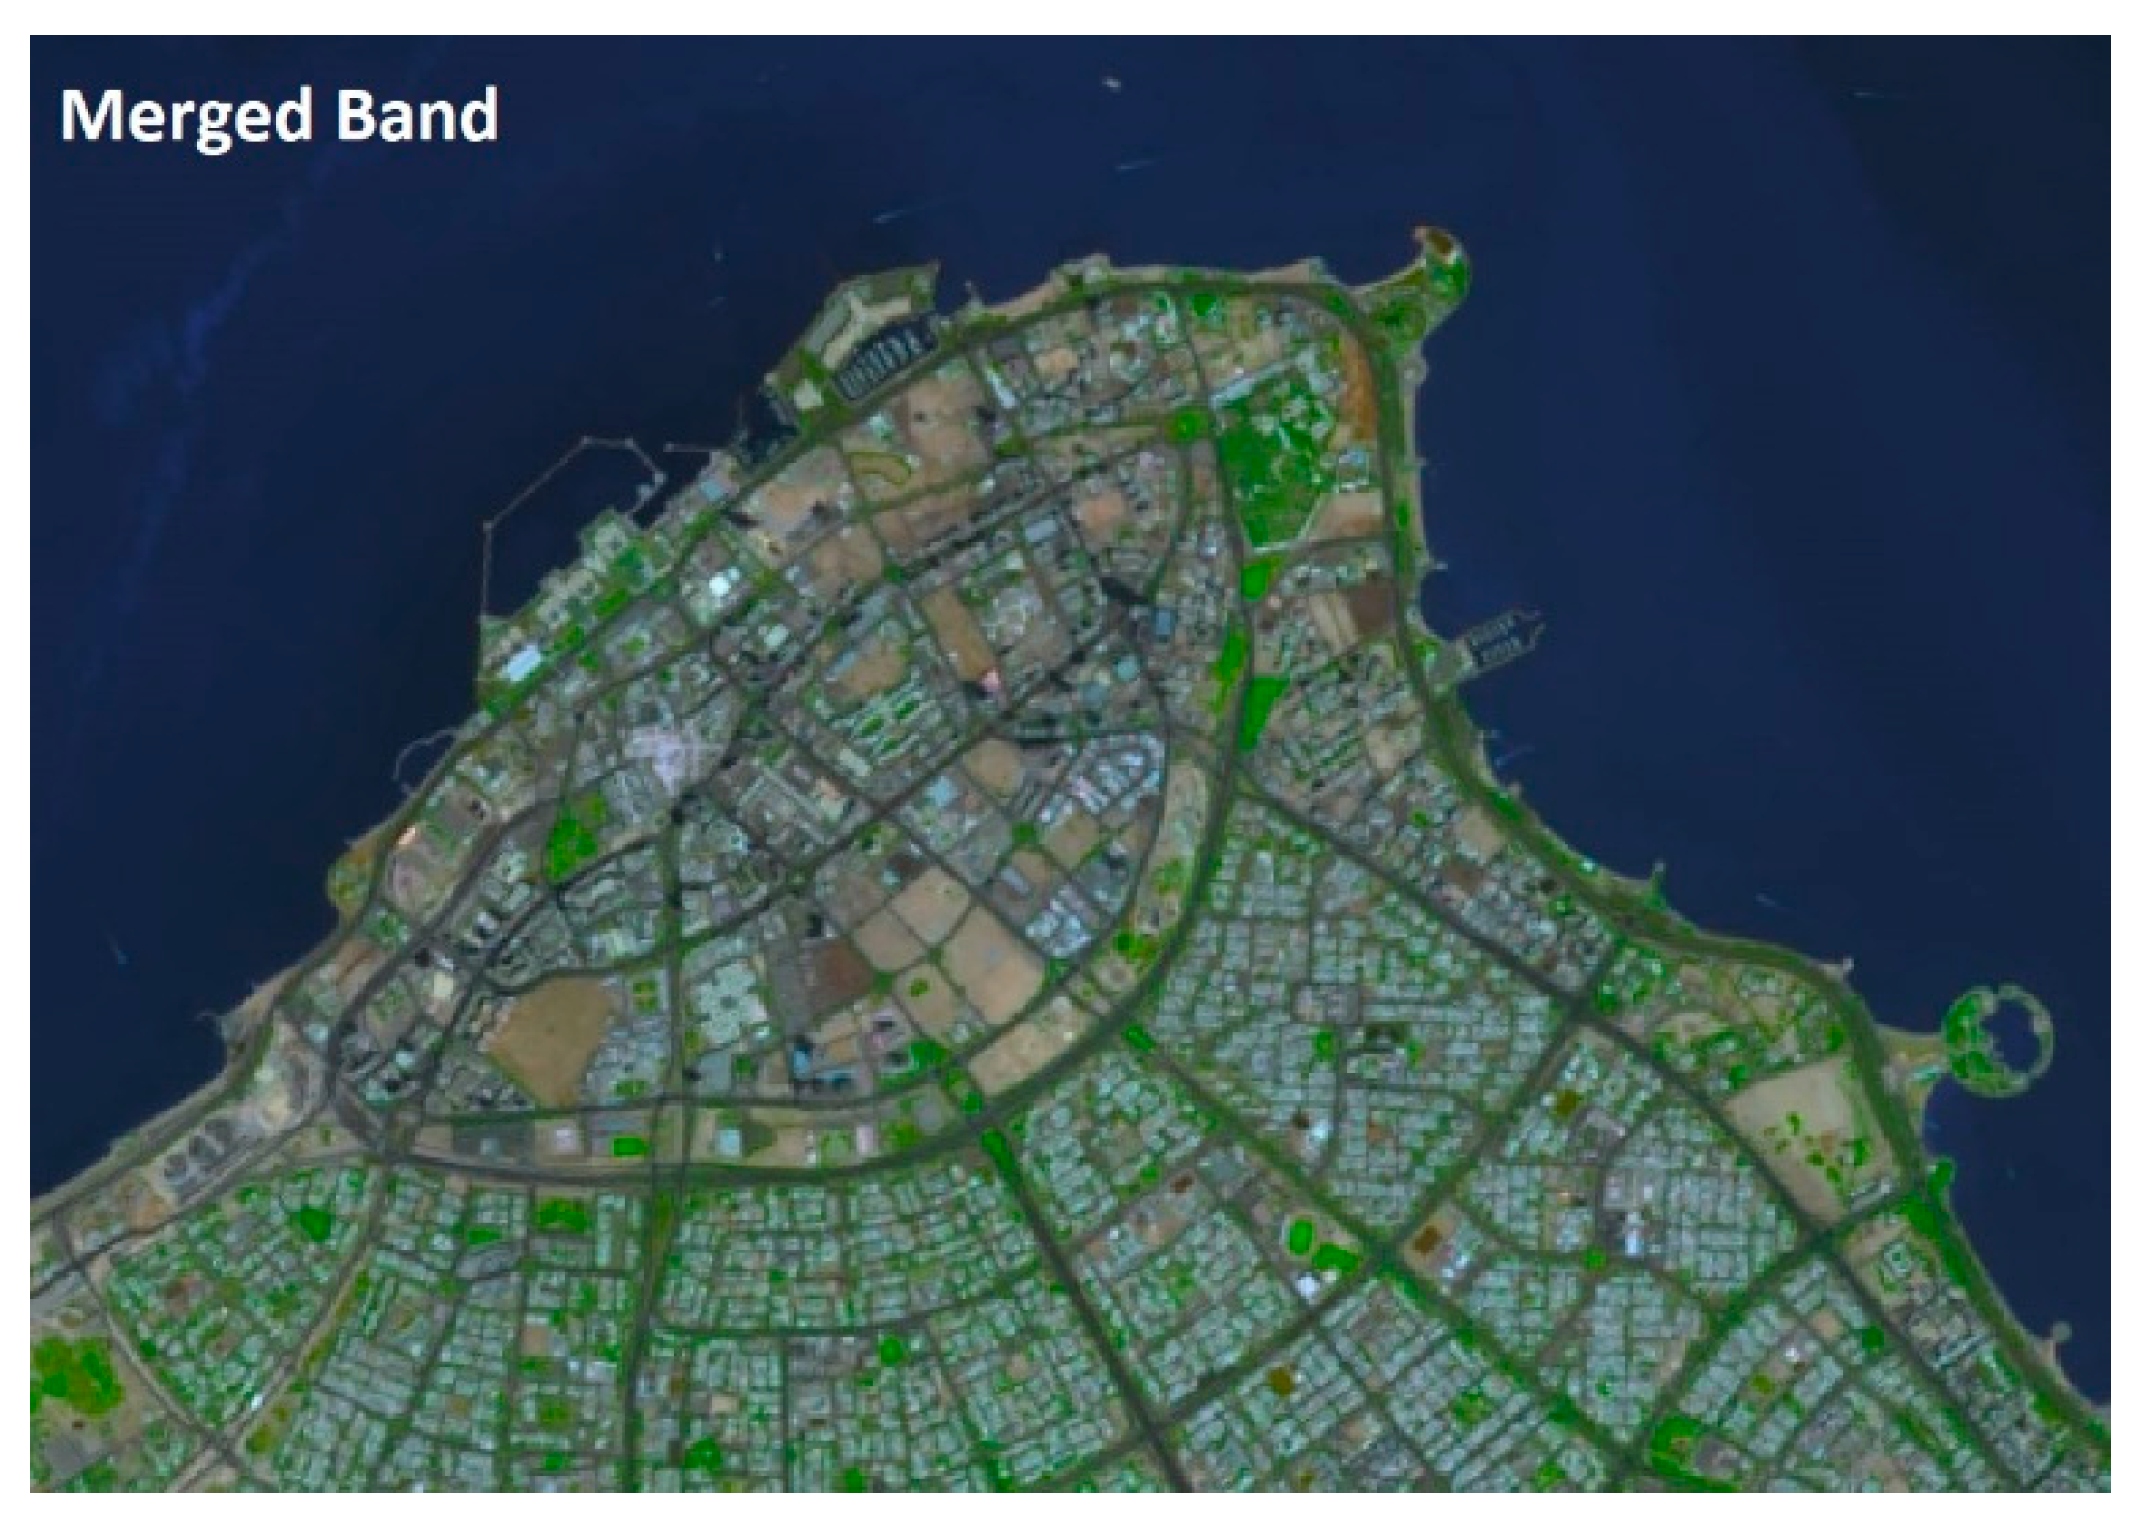
For the Landsat 8 Image, the pan sharping technique was applied using ArcGIS 10.4.1 (
Figure 4). The multispectral bands of Landsat 8 have a low spatial resolution equal to 30 meters, while the panchromatic band has 15 meters as a spatial resolution. This technique allows us to merge the bands to benefit from the high spatial resolution of the panchromatic band and also of the multispectral bands. The final result is merged bands with 15 meters spatial resolution, where the spectral range covers the visual and NIR bands. The band composite method was applied before the pan sharping. Additionally, the images have been enhanced using the linear properties on ENVI 5.2 for visual purposes. The satellite images need to be enhanced to avoid the weather conditions and the differences on the image colours and lights that may affect the analysis process.
Different methods have been applied to extract the most accurate shoreline. Overall, they can be divided into qualitative, quantitative and integrated methods.
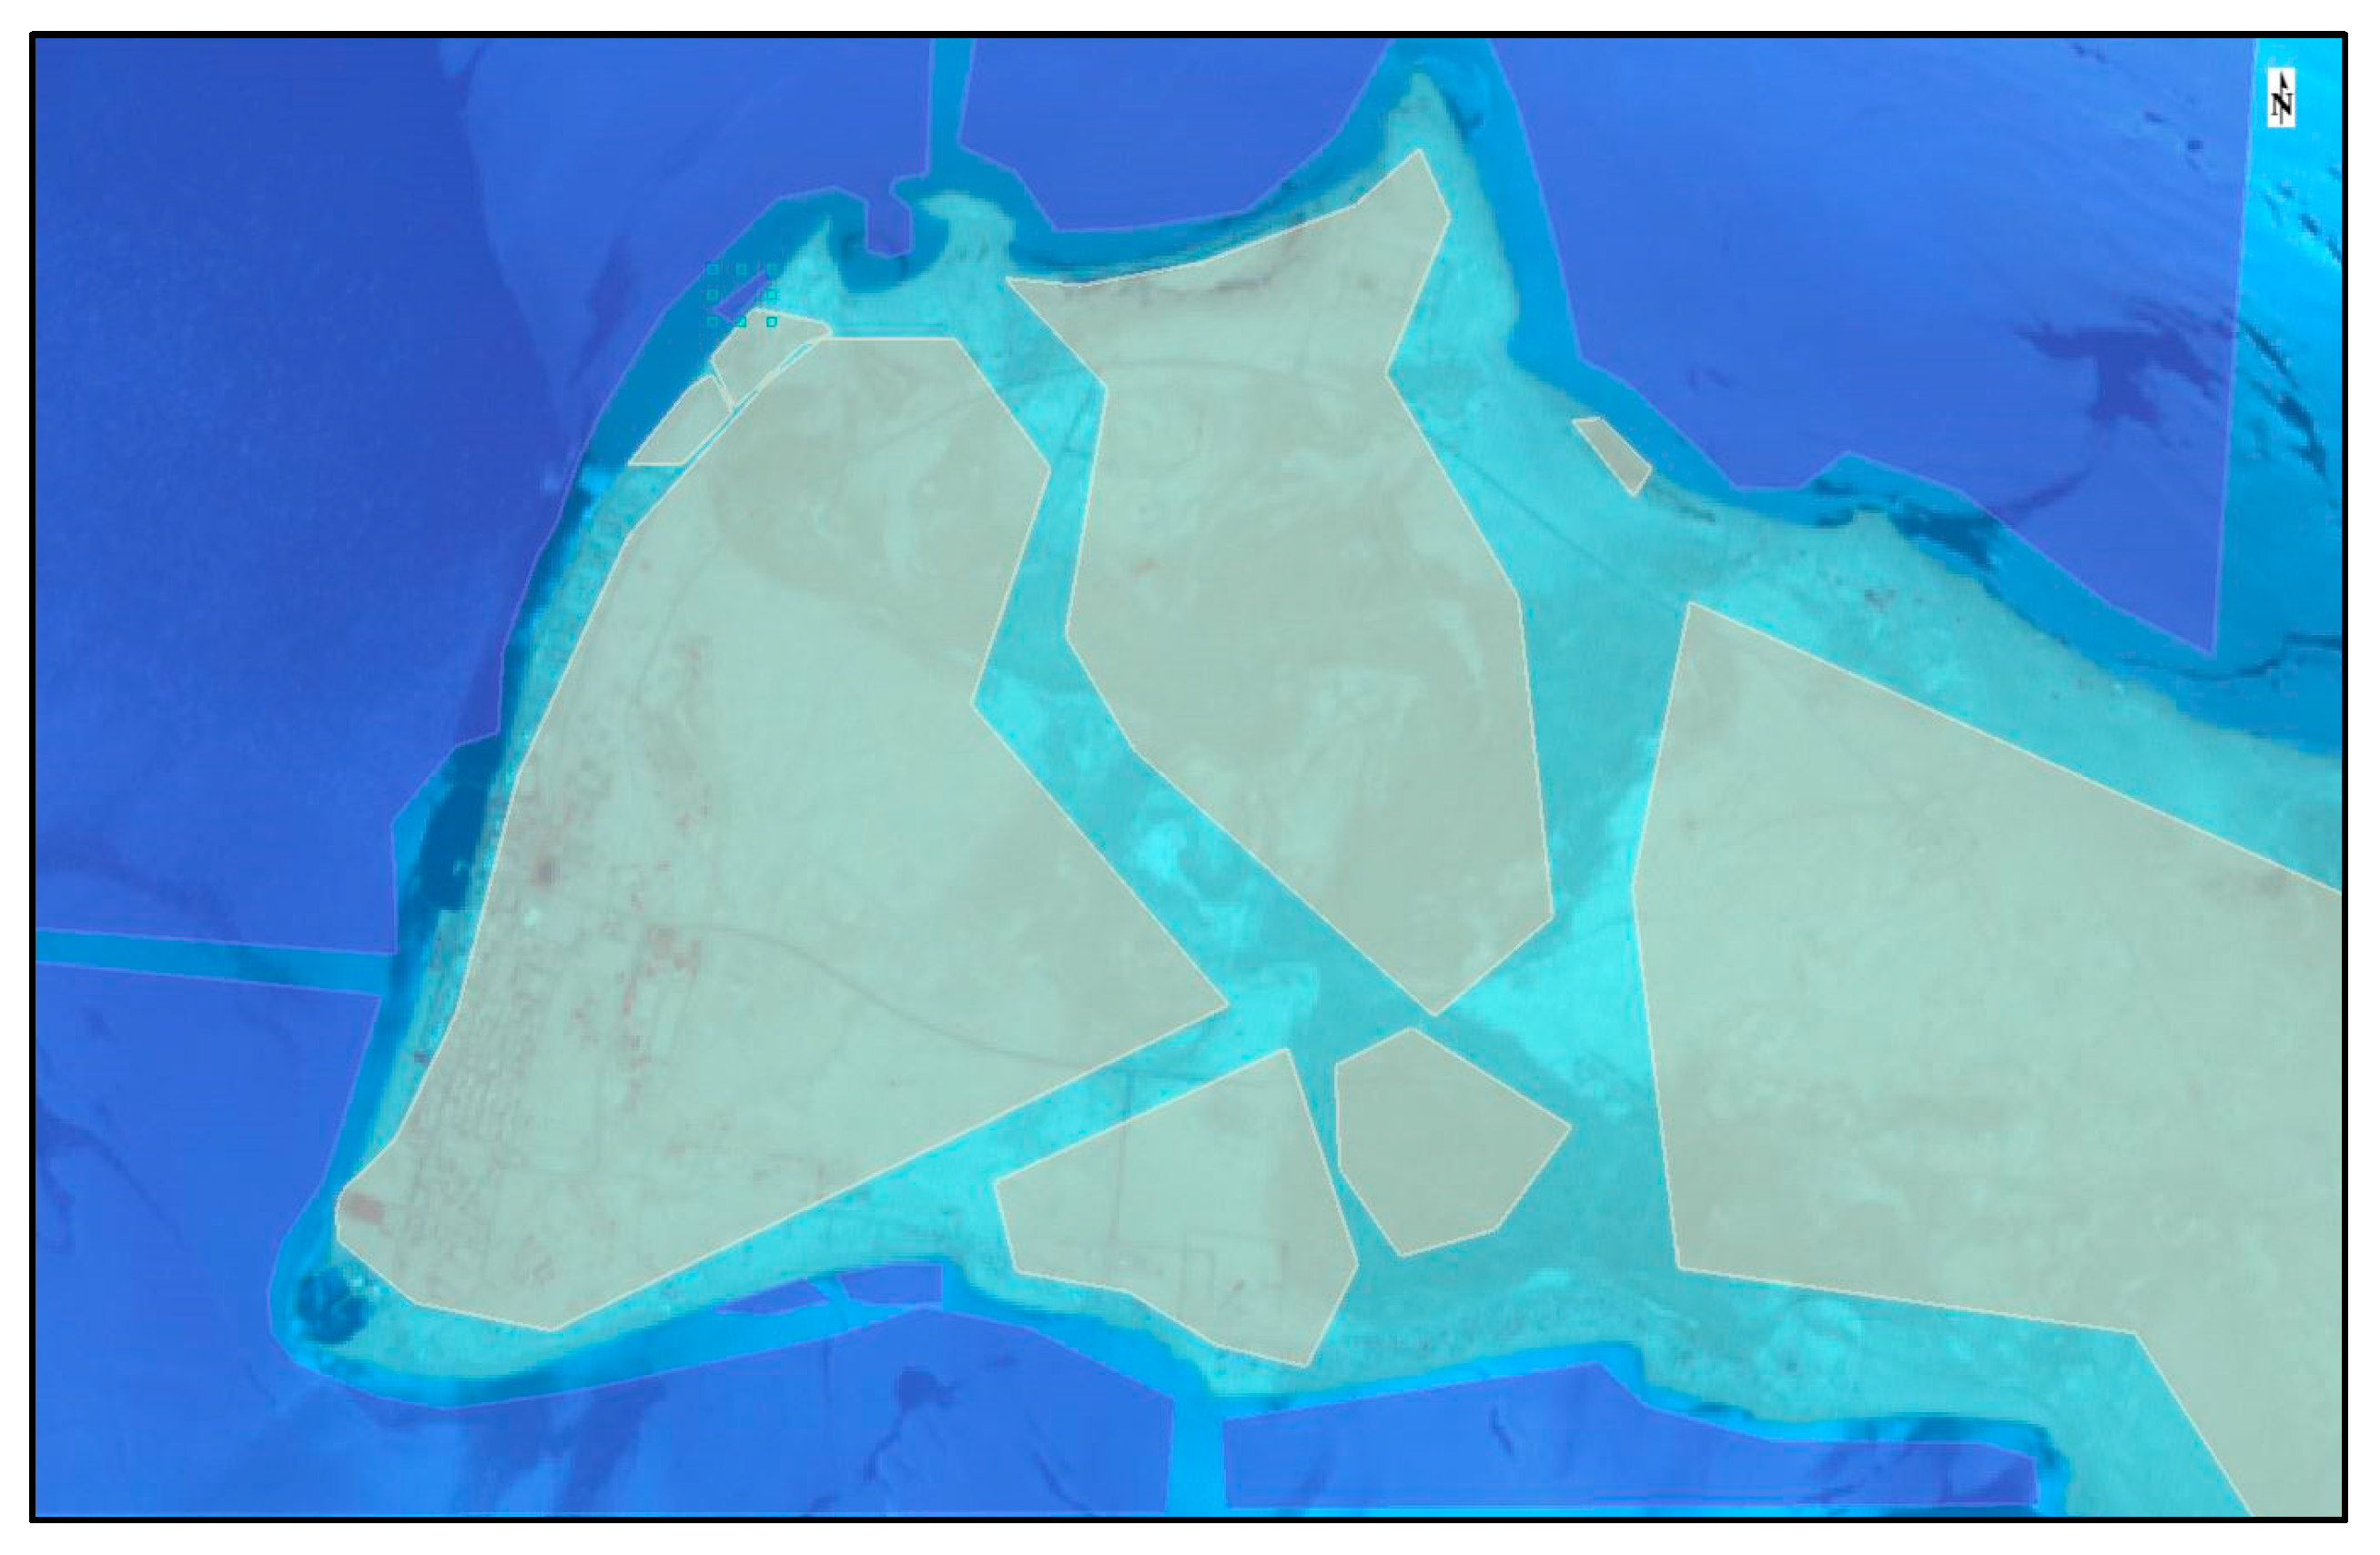
Shoreline 1: the Landsat 8 OLI sensor merged image has been classified using the supervised classification wizard appears technique (Spectral Angle Mapper Algorithm) with training data on ENVI 5.2 software. Then the shoreline has been extracted depending in the different classes.
Shoreline 2: the same technique has been applied for Aster image (VNIR sensor) to extract the shoreline (
Figure 5).
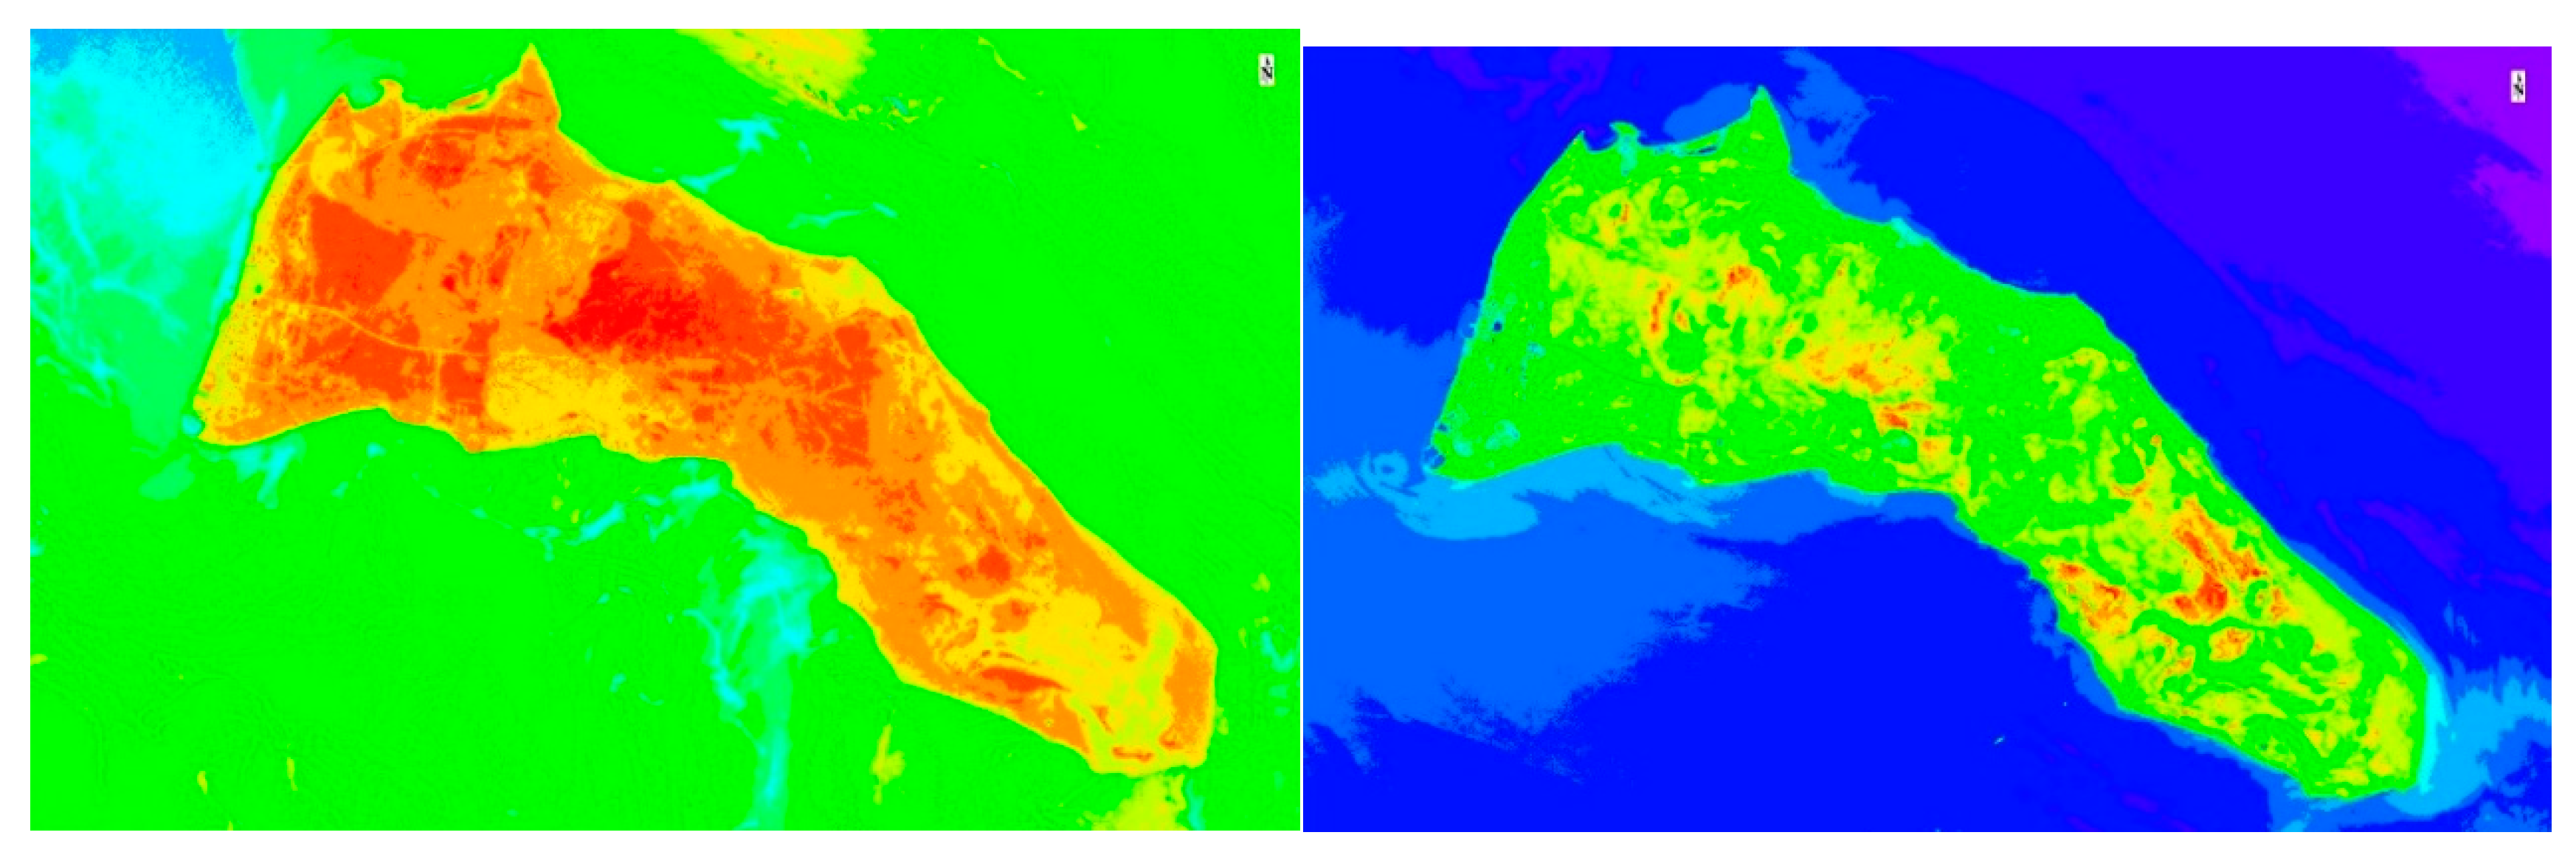
Shoreline 3: Landsat 8 merged image was classified using the colour slicing technique (unsupervised classification on ENVI 5.2 using near infrared band). Then the shoreline has been extracted depending on the different classes.
Shoreline 4: the same technique has been applied for Aster image to extract the shoreline.
Shoreline 5: the merged image of Landsat 8 was used to map the shoreline manually.
Shoreline 6: Aster VNIR was used to map the shoreline manually.
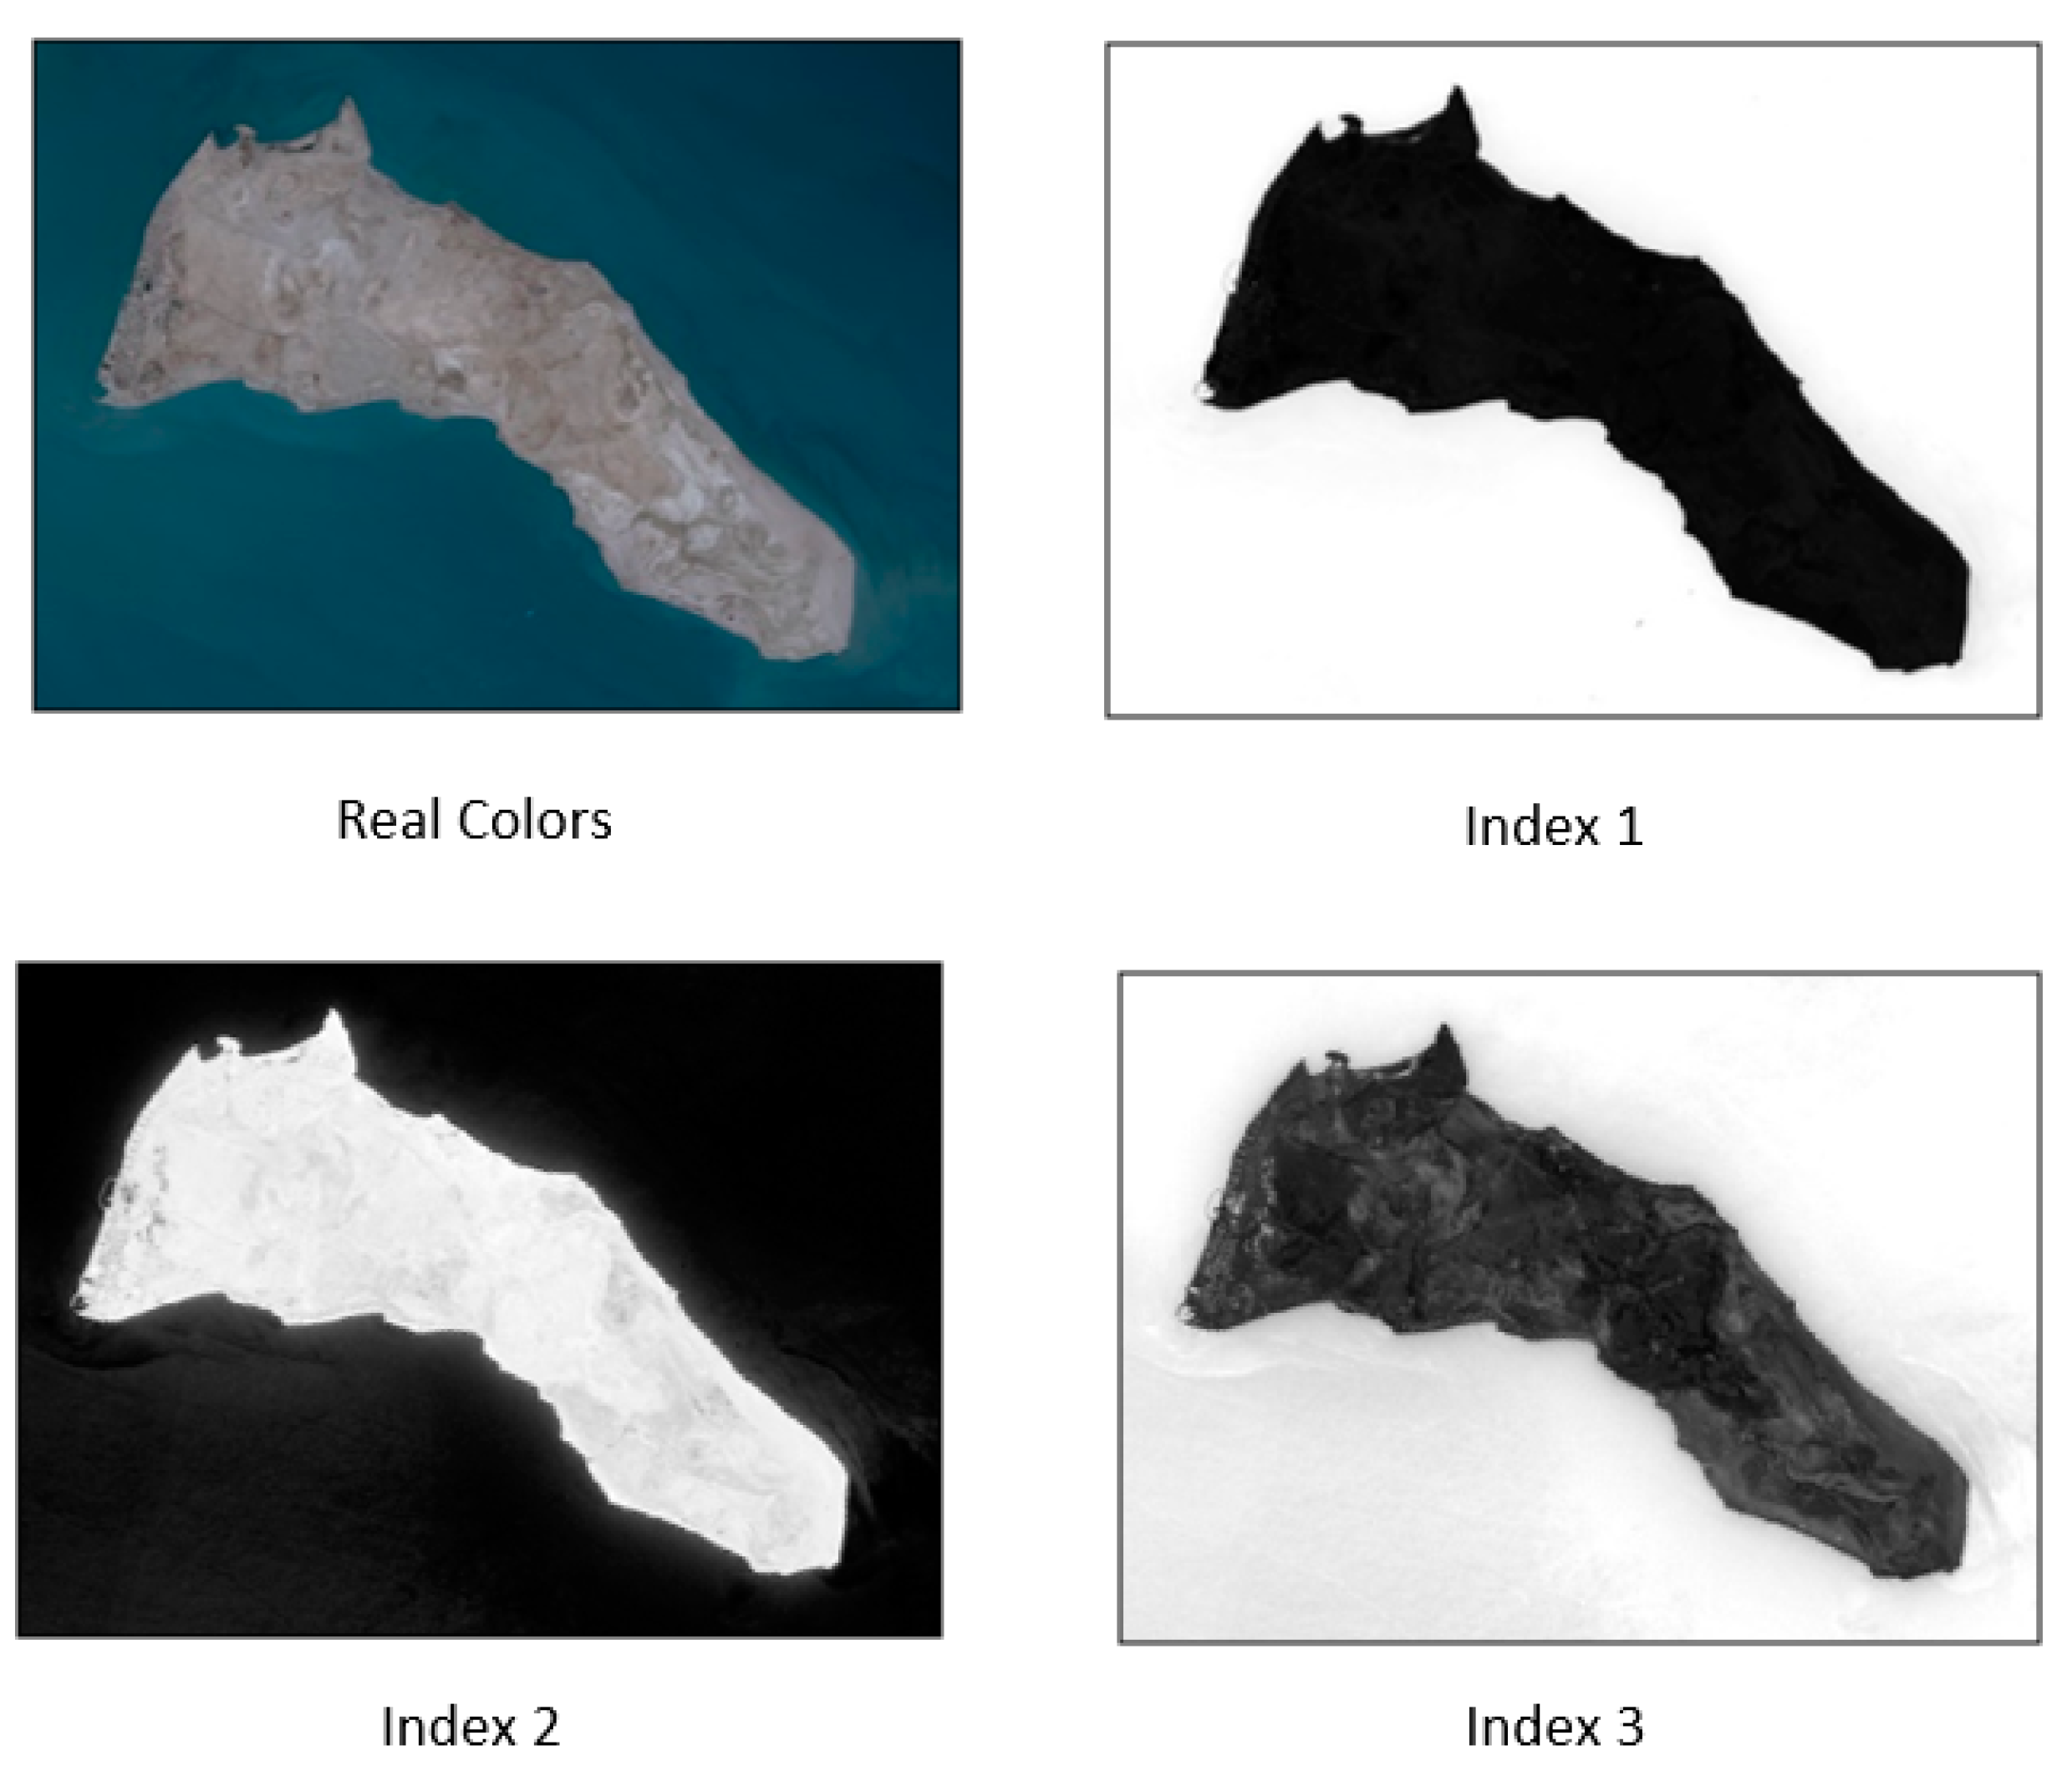
Shoreline 7: band rationing technique was applied for the Landsat 8 using the band math tool on ENVI 5.2. According to the spectral behaviour of the water, the band rationing technique has applied to delineate the shoreline of Failaka Island using the following algorithm:
Shoreline 8: band rationing technique was applied for the Landsat 8 using the following algorithm:
Shoreline 9: band rationing technique was applied for the Landsat 8. Using the following algorithm:
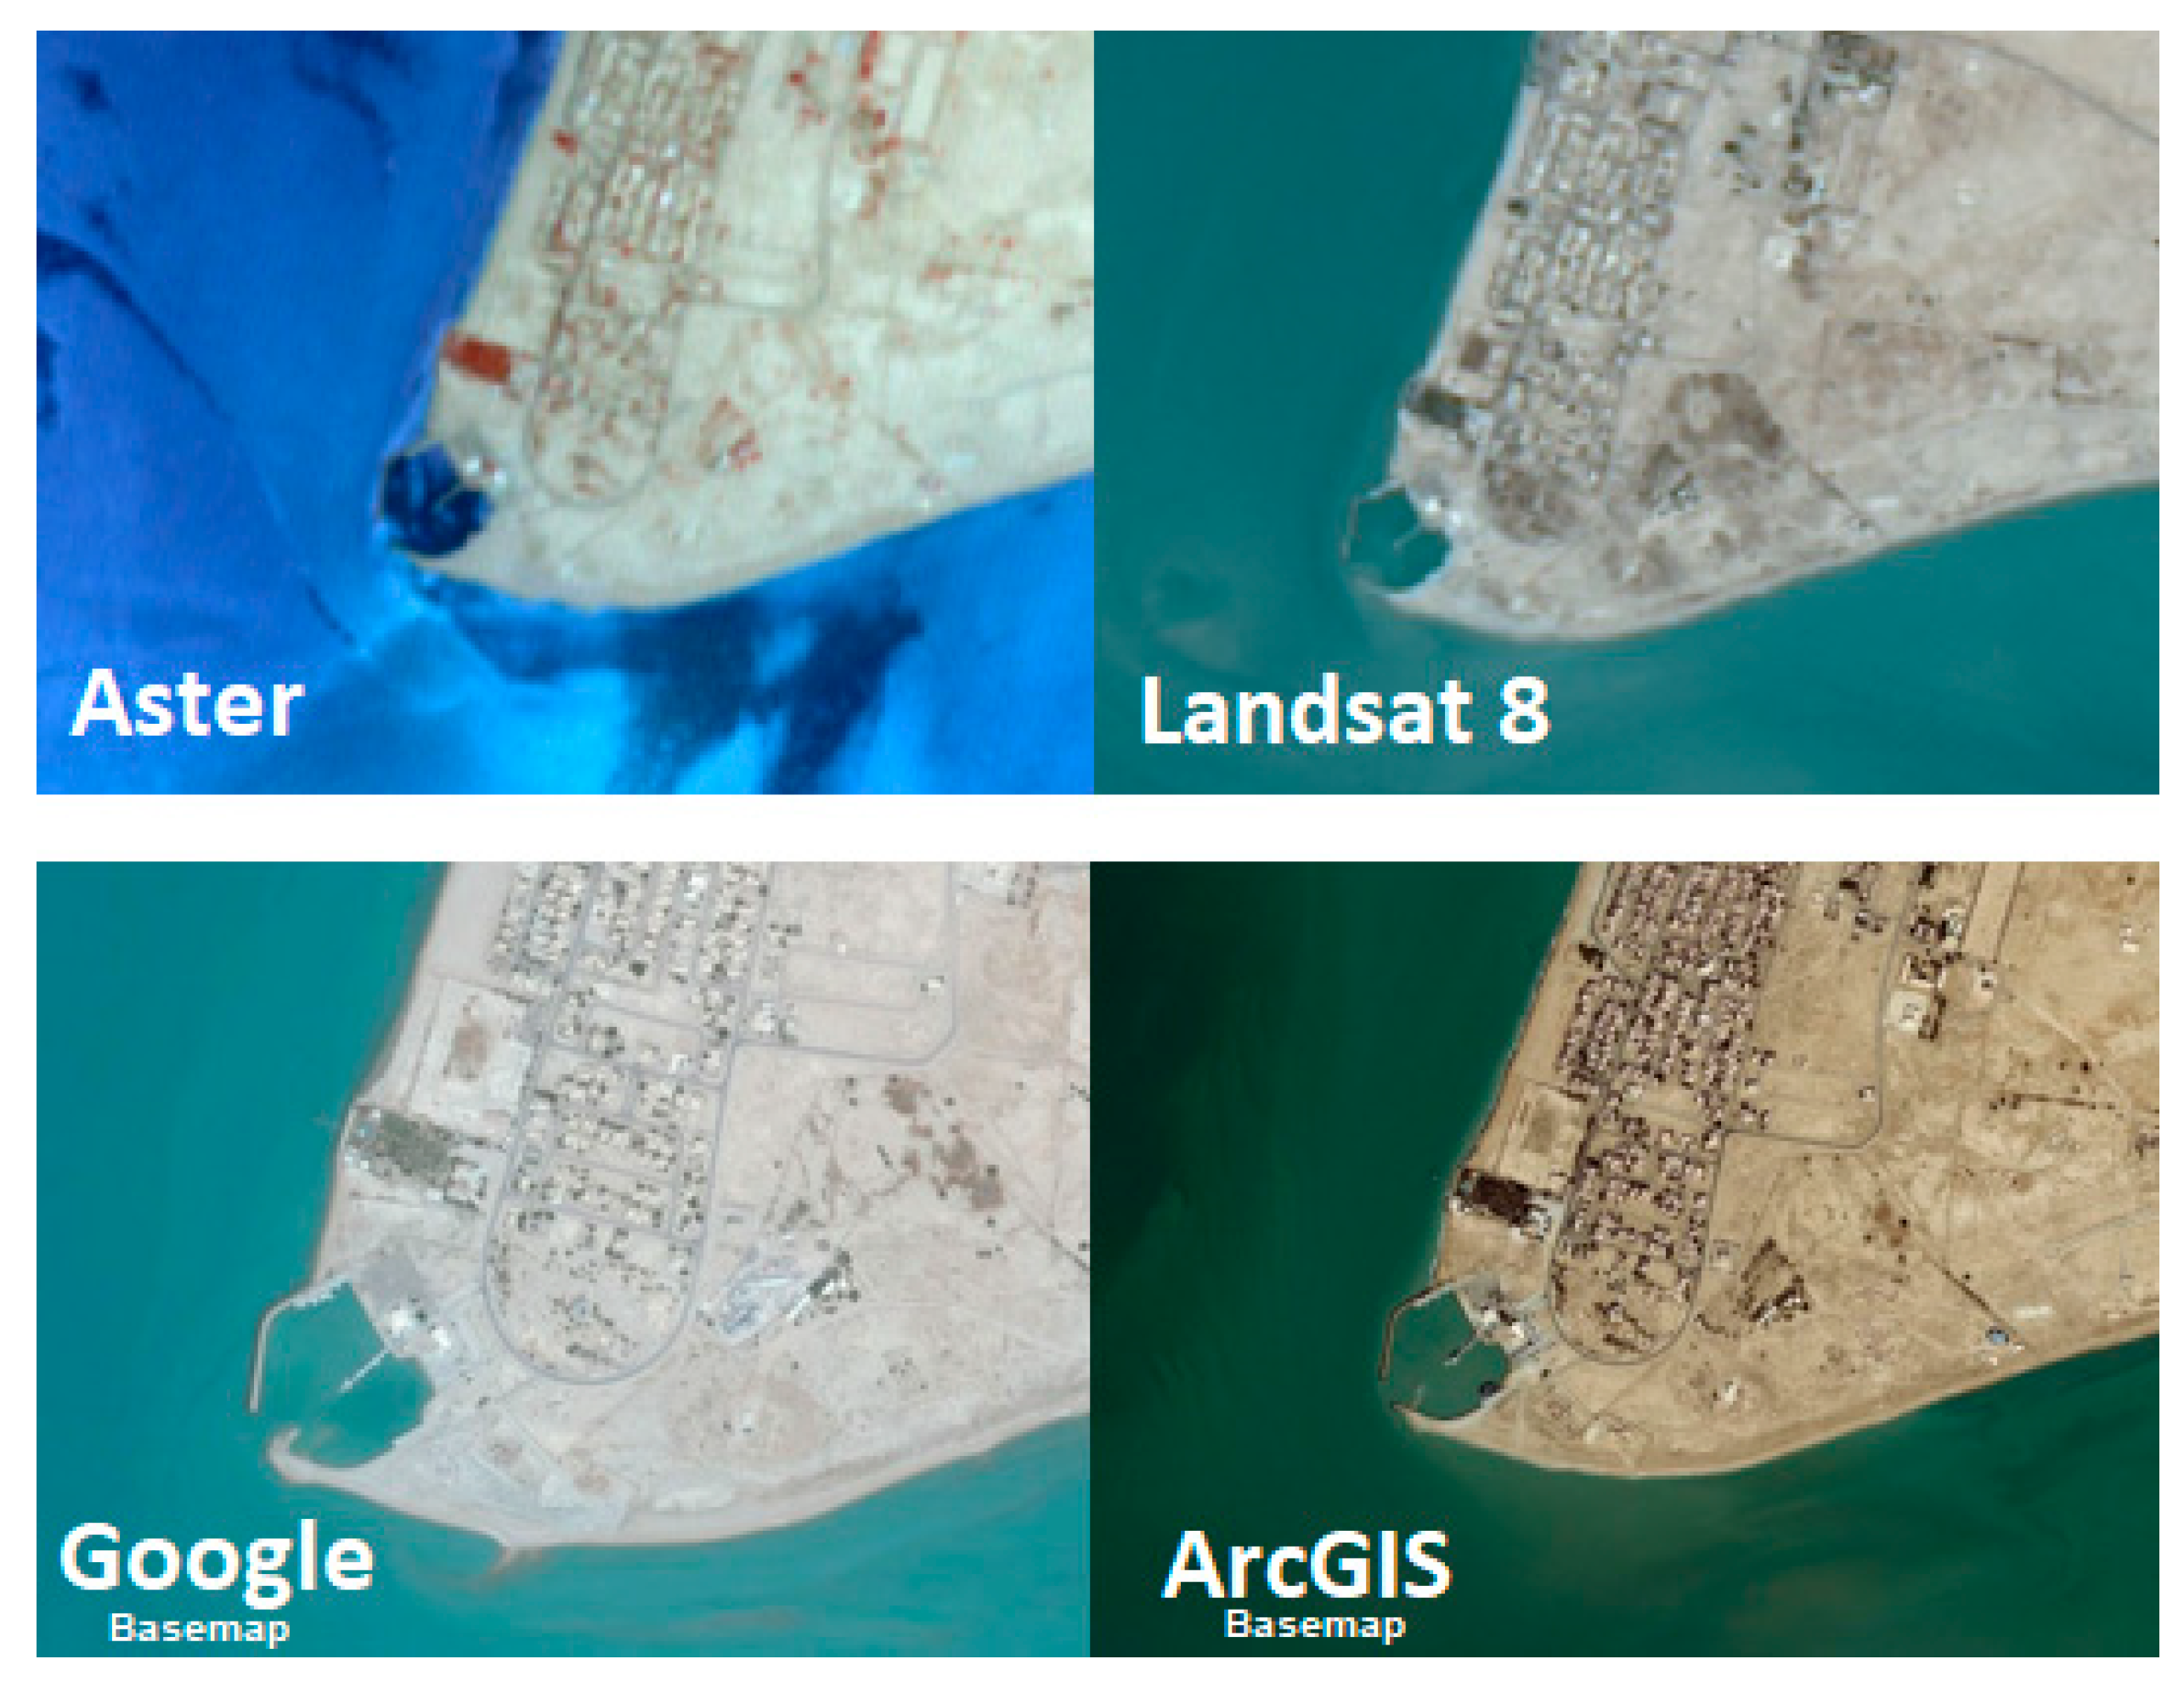
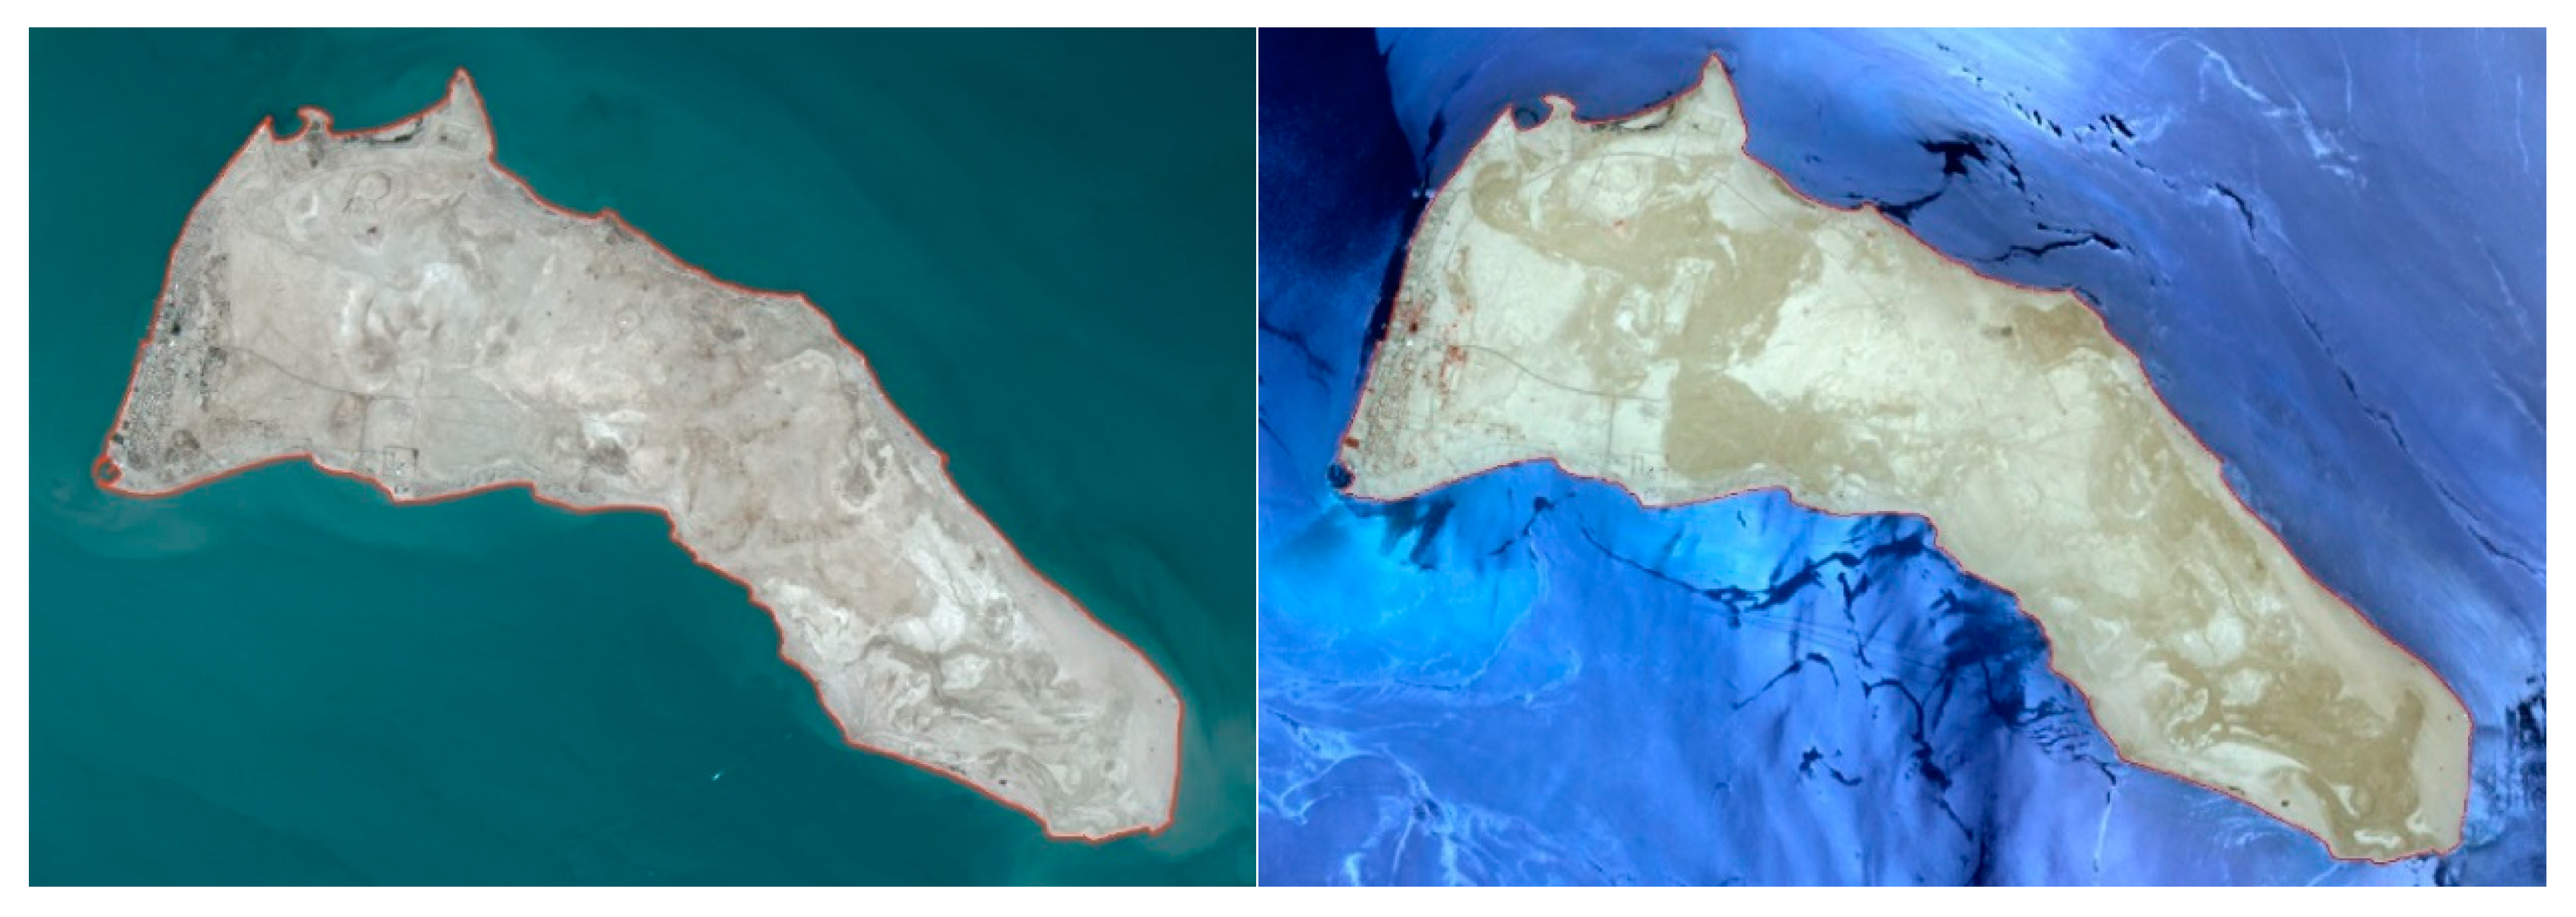
For validation and final editing purposes, high-resolution basemap images from both ArcGIS 10.4.1 (ArcGIS Online, 2018), and Google Earth in June 2018 (Google Earth, 2018) have been used. Both were used as a reference shoreline for validating and editing the mapped shorelines. Even though they are not taken at high tide, they are an important free resource to use. Their spatial resolution reaches a few centimetres.
Figure 6 shows the images used in this study. The final shorelines were projected on the local coordinate system WGS_1984_UTM_Zone_39N.
Results and Discussion
The results show that shoreline 7 is is the most accurate among the others (
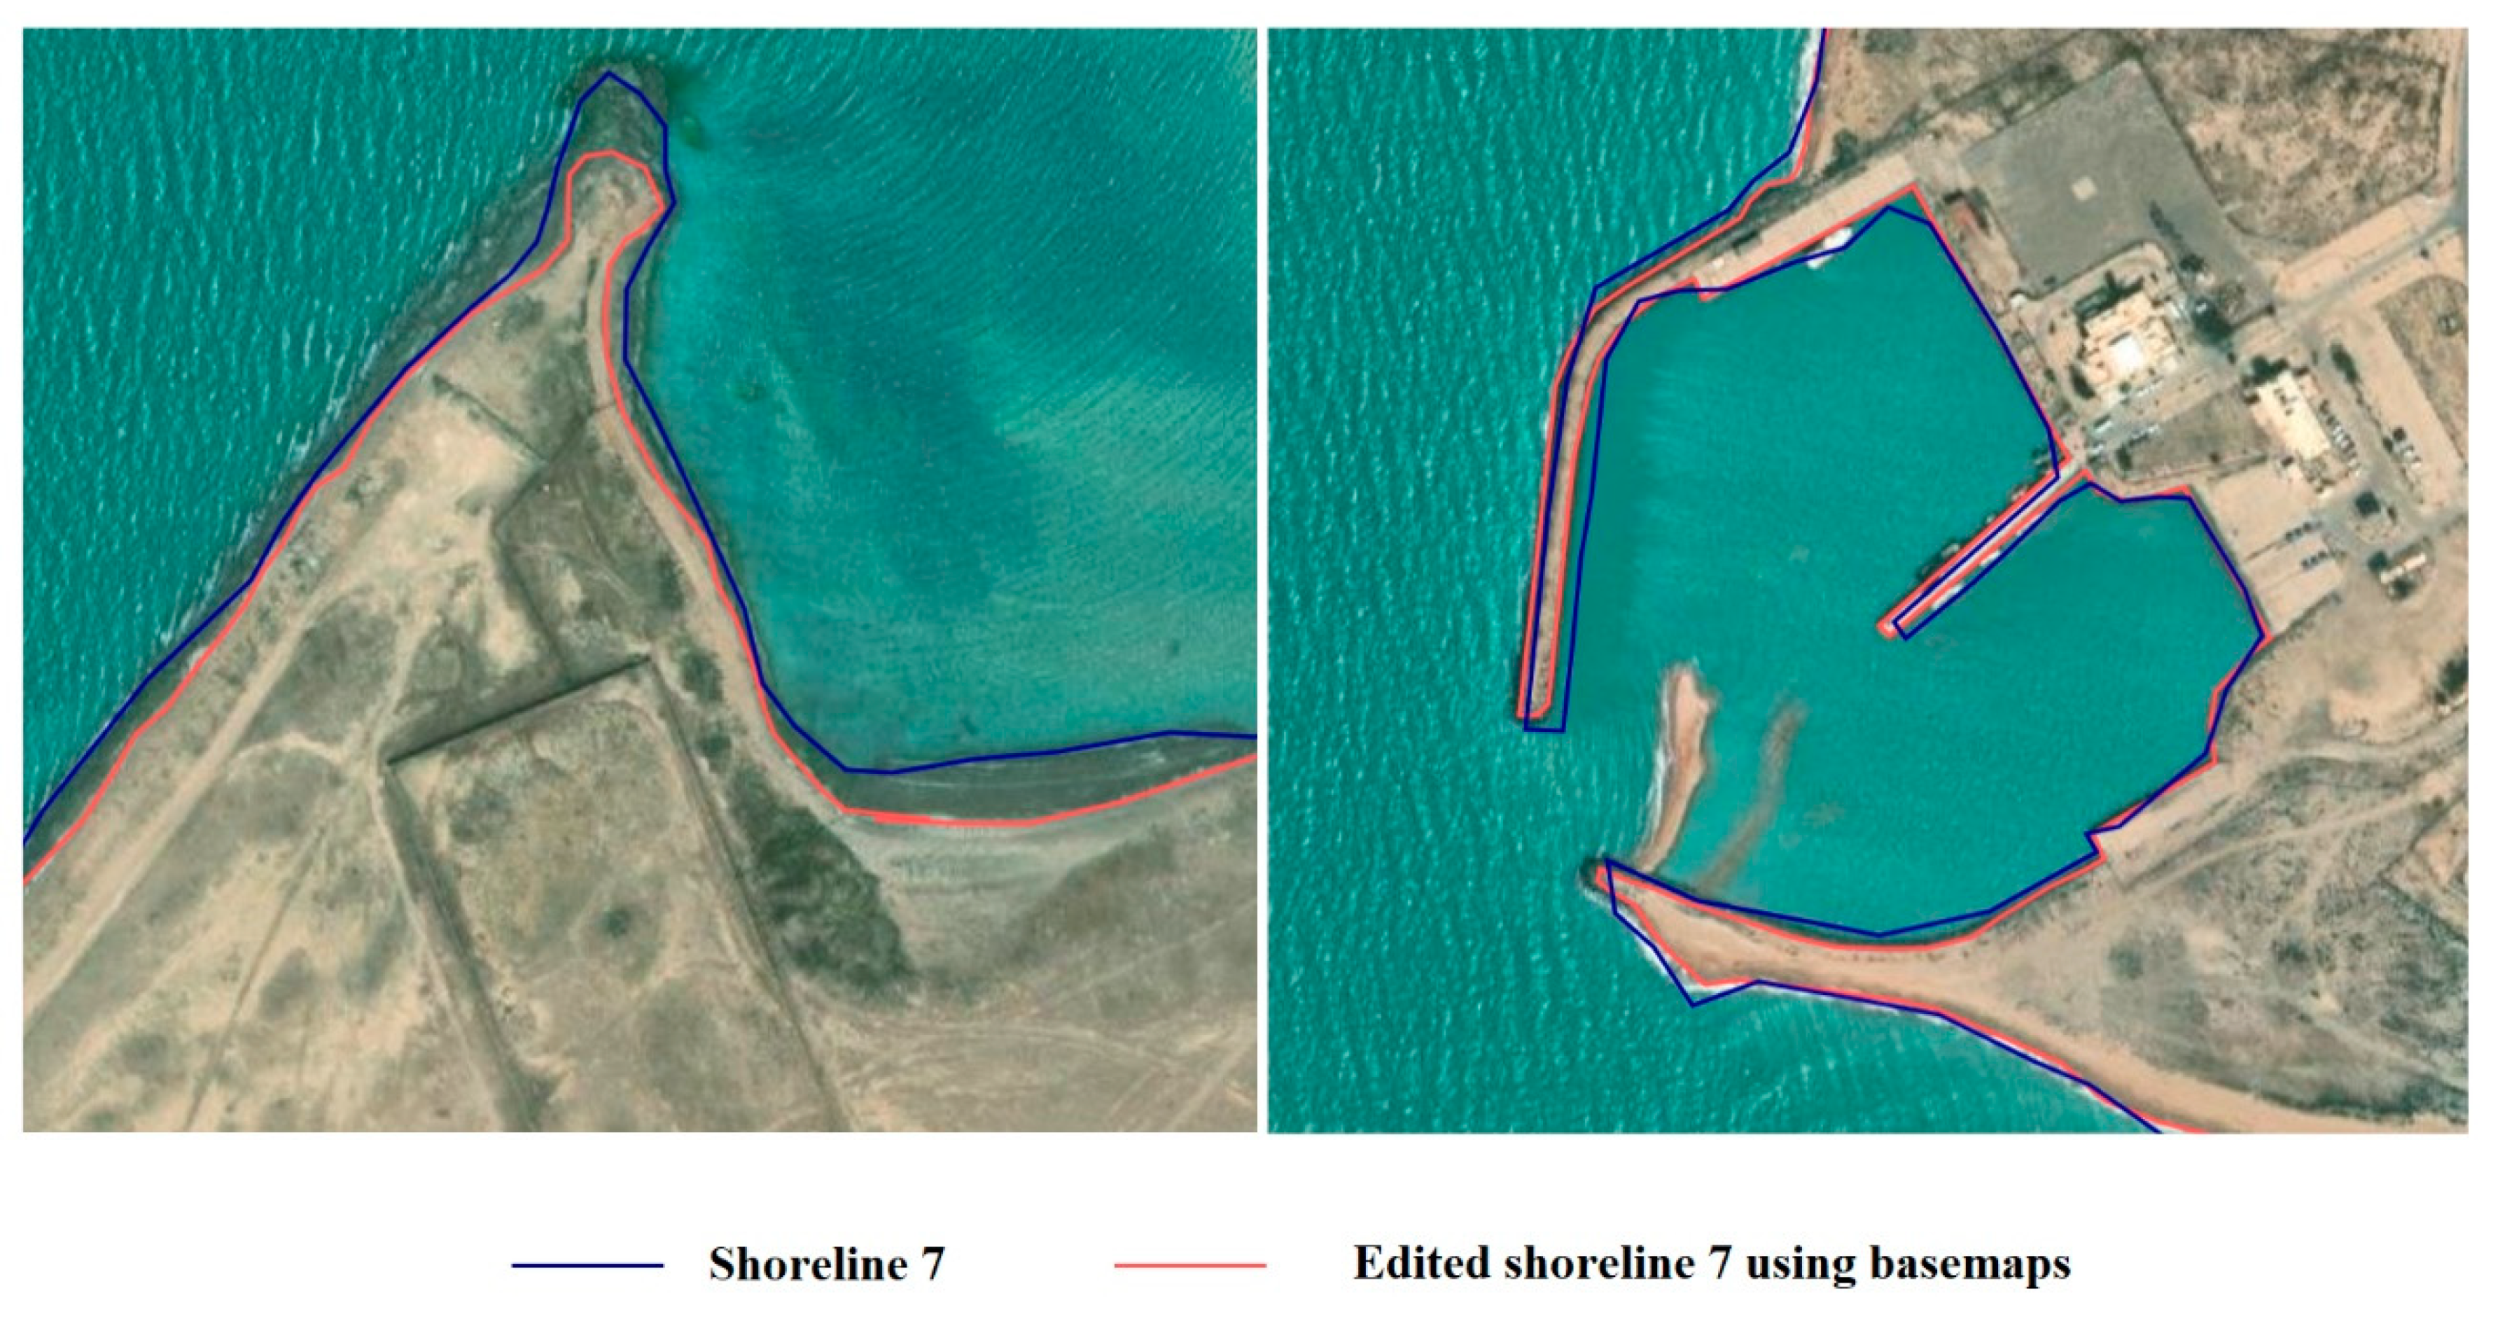
Figure 7). This shoreline was verified using the high-resolution images of the basemaps. Even though the shoreline 7 gave the best result, there were some simple displacements on the shoreline according to the spatial resolution of the band (
Figure 8). The high-resolution basemaps showed some generalization in the mapping. Although the high-resolution images were taken at different times, the high tide line can be determined, especially with field knowledge of the study area, and the background of analyzing satellite images based on coastal geomorphology concepts, in particular experience in distinguishing some phenomena such as wave-cut platforms and swash line, among others. Additionally, the spatial resolution of these data reaches a few centimetres in some places. The maximum tidal currents and waves around Failaka Island were less than 5 meters (Al-Sarawi et al., 1996); this is less than the spatial resolution of the merged image used to map the shoreline. According to that, it was better to use these high-resolution images to edit the extracted shoreline 7, which was extracted from the spectral index of Landsat 8 merged image using visual analysis. The band rationing technique could not be applied to Aster image due to the band’s range and number.
The use of multiple spectral bands increases the resolution of the image, especially on the intertidal areas and sabkhas or wetland zones, where it is hard to separate the land from the water using natural colours (Ryu et al., 2002). In addition, the band rationing method separates the land from the water into two clear colours, unlike the natural colours, which often shows a gradual shift between the two. In contrast to the automatic methods, the band rationing technique make the use of more than one band, and this has many advantages in identification of shorelines (Albanai, 2019).
Near infrared band is extremely useful for separating land from water because it is reflected strongly by land, and absorbed strongly by water (Albanai, 2022). This technique depends on the value of each pixel on the image. The program classifies the pixels depending on the number of classes that the analyst chooses.
For the quantitative methods, both the Aster VNIR and the merged image of Landsat 8 showed good results compared with the satellite basemap data. In the supervised classification methods, the technique depends on the user visual analysis of separating the land covers using samples of polygon annotation. Then, the program identifies the classes depending on the similarities of pixel values chosen by the user, and the number of classes sought by the analyst. Overall, this technique depends on which band is seen, and the spatial resolution of this band. On the other hand, unsupervised techniques are similar to the supervised classification, except it groups the pixels automatically, which in turn decreases the accuracy (
Figure 9). This method also depends on the spectral band that the user chooses, and the spatial resolution of the image. The results are good for studies which do not require a high resolution on mapping the shoreline. The required accuracy depends on the study’s purpose. When the two are compared, manual mapping remains more accurate and efficient.
Moving to the manual methods, the two satellites show good accuracy compared to the basemap data depending on the visual analysis (
Figure 10). The variation between Aster and the merged band of Landsat 8 on mapping the shorelines was too close, and less than the spatial resolution of the images. Although this result is acceptable, it was difficult to separate the land from the water in some areas. This difficulty is due to the natural colour applied in the image. There were some difficulties in mapping the shoreline using natural colours. These difficulties highlight the importance of using another spectral composite to help with the mapping process.
Conclusion
This study presents a methodology to use open source data in the best possible way to map the shoreline. Several methods have been tested using open source remote sensing data (Landsat and Aster) such as supervised classification, unsupervised classification, manual mapping, and by applying some spectral indicators, among others. The accuracy of the extracted shorelines was verified using high-resolution open database images (such as Google Earth basemap). The results showed that the manually mapped shoreline through applying spectral index (green- near infrared/green+ near infrared) is the most accurate, although it is important to modify it using high-resolution open database images. This study recommends relying on the latest available open source data, and this methodology can be applied to the latest satellite data such as Landsat – as well as to the Sentinel satellites, for example – in addition to any other open access satellites that may be launched in the future with better spatial resolution.
Acknowledgments
I would like to thank Prof. Mohammad Al-Sarawi. I am also indebted to the writers and institutions whose papers, websites and books were used in this study and to the USGS for their freely available satellite images
References
- Aedla, R., Dwarakish, G. S., & Reddy, D. V. (2015). Automatic Shoreline Detection and Change Detection Analysis of Netravati-GurpurRivermouth Using Histogram Equalization and Adaptive Thresholding Techniques. Aquatic Procedia, 4(Icwrcoe), 563–570. [CrossRef]
- Al-Mutari, F. (2017). Detecting Shoreline Change of the State of Kuwait Using spatial data integration approach. Kuwait University.
- Al-Sarawi, M. A., Marmoush, Y. R., Lo, J. M., & Al-Salem, K. A. (1996). Coastal management of Failaka Island, Kuwait. Journal of Environmental Management, 47(4), 299–310. [CrossRef]
- Albanai, J. A. (2021). Seawater quality atlas of the state of Kuwait (1st ed.). Center For Research and Studies on Kuwait.
- Albanai, J. A. (2019). A GIS Science Simulation for the Expected Sea Level Rise Scenarios on Failka Island in The State of Kuwait (1st ed.). Center For Research and Studies on Kuwait.
- Albanai, J. A., Shehab, M., Vatresia, A., & Al-Dashti, H. (2022). COVID-19 (2020) Impact on Air Quality of the State of Kuwait. [CrossRef]
- Albanai, J. A. (2020). Sea level rise projections for Failaka island in the state of Kuwait. Transactions on Maritime Science, 9(2), 236–247. [CrossRef]
- Albanai, J. A. (2021a). Coastal Atlas of The State of Kuwait: Geomorphology from Space and Atmosphere. Kuwait Foundation For The Advancement Of Science.
- Albanai, J. A. (2021b). Mapping Kuwait bathymetry using passive multispectral remote sensing. Kuwait Journal of Science, 48(4), 1–10. [CrossRef]
- Albanai, J. A. (2021c). Seasonal Spatial and Temporal Distribution of Chlorophyll-a Concentration over Kuwait and the Arabian Gulf using Satellite and In-Situ data. [CrossRef]
- Albanai, J. A. (2021d). Spatial Distribution of Kuwait Coastal Geomorphological Features using Remote Sensing Methods and GIS Solutions. Journal of Social Sciences, 49(3).
- Albanai, J. A. (2021e). Trend and dynamic of chlorophyll-a concentration over the Arabian Gulf A long-term study using MODIS data (2004 – 2019). Journal of Engineering Researsch.
- Albanai, J. A. (2022). Accuracy assessment for Landsat 8 thermal bands in measuring sea surface temperature over Kuwait and North West Arabian Gulf. Kuwait Journal of Science, 49(1). [CrossRef]
- Albanai, J. A., Karam, Q., Ali, M., & Annabi-Trabelsi, N. (2022). Physicochemical factors affecting chlorophyll-a concentrations in the north-western Arabian Gulf and Kuwait’s territorial waters. Arabian Journal of Geosciences, 15(22), 1671. [CrossRef]
- Albanai, J. A., Mahamat, A. A., & Abdelfatah, S. A. (2022). Geostatistical analysis of natural oil seepage using radar imagery—a case study in Qaruh Island, the State of Kuwait. Arabian Journal of Geosciences, 15(6), 469. [CrossRef]
- ArcGIS Online. (2018). Basemap (10.4.1). arcgis.com.
- California Institute of Technology: NASA. (2012). Advanced Spaceborne Thermal Emission and Reflection Radiometer (ASTER). https://asterweb.jpl.nasa.gov/gdem.asp.
- Cenci, L., Disperati, L., Persichillo, M. G., Oliveira, E. R., Alves, F. L., & Phillips, M. (2017). Integrating remote sensing and GIS techniques for monitoring and modeling shoreline evolution to support coastal risk management. GIScience & Remote Sensing, 00(00), 1–21. [CrossRef]
- Ford, M. (2013). Shoreline changes interpreted from multi-temporal aerial photographs and high resolution satellite images: Wotje Atoll, Marshall Islands. Remote Sensing of Environment, 135, 130–140. [CrossRef]
- Frazier, P. S., Frazier, P. S., Page, K. J., & Page, K. J. (2000). Water Body Detection and Delineation with Landsat TM Data. Photogrammetric Engineering & Remote Sensing, 66(12), 1461–1467.
- Gens, R. (2010). Remote sensing of coastlines: Detection, extraction and monitoring. International Journal of Remote Sensing, 31(7), 1819–1836. [CrossRef]
- Gibson, P. J. (2000). Introductory Remote Sensing Principles and Concepts"". Routledge.
- Google Earth. (2018). Digital Globe Data (6.2.2).
- Harris Geospatial product. (2018). Bnad Ratios.
- Hassan, A., Albanai, J. A., & Goudie, A. (2021). Modeling and managing flash flood Hazards in the (Issue July). [CrossRef]
- Hill, M. (2013). Coasts and Coastal Management (2nd ed.).
- Lipakis, M., Chtysoulakis, N., & Kamarianakis, Y. (2008). Shoreline extraction using satellite imagery. BEACHMED-e/OpTIMAL - Beach Erosin Monitoring, 81–95. www.iacm.forth.gr/papers/2008_Lipakis_et_al.pdf.
- Lohani, B., & Mason, D. C. (1999). Construction of a digital elevation model of the holderness coast using the waterline method and airborne thematic mapper data. International Journal of Remote Sensing, 20(3), 593–607. [CrossRef]
- McFeeters, S. K. (2013). Using the normalized difference water index (ndwi) within a geographic information system to detect swimming pools for mosquito abatement: A practical approach. Remote Sensing, 5(7), 3544–3561. [CrossRef]
- McGranahan, G., Balk, D., & Anderson, B. (2007). The rising tide: Assessing the risks of climate change and human settlements in low elevation coastal zones. Environment and Urbanization, 19(1), 17–37. [CrossRef]
- Meyer, B. K., Vance, R. K., Bishop, G. A., & Dai, D. (2016). Shoreline dynamics and environmental change under the modern marine transgression: St. Catherines Island, Georgia, USA. Environmental Earth Sciences, 75(1), 1–16. [CrossRef]
- Rokni, K., Ahmad, A., Selamat, A., & Hazini, S. (2014). Water feature extraction and change detection using multitemporal landsat imagery. Remote Sensing, 6(5), 4173–4189. [CrossRef]
- Ryu, J. H., Won, J. S., & Min, K. D. (2002). Waterline extraction from Landsat TM data in a tidal flat a case study in Gomso Bay, Korea. Remote Sensing of Environment, 83(3), 442–456. [CrossRef]
- USGS. (2018a). Earthexplorer. earthexplorer.usgs.gov.
- USGS. (2018b). Landsat Mission.
|
Disclaimer/Publisher’s Note: The statements, opinions and data contained in all publications are solely those of the individual author(s) and contributor(s) and not of MDPI and/or the editor(s). MDPI and/or the editor(s) disclaim responsibility for any injury to people or property resulting from any ideas, methods, instructions or products referred to in the content. |
© 2024 by the authors. Licensee MDPI, Basel, Switzerland. This article is an open access article distributed under the terms and conditions of the Creative Commons Attribution (CC BY) license (http://creativecommons.org/licenses/by/4.0/).

