Submitted:
26 December 2022
Posted:
03 January 2023
You are already at the latest version
Abstract
Keywords:
1. Introduction
2. Materials and Methods
3. Results and Discusion
3.1. Simulation results
3.2. Economic impact
4. Conclusions
Author Contributions
Funding
Acknowledgments
Conflicts of Interest
References
- Market research report, Ceramic tiles market size: Share & COVID -19 Impact Analysis, by implaction area (Floor, Walls,Others), By End-Use (Residential, Non Residential), and Regional Forecast, 2021-2028, 2022. https://www.fortunebusinessinsights.com/ceramic-tiles-market-102377.
- S. Ferrer, A. Mezquita, V.M. Aguilella, E. Monfort, Beyond the energy balance: Exergy analysis of an industrial roller kiln firing porcelain tiles, Applied Thermal Engineering 150 (2019) 1002–1015. [CrossRef]
- J.L. Bombazaro, A.M. Bernardin, Improving plasticity of kaolins by high-energy milling for use in porcelain tile compositions, Open Ceramics 10 (2022) 100256. [CrossRef]
- E. Monfort, A. Mezquita, R. Granel, E. Vaquer, A. Escrig, A. Miralles, V. Zaera, Analysis of energy consumption and carbon dioxide emissions in ceramic tile manufacture, Boletin De La Sociedad Espanola De Ceramica Y Vidrio 49 (2010) 303–310.
- E.F.S. Ciacco, J.R. Rocha, A.R. Coutinho, The energy consumption in the ceramic tile industry in Brazil, Applied Thermal Engineering 113 (2017) 1283–1289. [CrossRef]
- R.D. Darolt, M. Cargnin, M. Peterson, A. de Noni, Additional high-energy milling to enhance the performance of porcelain stoneware manufacturing, Int J Appl Ceram Technol 17 (2020) 1742–1751. [CrossRef]
- M.U. Taskiran, N. Demirkol, A. Capoglu, Influence of mixing/milling on sintering and technological properties of anorthite based porcelainised stoneware, Ceramics International 32 (2006) 325–330. [CrossRef]
- H.A. Refaey, A.A. Abdel-Aziz, M.R. Salem, H.E. Abdelrahman, M.W. Al-Dosoky, Thermal performance augmentation in the cooling zone of brick tunnel kiln with two types of guide vanes, International Journal of Thermal Sciences 130 (2018) 264–277. [CrossRef]
- H.A. Refaey, A.A. Abdel-Aziz, R.K. Ali, H.E. Abdelrahman, M.R. Salem, Augmentation of convective heat transfer in the cooling zone of brick tunnel kiln using guide vanes: An experimental study, International Journal of Thermal Sciences 122 (2017) 172–185. [CrossRef]
- H.A. Refaey, B.A. Almohammadi, A.A. Abdel-Aziz, H.E. Abdelrahman, H.A. Abd El-Ghany, M.A. Karali, M.W. Al-Dosoky, Transient thermal behavior in brick tunnel kiln with guide vanes: Experimental study, Case studies in thermal engineering (2022) 101959. [CrossRef]
- B. Delpech, M. Milani, L. Montorsi, D. Boscardin, A. Chauhan, S. Almahmoud, B. Axcell, H. Jouhara, Energy efficiency enhancement and waste heat recovery in industrial processes by means of the heat pipe technology: Case of the ceramic industry, Energy 158 (2018) 656–665. [CrossRef]
- Cogeneration systems in the ceramics tile sector, 1994.
- C. Agrafiotis, T. Tsoutsos, Energy saving technologies in the European ceramic sector: a systematic review, Applied Thermal Engineering 21 (2001) 1231–1249. [CrossRef]
- M. Castro Oliveira, M. Iten, P.L. Cruz, H. Monteiro, Review on Energy Efficiency Progresses, Technologies and Strategies in the Ceramic Sector Focusing on Waste Heat Recovery, Energies 13 (2020) 6096. [CrossRef]
- European Commission, European Commission. https://ec.europa.eu/info/.
- D.S. Barbosa, J.E. Silva, R.A.F. Machado, D. Hotza, Controle e automação na indústria cerâmica: estudo de caso na fabricação de porcelanato no Brasil, Revista Cerâmica Industrial 13 (2008) 23–30.
- M. Dosta, J.D. Litster, S. Heinrich, Flowsheet simulation of solids processes: Current status and future trends, Advanced Powder Technology 31 (2020) 947–953. [CrossRef]
- V. Skorych, M. Buchholz, M. Dosta, H.K. Baust, M. Gleiß, J. Haus, D. Weis, S. Hammerich, G. Kiedorf, N. Asprion, H. Nirschl, F. Kleine Jäger, S. Heinrich, Use of Multiscale Data-Driven Surrogate Models for Flowsheet Simulation of an Industrial Zeolite Production Process, Processes 10 (2022) 2140. [CrossRef]
- J. Haus, E.-U. Hartge, S. Heinrich, J. Werther, Dynamic flowsheet simulation for chemical looping combustion of methane, International Journal of Greenhouse Gas Control 72 (2018) 26–37. [CrossRef]
- C.L. Alves, A. de Noni Jr, R. Janssen, D. Hotza, J.B. Rodrigues Neto, S.Y. Gómez González, M. Dosta, Integrated process simulation of porcelain stoneware manufacturing using flowsheet simulation, CIRP Journal of Manufacturing Science and Technology 33 (2021) 473–487. [CrossRef]
- V. Skorych, M. Dosta, S. Heinrich, Dyssol—An open-source flowsheet simulation framework for particulate materials, SoftwareX 12 (2020) 100572. [CrossRef]
- V. Skorych, M. Dosta, E.-U. Hartge, S. Heinrich, Novel system for dynamic flowsheet simulation of solids processes, Powder Technology 314 (2017) 665–679. [CrossRef]
- C.L. Alves, V. Skorych, A. de Noni Jr, D. Hotza, S.Y. Gómez González, S. Heinrich, M. Dosta, Improving the sustainability of porcelain tile manufacture by flowsheet simulation, Ceramics International.
- G. Nassetti, F. Ferrari, A. Fregni, G. Maestri, Piastrelle Ceramiche & Energia: Banca dati dei consumi energetici nell' industria delle piastrelle di ceramica, Assopiastrelle, Bologna, 1998.
- K.G. Tsakalakis, G.A. Stamboltzis, Modelling the specific griding energy and abll- mill scaleup, IFAC Proceedings Volumes 37 53–58.
- Morrell, Power draw of wet tumbling mills and its relationship to charge dynamics- Part 1: a continuum apprach to a mathematical modelling of mill power draw, Mineral processing and Extractive metallurgy 105 (1996) C43-C53.
- P. Walzel, Spraying and Atomizing of Liquids, Ullmann’s Encyclopedia of Industrial Chemestry; Wiley-VCH Verlag GmbH: Weinheim, Germany (2012) 79–98.
- M. Ali, T. Mahmud, P.J. Heggs, M. Ghadiri, D. Djurdjevic, H. Ahmadian, L.M. Juan, C. Amador, A. Bayly, A one dimensional plug flow model of a counter current spray drying tower, chemical engineering research and design 92 (2014). [CrossRef]
- W. Kriaa, S. Bejaoui, H. Mhiri, G. Le Palec, P. Bournot, Study of dynamic structure and heat and mass transfer of a vertical ceramic tiles dryer using CFD simulations, Heat and Mass Transfer 50 (2014) 235–251. [CrossRef]
- K. Khalili, M. Bagherian, S. Khisheh, Numerical simulation of drying ceramic using finite element and machine vision, Procedia Technology 12 (2014) 388–393. [CrossRef]
- S.Y. Gómez, D. Hotza, Predicting powder densification during sintering, Journal of the European Ceramic Society 38 (2018) 1736–1741. [CrossRef]
- A. de Noni, D. Hotza, V.C. Soler, E.S. Vilches, Influence of composition on mechanical behaviour of porcelain tile. Part I: Microstructural characterization and developed phases after firing, Materials Science and Engineering: A 527 (2010) 1730–1735. [CrossRef]
- A. de Noni Jr, Modelagem matemática aplicada ao controle dimensional de placas cerâmicas de monoqueima processadas por via úmida: Dissertação (Mestrado em Ciência e Engenharia de Materiais), Universidade Federal de Santa Catarina, Florianópolis (2005).
- J. Martín-Márquez, J.M. Rincón, M. Romero, Effect of firing temperature on sintering of porcelain stoneware tiles, Ceramics International 34 (2008) 1867–1873. [CrossRef]
- S.A. Sacmi Iberica, Tecnología cerámica aplicada, Vol I, Faenza Editrice Ibérica SL Faenza RA, Italia: Litográfica Faenza SRL (2001).
- A. van Gelder, Tecnología cerámica aplicada, Volumen II. SACMI (2004).
- F.G. Melchiades, A. Canavesi, A.O. Boschi, Dimensionamento de Revestimentos Cerâmicos Visando a Maximização da Produtividade (Por que os Revestimentos tem os Tamanhos que tem?), Cerâmica Industrial 3 (2006) 13–15.
- SACMI, Asociación Española de Técnicos Cerámicos, Tecnología cerámica aplicada, Castellón de la Plana: Faenza Editrice Iberica (2004).
- G.B. Remmey, Firing ceramics, World Scientific, 1994.
- H.A. Refaey, E. Specht, M.R. Salem, Influence of fuel distribution and heat transfer on energy consumption in tunnel kilns, International Journal of Advances in Engineering & Technology 8 (2015) 281.
- Beltrán, V., Ferrer, C., Bagán, V., Sánchez, E., Garcia, J., & Mestre, S. (Ed.), Influence of pressing powder characteristics and firing temperature on the porous microstructure and stain resistance of porcelain tile, 1996.
- J. Peng, Y. Zhao, L. Jiao, W. Zheng, L. Zeng, CO2 Emission Calculation and Reduction Options in Ceramic Tile Manufacture-The Foshan Case, Energy Procedia 16 (2012) 467–476. [CrossRef]
- T. Ros-Dosdá, P. Fullana-i-Palmer, A. Mezquita, P. Masoni, E. Monfort, How can the European ceramic tile industry meet the EU's low-carbon targets? A life cycle perspective, Journal of Cleaner Production 199 (2018) 554–564. [CrossRef]
- P. Runst, D. Höhle, The German eco tax and its impact on CO2 emissions, Energy Policy 160 (2022) 112655. [CrossRef]
- P. Härtel, M. Korpås, Demystifying market clearing and price setting effects in low-carbon energy systems, Energy Economics 93 (2021) 105051. [CrossRef]
- A. Bengochea-Morancho, F. Higón-Tamarit, I. Martínez-Zarzoso, Economic Growth and CO2 Emissions in the European Union, Environmental and Resource Economics 19 (2001) 165–172. [CrossRef]
- R.E. Carter, Kinetic Model for Solid-State Reactions, The Journal of Chemical Physics 34 (1961) 2010–2015. [CrossRef]
- J.L. Amorós, M.J. Orts, J. García-Ten, A. Gozalbo, E. Sánchez, Effect of the green porous texture on porcelain tile properties, Journal of the European Ceramic Society 27 (2007) 2295–2301. [CrossRef]
- E. Sánchez-Vilches, V. Sanz-Solana, M.C. Bordes, J. Sales, K. Kayaci, M. Taşkiran, Ü. Anil, S. Türk, M. Tarhan, Firing deformation in large size porcelain tiles. Effect of compositional and process variables (2018).
- W.J. Walker, J.S. Reed, S.K. Verma, Influence of Slurry Parameters on the Characteristics of Spray-Dried Granules, Journal of the American Ceramic Society 82 (1999) 1711–1719. [CrossRef]
- J.S. Reed, Principles of ceramics processing (1995) 378–393.
- M. Dondi, Powder Granulation and Compaction 136–145. [CrossRef]
- A.S. Küçüker, A. Kara, K. Kayacı, S. Gerl, Cost Effective Slurry Preparation in Porcelain Tile Production, 0173-9913 (2009).
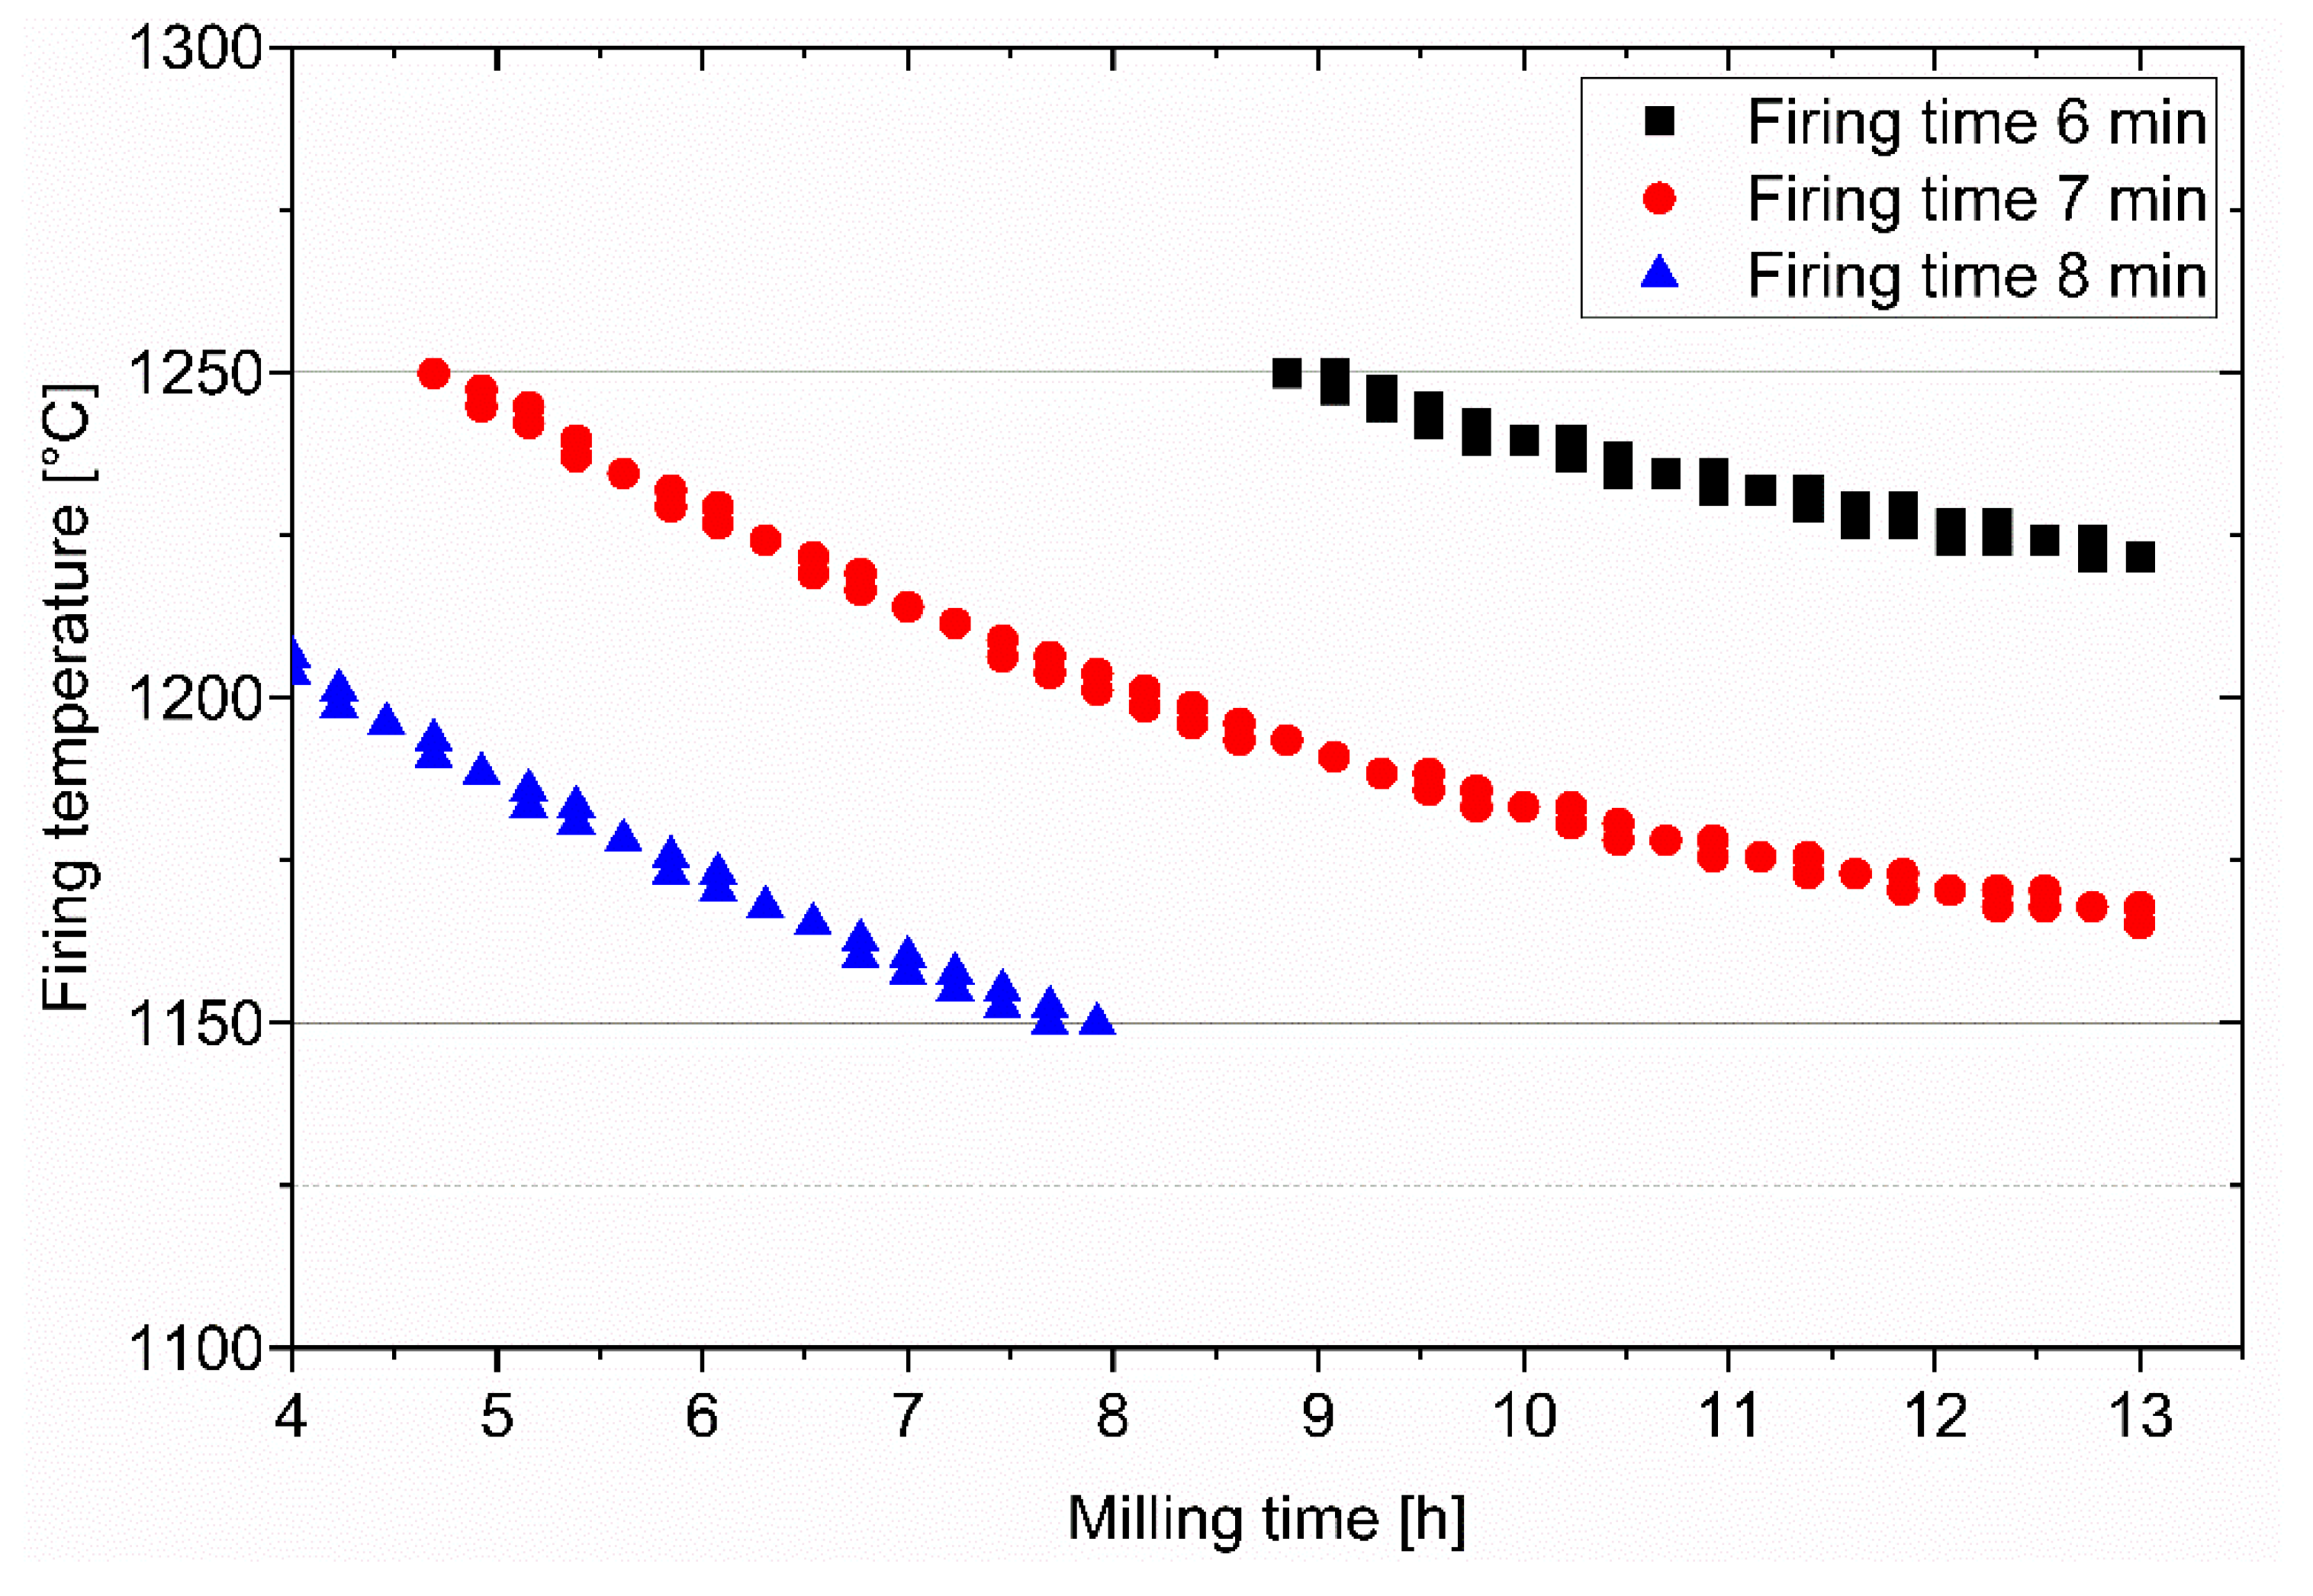

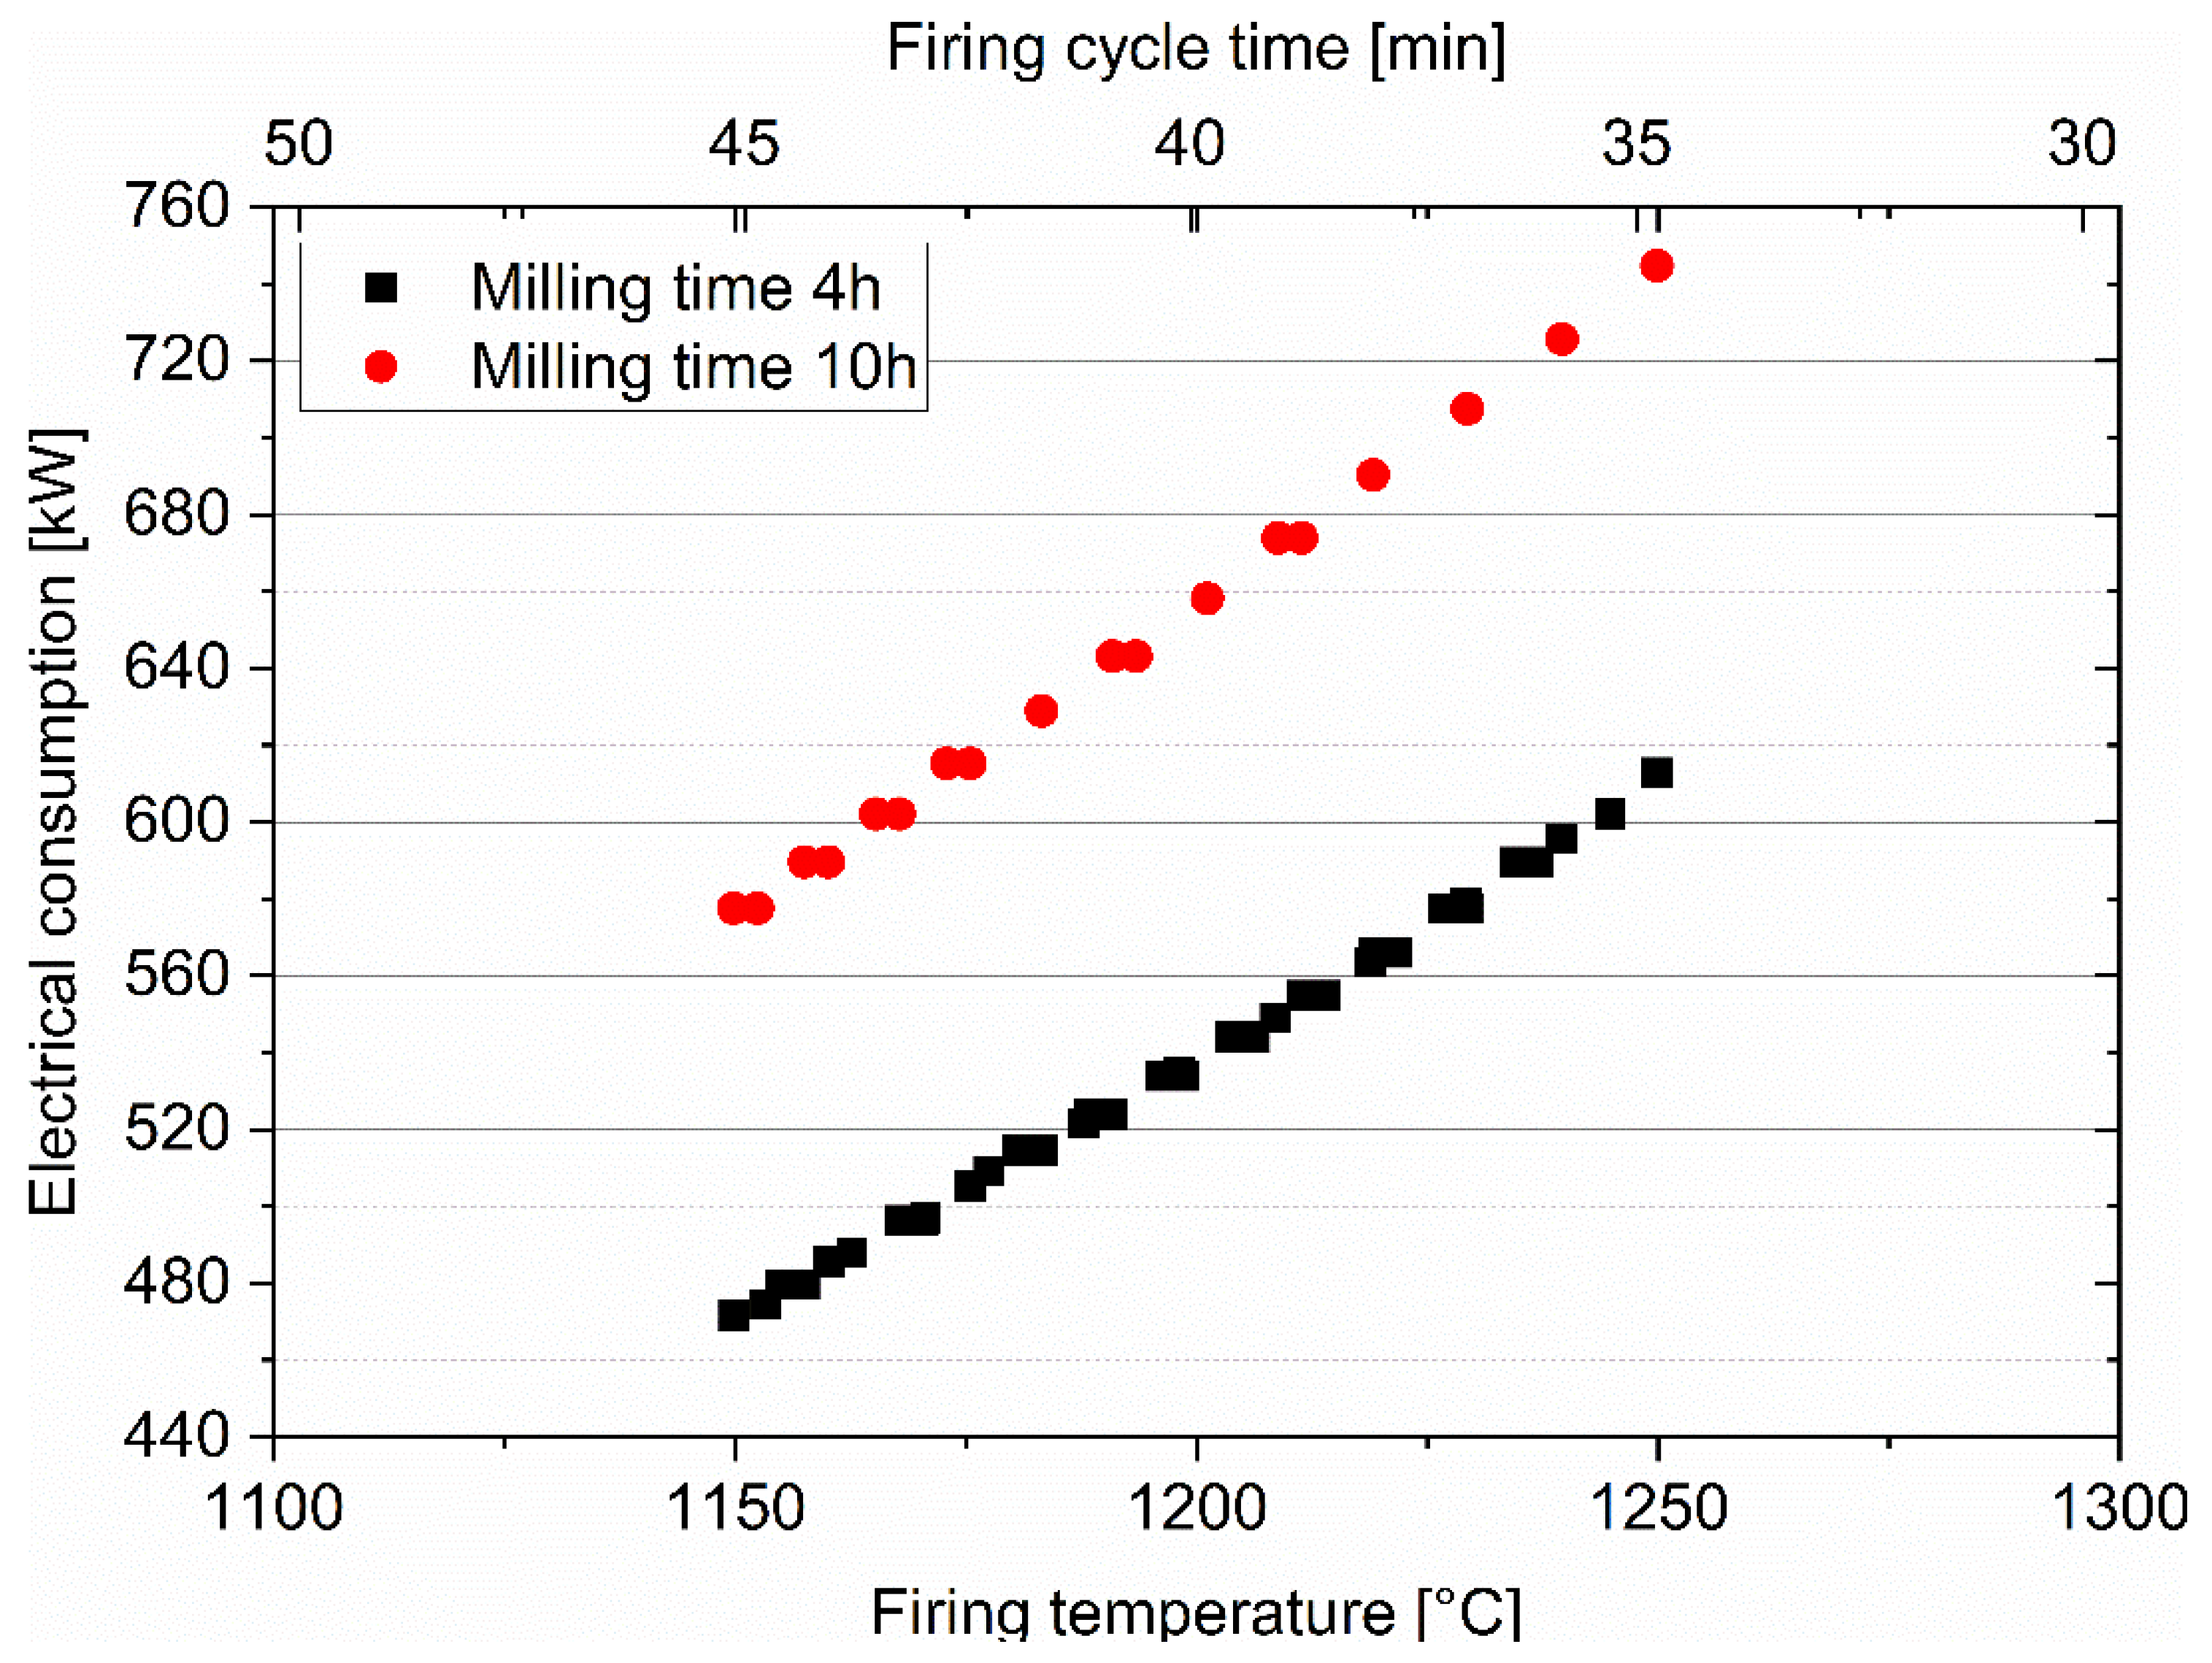
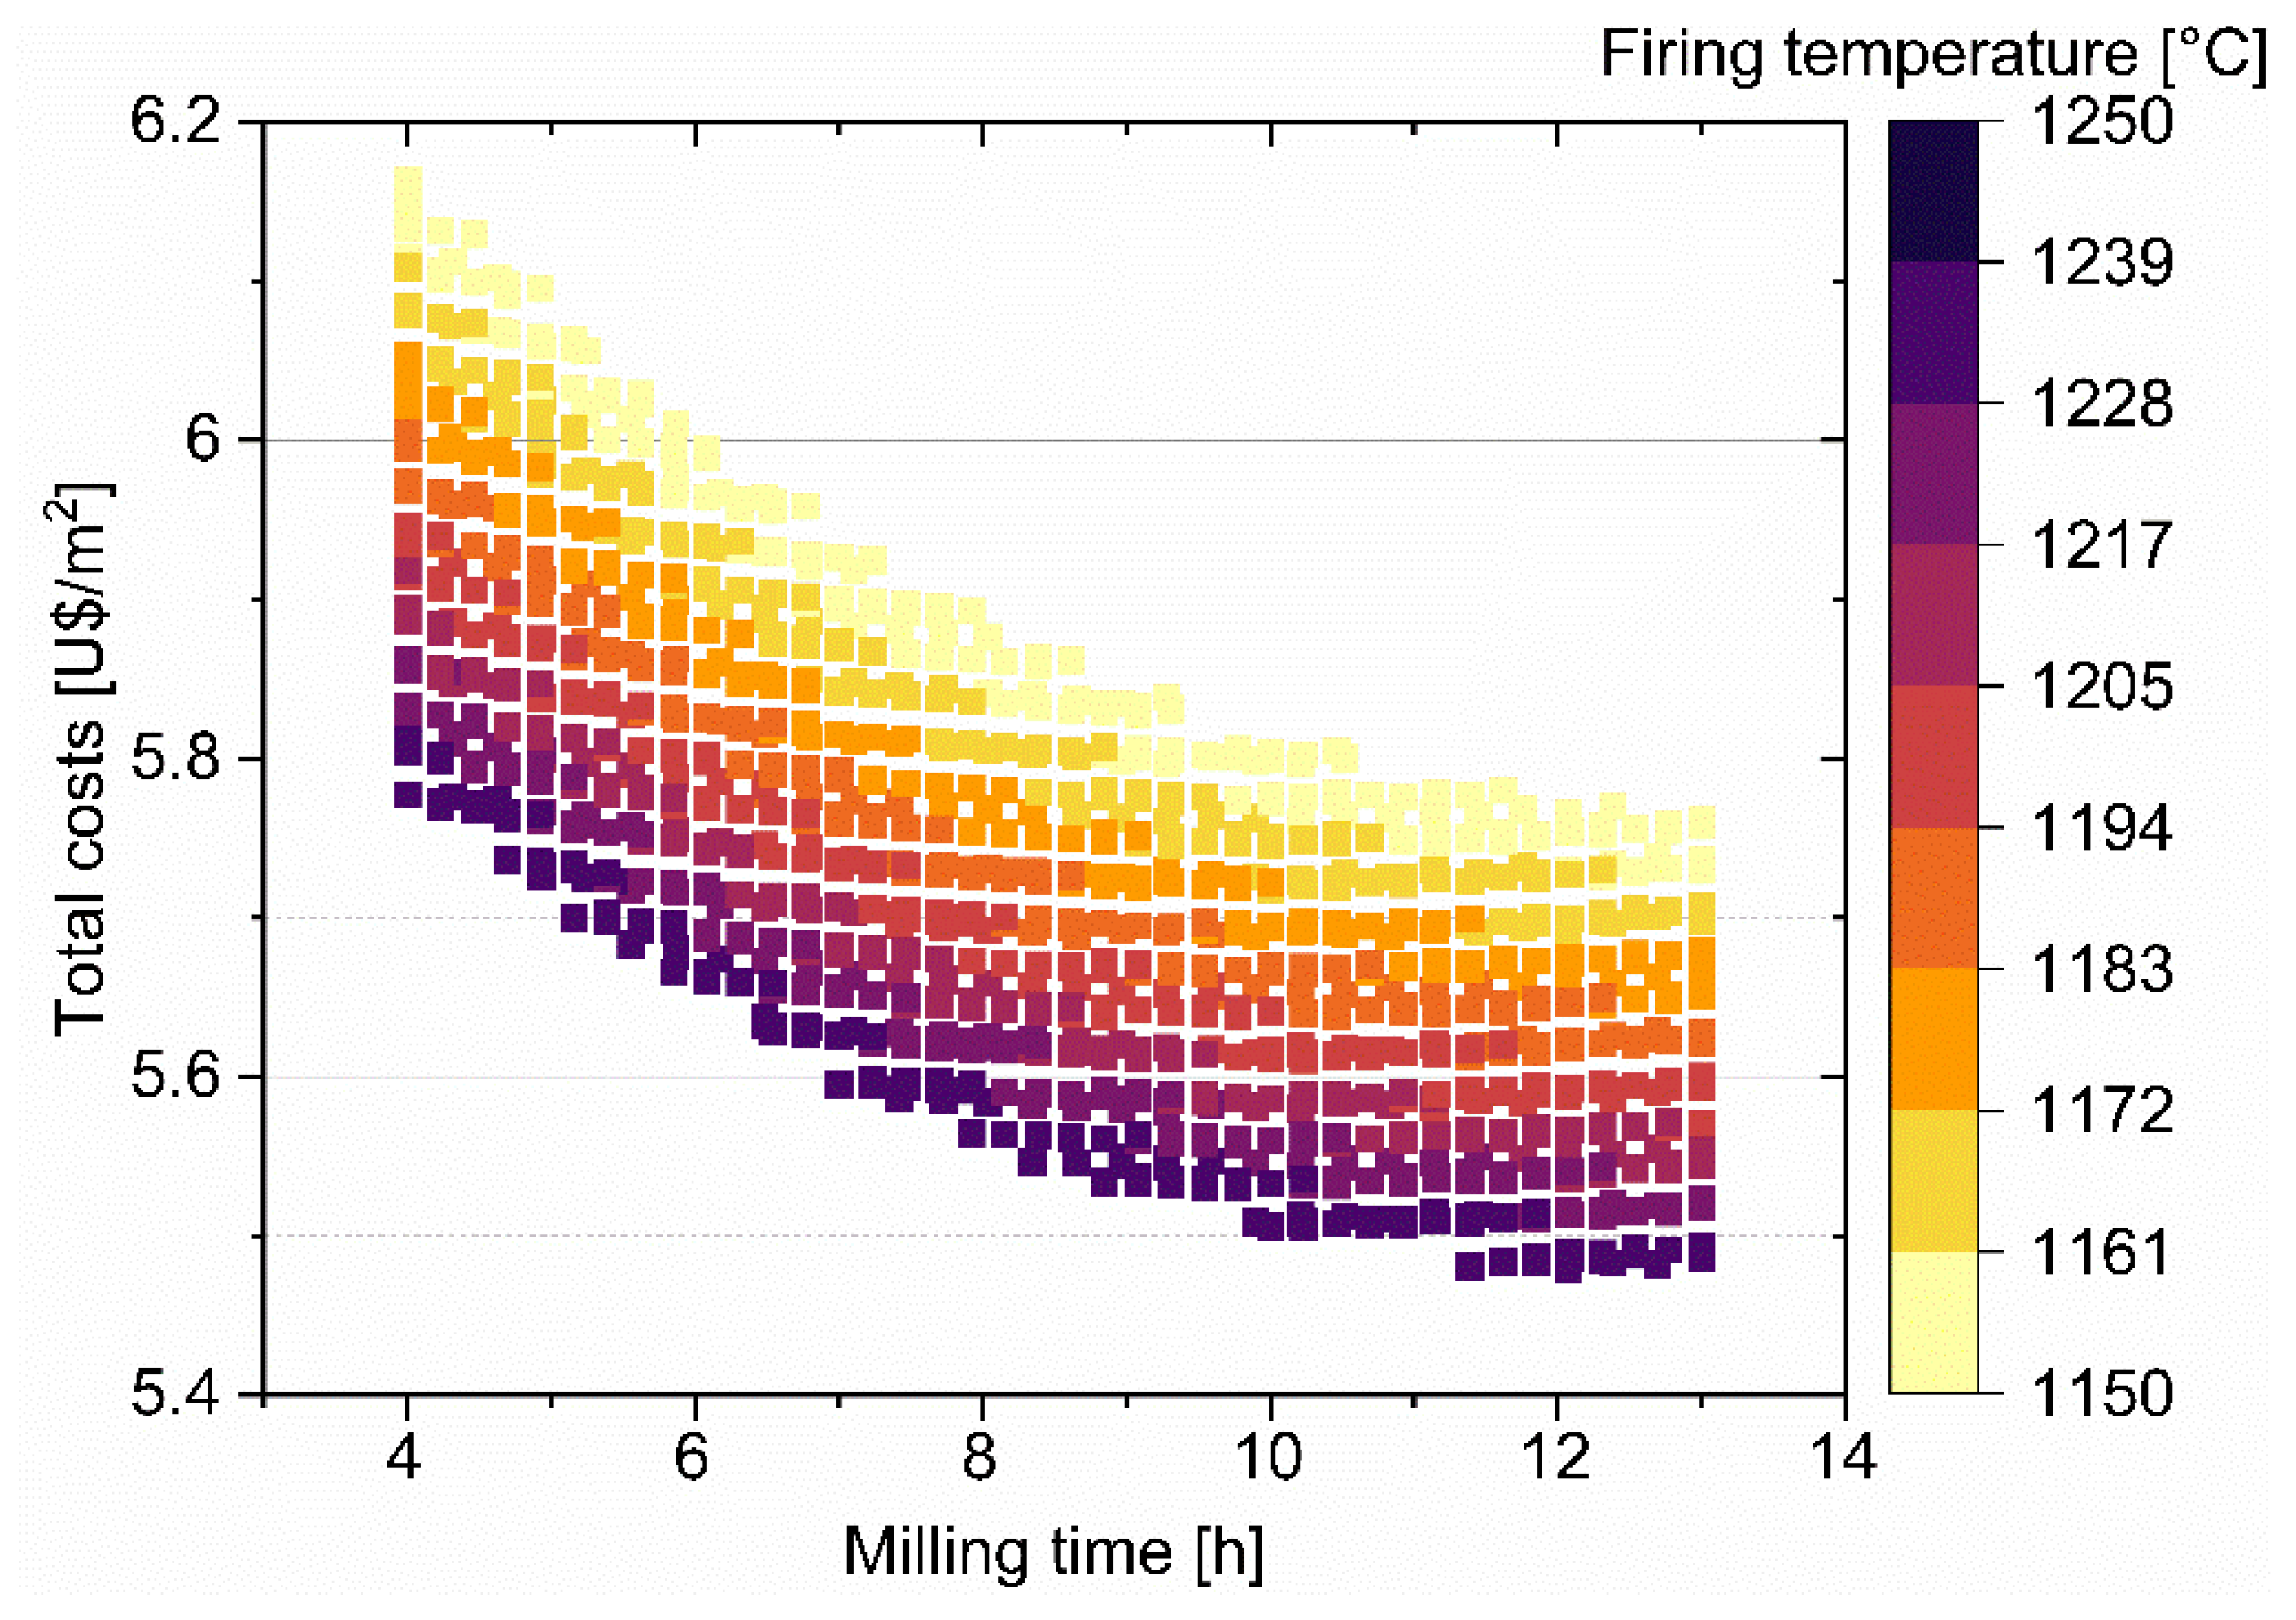
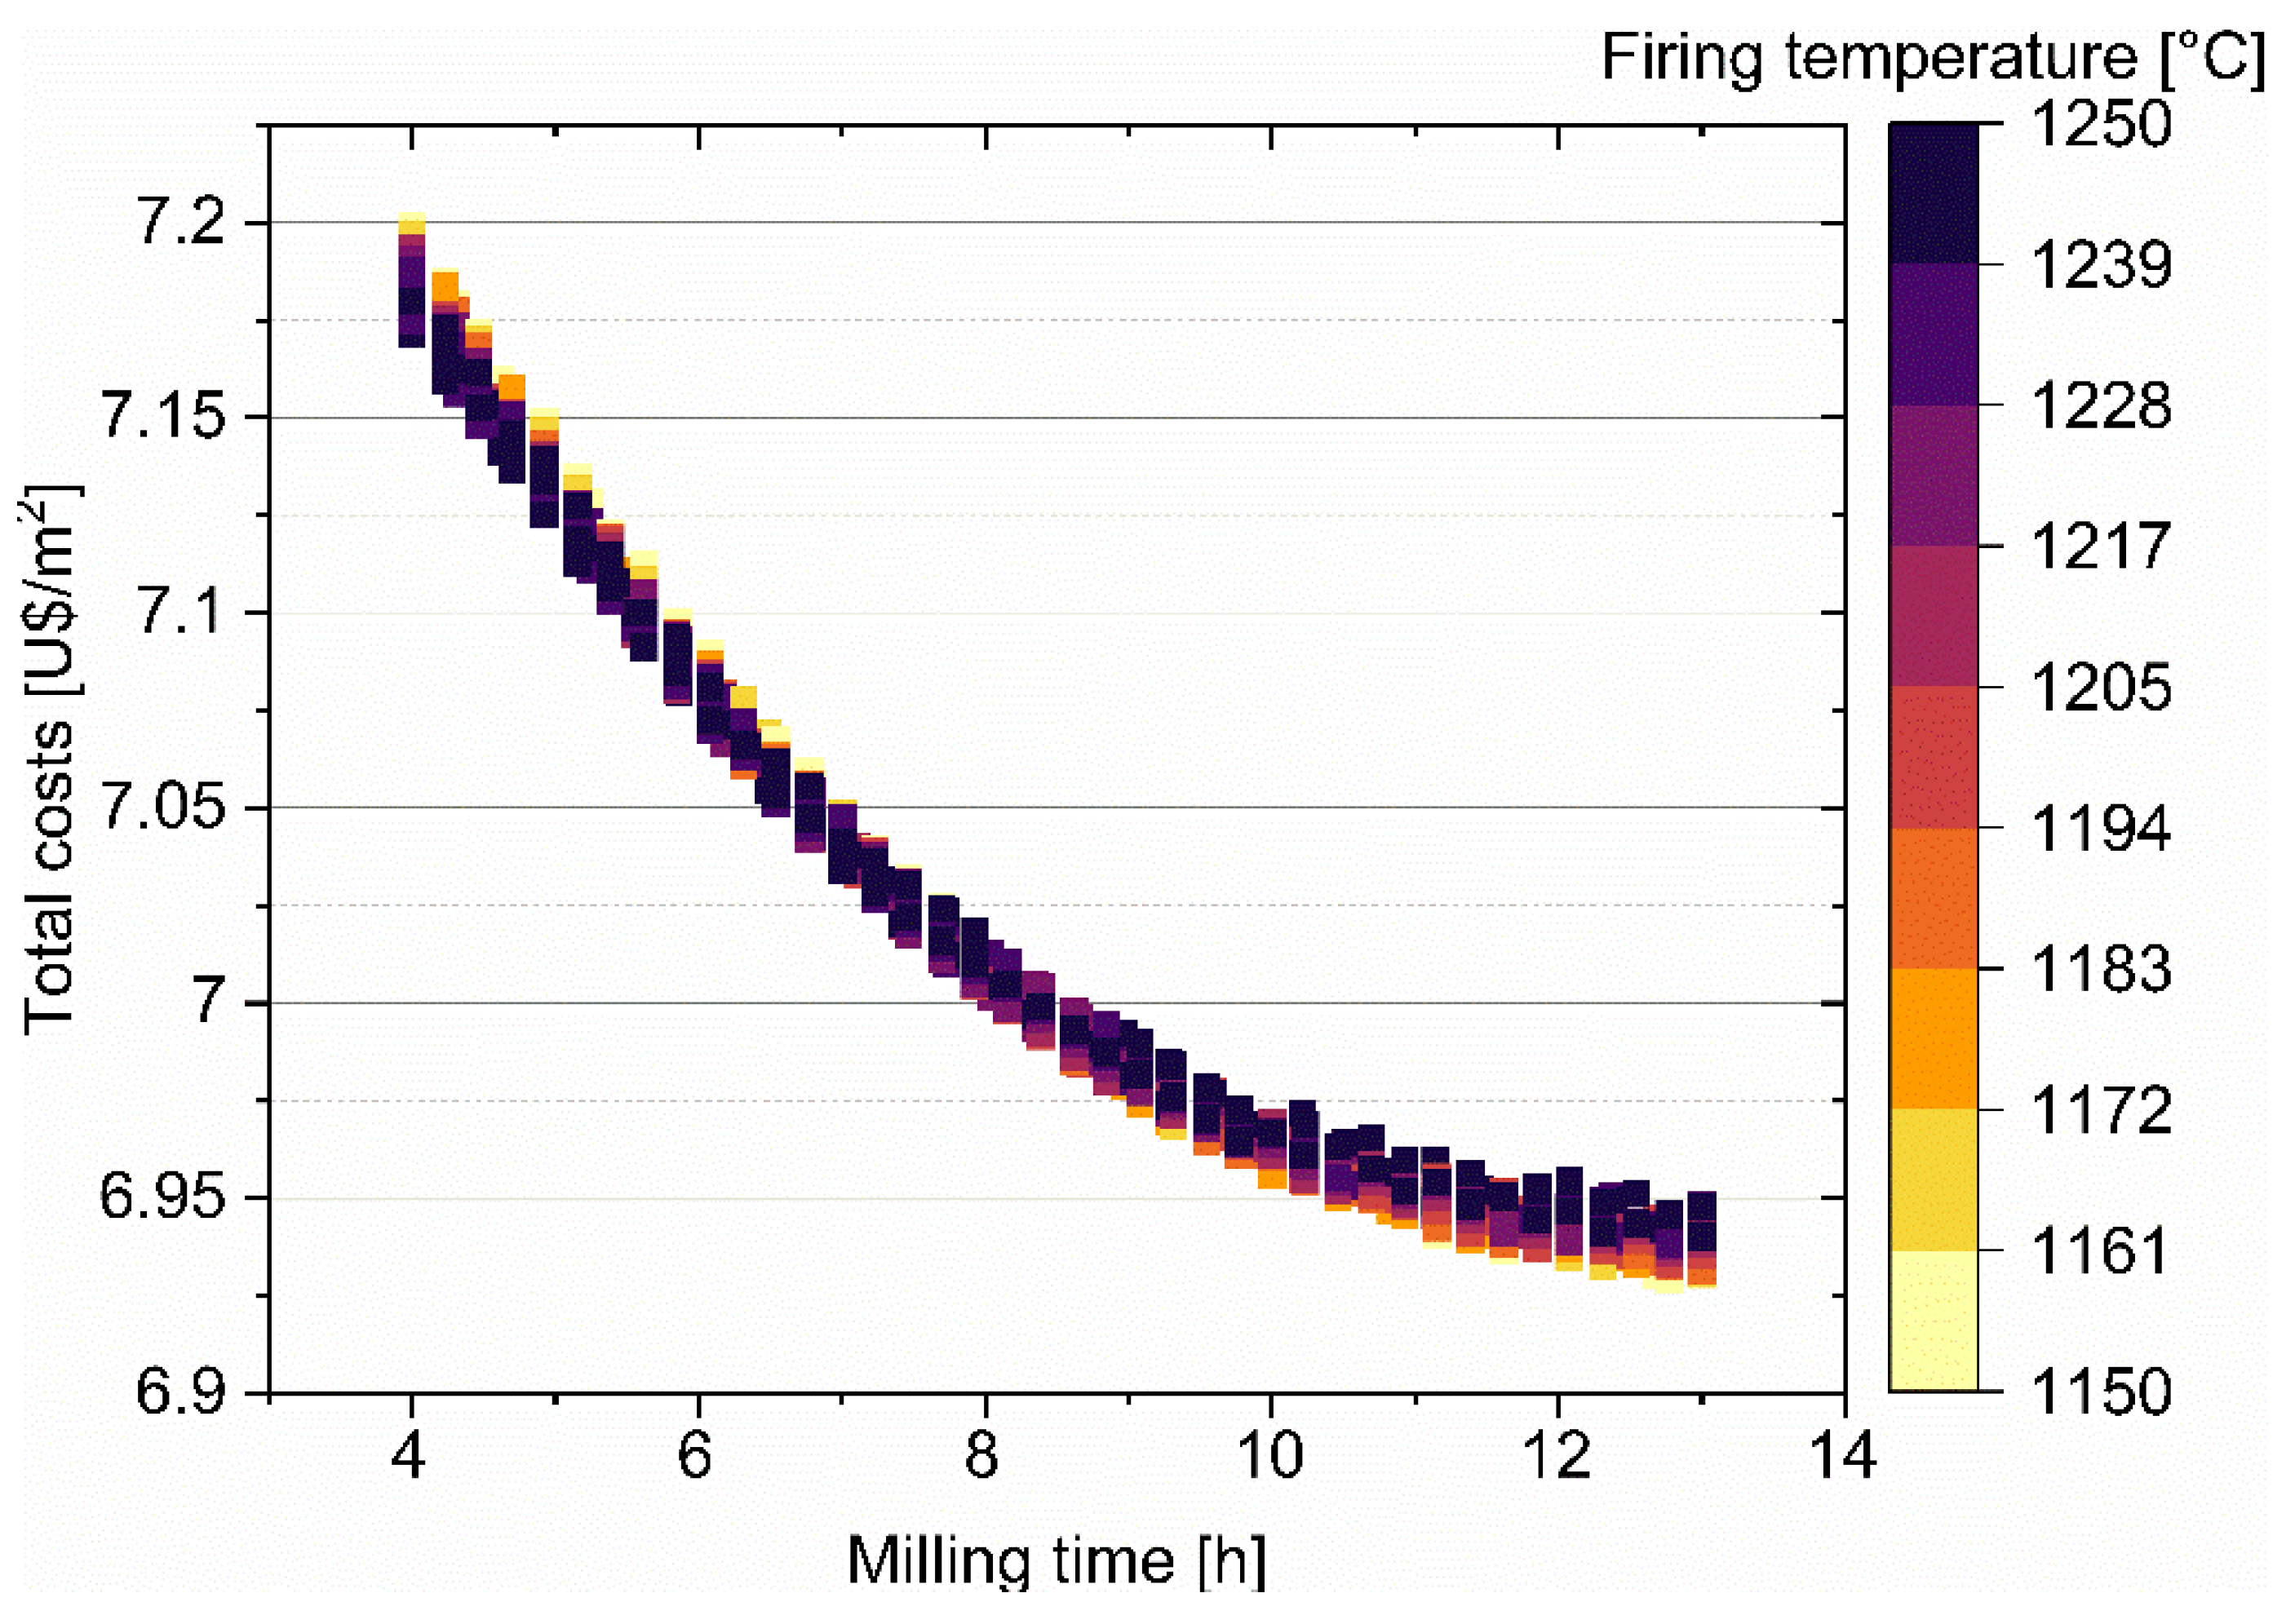
| Variable | Value | Units | |
|---|---|---|---|
| Reference temperature | 1190 | ºC | |
| Specific weight of the tile | 20 | kg/m2 | |
| Mass ratio of combustion fumes and dilution air to the amount of tiles | 2.15 | - | |
| Specific heat capacity of combustion fumes | 0.25 | kcal/kg·°C | |
| Specific heat capacity of the tiles | 0.22 | kcal/kg·°C | |
| Lower heating value of natural gas | 8500 | kcal/Nm3 | |
| Endothermic reactions energy | 50 | kcal/kg | |
| Required gas flow for empty kiln | 218.52 | Nm3/h | |
| Kiln length | 150 | m | |
| Kiln width | 2.5 | m |
| Minimum value | Maximum value | Unit | |
|---|---|---|---|
| Milling time | 4 | 13 | h |
| Firing temperature | 1150 | 1250 | ºC |
| Total firing cycle time | 24 | 60 | min |
| Brazil | Spain | Units | |
|---|---|---|---|
| 28.5 | 28.5 | USD/ton | |
| 475 | 475 | USD/ton | |
| 0.0665 | 0.0497 | USD/kWh | |
| 0.076 | 0.0606 | USD/kg of dried material | |
| 0.7733 | 1.5609 | USD/Nm3 | |
| - | 16.58 | USD/ton CO2 |
Disclaimer/Publisher’s Note: The statements, opinions and data contained in all publications are solely those of the individual author(s) and contributor(s) and not of MDPI and/or the editor(s). MDPI and/or the editor(s) disclaim responsibility for any injury to people or property resulting from any ideas, methods, instructions or products referred to in the content. |
© 2023 by the authors. Licensee MDPI, Basel, Switzerland. This article is an open access article distributed under the terms and conditions of the Creative Commons Attribution (CC BY) license (http://creativecommons.org/licenses/by/4.0/).


