1. Introduction
Over the last decades, developments in the synthesis of novel polymers and the fabrication of polymer-based materials have turned them into key components of our daily lives. The research is ever-growing in the pursuit of polymer-based materials with enhanced properties. Chain connectivity endows macromolecules with unique properties compared to monoatomic systems [
1,
2]. Describing polymer conformations and configurations statistically and understanding how these are connected to macroscopic properties are of paramount importance in technology and industry [
3,
4]. In parallel, many aspects of the phase behavior and self-organization of general atomic and particulate systems remain unknown or poorly understood. The analysis becomes a great deal harder when macromolecular systems are tackled. Advances in experimental, theoretical, and simulation methods continually enrich our fundamental knowledge of the phenomenon in a wide range of physical systems [
5,
6,
7,
8,
9,
10,
11]. For example, theoretical models have been developed to predict the effect of the processing conditions on the phase transition in order to analyze the final morphologies [
12,
13]. Advances in the synthesis and characterization of colloidal and granular systems have provided significant insights on the phase behavior of monomeric and polymeric systems, especially given their simplicity and large size compared to traditional polymers [
14,
15,
16,
17,
18,
19,
20,
21,
22]. Simulations can further aid in the research studies of phase transition given the constant advances at the level of hardware and software, starting from the traditional approaches at the molecular level based on Molecular Dynamics (MD) or Monte Carlo (MC) algorithms [
23,
24,
25,
26,
27].
The hard-sphere model is frequently used in the study of crystallization due to its simplicity and athermal nature, despite the obvious disadvantage of lacking chemical detail. Through molecular dynamics (MD) simulations, early and pioneering works have reported the entropy-driven crystallization of systems of hard spheres [
12,
28] once the melting point
is reached [
29] and given sufficient time for the observation of the phenomenon [
30,
31]. For individual hard spheres, the crystal expected to be obtained in experiments or simulations should be the face centered cubic (FCC), as it is slightly more stable thermodynamically than the hexagonal close-packed (HCP) one [
32,
33,
34]. However, random hexagonal close packing (RHCP) is almost always observed due to the small free energy of stacking faults [
35]. Thus, crystal perfection in the form of pure FCC crystals is rarely encountered in computer simulations [
36,
37].
The mechanism of crystallization of hard colloidal polymers [
37,
38,
39,
40,
41,
42,
43,
44,
45] differs substantially from that of traditional polymers, the latter as revealed in x-ray scattering studies of short alkane chains [
46,
47,
48], and in MD [
49,
50,
51,
52] or MC [
39,
53] simulations. Just as for monomeric athermal hard spheres, off-lattice MC simulations have shown that random packings of fully flexible linear chains of tangent hard spheres are able to crystallize at high volume fractions through an entropy-driven mechanism, very similar to the one of monomeric analogs [
37,
40,
41,
42,
54]. Extremely long simulations [
37] have shown the FCC polymorph to be the stable one for fully flexible chains of tangent hard spheres. In shorter simulations, an RHCP phase with a unique stacking direction [
40,
41,
42] appears most often. In spite of the similarities to monomeric counterparts, athermal polymer crystallization shows unique characteristics: The critical volume fraction for the phase transition (melting point) for the fully flexible (freely-jointed, FJ) chains of tangent hard spheres,
(> 0.56), is higher than the melting point of monomers. Monomeric systems present diverse crystal morphologies, ranging from single FCC or HCP structures to close-stacked packings with random directions where twin defects, associated with the formation of fivefold (FIV) symmetry structures, kinetically frustrate crystallization [
55,
56]. However, both the FCC or RHCP crystals of tangent hard-sphere chains are usually free of twin defects due to a conformational entropic barrier [
57]. It has been established that the phase transition and the ordered morphologies of hard-sphere chains are affected insignificantly by chain length, but are sensitive to factors such as gaps in bond lengths [
43,
58], the presence of surfaces/confinement [
44,
59,
60] and chain stiffness [
61,
62,
63,
64].
For semi-flexible polymers, the rigidity of the chains is generally implemented in molecular simulations through bending [
65,
66,
67,
68,
69,
70,
71,
72] and/or torsional [
71] potentials. A common topic of study about the phase behavior of semi-flexible polymers is the orientational (nematic) ordering of the chains. According to Onsager, thin and infinitely long rigid rods undergo a transition from the isotropic to the nematic phase which is driven by entropy, resulting from the competition between translational and orientational ordering [
73]. Building on this, Bolhuis and Frenkel mapped out the complete phase diagram of hard spherocylinders as a function of shape anisotropy [
74]. The long-range, nematic order in solutions of semi-flexible polymers depends on the size ratio of the chain [
75,
76,
77]. For tangent hard-sphere chains in the rod limit, the transition occurs at high concentrations, still lower than the solidification of the system [
78,
79]. Theories have been developed [
80,
81,
82] and studies have been conducted [
83,
84,
85,
86,
87] under various conditions on the isotropic-to-nematic transition of semi-flexible chains. Nguyen
et al. studied the effect of chain stiffness and temperature on the competition between crystallization and glass formation for unentangled semi-flexible polymer melts [
61,
62]. Shakirov and Paul studied the crystallization in melts of short, semi-flexible hard-sphere chains employing Monte Carlo simulations [
63,
64]. In their works, rod-like polymer melts undergo a first-order transition at a density lower than a melt of hard-sphere monomers or flexible hard-sphere chains [
64]. During crystallization, the orientational ordering (nematic) transition is accompanied by a 2-D translational ordering transition synchronously in the plane perpendicular to the chains. These orderings induce the formation of hexagonal crystal planes [
63].
Although rod-like chains have been extensively researched in the literature, the corresponding body of work on semi-flexible chains with different bending angles is very limited. Recent works studying the jamming and solidification of semi-flexible polymers employing the freely-rotating model varying the fixed bending angle through MD simulations have revealed the different mechanisms in solidification depending on the equilibrium bending angle,
[
88,
89].
The present manuscript analyzes the phase behavior of semi-flexible linear chains of tangent hard spheres, as a function of equilibrium bending angle and packing density. This is achieved through extensive Monte Carlo (MC) simulations using the Simu-D simulator-descriptor [
90], built around polymer-oriented algorithms and especially chain-connectivity-altering moves (CCAMs) [
91,
92]. Motivated by previous studies on the crystallization of linear, fully flexible chains of hard spheres [
40,
41,
42,
43,
44,
93,
94], we extend the research by the inclusion of chain stiffness via a bending potential that depends on a bending constant,
, and an equilibrium bending angle,
. Global order, at the level of chains, is quantified through the orientational (nematic) order parameter,
q. Local order, at the level of monomers, is gauged through the Characteristic Crystallographic Element (CCE) norm descriptor [
95,
96]. Compiling the results of all the simulated systems, we present a phase diagram that reflects the combined effect of packing density and chain stiffness on the local and global order of the semi-flexible systems.
This article is organized as follows: in
Section 2 we describe the molecular model, and the simulated systems and we briefly explain the descriptors to gauge long-range order and local structure.
Section 3 presents the results on the phase behavior of the simulated semi-flexible systems. Finally, we summarize the main conclusions and discuss current efforts in
Section 4.
3. Results
The phase behavior of polymer chains under the effect of the chain stiffness is the main focus of this work, emphasizing the long-range, orientational (nematic) ordering and the local structure.
Prior to simulation data being analyzed in a post-processing step, a preliminary visual inspection of the initial and resulting system configurations is performed. In the case of rod-like chains (
), the visual inspection of the initial configurations, as presented in
Figure 3, suggests a transition from an isotropic (
φ = 0.10 and 0.20) to a nematic phase (
φ = 0.30 and 0.50) with increasing packing density, i.e. the rod-like chains align in the system along the common nematic director. This transition happens at a packing density that is significantly lower than for solidification, in perfect qualitative agreement with past independent works on similar systems [
73,
78,
79].
Figure S2 (in Supporting Information) shows computer-generated snapshots of bulk system configurations at the end of the simulation for semi-flexible hard-sphere systems at
φ = 0.60.
3.1. Global Orientational Order
Following the preliminary visual inspection of the initial configurations for the rod-like chains (
), the long-range, orientational (nematic) ordering is analyzed through the second-order tensor
Q and the scalar order parameter
q, as explained in the previous section. The dependence of the nematic order parameter
q on packing density,
φ, is presented in
Figure 4 for all semi-flexible systems under study (
0, 60, 90, 108, and 120°), averaged over all frames of the equilibrated part of the simulation trajectory. In line with
Figure 3, rod-like chains of average length
Nav = 12 show a well-defined isotropic-nematic transition as concentration increases. This transition takes place in the interval 0.15 ≤
φ ≤ 0.20 and very closely resembles the prediction of Onsager’s theory. At higher volume fractions, chains form a prolate mesogen, nematic mesophase (PRO), as seen by the monotonically increasing value of
q. A perfect PRO phase (
q → 1) is established at packing densities approximately equal to
φ = 0.45. For the average lengths studied here (
Nav = 12), the transition from the isotropic to the nematic phase, ISO → PRO (i.e. nematic mesophase with prolate mesogens) for rod-like athermal chains occurs at significantly lower packing densities (
φnem ≈ 0.20) than the freezing (
) and melting (
) points of monomeric hard spheres.
Besides this expected isotropic-to-nematic transition exhibited by rod-like chains, a nematic mesophase with oblate mesogens, OBL, (q < 0) appears for semi-flexible chains with 90°. In contrast to the long-range orientational order of rod-like chains, the isotropic-to-oblate, ISO → OBL, transition takes place at φobl ≈ 0.57, which is higher than the melting point of HS.
For the remaining values of the equilibrium bending angles, each chain system remains in the isotropic phase in the whole concentration range. Still, a small peak is produced at very high packing densities that can be associated with chains primarily of 60°, taking some preferred directions, corresponding to values of the nematic order parameter of around q ≈ 0.15. This can be explained as the establishment of the FCC and HCP crystallites (see later discussion on local order) enforces specific bending angles which are compatible with these crystals. If such bending angles are not available through intra-chain arrangements, then the only other option is inter-chains ones, thus inducing alignment among chains at a local level.
In the case of semi-flexible chains with
, the left panel of
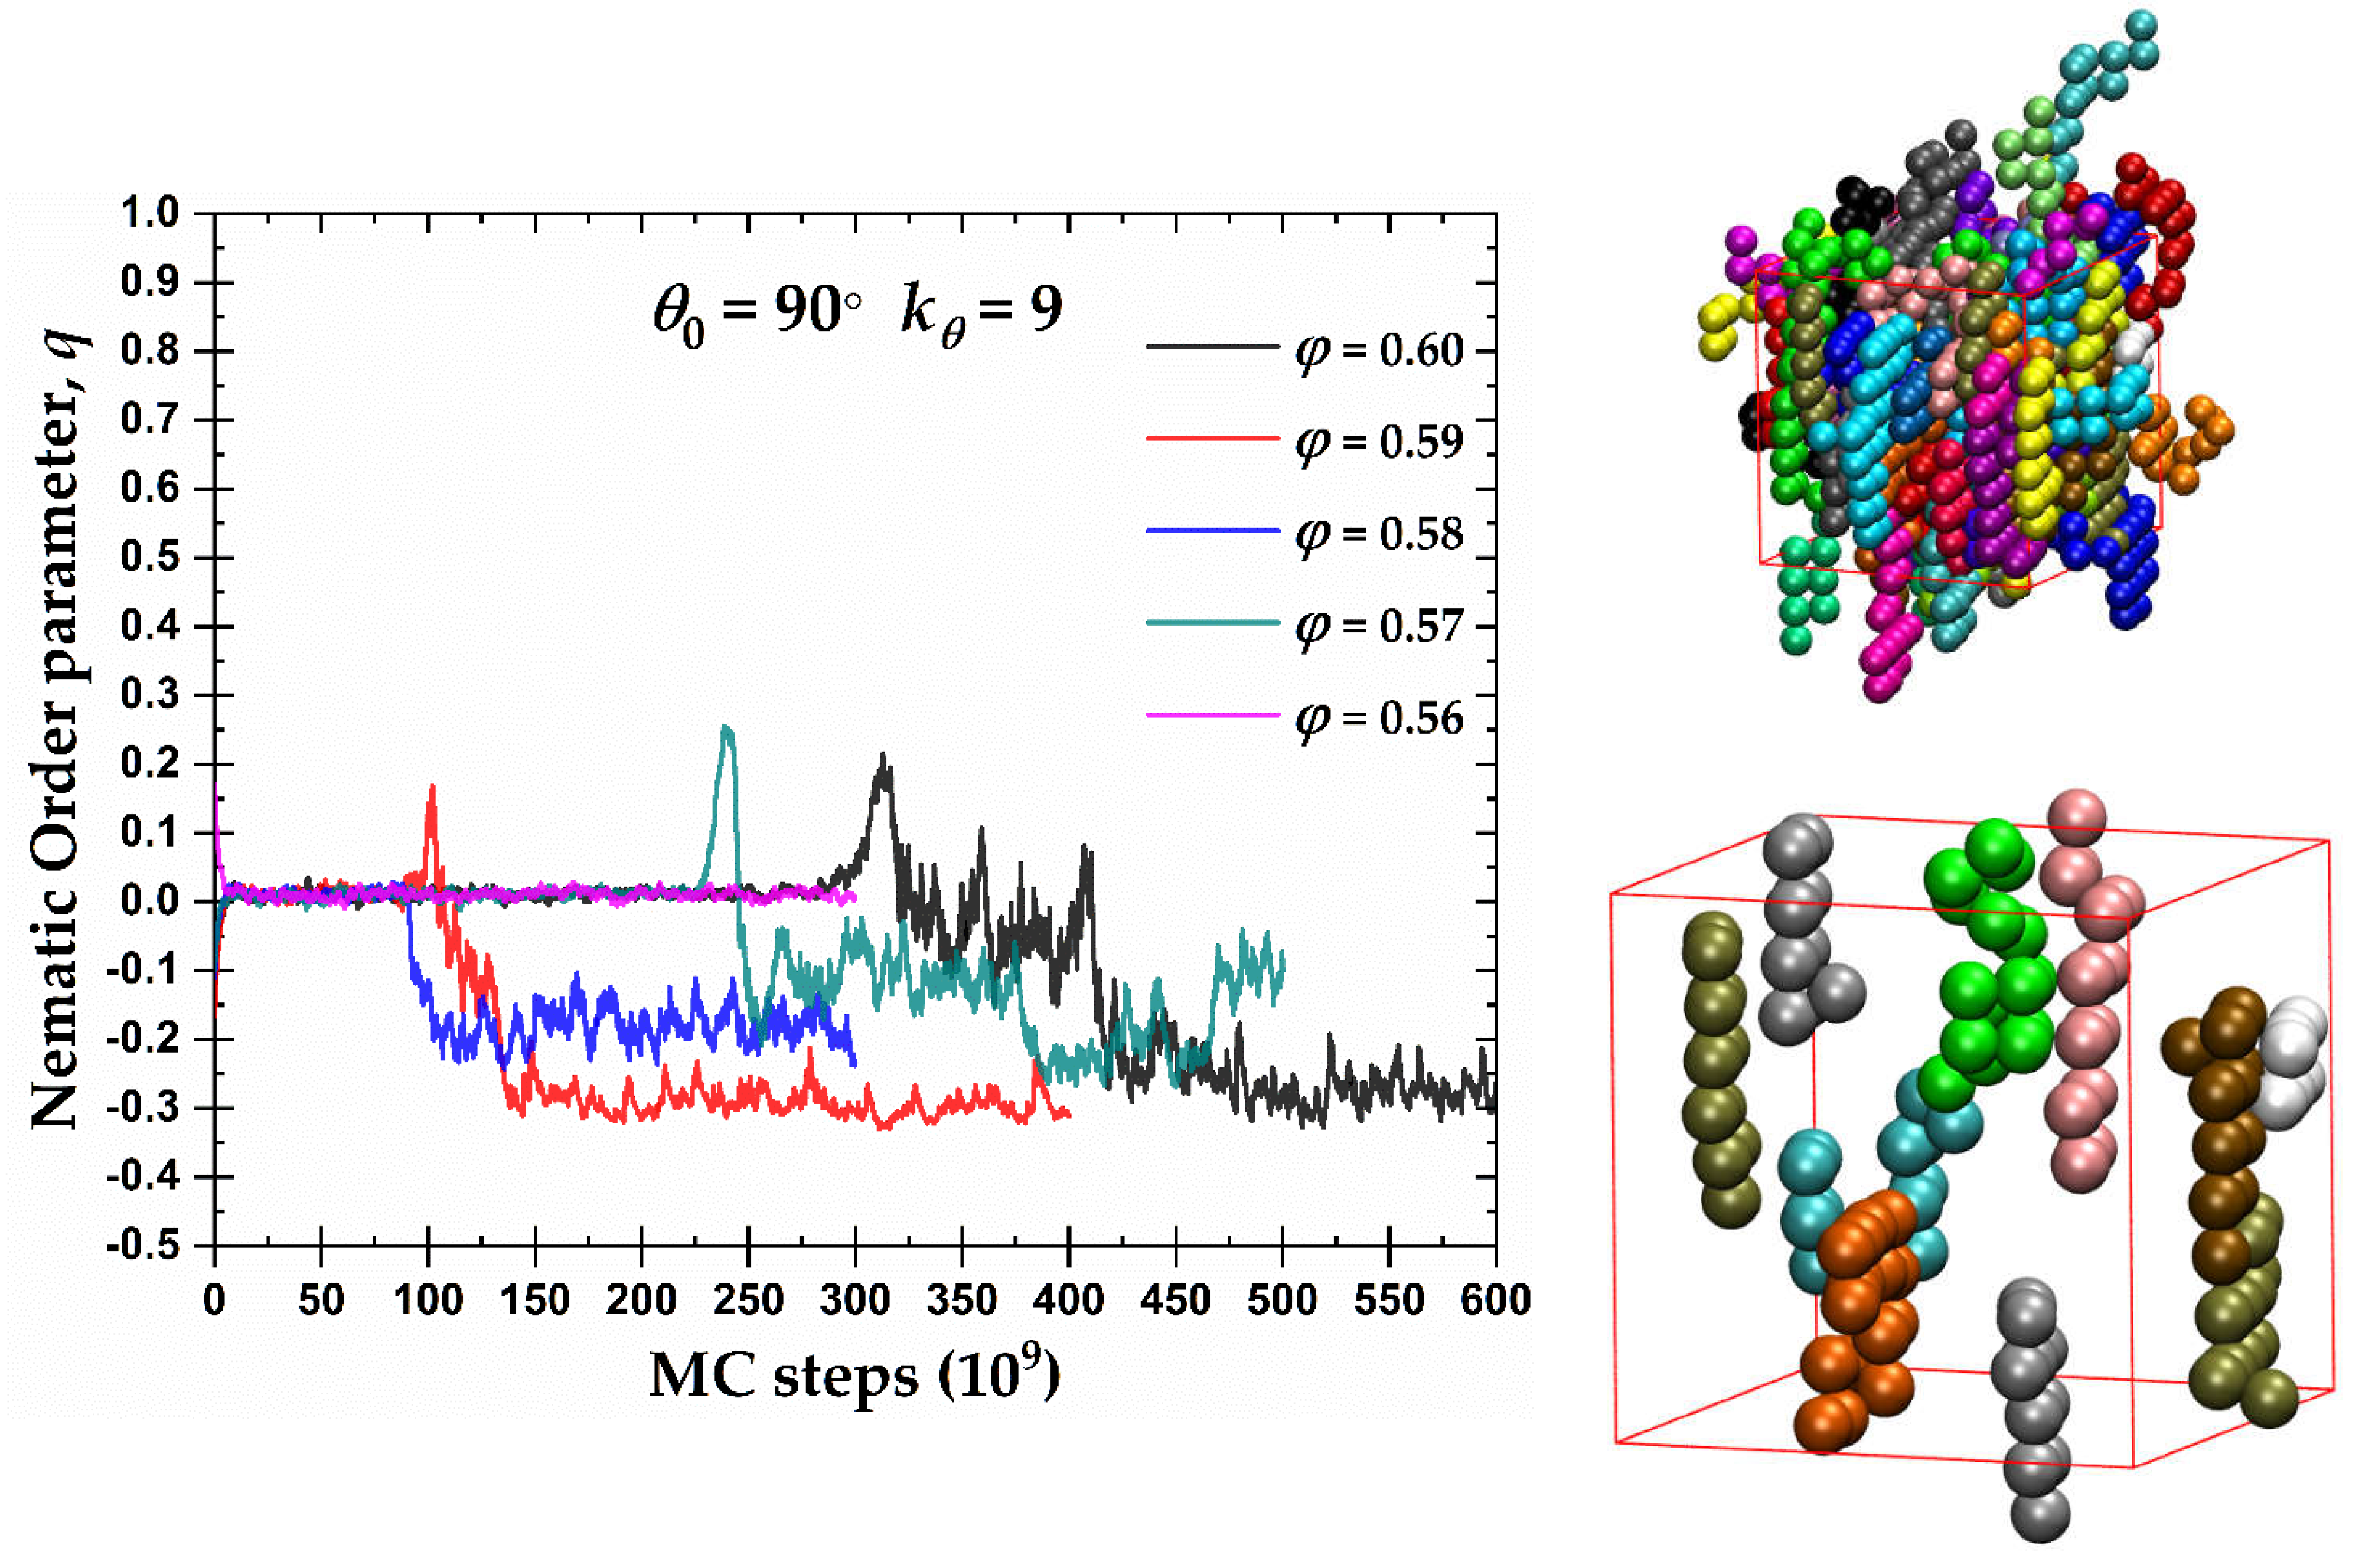
Figure 5 hosts the evolution of the exponential running average of the orientational order parameter,
q, as a function of MC steps for the packing densities where a certain degree of nematic order was observed in
Figure 4. A tendency for the formation of an oblate mesogen, nematic mesophase (OBL) is observed after sufficient simulation time. The degree of ordering of the oblate mesogens increases with volume fraction as indicated by
q approaching the ideal value
. Compared to crystallization at the level of monomers (see below), the ISO → OBL transition for
90° takes places with an equal or even slower rate. We should note here that “rate” used in the present manuscript has no physical meaning and it corresponds to the number of MC steps required to observe the phase transition. Thus, the nematic phase for the semi-flexible chains with
90° practically coincides with crystallization, i.e. self-organization at the local and global levels appears synchronized.
The right panels of
Figure 5 show semi-flexible chains with
90° at
φ = 0.59 at the end of the MC simulation, once the system has reached an OBL state. The top snapshot presents the unwrapped representation of the semi-flexible chains of the complete system. As in the previous snapshots, monomers are color-coded according to the parent chain. For clarity, the bottom snapshot contains only 10 randomly selected chains of the same system. The semi-flexible chains tend to form flat layers, interrupted occasionally by right-angle jumps between planes, consistent with
90°. These flat chain configurations have, in general, a common behavior that further explains the OBL phase in
Figure 4 and the left panel of
Figure 5.
3.2. Local Order: Crystal Nucleation and Growth
Local structure is gauged through the CCE norm descriptor [
95,
96]. For consistency with our past studies on flexible chains of hard spheres, we employ a threshold of
to label a site as
X-type, where
X is the reference crystal or local symmetry. In the present work given that no appreciable population of BCC or HEX sites is detected in any of the simulated systems,
X corresponds to HCP, FCC, and FIV. In the continuation and throughout the manuscript, the corresponding colors to be used for the representation of the HCP, FCC, and FIV sites (in snapshots) and curves (in figures) are blue, red, and green, respectively. The results from the semi-flexible systems are also compared with the ones of fully flexible (freely-jointed) chains of tangent hard spheres simulated and analyzed through the Simu-D software under the same conditions of volume fraction and average chain length [
40,
41,
42,
93,
94].
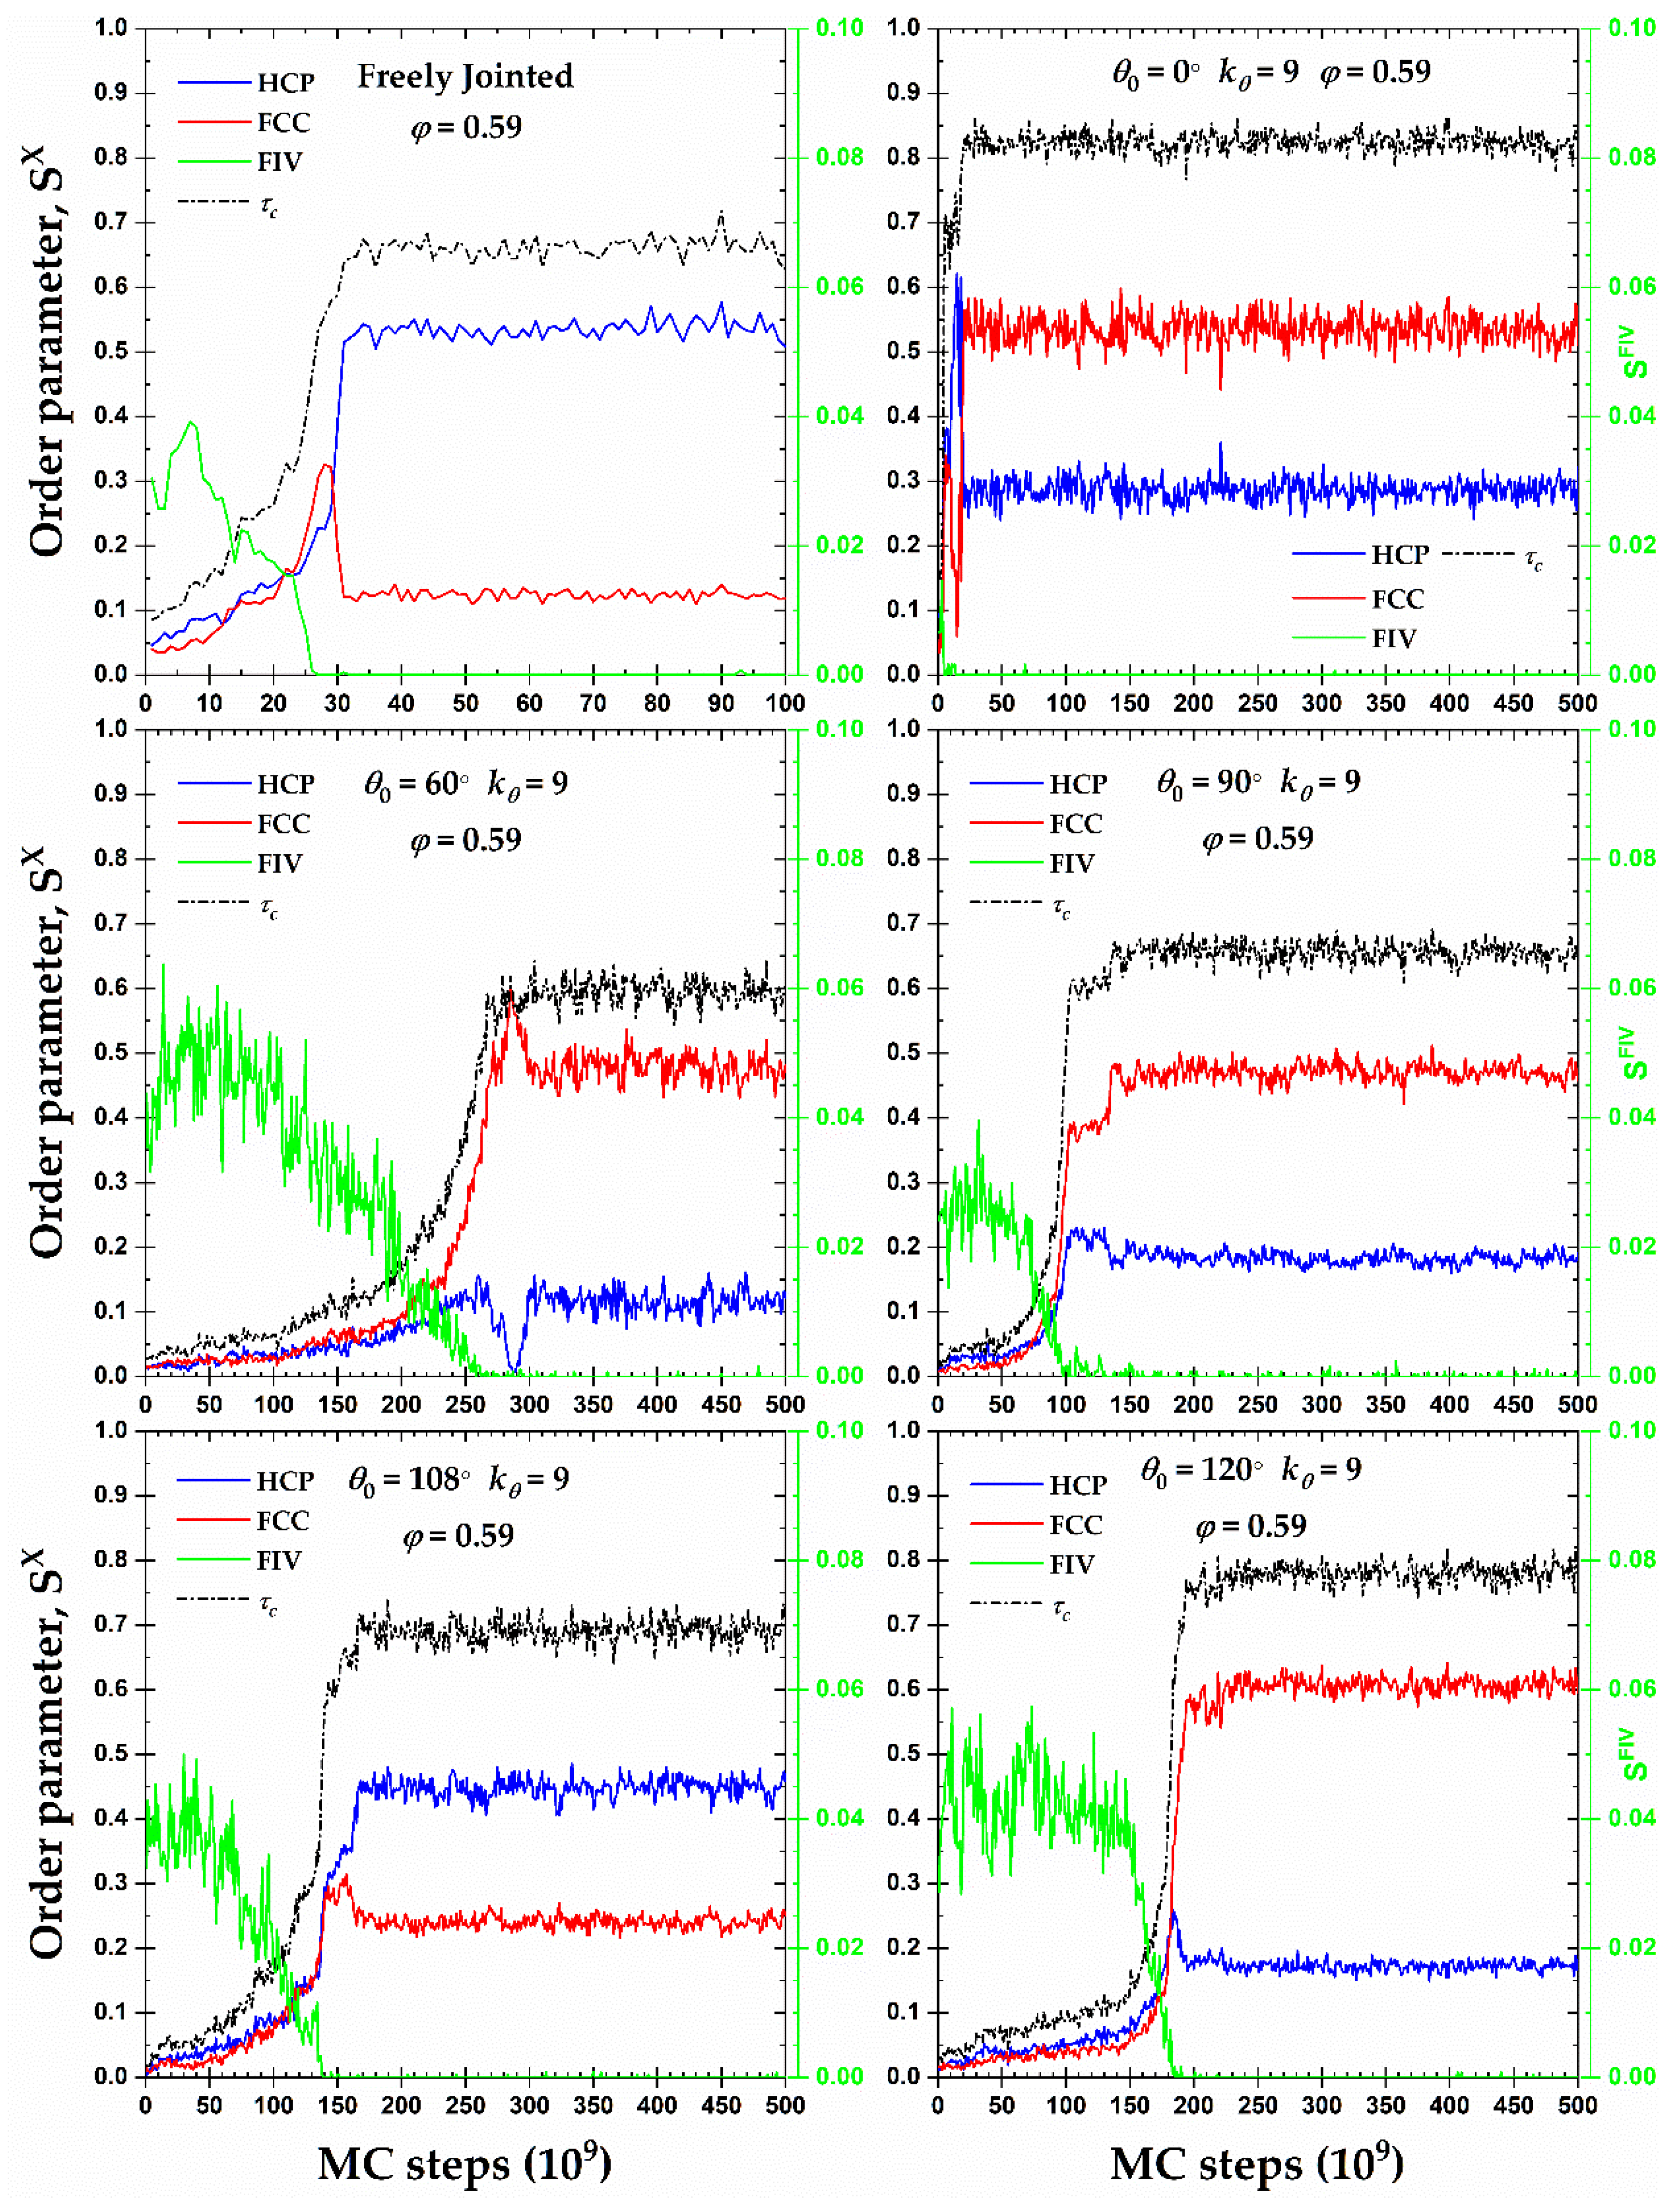
Figure 6 presents the CCE-based order parameters for HCP (
), FCC (
), and FIV (
), along with the degree of crystallinity,
, as a function of MC steps at a packing density
φ = 0.59 for all semi-flexible systems including the fully flexible one as reference. This volume fraction is higher than the melting transition of freely-jointed hard-sphere chains as established in [
37,
40,
41,
42,
54]. An inspection of all panels shows clearly that the mechanism of phase transition, here in the form of crystallization, is very similar and rather independent of the equilibrium bending angle. Initial packings are amorphous (AMO) as the fraction of sites with non-ordered local structure is vastly dominant: the percentage of close packed sites does not exceed 5% and, in most cases, the FIV population is commensurate or even exceeds the combined HCP+FCC one. This initial state of the AMO athermal chain packings agrees with past works on dense monomeric and polymer assemblies [
42,
45,
55,
56,
57]. Out of all systems, the rod-like one is characterized by the lowest population of FIV sites at the beginning as FIV appears to be incompatible with the perfect nematic ordering exhibited by the chains at this range of volume fractions.
Once crystallites of HCP and FCC characters start growing, at almost identical rates, the fraction of FIV-like sites decreases gradually until it practically disappears. The structural competition, observed here for all semi-flexible chain systems, between the FIV local symmetry and crystallization in the form of HCP and FCC sites is in perfect match with identical observations in simulations of fully flexible [
37,
40,
41,
42,
43,
44,
45] and monomeric HS systems [
55,
56], including bead-spring chains under quenching [
61,
105]. Once the population of FIV sites is eliminated, a trend manifestly valid for all simulated packings, the relative fractions of the HCP and FCC crystals undergo a sharp variation which is followed by the establishment of the final, stable ordered structures of crystalline (CRY) character. The average degree of crystallinity in the final CRY phase ranges between 0.65 and 0.85 with the lowest and highest values corresponding to the fully flexible and rod-like chains, respectively. At
φ = 0.59, as seen in
Figure 6, all crystals contain appreciable fractions of FCC and HCP sites and no perfection is registered. Accordingly, one expects that the formed morphologies correspond to fivefold-free but defect-ridden RHCP crystals.
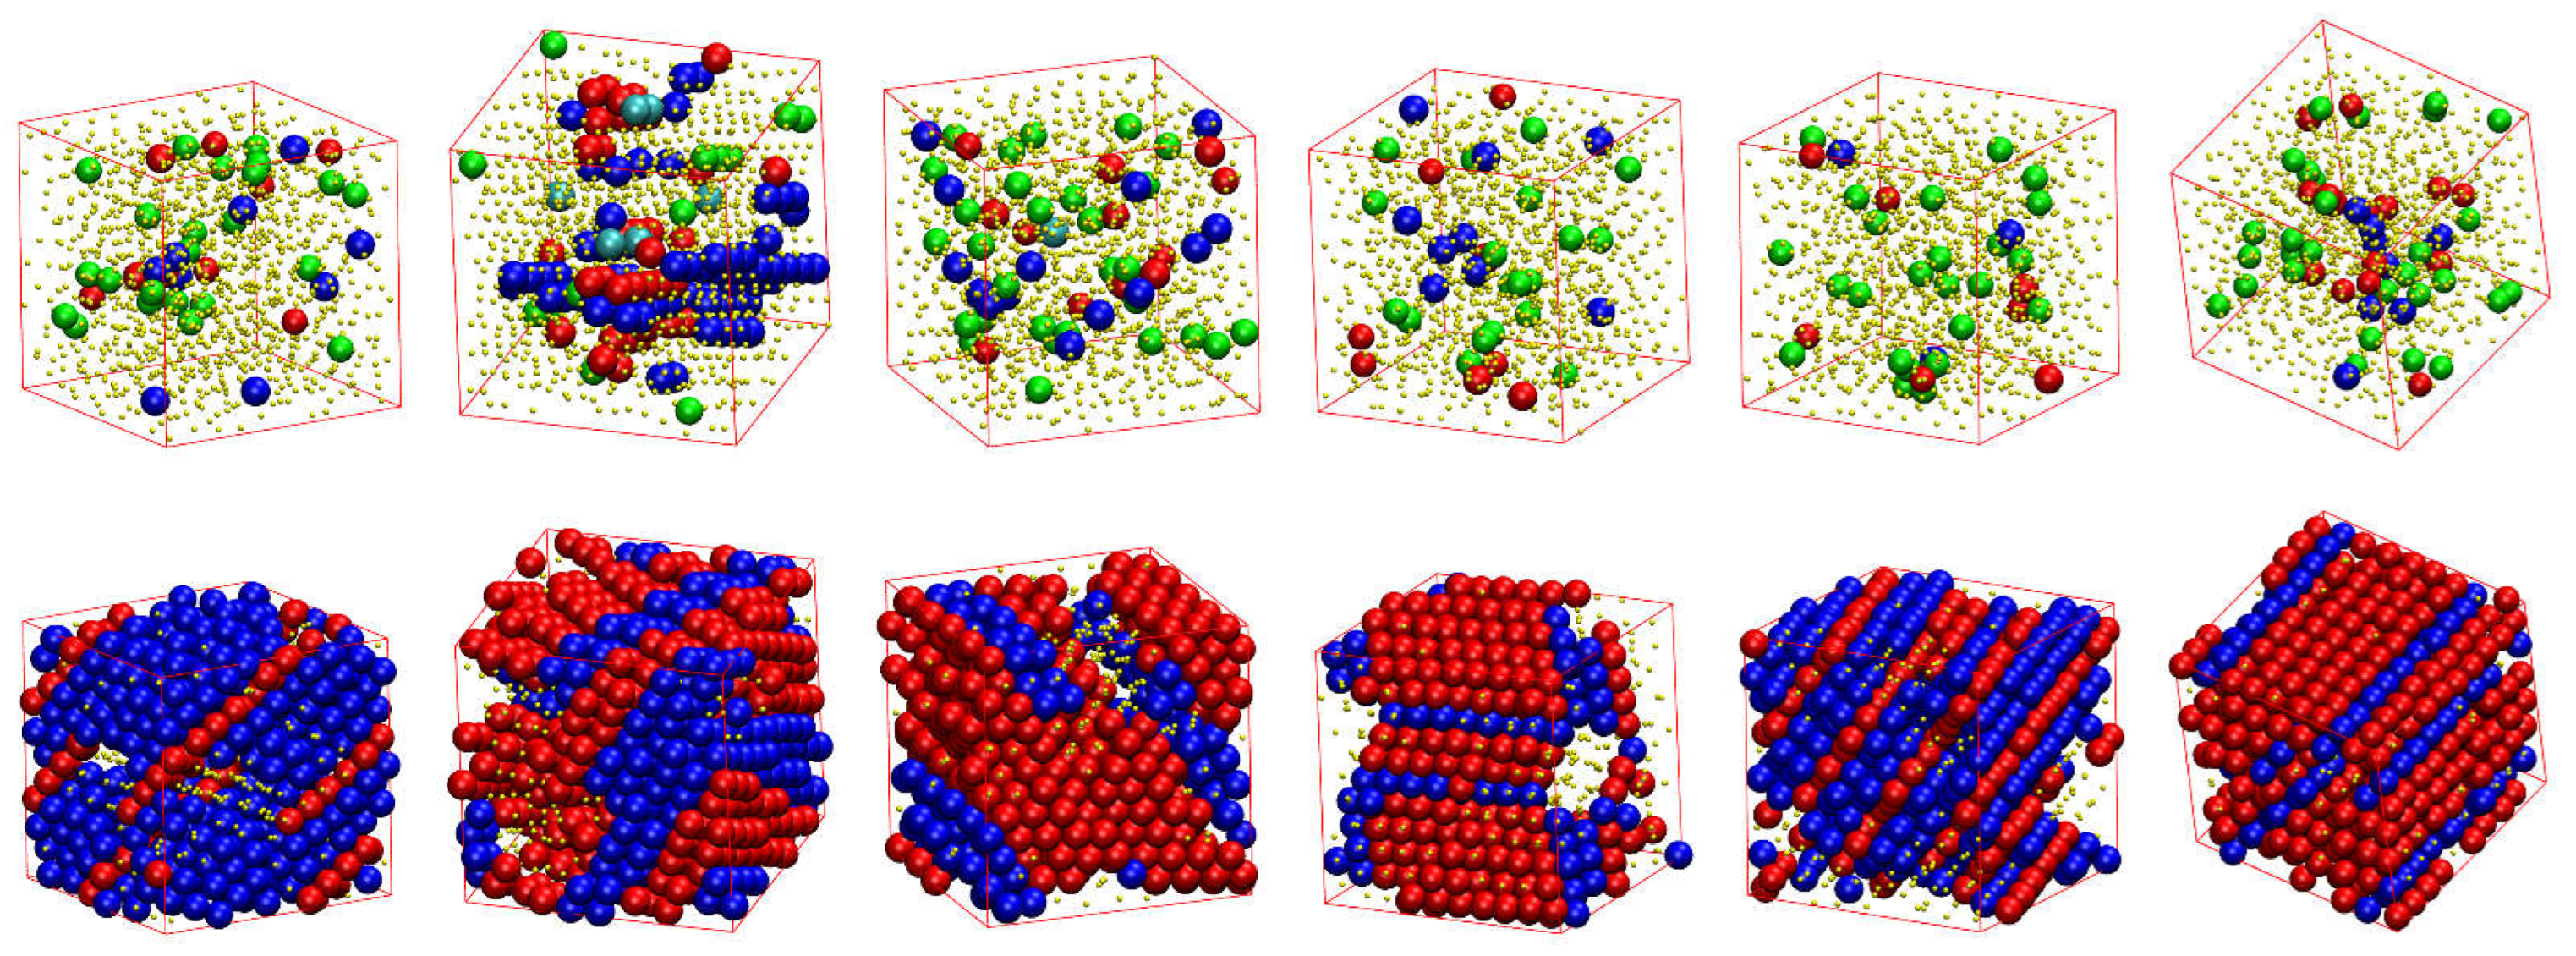
Figure 7 shows, for all systems whose phase transition is presented in
Figure 6, the snapshots at the beginning (top panels) and the end (bottom panels) of the corresponding MC simulations. As already quantified by the data in
Figure 6, all initial configurations show amorphous structures with a remarkable population of FIV-like sites. At the end of MC simulations, the crystalline phase of every system, both freely-jointed and semi-flexible ones, shows a stable configuration of mixed HCP/FCC structures, being defect-ridden and fivefold-free, exactly as expected by the fractions of sites in
Figure 6. In their majority, the semi-flexible chain packings form RHCP structures of alternating layers of unique FCC and HCP character with a single stacking direction, just like the freely-jointed systems. Additionally, semi-flexible systems can also form crystal structures with multiple, random stacking directions, as it is observed for the system with
.
The formation of RHCP crystals of mixed HCP/FCC structures, with unique or multiple stacking directions, is also observed for all the equilibrium bending angles studied at all packing densities where crystallization takes place.
Although the majority of the semi-flexible systems crystallize in RHCP crystals of mixed HCP/FCC layers, two important exceptions exist for the rod-like chains (
) at
φ = 0.58 and 0.60.
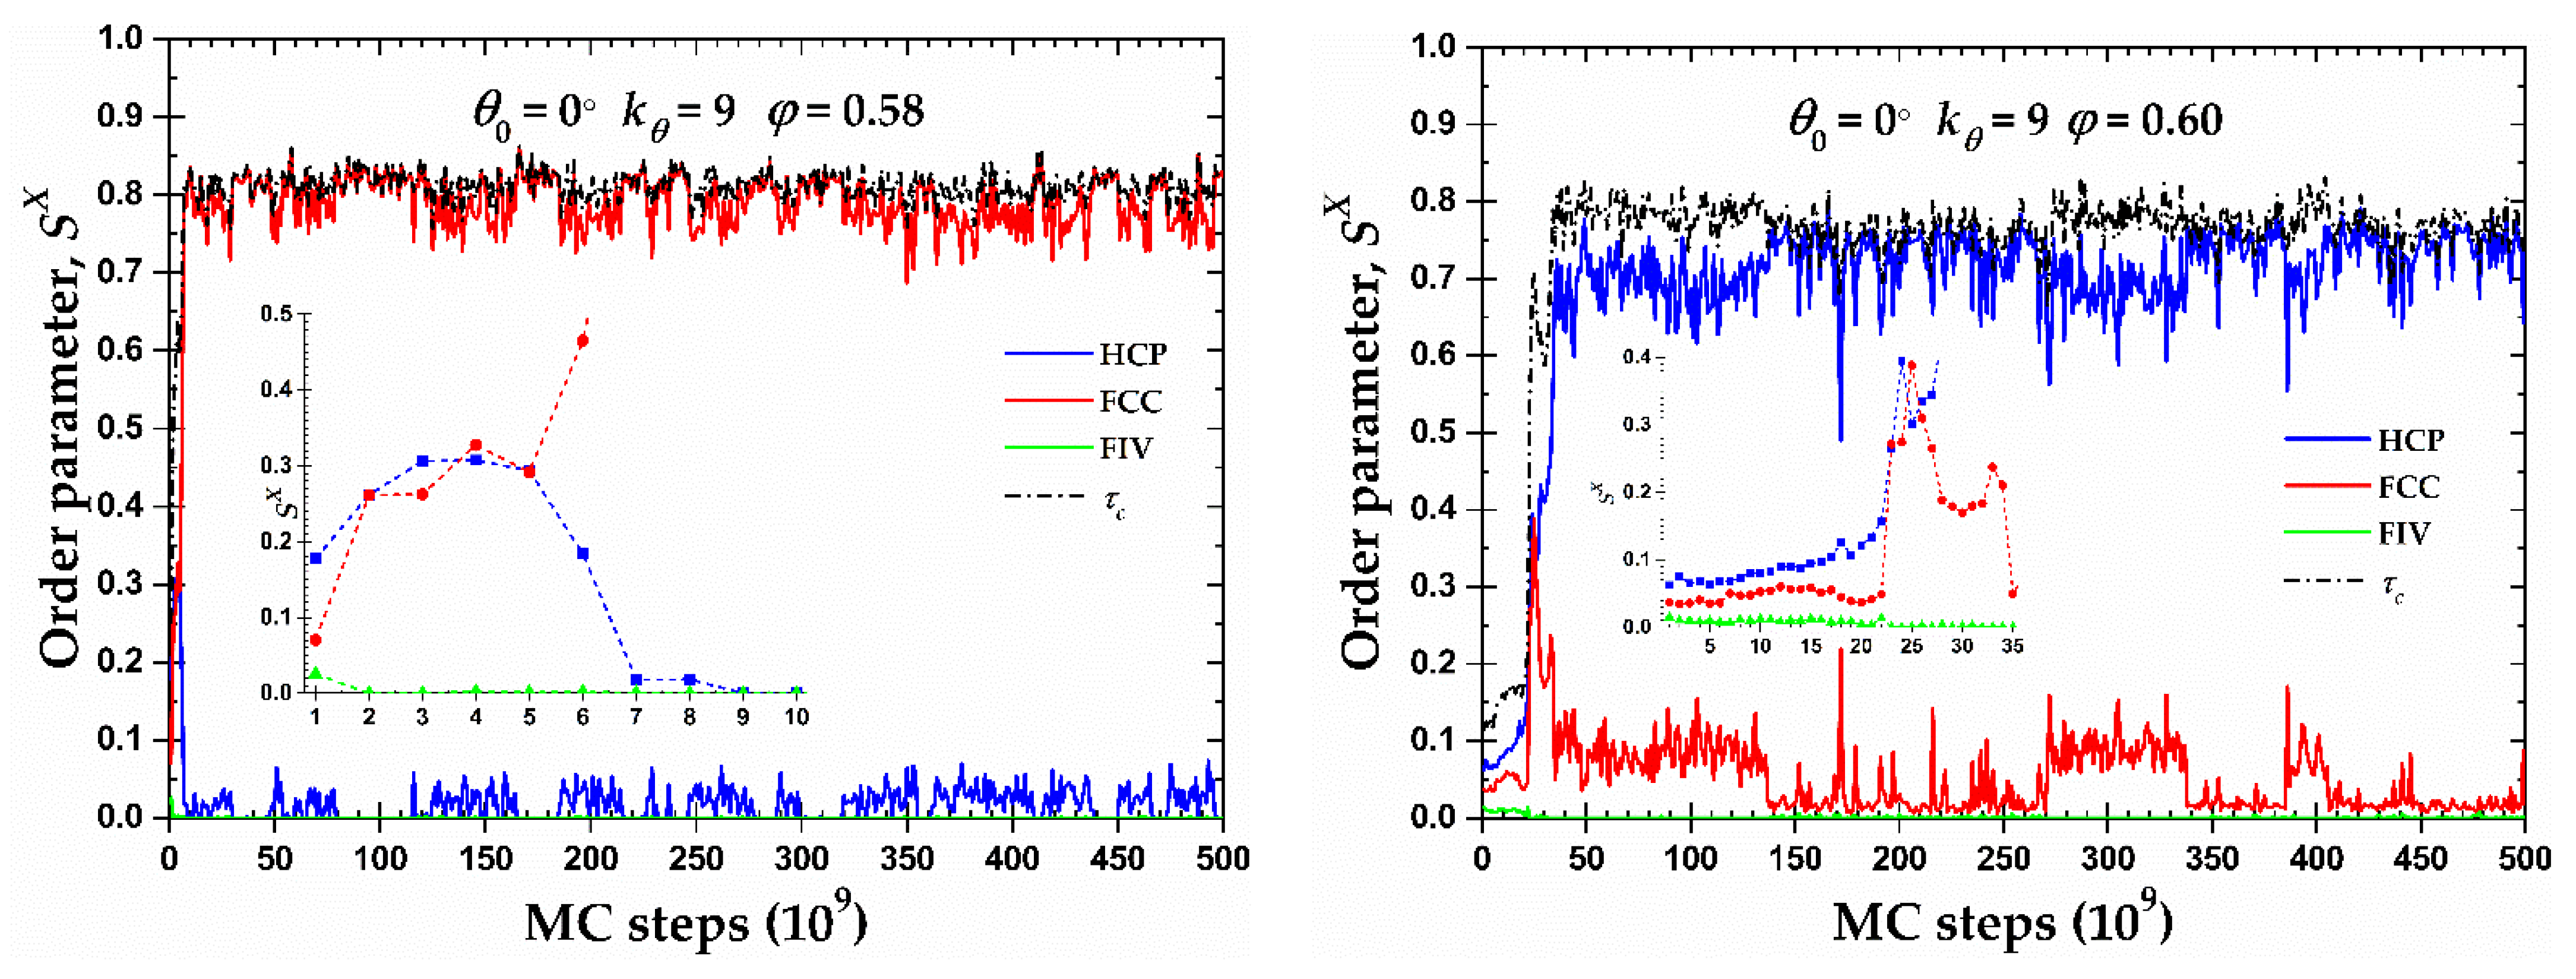
Figure 8 shows the CCE-based local order parameter,
, and the total crystallinity,
, as a function of MC steps, while the corresponding snapshots at various simulation instances can be found in
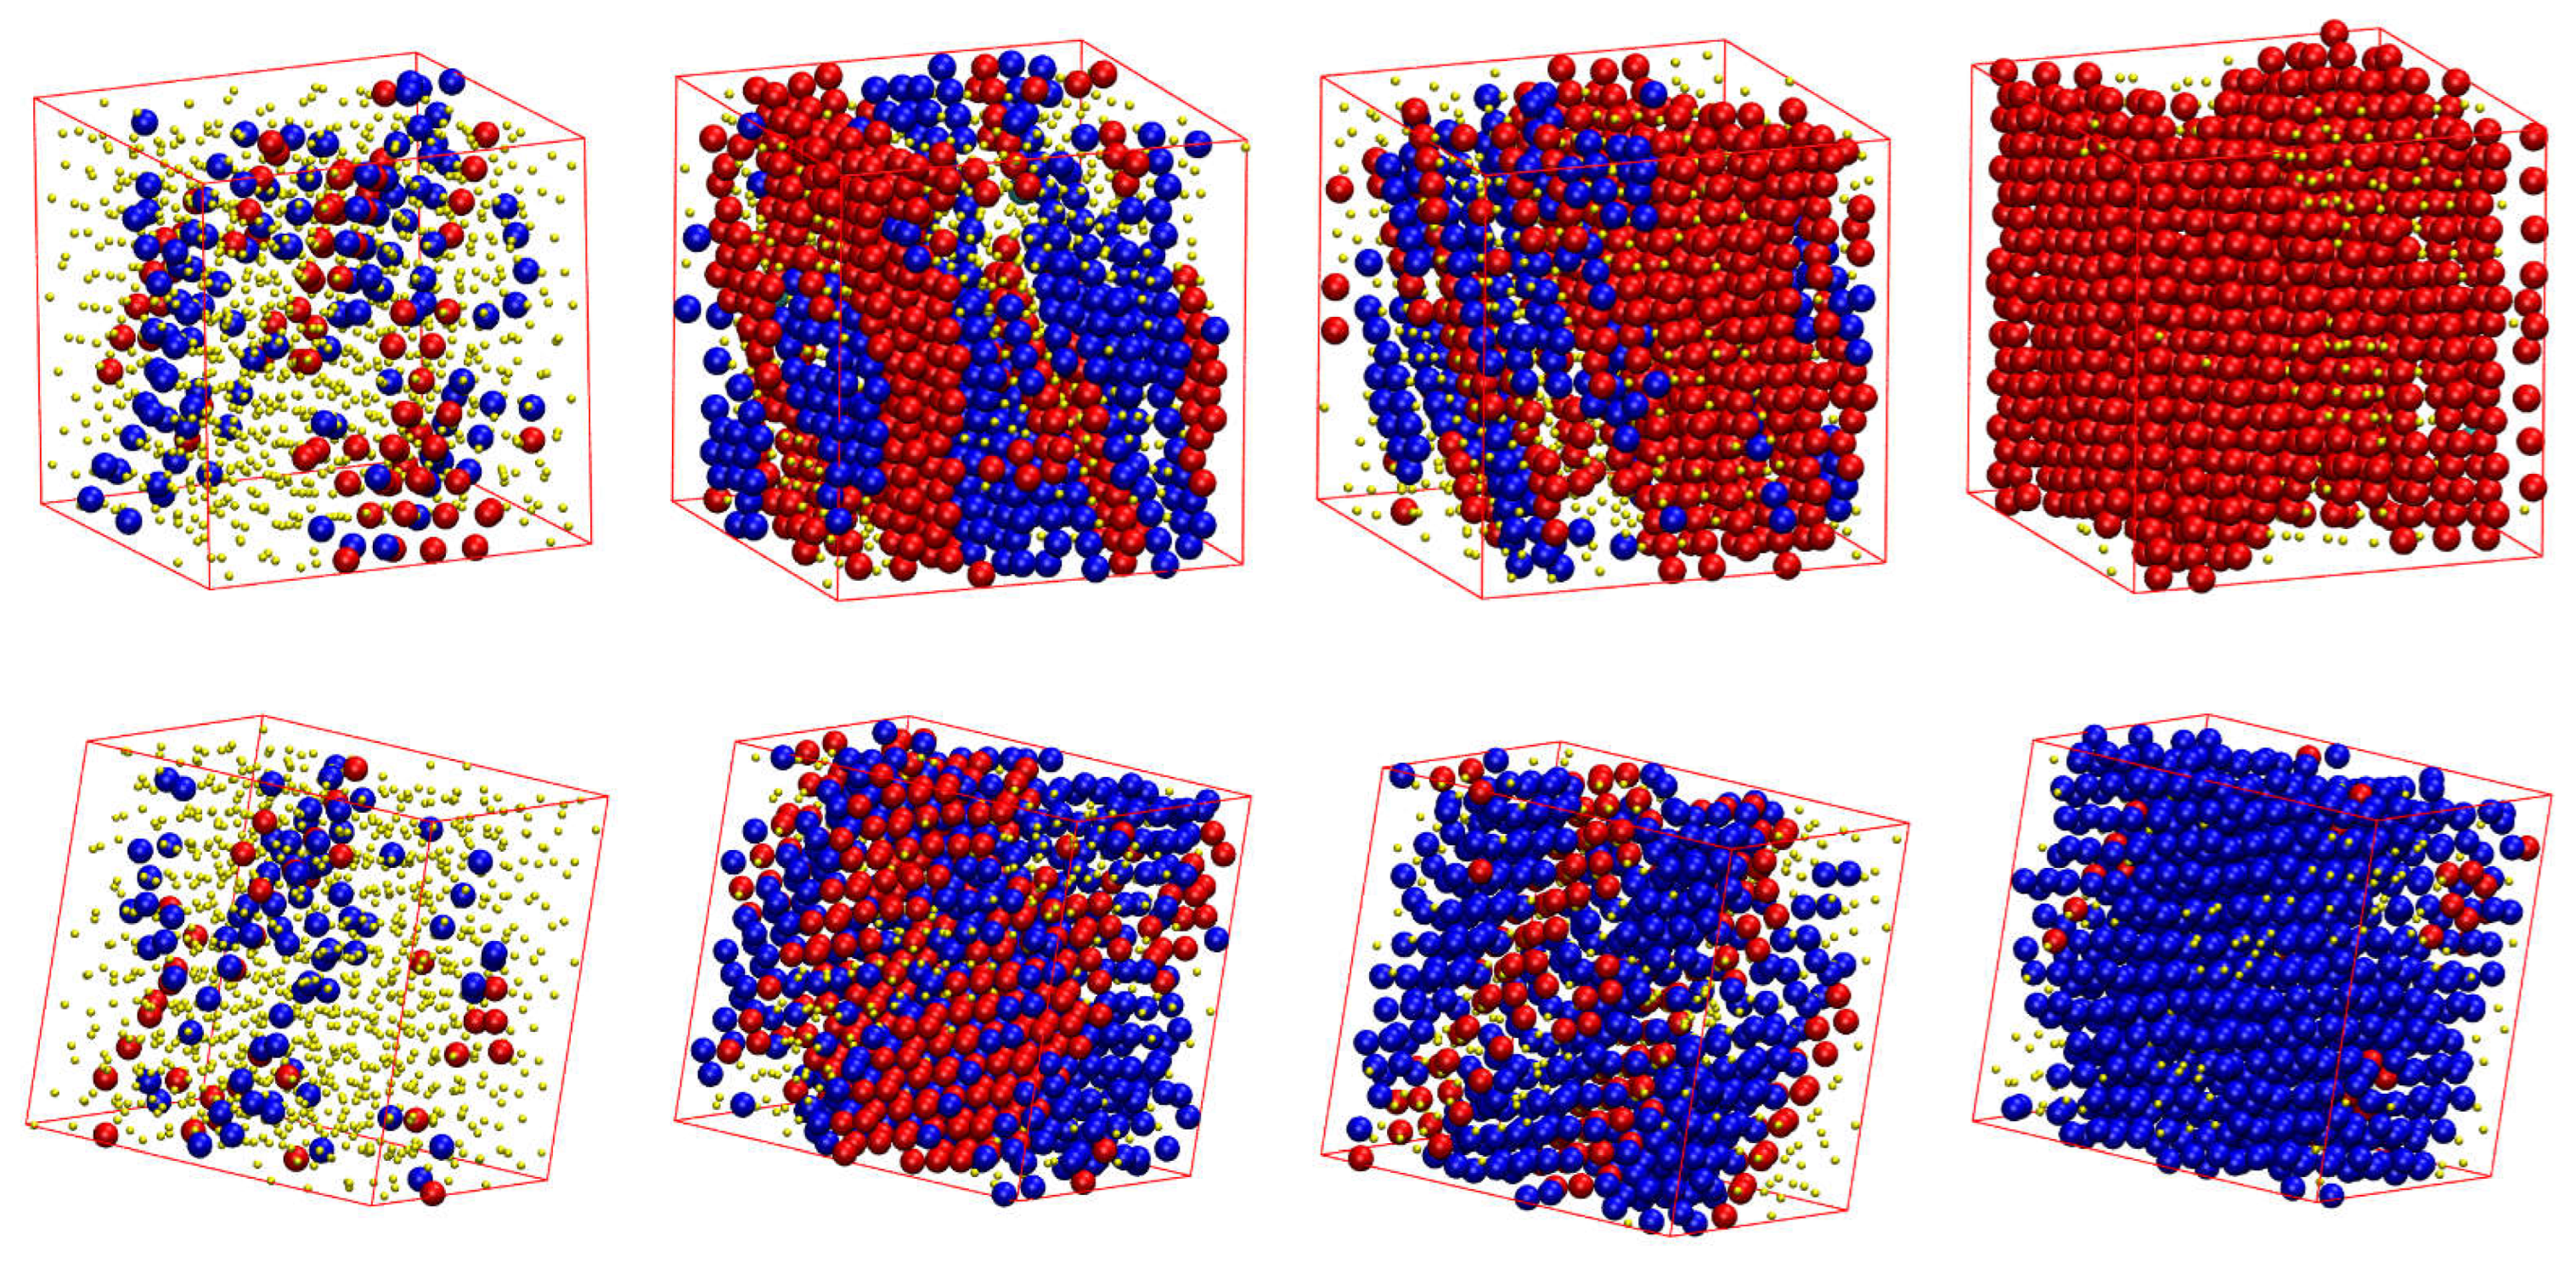
Figure 9. Both systems show very similar trends: after a very short initial period characterized by the rapid increase of HCP and FCC sites and the parallel reduction of the FIV population, the growth rates stop being the same and one type grows in favor of the other. At
φ = 0.58, the resulting morphology is an almost perfect FCC crystal (
,
) while the opposite happens at
φ = 0.60 where a (less) perfect HCP crystal emanates (
,
). In the case of the HCP crystal at
φ = 0.60, the resulting structure is not so stable as the one of the FCC crystal, alternating between the almost perfect HCP crystal (
) and an HCP crystal with a small population of FCC-like sites (
). For the latter case where FCC impurities appear in the HCP crystal, these are produced in the border of the crystal with a regime of defects in the form of amorphous (AMO) sites.
Figure S4 (in Supporting Information) hosts the CCE-based snapshots of the final configuration for the corresponding systems.
While perfection in the form of FCC crystal has been reported very recently from extremely long simulations on freely-jointed chains of hard spheres [
37], it is the first time that an almost perfect HCP crystal, made of hard-sphere chains, in extended rod-like conformations, is observed. The easiness with which crystal perfection is observed could be related to the nematic ordering exhibited by the rod-like chains. This trend, especially compared to the fully flexible model, will be explored in more detail in future studies.
3.3. Local Order: Total Crystallinity
From the local order parameters
, the total degree of crystallinity,
, can be gauged for all the simulated semi-flexible systems. As in the previous analysis, present results are compared against the ones of fully flexible (freely-jointed) analogs.
Figure S5 (Supporting Information) presents the evolution of the degree of crystallinity as a function of MC steps at different packing densities,
φ.
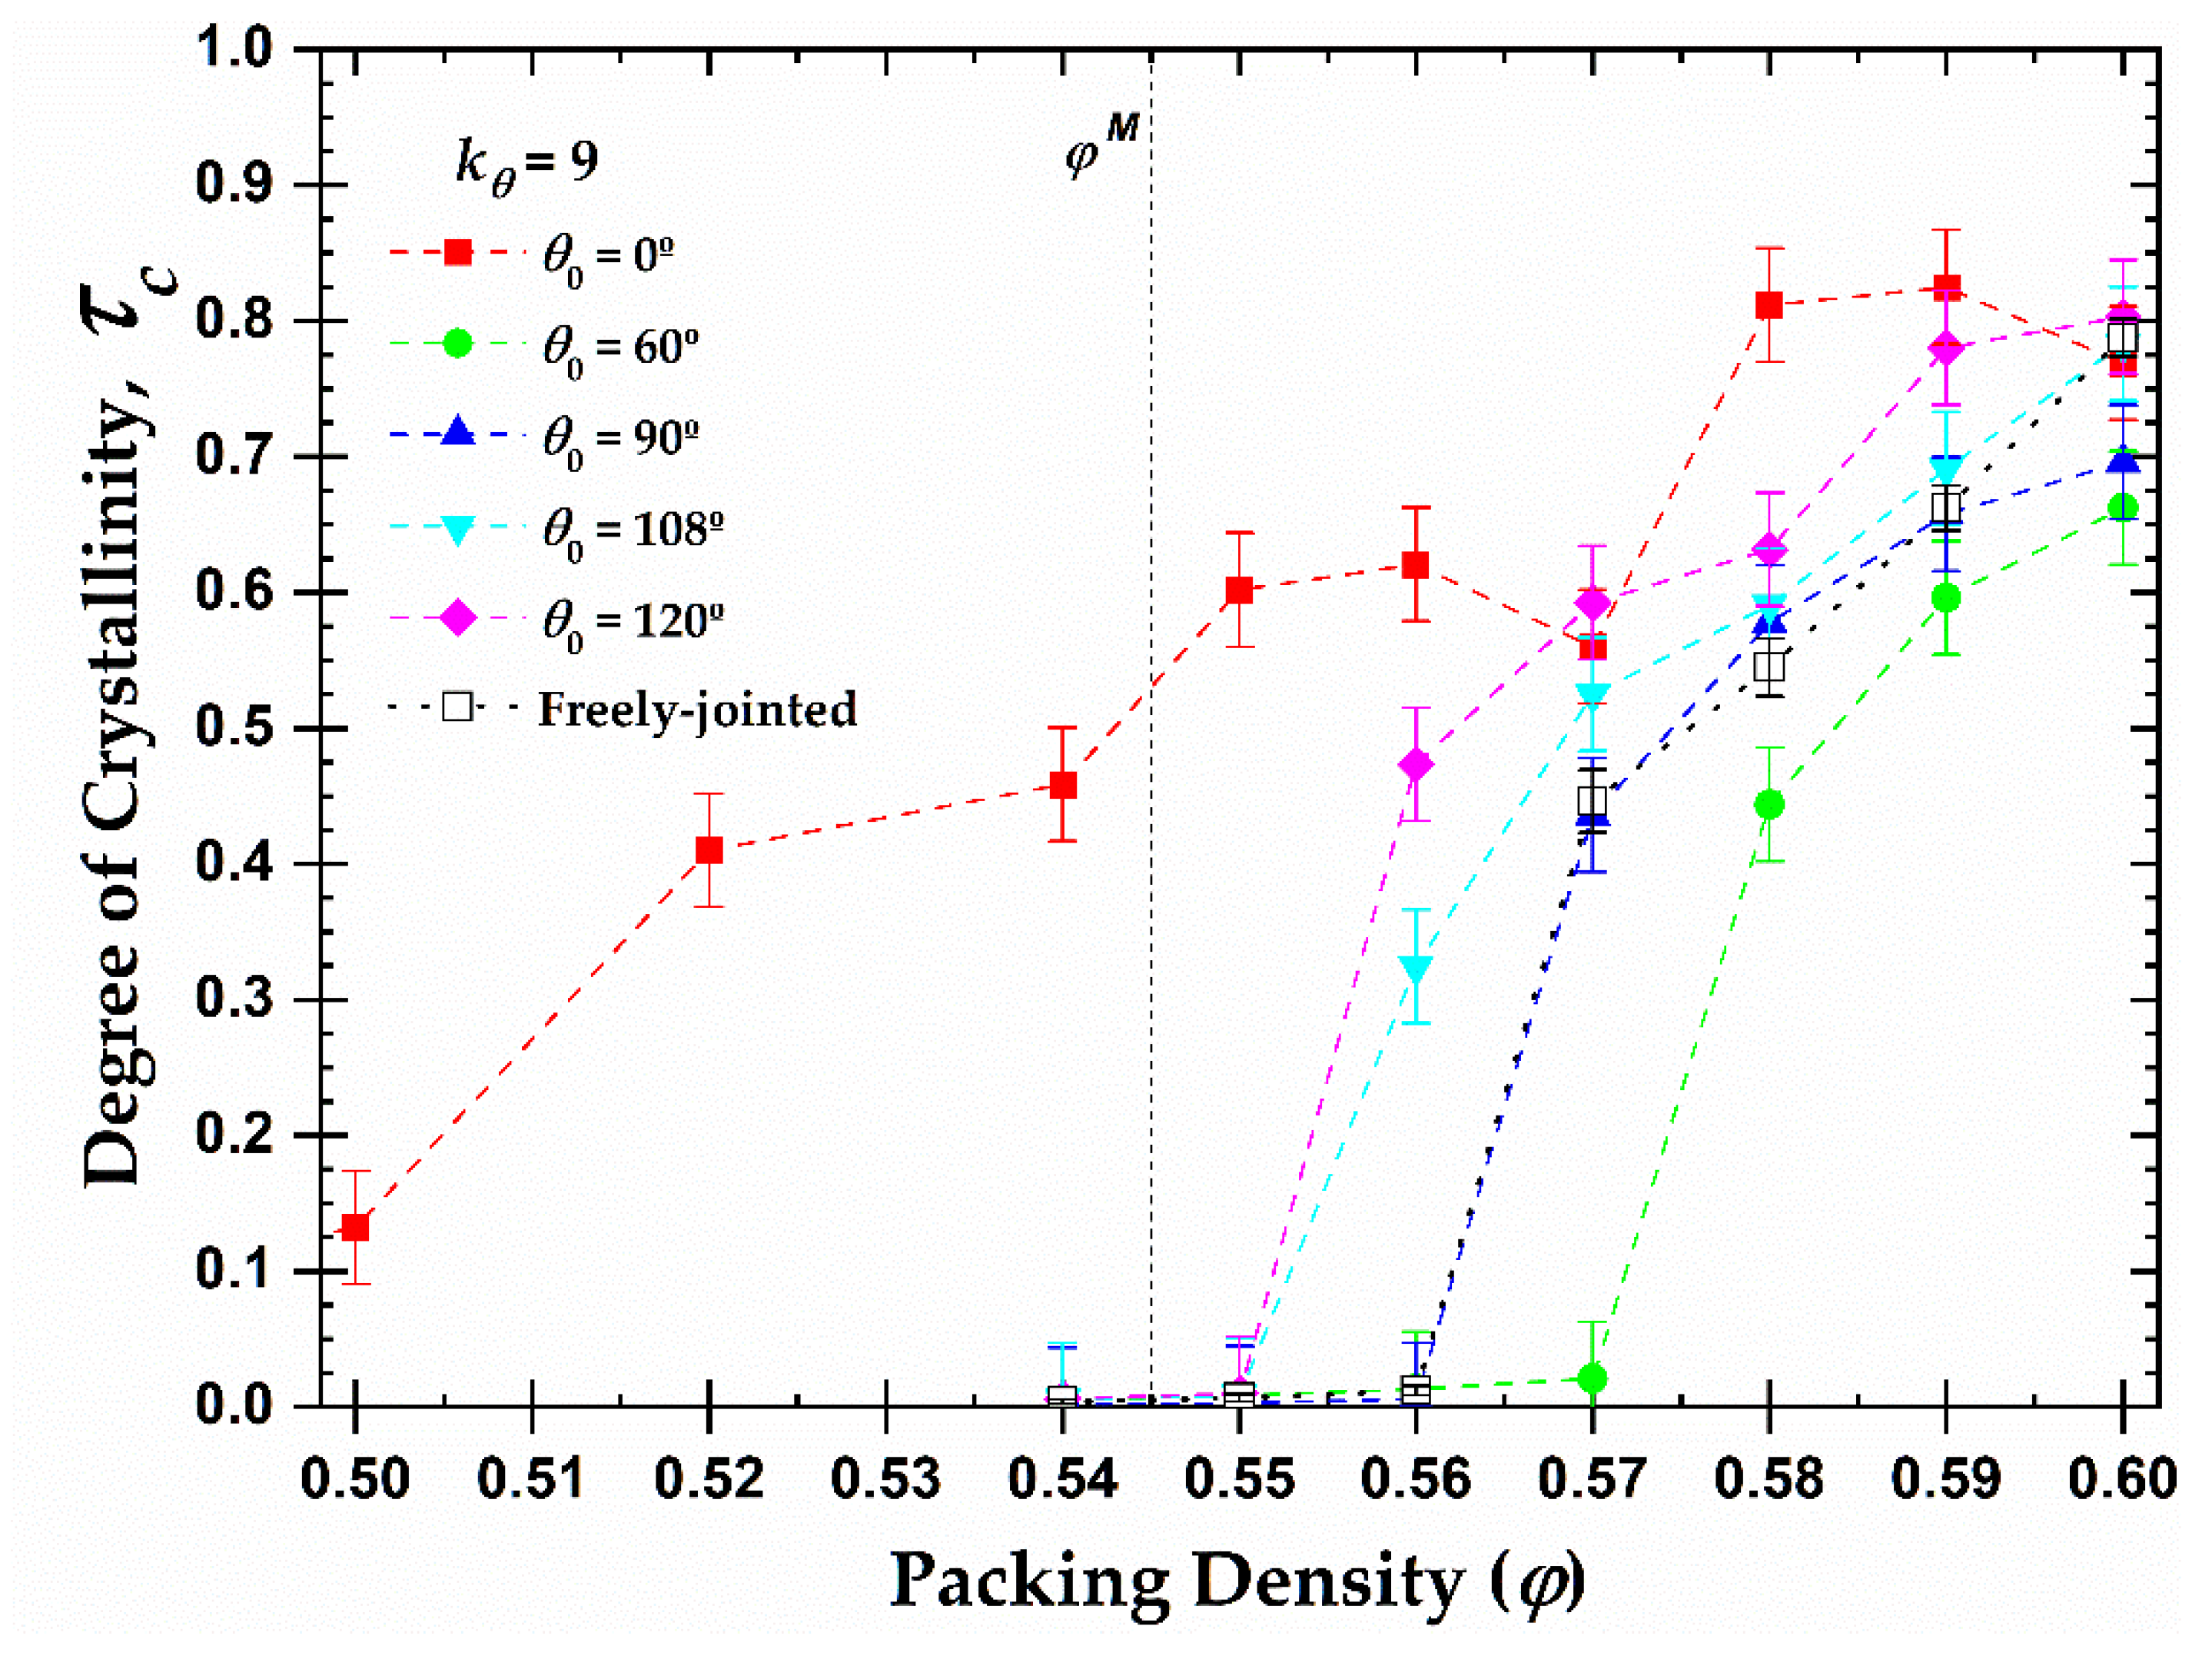
Based on these results and utilizing the value of the total crystallinity as established in the final, stable part of the MC simulation, we can further extract the one-dimensional phase diagram of local order, quantified by the degree of crystallinity, as a function of packing density and equilibrium bending angle (
Figure 10). We remind here that the melting point for monomers is
while freely-jointed chains of tangent hard spheres crystallize at higher volume fractions,
(> 0.56). Some important conclusions can be drawn from the diagram. First, all semi-flexible chain packings eventually crystallize, independently of the equilibrium angle. Second, the equilibrium angle affects profoundly the phase transition of the systems. For example, the rod-like chains present semi-crystalline and crystalline phases at volume fractions significantly lower than the melting point for freely-jointed chains, even lower than the one for monomeric hard spheres, due to the effect of the nematic (global) ordering that precedes local order (as will be demonstrated in the continuation). On the other hand, chains with
, crystallize later than all other systems as at
φ = 0.57 no crystal nucleation and growth is observed, even after
MC steps. Finally, the melting transition shows the trend:
.
In general, with the sole exception of the rod-like chains, the presence of constraints, related to bond geometry in the form of bonds or bending angles, increases the melting transition with respect to monomeric analogs. Still, it is quite surprising that the systems with obtuse bending angles (
) crystallize earlier and the right angle (
) at a very similar volume fraction as the fully flexible chains, which are free of bending constraints. Obtuse angles are favored at high volume fractions as they minimize the local volume compared to acute ones. However, one should further consider the fact that only specific geometric arrangements of polymer chains are compatible with the sites of ideal FCC and HCP crystals. For example, the FCC and HCP share the bending angles of 0, 60, 90, and 120
, while the angles at 33.5 and 70.5
exist exclusively on the HCP crystal [
37]. The lack of bending angles compatible with these crystals would require the adjacent sites to be covered by monomers belonging to other chains, imposing specific arrangements at the intermolecular level.
The phase behavior at the local (CCE-based crystallinity,
) and global (nematic orientational order parameter,
q) levels as a function of density for rod-like chains and right-angle chains is presented in
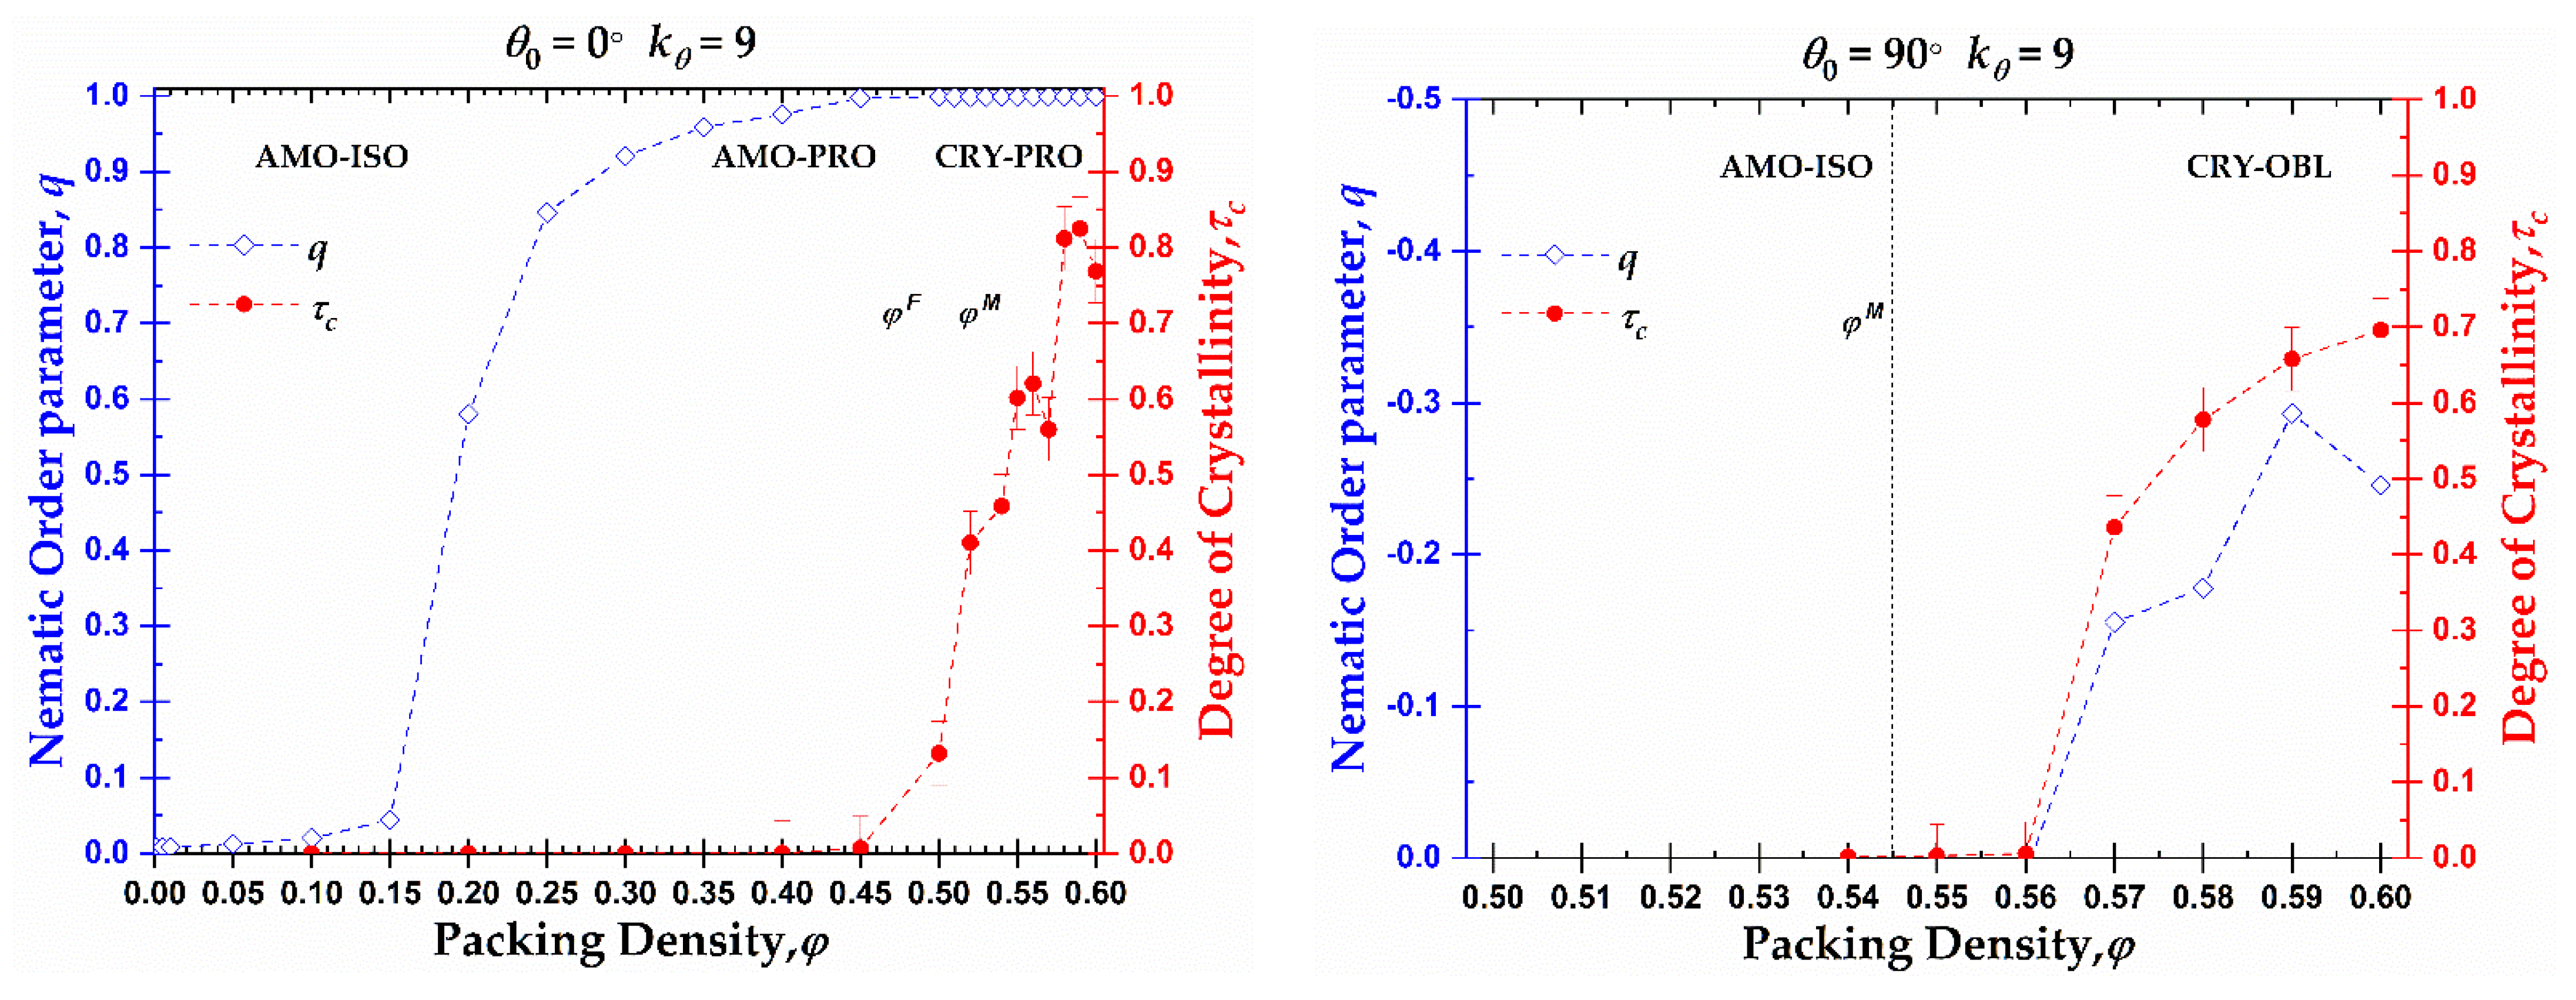
Figure 11. As was explained previously and based on the data of
Figure 4, rod-like chains present an isotropic-nematic transition at
φnem ≈ 0.20, a volume fraction significantly lower than the freezing point for monomeric hard spheres (
), in accordance with the trends presented in [
78,
79]. At volume fractions close to the freezing point, the rod-like systems reach a practically perfect PRO phase. According to Shakirov and Paul [
63], the rod-like chains self-arrange into a 2D hexagonal crystal structure in the plane perpendicular to the nematic director at a volume fraction
φ = 0.47, driven by 2D translational entropy. Thus, those 2D hexagonal crystal structures evolve into a 3D semi-crystalline phase of RHCP structures with the increase in concentration in the range between the freezing and melting point for monomeric hard spheres. After reaching the melting point for monomeric hard spheres, the nematic systems start to crystallize in HCP, FCC, or mixed HCP/FCC structures, keeping the nematic order. So, rod-like systems pack at high densities into Nematic Close Packed (NCP) structures, as was observed by independent researchers through MD simulations [
61,
62].
Based on the local and global phase behavior, the one-dimensional diagram as a function of packing density can be split into three distinct regions, marked by XX-YY, where the first index XX corresponds to the local structure (XX = AMO or CRY) and the second index YY to the global structure (YY = ISO, PRO or OBL). Accordingly, for the rod-like chains studied here (
Nav = 12,
), we have the following approximate domains of phase behavior (left panel of
Figure 11): i) AMO-ISO (
φ ≤ 0.15), where the system is amorphous at the local level and isotropic at the global, ii) AMO-PRO (0.20 ≤
φ ≤ 0.45), where the packing is amorphous locally and nematic globally, and iii) CRY-PRO (0.50 ≤
φ) where the system shows crystallinity in the form of HCP and FCC close packed morphologies of varied level of perfection, and perfect nematic ordering at the global orientational level. Comparing the local and global trends, a hysteresis is clearly evident as local order is established at volume fractions significantly higher than the ones for the ISO → PRO transition.
In the case of right-angle chains (
), the phase behavior is quite different compared to rod-like chains as seen in the right panel of
Figure 11. The small decrease in the long-range orientational order can be attributed to higher statistical uncertainty as the higher the packing density, and the closer to jamming, the more difficult is the sampling even when such advanced MC algorithms are employed. The right-angle systems do not crystallize until after reaching volume fractions higher than the melting point for monomeric hard spheres (
). Then, the ISO → OBL transition occurs simultaneously to crystal nucleation and growth. The formation of RHCP structures requires a semi-nematic OBL phase for the right-angle systems as the right-angle chain exists but is not dominant in the FCC and HCP crystals. Accordingly, for their creation, specific chain alignments are required. As a result, the local and global orders are simultaneously established and no hysteresis is observed. The phase diagram consists of two regimes: i) AMO-ISO (
φ ≤ 0.56), where the system is amorphous at the local level and isotropic at the global, and ii) CRY-OBL (
φ > 0.56) where the system shows RHCP morphologies and nematic order of oblate mesogens.
4. Discussion and Conclusions
We present results from extensive Monte Carlo simulations on the phase behavior of semi-flexible chains of tangent hard spheres as a function of packing density and equilibrium bending angle keeping temperature, spring bending constant, and average chain length constant. Local structure is quantified through the Characteristic Crystallographic Element (CCE) norm, while global structure is gauged through the nematic order parameter. A rich one-dimensional phase diagram as a function of packing density is identified where chains crystallize in close-packed morphologies, including random hexagonal close (RHCP) ones of single or multiple stacking directions, or almost perfect HCP and FCC crystals in the case of rod-like chains. Analysis of the long-range orientational tensor reveals the formation of prolate mesogen, nematic mesophase (PRO) for rod-like chains at rather low volume fractions and of oblate mesogen, nematic mesophase (OBL) at high packing densities. Although all systems of semi-flexible chains crystallize, the equilibrium bending angle significantly affects the melting point. While equilibrium angles of 108° and 120° degrees favor crystallization compared to the freely-jointed model, chains with 90° show a behavior that almost coincides with the fully flexible chains, and the acute angle of 60° hinders crystallization enforcing nucleation and growth to take place at higher concentrations.
Particularly, for rod-like chains, three distinct regimes can be identified in the one-dimensional phase diagram where hysteresis is observed between local and global self-organization: i) AMO-ISO (φ ≤ 0.15), where the system is amorphous at the local level and isotropic at the global, ii) AMO-PRO (0.20 ≤ φ ≤ 0.45), where the packing is amorphous locally and nematic globally, and iii) CRY-PRO (0.50 ≤ φ), where the system shows crystallinity in the form of HCP and FCC close packed morphologies of varied level of perfection and perfect nematic ordering at the global orientational level. Right-angle systems show a synchronous establishment of long-range nematic orientational order and formation of RHCP crystallites, thus splitting the behavior into two distinct regimes: i) AMO-ISO (φ ≤ 0.56), where the system is amorphous at the local level and isotropic at the global, and ii) CRY-OBL (φ > 0.56).
Present simulations are currently expanded to treat semi-flexible chains of tangent hard spheres in composites with nanofillers, under confinement, and in mixtures with different species in the form of linear chains and monomeric counterparts.
Author Contributions
Conceptualization, N.C.K.; methodology, N.C.K., K.F., D.M.F. and M.L; software (MC), D.M.F., M.H., N.C.K. and M.L.; software (CCE), K.F., N.C.K., M.H.; data curation, D.M.F.; writing—original draft preparation, D.M.F. and N.C.K.; writing—review and editing, M.H., K.F. and M.L.; visualization, D.M.F.; funding acquisition, K.F., N.C.K. and M.L. All authors have read and agreed to the published version of the manuscript.
Figure 1.
a) Scheme of the bond geometry of a linear sequence of four monomers, indicating bond lengths, l, bending angles, θ, and torsion angles, , b) Schematic representation of trimers having equilibrium bending angles () studied in the present work.
Figure 1.
a) Scheme of the bond geometry of a linear sequence of four monomers, indicating bond lengths, l, bending angles, θ, and torsion angles, , b) Schematic representation of trimers having equilibrium bending angles () studied in the present work.
Figure 2.
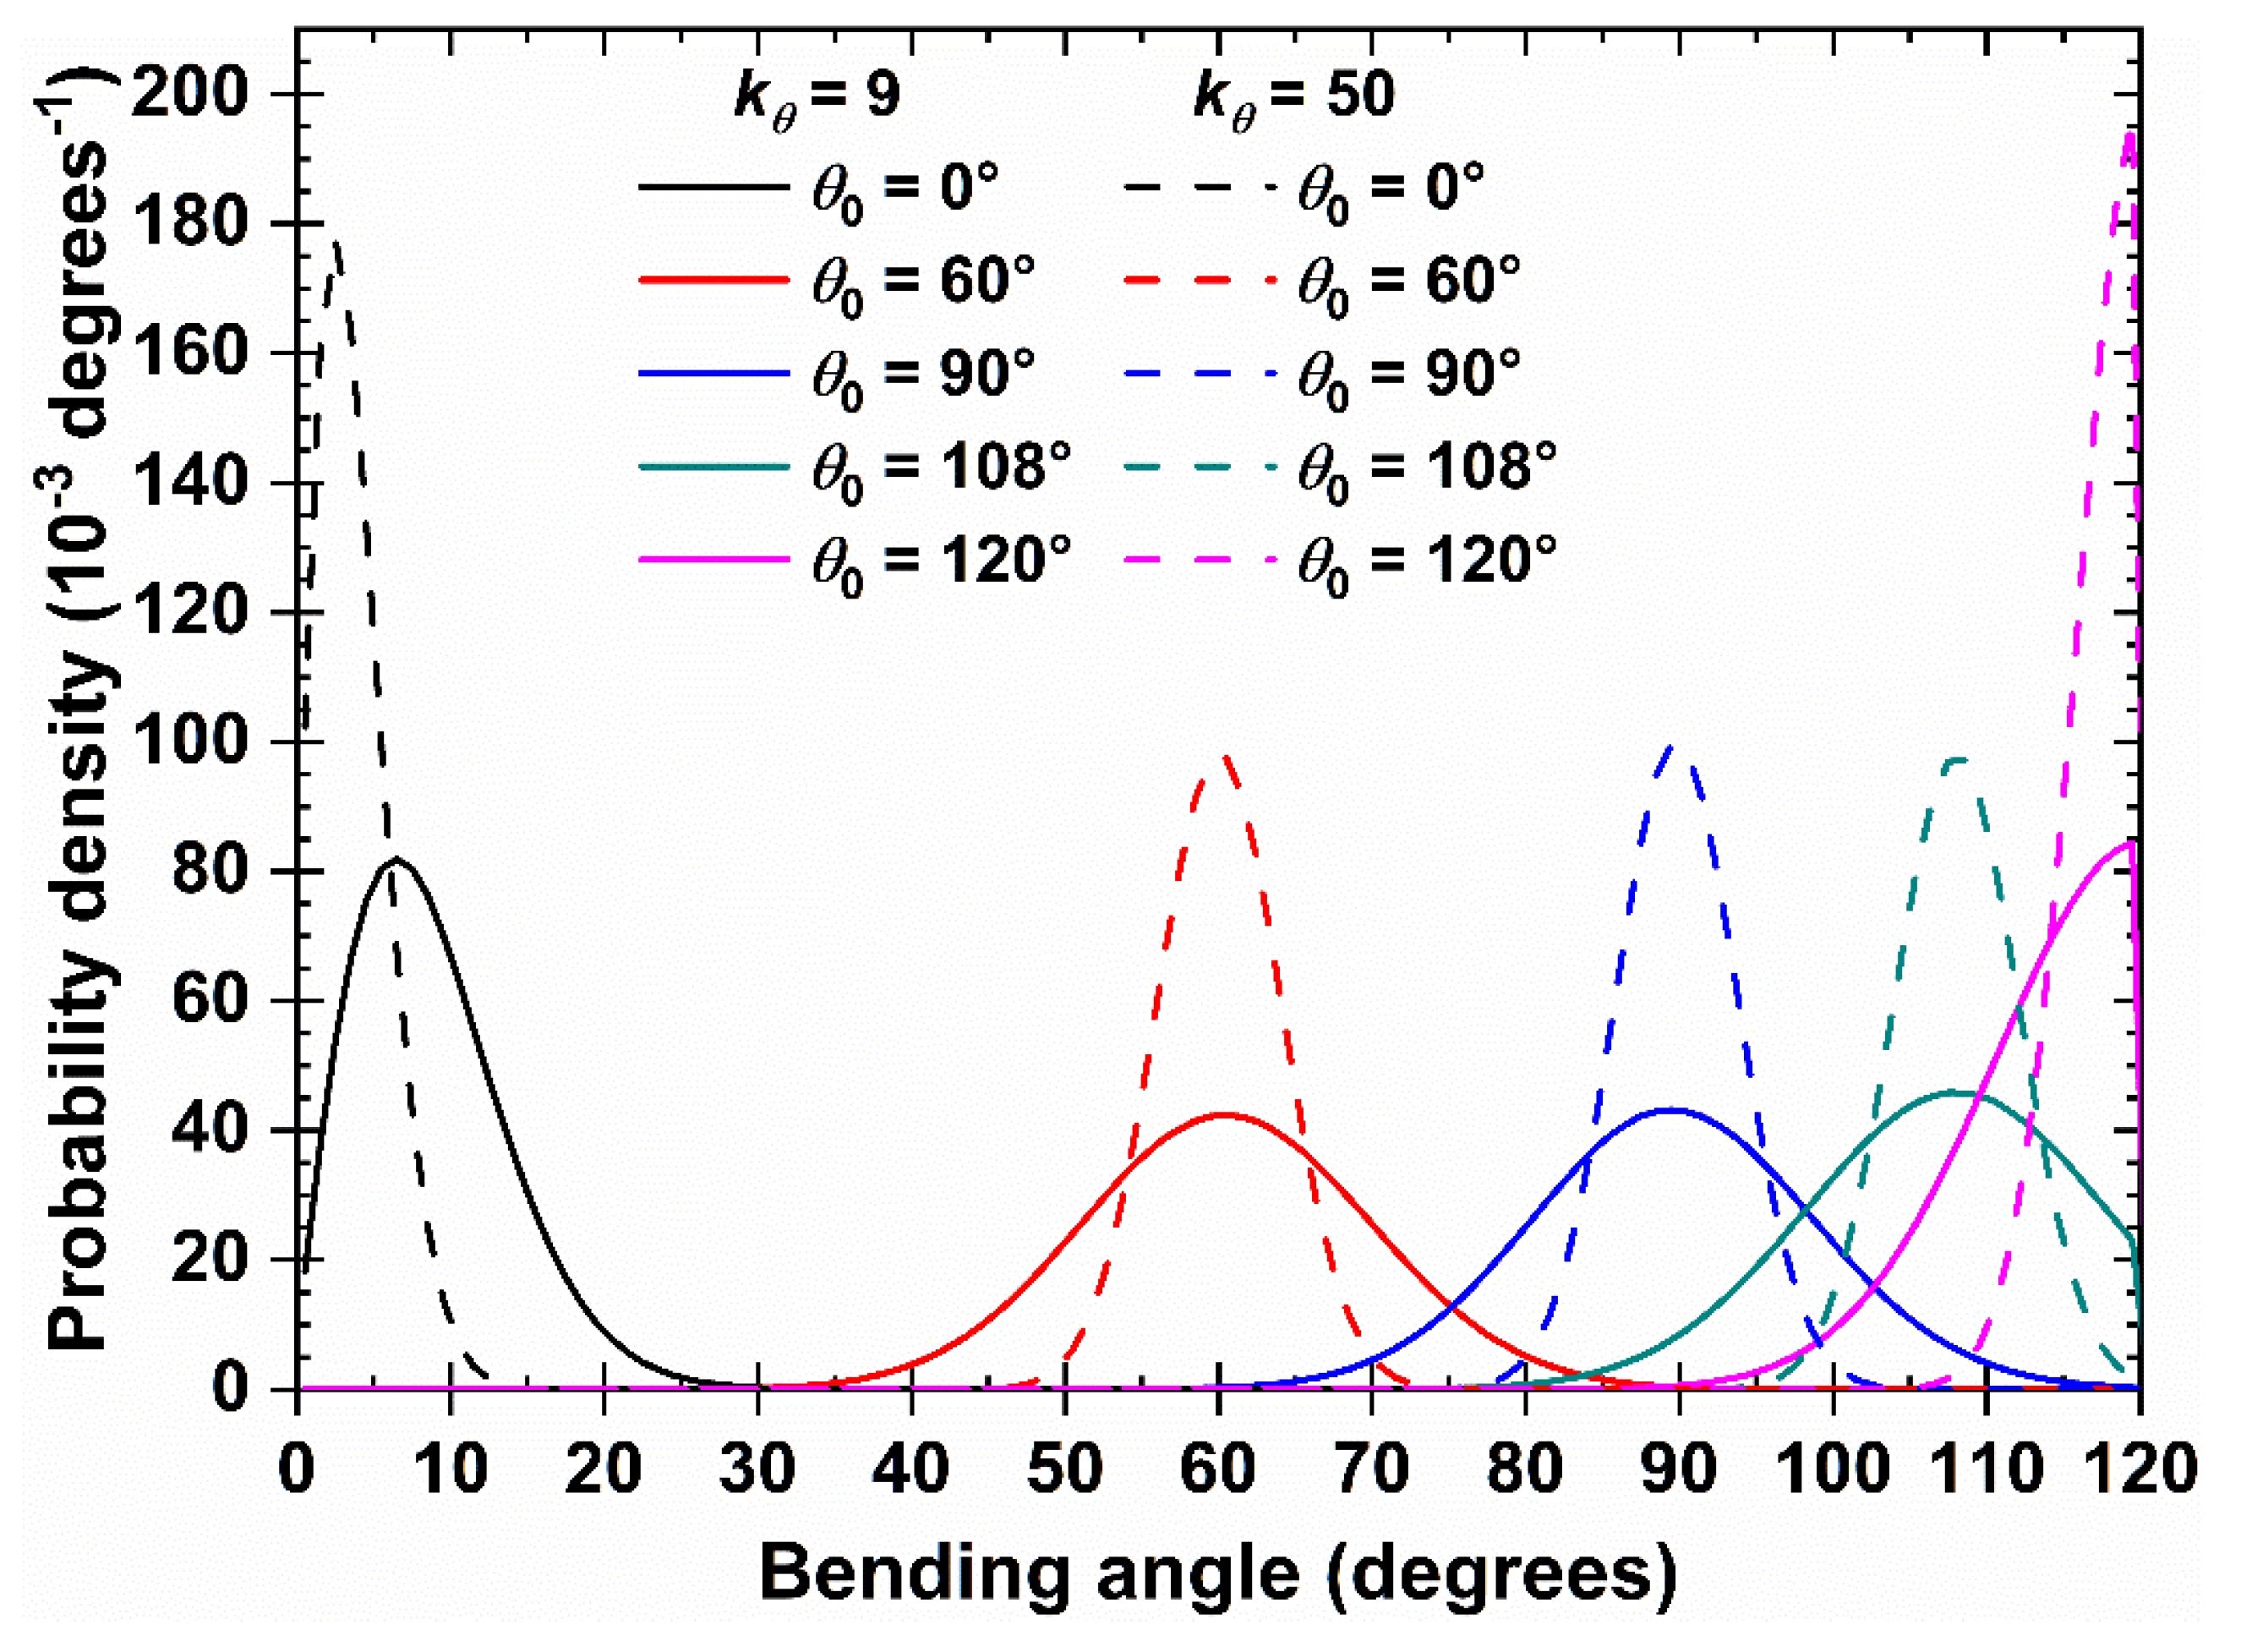
Distribution of bending angle, θ, of a 100-chain system of Nav = 12 at φ = 0.30 in the bulk for (solid lines) and 50 (dashed lines) and different equilibrium bending angles, .
Figure 2.
Distribution of bending angle, θ, of a 100-chain system of Nav = 12 at φ = 0.30 in the bulk for (solid lines) and 50 (dashed lines) and different equilibrium bending angles, .
Figure 3.
Snapshots of the initial configurations for the 100-chains,
Nav = 12,
,
0° system showing at increasing packing densities. From left to right:
φ = 0.10, 0.20, 0.30, and 0.50. Monomers are colored according to the parent chain. For clarity, only 50 chains (half of the total population) are shown. Chains are shown with the coordinates being fully unwrapped in space. Images created with VMD visualization software [
104].
Figure 4.
Evolution of the orientational (nematic) order parameter, q, as a function of the packing density, φ, at different equilibrium bending angles, . Also shown for comparison as dashed vertical lines are the freezing, , and melting, , points of monomeric hard spheres.
Figure 4.
Evolution of the orientational (nematic) order parameter, q, as a function of the packing density, φ, at different equilibrium bending angles, . Also shown for comparison as dashed vertical lines are the freezing, , and melting, , points of monomeric hard spheres.
Figure 5.
(Left) Exponential moving average of the orientational order parameter,
q, as a function of MC steps 100-chains
Nav = 12 semi-flexible system with bending constant
and equilibrium bending angle
at different packing densities,
φ. (Right) Visual representations at
φ = 0.59 showing all 100 chains (top) and 10 randomly selected chains (bottom) with coordinates of the monomers being fully unwrapped in space. Monomers are colored according to the parent chain. Images created with VMD visualization software [
104].
Figure 6.
Crystal nucleation and growth, and (left y-axis), and fraction of fivefold-like sites, (right y-axis), as a function of MC steps for 100-chains Nav = 12 systems of freely-jointed chains and semi-flexible chains with bending constant and equilibrium bending angle 0, 60, 90, 108, and 120° at a packing density φ = 0.59.
Figure 7.
Snapshots of the initial (top) and final configuration (bottom) of the MC simulations for the 100-chains Nav = 12 systems at φ = 0.59 of (from left to right) freely-jointed chains and semiflexible chains () with equilibrium bending angle 0, 60, 90, 108, and 120°. Monomers are color-coded according to CCE norm. Blue, red, cyan, purple, and green correspond to HCP-, FCC-, BCC-, HEX-, and FIV-like sites, respectively. Amorphous (AMO) sites are colored in yellow and are shown with reduced dimensions for visual clarity.
Figure 8.
CCE norm order parameter, , as a function of MC steps for the 100-chains Nav = 12 semi-flexible system chains with bending constant and equilibrium bending angle at φ = 0.58 (left panel) and 0.60 (right panel). Inset corresponds to the early part of the MC trajectory (left: 10 × 109 and right: 35 × 109 MC steps). Dashed black line corresponds to the evolution of the degree of crystallinity, , of the system.
Figure 9.
Computer-generated representations of the crystal growth of the 100-chains Nav = 12 semi-flexible system chains with bending constant and equilibrium bending angle at (top) φ = 0.58 after (from left to right) 1, 25, 60 and MC steps, and at (bottom) φ = 0.60 after (from left to right) 1, 240, 300 and MC steps. Monomers are color-coded according to CCE norm. Blue, red, and green correspond to HCP-, FCC-, and FIV-like sites, respectively. Amorphous (AMO) sites are colored yellow. For visual clarity, monomers are shown with reduced dimensions.
Figure 10.
Degree of crystallinity,
, as a function of packing density,
φ, and equilibrium bending angle,
, for 100-chains
Nav = 12 systems of semi-flexible chains with bending constant
(filled symbols) and freely-jointed chains (open square). Dashed lines connecting points are used as visual support. Vertical dashed line corresponds to the melting transition (
) for monomeric hard spheres [
29].
Figure 11.
Orientational order parameter,
q (left
y-axis, blue color), and crystallinity,
(right
y-axis, red color), as a function of packing density,
φ, for 100-chains
Nav = 12 systems of semi-flexible chains with bending constant
and equilibrium bending angle
(left) and
(right). Dashed lines connecting points are used as visual support. Vertical dashed lines correspond to the freezing (
) and melting (
) transition for monomeric hard spheres [
29].

