1. Introduction
Serine phosphorylation (pS), as the significant phosphorylation type, plays a regulatory role in the cell cycle, growth, apoptosis, and signal transduction [
1]. Serine ADP-ribosylation (SADPr), the common ADP-ribosylation type, regulates many cellular processes, including chromatin organization, epigenetic transcription regulation, cell differentiation and cytoplasm stress response [
2,
3]. Serine phosphorylation and ADP-ribosylation can co-occur on the same residue on a competitive basis as the in situ PTM crosstalk (dubbed pSADPr). This crosstalk represents a significantly high degree of overlap, similar to the site-specific crosstalk between lysine acetylation and ubiquitylation [
4]. The pSADPr crosstalk significantly increases the information content and regulates various biological results [
5,
6]. Nevertheless, the in situ crosstalk of serine phosphorylation and ADP-ribosylation have not been well investigated. Although a few in silico classifiers have been developed for predicting pS and SADPr sites [
7,
8], the classifier for predicting pSADPr sites is unavailable.
This study collected 3250 human pSADPr, 151,227 pS, 7,520 SADPr and 80,096 unmodified serine sites. Based on these sites, we investigated the characteristics of pSADPr and constructed classifiers to predict pSADPr sites. We found that pSADPr’s characteristics are more similar to those of SADPr than pS and unmodified serine sites. We also found that pSADPr sites were preferred to be phosphorylated by four subfamilies of serine kinases (i.e. AGC, CAMK, STE and TKL). Moreover, we built and evaluated five deep-learning classifiers in ten-fold cross-validation and independent test datasets. Three of them performed better than the rest two. The best classifiers had the AUC values of 0.700, 0.914 and 0.954 for recognizing pSADPr sites from the SADPr, pS and unmodified serine sites. Finally, we developed a few advanced stacking-based ensemble classifiers, but none performed better. Finally, we developed an online tool for extensively predicting human pSADPr sites, dubbed EdeepSADPr. It is freely available through
http://edeepsadpr.bioinfogo.org/. We anticipate that accurate prediction by EdeepSADPr will facilitate the discovery of new EdeepSADPr sites and promote an understanding of its functional characteristics.
2. Materials and Methods
2.1. Data collection and preprocessing
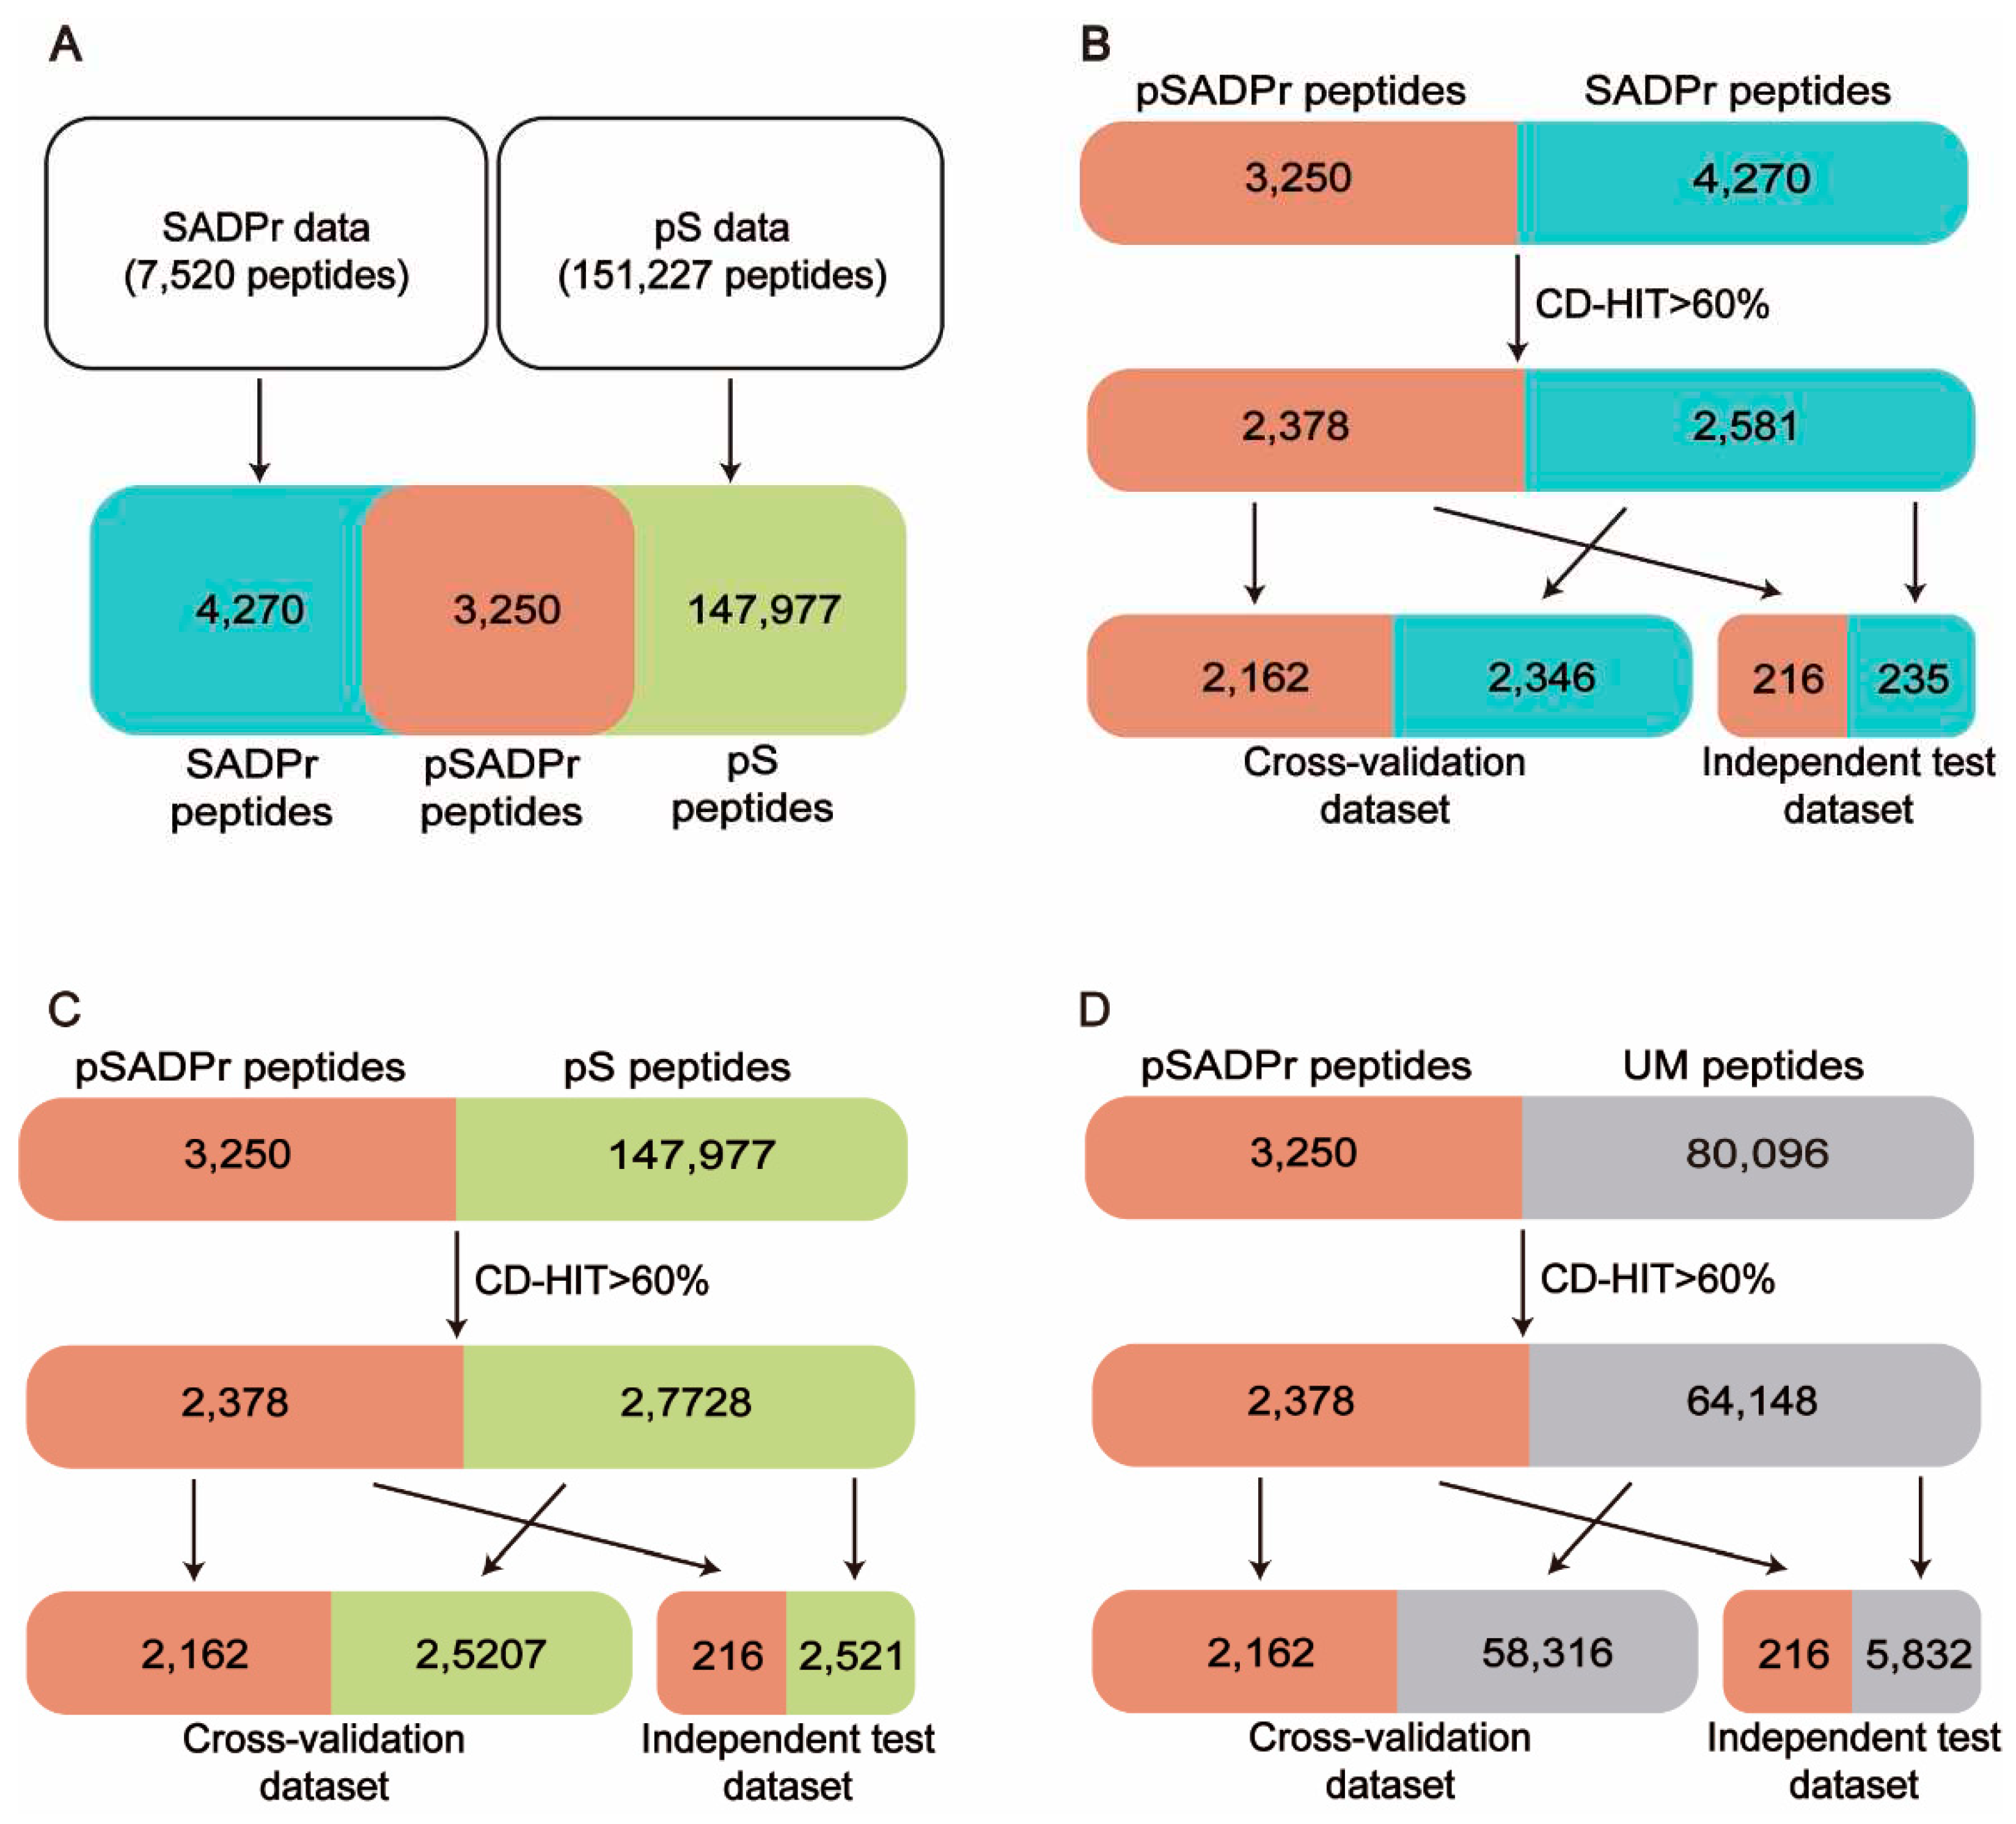
Figure 1 shows the procedure of dataset construction and preprocessing. 7520 human SADPr sites with high confidence (i.e., ADPr peptides with Andromeda scores > 40 and localization probability > 0.75) were collected from the literature [
2,
4,
9,
10] (
Figure 1A). 151,227 human pS sites were obtained from the database PhosphositePlus [
11] and the literature [
7] (
Figure 1A). We compared both datasets and found 3250 pSADPr peptides, 147,977 pS peptides, and 4270 SADPr peptides. We also collected 80,096 unmodified serine (UM) sites after removing modified serine sites (i.e. pSADPr, SADPr and pS) from the reported dataset [
7].
Each serine site of the above datasets was represented by a 41-residue-long sequence segment with the serine at the center [
12]. CD-HIT [
13,
14] was applied to eliminate the homologous peptides by setting the threshold to 60% sequence identity, which is valuable for avoiding overestimation. Specifically, we combined the pSADPr peptides with SADPr peptides, pS peptides, and UM peptides, respectively, and clustered them using CD-HIT. Accordingly, we obtained 4959 clusters, 30,106 clusters and 66,526 clusters. We selected one sequence randomly from each cluster according to the criterion: One pSADPr peptide was selected if it was included in the cluster; otherwise, one of the other peptides was selected. After that, 2378 pSADPr, 2581 SADPr, 27,728 pS and 64,148 UM peptides were collected (
Figure 1B-D). Furthermore, each of the three datasets was divided into 11 groups, where ten groups were used as a cross-validation dataset, and the rest group was considered an independent test dataset (
Figure 1B-D). It should be noted that if the central serine residue is located near the N or C terminus of the protein sequence, the complement symbol ‘_’ was added to the input sequences at the affected terminus to ensure the length was maintained. All these data are available at
http://edeepsadpr.bioinfogo.org/.
2.2. Feature encoding schemes
We selected five encoding features representing the input peptides for the model construction. They included the One-Hot encoding(OH) [
15], the Enhanced Amino Acid Composition Encoding (EAAC) [
16], the Enhanced Grouped Amino Acids Content encoding (EGAAC) [
16], the ZSCALE Encoding (ZSCALE) and the Word Embedding (WE).
2.2.1. One-Hot (OH) encoding
In the One-hot coding, the 20 amino acids and complement symbol ‘_’ are encoded into a 21-dimensional binary vector. In the vector corresponding to an amino acid, the element related to the amino acid is marked as 1 and others are marked as 0. For example, “A” is represented by “100000000000000000000” and “V” is represented by “0100000000000000000000”.
2.2.2. ZSCALE encoding
In ZSCALE encoding, every amino acid type is characterized by five physicochemical descriptor variables [
17,
18]. Therefore, each input sequence is represented as a vector of 205 (=41 × 5) dimensions. The filling character “_” is encoded as a 5-dimensional zero vector.
2.2.3. Word-embedding (WE) encoding
Word embedding [
19] relies on the numerical encoding approach [
20], which maps each type of amino acid residue to an integer. After the NUM encoding, each integer is mapped to a predefined five-dimension word vector. Therefore, each sequence is encoded as a vector of 205 (= 41×5) items.
2.2.4. Enhanced Amino Acid Composition (EAAC) encoding
In EAAC encoding, the frequency of each amino acid from the N-terminal to the C-terminal within a fixed sliding window size (the default length being 5) is calculated [
20]. Therefore, each peptide sequence is encoded as a vector of 740 (=(41 − 5 + 1) × 20) items.
2.2.5. Enhanced Grouped Amino Acids Content (EGAAC) encoding
The EGAAC encoding is developed based on grouped amino acid content (GAAC) characteristics [
21]. In the GAAC encoding, the 20 amino acid types are divided into five groups according to their physical and chemical properties (G1: GAVLMI, FYW, G3: KRH, G4: DE, and G5: STCPNQ). In the EGAAC encoding, the GAAC value is calculated from N-terminal to C-terminal within a fixed sliding window (the default length being 5).
2.3. The architecture of deep-learning classifiers
We constructed five classifiers based on Convolutional Neural Network (CNN). They included the model combined with the One-Hot Encoding (CNN
OH), the model with the Word Embedding Encoding (CNN
WE), the model with the ZSCALE Encoding (CNN
ZSCALE), the model with the EAAC encoding (CNN
EAAC) and the model with the EGAAC encoding (CNN
EGAAC). We took the CNN Model with the One-Hot encoding (CNN
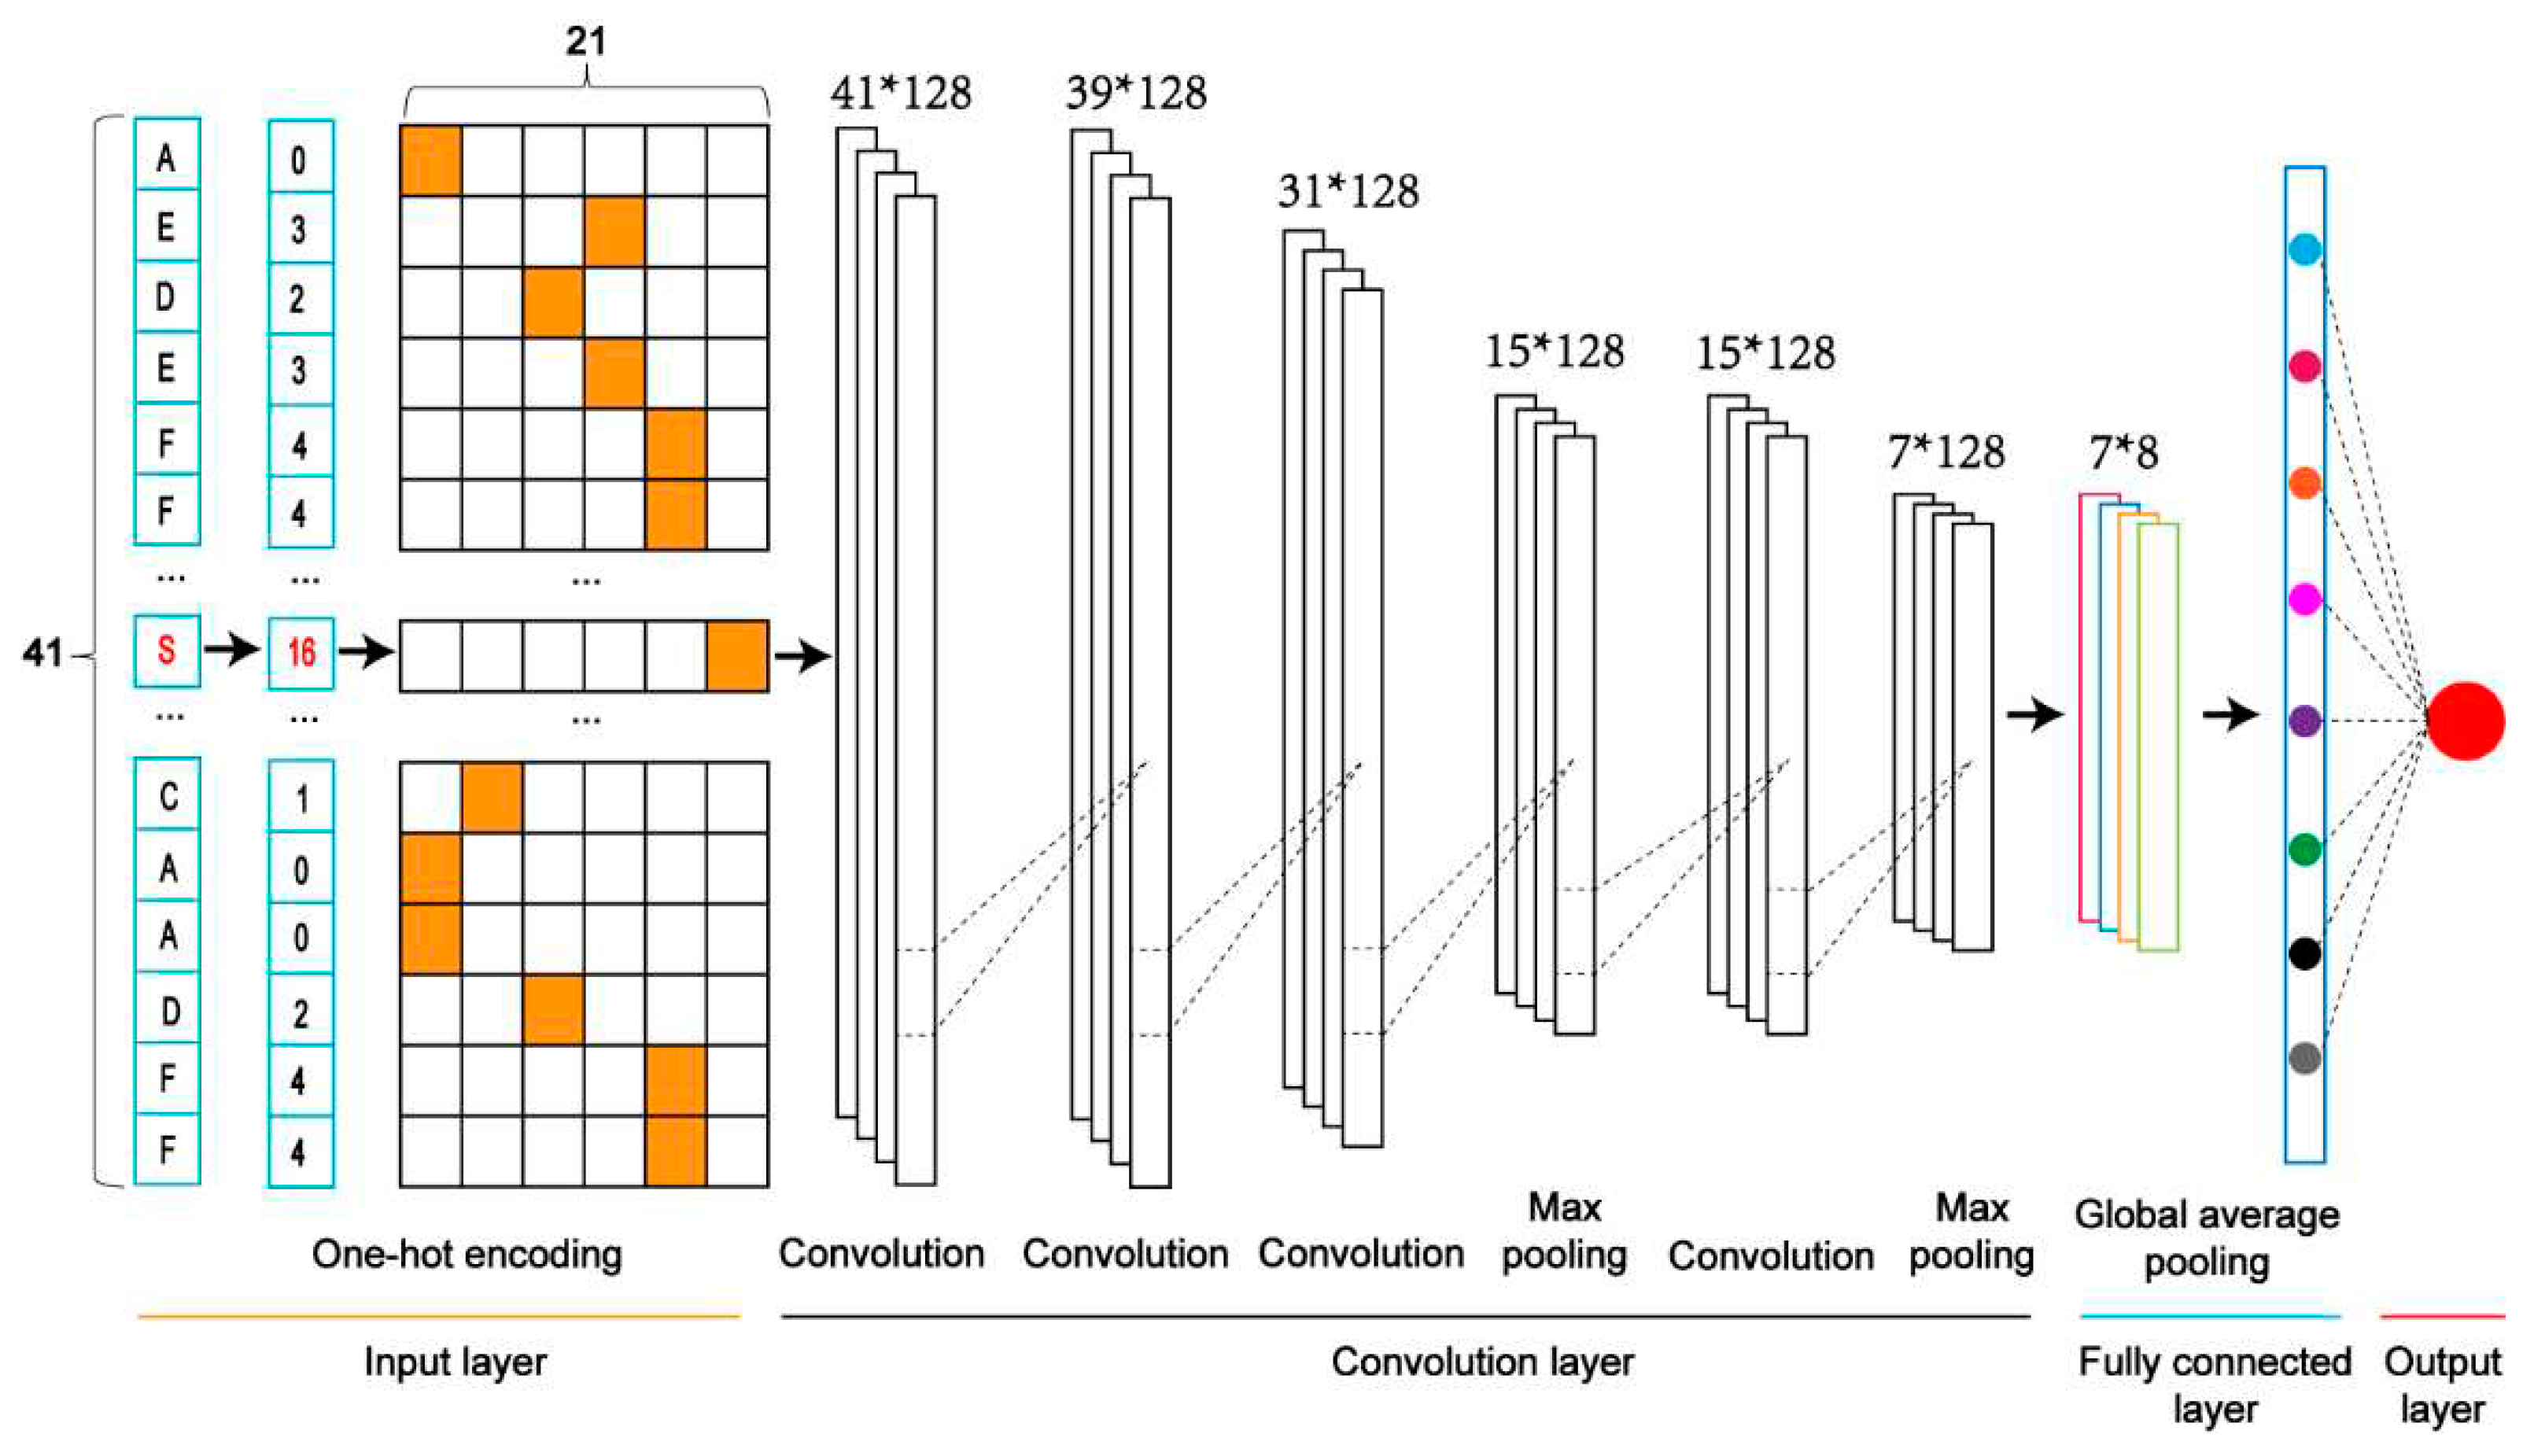
OH) as an example to demonstrate the architecture (
Figure 2).
- (1)
Input layer. Each sequence is converted into a feature vector with One-Hot encoding.
- (2)
The convolution layer. It contains two convolution sublayers followed by two sequentially connected blocks. each block includes a convolution sublayer and a max pooling sublayer. There are 128 convolution kernels with the sizes of 1 and 3 for the first and second convolution sublayers, respectively. A dropout layer with a rate of 0.7 follows each convolution kernel to prevent potential overfitting. In these two blocks, there were 128 convolution kernels with a size of 9 and 10 for these two convolution sublayers of two blocks, respectively; the parameters pool_size of the max-pooling sublayer was set as 2; the dropout rate was set to 0.5. The rectified linear unit (ReLU) is considered the activation function.
- (3)
Fully connected layer. It contains a dense sublayer with 128 neurons without flattening and a global average pooling sublayer to calculate and output an average value.
- (4)
Output layer: This layer contains a single neuron, activated by a sigmoid function, to output the probability score (within the range from 0 to 1), indicating the likelihood of the crosstalk. If the probability score of an input sequence is greater than a specified threshold, the central serine in the sequence is predicted as a crosstalk site.
2.4. Performance evaluation
Several statistical measures were used to evaluate prediction performance, including sensitivity (SN), specificity (SP), overall accuracy (ACC), Matthew correlation coefficient (MCC) and the area under the receiver operating characteristic (ROC) curve (AUC). The definitions of SN, SP, ACC, and MCC are given as follows:
In the above formulas, TP, TN, FP, and FN are the number of true positives, true negatives, false positives, and true negatives, respectively.
3. Results and discussion
3.1. Construction and functional investigation of the pSADPr datasets
We created three datasets for constructing classifiers to predict pSADPr sites (
Figure 1). The first dataset was the pSADPr-SADPr dataset, containing pSADPr and SADPr peptides. The related model was used to recognize pSADPr sites from known SADPr sites (
Figure 1B). The second was the pSADPr-pS dataset, including pSADPr and pS peptides (
Figure 1C). The third was the pSADPr-UM dataset, containing pSADPr and UM peptides (
Figure 1D). Because the vast majority of serine residues are unmodified in the human proteome, the model based on the third dataset was expected to recognize pSADPr sites from the human proteome (
Figure 1D). Each of the three datasets contained two parts: cross-validation and independent test datasets (
Figure 1B-D).
We explored the characteristics of the pSADPr crosstalks by comparing pSADPr-containing and other peptides in the three datasets through the Two-Sample-Logo program [
22]. For the pSADPr-SADPr dataset, the amino acid R was significantly enriched at positions -2 and -3 (
i.e. P-2 and P-3), whereas K was depleted at P-1 (
Figure 3A). For the rest datasets, the pSADPr crosstalks showed similar characteristics (
Figure 3B,C). Specifically, K was enriched entirely except P+1 and G was enriched at P1 and P2; D and E were depleted at P-3 to P+5 and L was depleted entirely. The maximum enriched/depleted value (29.3%) for the pSADPr-pS dataset was similar to that (32.0%) for the pSADPr-UM dataset, and both were more than twice as large as that (13.2%) for the pSADPr-SADPr dataset (
Figure 3). It indicates that the differences between pSADPr and SADPr sites are smaller than those between pSADPr and pS/UM sites. In other words, it is easy to distinguish pSADPr sites from pS/UM sites, compared to recognizing pSADPr sites from SADPr sites.
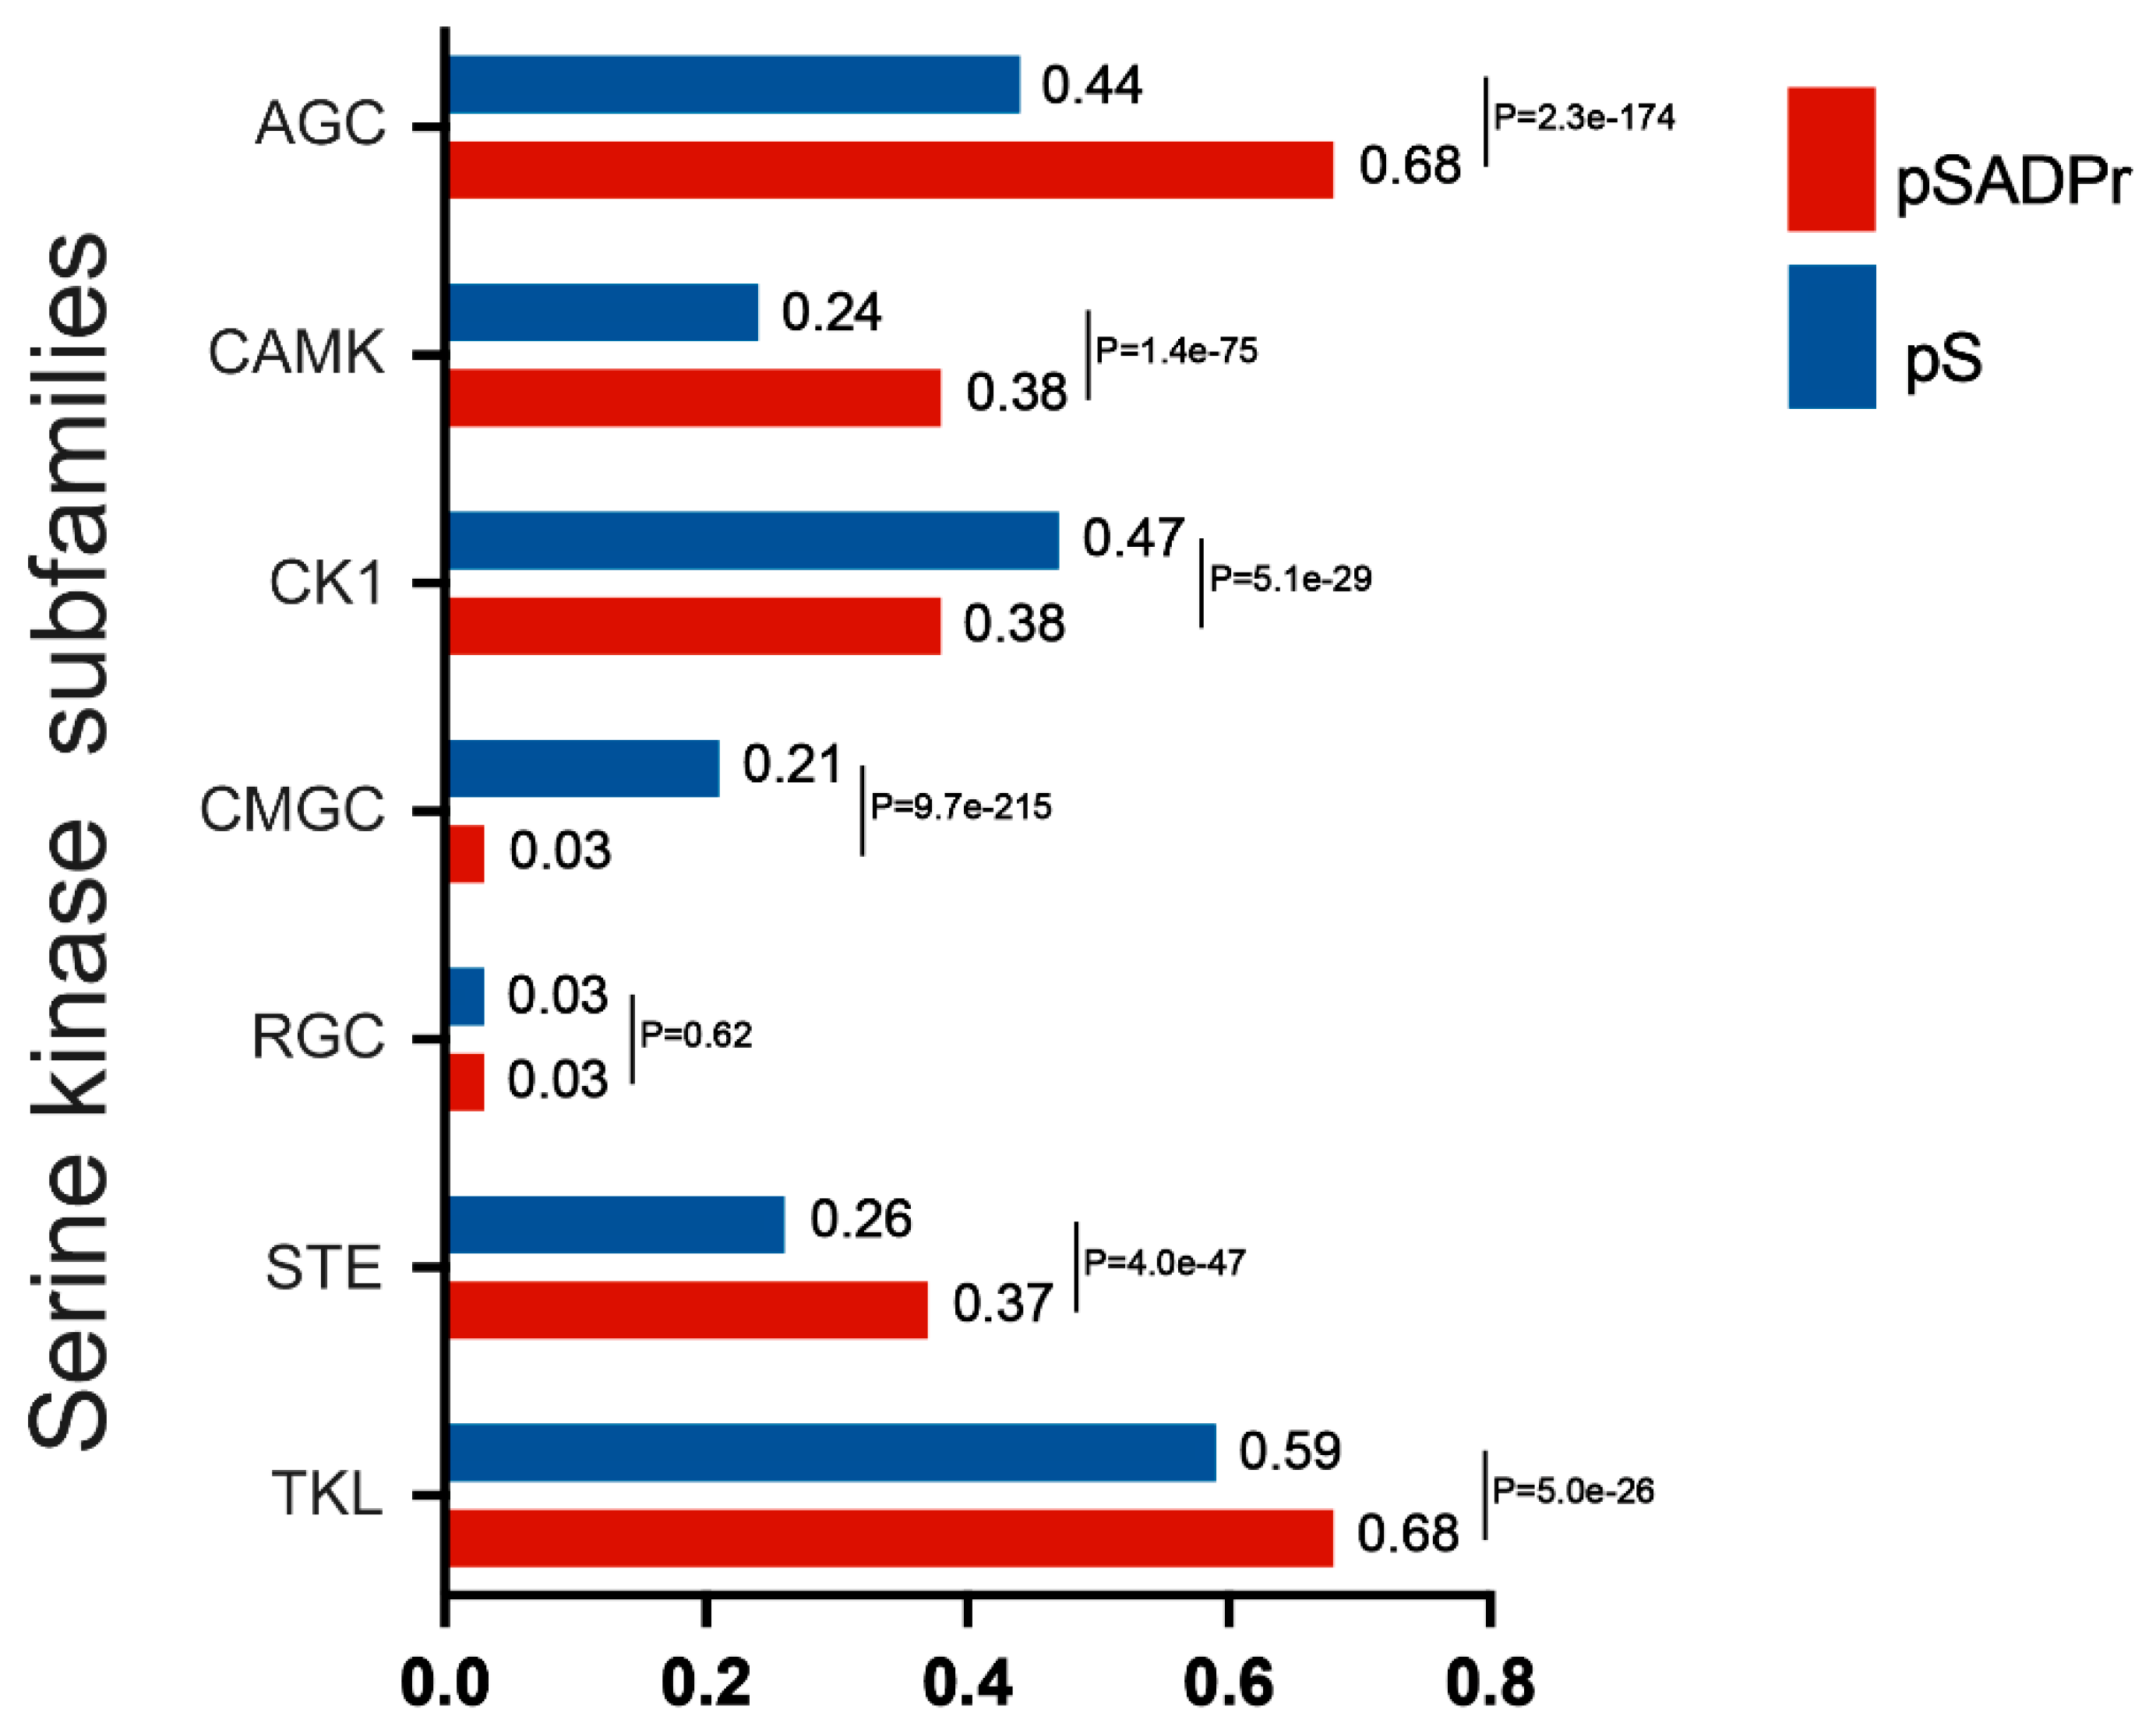
The human serine kinase family contains a few subfamilies, each with its characteristics. We explored which subfamilies preferred phosphorylating the pSADPr sites. To perform this analysis, we used the human pS sites as the background and the pSADPr sites as the test dataset. We employed the GPS program [
23] to predict pS sites for each subfamily from both datasets (
Figure 4). We found that four subfamilies (i.e. AGC, CAMK, STE and TKL) tended to phosphorylate pSADPr sites (P<5.0×10
-26, hyper-geometric test). In comparison, two subfamilies (i.e. CK1 and CMGC) prefer not to phosphorylate pSADPr sites (p<5.1×10
-29, hyper-geometric test). For example, 68% of pSADPr sites could be phosphorylated by the AGC subfamily, whereas only 44% of pS sites are modified by this subfamily (P=2.3×10
-174, hyper-geometric test). This observation suggests that the pSADPr sites may be related to specific subfamilies of serine kinases.
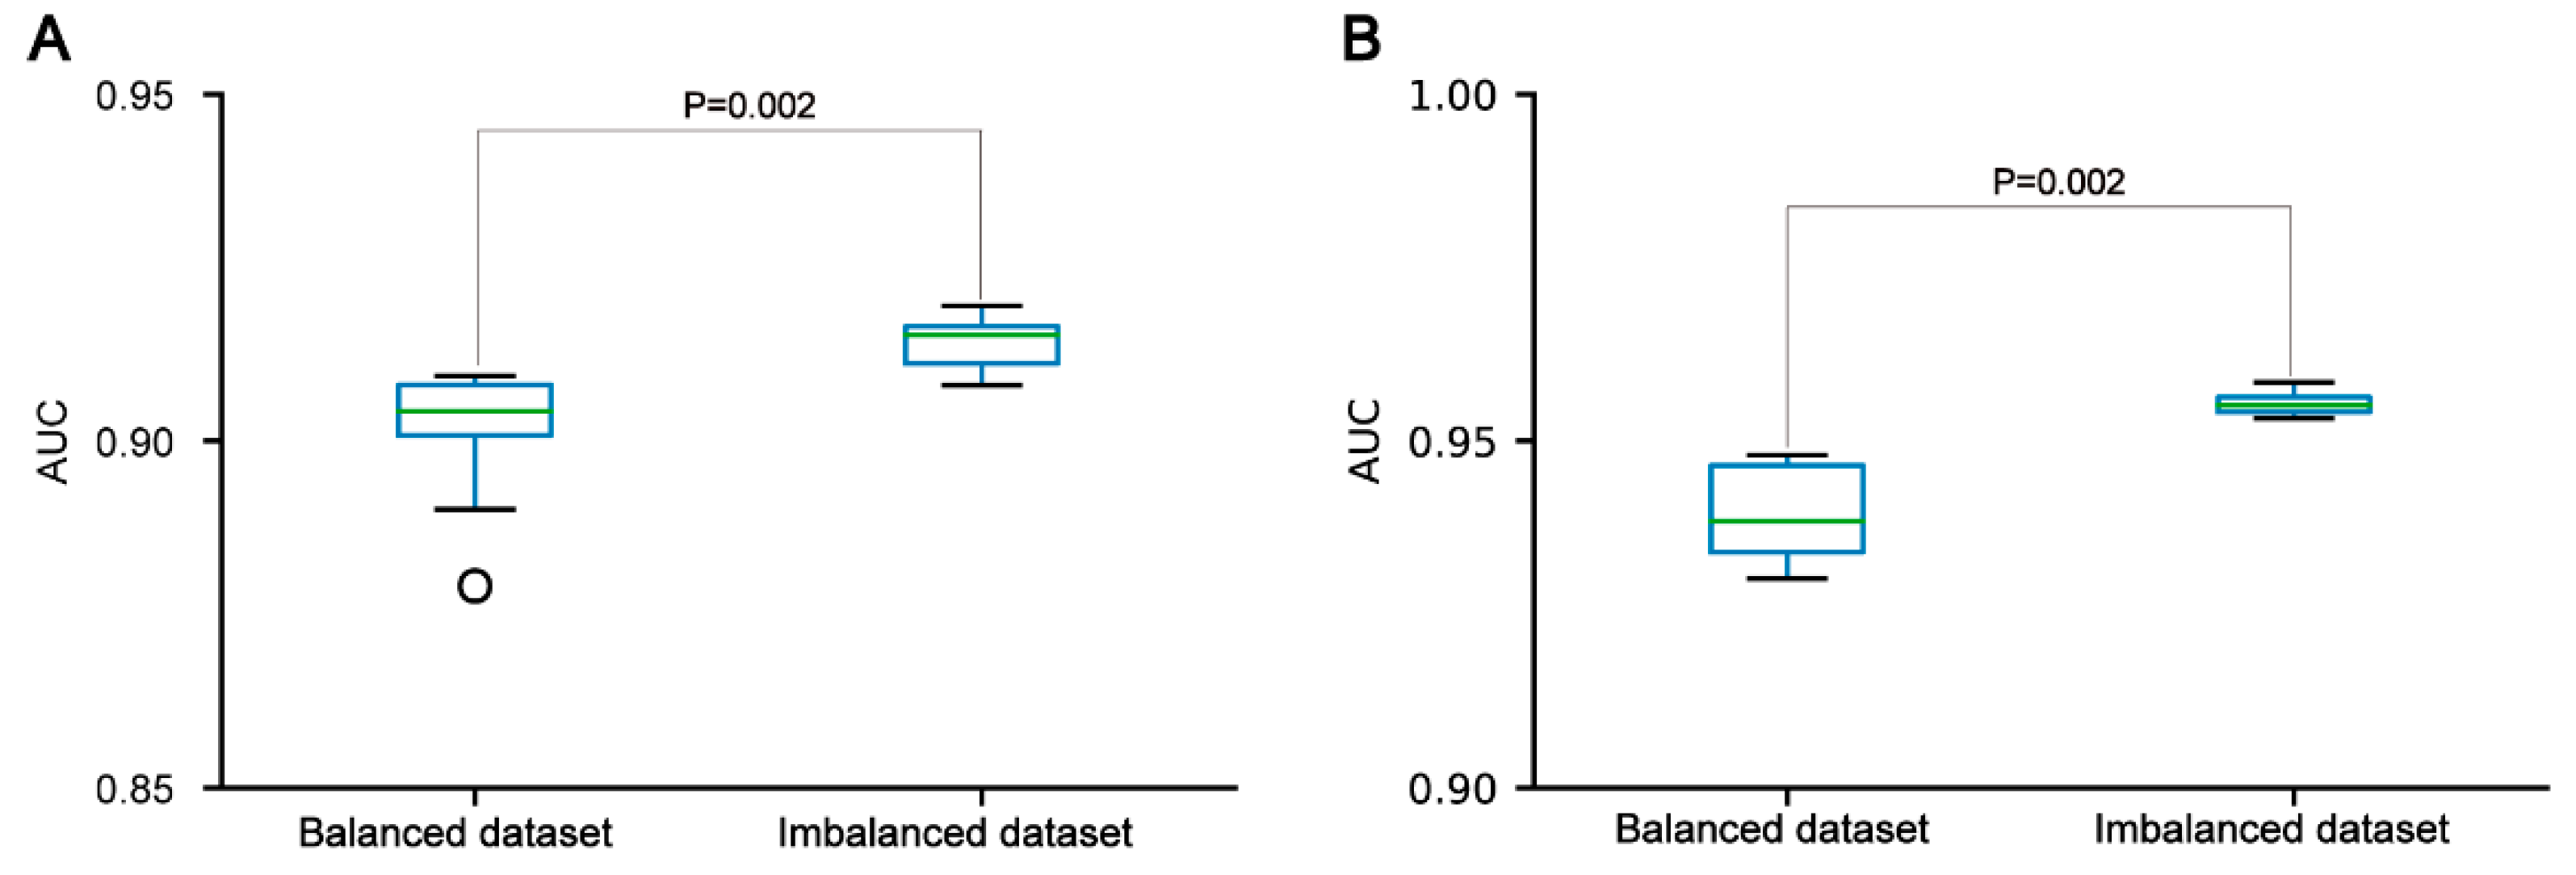
In the three datasets, the pSADPr-pS and pSADPr-UM datasets were imbalanced because the numbers of pS and UM peptides were far more than the number of pSADPr peptides (
Figure 1C,D). To explore the effect of the imbalanced dataset on the predictor’s performance, we built the related balanced cross-validation dataset where the number (2162) of randomly selected pS or UM peptides was the same as that of pSADPr peptides. We constructed the CNN
OH models related to the imbalanced and balanced datasets and evaluated their prediction performances in terms of the independent test. The CNN
OH model based on the imbalanced dataset had better performance than the counterpart constructed using the balanced dataset (p=0.002 for both pSADPr-pS and pSADPr-UM datasets, Wilcoxon rank sum test;
Figure 5). Therefore, we chose the imbalanced dataset for model construction.
3.2. Construction and evaluation of CNN-based classifiers
We constructed five CNN classifiers (i.e. CNN
OH, CNN
WE, CNN
EAAC, CNN
EGAAC and CNN
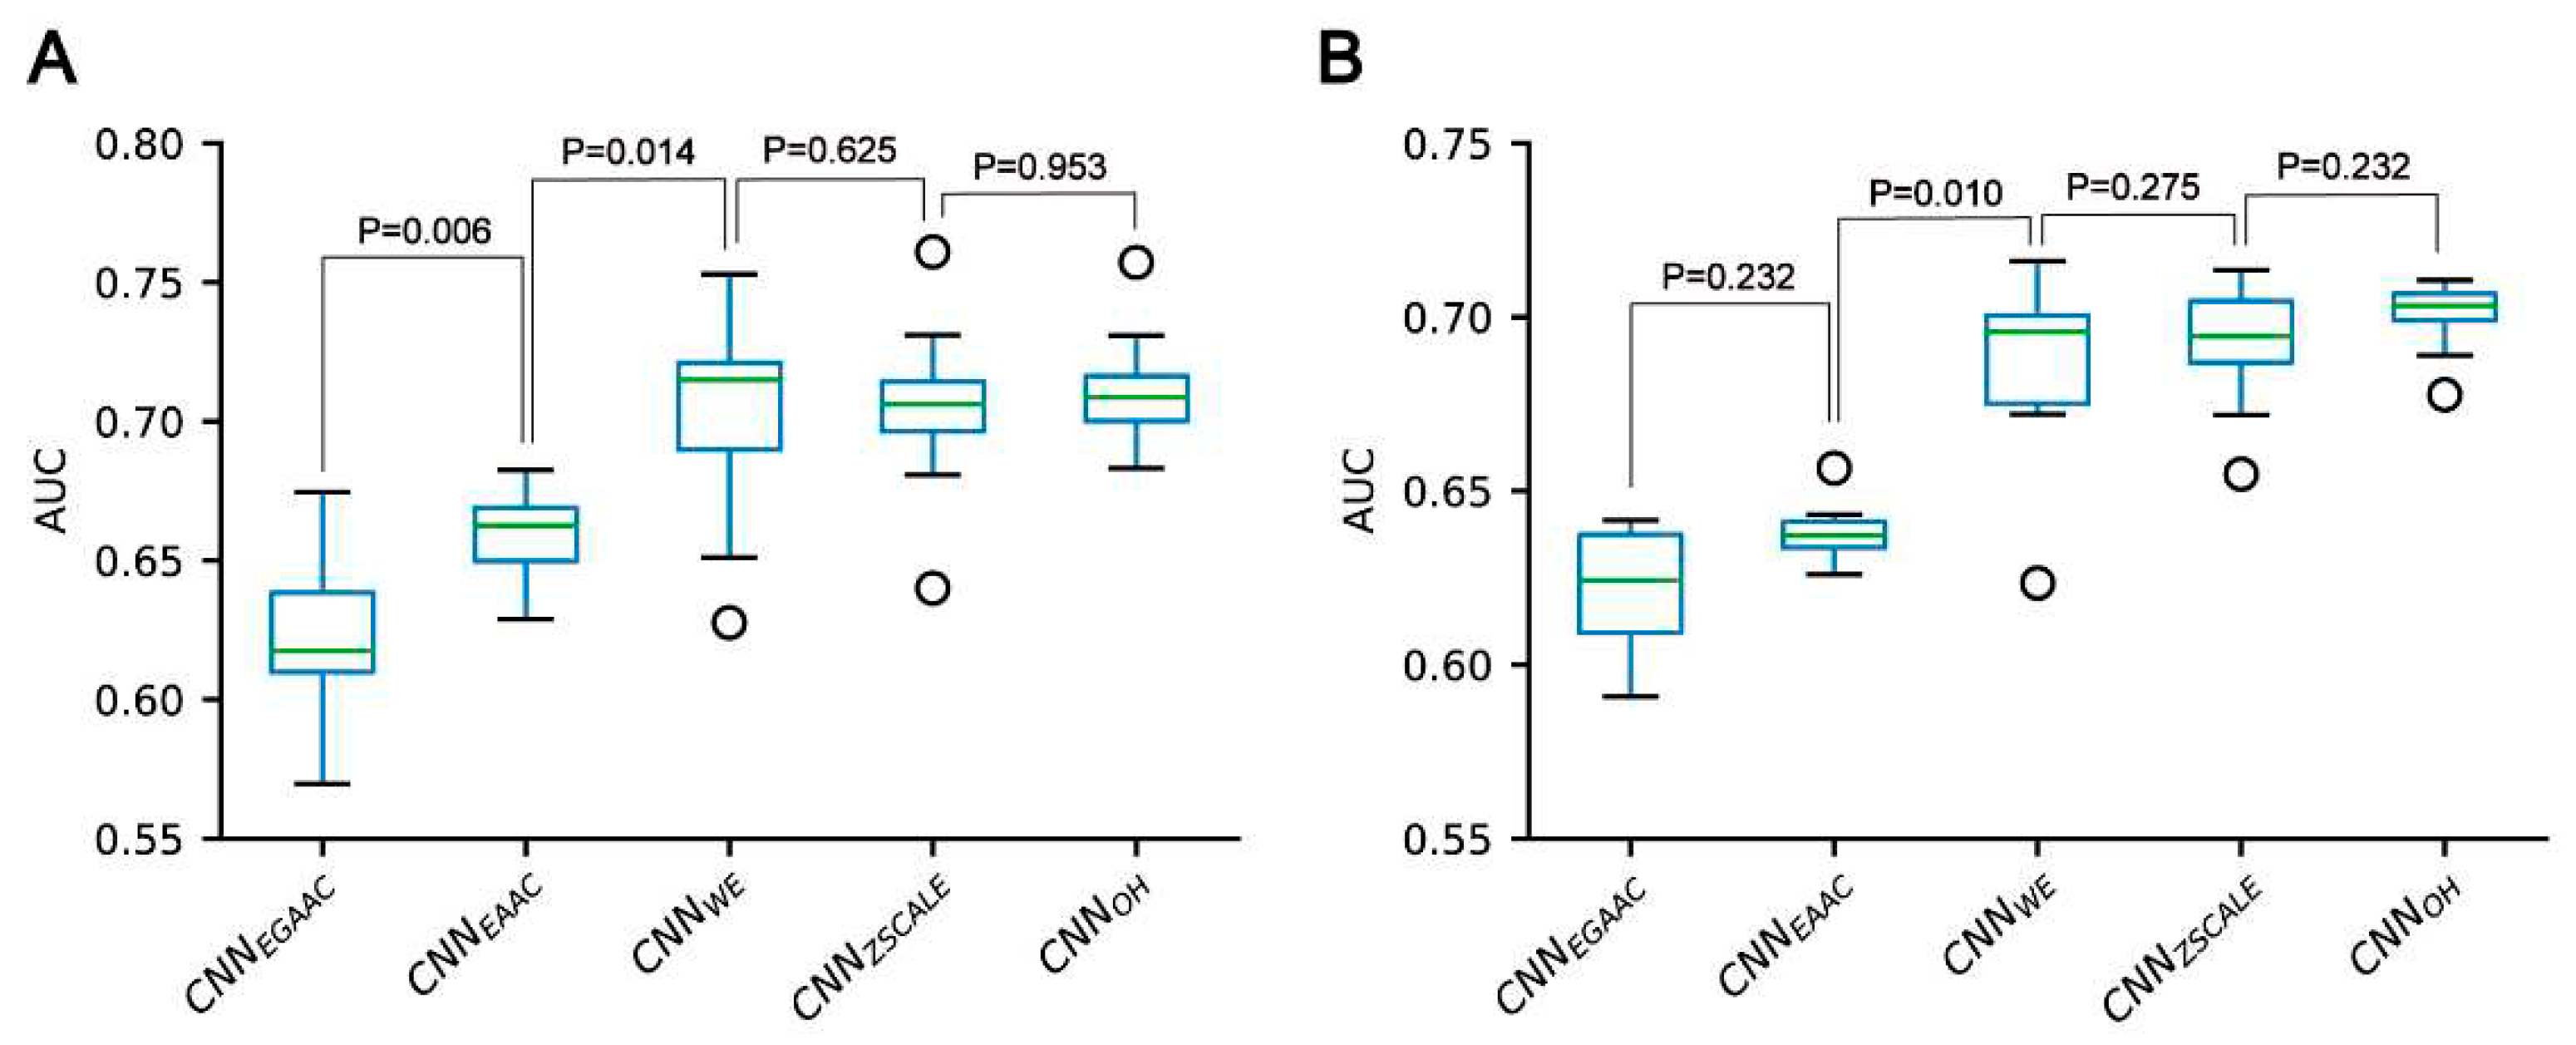
ZSCALE) to recognize pSADPr sites from the three datasets and compared their prediction performances. Here, we used the pSADPr-SADPr dataset to demonstrate the process. Three out of the five classifiers (i.e. CNN
OH, CNN
WE and CNN
ZSCALE) showed similar performances and superiority over the rest two (i.e. CNN
EAAC and CNN
EGAAC) in ten-fold cross-validation and independent test (
Table 1;
Figures 6 and S1). For instance, the CNN
OH model had an AUC value of 0.712, larger than that (0.659) of the CNN
EAAC model in the cross-validation. We repeated this analysis for the pSADPr-pS and pSADPr-UM datasets and made similar observations that the three classifiers had the best performances (
Tables S1 and S2;
Figures S2–S5). Furthermore, we compared the classifiers’ performances for the three datasets. We found that the AUC values (0.921 & 0.953) of the CNN
OH classifiers for pSADPr-pS and pSADPr-UM datasets were significantly larger than that (0.712) for the pSADPr-SADPr dataset. These results were consistent with our observation that the differences between pSADPr and SADPr sites are smaller than those between pSADPr and pS/UM sites (
Figure 3). Since the One-Hot feature is the simplest compared to the Word-Embedding and ZSCALE features, we chose the CNN classifier with the One-Hot scheme as the representative of the three classifiers.
3.3. Construction and evaluation of stacking ensemble learning classifiers
A stacking-based ensemble learning architecture is one of the ensemble techniques in which multiple learning models are integrated to produce one optimal predictive model, which performs better than the base models taken alone. In the stacking ensemble architecture, a meta-learner is trained to output a prediction based on the different base learner’s predictions. The stacking ensemble architecture has been used to improve the prediction performance in various bioinformatics applications (e.g. lysine acetylation site prediction) [
24,
25,
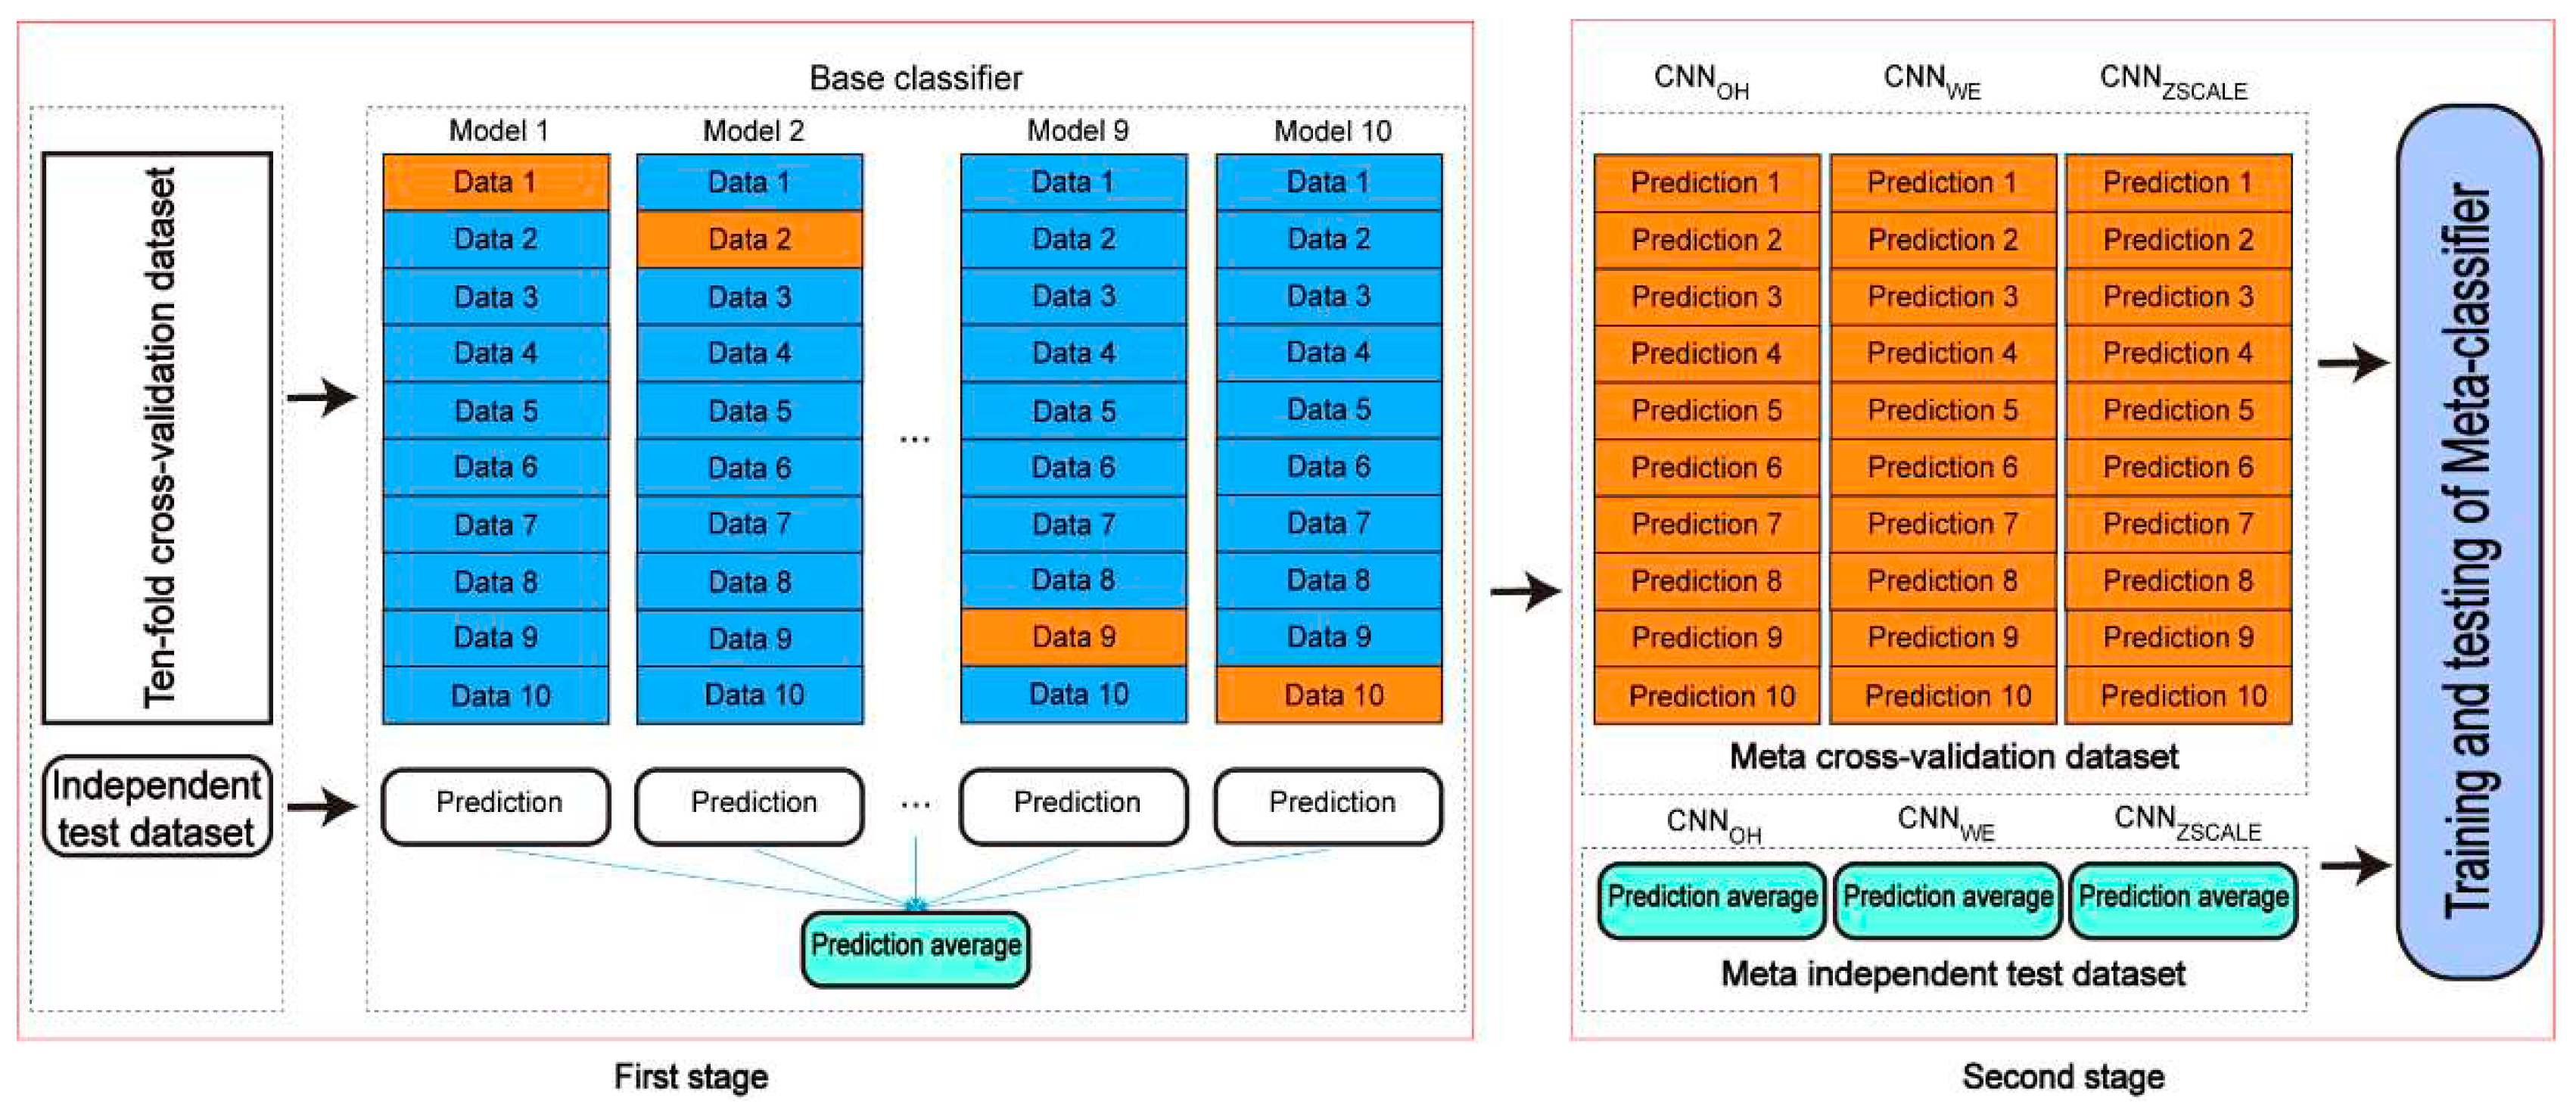
26]. Here, we introduced the two-stage stacking ensemble approach to improve the performance of the pSADPr site prediction (
Figure 7). In the first stage, different CNN algorithms (e.g. CNN
OH, CNN
WE and CNN
ZSCALE) were selected to construct base classifiers. Specifically, ten base classifiers for each CNN algorithm were built and validated using the ten-fold cross-validation dataset. The base classifiers were then used for prediction in the independent test dataset, and their prediction results were averaged. Therefore, each CNN algorithm corresponds to the validation result and the averaged result for the independent test dataset. In the second stage, the validation and the averaged results were merged as a meta cross-validation dataset and a meta-independent test dataset, respectively (
Figure 7). The former dataset was used to train and validate a meta-classifier, whereas the latter was employed to evaluate the meta-classifier’s performance. Here, we constructed the meta-classifier using the random forest algorithm (RF), which was optimized using the GridSearchCV package. The optimized parameters included max_depth as 8, max_features as ‘sqrt’, min_samples_leaf as 20, min_samples_split as 300 and n_estimators as 100.
According to the above analysis, the three classifiers (i.e. CNN
OH, CNN
WE and CNN
ZSCALE) had better performances than two other classifiers (i.e. CNN
EAAC and CNN
EGAAC) for all three datasets. Based on the observation, we fused them as base classifiers to build the two-stage stacking ensemble approach with a good performance. We started with the fusion of the three best classifiers until we fused all the classifiers. The related stacking models included Stacking
O+Z+W, Stacking
O+Z+W+E and Stacking
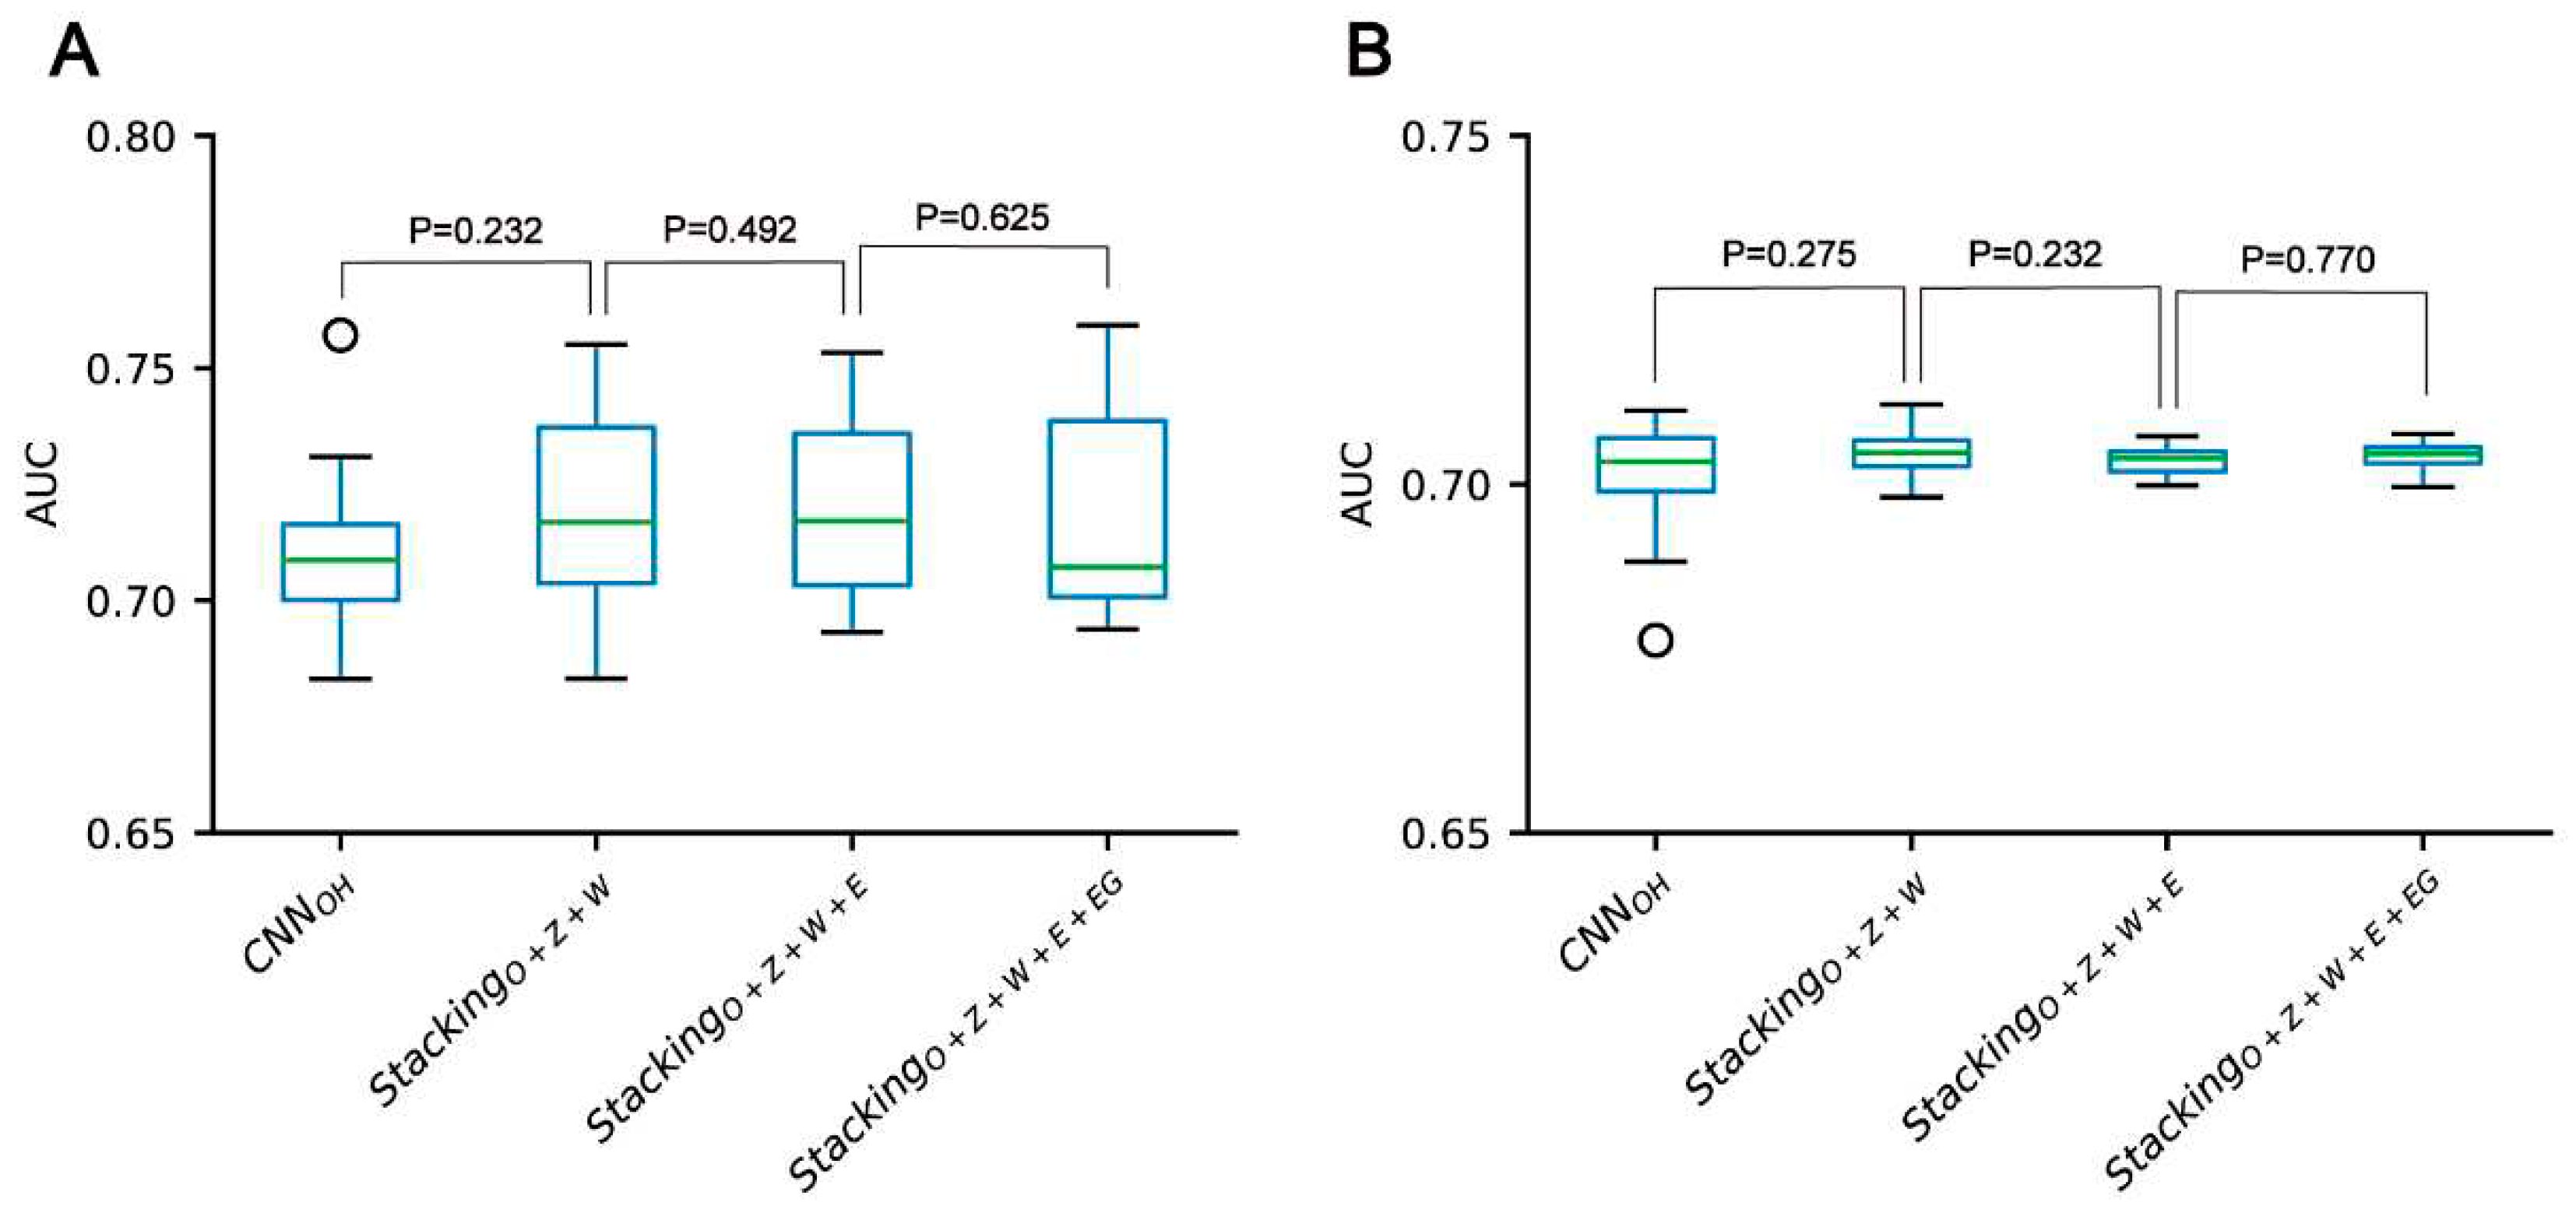
O+Z+W+E+EG, where O stands for OH, Z for ZSCALE, W for WE, E for EAAC and EG for EGAAC. For the pSADPr-SADPr dataset, the three stacking models showed similar performances in meta ten-fold cross-validation and independent test (
Table 2;
Figure 8 and
Figure S6). For instance, their average AUC/MCC values were around 0.719/0.313 in cross-validation (
Table 2). The stacking models for the two other datasets (pSADPr-pS and pSADPr-UM) also performed similarly (
Figures S7–S10).
3.4. Comparison of CNN-based models and stacking ensemble models
We compared the performances of the CNN-based models and the stacking ensemble models for each of the three datasets. We found no statistical difference between the CNN
OH model and these stacking ensemble models for each dataset (
Figures 8, S10 and S11). The observation that the meta-classifiers perform similarly to the base classifier is consistent with the previous report for predicting bacterial Type IV secreted effectors, in which the meta-classifier and base classifier performed similarly [
27]. It suggests that the base classifiers may have sufficient predictive ability, and the stacking ensemble architecture does not constantly improve prediction accuracy.
3.5. Construction of the online EdeepSADPr predictor
We developed an online prediction tool for predicting human pSADPr sites extensively from different conditions, dubbed EdeepSADPr. This tool consists of three models, each corresponding to the prediction from the SADPr dataset, the serine phosphorylation dataset or the human proteome. As the CNN
OH classifier had no less predictive performance than other methods, we selected this classifier to construct EdeepSADPr. The usage of this tool was described as follows. After the model selection, the input sequence with the fasta format would be uploaded. The prediction results were output in tabular form with five columns: sequence header, position, sequence, prediction score, and prediction category. The predicted results can also be downloaded as a data file. EdeepSADPr is accessible via
http://edeepsadpr.bioinfogo.org/.
4. Conclusion
The main goal of this study is to develop a model with good performance to predict pSADPr sites from protein sequence information and to investigate the characteristics of pSADPr. We developed different deep-learning classifiers and used them as base classifiers to construct a few stacking-based ensemble models. It was demonstrated that the base classifiers and the ensemble models had similar performances. Nevertheless, this observation may require further investigation. Moreover, we found the characteristics of pSADPr sites, which may boost the understanding of this crosstalk. In summary, we developed the first classifier to predict human pSADPr sites and expect accurate prediction facilitate the discovery of new EdeepSADPr sites.
Supplementary Materials
The following supporting information can be downloaded at the website of this paper posted on Preprints.org.
Author Contributions
L.L. conceived this project. H.J. and Y.S. constructed the algorithms; H.J. analyzed the data; H.J., S.S., Y.S. and L.L. wrote the manuscript. All authors have read and agreed to the published version of the manuscript.
Funding
This work was supported by the National Natural Science Foundation of China (Grant 32071430 and Grant 32271504).
Conflicts of Interest
The authors declare that the research was conducted without any commercial or financial relationships that could be construed as a potential conflict of interest.
References
- Zolnierowicz, S. and M. Bollen, Protein phosphorylation and protein phosphatases. De Panne, Belgium, September 19-24, 1999. EMBO J, 2000. 19(4): p. 483-8. [CrossRef]
- Nowak, K., et al., Engineering Af1521 improves ADP-ribose binding and identification of ADP-ribosylated proteins. Nat Commun, 2020. 11(1): p. 5199. [CrossRef]
- Brustel, J., et al., Linking DNA repair and cell cycle progression through serine ADP-ribosylation of histones. Nat Commun, 2022. 13(1): p. 185. [CrossRef]
- Larsen, S.C., et al., Systems-wide Analysis of Serine ADP-Ribosylation Reveals Widespread Occurrence and Site-Specific Overlap with Phosphorylation. Cell Rep, 2018. 24(9): p. 2493-2505 e4. [CrossRef]
- Peng, M., et al., Identification of enriched PTM crosstalk motifs from large-scale experimental data sets. J Proteome Res, 2014. 13(1): p. 249-59. [CrossRef]
- Venne, A.S., L. Kollipara, and R.P. Zahedi, The next level of complexity: crosstalk of posttranslational modifications. Proteomics, 2014. 14(4-5): p. 513-24. [CrossRef]
- Luo, F., et al., DeepPhos: prediction of protein phosphorylation sites with deep learning. Bioinformatics, 2019. 35(16): p. 2766-2773. [CrossRef]
- Sha, Y., et al., DeepSADPr: A Hybrid-learning Architecture for Serine ADP-ribosylation site prediction. Methods, 2021. [CrossRef]
- Buch-Larsen, S.C., et al., Mapping Physiological ADP-Ribosylation Using Activated Ion Electron Transfer Dissociation. Cell Reports, 2020. 32(12). [CrossRef]
- Hendriks, I.A., S.C. Larsen, and M.L. Nielsen, An Advanced Strategy for Comprehensive Profiling of ADP- ribosylation Sites Using Mass Spectrometry- based Proteomics. Molecular & Cellular Proteomics, 2019. 18(5): p. 1010-1026. [CrossRef]
- Hornbeck, P.V., et al., PhosphoSitePlus: a comprehensive resource for investigating the structure and function of experimentally determined post-translational modifications in man and mouse. Nucleic Acids Res, 2012. 40(Database issue): p. D261-70. [CrossRef]
- Sha, Y., et al., DeepSADPr: A hybrid-learning architecture for serine ADP-ribosylation site prediction. Methods, 2022. 203: p. 575-583. [CrossRef]
- Huang, Y., et al., CD-HIT Suite: a web server for clustering and comparing biological sequences. Bioinformatics, 2010. 26(5): p. 680-2. [CrossRef]
- Li, W. and A. Godzik, Cd-hit: a fast program for clustering and comparing large sets of protein or nucleotide sequences. Bioinformatics, 2006. 22(13): p. 1658-9. [CrossRef]
- Wang, D., et al., MusiteDeep: a deep-learning based webserver for protein post-translational modification site prediction and visualization. Nucleic Acids Res, 2020. 48(W1): p. W140-W146. [CrossRef]
- Chen, Z., et al., iFeature: a Python package and web server for features extraction and selection from protein and peptide sequences. Bioinformatics, 2018. 34(14): p. 2499-2502. [CrossRef]
- Zhang, L., et al., DeepKhib: A Deep-Learning Framework for Lysine 2-Hydroxyisobutyrylation Sites Prediction. Front Cell Dev Biol, 2020. 8: p. 580217. [CrossRef]
- Chen, Y.Z., et al., SUMOhydro: a novel method for the prediction of sumoylation sites based on hydrophobic properties. PLoS One, 2012. 7(6): p. e39195. [CrossRef]
- Ge, L. Improving text classification with word embedding. in IEEE International Conference on Big Data. 2018.
- Lyu, X.R., et al., DeepCSO: A Deep-Learning Network Approach to Predicting Cysteine S-Sulphenylation Sites. Frontiers in Cell and Developmental Biology, 2020. 8. [CrossRef]
- Wei, X.L., et al., DeepKcrot: A Deep-Learning Architecture for General and Species-Specific Lysine Crotonylation Site Prediction. Ieee Access, 2021. 9: p. 49504-49513. [CrossRef]
- Vacic, V., L.M. Iakoucheva, and P. Radivojac, Two Sample Logo: a graphical representation of the differences between two sets of sequence alignments. Bioinformatics, 2006. 22(12): p. 1536-7. [CrossRef]
- Wang, C., et al., GPS 5.0: An Update on the Prediction of Kinase-specific Phosphorylation Sites in Proteins. Genomics Proteomics Bioinformatics, 2020. 18(1): p. 72-80. [CrossRef]
- Mishra, A., P. Pokhrel, and M.T. Hoque, StackDPPred: a stacking based prediction of DNA-binding protein from sequence. Bioinformatics, 2019. 35(3): p. 433-441. [CrossRef]
- Basith, S., G. Lee, and B. Manavalan, STALLION: a stacking-based ensemble learning framework for prokaryotic lysine acetylation site prediction. Brief Bioinform, 2022. 23(1). [CrossRef]
- Zhang, L., et al., SBP-SITA: A sequence-based prediction tool for S-itaconation. bioRxiv, 2021.
- Xiong, Y., et al., PredT4SE-Stack: Prediction of Bacterial Type IV Secreted Effectors From Protein Sequences Using a Stacked Ensemble Method. Front Microbiol, 2018. 9: p. 2571. [CrossRef]
|
Disclaimer/Publisher’s Note: The statements, opinions and data contained in all publications are solely those of the individual author(s) and contributor(s) and not of MDPI and/or the editor(s). MDPI and/or the editor(s) disclaim responsibility for any injury to people or property resulting from any ideas, methods, instructions or products referred to in the content. |
© 2023 by the authors. Licensee MDPI, Basel, Switzerland. This article is an open access article distributed under the terms and conditions of the Creative Commons Attribution (CC BY) license (http://creativecommons.org/licenses/by/4.0/).
