1. Introduction
Research into chaotic mathematical systems is key for studying astrophysics and space science. One illustration of applicability to astrophysics and space science is stellar dynamics, where some variable stars have slightly similar-looking dynamics. There are also dynamo currents generating planetary and stellar magnetic fields. In the case of planetary orbits, chaos plays an interesting role, but since this is not a dissipative system there are no real attractors, but rather chaotic regions separated by quasiperiodic orbits.
Control of chaos refers to a process wherein a tiny perturbation is applied to a chaotic system, in order to realize a desirable (chaotic, periodic, or stationary) behavior. [1]
Figure 1.
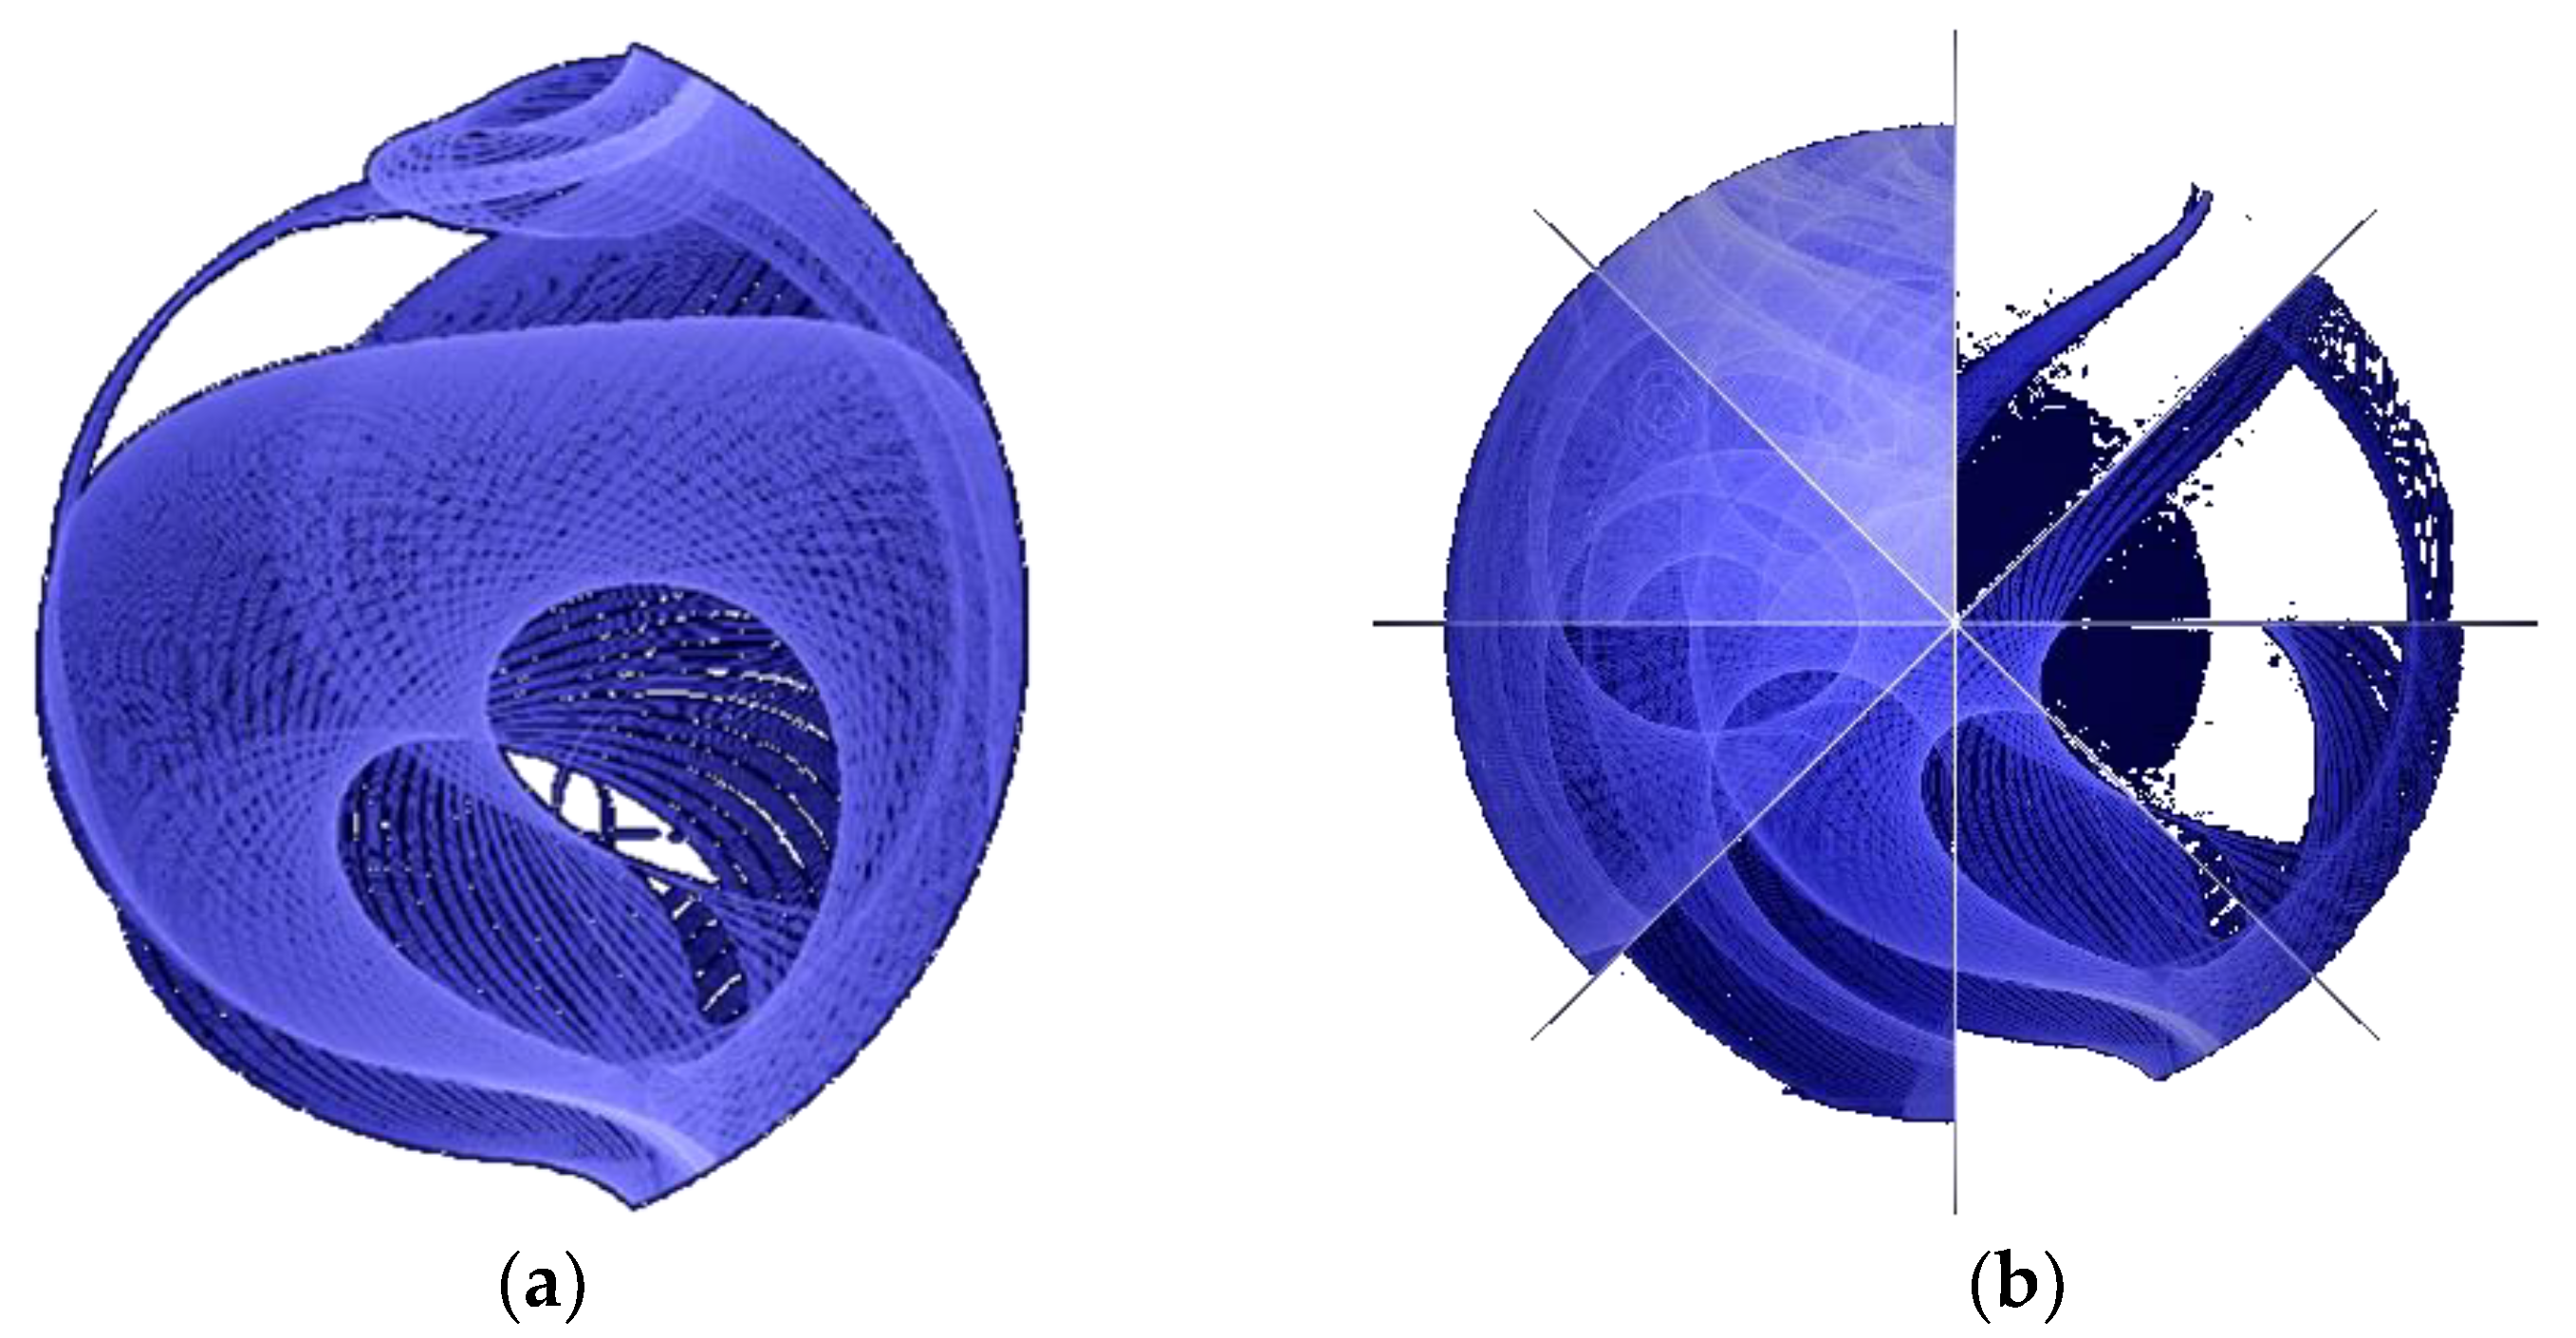
Data of a famous pulsar, neutron stars, the crushed cores of massive suns that destroyed themselves when they ran out of fuel, collapsed and exploded. Photo credit NASA's Goddard Space Flight Center, (a) credit NASA/DOE/Fermi LAT Collaboration, (b) credit . Taken from [7] in compliance with NASA’s image use policy [8].
In 2000, Boccalettia reviewed the major ideas involved in the control of chaos and proposed two methods: the Ott–Grebogi–Yorke (OGY) method and the adaptive method both seeking to bring a trajectory to a small neighborhood of a desired location, seeking stabilized desired chaotic orbits embedded in a chaotic attractor including a review of relevant experimental applications of the techniques [1]. Ott, C. Grebogi and J. A. Yorke observed that the infinite number of unstable periodic orbits typically embedded in a chaotic attractor could be taken advantage of for the purpose of achieving control by means of applying only very small perturbations [1]. Song, et. al, proposed combining feedback control with OGY method [2], and this trend to utilize feedforward followed by application of feedback might be considered canonical. Back in 1992, Pyragas had already offered continuous control of chaos by self-controlling feedback [3].
Adaptive methods as offered by Slotine and Li [4] strictly rely on a feedforward implementation augmented by feedback adaption of the feedforward dynamics, but also utilize elements of classical feedback adaption (e.g. the M.I.T. rule [5]) to adapt classical feedback control gains and adapt the desired trajectory to eliminate tracking errors. Following kinetic improvements to Slotine’s approach by Fossen [6,7] and subsequent researchers [8] the approach was experimentally validated in [9]. In 2017, Cooper and Heidlaulf [10] proposed extracting the feedforward elements of Slotine’s approach for controlling chaos of the famous van der Pol oscillator [11] which has grown to become a benchmark system for representing chaotic systems like relaxation oscillators [12], frequency demultiplication [13], heartbeats [14] and nonlinear electric oscillators in general [15].
Cooper and Heidlauf’s techniques were initially paired with linear feedback control (linear quadratic optimal control), but the combination of feedback and feedforward proved ineffective. Smeresky and Rizzo offered 2-norm optimal feedback using pseudoinverse in 2020 [16], and the combination proved effective for controlling highly nonlinear, coupled (non-chaotic) Euler’s moment equations. The combination of feedforward and optimal feedback learning was formulated for five-degree of freedom oceanic vehicles in [17] and labeled deterministic artificial intelligence. Shortly afterwards, Zhai directly compared stochastic artificial intelligence methods: neural networks and physics-informed deep learning in [18] and [19].
This manuscript follows the same lineage of thought for Lorenz systems as just described for Euler’s equations and van der Pol systems. The same broad techniques applied to the chaotic Lorenz system begins with combining idealized feedforward elements with prescribed trajectories to be tracked. Identifying a method to control a chaotic Lorenz system could be beneficial to ubiquitous applications, including radar [21]. Linear feedback control alone proves ineffective controlling Lorenz system behavior.
Paralleling the work of Cooper and Heidlauf applied to van der Pol systems, section 2 of this manuscript develops idealized feedforward elements for chaotic Lorenz systems. System linearization is performed to facilitate development of classical linear feedback elements. The methods are modeled, and simulation experiments were performed in SIMLINK®, where the results are presented in
Section 3.
2. Materials and Methods
The Lorenz system is a chaotic system described by the differential equations (1), (2), and (3), where x, y, and z are the state variables and
, r, and b are the Lorenz parameters.
Table 1 describes the variables and their definitions used throughout this manuscript.
The Lorenz parameters were placed in the vector of unknowns, as seen in equation (4). The matrix of knowns contains prescribed x, y, and z values. The x, y, and z parameters are driven to sinusoids. In this manuscript, the amplitude of the prescribed sinusoids used is 500 and the frequency of the prescribed sinusoids is 100.
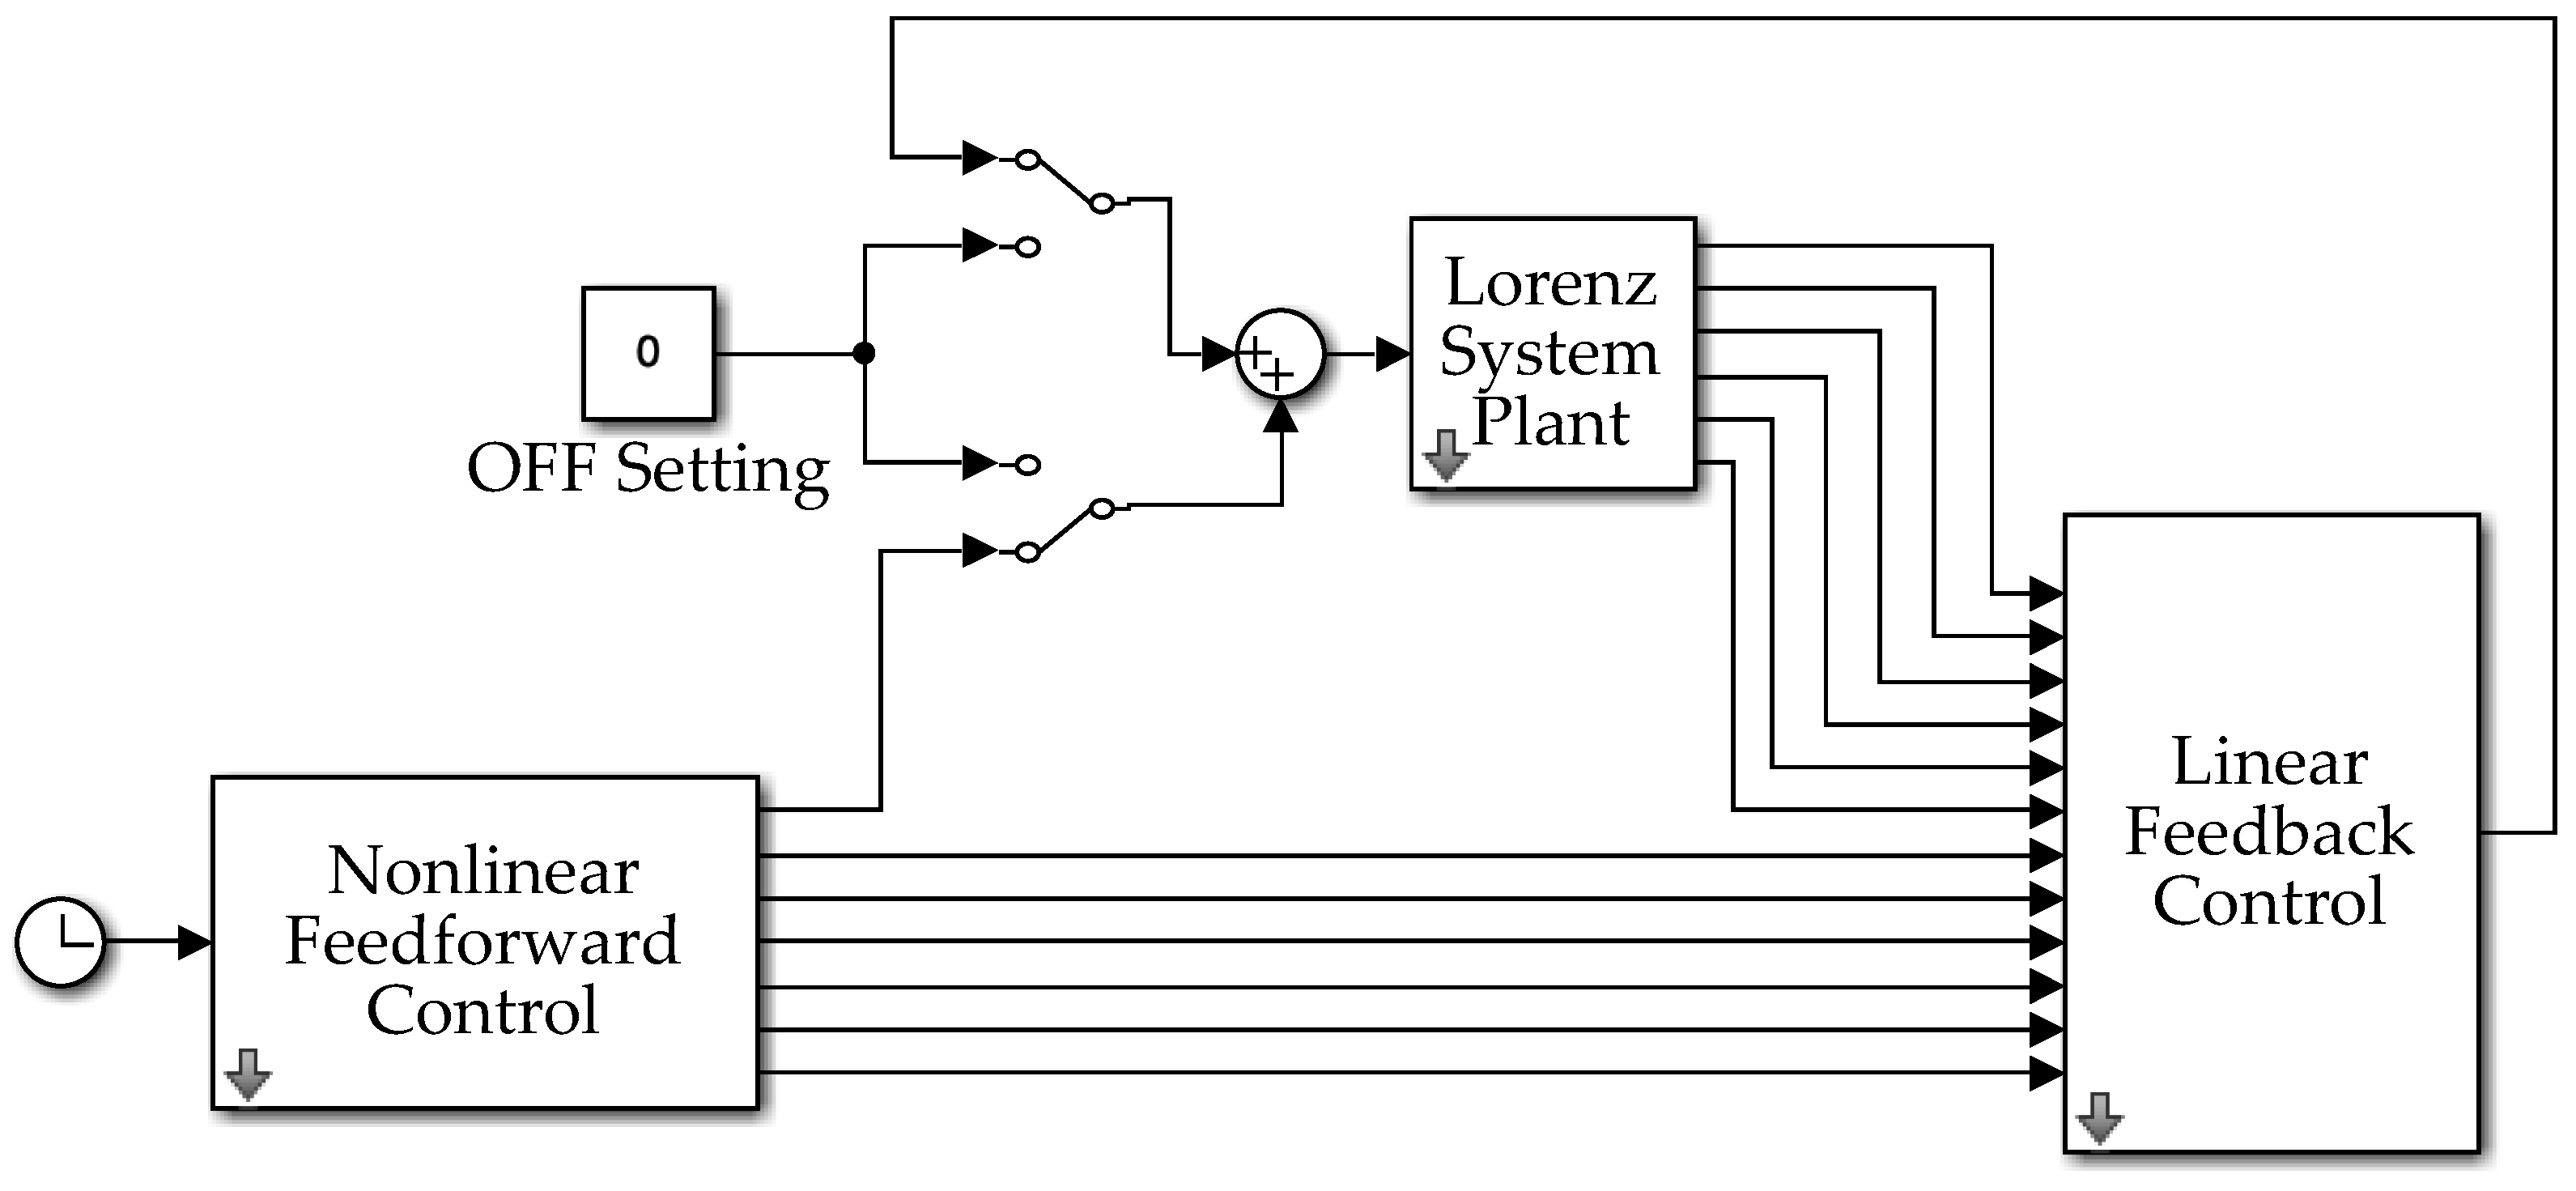
The Lorenz system is modeled in MATLAB® Simulink®, according to the topology seen in
Figure 1. A Runge-Kutta ode4 solver is used for all the simulations in this manuscript with a fixed step-size of 0.001.
Figure 1.
Lorenz system topology coded in MATLAB/SIMULINK software. The forced Lorenz differential equations (1), (2), and (3) are modeled within the Lorenz System Plant, seen in
Appendix A. The external force is set to a sinusoidal input function based on the current simulation time. The linear feedback control and nonlinear feedforward controls can be activated using manual switches. The linear feedback and nonlinear feedforward control subsystem blocks are detailed in
Appendix A.
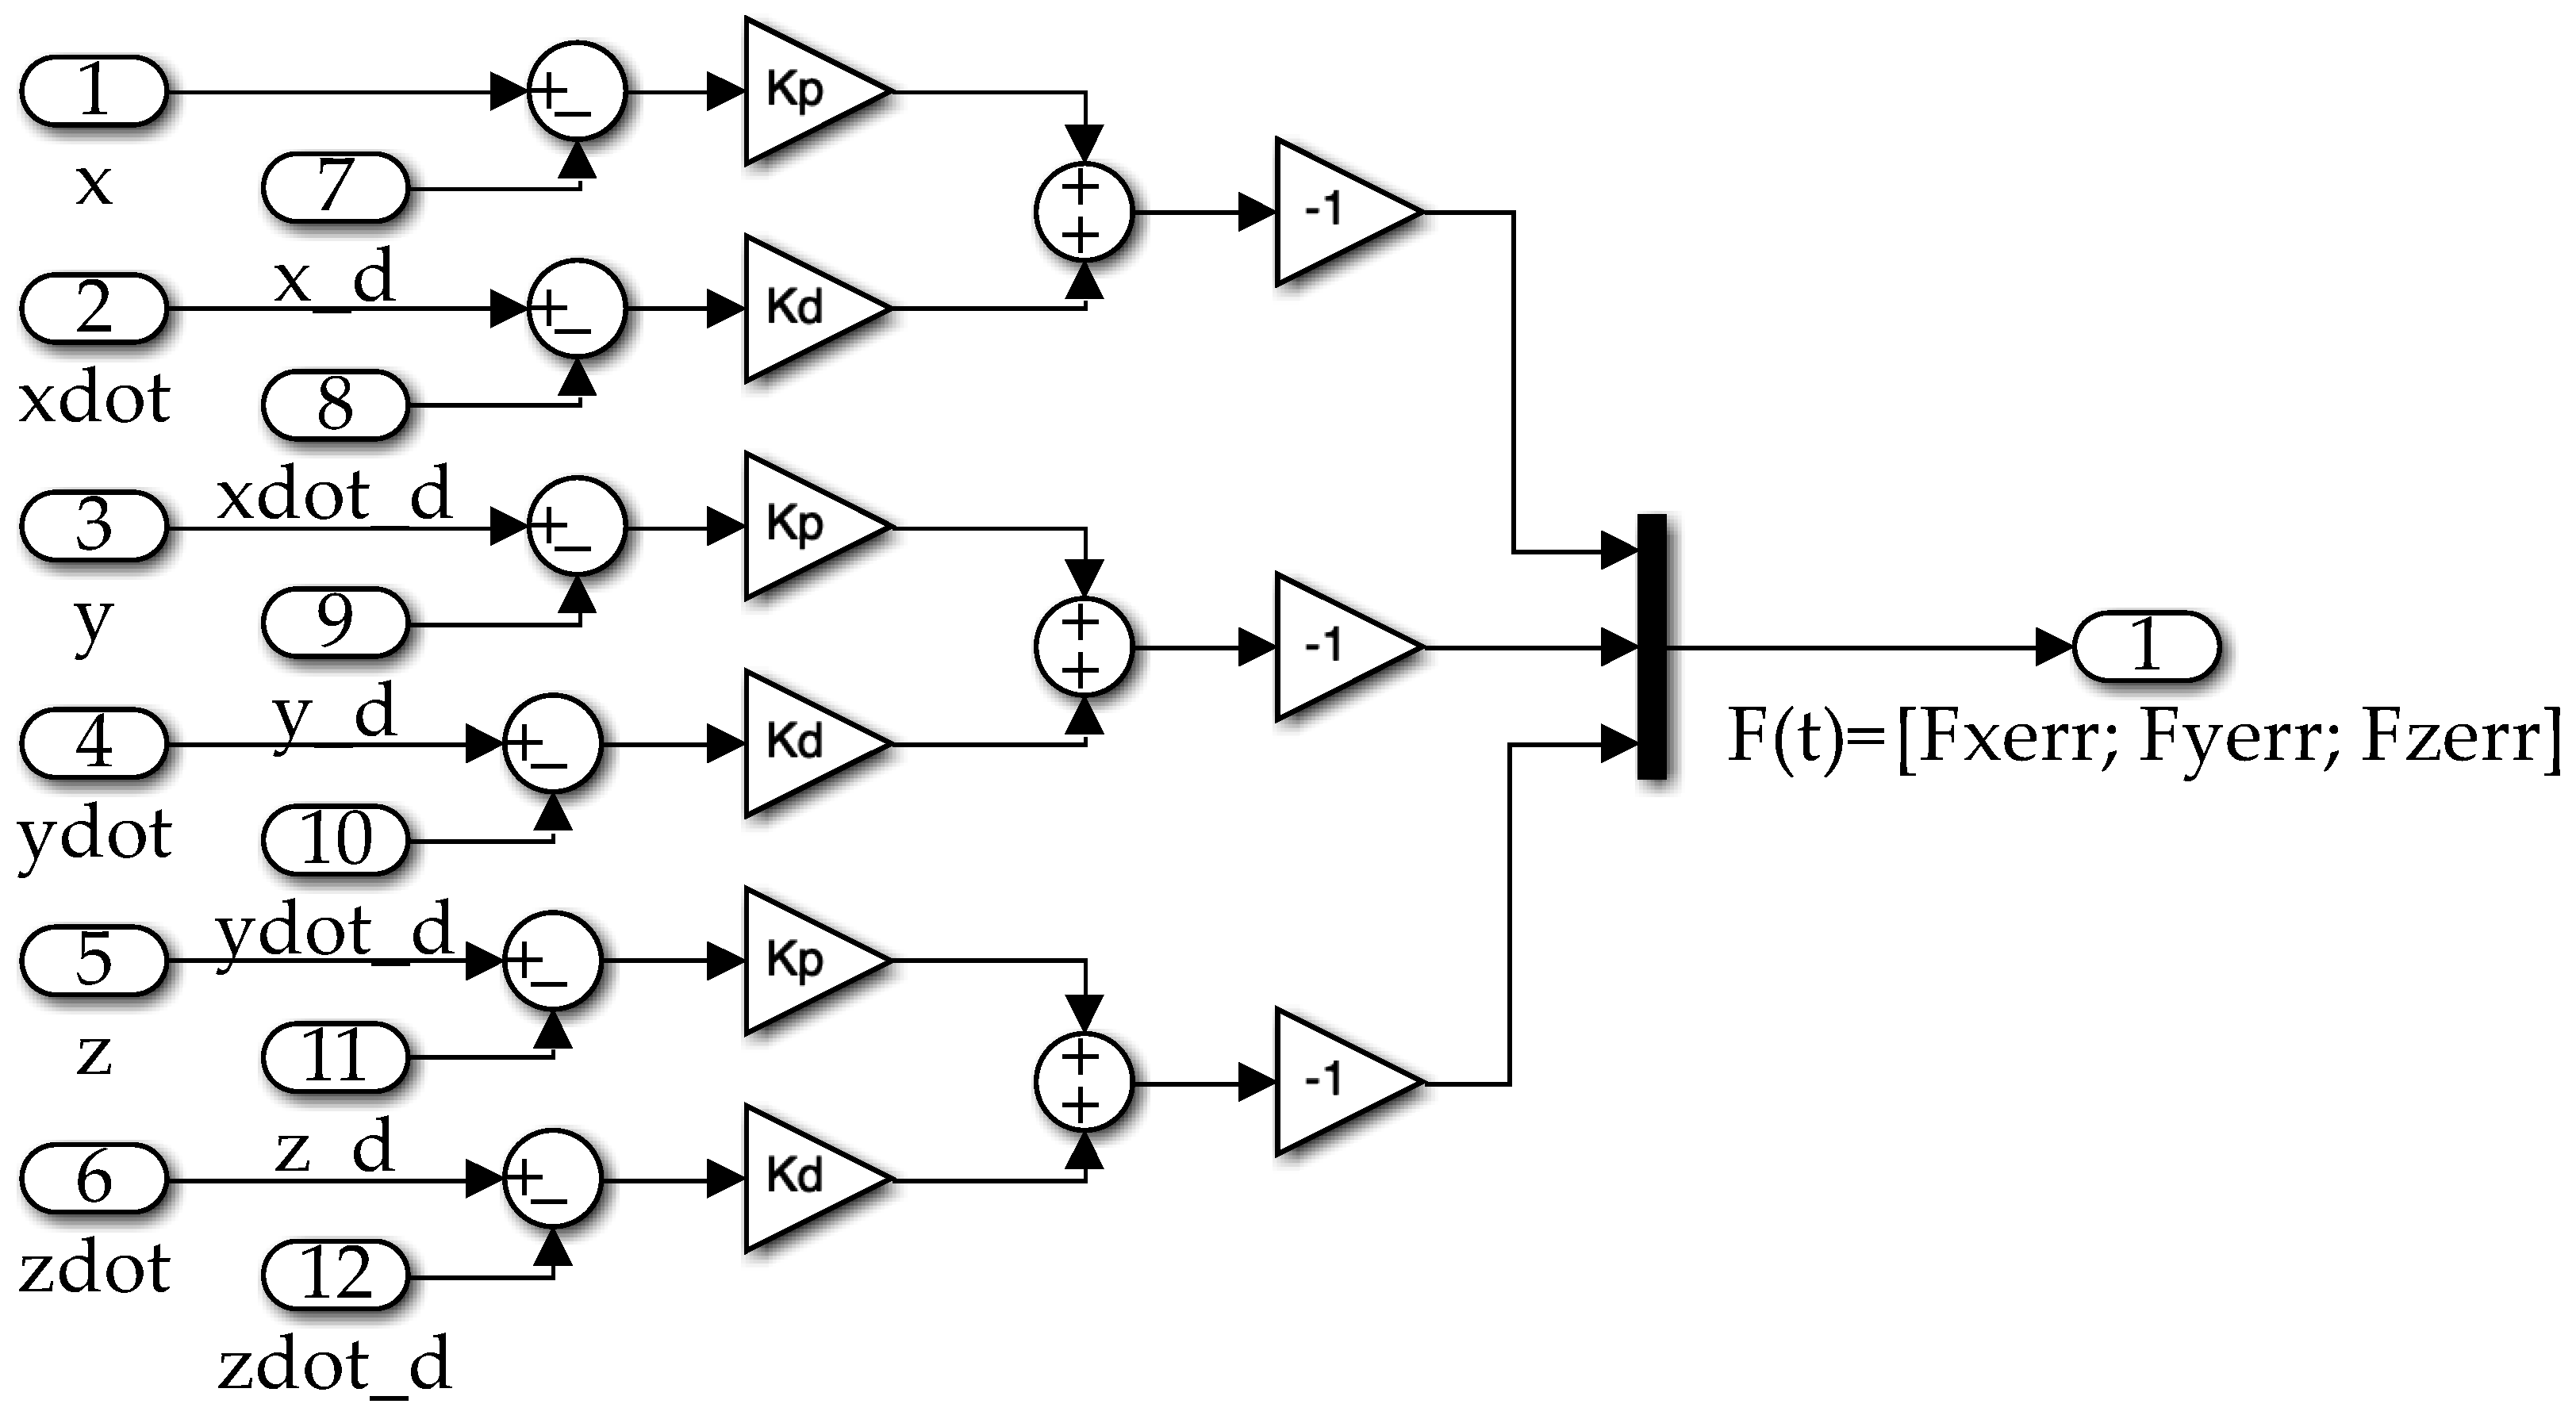
The linear feedback controller is an instantiation of a Proportional Derivative (PD) Controller. Both proportional gains are applied to the state (x, y, and z) errors, while derivative gains are applied to the rate (dx/dt, dy/dt, and dz/dt) errors. The grouped subsystem topology can be seen in
Appendix A. The proportional and velocity gain values,
and
, were set to 2.6818 and 0.4142, respectively.
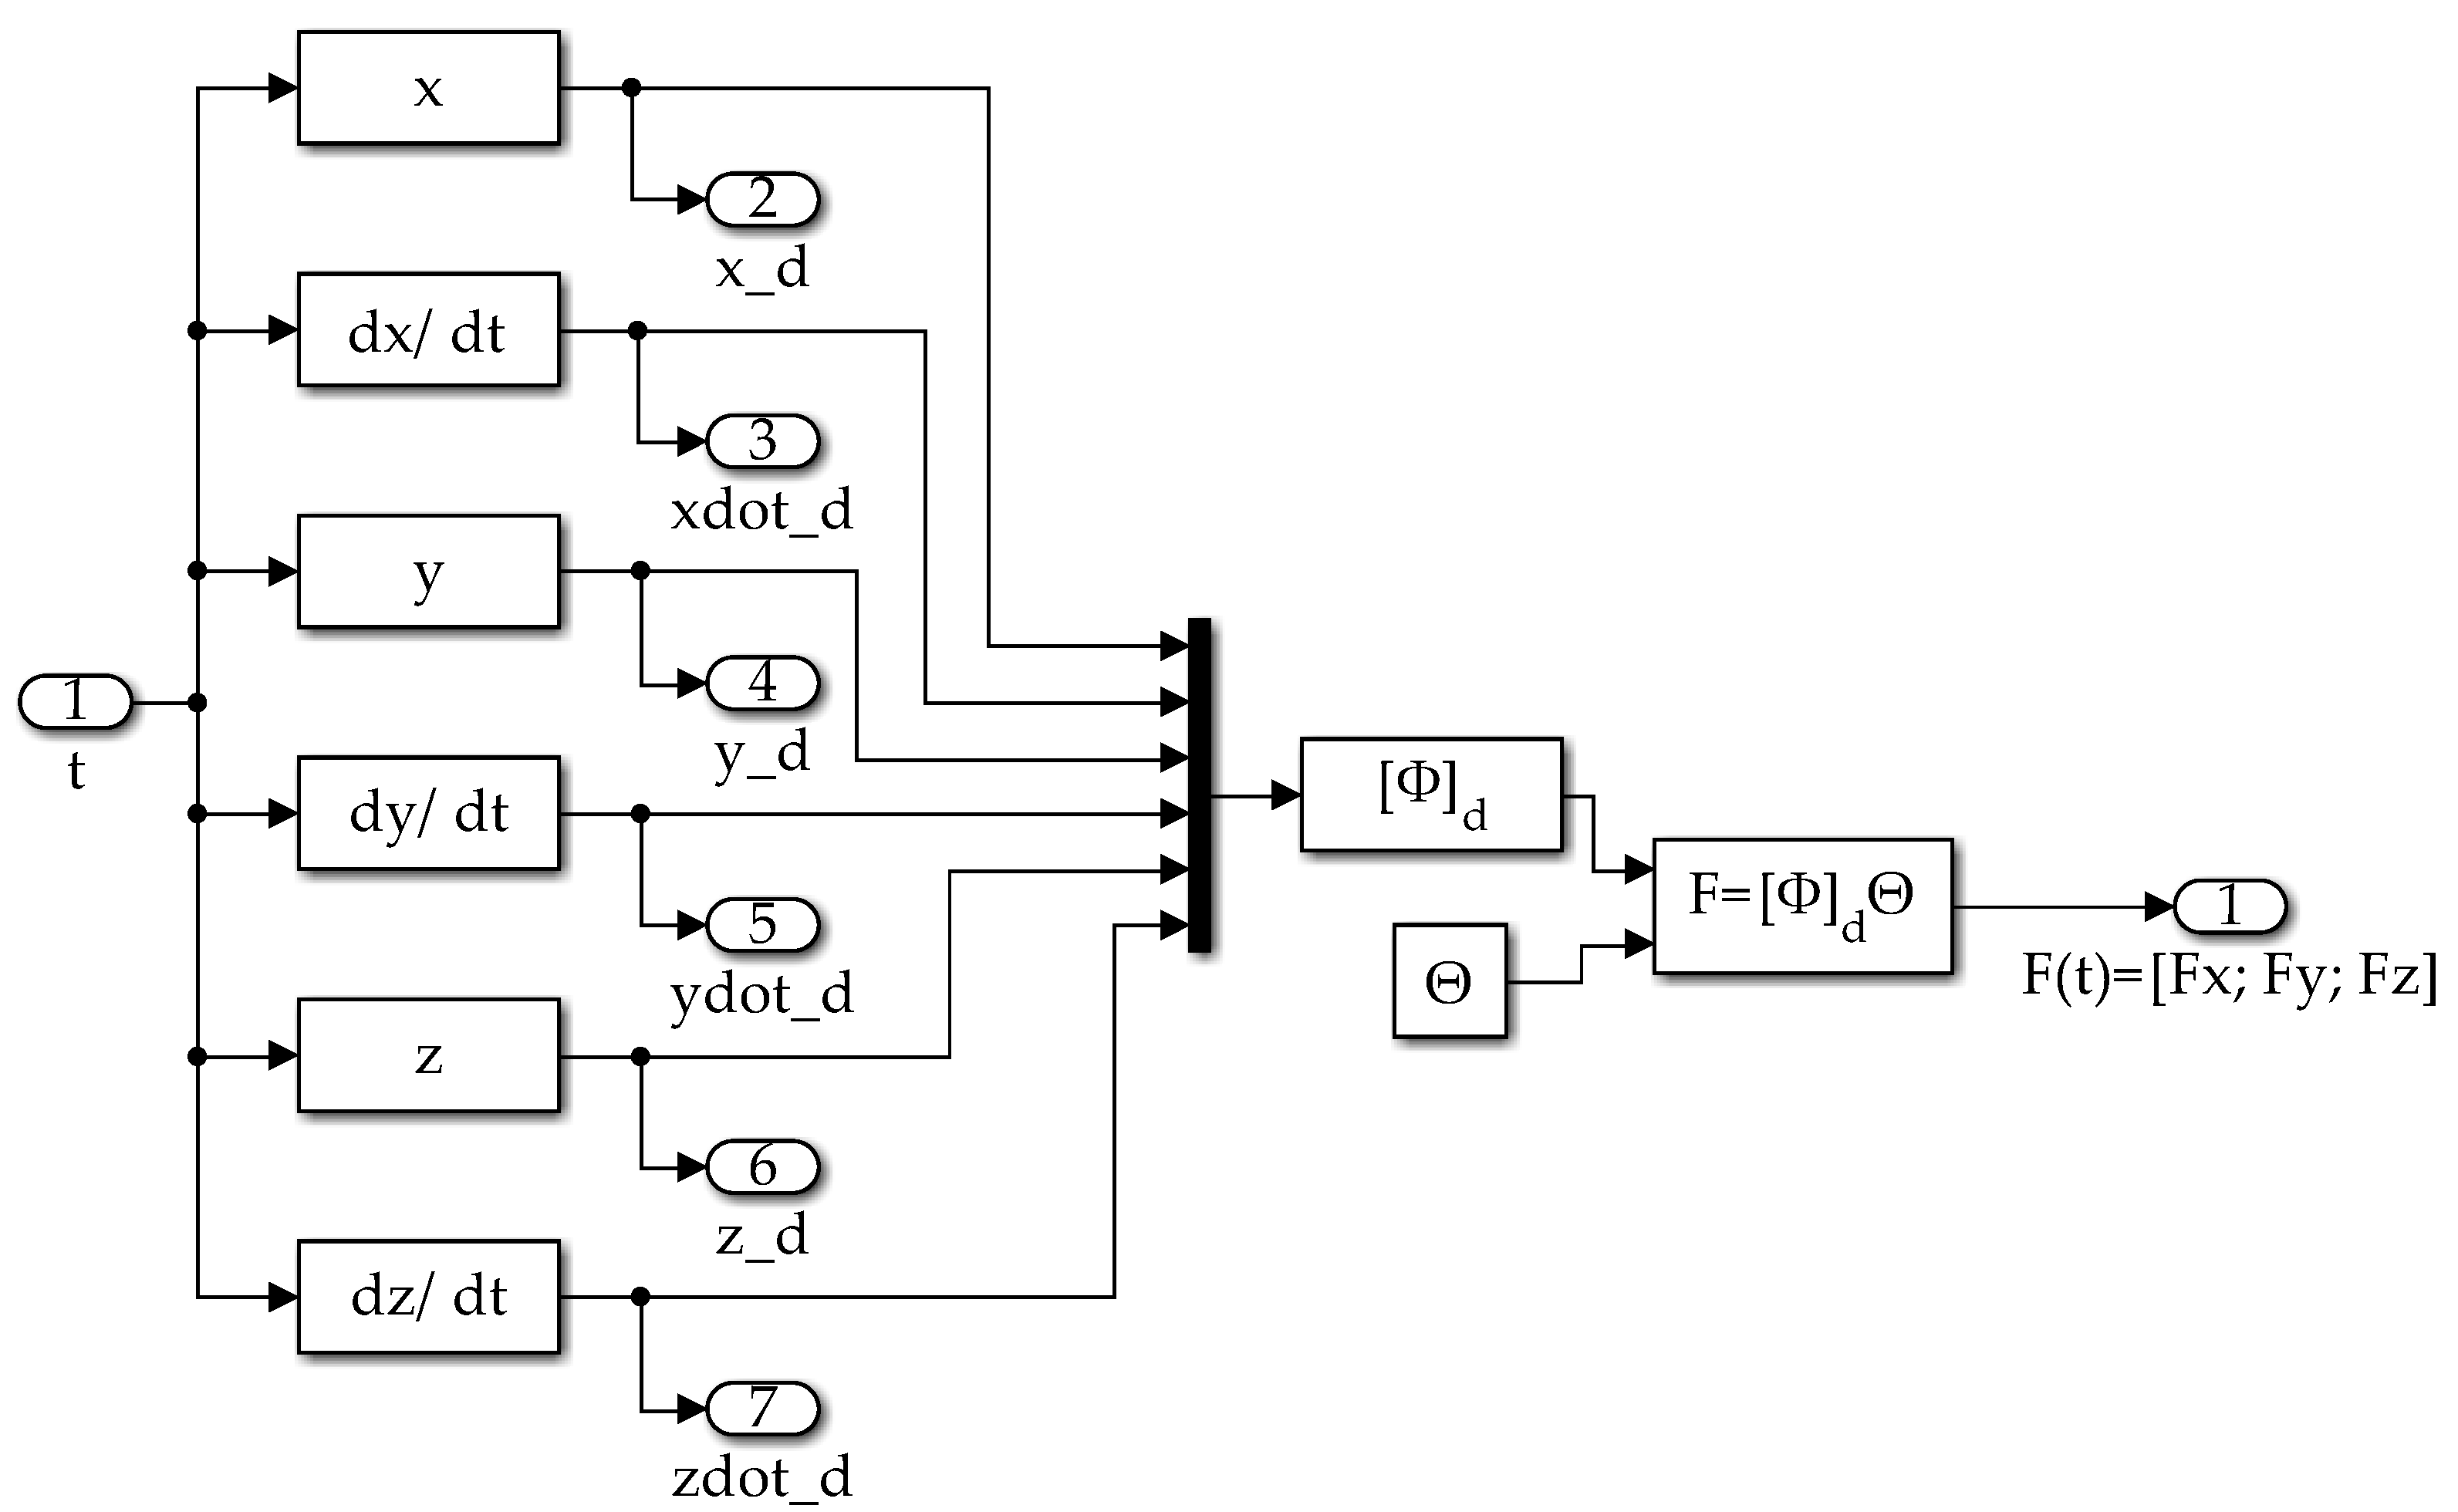
The nonlinear feedforward controller is implemented using the matrix of knowns and vector of unknowns described in equation (4).
Appendix A shows the topology of the nonlinear feedforward controller block.
3. Results
The model was simulated from zero to one second. Four combinations were simulated: (1) uncontrolled Lorenz system, (2) Lorenz system with linear feedback controller, (3) Lorenz system with nonlinear feedforward controller, and (4) Lorenz system with both linear feedback controller and nonlinear feedforward controller. The state trajectories are evaluated for each type of controller. The initial conditions of the integrators are all set to one. The summary of the error terms is shown in
Table 2. Each of the following subsections display plots of the trajectories and phase portraits of the controller setups.
3.1. Uncontrolled Forced Lorenz System
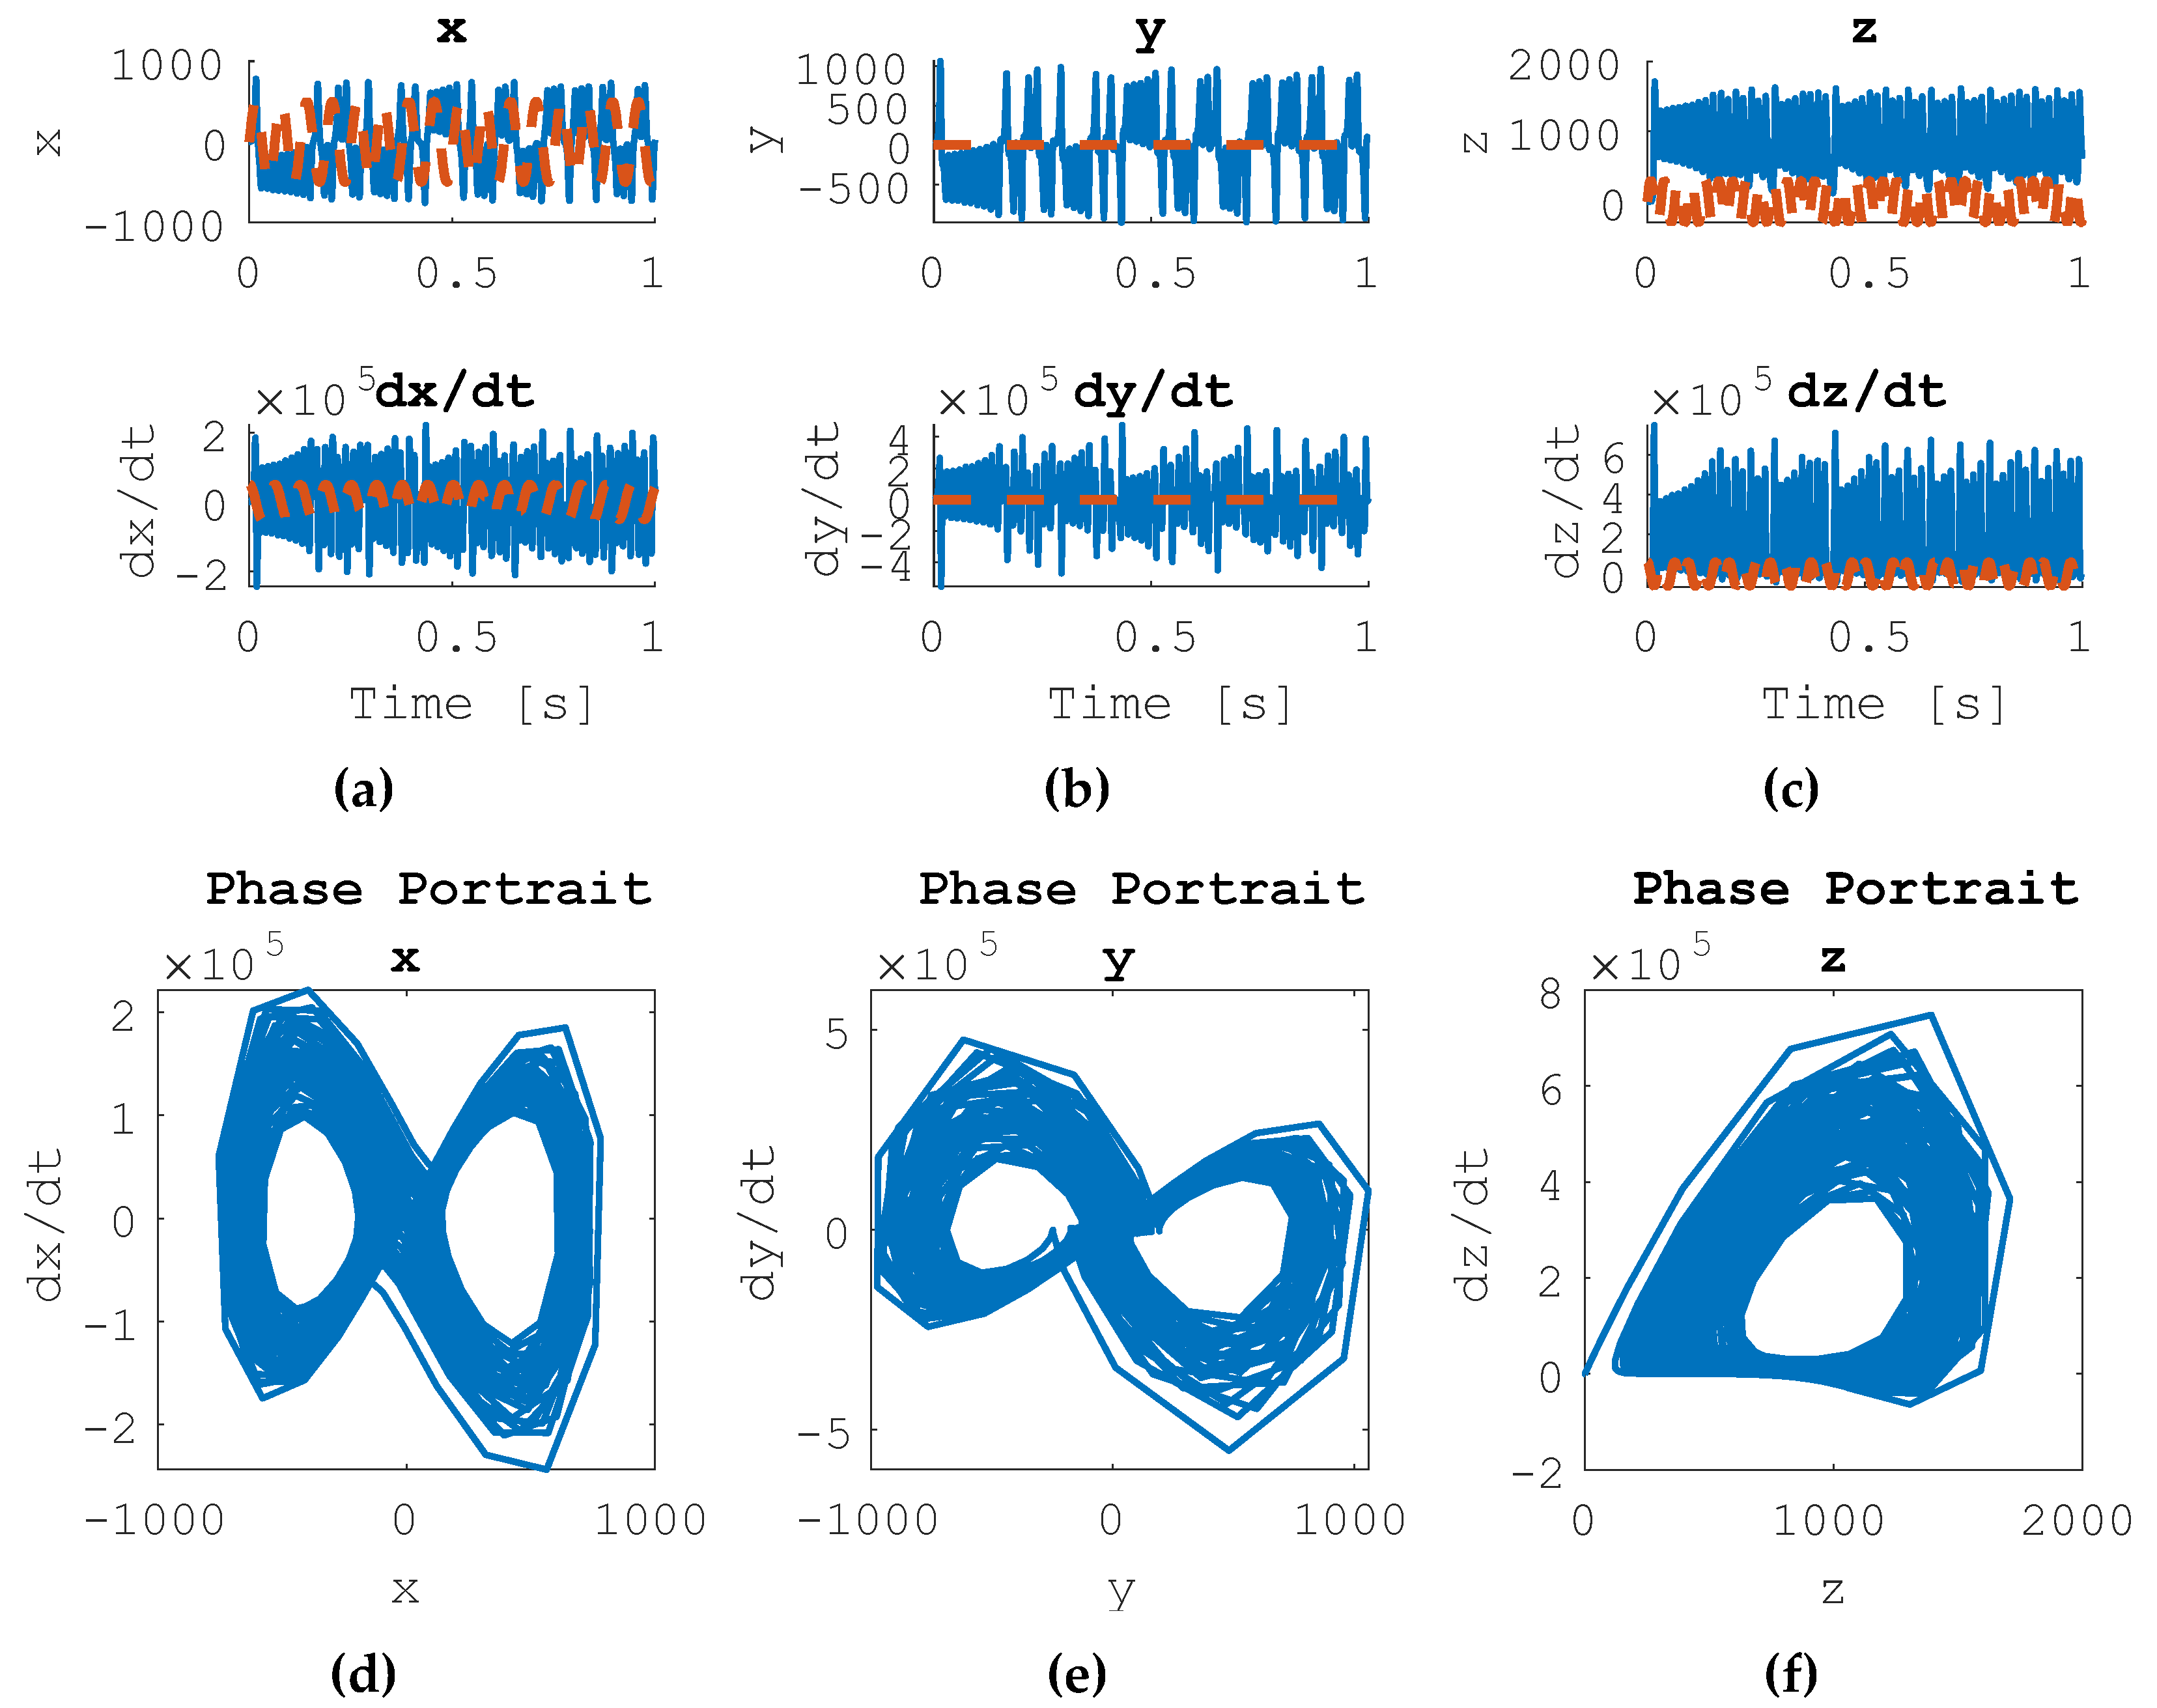
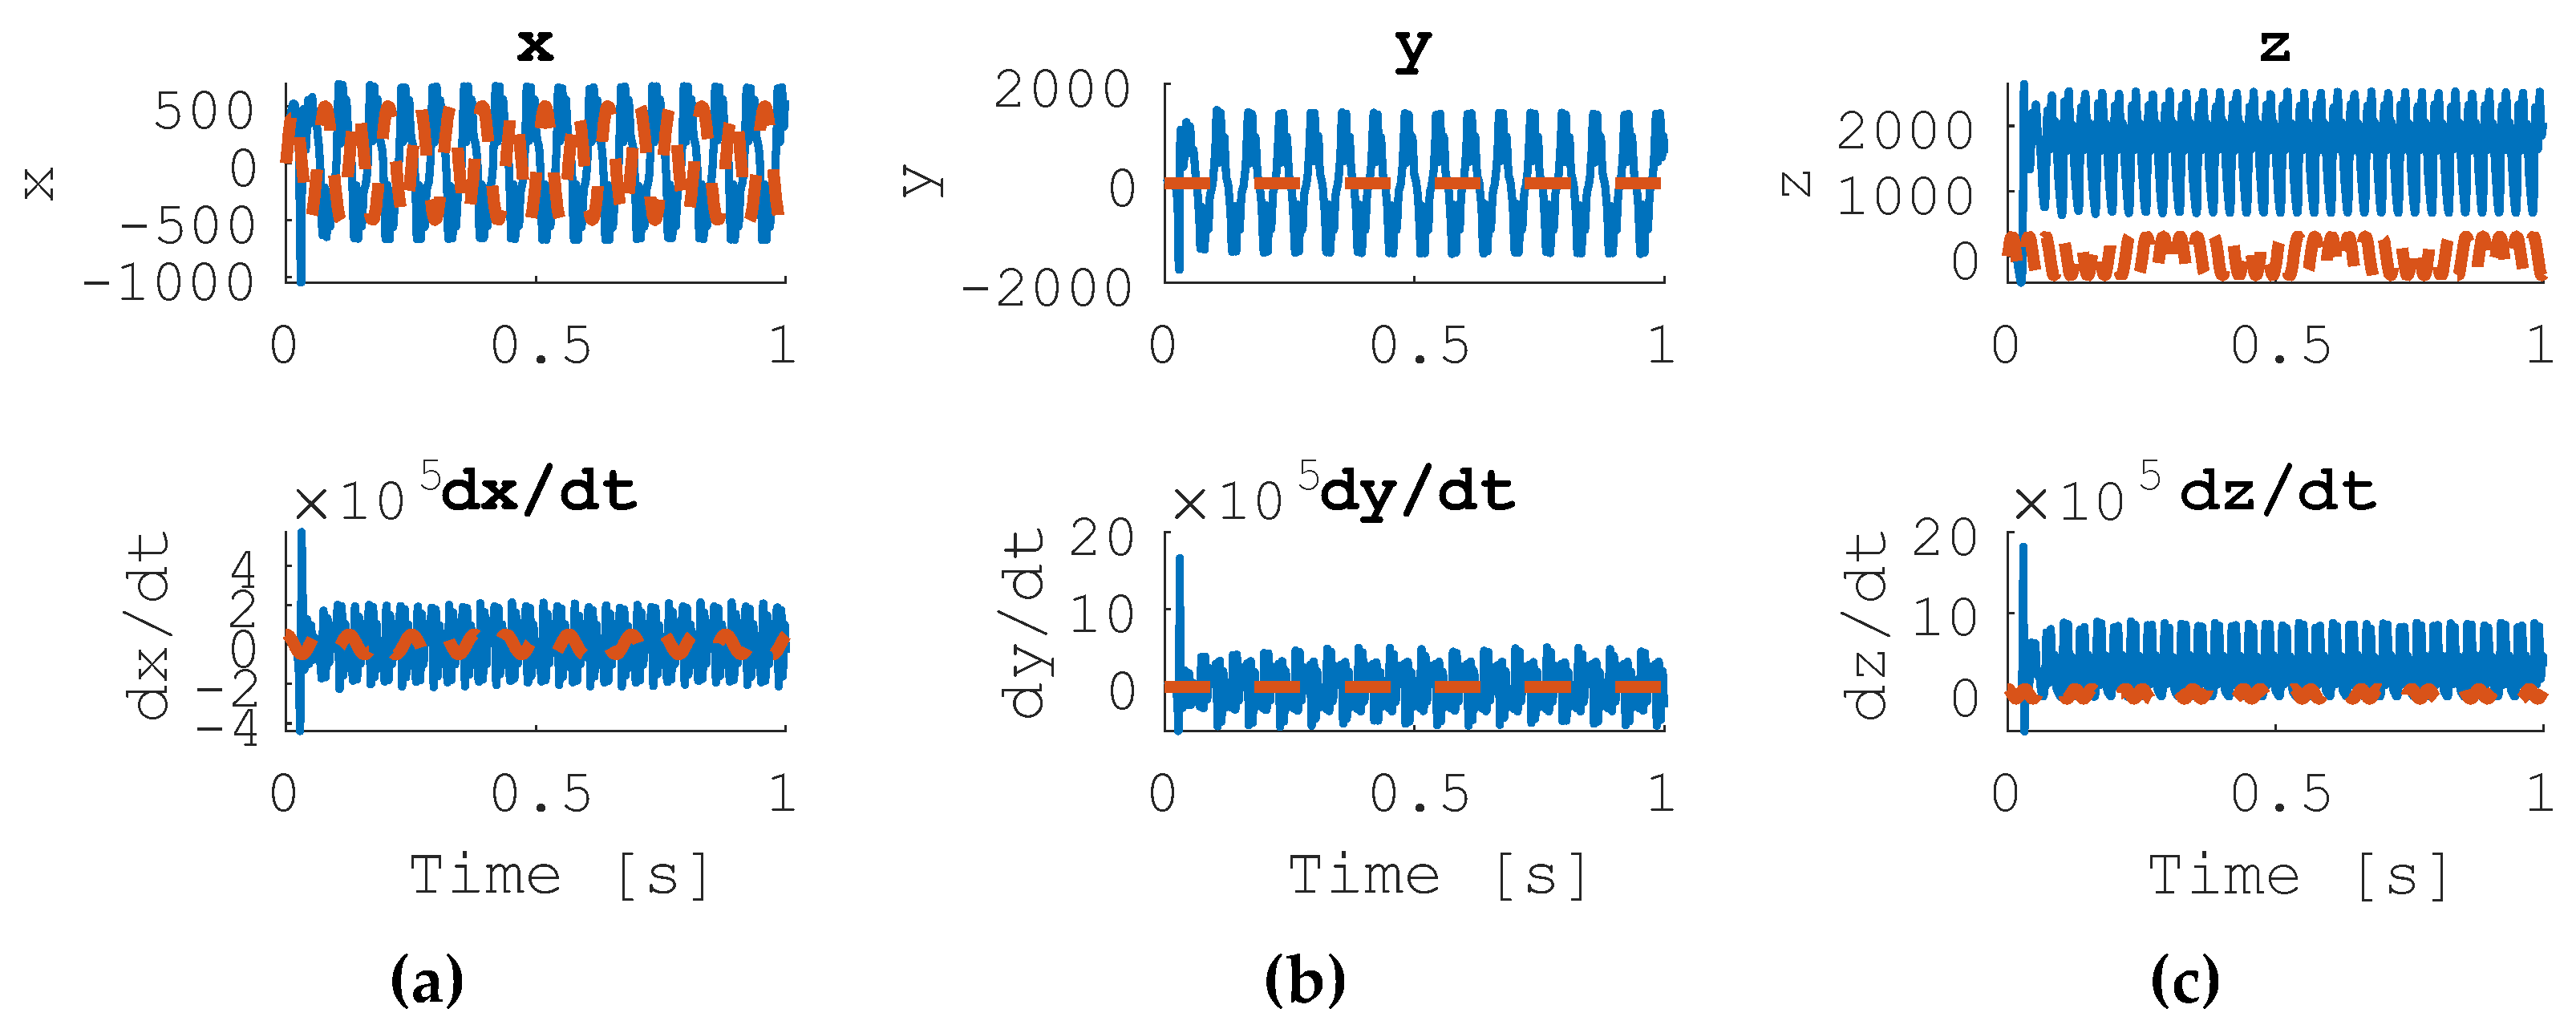
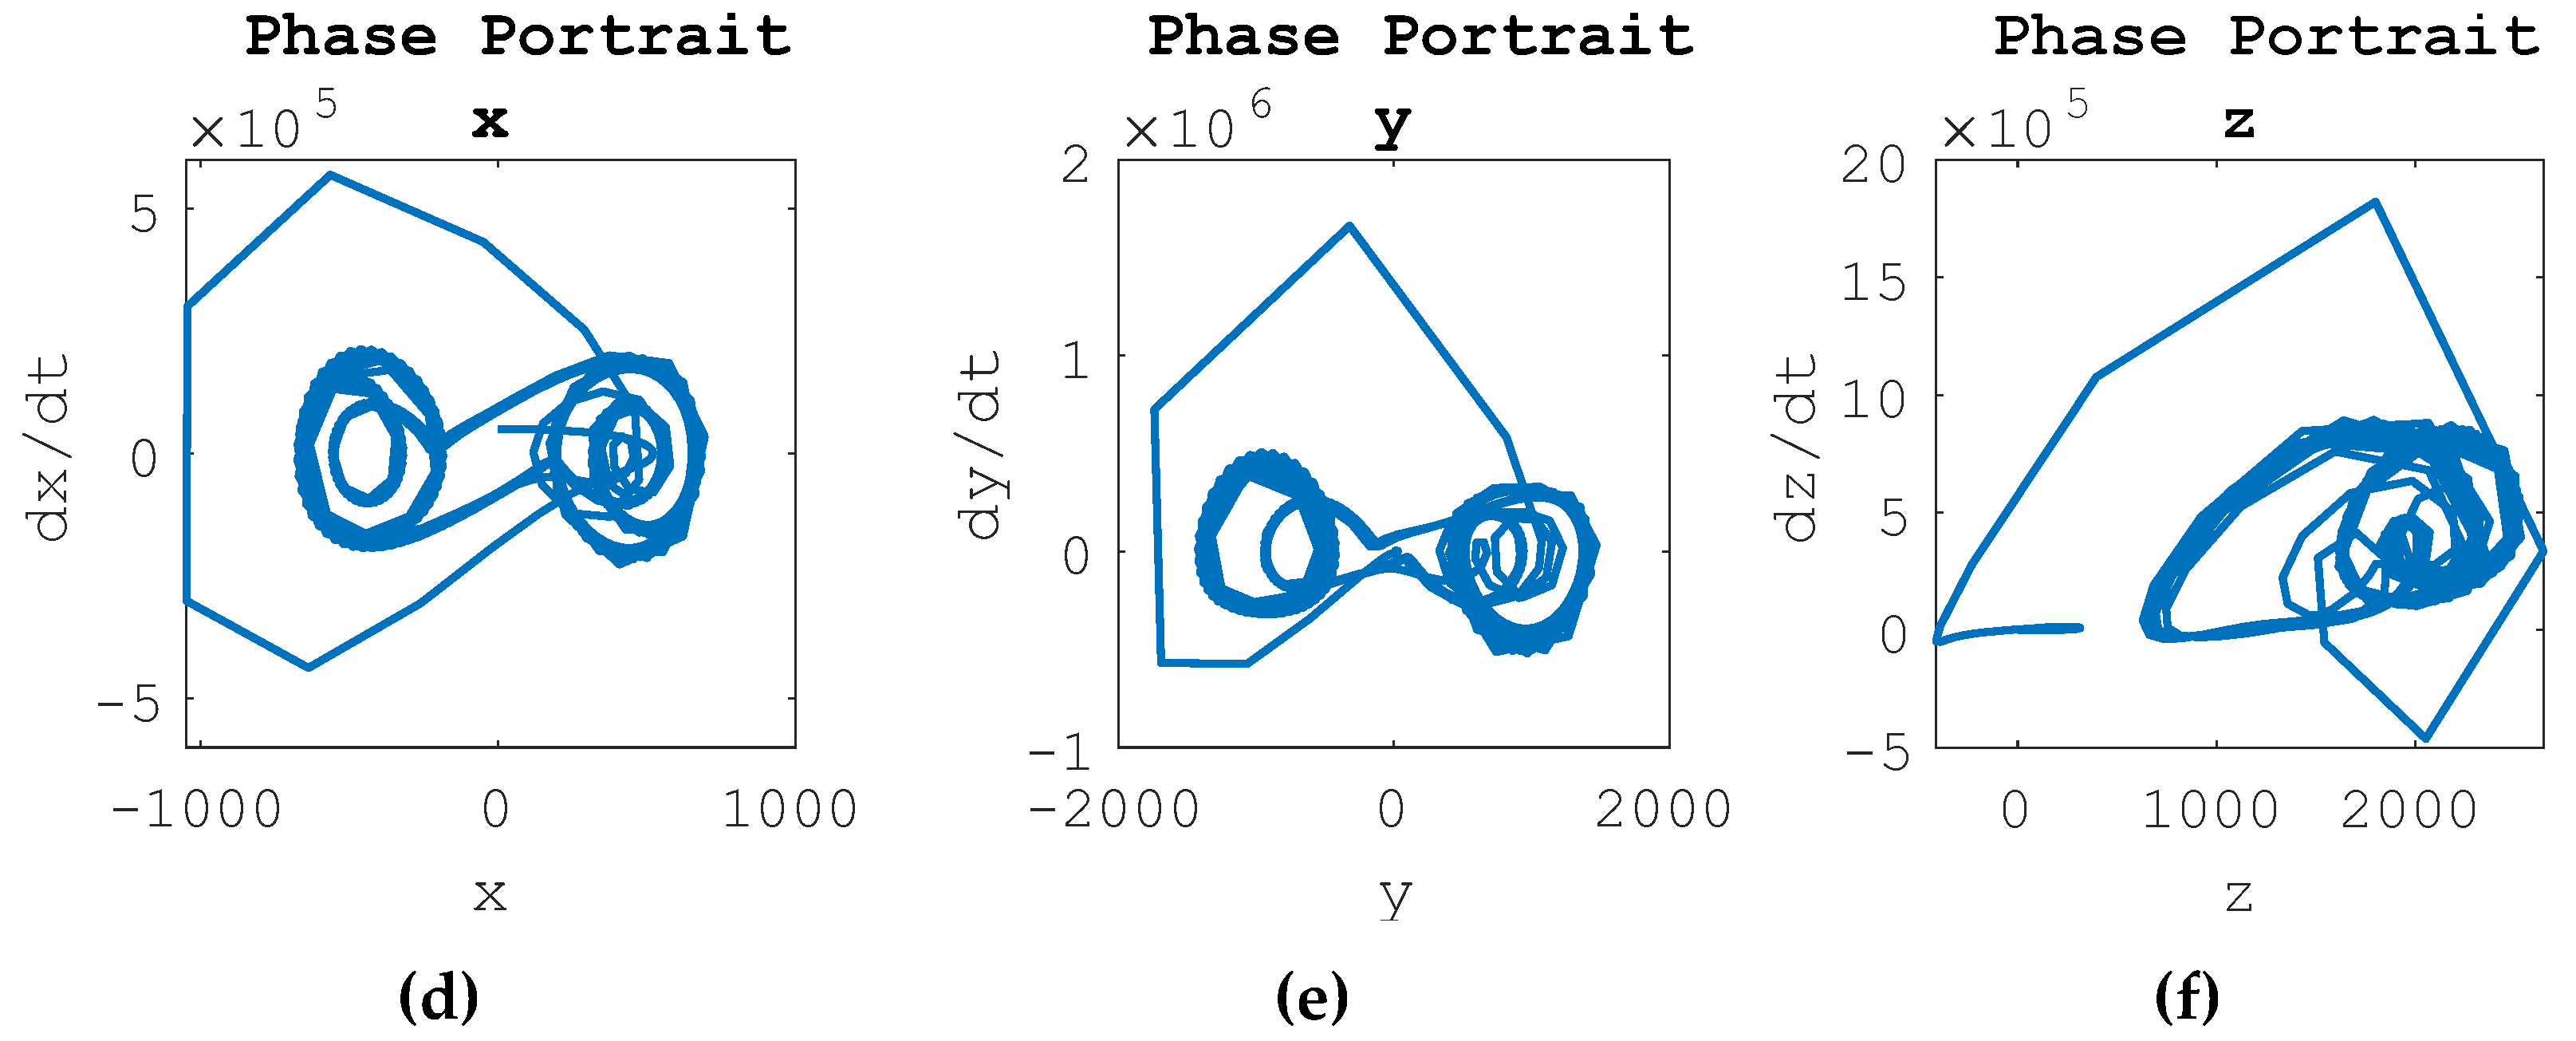
A desired zero trajectory is commanded, with no controllers activated. The state trajectories are shown in
Figure 2a–c and the phase portraits are shown in
Figure 2d–f.
Figure 2.
Uncontrolled Forced Lorenz System Results, Commanded Zero Trajectory. (a) State Trajectories for state x and dx/dt, (b) state trajectories for state y and dy/dt, (c) state trajectories for state z and dz/dt, (d) phase portrait for x, (e) phase portrait for y, (f) phase portrait for z.
Figure 2.
Uncontrolled Forced Lorenz System Results, Commanded Zero Trajectory. (a) State Trajectories for state x and dx/dt, (b) state trajectories for state y and dy/dt, (c) state trajectories for state z and dz/dt, (d) phase portrait for x, (e) phase portrait for y, (f) phase portrait for z.
3.2. Lorenz System Dynamics Forced by Linear Feedback Controllers
The Lorenz system is run with linear feedback control enabled.
Figure 3 details the results of the linear feedback controller only in the presence of the desired sinusoidal trajectory commands.
Figure 3.
Uncontrolled Forced Lorenz System Results, Commanded Sinusoidal Trajectory. (a) State Trajectories for state x and dx/dt, (b) state trajectories for state y and dy/dt, (c) state trajectories for state z and dz/dt, (d) phase portrait for x, (e) phase portrait for y, (f) phase portrait for z.
3.3. Lorenz System Dynamics Forced by Only Nonlinear Feedforward Controllers
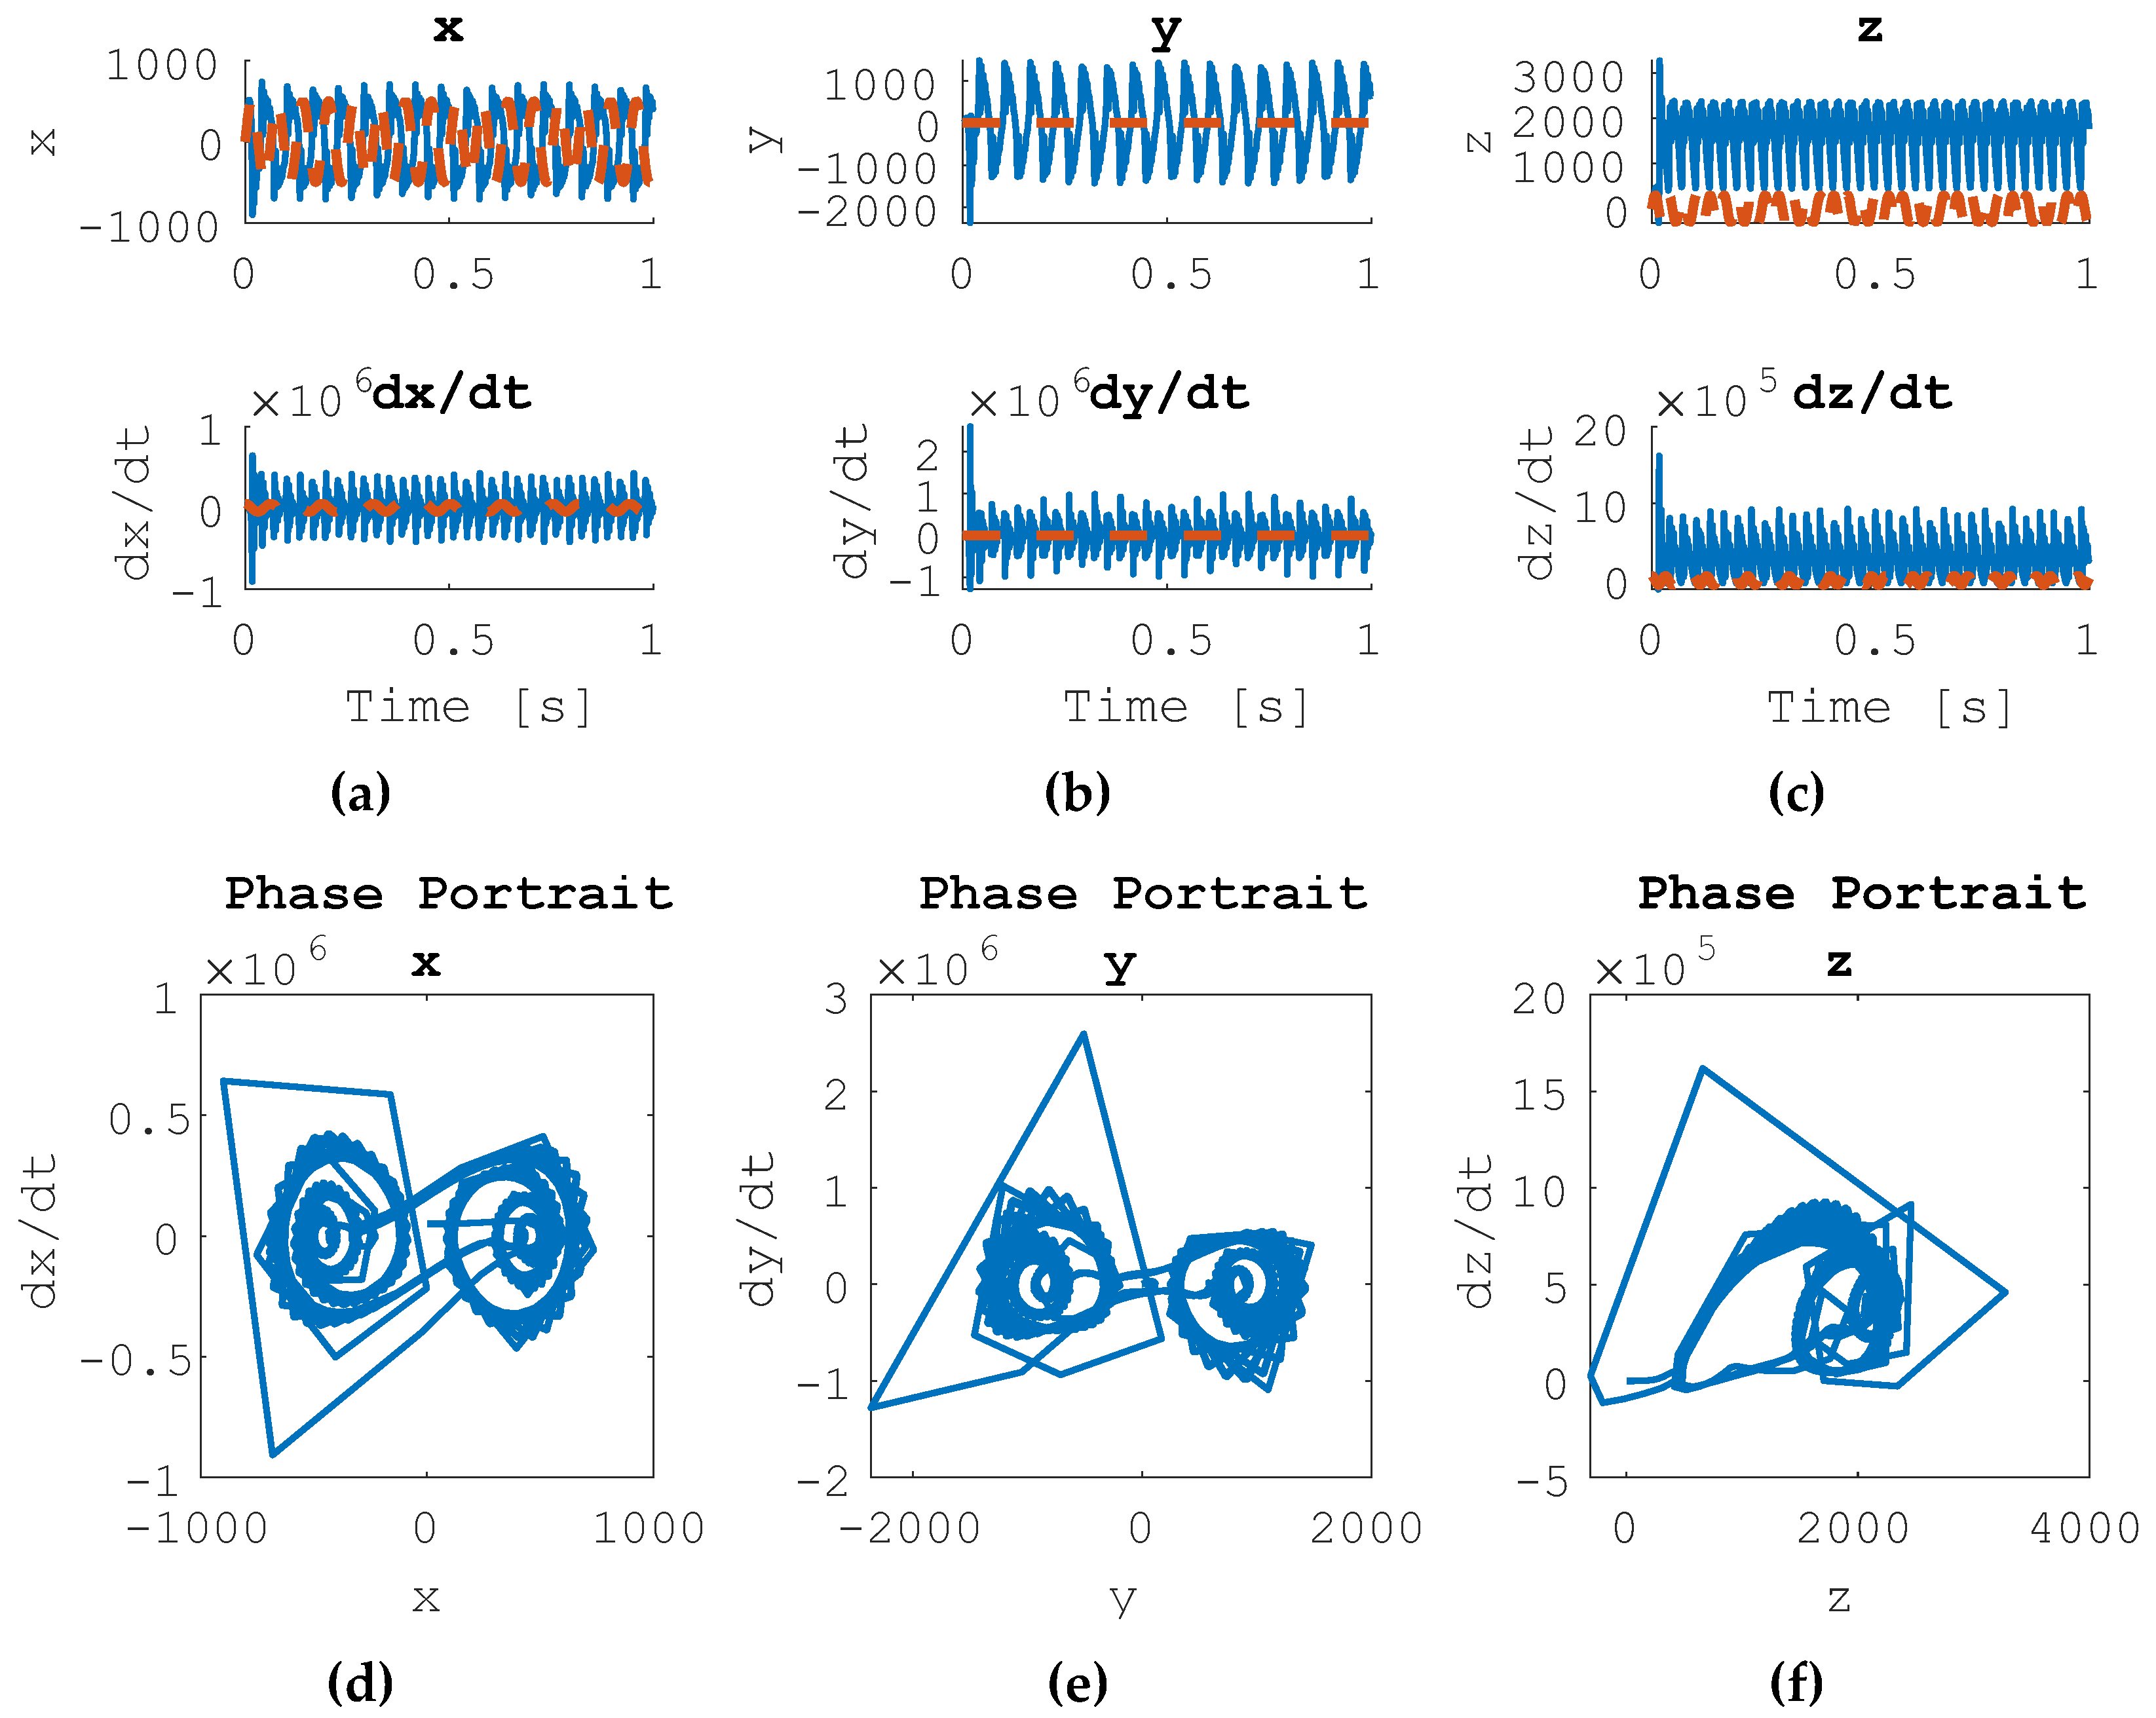
When the Lorenz system is set to a desired sinusoidal control and subjected to a nonlinear feedforward controller, the results are seen in
Figure 4. Each state x, dx/dt, y, dy/dt, z and dz/dt are driven to sinusoids. The system is commanded to follow a circular oscillation, though it maintains chaotic behavior. The x state trajectory seems to be almost 180 degrees out of phase with the desired trajectory.
Figure 4.
Nonlinear Feedforward Control of Forced Lorenz System Results, Commanded Sinusoidal Trajectory. (a) State Trajectories for state x and dx/dt, (b) state trajectories for state y and dy/dt, (c) state trajectories for state z and dz/dt, (d) phase portrait for x, (e) phase portrait for y, (f) phase portrait for z.
3.4. Lorenz System Dynamics Forced by Both Linear Feedback and Nonlinear Feedforward Controllers
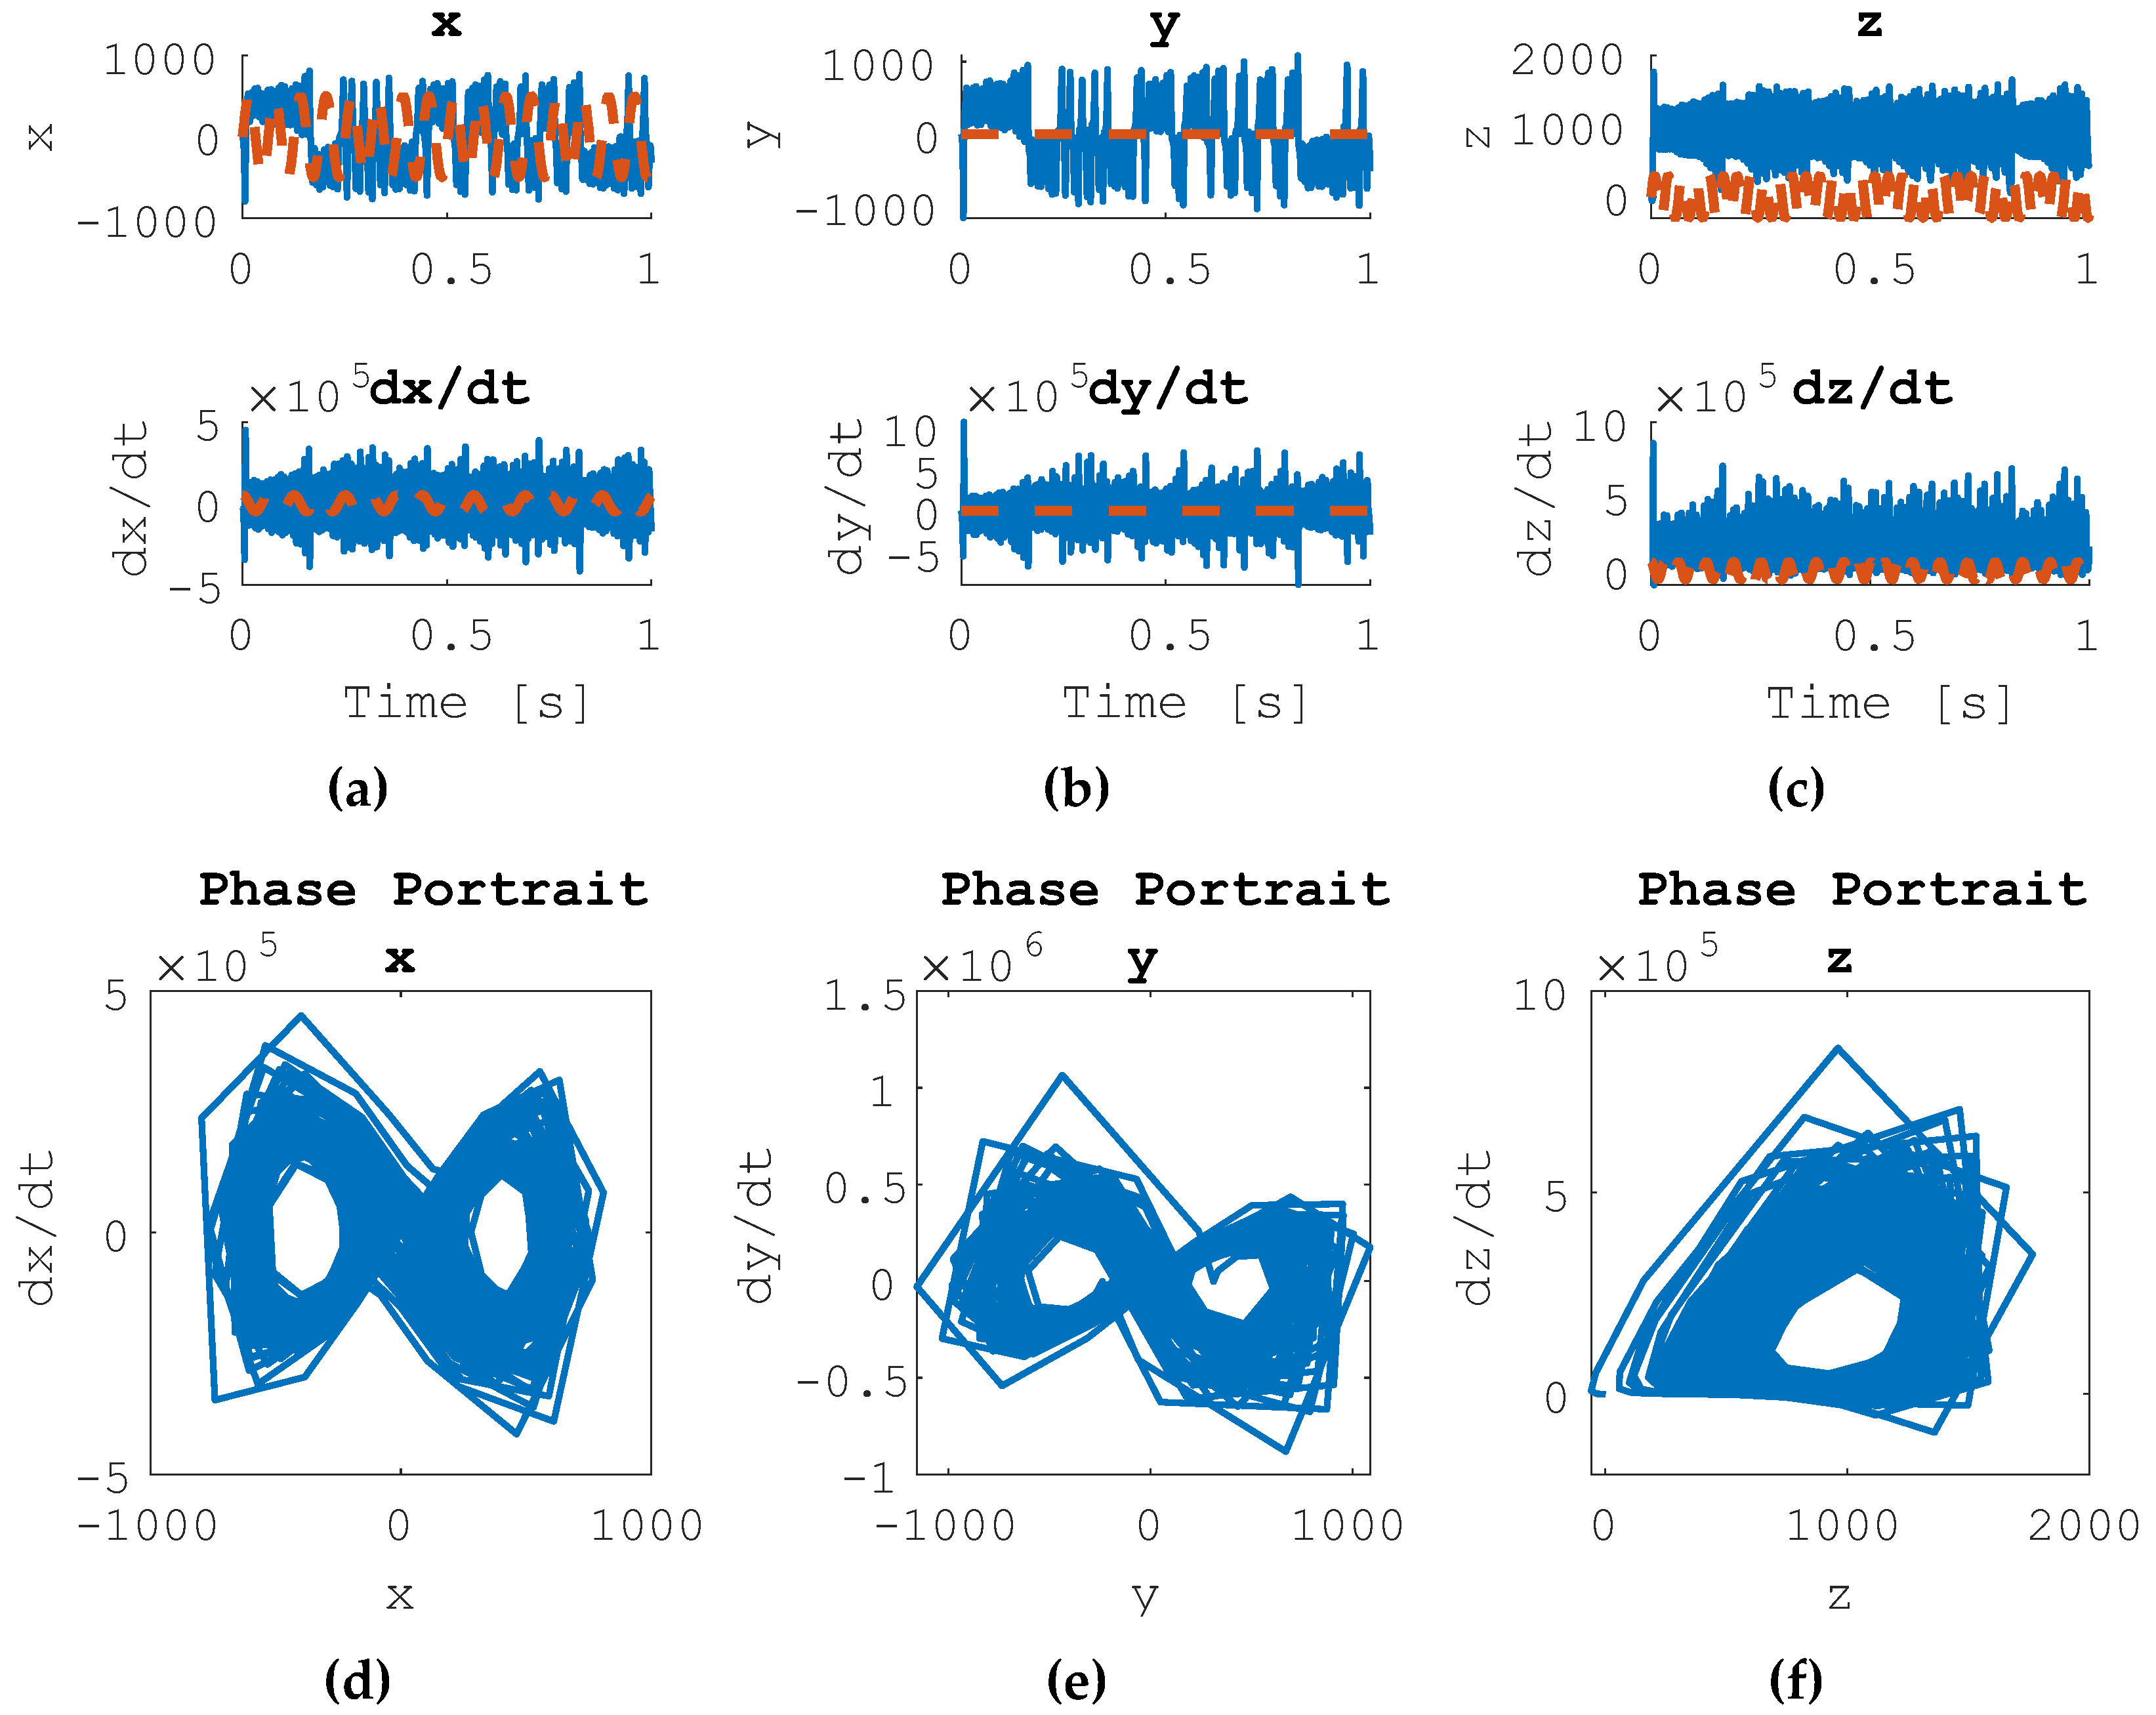
When the Lorenz system is set to a desired sinusoidal control and subjected to a nonlinear feedforward controller and a linear feedback controller, the results are seen in
Figure 5. Each state x, dx/dt, y, dy/dt, z and dz/dt are driven to sinusoids. The system is commanded to follow a circular oscillation, though it maintains chaotic behavior. The behavior is dominated by the linear feedback controller’s response.
Figure 5.
Combined Nonlinear Feedforward Control and Linear Feedback Control of Forced Lorenz System Results, Commanded Sinusoidal Trajectory. In plots (a), (b), and (c), the desired trajectory is shown in dotted orange line. The actual state trajectory is depicted in the solid blue line. (a) State Trajectories for state x and dx/dt, (b) state trajectories for state y and dy/dt, (c) state trajectories for state z and dz/dt, (d) phase portrait for x, (e) phase portrait for y, (f) phase portrait for z.
4. Discussion
Unlike the van der Pol system investigated in [
12], the Lorenz system does not have better performance when controlled by the nonlinear feedforward controller. Interestingly, all controllers tested in this manuscript provide significantly worse mean error values for the derivative state trajectories (dx/dt, dy/dt, and dz/dt) than the baseline.
Table 3 describes the percent error for the state trajectories when compared to the baseline uncontrolled setup.
The feedback and feedforward combination controller shows improvements in the state estimations of the x, y, and dy/dt states. However, it shows degraded performance in the dx/dt, z, and dz/dt states. Using any of these controllers will improve x, y, and z errors by as much as 94%, but at the cost of more than 2000% degradation in the derivate errors.
4.1. Recommended future research
Smeresky and Rizzo developed nonlinear optimal feedback learning which proved effective for highly nonlinear, coupled equations that were not strictly chaotic, while Cooper and Heidlauf illustrated the lack of efficacy of (even optimal) linear feedback applied to the chaotic van der Pol system. The sequel should develop and evaluate efficacy efficacious nonlinear optimal feedback for van der Pol and Lorenz systems.
Author Contributions
Conceptualization, E.K. and T.S.; methodology, E.K. and T.S.; software,E.K.; validation, E.K. and T.S.; formal analysis, E.K.; investigation, E.K. and T.S.; resources, T.S.; data curation, E.K.; writing—original draft preparation, E.K.; writing—review and editing, E.K. and T.S.; visualization, E.K. and T.S.; supervision, T.S.; project administration, T.S.; funding acquisition, T.S. All authors have read and agreed to the published version of the manuscript. Please turn to the CRediT taxonomy for the term explanation. Authorship must be limited to those who have contributed substantially to the work reported.
Funding
This research received no external funding.
Data Availability Statement
Data supporting reported results analyzed or generated during the study may be obtained by contacting the corresponding author.
Conflicts of Interest
The authors declare no conflict of interest.
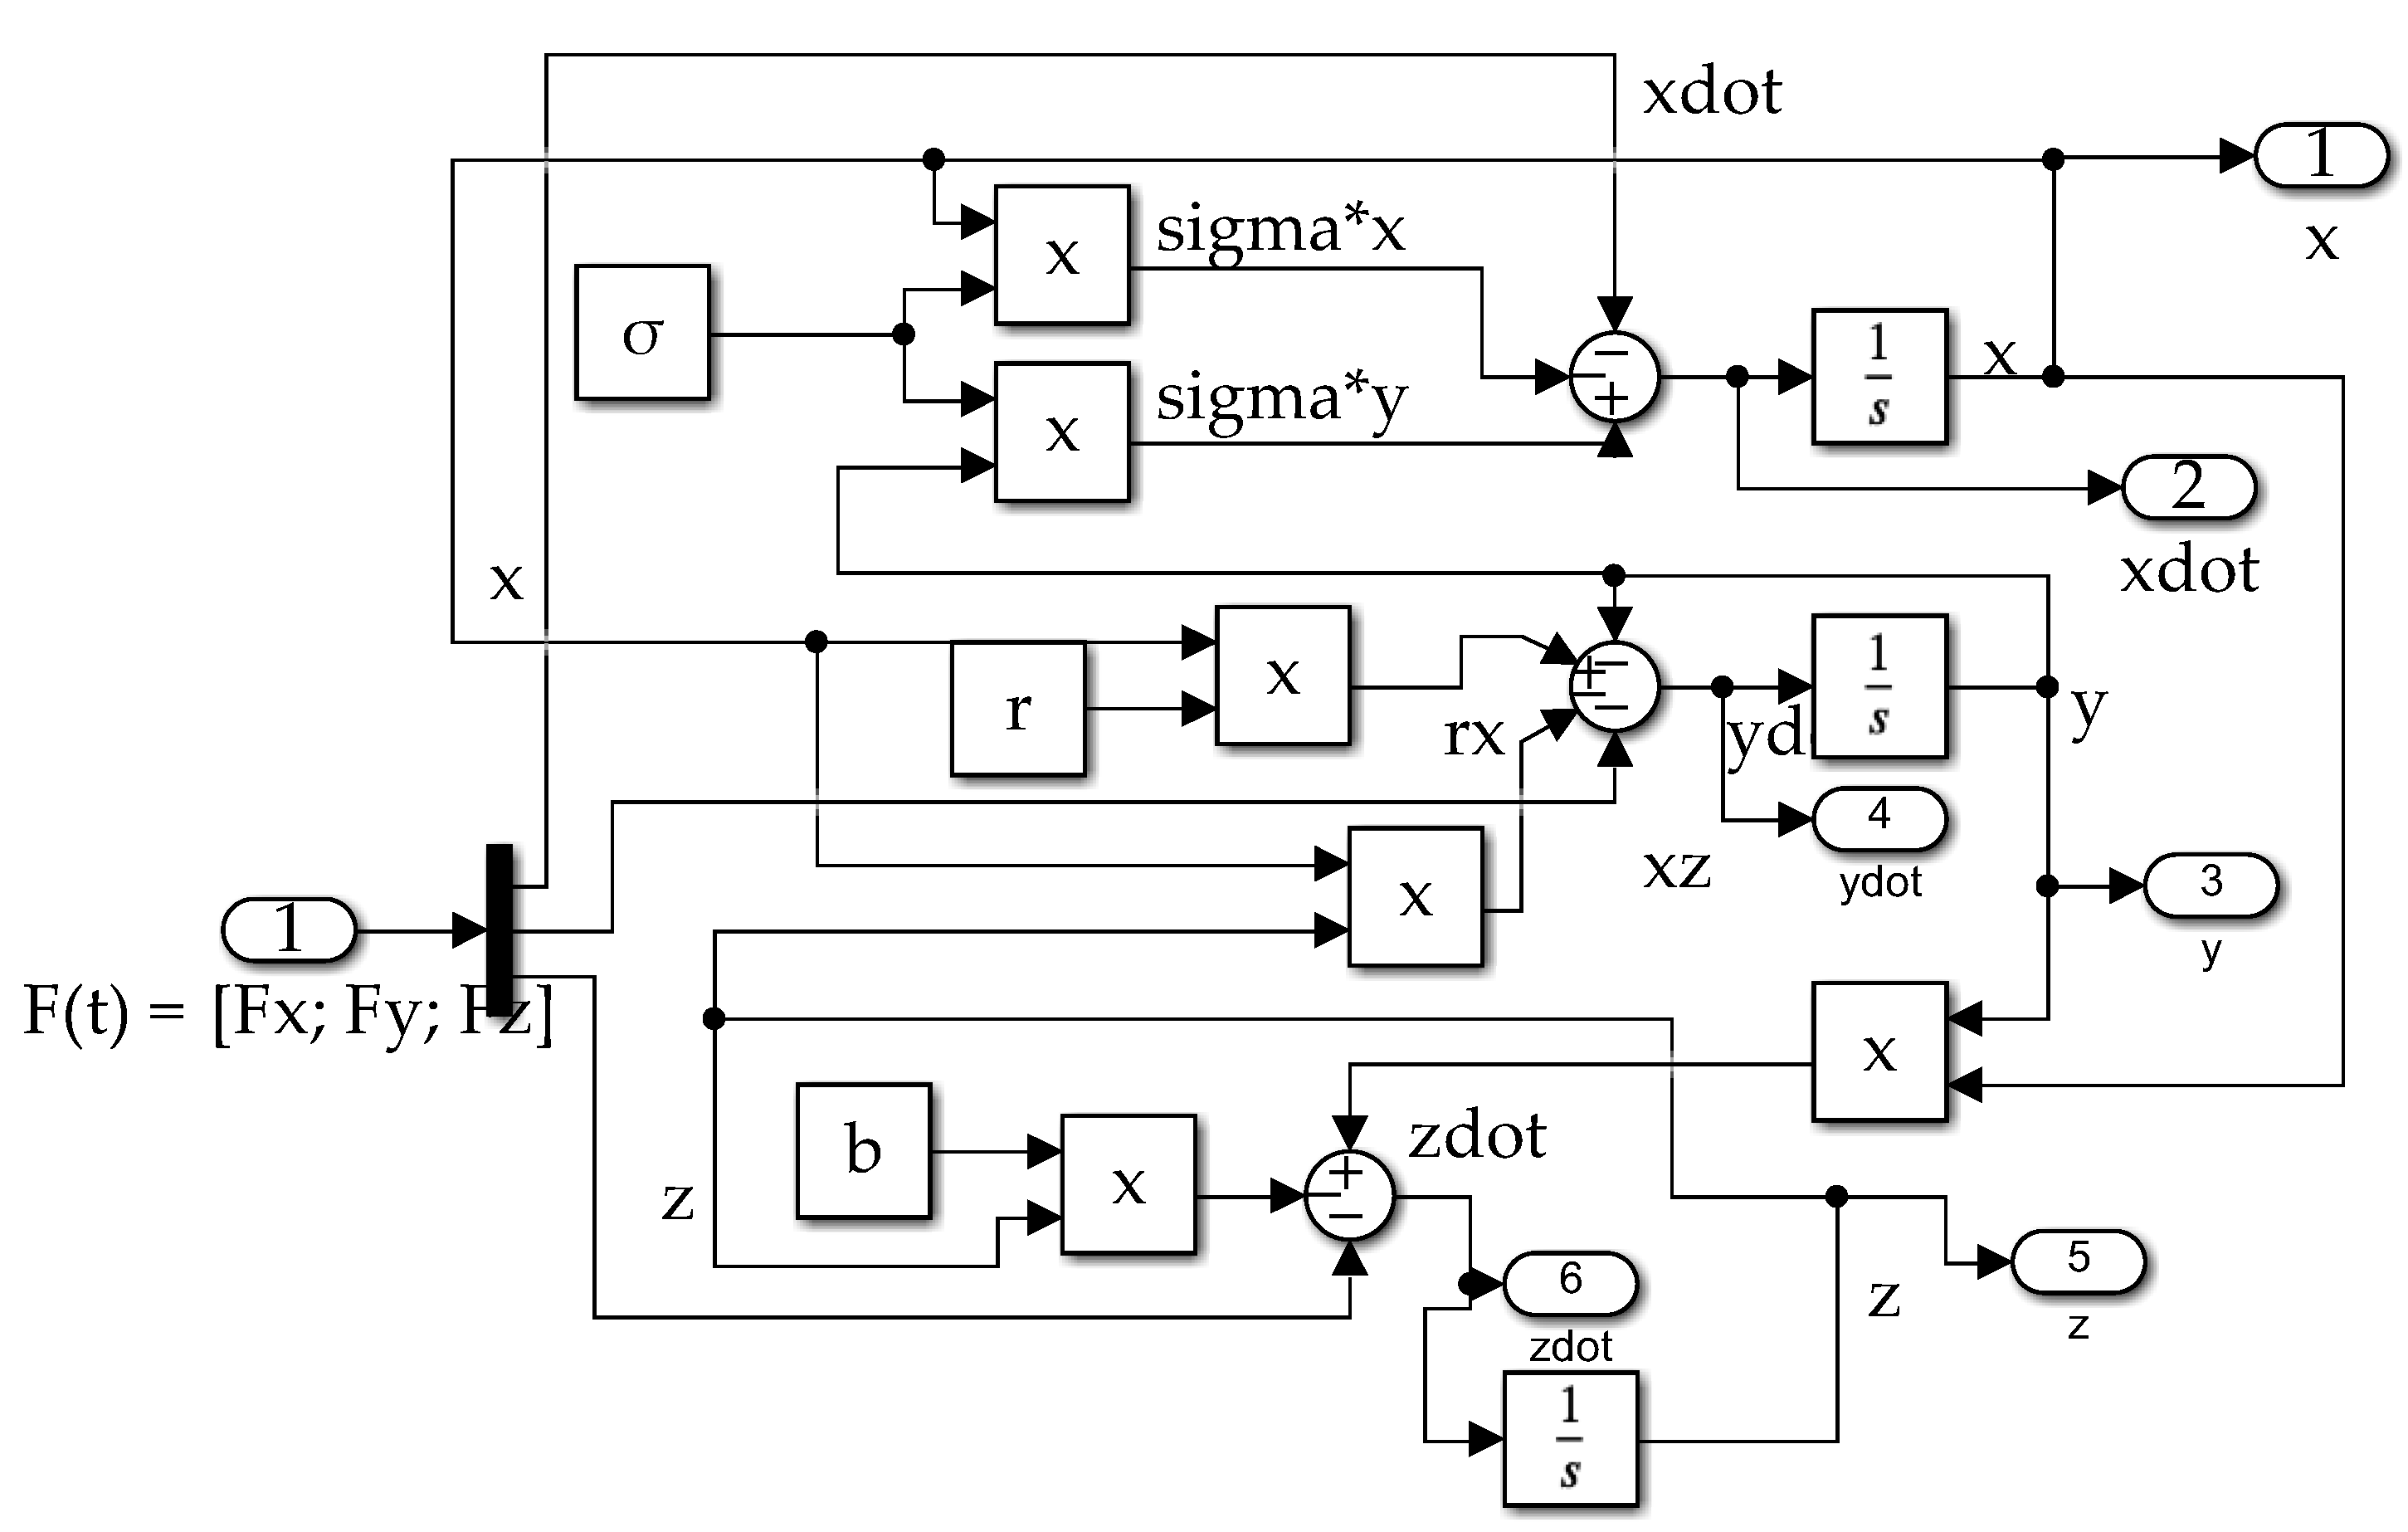
Appendix A. Subsystem Topologies
Figure A1.
Lorenz Plant Subsystem Topology. Nonlinear differential equations (1), (2), and (3) are modeled given an external force input.
Figure A1.
Lorenz Plant Subsystem Topology. Nonlinear differential equations (1), (2), and (3) are modeled given an external force input.
Figure A2.
Linear Feedback Control Subsystem Topology, PD Controller. Derivative and velocity gain values are applied to the difference between the measured and desired (_d) state values.
Figure A2.
Linear Feedback Control Subsystem Topology, PD Controller. Derivative and velocity gain values are applied to the difference between the measured and desired (_d) state values.
Figure A3.
Nonlinear Feedforward Control Subsystem Topology.
Figure A3.
Nonlinear Feedforward Control Subsystem Topology.
References
- Boccalettia, S.; Grebogib, C.; Lai, Y.; Mancinia, H.; Mazaa, D. The control of chaos: theory and applications. Physics Reports 2000, 329, 103–197. Fradkov A.; Pogromsky A. (1998). Introduction to Control of Oscillations and Chaos. World Scientific Publishers, Singapore, 1998. [CrossRef]
- Fermi Traces a Celestial Spirograph. Available online: https://svs.gsfc.nasa.gov/11205 (accessed on 24 December 2022).
- NASA Image Use Policy. Available online: https://gpm.nasa.gov/image-use-policy (accessed on 24 December 2022).
- Song, Y.; Li, Y. Li, C. Ott-Grebogi-Yorke controller design based on feedback control. 2011 International Conference on Electrical and Control Engineering, Yichang, China, 24 October 2011, pp. 4846–4849.
- Pyragas, K. Continuous control of chaos by self-controlling feedback. Physics Letters A 1992, 170, 421–428. [Google Scholar] [CrossRef]
- Slotine, J.; Li, W. Applied Nonlinear Control; Prentice-Hall, Inc.: Englewood Cliffs, NJ, U.S.A, 1991; pp. 392–436. [Google Scholar]
- Osburn, J.; Whitaker, H.; Kezer, A. New developments in the design of model reference adaptive control systems. Inst. Aero. Sci. 1961, 61. [Google Scholar]
- Fossen, T. Handbook of Marine Craft Hydrodynamics and Motion Control, 2 ed.; John Wiley & Sons Inc.: Hoboken, USA, 2021. [Google Scholar]
- Fossen, T. Guidance and Control of Ocean Vehicles; John Wiley & Sons Inc.: Chichester, UK, 1994. [Google Scholar]
- Sands, T.; Kim, J.; Agrawal, B. Spacecraft fine tracking pointing using adaptive control. Proceedings of 58th International Astronautical Congress, International Astronautical Federation: Paris, France, 24-28 September 2007.
- Sands, T.; Kim, J.; Agrawal, B. Spacecraft Adaptive Control Evaluation. Infotech@Aerospace, Garden Grove, California, 19 - 21 June 2012.
- Cooper, M.; Heidlauf, P.; Sands, T. Controlling Chaos—Forced van der Pol Equation. Mathematics 2017, 5, 70. [Google Scholar] [CrossRef]
- van der Pol, B. A note on the relation of the audibility factor of a shunted telephone to the antenna circuit as used in the reception of wireless signals. Philosophical Magazine 1917, 34, 184–188. [Google Scholar]
- van der Pol, B. On “Relaxation Oscillations”. I. Philos. Mag. 1926, 2, 978–992. [Google Scholar] [CrossRef]
- van der Pol, B.; van der Mark, J. Frequency Demultiplication. Nature 1927, 120, 363–364. [Google Scholar] [CrossRef]
- van der Pol, B.; van der Mark, J. The heartbeat considered as a relaxation-oscillation, and an electrical model of the heart. Philosophical Magazine 1929, 6, 673–675. [Google Scholar] [CrossRef]
- van der Pol, B. The nonlinear theory of electric oscillations. Proc. IRE 1934, 22, 1051–1086. [Google Scholar] [CrossRef]
- Smeresky, B.; Rizzo, A.; Sands, T. Optimal Learning and Self-Awareness Versus PDI. Algorithms 2020, 13, 23. [Google Scholar] [CrossRef]
- Sands, T. Development of Deterministic Artificial Intelligence for Unmanned Underwater Vehicles (UUV). J. Mar. Sci. Eng. 2020, 8, 578. [Google Scholar] [CrossRef]
- Zhai, H.; Sands, T. Controlling Chaos in Van Der Pol Dynamics Using Signal-Encoded Deep Learning. Mathematics 2022, 10, 453. [Google Scholar] [CrossRef]
- Zhai, H.; Sands, T. Comparison of Deep Learning and Deterministic Algorithms for Control Modeling. Sensors 2022, 22, 6362. [Google Scholar] [CrossRef] [PubMed]
- M. S. Willsey, K. M. Cuomo and A. V. Oppenheim Quasi-Orthogonal Wideband Radar Waveforms Based on Chaotic Systems. IEEE Transactions on Aerospace and Electronic Systems 2011, 47, 1974–1984. [CrossRef]
- E. H. Park, M. A. Zaks, J. Kurths. Phase synchronization in the forced Lorenz system. Physical Review E 1999, 60, 6627–6638. [CrossRef]
Table 1.
Proximal Variable Definitions.
Table 1.
Proximal Variable Definitions.
| Variable |
Definition |
Variable |
Definition |
|
State variables |
|
Lorenz parameters |
|
External force amplitude |
|
External force frequency |
|
Proportional gain |
|
Velocity gain |
|
Rise time |
|
Settling time |
Table 2.
Mean and standard deviation error values for state trajectories for each of the controller setups. The desired state trajectories are driven by sinusoids. The standard deviations are presented in parenthesis.
Table 2.
Mean and standard deviation error values for state trajectories for each of the controller setups. The desired state trajectories are driven by sinusoids. The standard deviations are presented in parenthesis.
| Controller Setup |
x Error |
dx/dt Error |
y Error |
dy/dt Error |
z Error |
dz/dt Error |
| Uncontrolled |
-35.5 (357.6) |
34.4 (9.1e4) |
-35.4 (412.5) |
101.5 (1.4e5) |
778.0 (400.0) |
704.5 (1.7e5) |
| Linear Feedback |
-4.4 (532.0) |
-242.5 (1.5e5) |
-4.6 (415.3) |
-666.1 (2.2e5) |
818.8 (421.5) |
2.06e3 (2.7e5) |
| Nonlinear Feedforward |
13.8 (717.8) |
743.8 (1.2e5) |
15.5 (772.5) |
466.6 (2.2e5) |
1.6e3 (742.0) |
2.6e3 (2.4e5) |
| Feedback & Feedforward |
4.3 (711.2) |
683.6 (1.6e5) |
5.2 (742.3) |
5.4 (3.0e5) |
1.6e3 (751.4) |
2.8e3 (3.3e5) |
Table 3.
Percent Difference in Mean Error Values for Each Controller Setup. The desired state trajectories are driven by sinusoids. The percentages are compared to the baseline uncontrolled setup. The most improved (i.e. most negative) value is bolded in each column.
Table 3.
Percent Difference in Mean Error Values for Each Controller Setup. The desired state trajectories are driven by sinusoids. The percentages are compared to the baseline uncontrolled setup. The most improved (i.e. most negative) value is bolded in each column.
| Controller Setup |
x Error |
dx/dt Error |
y Error |
dy/dt Error |
z Error |
dz/dt Error |
| Uncontrolled |
--- |
--- |
--- |
--- |
--- |
--- |
| Linear Feedback |
-87.58% |
604.657% |
-86.99% |
556.43% |
5.26% |
188.25% |
| Nonlinear Feedforward |
-61.03% |
2060.71% |
-56.18% |
359.80% |
103.80% |
272.81% |
| Feedback and Feedforward |
-87.92% |
1885.82% |
-85.40% |
-94.68% |
104.24% |
303.93% |
|
Disclaimer/Publisher’s Note: The statements, opinions and data contained in all publications are solely those of the individual author(s) and contributor(s) and not of MDPI and/or the editor(s). MDPI and/or the editor(s) disclaim responsibility for any injury to people or property resulting from any ideas, methods, instructions or products referred to in the content. |
© 2023 by the authors. Licensee MDPI, Basel, Switzerland. This article is an open access article distributed under the terms and conditions of the Creative Commons Attribution (CC BY) license (http://creativecommons.org/licenses/by/4.0/).
