Preprint
Article

First-principles Calculation of In and Ag, Cu Replacing Zn in Sphalerite

Altmetrics

Downloads

167

Views

84

Comments

0

This version is not peer-reviewed

Submitted:

06 January 2023

Posted:

06 January 2023

You are already at the latest version

Alerts
Abstract
Sphalerite has been recognized as the most important carrier of critical metal of Indium (In) due to that In mainly exists in the sphalerite lattice by isomorphic substitution. There are two significant replacing schemes for In entry into sphalerite, these are, Ag++In3+→2Zn2+ and Cu++In3+→2Zn2+. In order to understand the reaction process and constraints of the two substitution schemes, this paper uses first-principles methods to calculate In and Ag, Cu replacing Zn in sphalerite. According to the substitution schemes of Ag++In3+→2Zn2+ and Cu++In3+→2Zn2+, two doped sphalerite systems of Zn30InAgS32 and Zn30InCuS32 were constructed using 2×2×2 supercell model of sphalerite. Firstly, the pressure is controlled to 30MPa, and the temperature is set from 20-40MPa to simulate the response of the two doped sphalerite systems to temperature; Then, the control temperature was unchanged to 600K, and the pressure was set from 20-40MPa to investigate the pressure control of the two doped sphalerite systems. The lattice parameters, substitution energy, electronic structure, and population analysis of the designed models before and after replacement have been critically compared. The main conclusions can be drawn that it is more stable for In to enter sphalerite via the coupled substitution scheme Cu++In3+→2Zn2+, and the conditions that the two substitution schemes most likely to occur are 650K and 40MPa. This study not only reveals the physical and chemical properties of In-rich sphalerite formed by the two reaction processes of Ag++In3+→2Zn2+ and Cu++In3+→2Zn2+, but also has a certain enlightenment effect on the search for indium in sphalerite, and promotes the application of first principles in mineralization analysis.
Keywords: 
Subject: Engineering  -   Mining and Mineral Processing

1. Introduction

Indium (In) is one of the most important critical metal that is extracted from Zn, Sn and Cu polymetallic ore deposits[1,2,3,4,5,6]. Due to its use in solar panels and liquid crystal displays for computers, television and mobile devices, it has considerable strategic and economic value to modern industry, national defense and cutting-edge science and technology[7]. These days, the global consumption of metal In is gradually increasing, and the contradiction between supply and demand is becoming prominent[8,9]. Nevertheless, indium is a typical rare dispersed element and its average content in the crust is extremely low[10]. In this regard, totally different from base and non-ferrous metals, it is usually very difficult to form an ore deposit with economic value that is rich in independent minerals of In[11,12,13,14]. Indium is mainly produced as a beneficial accompanying metal in the sulfide ore-forming minerals of magmatic-hydrothermal deposits including Zn, Sn and Cu. Therefore, studying the rich mechanism of In in nature can achieve a breakthrough in exploration of In-rich polymetallic ore deposits. Studies have shown that sphalerite is the main carrier mineral of In, and the In in more than 80% of In-rich deposits are contained in sphalerite[4,15,16]. Therefore, the occurrence state and enrichment mechanism of In can be studied by sphalerite[17,18,19,20]. However, the distribution of In in sphalerite is exceedingly inhomogeneous, that is, the enrichment degree of In in different sphalerites from the same deposit is usually observed to exhibit significant difference[1,21,22]. The most typical examples are "indium window"[23] and "indium explosion"[24,25,26,27,28,29,30,31]. These phenomena indicate that there is a strong enrichment of In in a certain type of sphalerite at a specific metallogenic stage. Thus, it is significant to reveal the selective enrichment mechanism of In in sphalerite for clarifying the temperature and pressure conditions of the genesis of In-rich ore deposit and the symbiotic relationship with other metal elements such as Cu Ag and Sn.
In recent years, thanks to the development and application of many high-resolution microscopic observation systems such as electron probe micro-analyzer, laser ablation inductively coupled plasma mass spectrometry (LA-ICP-MS) and scanning transmission electron microscopy, the occurrence state and enrichment regulation of In in sphalerite has been effectively investigated. A broad consensus derived by previous studies is that In mainly exists in the sphalerite lattice by isomorphic substituting with Zn[15,16,23,26,30,31,32]. Thereafter, many substitution models of In in sphalerite have been proposed[20,27,33]. McIntyre et al.[19] conducted an experiment on the solubility of In in sulfidic Zn minerals, and concluded that the substitution mechanism of In in sphalerite was A g + + I n 3 + 2 Z n 2 + . Johan[34] inferred that the replacement mechanism of In in sphalerite is C u + + I n 3 + Z n 2 + + F e 2 + . Cook et al.[20] analyzed trace elements in sphalerites of the Toyoha deposit in Japan using LA-ICP-MS, and proposed that the displacement process of In was C u + + I n 3 + 2 Z n 2 + based on the correlation between the elements. This displacement mechanism was furtherly confirmed by synchrotron radiation X-ray absorption near edge structure[35]. Through the analysis of trace elements in sphalerites from several magmatic-hydrothermal deposits in Japan, Bolivia and China, Murakami and Ishihara[30] supposed that the mechanism of In replacing Zn is A g + + I n 3 + 2 Z n 2 + in the Huari and Bolivar deposits, while it is C u + / A g + + I n 3 + 2 Z n 2 + in the Akenobe and Dulong deposits. Filimonova et al.[36] concluded that the substitution mechanism of In, Au, Cu-bearing sphalerite was ( C u , A g , A u ) + + I n 3 + 2 Z n 2 + by using X-ray absorption spectroscopy. Zhou and Wen[37] discovered that C u + + I n 3 + Z n 2 + + F e 2 + is the mechanism of In replacing Zn in sphalerite in magmatic-hydrothermal vein-type Pb-Zn deposits in the western Jiangnan orogenic belt. In summary, the main way for In entering to sphalerite is to combine with other metals such as Cu, Ag, Fe and Au to replace Zn. The physical and chemical properties of In-bearing sphalerites are varied due to different substitution mechanisms under specific mineralization conditions, which furtherly affect the enrichment degree of In. The two most common and significant substitution mechanisms for In mineralization in magmatic-hydrothermal polymetallic deposits are A g + + I n 3 + 2 Z n 2 + and C u + + I n 3 + 2 Z n 2 + [1,19,20,30,34,35,36,37].
In recent years, in addition to experimental observation method, atomic/molecular scale simulation provides an inspired way to investigate the structure, electrical properties and other physical and chemical properties of minerals. The first principles calculation based on density functional theory is considered to be one of the most accurate theoretical methods to deal with atomic/molecular scale problems nowadays. It has been used in a wide range fields of substance and material including earth science and has achieved comparable results to those of experimental studies [38,39]. The first principles calculation has been demonstrated to be useful for exploring the microscopic mechanism of isomorphic substitution of metal ions[36,40,41,42]. Therefore, to investigate controlling factors including temperature and pressure of the above-mentioned two critical substitution mechanisms in sphalerite: A g + + I n 3 + 2 Z n 2 + and C u + + I n 3 + 2 Z n 2 + , this study aims to apply first-principles simulation method based on density function for modeling the physical and chemical properties of In-rich sphalerite formed by these two reaction processes. The results could assist for understanding distribution behavior and mineralization process of In in sphalerite.

2. Methods and Models

First-principles method, also known as ab initio method, treats a polyatomic system as a multi-electron structure composed of electrons and atomic nucleus. It calculates the energy of molecules or ions according to the basic principles of quantum mechanics, and then describes and explains the bonding between atoms, thereby obtaining the physical, chemical and mechanical properties related to the electronic structure of a certain substance. Only five basic physical constants are required to carry out first-principles calculations, namely the static mass of electrons m, the electron's charge e, Planck's constant h, the velocity of light c and the Boltzmann constant kB. This makes first principles method a powerful tool for studying and simulating properties related to electronic structures of a given polyatomic system. In the following calculation models of this study, the exchange-correlation function uses the Perdew-Burke-Ernzerhof (PBE)[43] method under generalized gradient approximation (GGA)[44], and uses ultrasoft pseudopotential to describe the interaction of ion real and valence electrons[45]. The Broyden–Fletcher–Goldfarb–Shanno (BFGS) method[46,47,48,49], which is recognized as one of the most useful quasi Newton methods for iterating a nonlinear system of equations, has been used to optimize the geometric model. According to the convergence test, the plane wave cutoff energy is set to 550eV, and the integration calculation of the total energy and charge density of the system in the Brillouin region is selected by the Monkhorst-Pack method[50]. In order to ensure the convergence of the energy and configuration of the system at the level of the quasi-complete plane wavebase, the K grid point is selected as 2×2×2.
Sphalerite crystal has a zinc blende structure with a space group of F 4 ¯ 3m, and belongs to the isometric system. Each unit cell of sphalerite contains 4 Zn atoms and 4 S atoms, of which S2- is the most tightly packed cubic and occupies the sites, and Zn2+ is filled in half of the tetrahedral voids[16,32]. The sites of its 1/4 diagonal are occupied by S atoms, 8 corners and 6 facial centers are Zn atoms. In this study, the sphalerite structure file was downloaded from the American Mineralogist Crystal Structure Database, as shown in Figure 1a. In order to control the doping concentration and make the simulation close to the actual situation, the 2×2×2 superunit cell (Figure 1b) is constructed by extending the unit cell of sphalerite. Considering that In is enriched in sphalerite along the {111} direction[4], the supercell model is doped with an In atom along the {111} direction, and the outer surface is doped with an Ag atom (Figure 2a) or Cu atom (Figure 2b). These two doped models are accordingly used for modeling the substitution mechanisms of A g + + I n 3 + 2 Z n 2 + and C u + + I n 3 + 2 Z n 2 + occurred in In-bearing sphalerite. For different modeling systems, convergence tests are performed first to select the best parameters.
It is tentatively estimated from the previous studies[51,52,53,54,55,56,57,58,59,60] that the mineralization temperature and pressure of In-rich sphalerite in magmatic-hydrothermal deposits are about 480-700K, and 20-43MPa, respectively. Thus, to simulate these actual mineralization conditions, the influence of temperature is introduced by molecular dynamics. In the designed numerical models, five groups of temperature and pressure are set from 500K-700K and 20-40Mpa, respectively. The valence electrons selected for the pseudopotential calculation of each atom are Zn3d104s2, S3s23p4, In4d105s25p1, Ag4d105s1, and Cu3d104s1.

3. Results

3.1. Sphalerite

3.1.1. Lattice Parameter

Figure 1a shows the crystal model of sphalerite, with blue spheres representing Zn atoms and yellow spheres representing S atoms. Firstly, BFGS algorithm is adopted to optimize the geometry of sphalerite unit cell. The lattice parameter of sphalerite unit cell after structural optimization is a = b = c = 5.439 Å, α = β = γ = 90°, while it is a = b = c = 5.401 Å, α = β = γ = 90° measured by the experiment[61]. The value error between theory calculation with the experiment is 0.7%, and it is within the allowable error range of the exchange correlation potential GGA-PBE selected in this experiment.
In order to control the concentration of In in sphalerite and make it more relevant to the actual situation, a 2×2×2 supercell model of sphalerite is constructed, which contains 32 Zn and 32 S atoms, with periodic boundary conditions. Figure 1b shows the geometrically optimized supercell structure of sphalerite, the lattice parameter of sphalerite supercell is a = b = c = 10.882Å, α = β = γ = 90°. In order to determine that the calculation method and selected parameters of this study are reliable, the electronic structure and Mulliken population of sphalerite unit cell is calculated, and the rationality of the parameters and methods used in this experiment can be explained by comparing the calculation results with the experimental results of previous studies.

3.1.2. Electronic Properties

The energy band is composed of many bands with similar energy levels, and the energy level interval between them is very small, which can be approximated as continuous, and the number of quantum states in the energy band is each unit energy interval near E is called Density of States (DOS). It is one of the most important parameters in solid state physics to describe the state of electron motion, and has been widely used in solid state physics, surface science and interfacial adsorption.
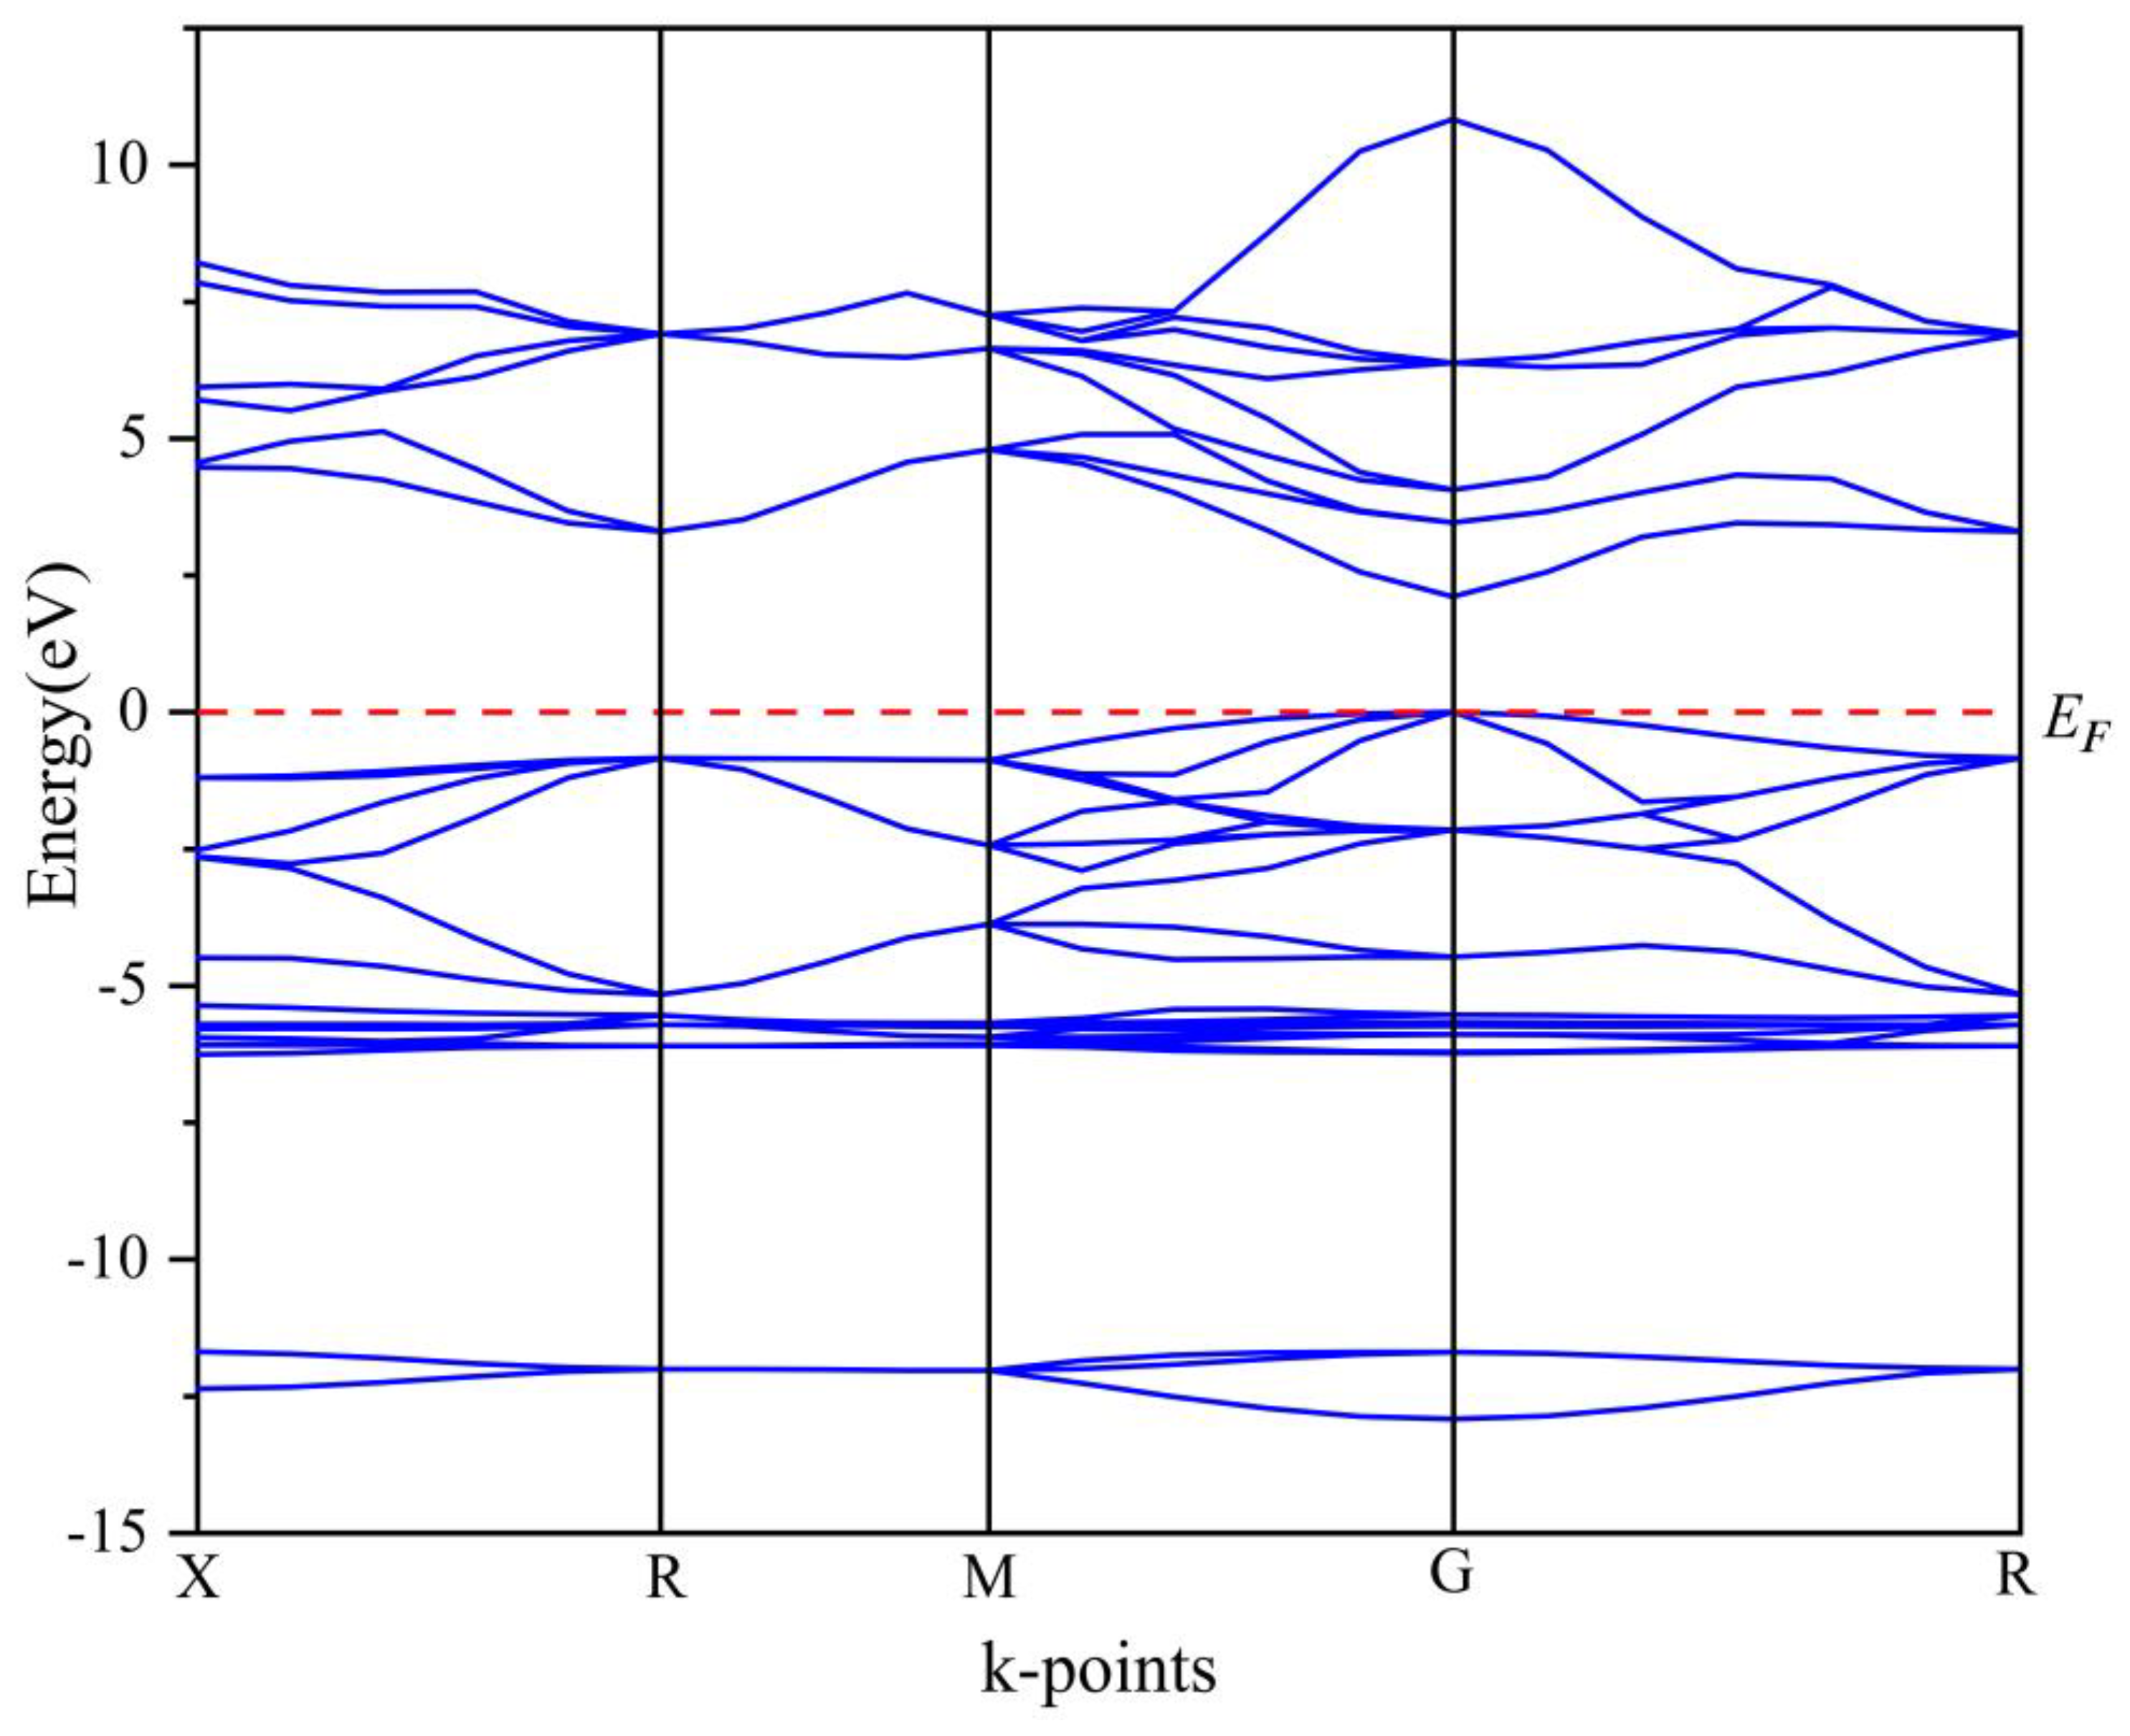
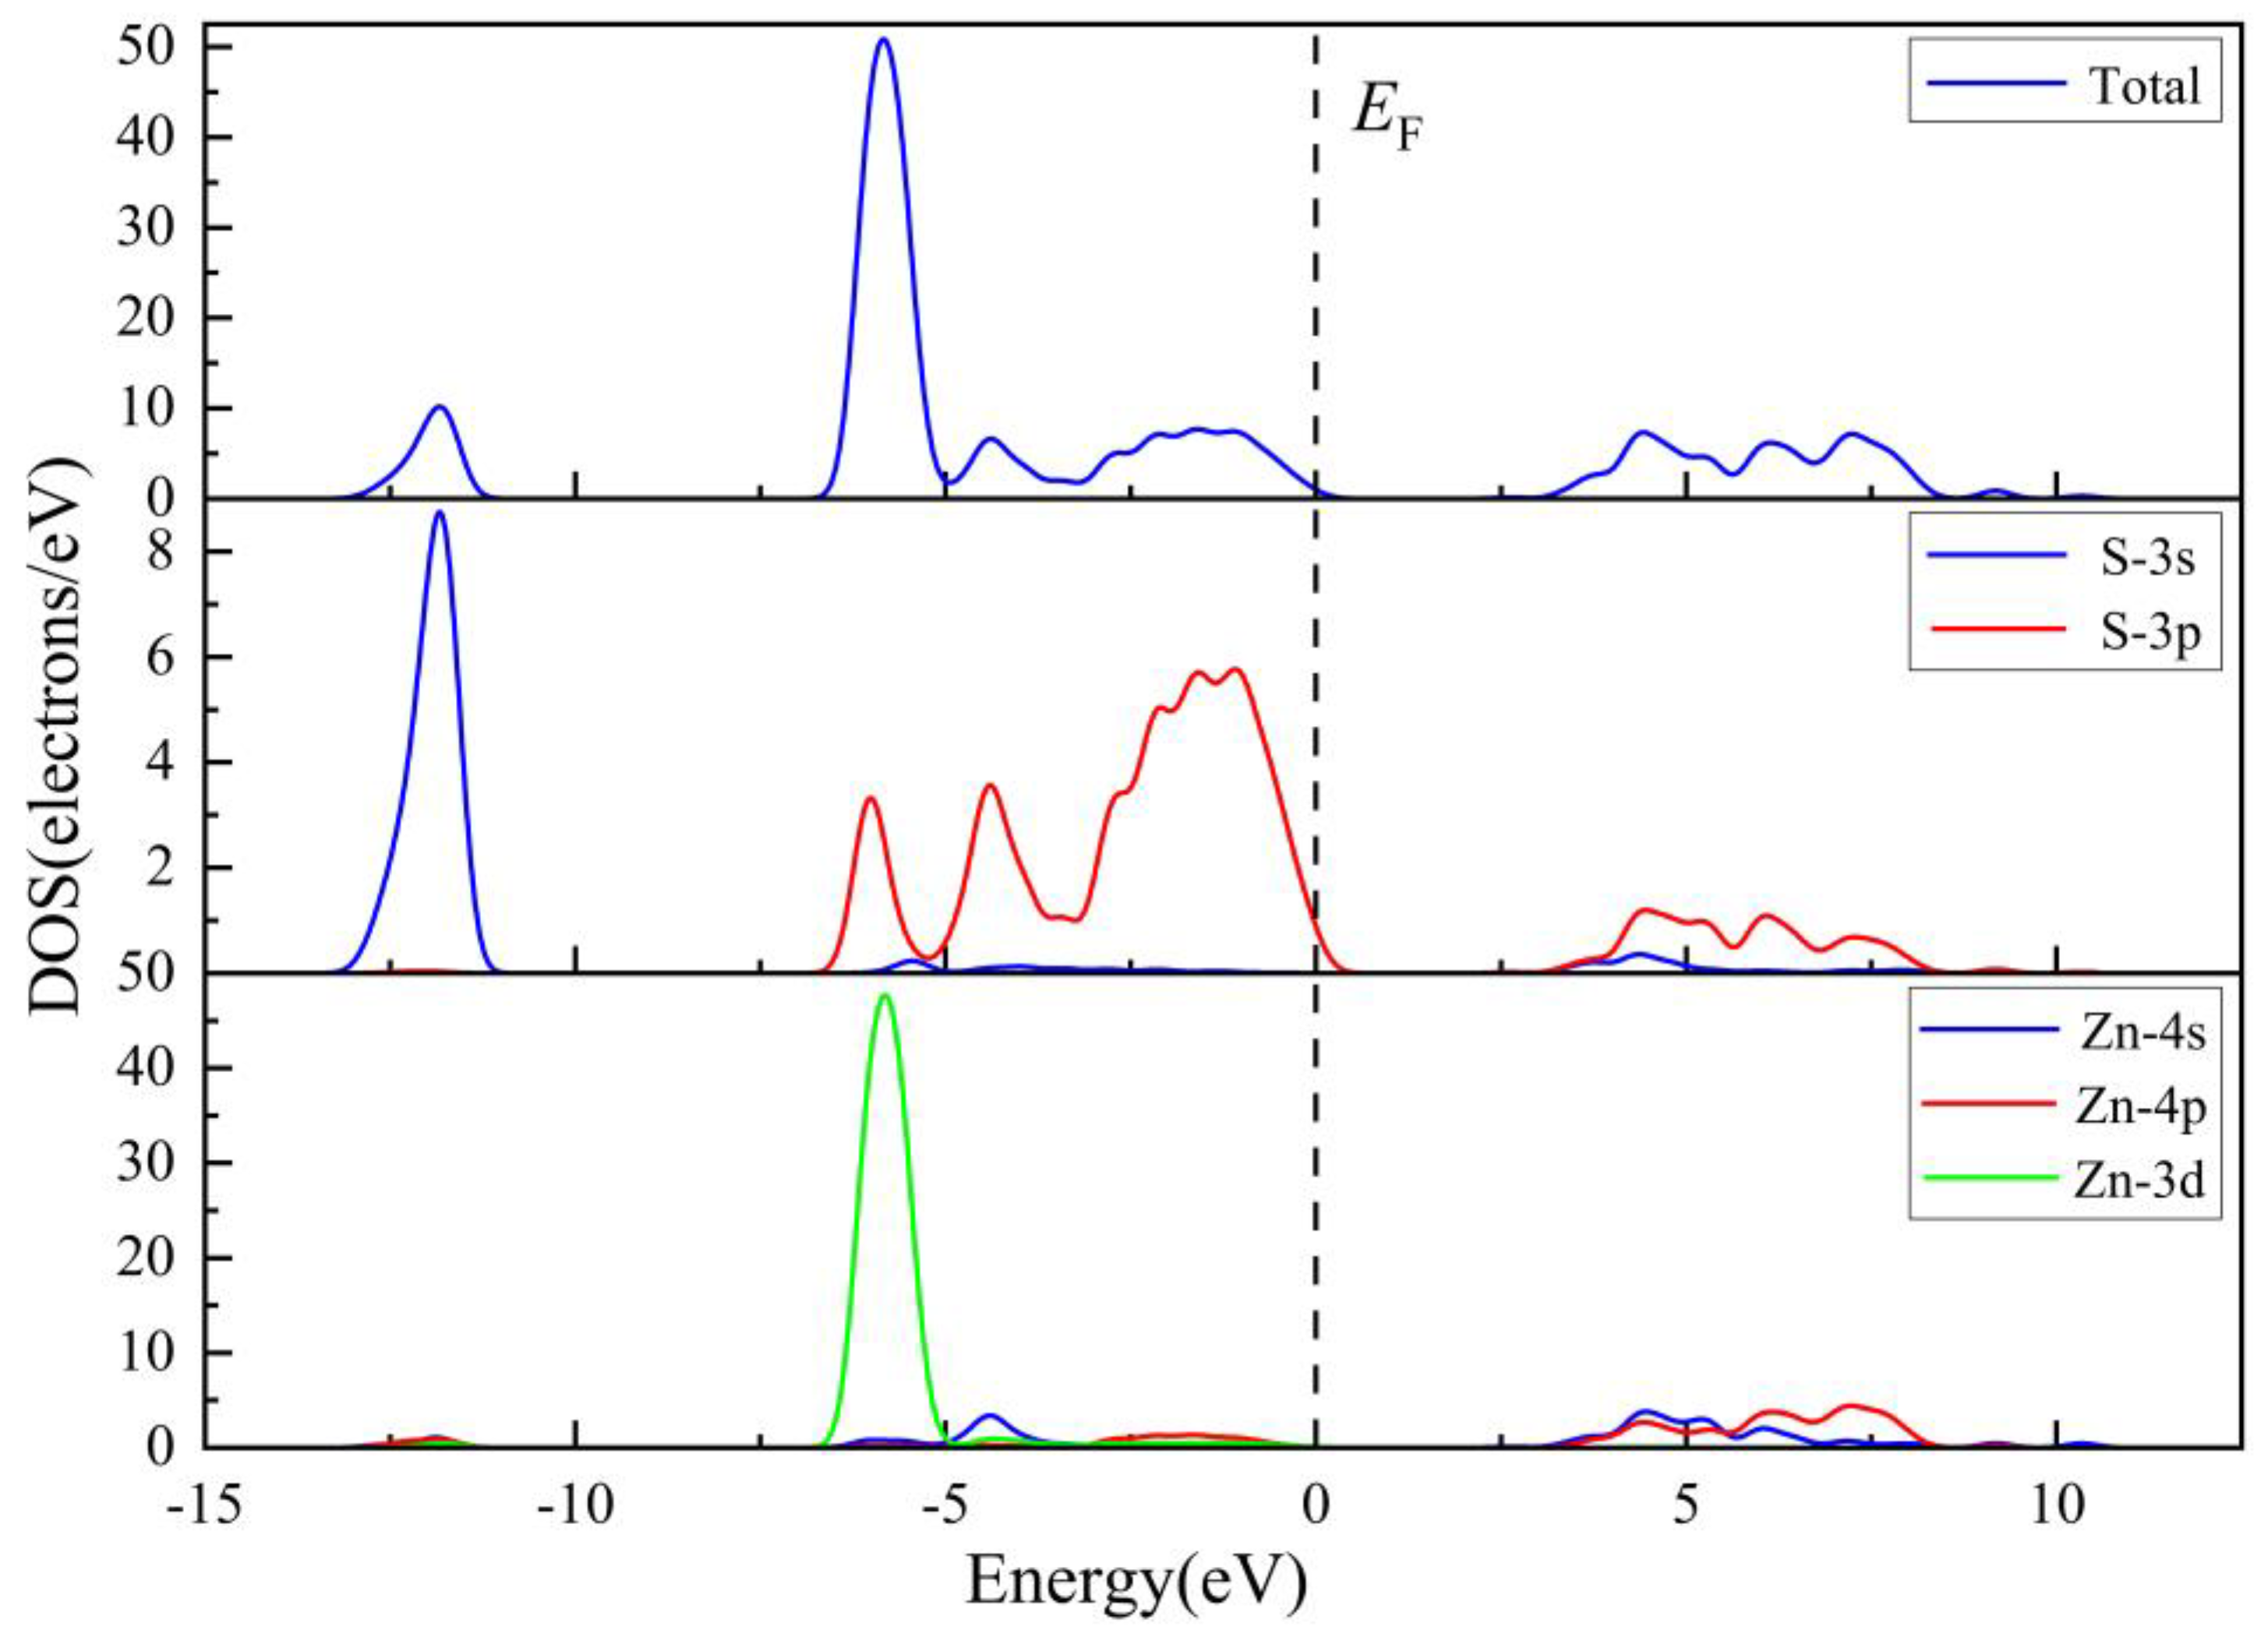
Figure 3 is the band structure of the sphalerite unit cell, and Figure 4 is the total and partial density of states of the sphalerite unit cell. The energy band at the left end of the sphalerite Fermi level is mainly composed of valence band, and it is mainly composed of three parts from low to high, of which the part located in the -13.5 ~ -11eV valence band is mainly contributed by the S atom 3s orbital; Located in the -6.7 ~-3.2eV valence band, the part is mainly contributed by the Zn atom 3d orbital and the S atom 3p orbital; Located in the -3.2 ~ 0eV valence band, the part is mainly contributed by the 3p orbitals of S atom and Zn atom 4p; The conduction band part is mainly contributed by the 4s and 4p orbitals of the Zn atom and the 3p orbital of the S atom. The 3d orbitals of Zn atoms and 3s orbitals of S atoms are mainly concentrated in the energy band with lower energy level, which has higher oxidation, easy to obtain electrons, the state density is flatter, the electron distribution is more dispersed, and the delocality is stronger.
Two types of orbitals, bonding and anti-bonding, are formed during the bonding of two atoms, usually in pairs. Since the energy decreases after bonding, the lower energy part of the state density diagram corresponds to the bonding orbital, and the higher energy part corresponds to the anti-bond orbital. It can be seen from Figure 4 that the 3d orbitals of Zn atoms and the low-energy level density peaks of S atoms basically coincide, indicating that it is manifested as bonding. The 4s orbital of the Zn atom and the high-energy level partial density peak of the 3p orbital of the S atom also coincide well. Thus, it shows an anti-bonding effect. The final manifestation is that sphalerite has two distinct state density peaks near the Fermi level. The electron state density of the lower energy level part is more than the electron state density of the high energy level part. Consequently, the overall manifestation of sphalerite is bonding, mainly the bonding of the 3d orbital of Zn atom and the 3p orbital of S atom. During mineralization, the ions that react with it in the environment may react primarily with these two orbitals. In the subsequent substitution process, the changes in these orbitals before and after doping can be compared.

3.1.3. Population Analysis

There are two types of Mulliken population: Muliken atomic population and Muliken bond populations. By analyzing the population of sphalerite, it is possible to quantitatively understand and compare the bonding between atoms. The atom population distributes the overlapping region charge evenly to the relevant atomic orbitals, and the charge distribution of each atomic orbital can be obtained. The bond population can reflect the overlap of electrons between two atoms, and then judge the ionization and covalence of the bond between the two atoms, that is, the stability of the bond, which provides a certain basis for the stability of the subsequent In and Ag (or Cu) after entering the sphalerite unit cell together. A higher Mulliken population indicates that there is more charge overlap between atoms and strong covalence of bonds, while a lower Mulliken population indicates less charge overlap between atoms, weak covalence of bonds, and strong ionism.
Table 1 and Table 2 show atomic population and bond population of sphalerite. It can be seen from the tables that the charge of the S atom in sphalerite is -0.47 and the charge of the Zn atom is +0.47. The S-Zn bond population of the ideal sphalerite is 0.46 and the bond length is 2.308 Å. In this calculation, the S-Zn bond population is 0.46 and the bond length is 2.35501 Å. The error is small, indicating that the parameters taken in this calculation are relatively reliable.

3.2. Coupled Substitution Scheme A g + + I n 3 + 2 Z n 2 +

3.2.1. Lattice Parameter

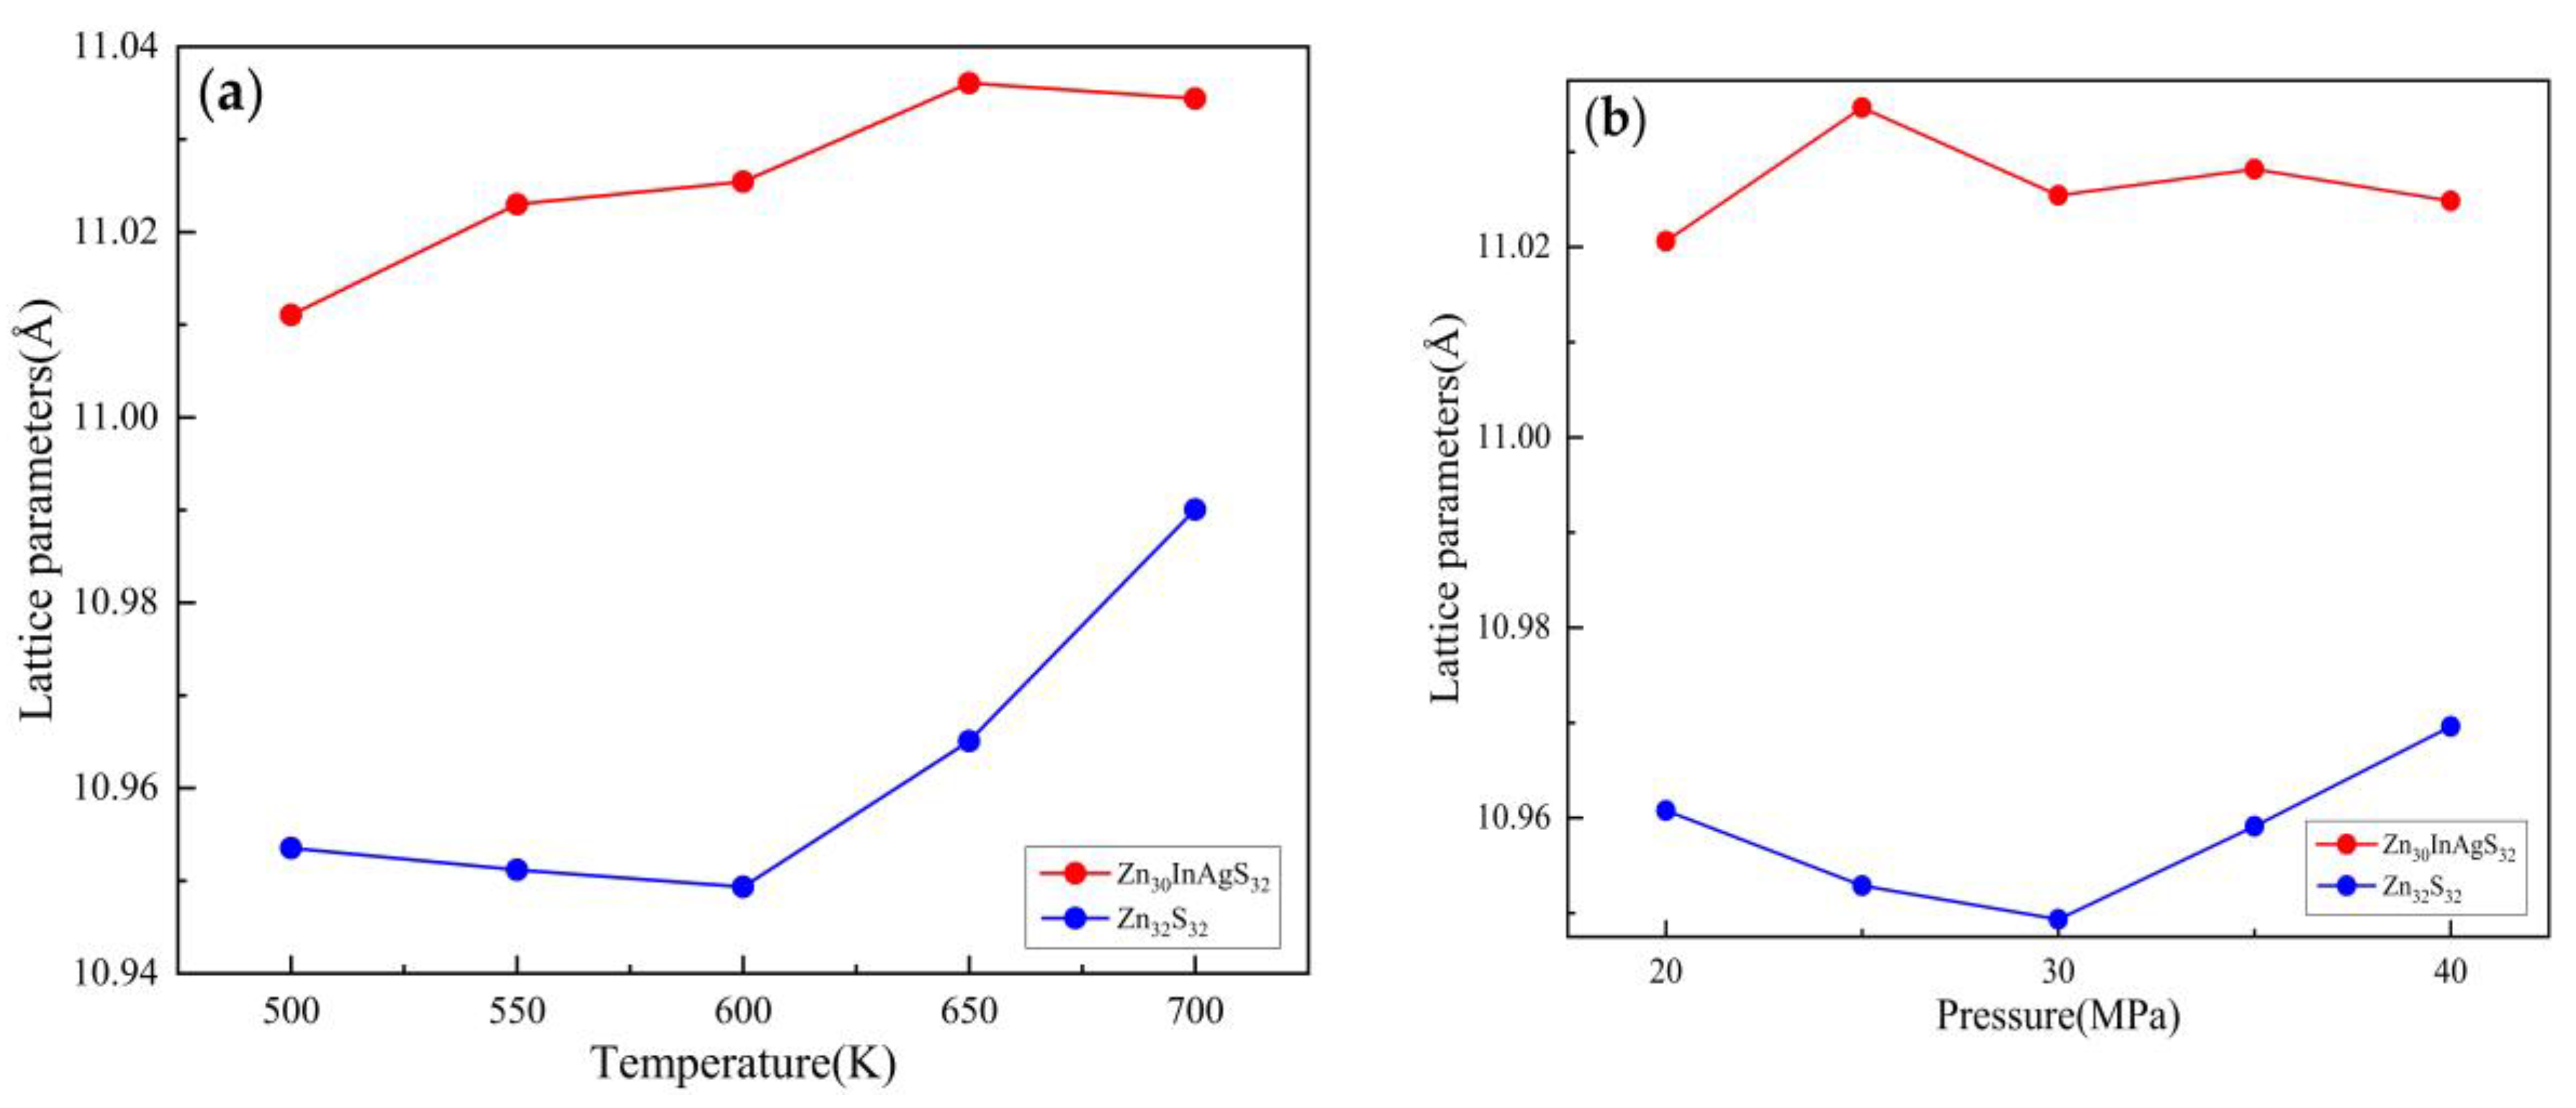
The length of the original supercell of sphalerite is a = b = c = 10.8186 Å, and the length of the doped system at different temperature and pressure is shown in Table 3. It can be seen from the table that the length of the doped system increases with the increase of temperature and decreases with the increase of pressure. These results suggest that the increase of temperature improves the ability of atomic motion of the system, and the increase of pressure limits the ability of atomic motion of the system. Nevertheless, there is no significant difference in overall gap. In this regard, the modeling results indicate the influence of temperature on cell length is much greater than that of pressure.
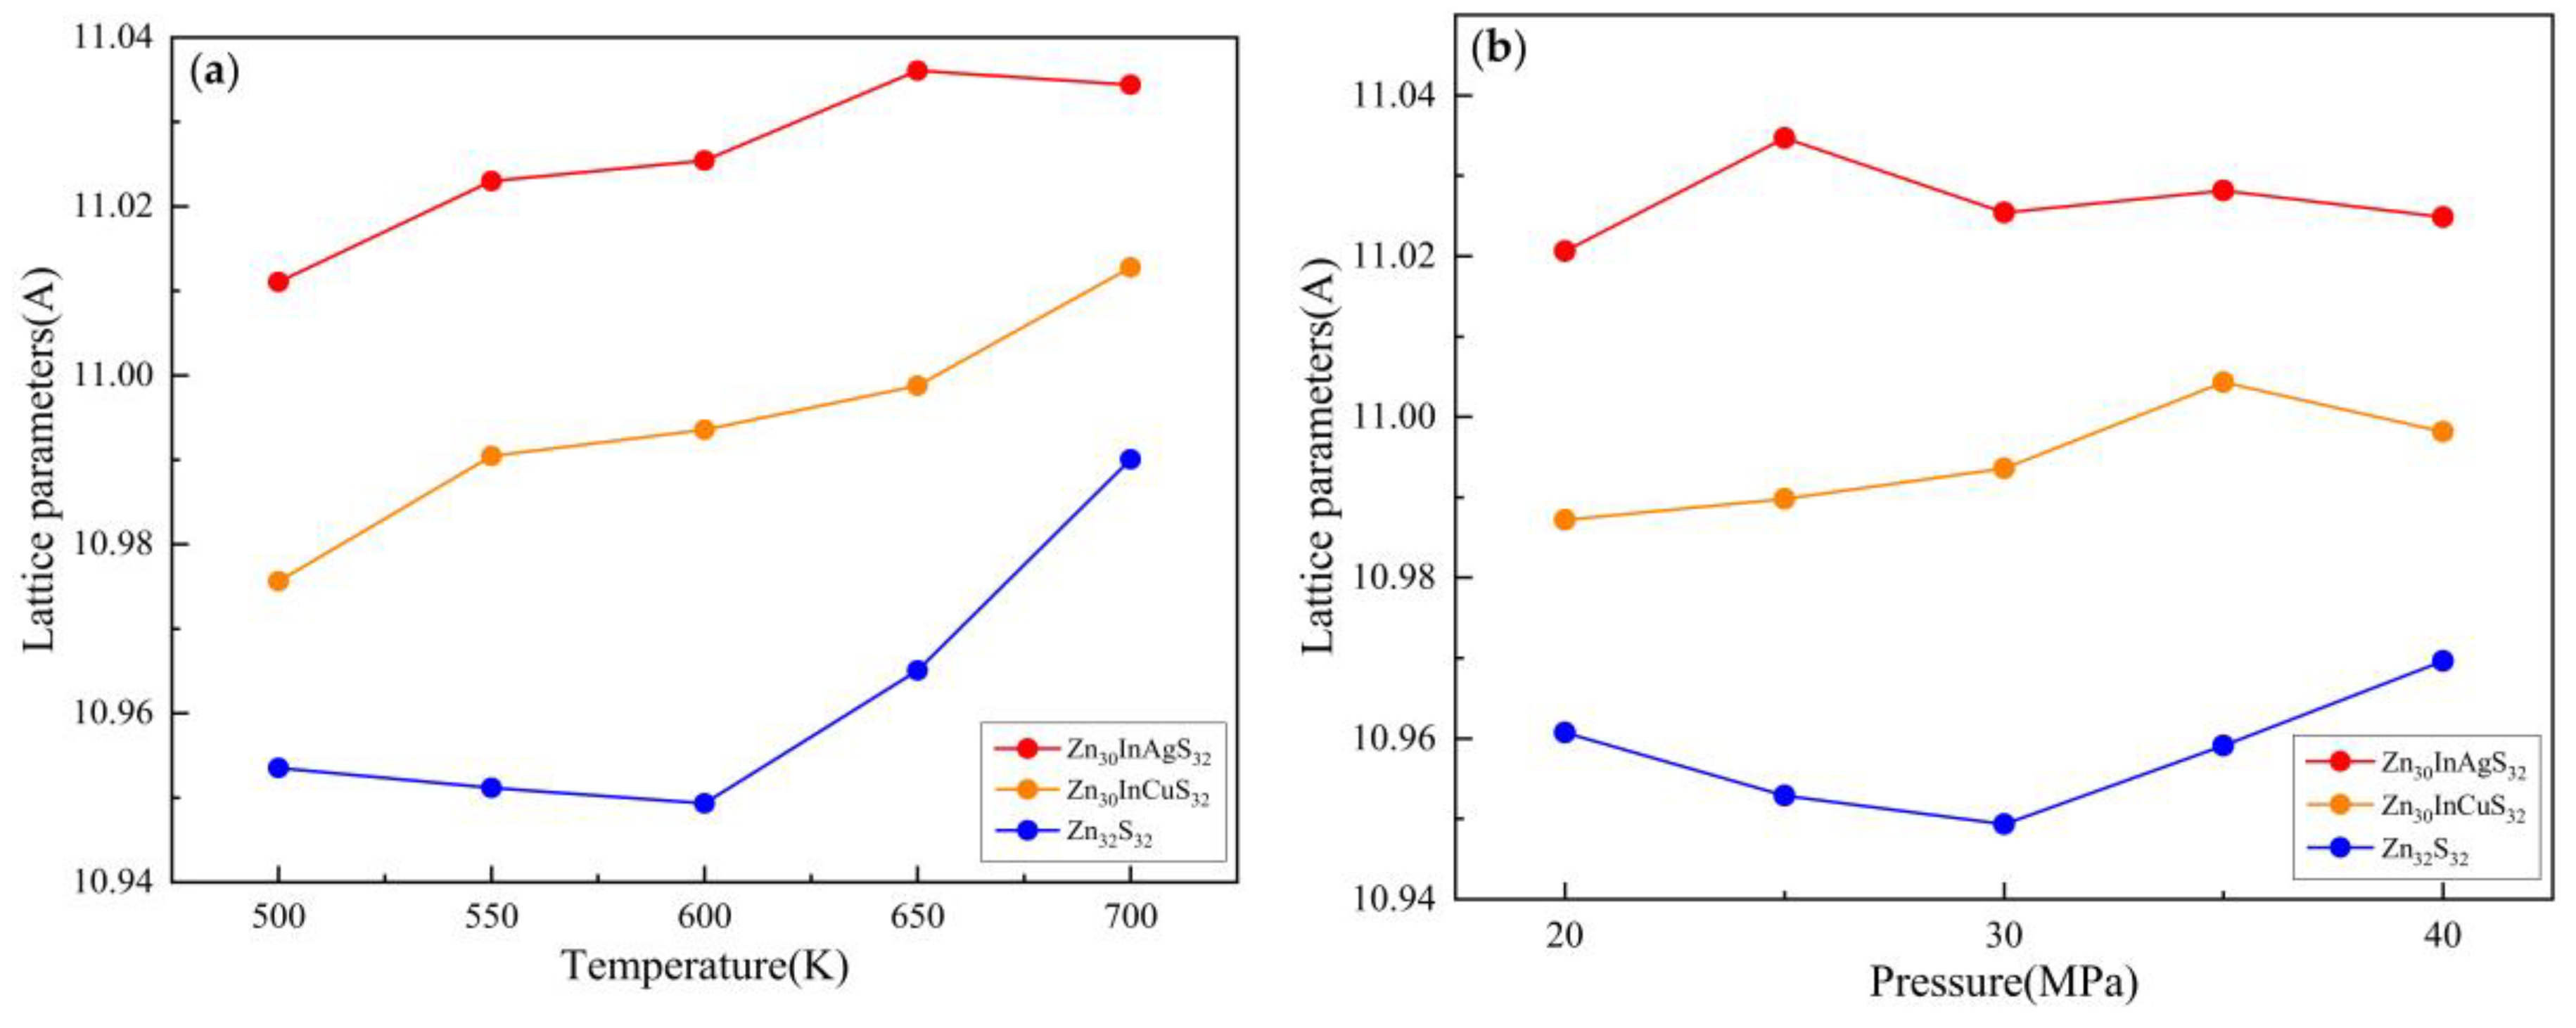
Figure 5 shows the lattice parameter as a function of temperature and pressure. The red line represents the sphalerite doped system that Ag and In substitute Zn via the coupled substitution scheme A g + + I n 3 + 2 Z n 2 + , and the blue line represents the sphalerite supercell. The lattice length shows an overall upward trend with the increase of temperature(Figure 5a), while it is not obvious with the change of pressure(Figure 5b). This is also in line with the law of thermal expansion and contraction. In addition, under the set temperature and pressure conditions, the lattice length of the replacement system is greater than that of the sphalerite supercell, indicating that after Ag and In enter sphalerite, the unit cell becomes larger, and the degree of distortion becomes larger, which may be that the radius of Ag atom and In atom is originally larger than that of Zn atom.

3.2.2. Substitution Energy

Substitution energy refers to the energy required by impurity atoms to replace atoms in sphalerite. For replacing Zn atoms, it is calculated as
E sub = ( E Z n S + I n + M + N Z n E Z n ) E Z n S + N I n E I n + N M E M
where E Z n S + I n + M is the total energy of the sphalerite supercell after In and Ag (Cu) substitute Zn, N Z n is the number of Zn atoms being replaced, E Z n is the energy of Zn atom, E Z n S is the total energy of ideal sphalerite supercell, N I n is the number of In atoms being replaced, E I n is the energy of In atom, N M represents the number of Ag(Cu) atoms being replaced, E M is the energy of Ag (Cu) atoms. E s u b is the substitution energy in the entire substitution scheme, the smaller the E s u b , the easier the substitution scheme is to carry out, and the more stable the system containing impurity atoms formed. E s u b indicates that the entire substitution scheme needs to absorb energy if it is positive values, while indicates that the reaction releases energy externally if it is negative values.
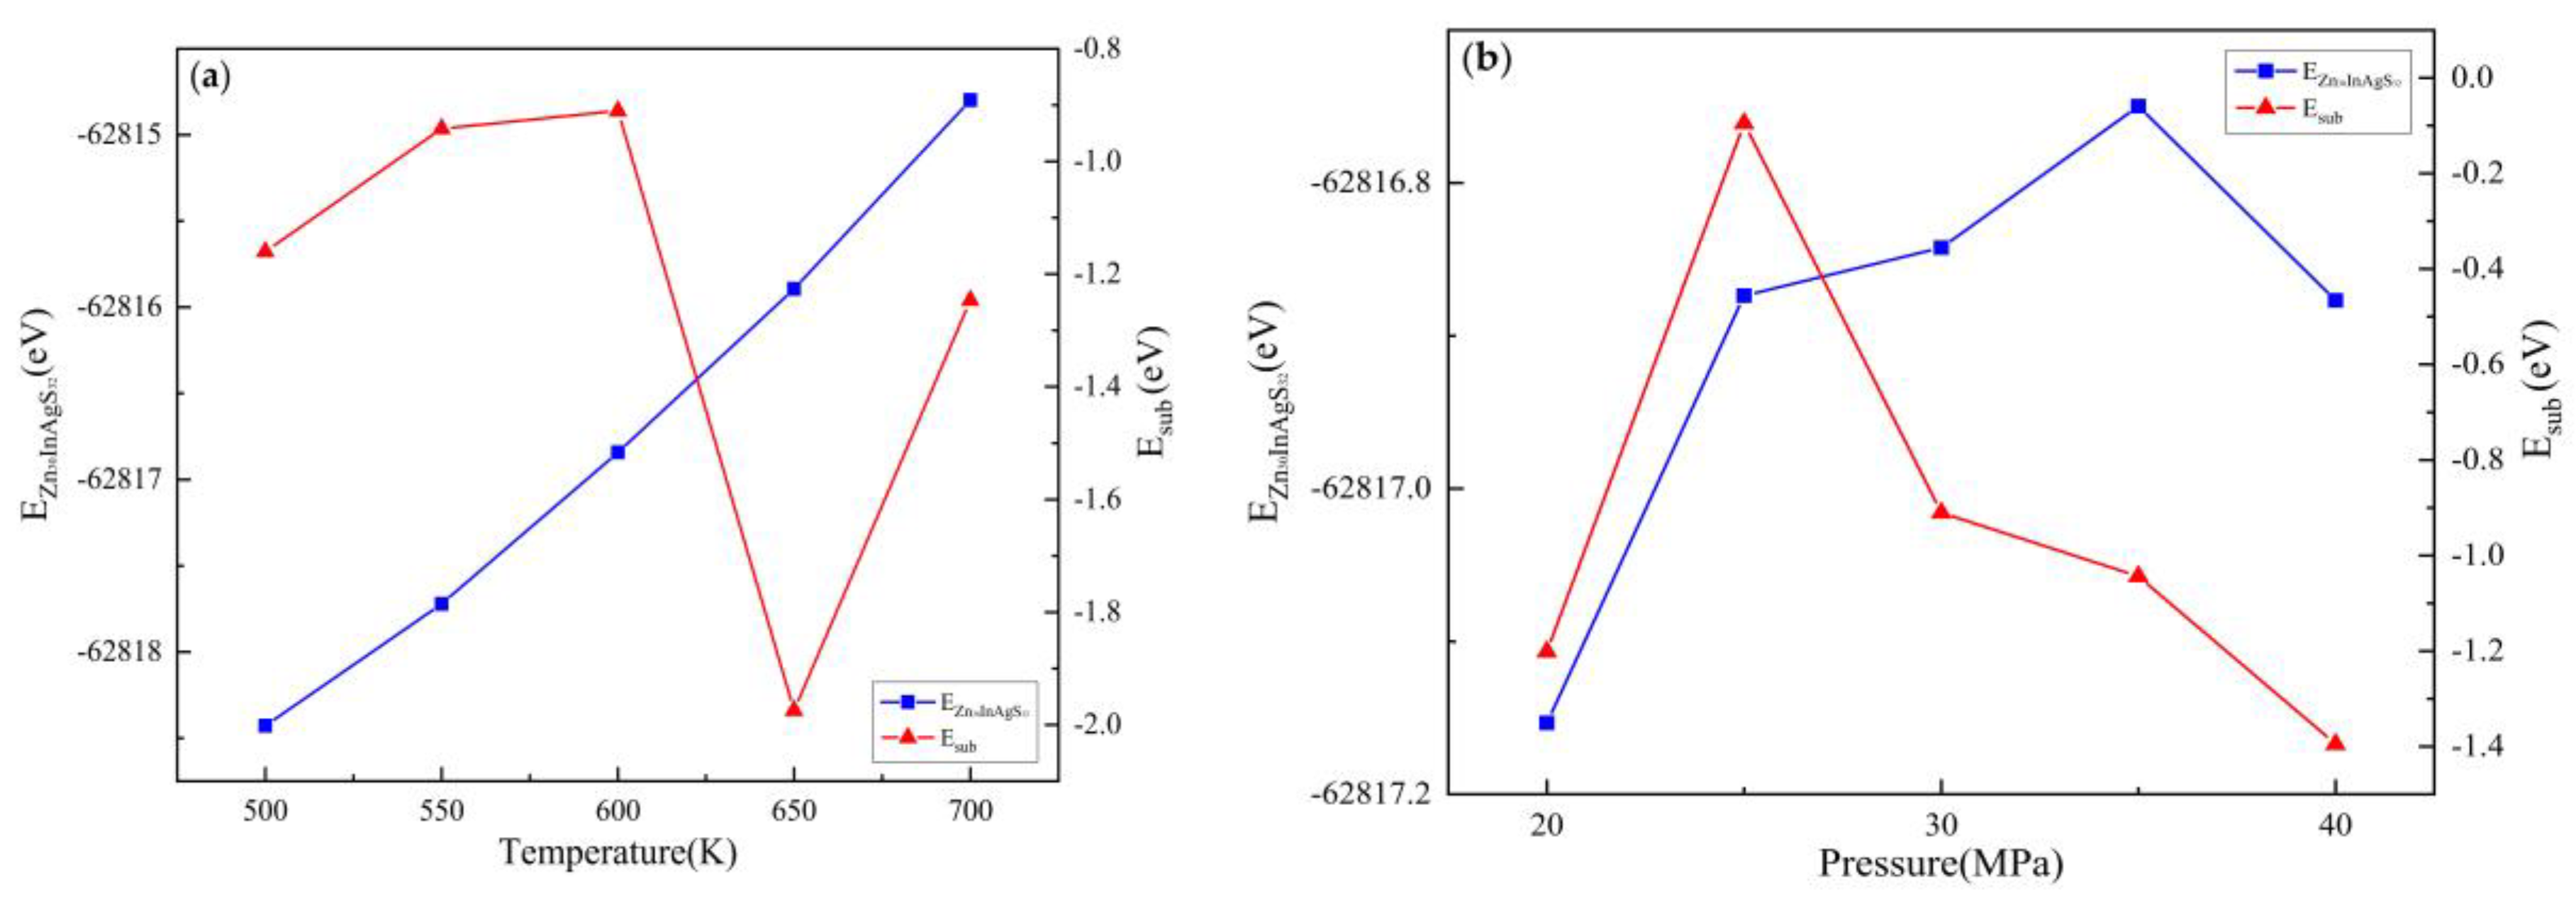
In the substitution scheme A g + + I n 3 + 2 Z n 2 + , 2 Zn atoms are replaced by 1 Ag atom and 1 In atom. Using the Equation (1), the results of each item are calculated at different temperatures and pressures as shown in Table 4. In the set temperature and pressure conditions, the substitution energy is negative, indicating that the reaction for In entering sphalerite via the substitution scheme A g + + I n 3 + 2 Z n 2 + can be carried out spontaneously. When keeping the pressure constant, the substitution energy is the lowest at 650K (Figure 6a), indicating that the reaction is easier to carry out under this temperature condition than others. When keeping the temperature unchanged, the substitution energy can first become larger and then smaller with the increase of pressure, and the lowest value appears at 40Mpa (Figure 6b). Overall, the greater the pressure, the easier the reaction is to carry out. With the increase of pressure, the distance between the reactants gradually decreases, so the efficiency of participating in the reaction also increases. Thus, relatively speaking, temperature changes have a greater effect on substitution energy than pressure changes.

3.2.3. Electronic Properties

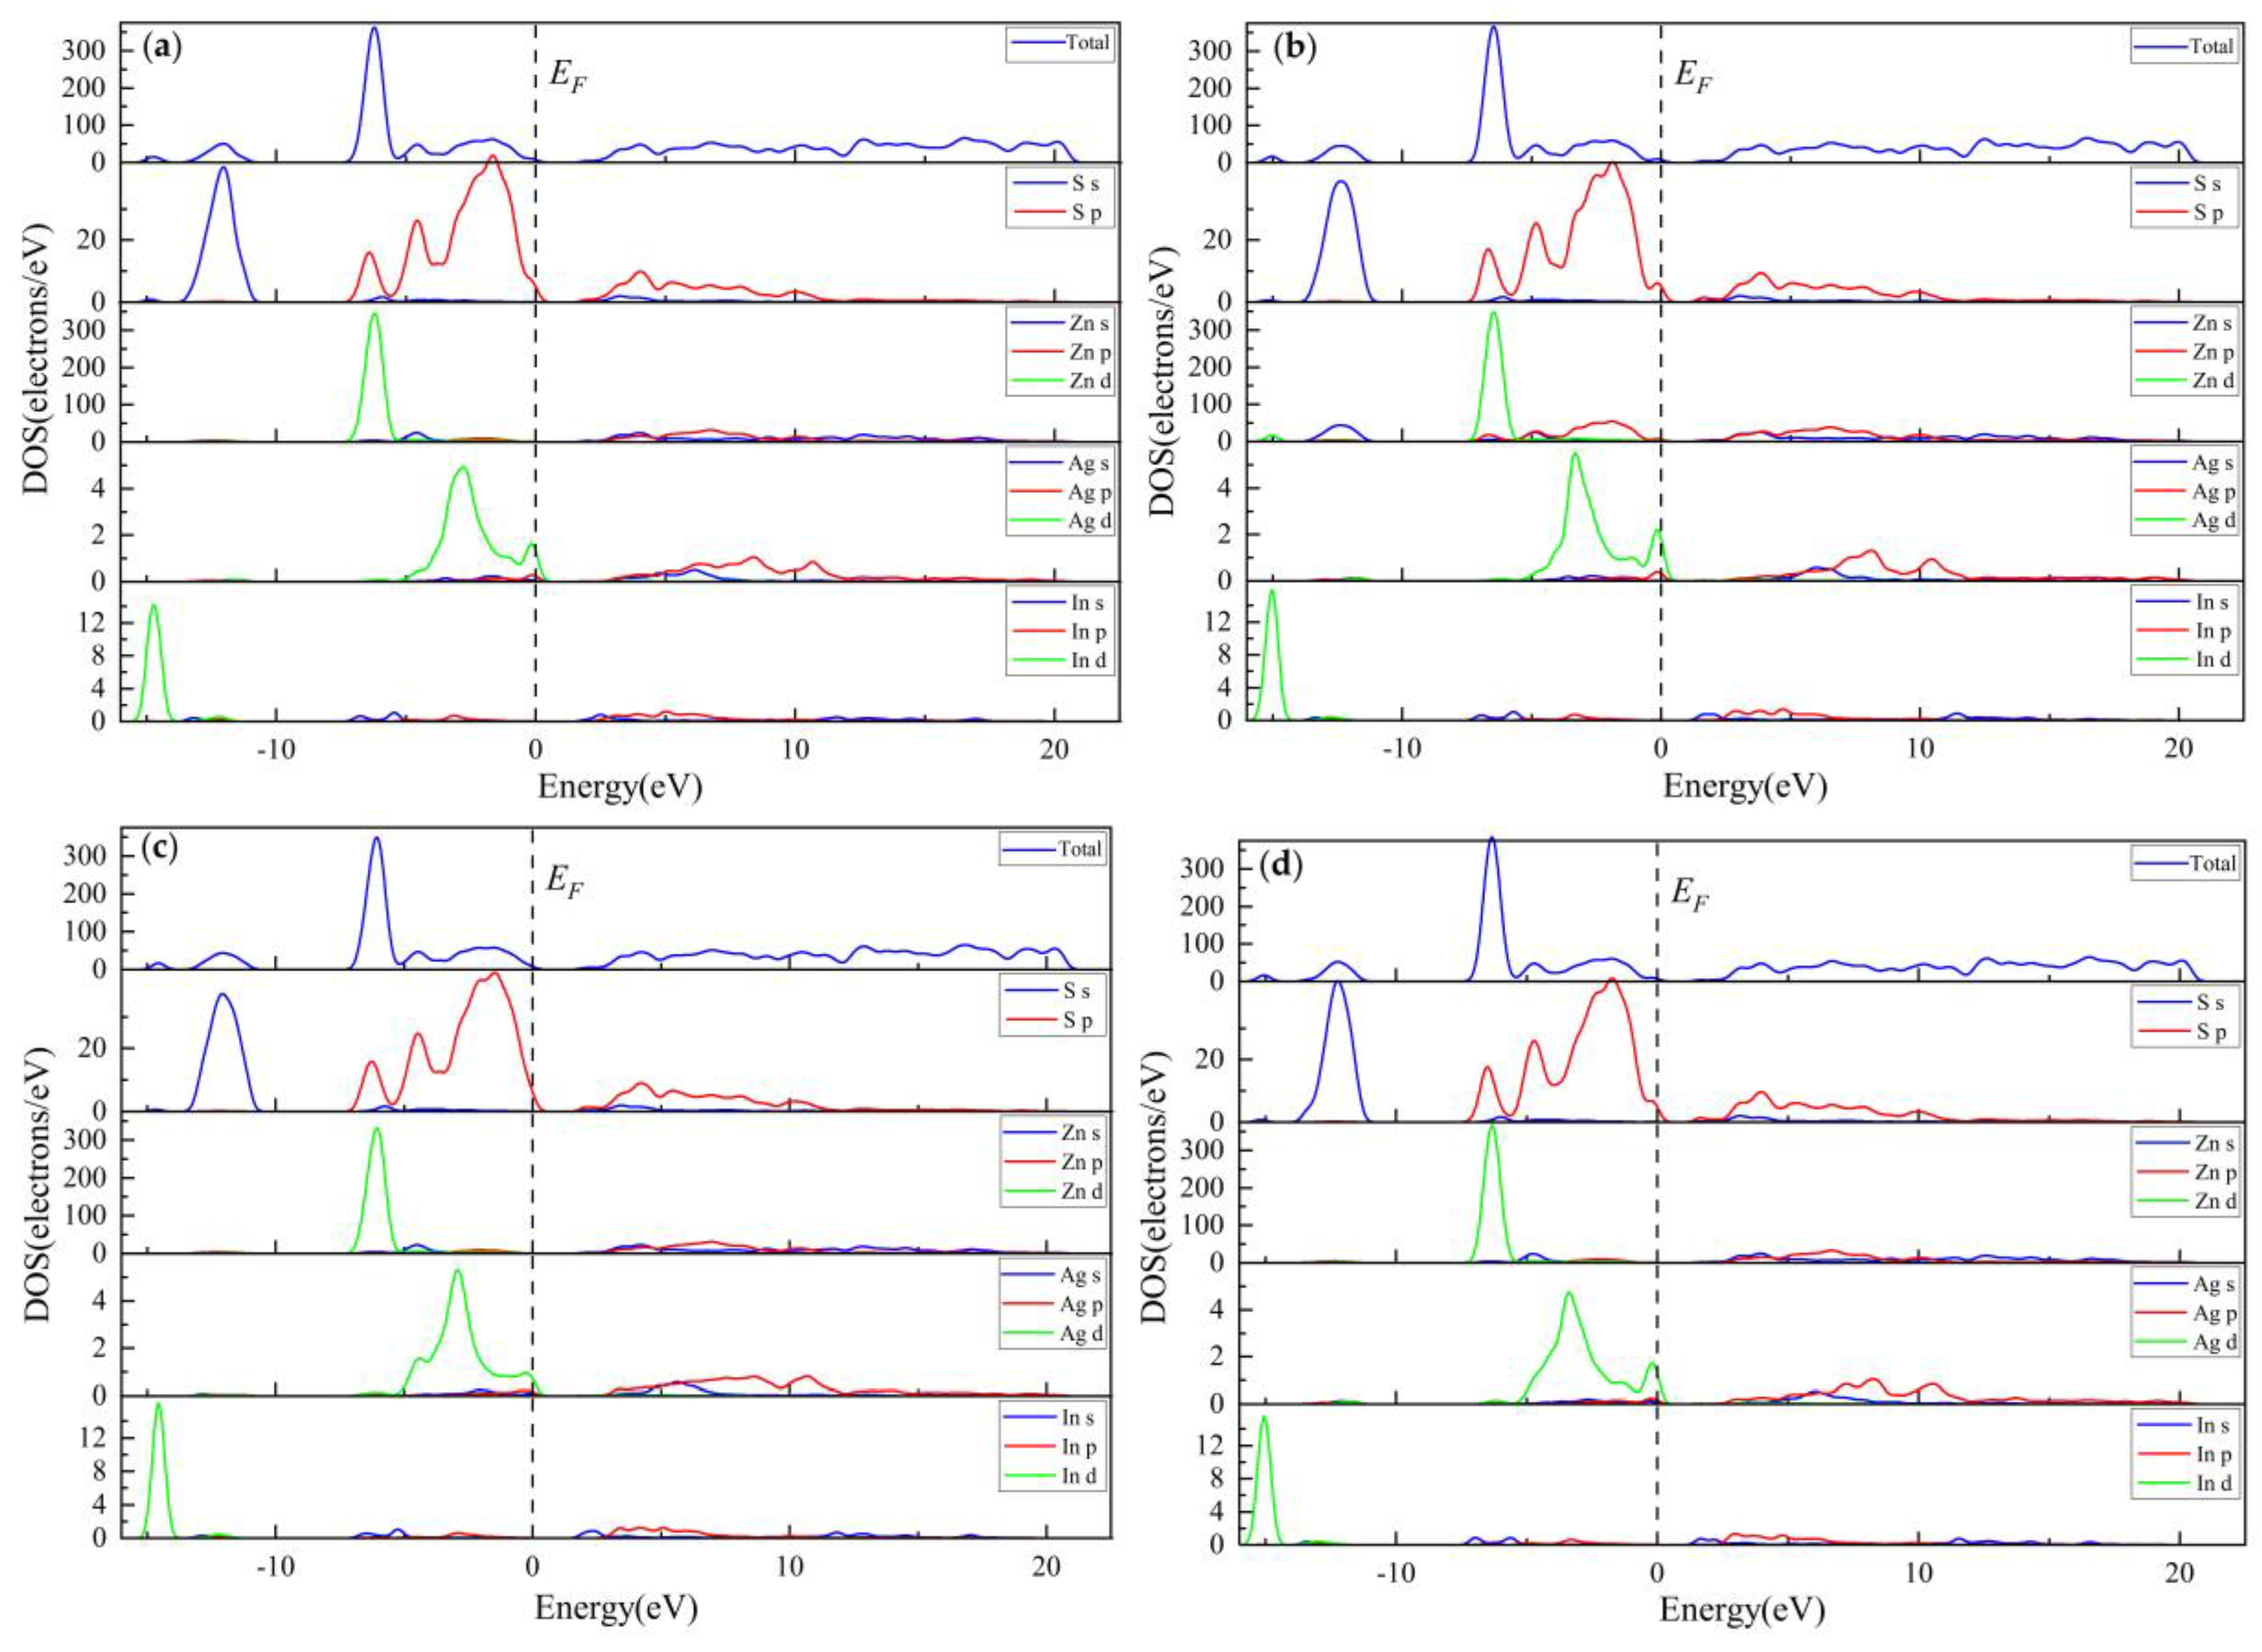
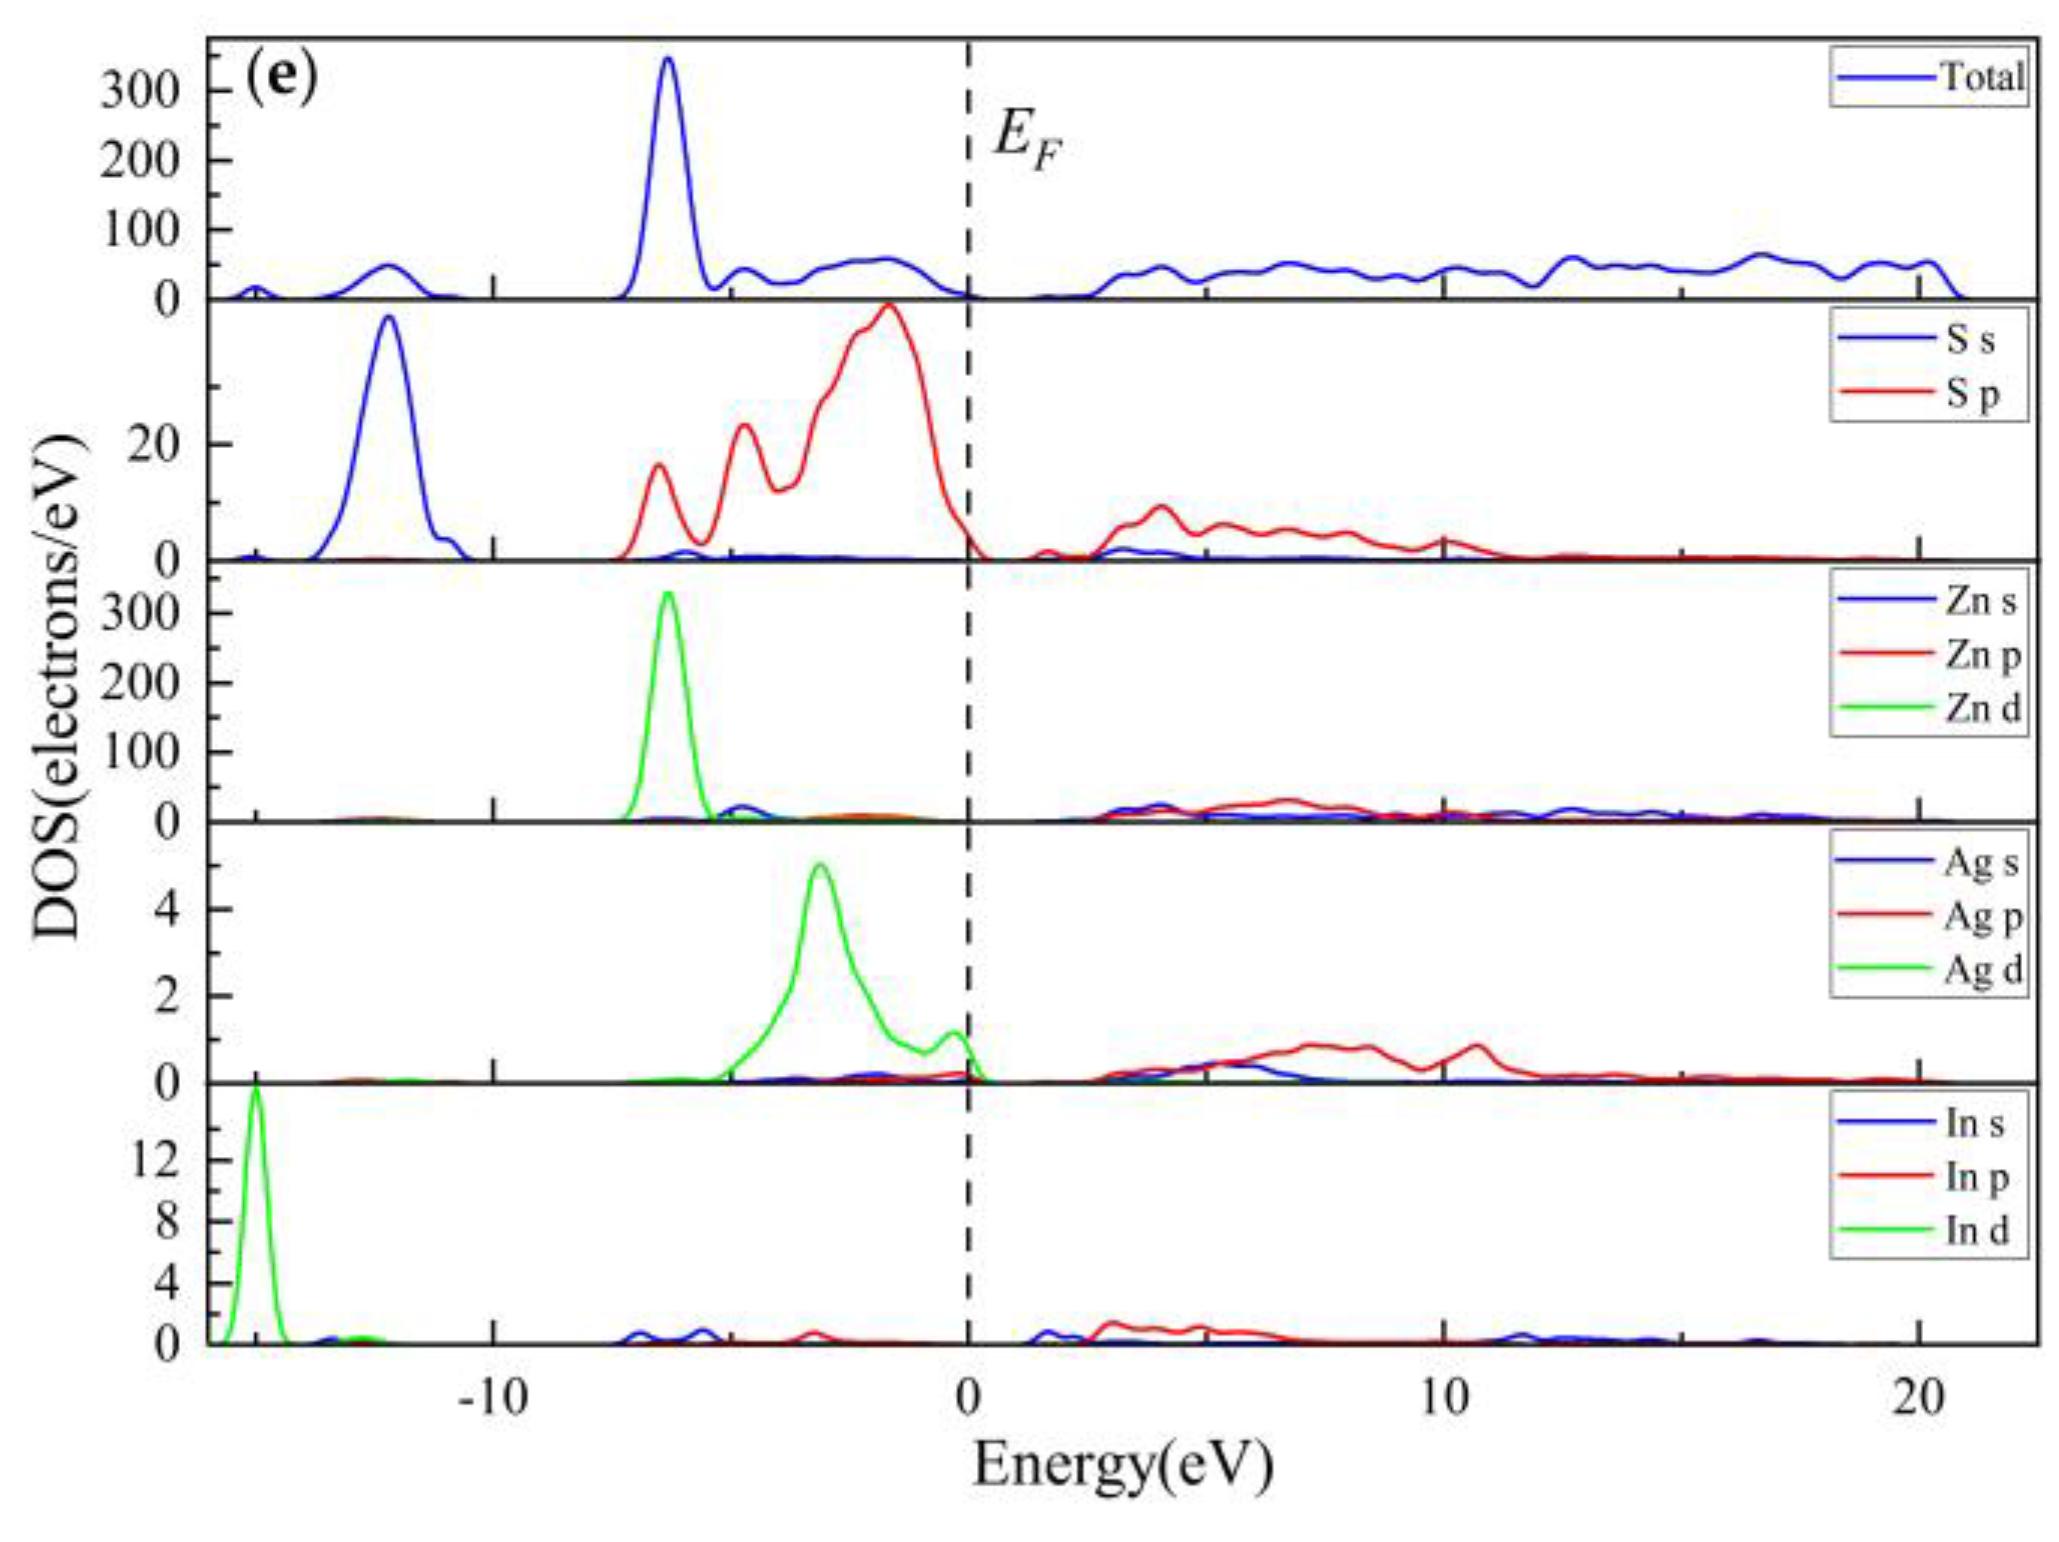
Figure 7 and Figure 8 show the total and partial DOS of Zn30InAgS32 in various temperature and pressure conditions. The effect of temperature and pressure changes on the density of the system is relatively small on the whole, and the main form hardly changes. Overall, the electron density orbital is mainly contributed by the d orbital, and the energy band at the left end of the Fermi level of the Zn30InAgS32 Fermi level of the sphalerite doped system is composed of valence band, which is mainly composed of four parts from low to high, of which the part located in the -15 ~ -14eV valence band is mainly contributed by the d orbital of the In atom; Located in the -13 ~ -11eV valence band, the part is mainly contributed by the s orbital of the S atom; Located in the -7 ~-5eV valence band, it is mainly contributed by the d orbital of Zn atom and the p orbital of S atom; The valence band of -5 ~ 0eV is mainly contributed by the p orbital of the S atom and the d orbital of the Ag atom. The conduction band part is mainly contributed by the s and p orbitals of Zn, S, Ag and In, and the overall distribution is relatively flat, the electron distribution is more dispersed, and the delocality is stronger. The d orbitals of the In atom, the d orbital of the Zn atom and the p orbital of the S atom are mainly concentrated in the energy band with a lower energy level, which has high oxidation and is easy to obtain electrons. The density of the s orbitals of the In atom and the s and p orbitals of the Ag atom are flatter, the electron distribution is more dispersed, and the delocality is stronger.
The electron state density energy on the In p orbital is stronger, while the electron state density energy on the d orbital is lower, and the state density near the Fermi level is mainly contributed by the p and d orbitals of Ag. The p-layer and d-layer orbitals of Ag atoms spike at the Fermi level, indicating that Ag plays an important role in bonding in the process of In entering sphalerite.
When the temperature remains unchanged at 600K and the pressure is 20MPa (Figure 7a), the p orbital of Zn atom and the d orbital energy of Ag atom are significantly increased, indicating that the system has a significant impact on the bonding of these atoms at 20MPa. At 40MPa (Figure 7e), the overall energy of the In atom is lower, indicating that the system is relatively stable at this time. This is consistent with the results of the substitution energy calculation shown in Figure 6. The pressure remains unchanged at 30MPa, and when the temperature is 650K (Figure 8d), the d orbital of the In atom is shifted the most to the left as a whole, and the peak is the highest, indicating that the In atom is relatively stable at 650K, which means that In enters sphalerite at this temperature.

3.2.4. Population Analysis

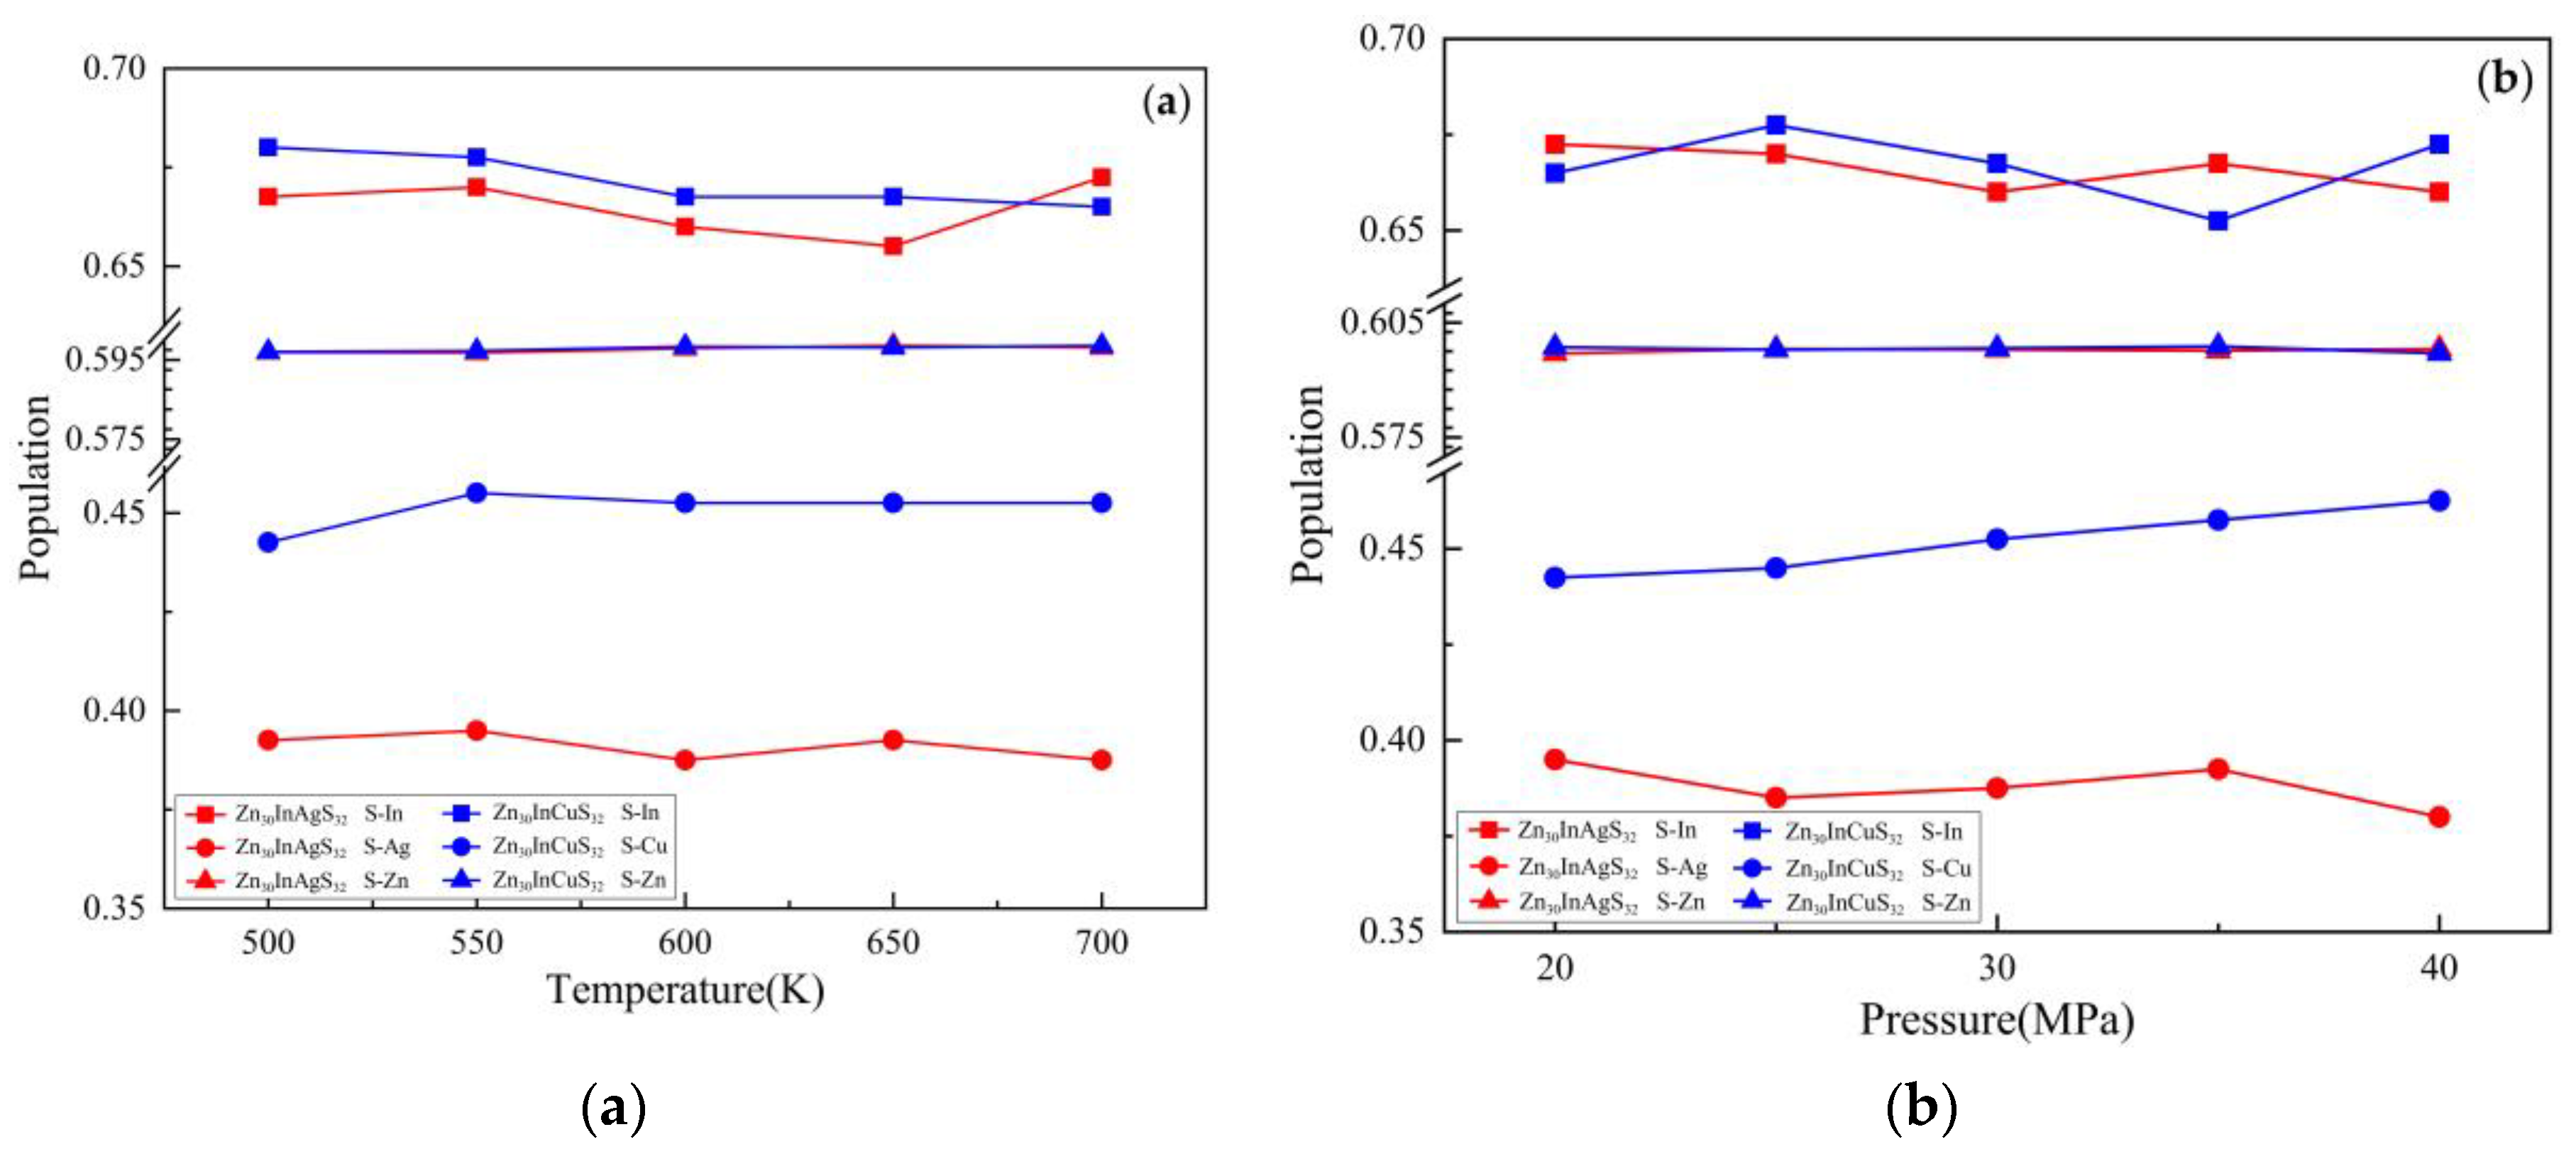
The bond population of the doped system at different temperature and pressure conditions is shown in Table 5. On the whole, when the pressure is kept unchanged, the S-In bond population decreases with the increase of temperature, and the bond length increases with the increase of temperature, while length and population of S-Ag bonds and S-Zn bonds change less overall. When the temperature is kept unchanged, the population of S-In bond, S-Ag bond first decreases and then increases with the increase of pressure, and the bond length increases first and then decreases. The average population of the S-In bond is 0.666, the bond length is about 2.382 Å, while the S-Zn bond population is 0.598, the bond length is about 2.363 Å, the population of the S-Ag bond is 0.390, the bond length is about 2.377 Å, and the S-In bond population is larger than that of the S-Zn bond, indicating that the S-In bond strength is greater than the S-Zn bond strength. The population of the S-In bond is larger than the overlapping distribution of the S-Ag bond, and the bond length is shorter, indicating that although the In atom and the Ag atom are co-replaced into the sphalerite crystal system, the In atom is relatively stable in the crystal.
When the temperature changed from 500K to 700K, the S-In bond population increased from 0.668 to 0.673 (0.7%), while the S-Ag bond population decreased from 0.393 to 0.388 (1.3%), indicating that the strength of the S-In bond was greater than the strength of the S-Ag bond when the temperature changed. When the pressure changes from 20MPa to 40MPa, the S-In bond population decreases from 0.673 to 0.660 (1.9%), while the S-Ag bond population decreases from 0.395 to 0.380 (3.8%), indicating that the strength of the S-In bond is stronger than that of the S-Ag bond when the pressure changes. Temperature and pressure changes have a great influence on S-Ag bonds.

3.3. Coupled Substitution Scheme C u + + I n 3 + 2 Z n 2 +

3.3.1. Lattice Parameter

The length of the doped system Zn30InCuS32 at different temperatures and pressures is shown in Table 6. It can be seen from the table that the length of the doped system increases with the increase of temperature and decreases with the increase of pressure, indicating that the increase of temperature improves the ability of atomic motion of the system, and the increase of pressure limits the ability of atomic motion of the system. But the overall gap is not particularly obvious, relatively speaking, the influence of temperature on unit cell length is greater than pressure. In general, the trend is the same as that of Zn30InAgS32
In addition, under the set temperature (Figure 9a) and pressure (Figure 9b) conditions, the lattice length of the re-placement system is greater than that of the original sphalerite supercell in the same conditions, indicating that after Cu and In enter sphalerite, the unit cell becomes larger, and the degree of distortion becomes larger, which may be that the radius of Cu atom and In atom is originally larger than that of Zn atom.

3.3.2. Substitution Energy

In the C u + + I n 3 + 2 Z n 2 + mechanism, 2 Zn atoms are replaced with 1 Cu atom and 1 In atom. Using Equation 1, the results of the calculations at different temperatures and pressures are shown in Table 7. In the set temperature and pressure conditions, the substitution energy is negative, indicating that the reaction in which In enters sphalerite with the substitution mechanism of C u + + I n 3 + 2 Z n 2 + can be carried out spontaneously. When keeping the pressure unchanged, the substitution energy first becomes smaller and then increases with the increase of temperature, and the substitution energy appears at the lowest value at 650K (Figure 10a), and then rises sharply, indicating that the reaction releases the most energy at a temperature of 650K, the reaction is the easiest to carry out, and the reaction is not easy to carry out after exceeding this temperature; When the temperature is kept unchanged, on the whole, the substitution energy decreases with the increase of pressure, and the substitution energy appears at the lowest value at 40MPa(Figure 10b), indicating that the reaction is easy to carry out under this pressure condition, and the pressure condition that is most likely to react is 40MPa.

3.3.3. Electronic Properties

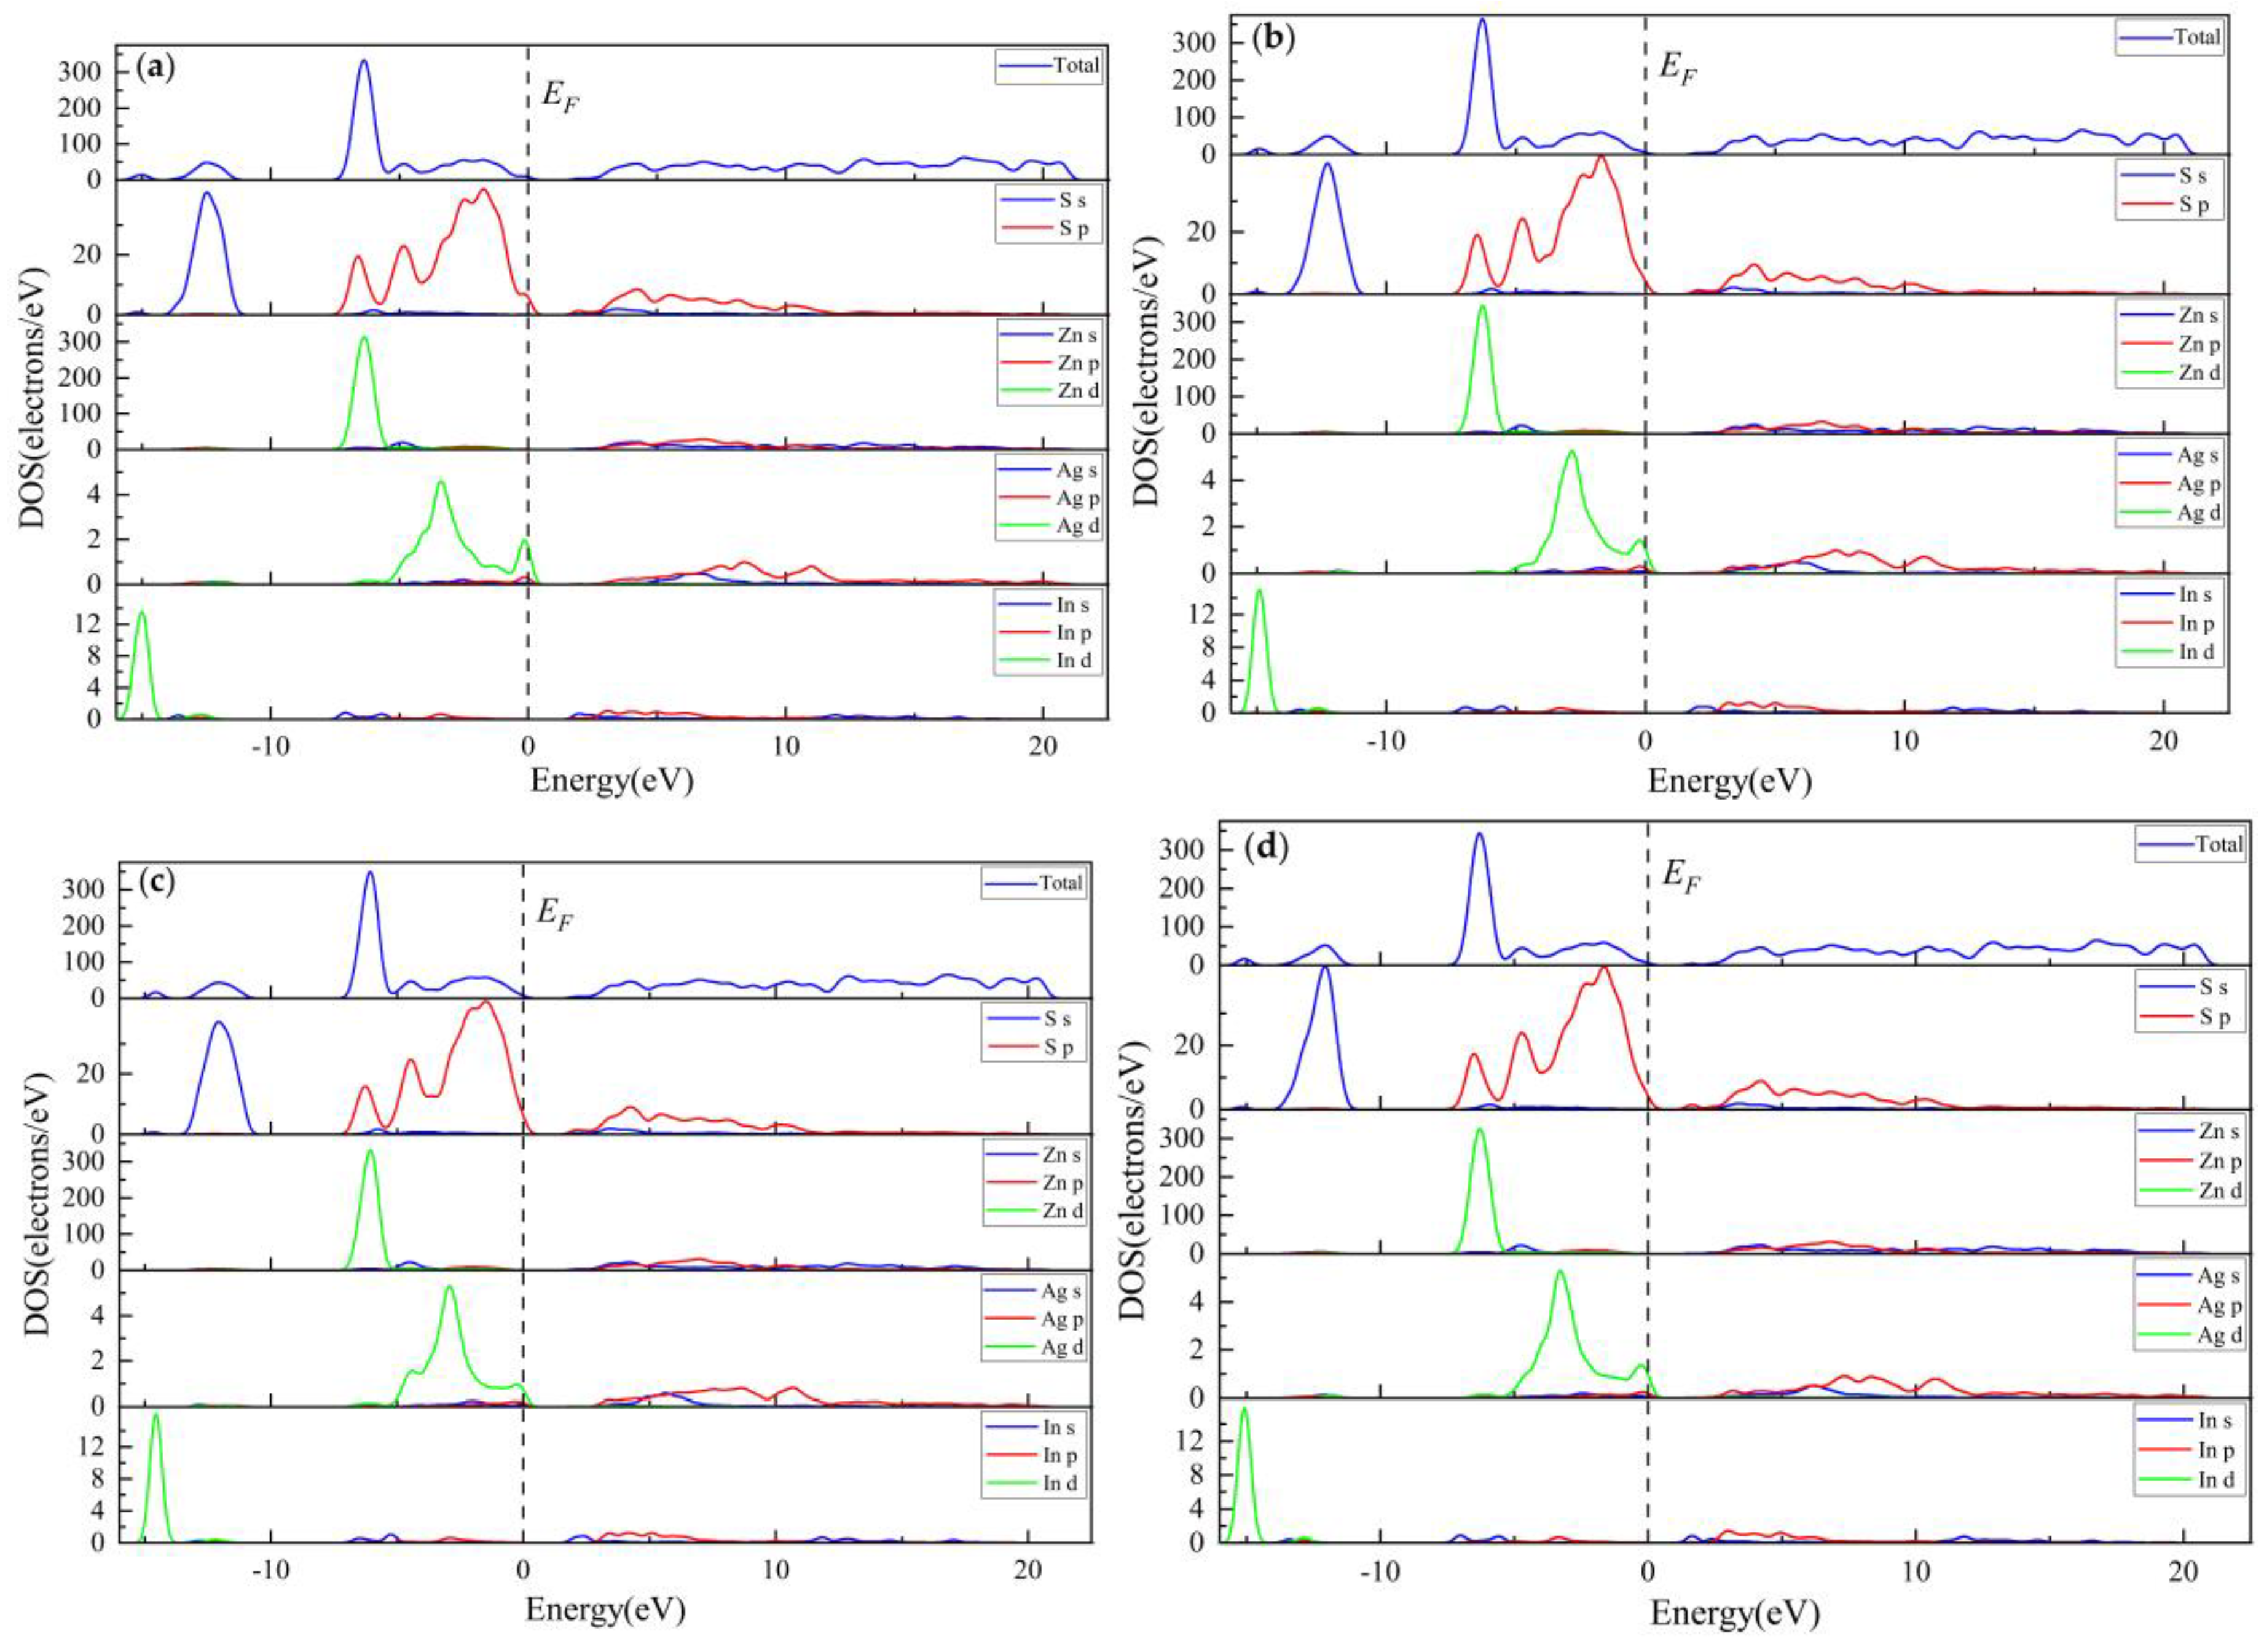
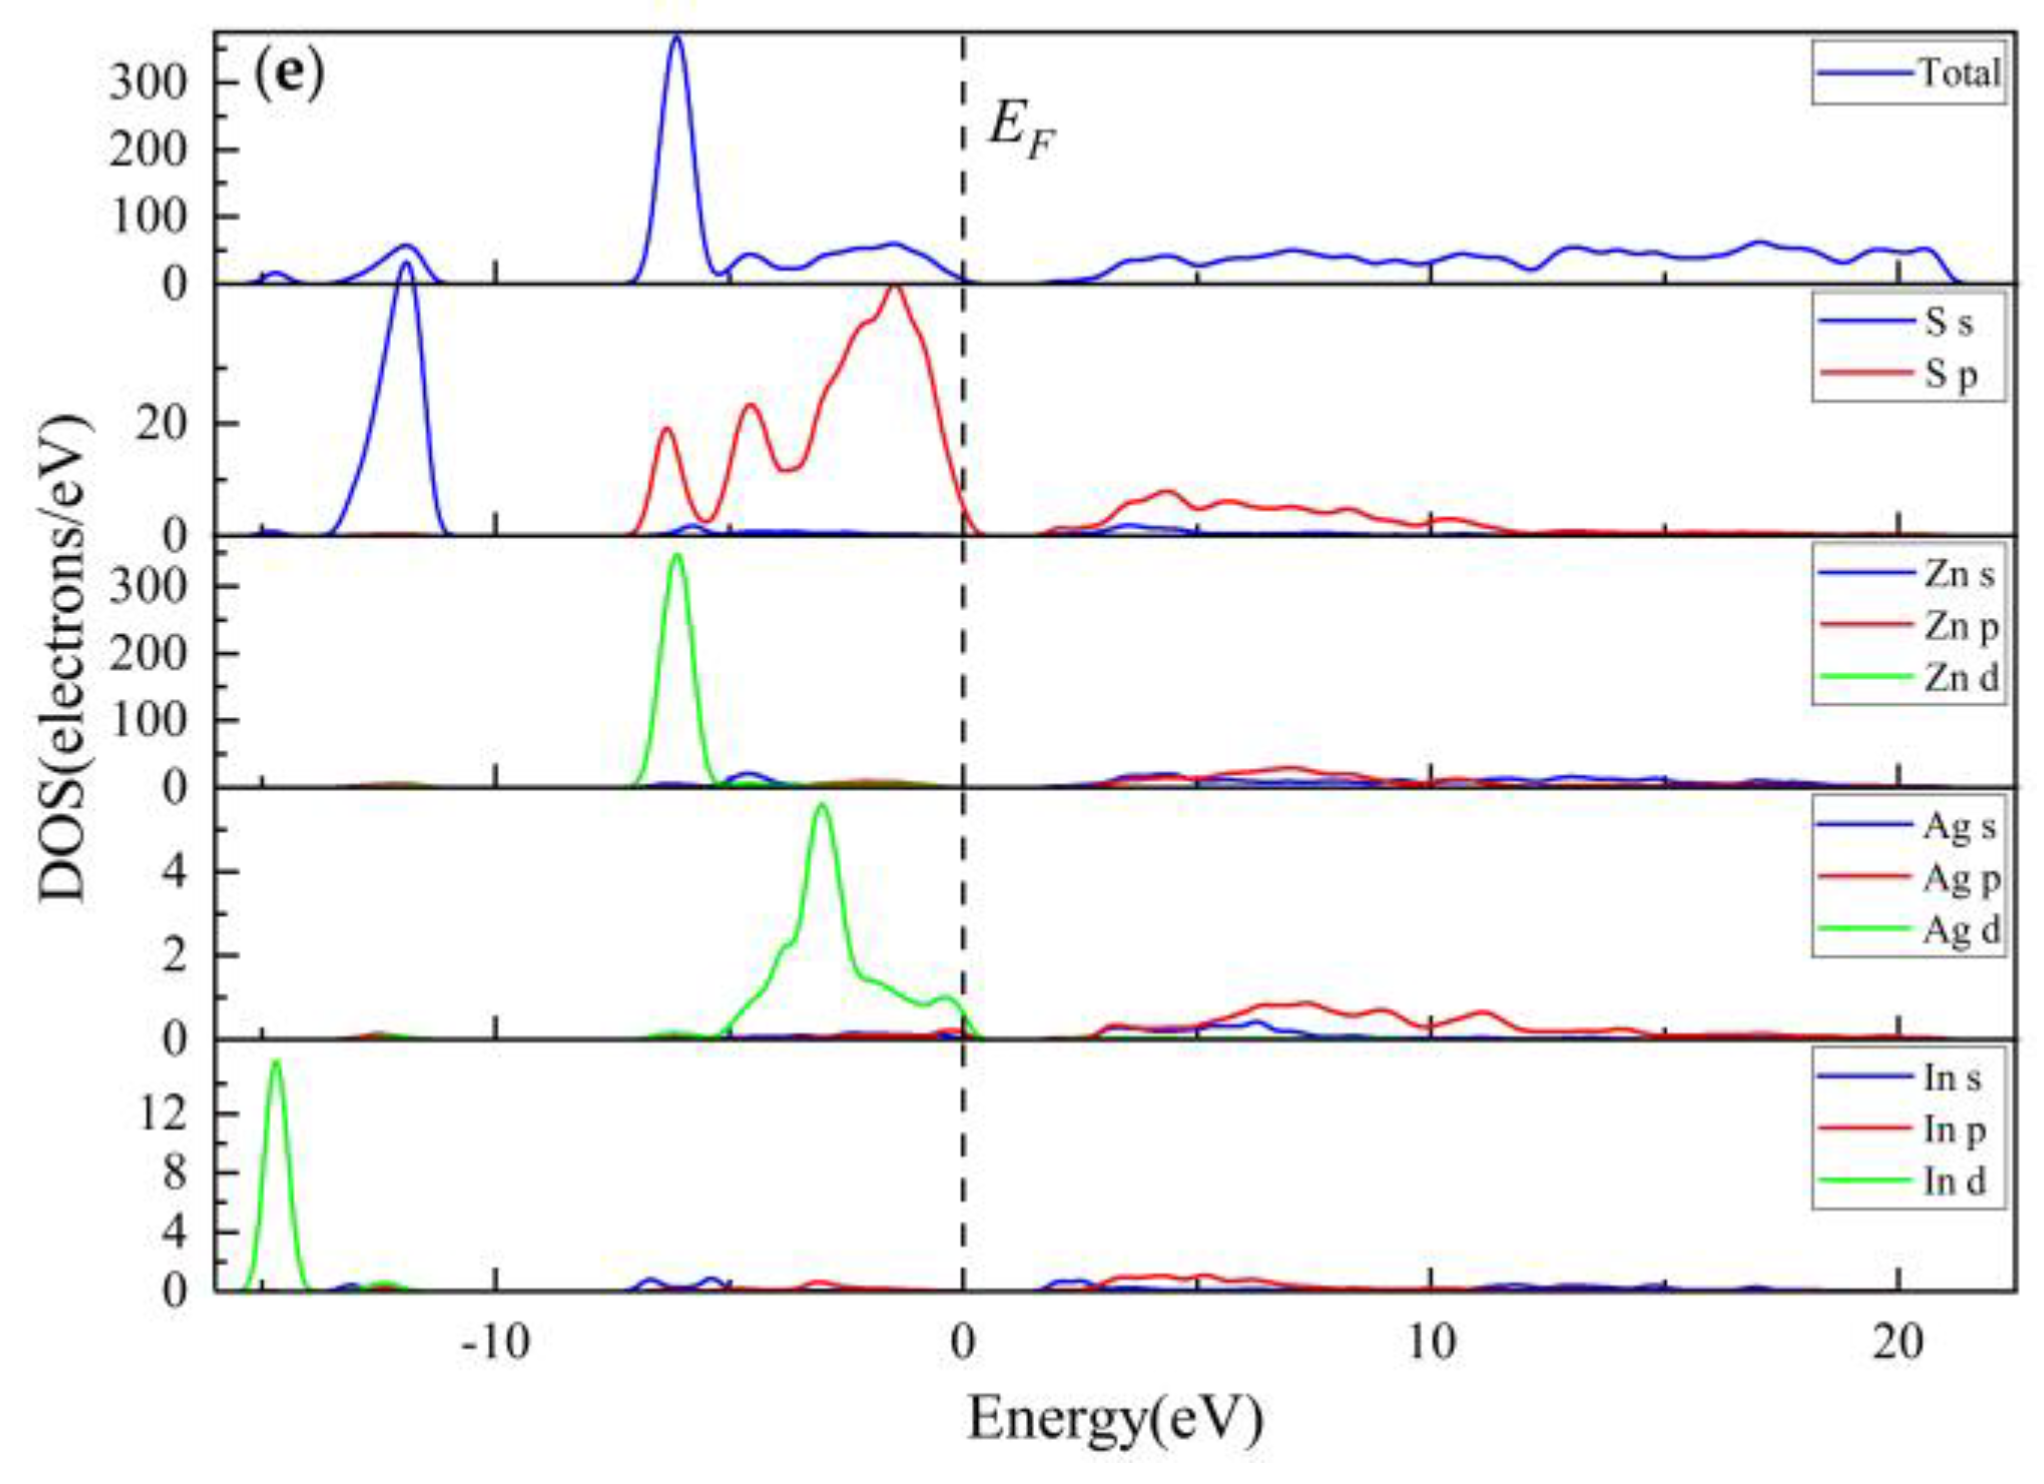
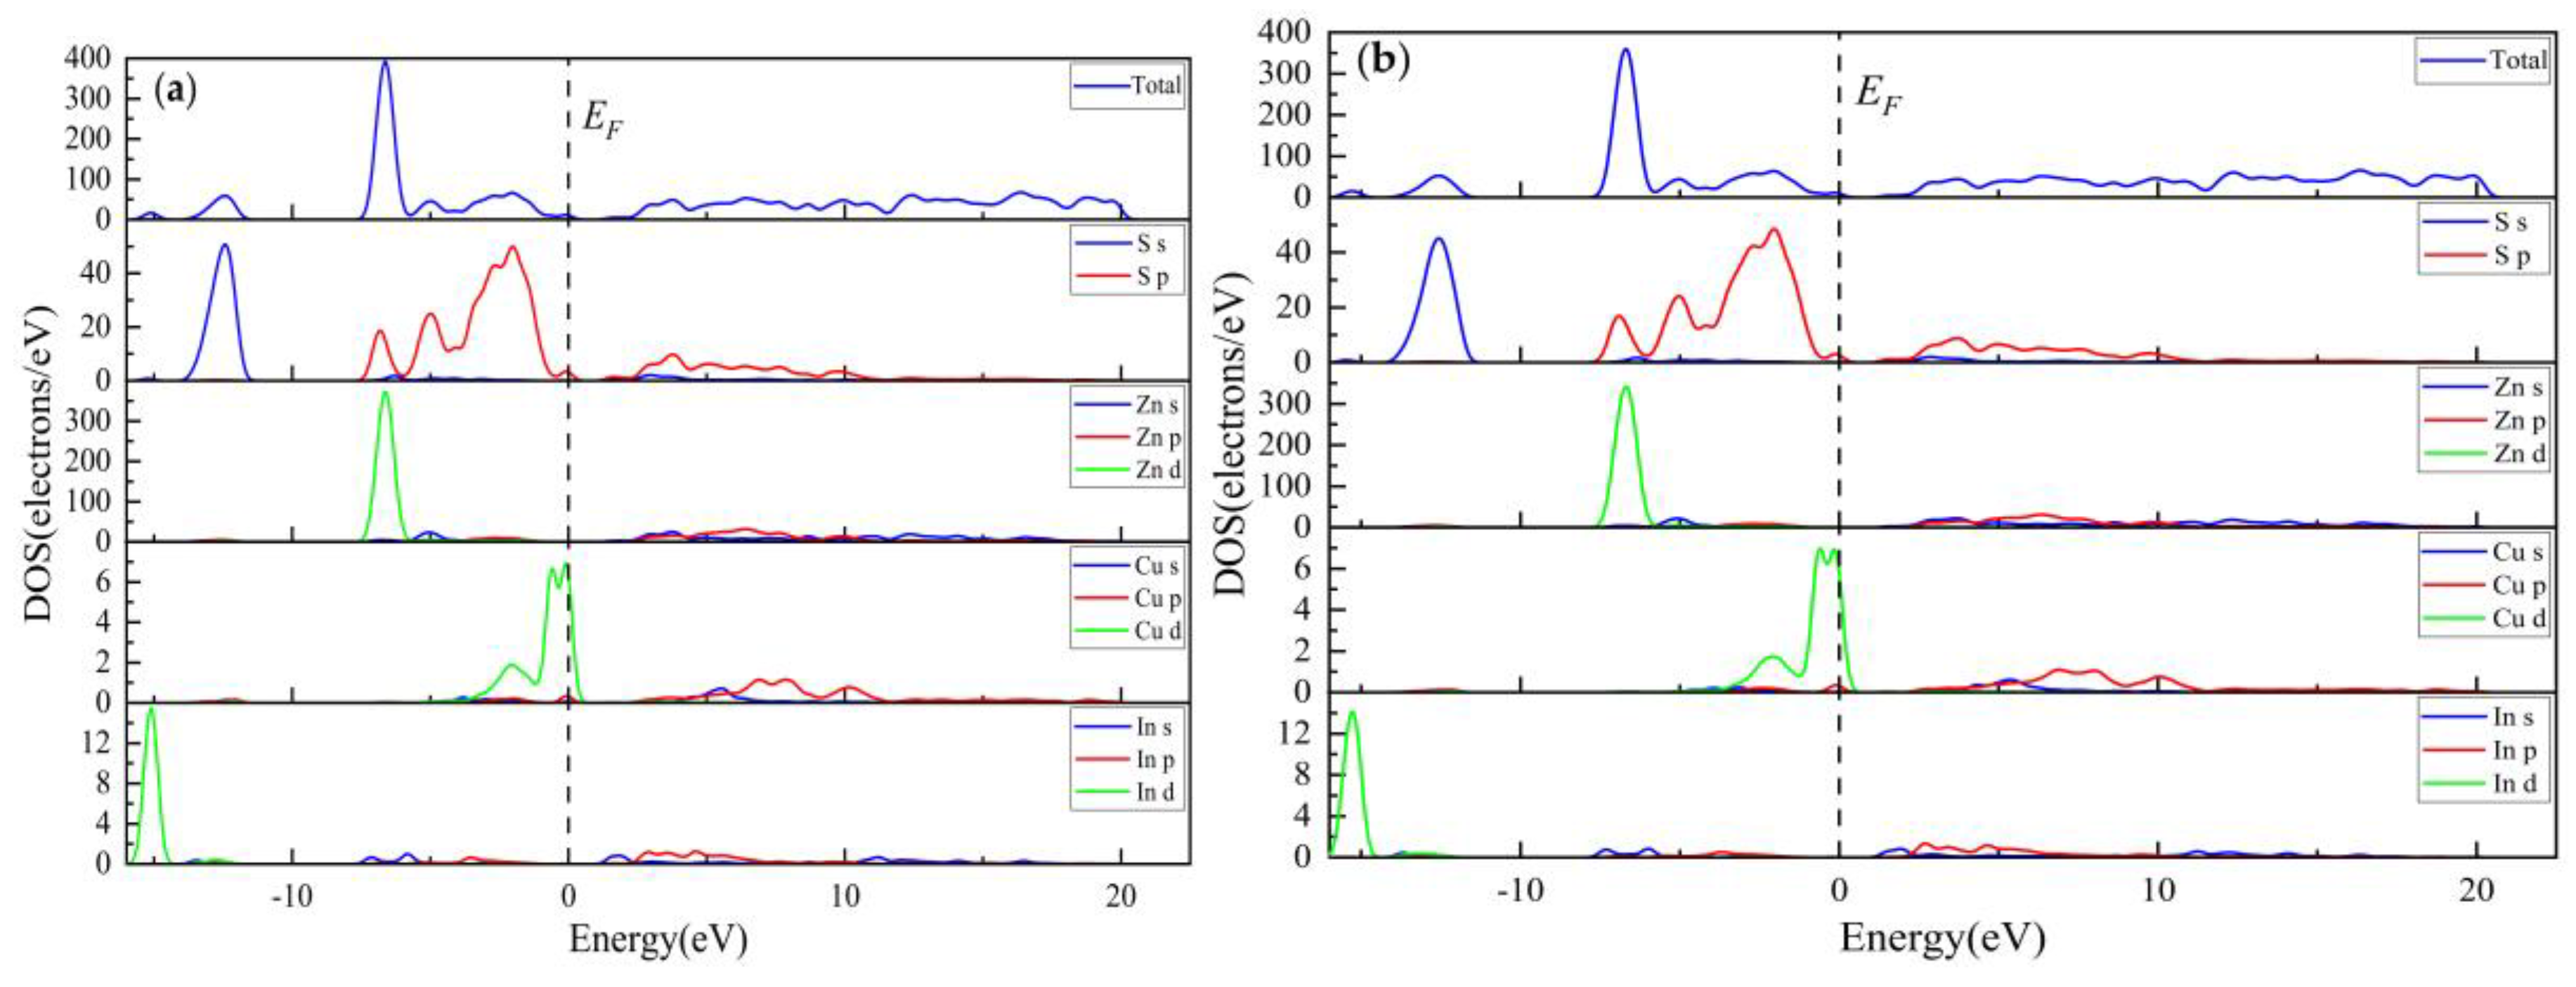
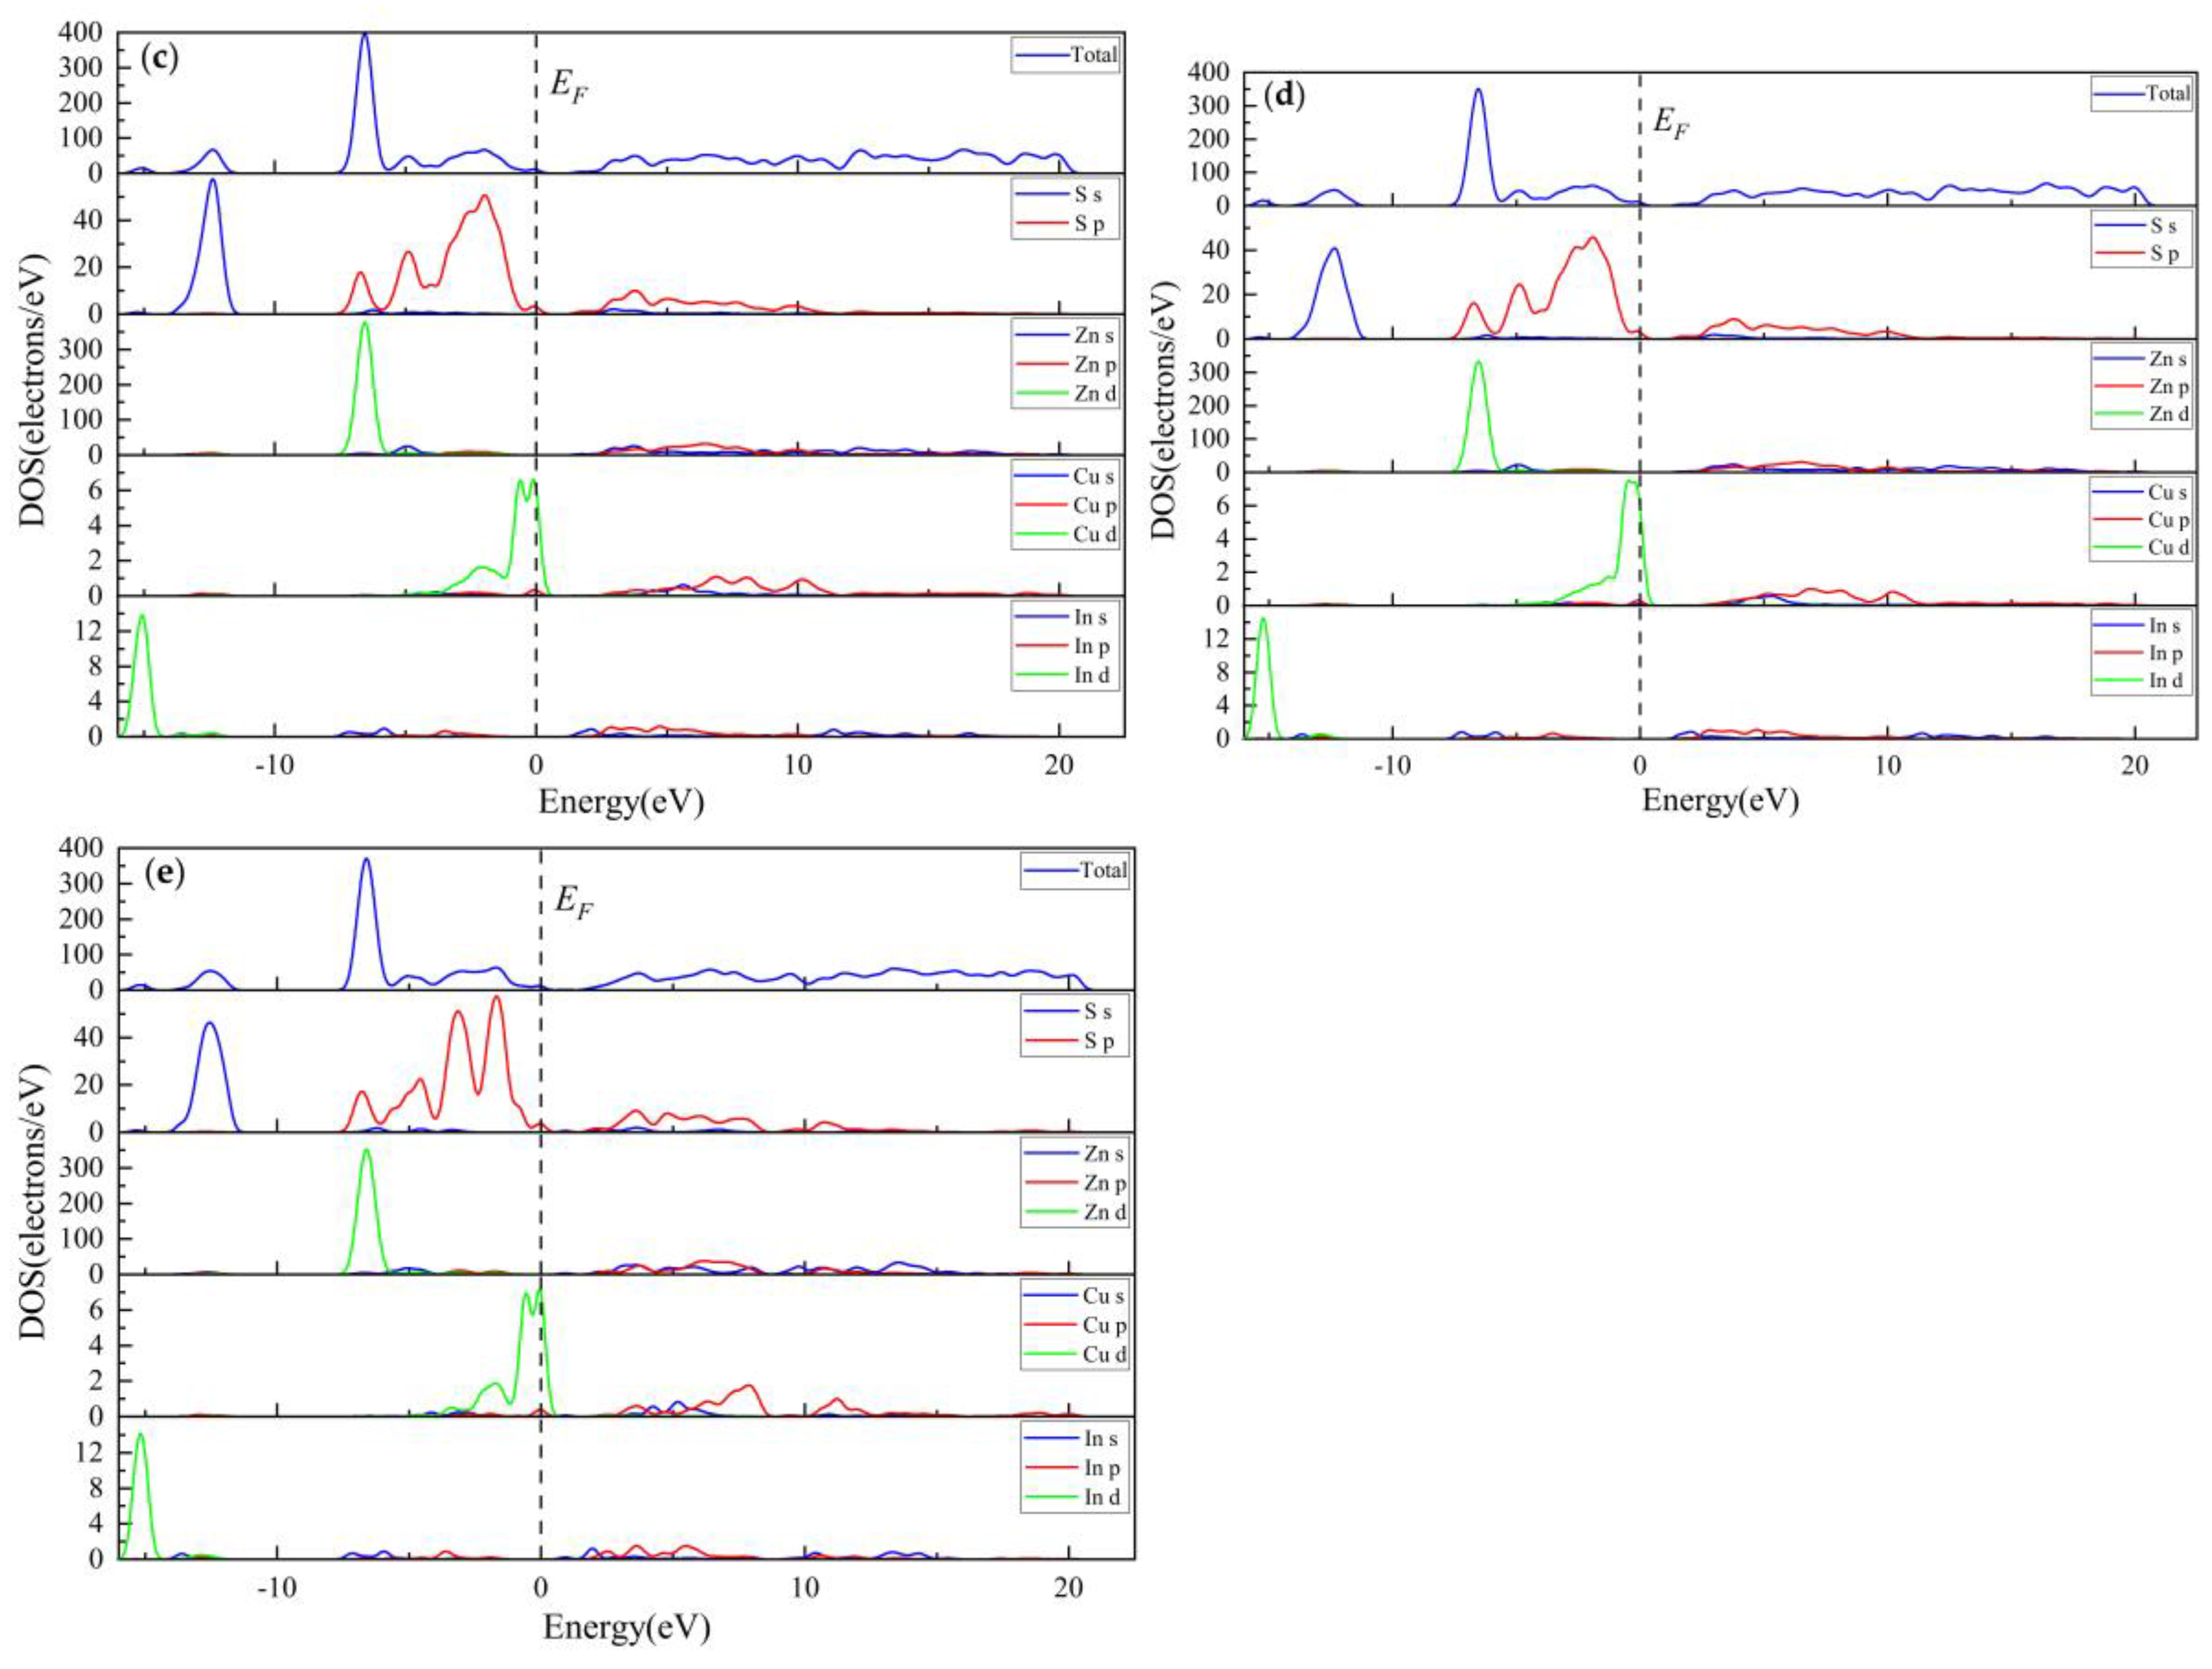
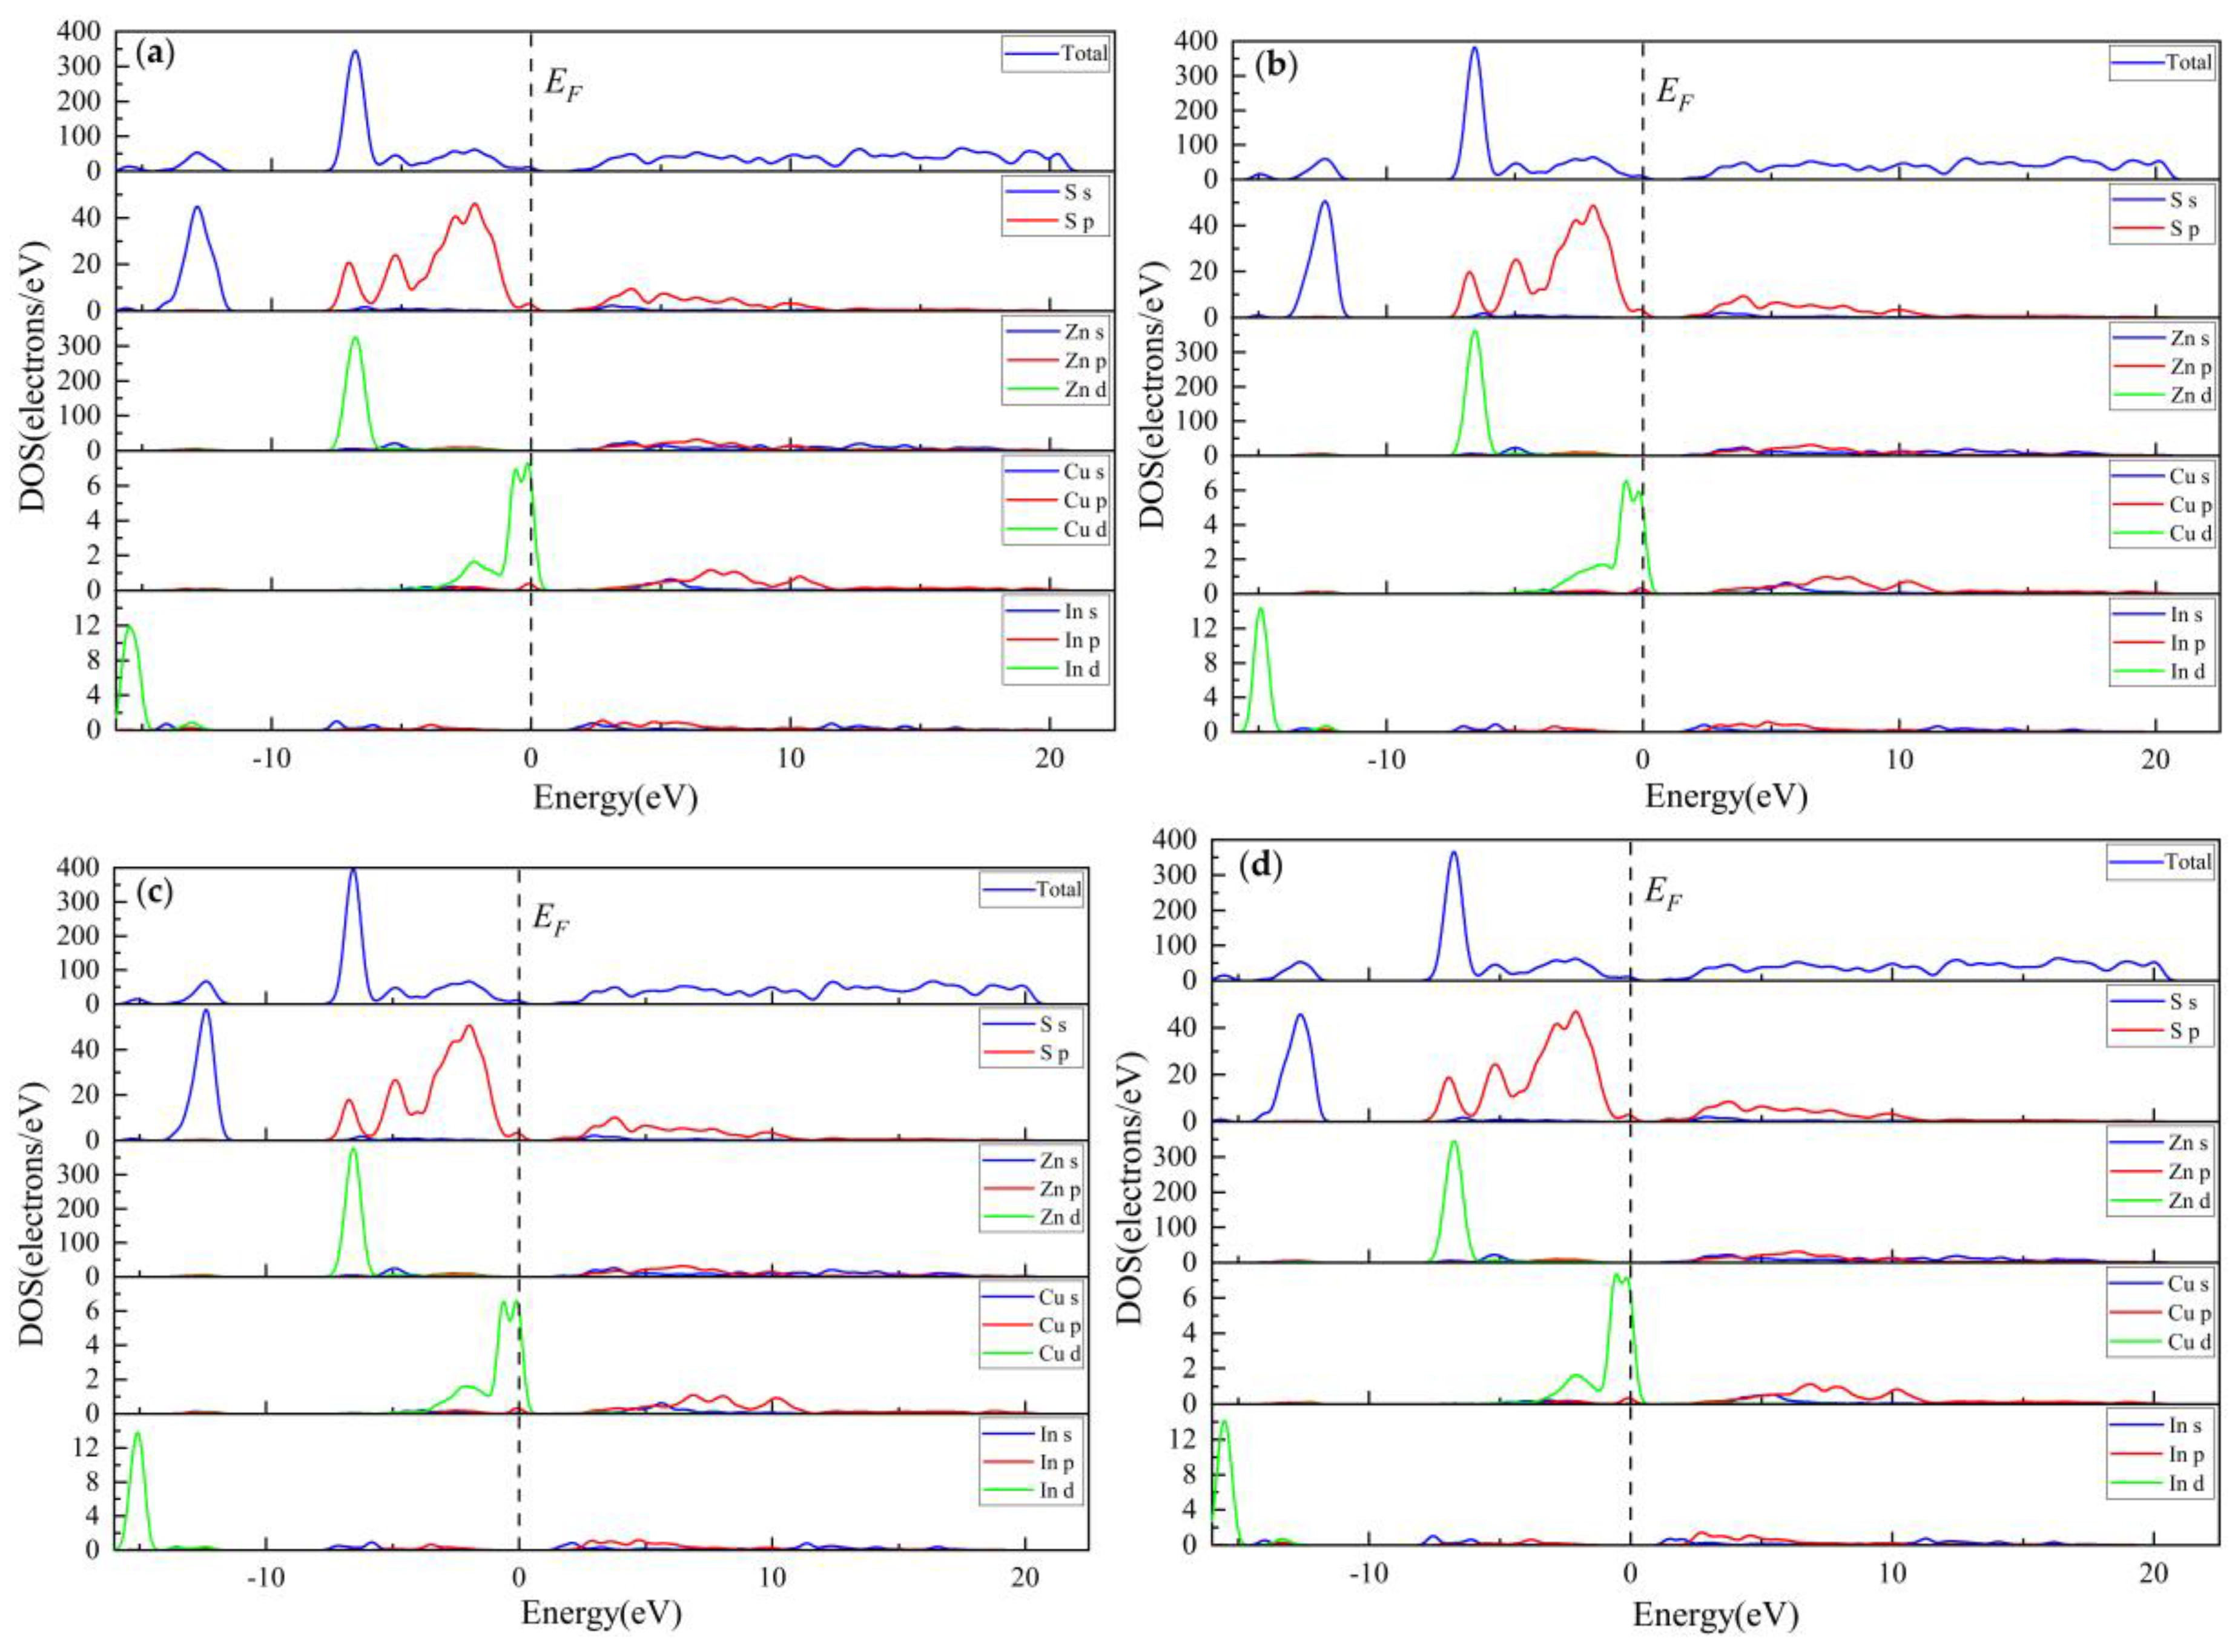
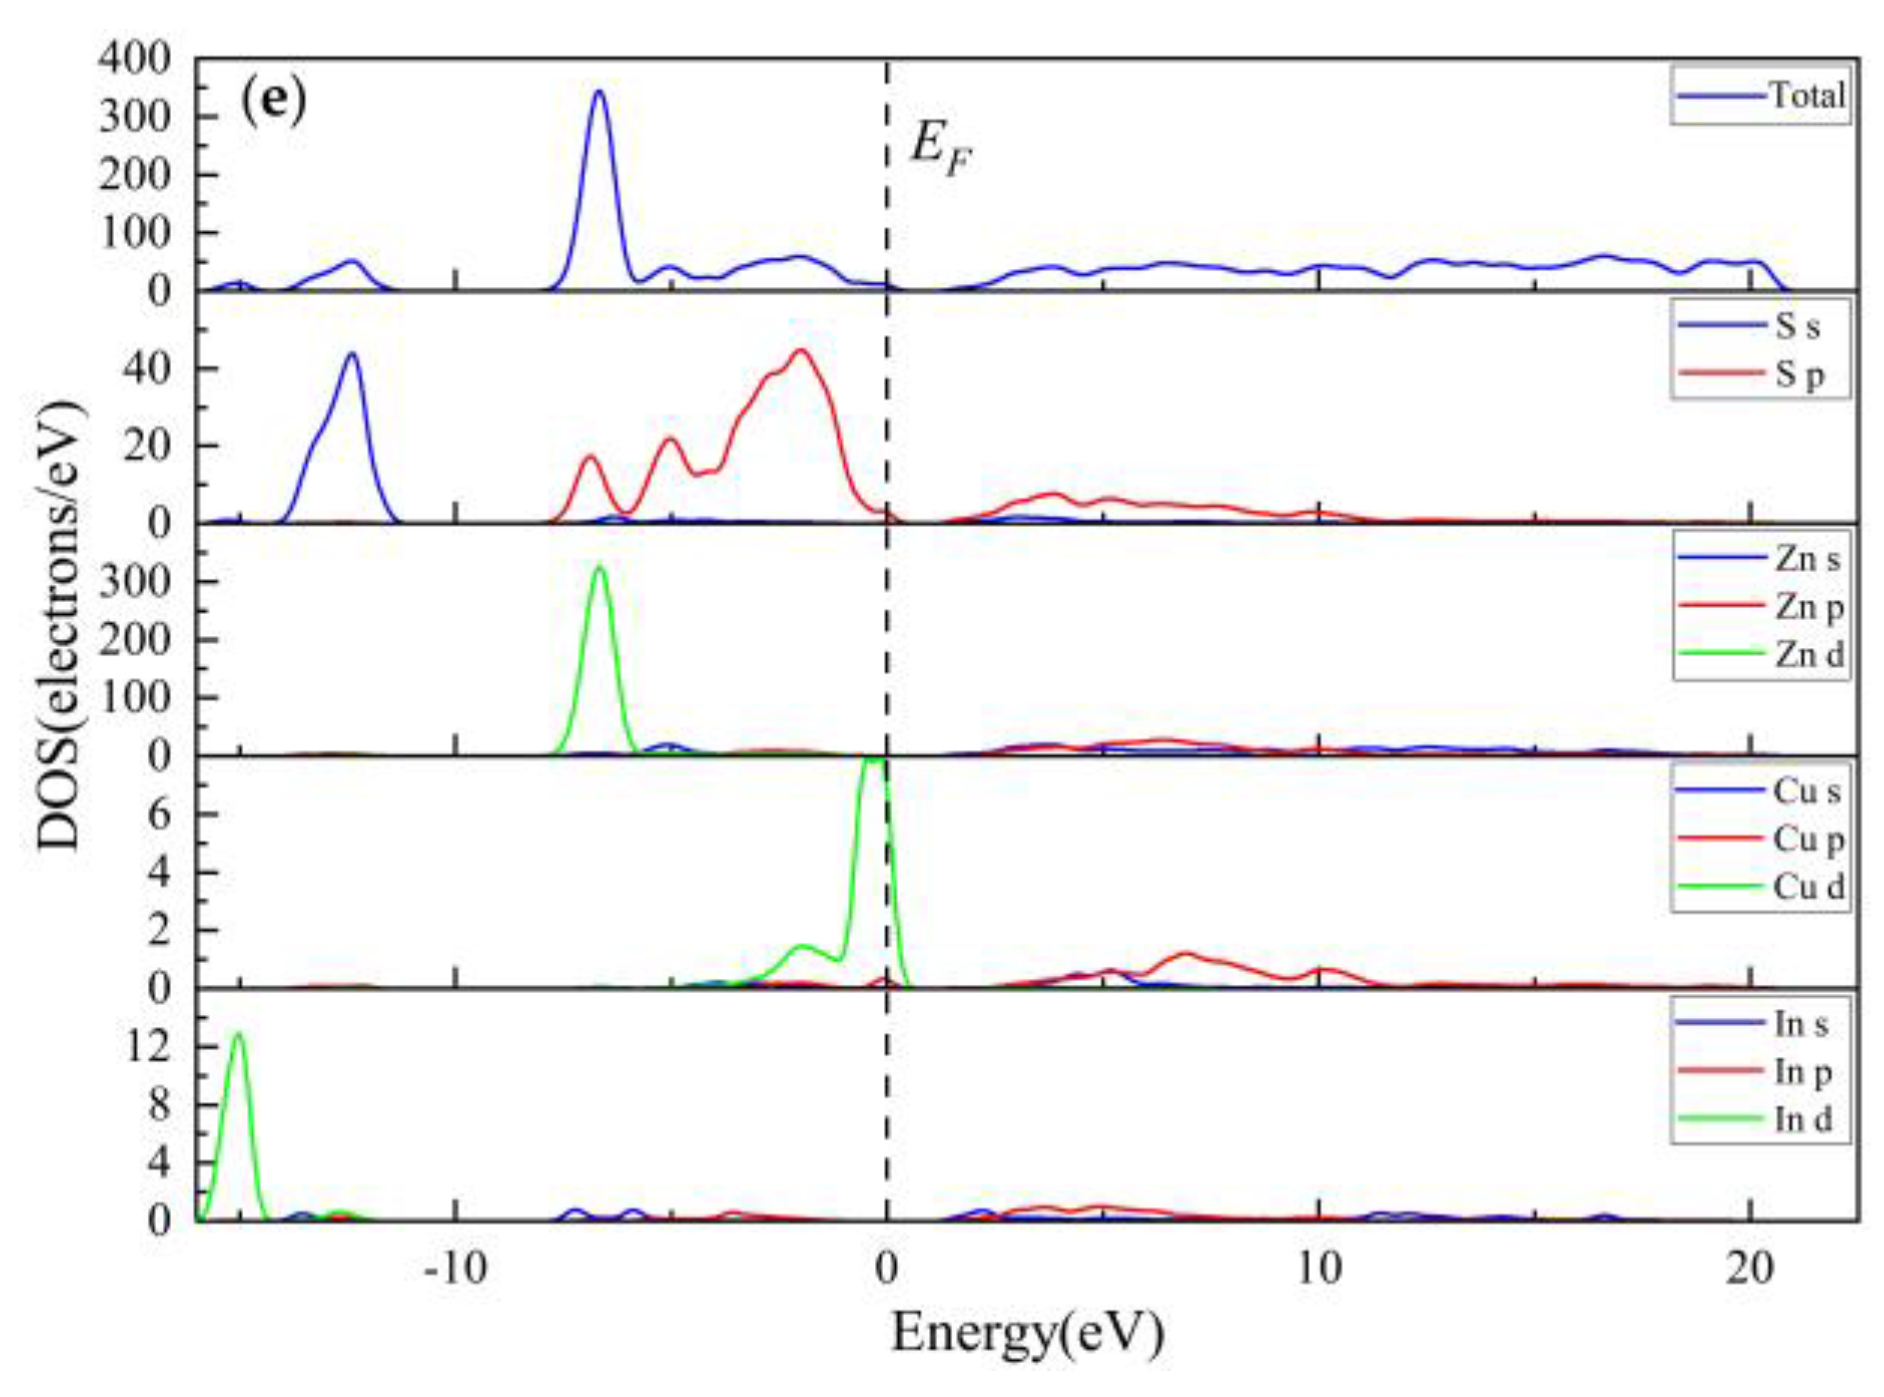
Figure 11 and Figure 12 show the total and partial DOS of Zn30InCuS32 in various temperature and pressure conditions. The electron density orbital of Zn30InCuS32 is mainly contributed by the d orbital, and the energy band at the left end of the Fermi level of the doped system Zn30InCuS32 is mainly composed of valence band, which is mainly composed of four parts from low to high, of which the valence band part located in -15 ~ -14eV is mainly contributed by the In atom d orbital; Located in the -13 ~ -12eV valence band, the part is mainly contributed by the S atom s orbital; Located in the -7 ~-5.5eV valence band, the part is mainly contributed by Zn atom d orbital and S atom p orbital; Located in the -5 ~ 0eV valence band, the part is mainly contributed by the 3p and Cu atom d orbitals of S atoms. The conduction band part is mainly contributed by the s and p orbitals of Zn atoms and the s and p orbitals of S atoms, as well as the s and p orbitals of In. The d orbitals of the In atom, the d orbital of the Zn atom and the p orbital of the S atom are mainly concentrated in the energy band with a lower energy level, which has high oxidation and is easy to obtain electrons. The density of the s orbitals of the In atom and the s and p orbitals of the Cu atom are flatter, the electron distribution is more dispersed, and the delocality is stronger.
When the temperature remains unchanged at 600K, at 40MPa(Figure 11e), the DOS of Cu atom fluctuates greatly near the Fermi surface, and there is no obvious law in the rest. While the pressure remains unchanged at 30MPa, at the temperature of 650K(Figure 12d), the d orbital of the In atom is shifted the most to the left as a whole, the energy is lower, and the peak value is higher, indicating that the In atom is relatively stable at 650K, that is, it is easier for In to enter sphalerite at this temperature.

3.3.4. Population Analysis

The bond population of the doped system at different temperature and pressure is shown in Table 8. It can be seen from the table that, on the whole, when the pressure is kept unchanged, the population of S-In bonds, S-Cu bonds and S-Zn bonds first decreases and then increases with the increase of temperature, and the bond length first becomes larger and then decreases with the increase of temperature; When the temperature is kept unchanged, the overall change of S-In bond, S-Cu bond and S-Zn bond population is relatively small, and the bond length first increases and then decreases with the increase of temperature. The average population of the S-In bond is 0.670, the bond length is about 2.375 Å, while the S-Zn bond population is 0.598, the key length is about 2.359 Å, the S-Cu bond population is 0.452, the bond length is about 2.364Å, and the S-In bond population is larger than that of the S-Zn bond, indicating that the S-In bond strength is greater than the S-Zn bond strength. The population of the S-In bond is larger than the overlapping arrangement of the S-Cu bond, and the bond length is shorter, indicating that although the In atom and the Cu atom are co-replaced into the sphalerite crystal system, the indium atom is relatively stable in the crystal.
When the temperature changes from 500K to 700K, the S-In bond population decreases from 0.680 to 0.665 (2.2%), while the S-Cu bond population decreases from 0.37 to 0.36 (2.3%), indicating that the strength of the S-In bond is similar to that of the S-Cu bond when the temperature changes. When the pressure changed from 20MPa to 40MPa, the S-In bond population increased from 0.665 to 0.673 (1.2%), while the S-Cu bond population increased from 0.443 to 0.463 (4.5%), indicating that the strength of the S-Cu bond was weaker than the strength of the S-In bond when the pressure changed. Temperature changes have a similar effect on both bonds, while pressure changes have a greater effect on S-In bonds.

4. Discussion

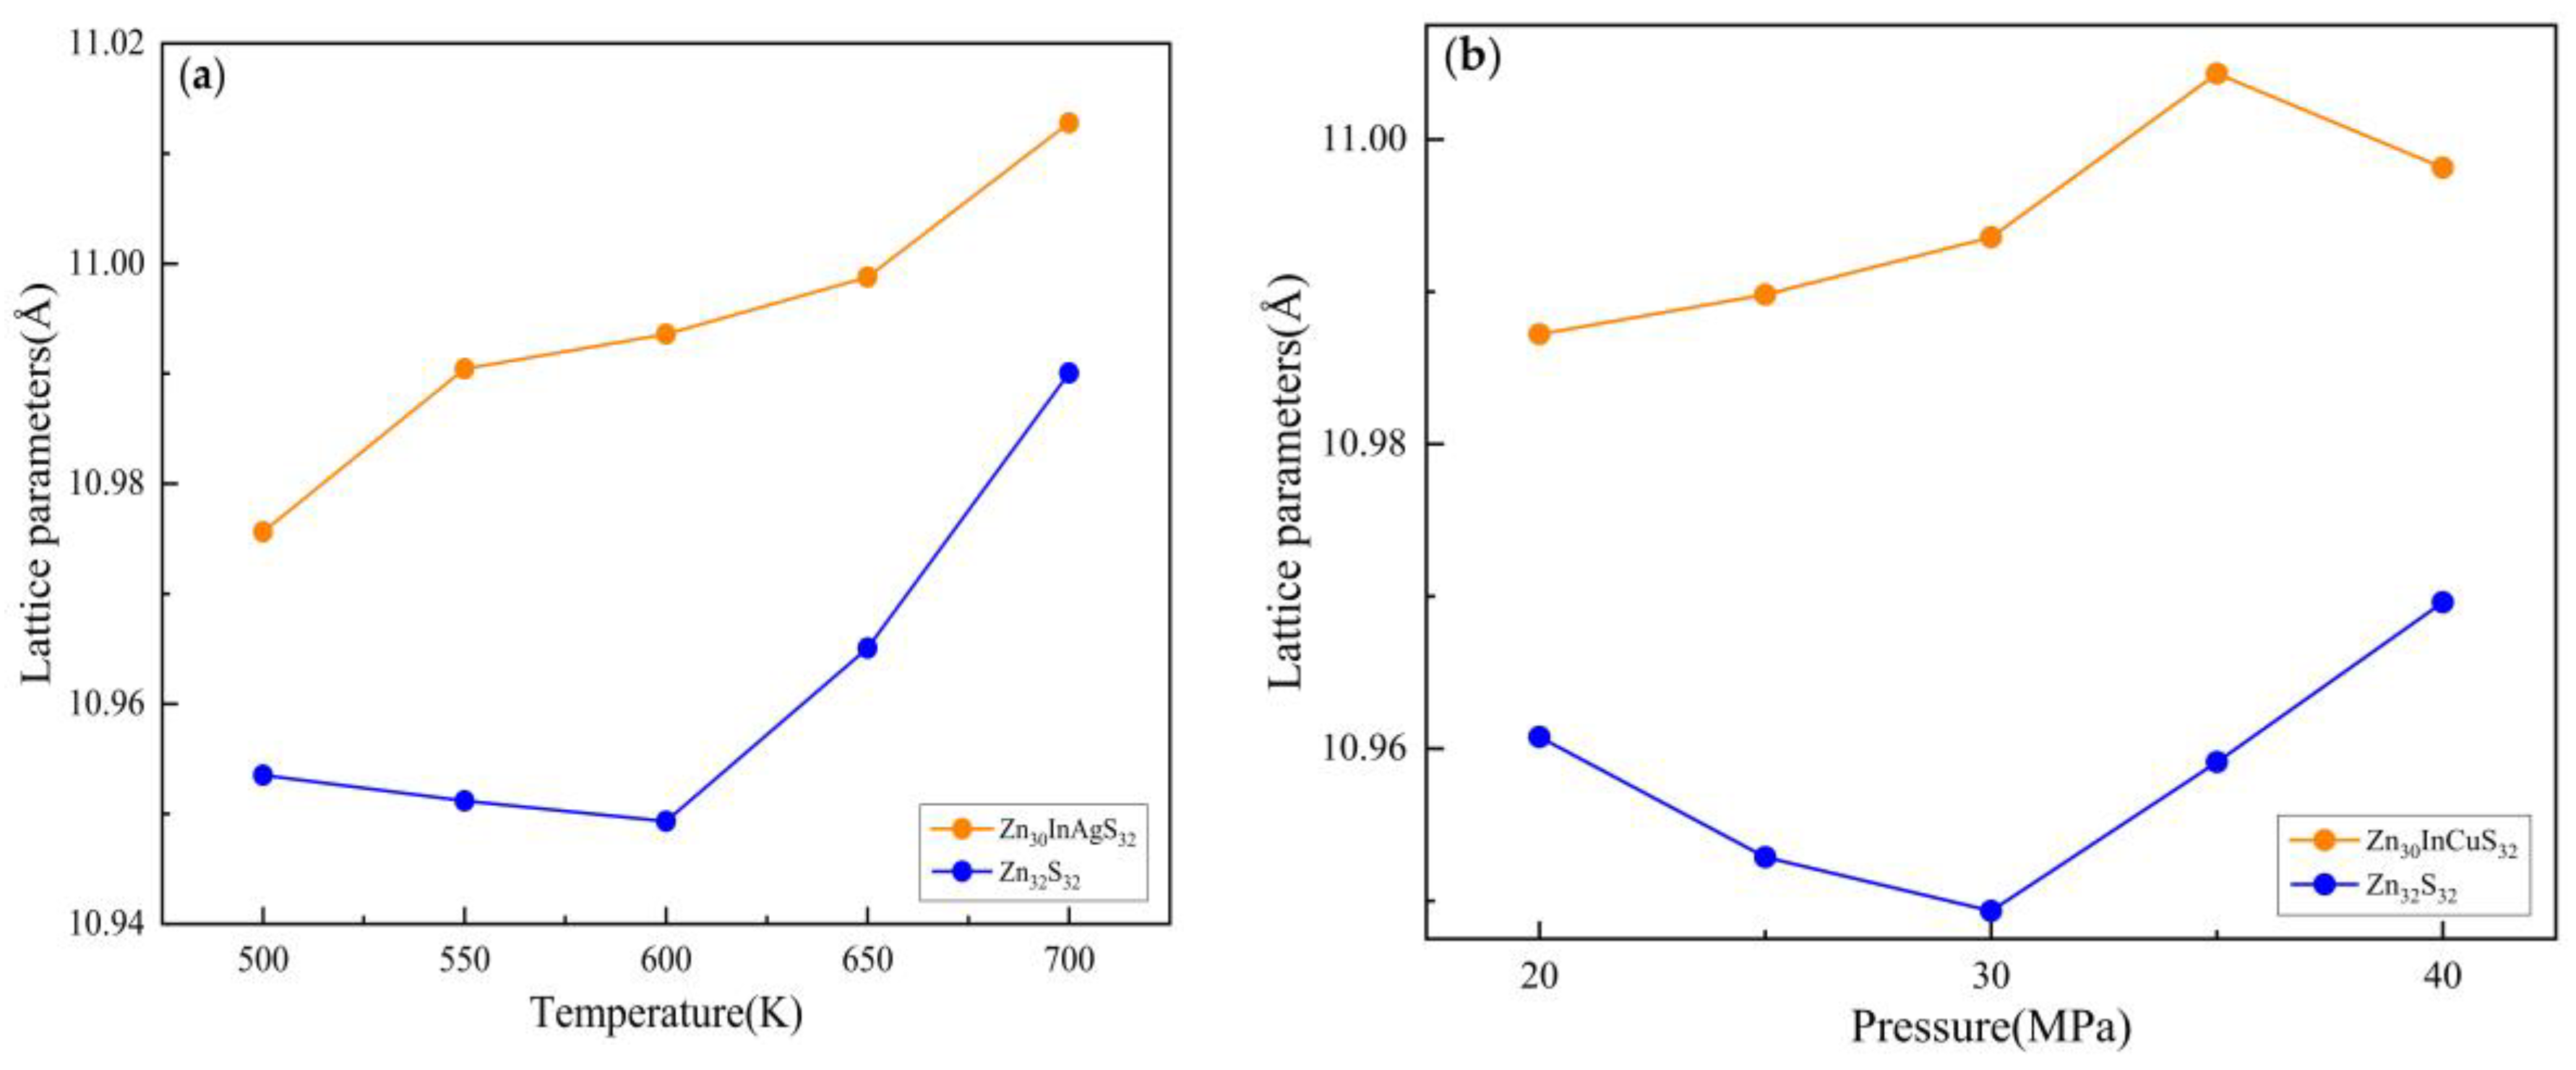
Figure 13 shows the lattice length of the two systems Zn30InAgS32 and Zn30InCuS32 at various temperatures and pressures. The unit cell length of the doped system increases with increasing temperature(Figure 13a), and does not change significantly with increasing pressure(Figure 13b). Under the same conditions, the lattice constants Zn30InAgS32 > Zn30InCuS32 > Zn32S32, probably because of the atomic radius: Ag>Cu>Zn.
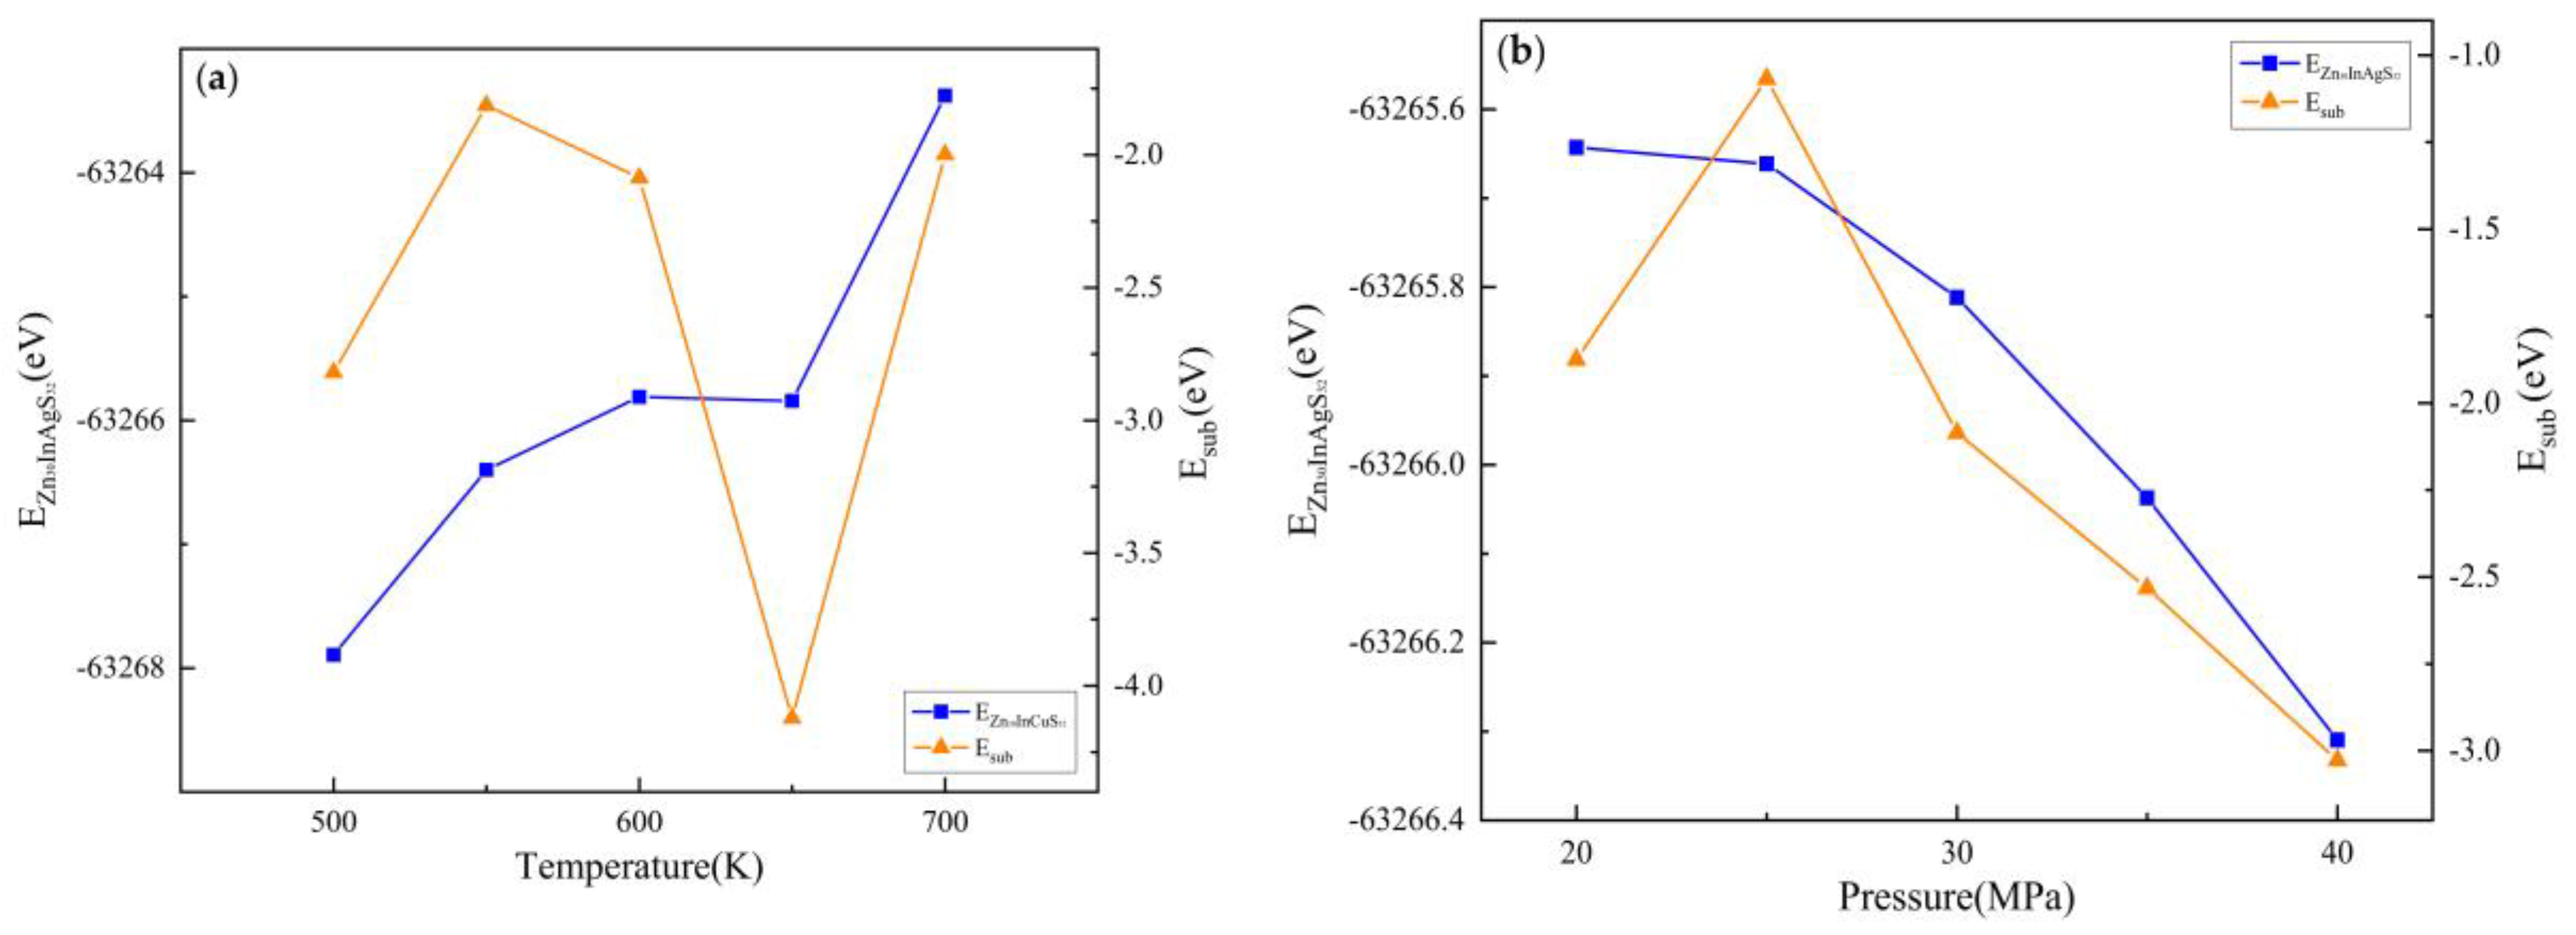
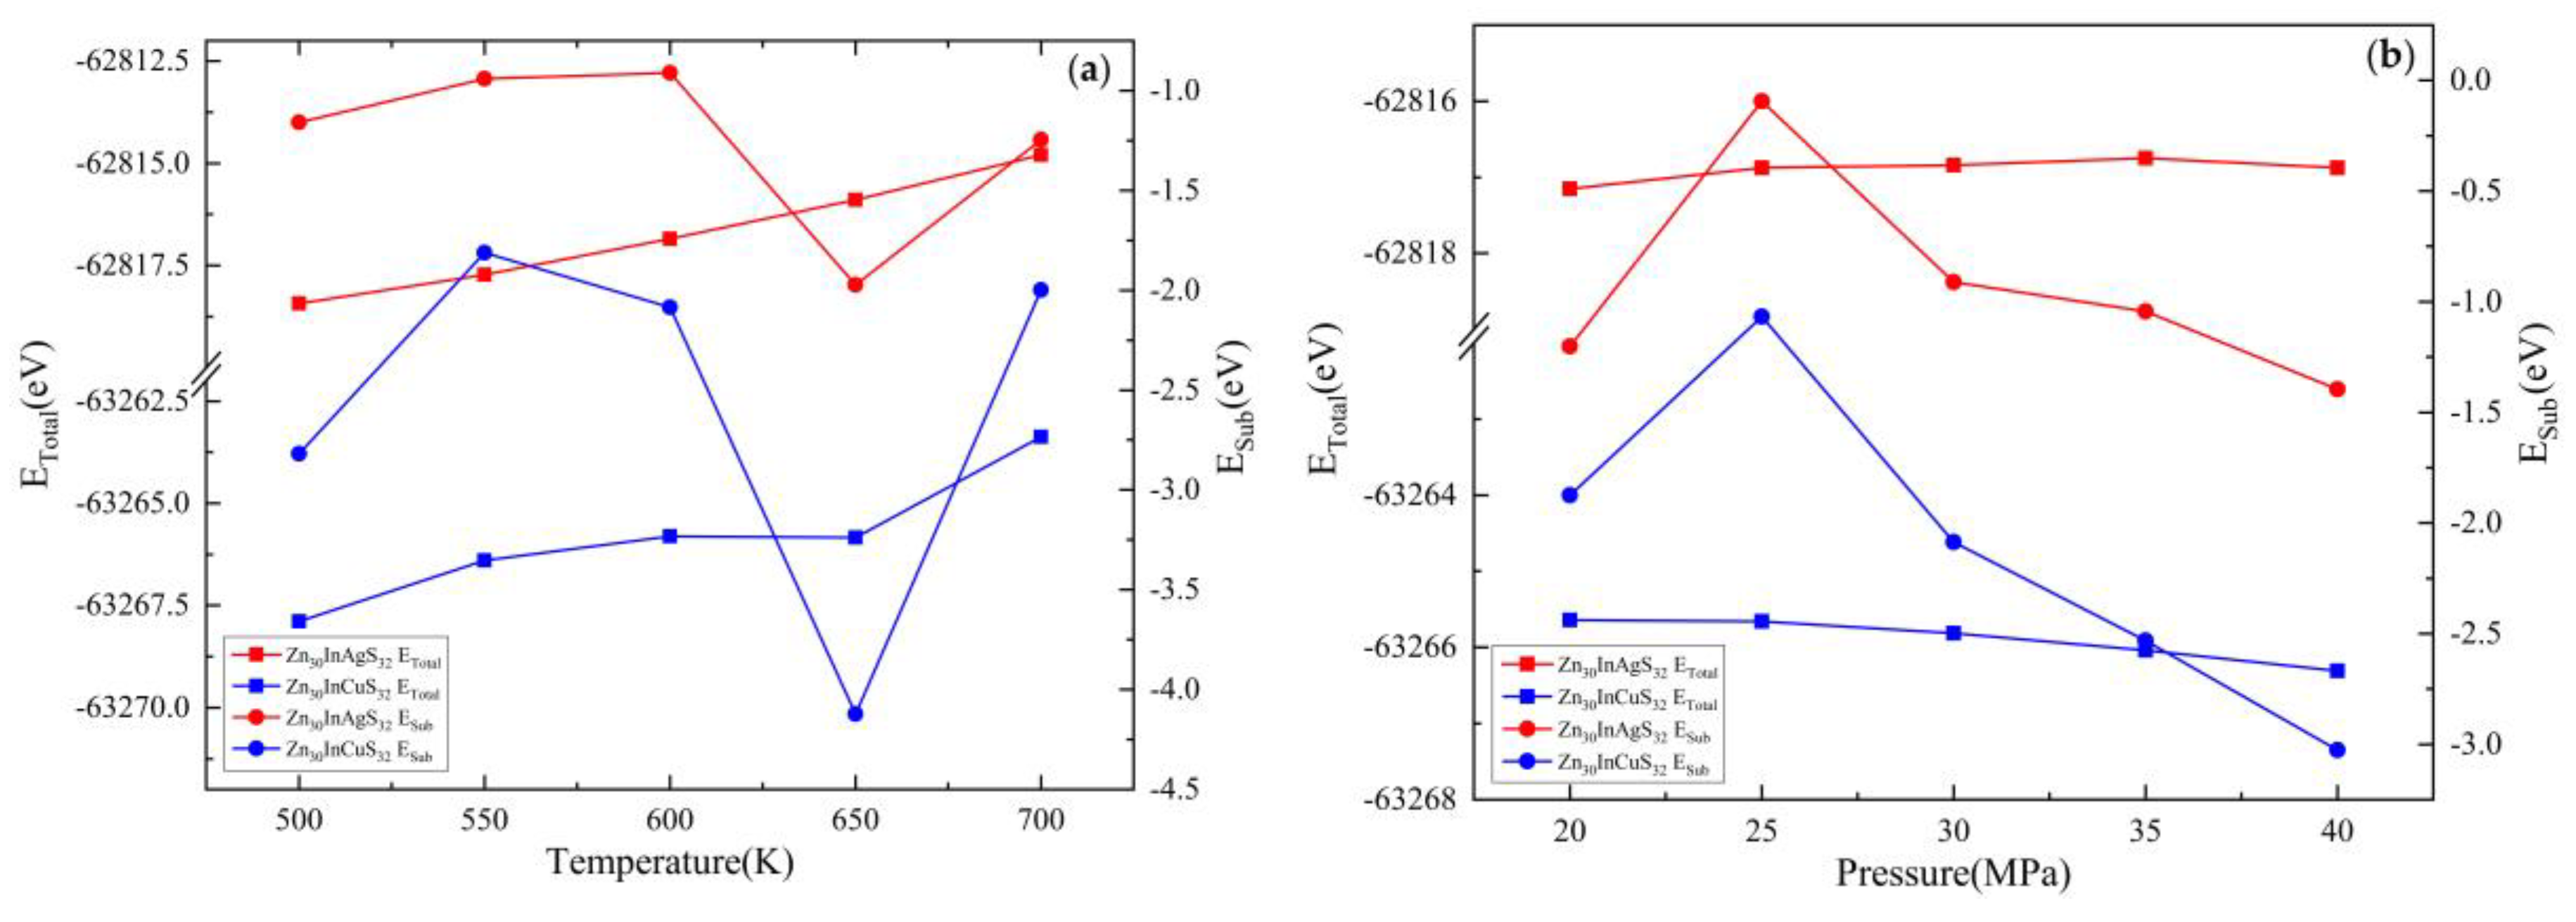
Figure 14 shows the replacement energy of the two systems Zn30InAgS32 and Zn30InCuS32 at various temperatures and pressures, it can be drawn that when the pressure remains unchanged at 30MPa(Figure 14a), the total energy is lower than Zn30InCuS32 under any temperature conditions, and the replacement energy generated by generating Zn30InCuS32 is less than the replacement energy generated by Zn30InAgS32 under the same conditions, indicating that Zn30InCuS32 is more stable under any temperature conditions, and In is more inclined to enter sphalerite in the form of C u + + I n 3 + 2 Z n 2 + . Looking at the two replacement mechanisms as a whole, it can be found that the two change trends are the same, with the increase of temperature, the replacement energy produced first increases and then decreases and then increases, reaching a minimum value at 650K, and then suddenly increases, indicating that when the pressure is 30MPa, the replacement energy generated by Zn30InAgS32 and Zn30InCuS32 under the temperature condition of 650K is the lowest, and the reaction is the easiest to carry out. When the temperature remains unchanged at 600K(Figure 14b), the replacement energy generated by the generation of Zn30InCuS32 is less than the replacement energy generated by the generation of Zn30InAgS32 under the same conditions, that is, the generation of Zn30InCuS32 releases more energy and the reaction is easier to carry out, indicating that when the temperature remains unchanged at 600K, In is more inclined to enter sphalerite with the replacement mechanism of C u + + I n 3 + 2 Z n 2 + , and on the whole, no matter which mechanism, with the increase of pressure, Both mechanisms produce substitution energy at a minimum of 40 MPa, when the reaction is easiest to proceed. In summary, when the pressure remains constant, for the two replacement mechanisms of In entering sphalerite, In is more inclined to enter sphalerite in the form of C u + + I n 3 + 2 Z n 2 + , both have the lowest value at 650K, the easier the reaction is to carry out. When the temperature remains constant, for the two substitution mechanisms of In entering sphalerite, In is more inclined to enter sphalerite in the form of C u + + I n 3 + 2 Z n 2 + at any pressure, and the two substitution mechanisms as a whole are smaller and smaller with the increase of pressure, and the easier the reaction is to carry out. This also corresponds to the reality that when In is enriched in sphalerite, a large amount of Cu is usually enriched
It can be seen from Figure 15 that when the pressure remains unchanged, the difference between the two systems S-Zn bond population is not large, and the S-Cu bond population is greater than that of S-Ag bond population, indicating that the S-Cu bond is more stable than the S-Ag bond, before 650K, the S-In key layout of Zn30InCuS32 is greater than that of Zn30InAgS32, and the S-In bond population of Zn30InAgS32 is larger after exceeding 650K(Figure 15a). When the temperature remains unchanged, the difference between the two systems S-Zn bond population is not large, the S-Cu bond population is greater than that of S-Ag bond population, and the S-In bond population fluctuates with the increase of pressure, but on the whole, Zn30InCuS32 is larger(Figure 15b).

5. Conclusions

By simulating the two most common substitution mechanisms of In entering sphalerite: A g + + I n 3 + 2 Z n 2 + and C u + + I n 3 + 2 Z n 2 + , the following conclusions are obtained by calculating the lattice parameter, electronic structure, settlement analysis and replacement energy of the first-principles calculation system based on density functionals:
(1) In the two substitution mechanisms, the replacement energy obtained by the co-substitution of Cu and In is lower, and the related bond population is higher, such as the S-Cu bond population is greater than that of S-Ag bond population, which to a certain extent can indicate that In may be more stable in the form of C u + + I n 3 + 2 Z n 2 + substitution into sphalerite.
(2) Under the same substitution mechanism, whether it is for A g + + I n 3 + 2 Z n 2 + and C u + + I n 3 + 2 Z n 2 + , when the pressure remains unchanged, the substitution energy is the lowest value at 650K; When the temperature remained unchanged, the replacement energy was the lowest value at 40MPa, indicating that the environment of 650K and 40MPa was conducive to the enrichment and stability of In sphalerite. This can also be used to aid verification from the results of state density.

Acknowledgements

This research was financially supported by the Ministry of Science and Technology of China (No. 2021YFC2900300), National Natural Science Foundation of China (No. 41872245, U1911202), and Guangdong Basic and Applied Basic Research Foundation (No. 2020A1515010666).

References

  1. Xu, J.; Li, X. Spatial and temporal distributions, metallogenic backgrounds and processes of indium deposits. Acta Petrol. Sin. 2018, 34, 3611–3626. [Google Scholar] [CrossRef]
  2. Zai, M.; Wu, F.; Hu, R.; Jiang, S.; Li, W.; Wang, R.; Wang, D.; Qi, T.; Qin, K.; Wen, H. Critical metal mineral resources: current research status and scientific issues. Bull. Natl. Nat. Sci. Foun. China 2019, 33, 106–111. [Google Scholar]
  3. Jiang, S.; Wen, H.; Xu, C.; Wang, Y.; Su, H.; Sun, W. Earth sphere cycling and enrichment chanimof critical metals: major scientific issues for future research. Bull. Natl. Nat. Sci. Foun. China 2019, 33, 112–118. [Google Scholar]
  4. Li, X.; Zhu, Y.; Xu, J. Indium as a critical mineral: A research progress report. CHINESE SCIENCE BULLETIN-CHINESE 2020, 65. [Google Scholar] [CrossRef]
  5. Mao, J.; Yang, Z.; Xie, G.; Yuan, S.; Zhou, Z. Critical minerals: International trends and thinking. Miner. Deposits 2019, 38, 689–698. [Google Scholar]
  6. Wang, D. Study on critical mineral resources: significance of research, determination of types, attributes of resources, progress of prospecting, problems of utilization, and direction of exploitation. Acta Geol. Sin. 2019, 93, 1189–1209. [Google Scholar]
  7. Werner, T. T.; Mudd, G. M.; Jowitt, S. M. The world's by-product and critical metal resources part III: A global assessment of indium. Ore Geol. Rev. 2017, 86, 939–956. [Google Scholar] [CrossRef]
  8. Yoshimura, A.; Daigo, I.; Matsuno, Y. Global Substance Flow Analysis of Indium. Mater. Trans. 2013, 54, 102–109. [Google Scholar] [CrossRef]
  9. Zhang, X. Analysis of the development and the reserve of indium resources in China. China Min. Mag. 2018, 27, 7–10. [Google Scholar] [CrossRef]
  10. Rudnick, R. L.; Gao, S. Composition of the continental crust. In: Turekian, H.D., Holland, K.K. (Eds.), Treatise on Geochemistry. second ed. Elsevier, Oxford, pp. 1–51. 2014.
  11. European, C. Report on Critical Raw Materials for the EU: Report of the Ad hoc Working Group on defining critical raw materials.; 2014.
  12. Jowitt, S. M. Mineral Economics and Critical Metals: introduction to a multi-part thematic issue. Appl. Earth Sci. 2015, 124, 205–206. [Google Scholar] [CrossRef]
  13. Skirrow, R. G.; Huston, D. L.; Mernagh, T. P.; Thorne, J. P.; Duffer, H.; Senior Anthony, B. , Critical commodities for a high-tech world: Australia's potential to supply global demand. In Canberra: Geoscience Australia.: 2013.
  14. Zepf, V.; Simmons, J.; Augsburg, U. , Materials critical to the energy industry: an introduction. In BP plc: 2014.
  15. Zhang, Q.; Liu, Z.; Zhan, X.; Shao, S. Trace element geochemistry of Meng's Entaolegai Ag-Pb-Zn-In deposit, inner mongolia, China. Acta Minerl. Sin. 2004, 39–47. [Google Scholar]
  16. Tu, G.; Gao, Z.; Hu, R.; Zhang, Q.; Li, C.; Zhao, Z.; Zhang, B. Dispersed element geochemistry and mineralization mechanisms. Beijing: Geological Publishing House: 2004; p 430.
  17. Ishihara, S.; Murakami, H.; Marquez-Zavalia, M. F. Inferred Indium Resources of the Bolivian Tin-Polymetallic Deposits. Resour. Geol. 2011, 61, 174–191. [Google Scholar] [CrossRef]
  18. Li, X.; Yang, F.; Chen, Z.; Bu, G.; Wang, Y. A tentative discussion on geochemistry and genesis of indium in Dachang tin ore district‚, Guangxi. Miner. Deposits 2010, 29, 903–914. [Google Scholar]
  19. McIntyre, N. S.; Cabri, L. J.; Chauvin, W. J.; Laflamme, J. H. G. Secondary ion mass spectrometric study of dissolved silver and indium in sulfide minerals. Scan. Elec. Micros. 1984, 1984, 1139–1146. [Google Scholar]
  20. Cook, N. J.; Ciobanu, C. L.; Pring, A.; Skinner, W.; Shimizu, M.; Danyushevsky, L.; Saini-Eidukat, B.; Melcher, F. Trace and minor elements in sphalerite: A LA-ICPMS study. Geochim. Cosmochim. Ac. 2009, 73, 4761–4791. [Google Scholar] [CrossRef]
  21. Chen, C.; Zhao, T. Metallogenesis of indium in magmatic hydrothermal system. Miner. Deposits 2021, 40, 206–220. [Google Scholar]
  22. Liu, Y.; Hou, Z.; Yue, L.; Ma, D.; Ma, W.; Tang, B. Critical metals in sediment-hosted Pb-Zn deposits in China. Chin. Sci. Bull. 2021, 67, 406–424. [Google Scholar] [CrossRef]
  23. Dill, H. G.; Garrido, M. M.; Melcher, F.; Gomez, M. C.; Weber, B.; Luna, L. I.; Bahr, A. Sulfidic and non-sulfidic indium mineralization of the epithermal Au–Cu–Zn–Pb–Ag deposit San Roque (Provincia Rio Negro, SE Argentina) — with special reference to the "indium window" in zinc sulfide. Ore Geol. Rev. 2013, 51, 103–128. [Google Scholar] [CrossRef]
  24. Tao, Y.; Hu, R.; Tang, Y.; Ye, L.; Qi, H.; Fan, H. Types of dispersed elements bearing ore-deposits and their enrichment regularity in Southwest China. Acta Geol. Sin. 2019, 93, 1210–1230. [Google Scholar]
  25. Li, X.; Xu, J.; Zhu, Y.; Lǚ, Y. Critical minerals of indium: Major ore types and scientific issues. Acta Petrol. Sin. 2019, 35, 3292–3302. [Google Scholar] [CrossRef]
  26. Xu, J.; Cook, N. J.; Ciobanu, C. L.; Li, X.; Kontonikas-Charos, A.; Gilbert, S.; Lv, Y. Indium distribution in sphalerite from sulfide–oxide–silicate skarn assemblages: a case study of the Dulong Zn–Sn–In deposit, Southwest China. Miner. Deposita 2021, 56, 307–324. [Google Scholar] [CrossRef]
  27. Li, Y.; Tao, Y.; Zhu, F.; Liao, M.; Xiong, F.; Deng, X. Distribution and existing state of indium in the Gejiu Tin polymetallic deposit, Yunnan Province, SW China. Chin. J. Geochem. 2015, 34, 469–483. [Google Scholar] [CrossRef]
  28. Liu, J. P.; Rong, Y. N.; Zhang, S. G.; Liu, Z. F.; Chen, W. K. Indium Mineralization in the Xianghualing Sn-Polymetallic Orefield in Southern Hunan, SouthernChina. Minerals 2017, 7. [Google Scholar] [CrossRef]
  29. Ishihara, S.; Murakami, H.; Li, X. Indium concentration in zinc ores in plutonic and volcanic environments: examples at the Dulong and Dachang mines, South China. BULLETIN OF THE GEOLOGICAL SURVEY OF JAPAN 2011, 62. [Google Scholar] [CrossRef]
  30. Murakami, H.; Ishihara, S. Trace elements of Indium-bearing sphalerite from tin-polymetallic deposits in Bolivia, China and Japan: A femto-second LA-ICPMS study. Ore Geol. Rev. 2013, 53, 223–243. [Google Scholar] [CrossRef]
  31. Moura, M. A.; Botelho, N. F.; de Mendonca, F. C. The Indum-rich sulfides and rare arsenates of the Sn-In-mineralized mangabeira A-Type granite, central Brazil. Canad. Mineral. 2007, 45, 485–496. [Google Scholar] [CrossRef]
  32. Schampera, U. S.; Herzig, P. M. Indium: Geology, Mineralogy, and Economics-A Review. 2002; p 164-169.
  33. Ye, L.; Cook, N. J.; Ciobanu, C. L.; Yuping, L.; Qian, Z.; Tiegeng, L.; Wei, G.; Yulong, Y.; Danyushevskiy, L. Trace and minor elements in sphalerite from base metal deposits in South China: A LA-ICPMS study. Ore Geol. Rev. 2011, 39, 188–217. [Google Scholar] [CrossRef]
  34. Johan, Z. Indium and germanium in the structure of sphalerite: an example of coupled substitution with Copper. Mineralogy and Petrology 1988, 39, 211–229. [Google Scholar] [CrossRef]
  35. Cook, N. J.; Ciobanu, C. L.; Brugger, J.; Etschmann, B.; Howard, D. L.; de Jonge, M. D.; Ryan, C.; Paterson, D. Determination of the oxidation state of Cu in substituted Cu-In-Fe-bearing sphalerite via -XANES spectroscopy. Am. Mineral. 2012, 97, 476–479. [Google Scholar] [CrossRef]
  36. Filimonova, O. N.; Trigub, A. L.; Tonkacheev, D. E.; Nickolsky, M. S.; Kvashnina, K. O.; Chareev, D. A.; Chaplygin, I. V.; Kovalchuk, E. V.; Lafuerza, S.; Tagirov, B. R. Substitution mechanisms in In-, Au-, and Cu-bearing sphalerites studied by X-ray absorption spectroscopy of synthetic compounds and natural minerals. Mineral. Mag. 2019, 83, 435–451. [Google Scholar] [CrossRef]
  37. Zhou, Z.; Wen, H. A magmatic-hydrothermal indium-bearing polymetallic vein mineralization belt in the western Jiangnan Orogen: Evidence from zinc and cadmium isotopes of sphalerite. Ore Geol. Rev. 2021, 131, 103843. [Google Scholar] [CrossRef]
  38. Marzari, N.; Ferretti, A.; Wolverton, C. Electronic-structure methods for materials design. Nat. Mater. 2021, 20, 736–749. [Google Scholar] [CrossRef] [PubMed]
  39. Brugger, J.; Liu, W.; Etschmann, B.; Mei, Y.; Sherman, D. M.; Testemale, D. A review of the coordination chemistry of hydrothermal systems, or do coordination changes make ore deposits? Chem. Geol. 2016, 447, 219–253. [Google Scholar] [CrossRef]
  40. Ma, D.; Deng, Y.; Wang, D.; Ji, W.; Li, E. Photoelectric properties of InxGa1-xAs: A first-principles study. Micro and Nanostructures 2019, 128, 312–318. [Google Scholar] [CrossRef]
  41. Hu, M.; Chen, M.; Guo, P.; Zhou, H.; Deng, J.; Yao, Y.; Jiang, Y.; Gong, J.; Dai, Z.; Zhou, Y.; Qian, F.; Chong, X.; Feng, J.; Schaller, R. D.; Zhu, K.; Padture, N. P.; Zhou, Y. Sub-1.4eV bandgap inorganic perovskite solar cells with long-term stability. Nat. Commun. 2020, 11. [Google Scholar] [CrossRef] [PubMed]
  42. Hu, M.; Fan, Z.; Liu, J. Y.; Zhang, K.; Wang, Y.; Yang, C. F. Adsorption of Ag on M-doped graphene: First principle calculations. Int. J. Min. Met. Mater. 2021, 28, 487–494. [Google Scholar] [CrossRef]
  43. Perdew, J. P.; Chevary, J. A.; Vosko, S. H.; Jackson, K. A.; Pederson, M. R.; Singh, D. J.; Fiolhais, C. Atoms, molecules, solids, and surfaces: Applications of the generalized gradient approximation for exchange and correlation. Phys. Rev. B Condens. Matter 1992, 46, 6671–6687. [Google Scholar] [CrossRef] [PubMed]
  44. Perdew, J. P.; Burke, K.; Ernzerhof, M. In Generalized gradient approximation made simple, United States, 1996, 1996; Louisiana State University, Baton Rouge, LA (United States): United States, 1996. [Google Scholar]
  45. Vanderbilt, D. Soft self-consistent pseudopotentials in a generalized eigenvalue formalism; 1990.
  46. Broyden, C. G. The convergence of a class of double-rank minimization algorithms 1. general considerations. Ima J. Appl. Math. 1970, 6, 76–90. [Google Scholar] [CrossRef]
  47. Fletcher, R. A new approach to variable metric algorithms. Comput. J. 1970, 13, 317–322. [Google Scholar] [CrossRef]
  48. Goldfarb, D. A family of variable-metric methods derived by variational means. Math. Comput. 1970. [Google Scholar] [CrossRef]
  49. Shanno, D. F. Conditioning of Quasi-Newton methods for function minimization. Math. Comput. 1970, 24, 647–656. [Google Scholar] [CrossRef]
  50. Chadi, D. J. Special points for Brillouin-zone integrations. Phys. Rev. B 1977. [Google Scholar] [CrossRef]
  51. Liu, S. The metallogenesis research of Yaojialing Zn-Au polymetallic deposit in Tongling, Anhui Province. C. U. G. Beijing, 2012.
  52. Wang, Y.; Wang, Y.; Tang, J.; He, C.; Wang, H.; Yan, P.; Feng, J. Chemical composition characteristics and geological significance of sphalerite in Bangbule skarn Pb-Zn deposit, Tibet. Acta Geosci. Sin. 2022, 1–13. [Google Scholar]
  53. Guo, F.; Wang, Z.; Xu, D.; Yu, D.; Dong, G.; Ning, J.; Kang, B.; Peng, E. Trace element characteristics of sphalerite in the Lishan Pb-Zn-Cu polymetallic deposit in Hunan Province and the metallogenic implications. Earth Sci. Front. 2020, 27, 66–81. [Google Scholar]
  54. Yang, H. Study on the mineralization of skarn-vein type lead-zinc deposits in the Northern of De'rbugan metallogenic belt, the Great Xing'an Range. Jilin U., 2021.
  55. Wei, W. Genetic mineralogy and metallogenesis of Shuangjianzishan Ag-Pb-Zn polymetallic deposit, Inner Mongolia. C. U. G. Wuhan, 2021.
  56. Liu, J. Typical minerals chemical characteristics and discussion on genesis of the Mengxing Zn-Pb deposit, western Yunnan (SW China). Kunming U. Sci. Techno., 2020.
  57. Hu, P.; Cai, M.; He, G.; Gan, N.; Xiao, J.; Zhu, M.; Lv, T. Characteristics of trace elements, rare earth elements and hydrogen and oxygen isotopes of sphalerite in Dachang Tongkeng deposit, Guangxi. Sci. Techno. Eng. 2022, 22, 10857–10866. [Google Scholar]
  58. Wei, R.; Wang, Y.; Hu, Q.; Huang, S.; Dou, P.; Hu, W. Source of ore-forming metals in Changba-Lijiagou super-large Pb-Zn deposit, Gansu Province: Evidence from in-situ S-Pb and Zn isotopic compositions of sphalerite. Miner. Deposits 2022, 41, 722–740. [Google Scholar]
  59. Hu, P. Geochemical characteristics and genesis of cassiterite and sphalerite in the Tongkeng tin polymetallic deposit, Northwestern Guangxi. Guangxi U., 2022.
  60. Wang, X.; Zhu, X.; Zhu, Z.; Zang, W.; Zhou, Z.; Yao, T.; Yan, P. A discussion on the genesis of the Wulanbaiqi Pb-Zn deposit, Inner Mongolia: Evidence from fluid inclusions, S-Pb isotopes and trace elements of ore minerals. Acta Petrol. Sin. 2020, 36, 2232–2248. [Google Scholar] [CrossRef]
  61. Huang, H.; Yang, C.; Wang, M.; Ma, X. Optical absorption enhancement of Hg-doped ZnX (X= S, Se) for hydrogen production from water splitting driven by solar energy. Vacuum 2018, 157, 36–44. [Google Scholar] [CrossRef]
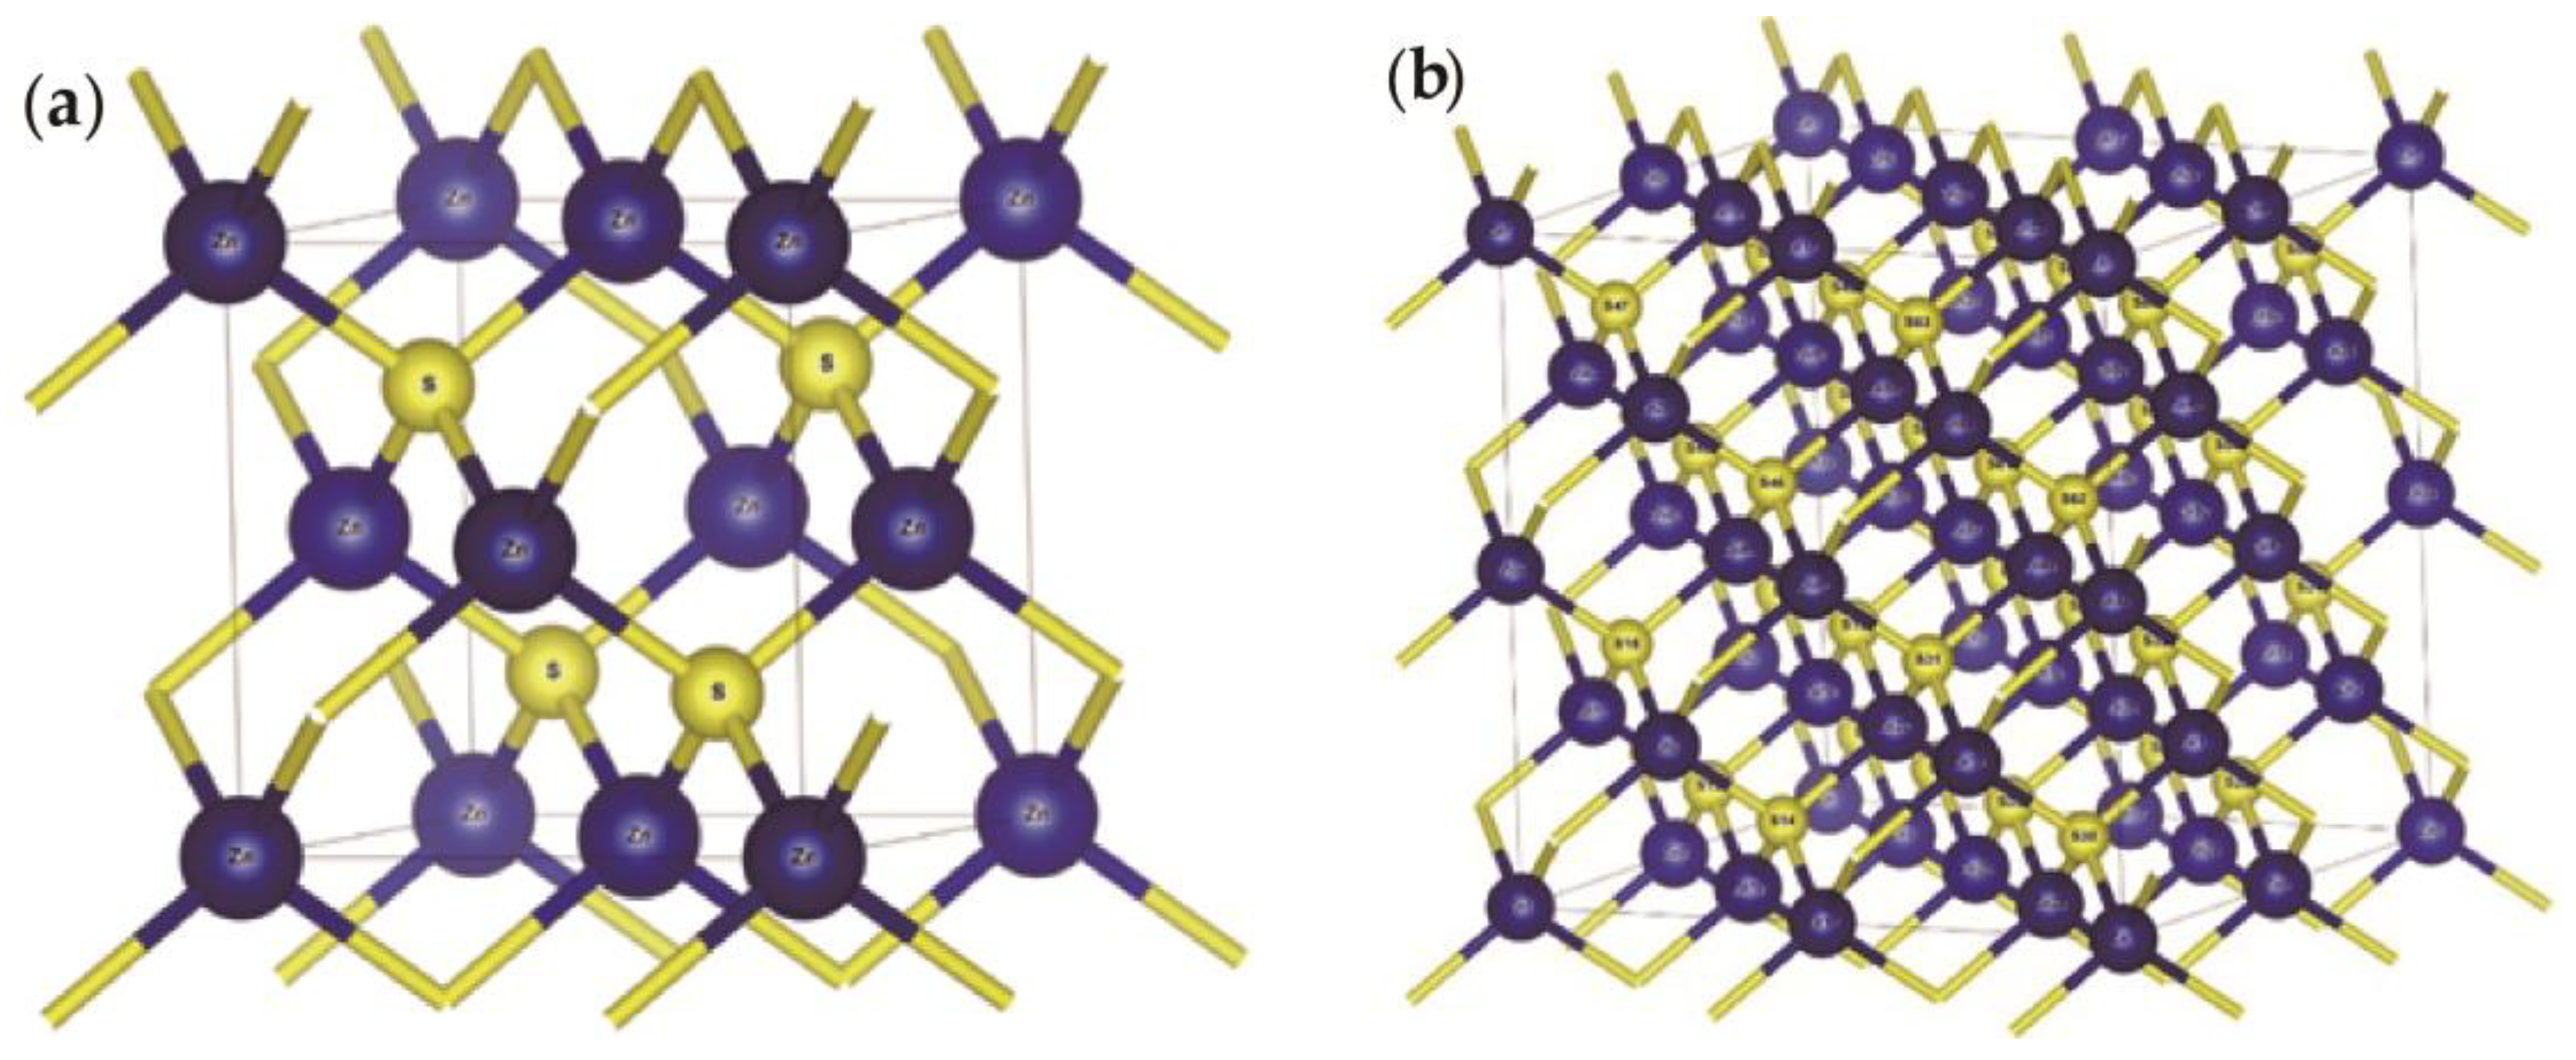
Figure 1. Crystal models of sphalerite and its supercell: (a) Conventional cell; (b) 2×2×2 supercell.
Preprints 67116 g001
Figure 2. Doped sphalerite systems: (a) Zn30InAgS32( A g + + I n 3 + 2 Z n 2 + ); (b) Zn30InCuS32( C u + + I n 3 + 2 Z n 2 + ).
Preprints 67116 g002
Figure 3. Band structures of sphalerite.
Preprints 67116 g003
Figure 4. Total and partial DOS of sphalerite.
Preprints 67116 g004
Figure 5. Lattice length of Zn30InAgS32 at various temperatures (a) and pressures (b).
Preprints 67116 g005
Figure 6. Zn30InAgS32 substitution energy at various temperatures (a) and pressures (b).
Preprints 67116 g006
Figure 7. The temperature remains unchanged at 600K, and the total and partial DOS of Zn30InAgS32 when the pressure changes: (a) 20MPa; (b) 25MPa; (c) 30MPa; (d) 35MPa; and (e) 40MPa.
Preprints 67116 g007aPreprints 67116 g007b
Figure 8. The pressure remains unchanged at 30MPa, and the total and partial DOS of Zn30InAgS32 when the temperature changes: (a) 500K; (b) 550K; (c) 600K; (d) 650K; and (e) 700K.
Preprints 67116 g008aPreprints 67116 g008b
Figure 9. Lattice length of Zn30InCuS32 at various temperatures (a) and pressures (b).
Preprints 67116 g009
Figure 10. Zn30InCuS32 substitution energy at various temperatures(a) and pressures (b).
Preprints 67116 g010
Figure 11. The temperature remains unchanged at 600K, and the total and partial DOS of Zn30InCuS32 when the pressure changes: (a) 20MPa; (b) 25MPa; (c) 30MPa; (d) 35MPa;(e) 40MPa.
Preprints 67116 g011aPreprints 67116 g011b
Figure 12. The pressure remains unchanged at 30MPa, and the total and partial DOS of Zn30InCuS32 when the temperature changes: (a) 500K; (b) 550K; (c) 600K; (d) 650K; (e) 700K.
Preprints 67116 g012aPreprints 67116 g012b
Figure 13. Lattice length of Zn30InAgS32 and Zn30InCuS32 at various temperatures (a) and pressures (b).
Preprints 67116 g013
Figure 14. Substitution energy and total energy of Zn30InAgS32 and Zn30InCuS32 in various temperatures (a) and pressures (b).
Preprints 67116 g014
Figure 15. Bond population distribution of Zn30InAgS32 and Zn30InCuS32 in various temperatures (a) and pressures (b).
Preprints 67116 g015
Table 1. Sphalerite Mulliken atom population.
Compound Charge spilling Species Muliken atomic populations Mulikencharge Formal ionic charge Effective valence Hirshfeld charge Effective valence
s p d Total
Zn4S4 0.14 Zn 0.57 0.98 9.98 11.53 0.47 2 1.53 0.23 1.77
S 1.82 4.65 - 6.47 -0.47 -2 1.53 -0.23 1.77
Table 2. Sphalerite Mulliken bond population.
Compound Bond nμ pμ dμ
Zn4S4 Zn-S 16 0.46 2.35501
Zn-Zn 6 -2.5 3.84572
S-S 6 -0.17 3.84572
Table 3. Cell length of Zn30InAgS32 at various temperatures and pressures.
Temperature(K) Pressure (MPa) Zn30InAgS32 cell length(Å) Zn32S32 cell length(Å)
500 30 11.011051 10.953515
550 11.023002 10.951177
600 11.025429 10.949337
650 11.036065 10.965068
700 11.034404 10.990049
600 20 11.020628 10.960759
25 11.034657 10.952866
30 11.025429 10.949337
35 11.028178 10.959118
40 11.024839 10.969608
Table 4. The energy of the related system at various temperatures and pressures.
Doped system Temperature(K) Pressure(MPa) EZnS+In+Ag/eV EZn/eV EZnS/eV EIn/eV EAg/eV Esub/eV
Zn30InAgS32 500 30 -62818.43 -1708.92 -63651.81 -1558.28 -1025.02 -1.16
550 -62817.72 -1708.91 -63651.32 -1558.26 -1025.02 -0.94
600 -62816.84 -1708.90 -63650.46 -1558.25 -1025.02 -0.91
650 -62815.89 -1708.89 -63648.43 -1558.25 -1025.01 -1.97
700 -62814.80 -1708.85 -63648.02 -1558.24 -1024.99 -1.25
600 20 -62817.15 -1708.92 -63650.54 -1558.26 -1025.00 -1.20
25 -62816.87 -1708.94 -63651.39 -1558.26 -1025.01 -0.09
30 -62816.84 -1708.90 -63650.46 -1558.25 -1025.02 -0.91
35 -62816.75 -1708.97 -63650.38 -1558.26 -1025.02 -1.04
40 -62816.88 -1708.95 -63650.11 -1558.27 -1025.02 -1.40
Table 5. Bond population distribution of Zn30InAgS32 at various temperatures and pressures.
Doped system Temperature(K) Pressure (MPa) S-In bond S-Ag bond S-Zn bond
population length population length population length
Zn30InAgS32 500 30 0.668 2.37642 0.393 2.37218 0.597 2.36707
550 0.670 2.37870 0.395 2.35881 0.597 2.36555
600 0.660 2.38988 0.388 2.37972 0.598 2.36288
650 0.655 2.40507 0.393 2.36310 0.599 2.36160
700 0.673 2.36874 0.388 2.38320 0.598 2.36117
600 20 0.673 2.37213 0.395 2.35916 0.597 2.36435
25 0.670 2.37078 0.385 2.39321 0.598 2.36326
30 0.660 2.38988 0.388 2.37972 0.598 2.36288
35 0.668 2.37831 0.393 2.37982 0.598 2.36334
40 0.660 2.39155 0.380 2.39766 0.598 2.36206
Table 6. Cell length of Zn30InAgS32 at various temperatures and pressures.
Temperature(K) Pressure (MPa) Zn30InCuS32 cell length(Å) Zn32S32 cell length(Å)
500 30 10.975624 10.953515
550 10.99044 10.951177
600 10.993576 10.949337
650 10.998761 10.965068
700 11.012782 10.990049
600 20 10.987211 10.960759
25 10.989812 10.952866
30 10.993576 10.949337
35 11.004323 10.959118
40 10.99814 10.969608
Table 7. The energy of the related system at various temperatures and pressures.
Doped system Temperature(K) Pressure (MPa) EZnS+In+Cu/eV EZn/eV EZnS/eV EIn/eV ECu/eV Esub/eV
Zn30InCuS32 500 30 -63267.89 -1708.92 -63651.81 -1558.28 -1472.83 -2.82
550 -63266.40 -1708.91 -63651.32 -1558.26 -1472.83 -1.81
600 -63265.81 -1708.90 -63650.46 -1558.25 -1472.82 -2.09
650 -63265.84 -1708.89 -63648.43 -1558.25 -1472.81 -4.12
700 -63263.38 -1708.85 -63648.02 -1558.24 -1472.82 -2.00
600 20 -63265.64 -1708.92 -63650.54 -1558.26 -1472.82 -1.88
25 -63265.66 -1708.94 -63651.39 -1558.26 -1472.82 -1.07
30 -63265.81 -1708.90 -63650.46 -1558.25 -1472.82 -2.09
35 -63266.04 -1708.97 -63650.38 -1558.26 -1472.81 -2.53
40 -63266.31 -1708.95 -63650.11 -1558.27 -1472.82 -3.03
Table 8. Bond population distribution of Zn30InCuS32 at various temperatures and pressures.
Doped system Temperature(K) Pressure(MPa) S-In bond S-Cu bond S-Zn bond
population length population length population length
Zn30InCuS32 500 30 0.680 2.35078 0.443 2.38279 0.597 2.36187
550 0.678 2.35704 0.455 2.35427 0.597 2.36085
600 0.668 2.38333 0.453 2.35995 0.598 2.35903
650 0.668 2.37992 0.453 2.36192 0.598 2.35781
700 0.665 2.38084 0.453 2.35974 0.599 2.35735
600 20 0.665 2.38164 0.443 2.38702 0.599 2.35821
25 0.678 2.36125 0.445 2.38010 0.598 2.35868
30 0.668 2.38333 0.453 2.35995 0.598 2.35903
35 0.653 2.40277 0.458 2.35400 0.599 2.35842
40 0.673 2.36891 0.463 2.34061 0.597 2.35974
Disclaimer/Publisher’s Note: The statements, opinions and data contained in all publications are solely those of the individual author(s) and contributor(s) and not of MDPI and/or the editor(s). MDPI and/or the editor(s) disclaim responsibility for any injury to people or property resulting from any ideas, methods, instructions or products referred to in the content.
Copyright: This open access article is published under a Creative Commons CC BY 4.0 license, which permit the free download, distribution, and reuse, provided that the author and preprint are cited in any reuse.
Prerpints.org logo

Preprints.org is a free preprint server supported by MDPI in Basel, Switzerland.

Subscribe

© 2024 MDPI (Basel, Switzerland) unless otherwise stated