1. Introduction
Sudan is located between the latitudes 3o and 23o N and 21o,45 and 39o E. This wide land provides a wide range of climates, from tropical regions in the south to desert regions in the north, making it a perfect location for all integrated agricultural investment activities, from production to processing. [
1,
2]. state that the population density in Sudan is low. Summers in Khartoum are generally warm (mean maximum 41° C and mean lowest 25° C), with significant seasonal fluctuation and low average relative humidity (25%) There is much daylight. The typical climate of a desert is characterized by a broad variety of temperatures and scant precipitation. The differences are due to the dry and wet seasons. Two major air currents significantly impact the global climate.
2. Research area and data
2.1. Solar radiation at Khartoum
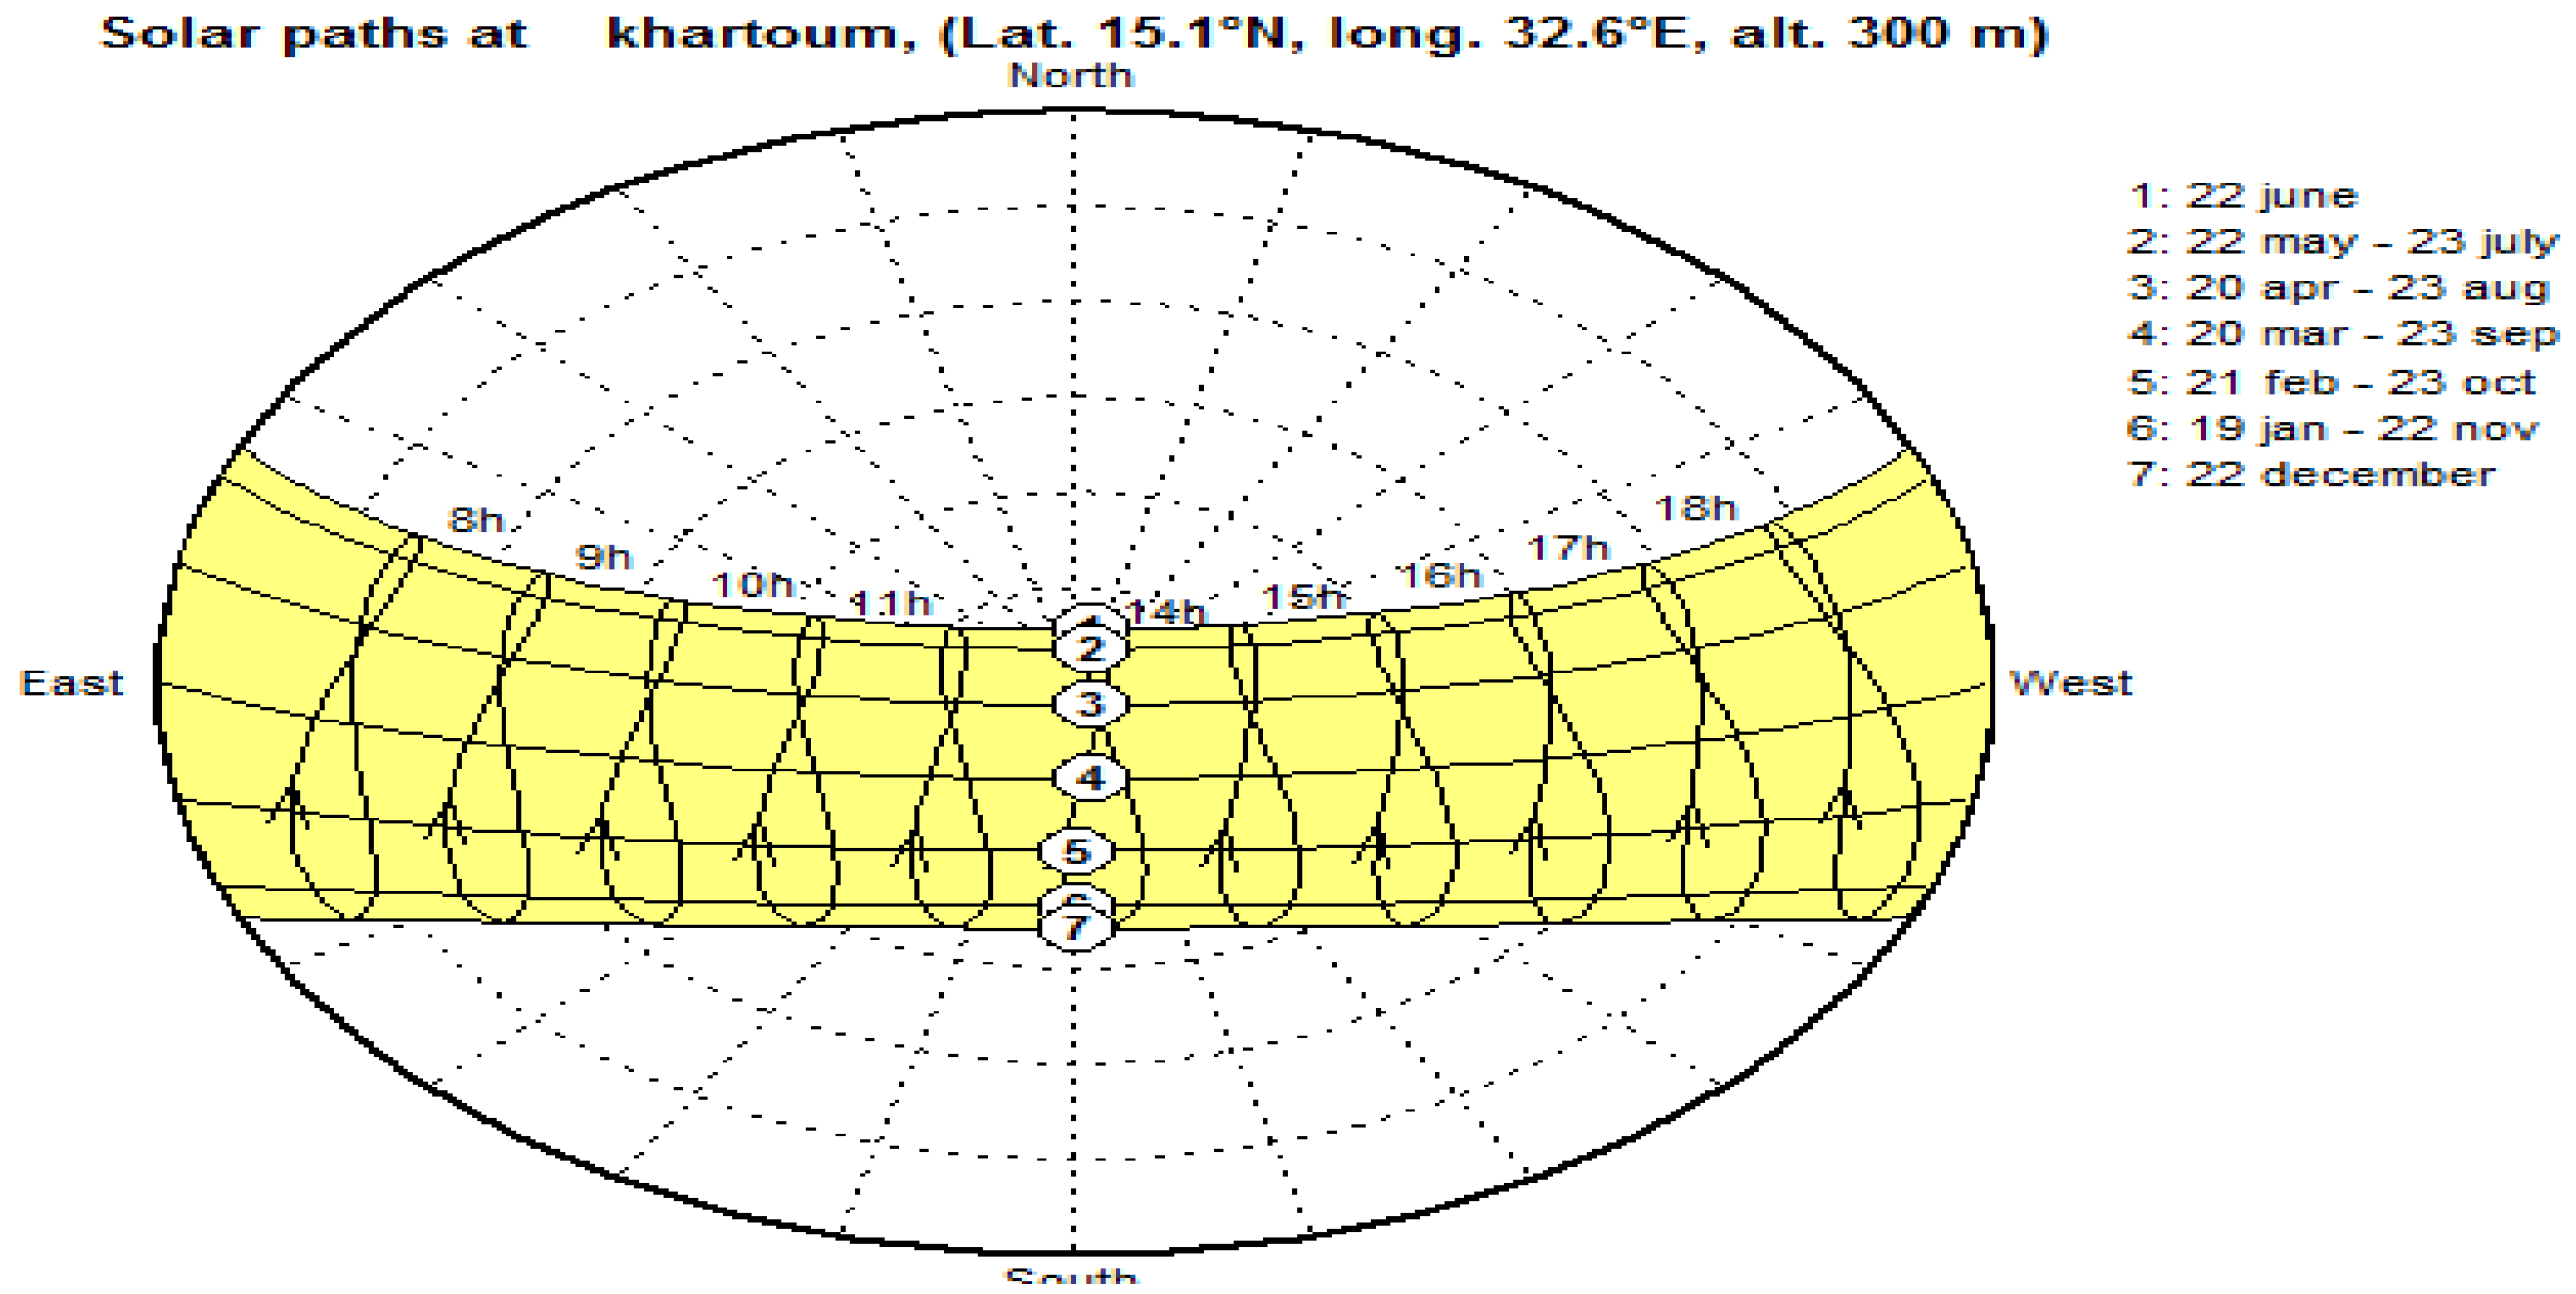
The Khartoum State is one of the parts of the world with a comparatively high solar radiation because of its geographic location. It is located in the northern hemisphere at latitude 15.3° and longitude 32.23°, and it receives about 2000 kWh.m-2 of incident solar energy each year.[
1,
2] The panel must be mounted north-south with the maximum amount of solar energy and the number of days of independence for the system to work without solar input for approximately 4 days after recording [
2] Where the minimum sun-hours per day equal 3.84 for the chosen location in the south of Khartoum, as illustrated by the study’s planning and architectural design. Panel orientation and tilt angle are the most critical factors that contribute to the location’s value. 23o-25o is the optimal tilt angle for catching the maximum sun radiation throughout the year in the Khartoum region[
2].At a maximum power density of around one kilowatt per square meter, solar radiation impacts the earth’s surface (KWM-2)[
3]. Various factors, such as geographic location, cloud cover, the amount of sunlight received each day, and others, affect the actual useable radiation components. In actuality, the solar flux density, sometimes referred to as the power density, ranges from 250 to 2500 kWhm-2 per year[
4]. They believed that in sunny, hot, dry regions, the equator would see the highest levels of total solar radiation. The solar orientation to the integrated photovoltaic panel on the roof Using optimal direction tilts on the roof and natural light to minimize load; few architectural developments have piqued the interest of designers, such as the Solar House[
5]. In essence, the building is oriented and designed to receive a minimal amount of direct sunlight in the summer and a maximum amount of solar heat in the winter in Khartoum. Sun control is easier to achieve where the module faces True South, although successful integrating photovoltaic house in Khartoum can be built with the module upon the roof o orientation slightly east or west of accurate South and accurate north.
2. Materials and Methods
2.1. Sizing and Designing BIPV Grid Connected System
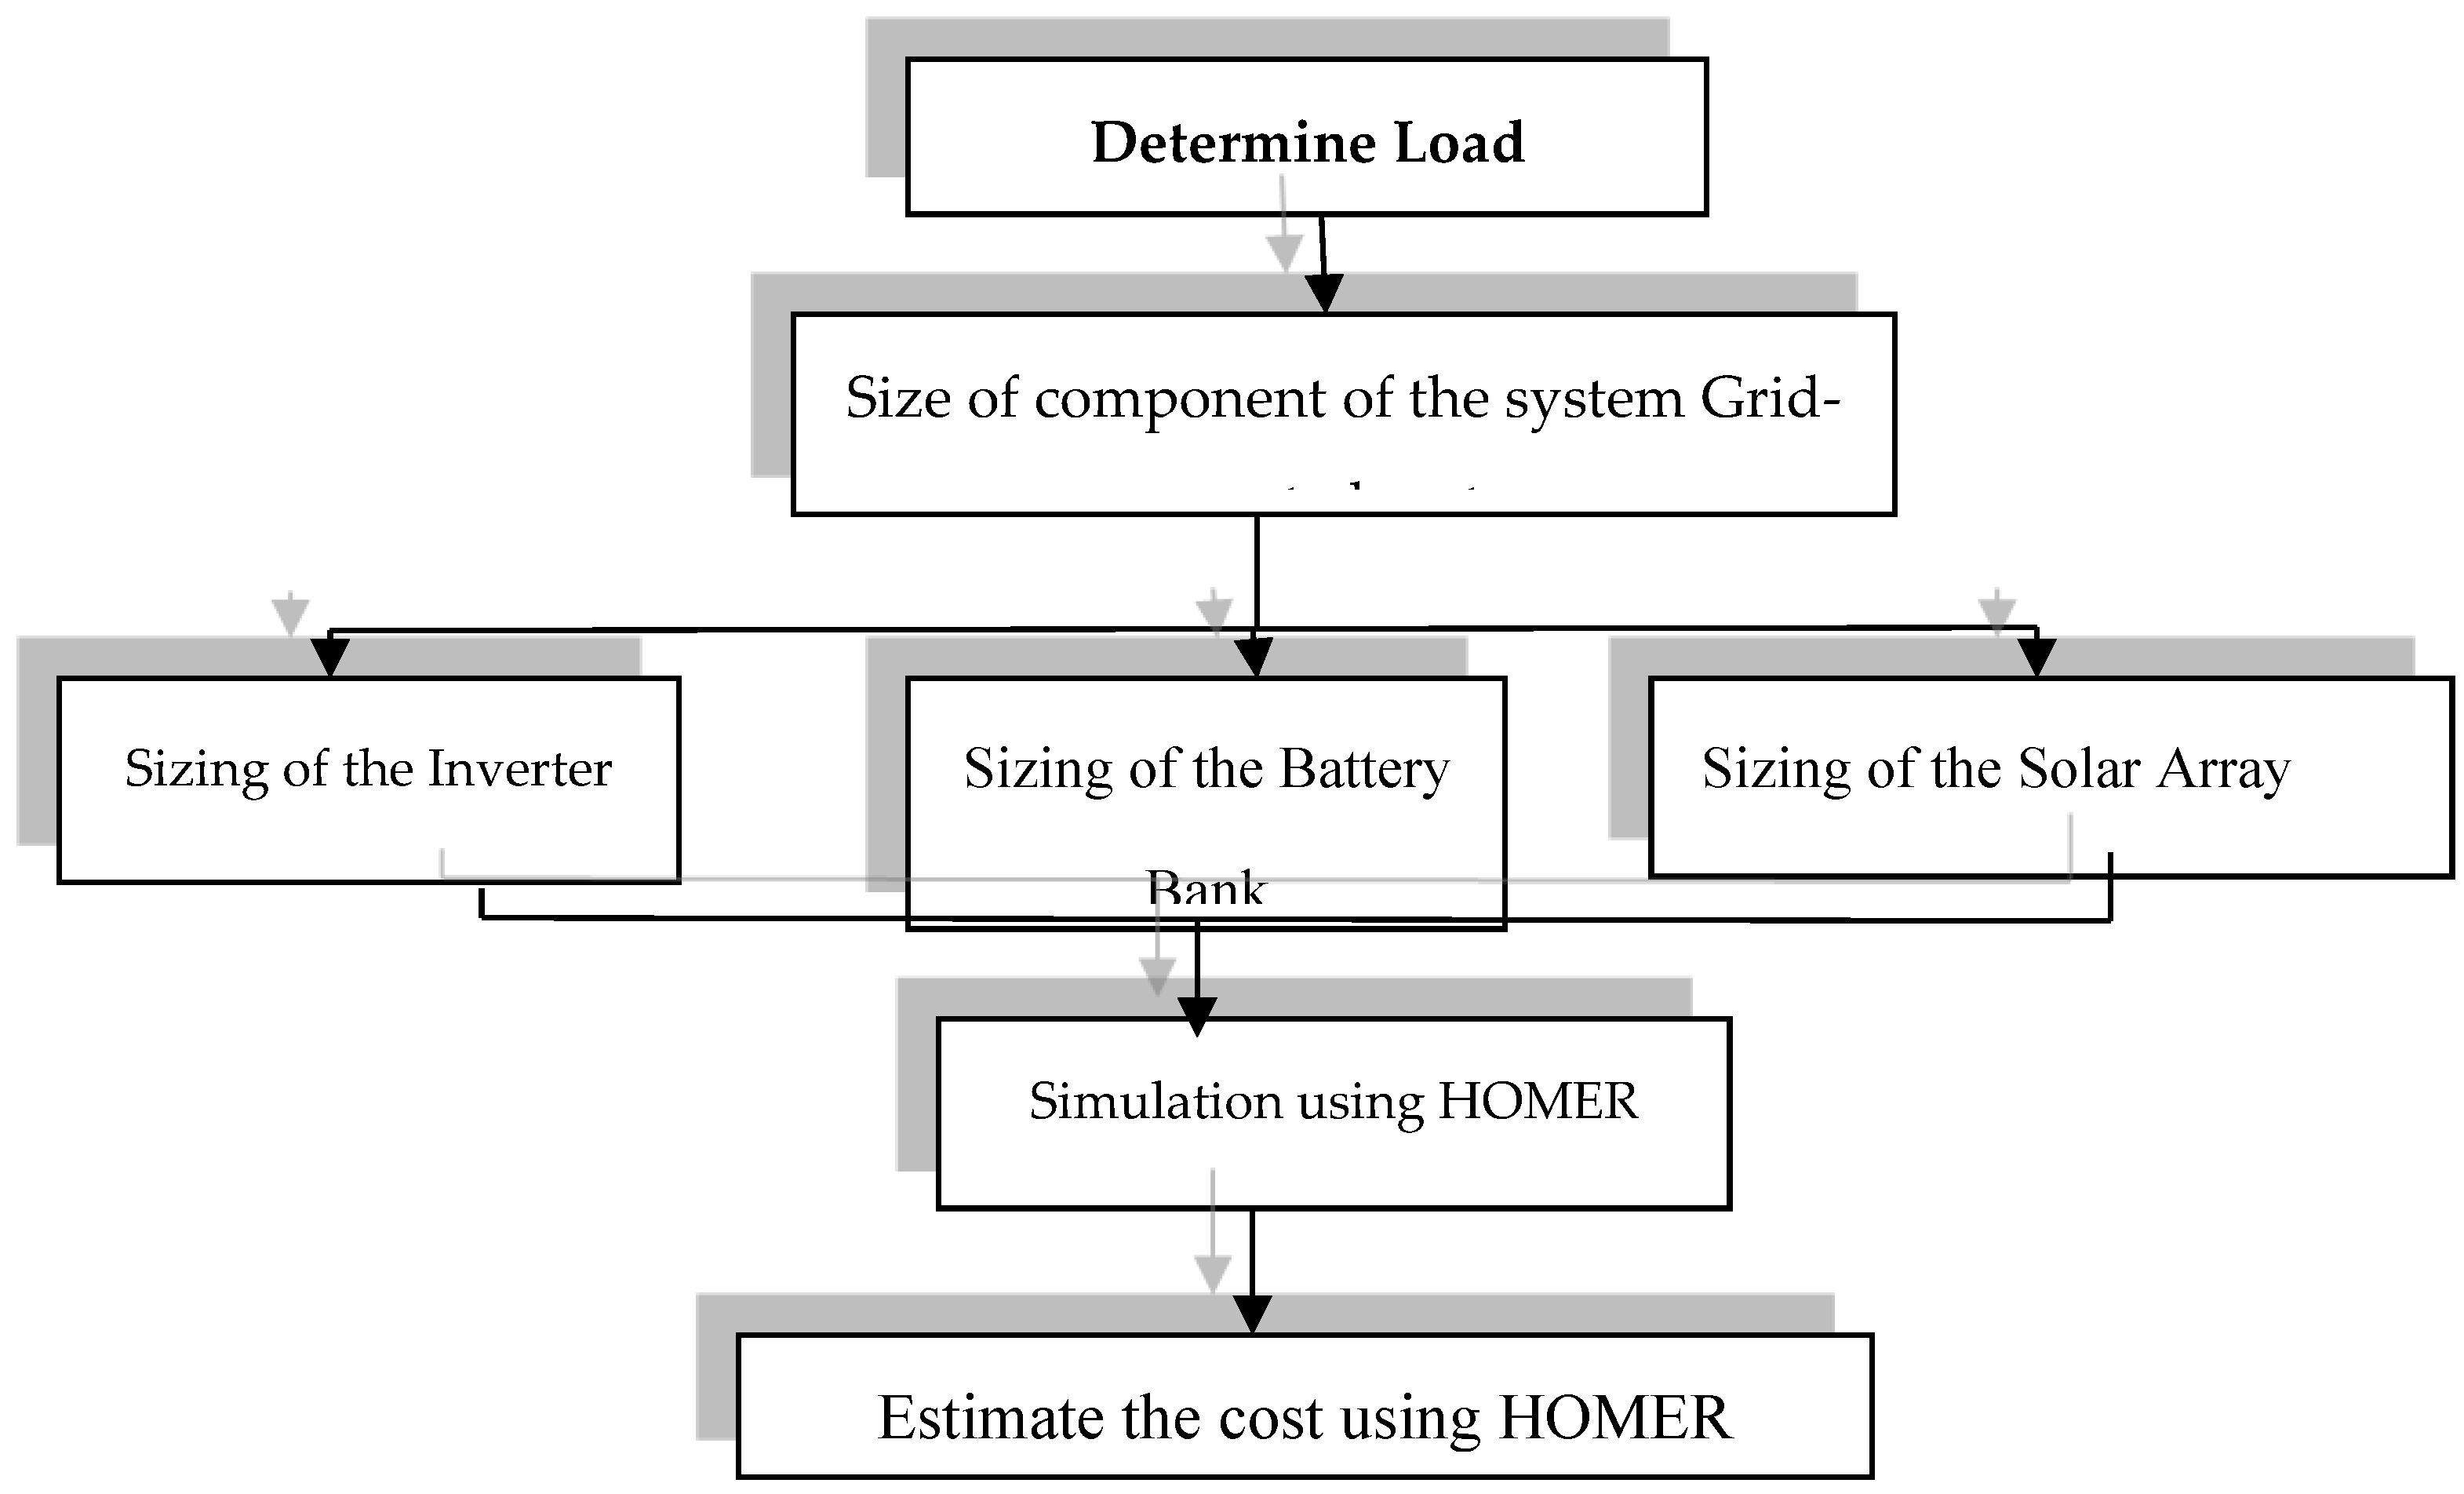
[8] Sunlight on a local variety of sloped roofs is a common feature of residential buildings, and these roofs are best for a PV system if they face roughly the opposite direction of Ecuador. By clicking on profiles, you can connect and power the modules in a pretty simple way. This information is part of the BIPVGCS process’s design method and design. To find the best system size, follow the steps in this section and in
Figure 1.
2.2. Grid-connected system sizing
The most important thing that affects how much power a PV module makes is how much sunlight hits it. As the amount of solar radiation goes up, so do the current in a short circuit, the maximum power, and the efficiency.[
6] Photovoltaic (PV) technology was developed to be used in space, so it shouldn’t be used for commercial purposes. But recent advances in technology have sped up the development and commercialization of photovoltaic panels by making it possible to use them in construction equipment. [
7,
8]
2.3. Load require and dwelling application
The variety of equipment utilized, either occasionally or more intermittently, makes the specific load apparent. The daily load profile for the energy services needed in a third-class home in Khartoum is shown below. The range of tools utilized, either rarely or more infrequently, shows the clear load. The daily load profile for the energy services needed in a third-class home in Khartoum is shown below. To determine the average energy requirement in KW-hour per day, as indicated in
Table 1 below, the electrical appliances at the home must first be certified with their power evaluation and time of operation throughout the day. The size of the teams, rankings, and expected expenditures are then determined using the figure obtained as the average energy consumption of the sum, starting with the solar array and finishing with the electrical system.[12] Lightning was the most common type of lighting in Khartoum. The lights are expected to be used for 5-7 hours per day, so using the upper limit would result in a total of 267Wh per day. If a traditional 20% extra power consumption for system losses is assumed, the average daily energy required is = 380Wh, rounded up to 360Wh. Monitoring of specific low-load overnight is also of particular interest. Some of the factors influencing load characteristics have a cultural explanation, and a similar experimental project in Indonesia Sukatani [13] After the first few months of installation, the local user requested the use of the lights at night, and the research implementers "matched when it was discovered that the PV system could meet the increased load.".[14] Second, as people in the third class become more comfortable with the technology that has been provided to them, they will begin to add new loads and use the system. This was observed in the Sukatani project as well.[15]
2.4. Modules requirement
PVSYS must test and approve modules used in systems that receive contributions. Modules that do not receive PVSYS appreciation do not even benefit from the 13% to 10% efficiency. Test conditions: 1000W/m2 irradiance, 25°C cell temperature A measured increase in the power of the modules found in the Sudan PV market was observed during the PVSYS module test, However, import channels are limited, and module import is frequently complicated. Modules are currently primarily imported from India, but Chinese imports are increasing in popularity. [16] Multicrystal photovoltaic modules from Kyocera FACTORYMODULE: UL 1703 FACTORY: ISO9001 and ISO 14001.
2.5. Design the array
It was designed based on the architect’s design of the house and upon the roof as two parts of an array of 20 modules of one part contacting the other part with the same number of this module after running at software we discovered that the plane irradiance was 1000w/m2. The output of power from the section of this array (with 20 modules) was 3.8 kwh, which means that the output of power was appropriate with the design of electricity requirement that obtained the selection of the type of module and array was sufficient to generate the power which was required for the design, with all requirements, slope of angles and orientation, and system component design as [
9].
2.6. Sizing of the Solar Array and System Design at Khartoum
To prevent undersizing, divide the total average daily energy demand by the efficiency of the system components to get the daily energy requirement from the solar array:
The total current needed for a DC-voltage of 24 is I = 1608/24= 67 A, according to the chosen panel KC50T [
http://www.kyocerasolar.com/pdf/specsheets/KC50T.pdf]. The number of parallel panels, Np=67/7.45=40, and the number of series panels, Ns=24/24=1, are both close to 40, indicating that there are 40 total panels needed (220),also [
10] Design the array and the number of modules based on their load requirements, which means module sizing is affected by the factors mentioned above. While performing the above calculation, an average efficiency of 12% was assigned to the PV modules used in the current installation.
Table 2.
Details of requirements of the system.
2.7. Sizing of the Battery Bank
The required amount of energy storage is = 45004 = 18 kWh, where 4 represents the number of days of autonomy or no-sun days [
www.energymatters.com.au/]. For safety, we divided the previous value by the maximum allowable discharge level, MDOD (75%) as
Assuming we choose a battery voltage of 12 V, the required ampere-hour capacity of the battery bank is C = 24000/12= 2000 Ah, and depending on the chosen battery (UB-8D AGM -250 AH, 12V-DC), the required number of batteries is N batteries = 2000/250= 8 batteries. According to the equation Np=8/2=4, four parallel branches are discernible at a DC voltage of 24 V. There are two series batteries in each branch.
2.8. Sizing of the Voltage Regulator
The total current required, I = 9×8.03×1.25=90.34 A, where the current Isc for each of the selected modules equals 8.03-A and a safety factor of 1.25 is used. The number of regulators required is, N =90.34/60=1.5 approximated to 2. According to selected regulator (Xantrex C-60, 24-V, 60-A,) as [
10] chosen.
2.9. Sizing of the Inverter
The following formula figures out how much power each appliance can use at the same time: P = (1011 + 125 + 200 + 1000) = 1435 W, while high-surge-current appliances, like motors, are 2453 = 735 W. To give the system room to grow, we add 25% to the first two numbers to get the total power:
An inverter that can manage roughly 2712-W 220-Vac is required. A decent option is the Latronics LS-3024 inverter, which has a rating of 3000-W, 24-Vdc, 220-Vac, appropriate sine-wave, a half-hour power of 3700-W, and a surge power of 9000-W for 5 seconds.[
10] The performance and reliability of a photovoltaic system are determined by the system size selection and proper cabling type of cable. The circuit diagram in the graph depicts a region with a photovoltaic generator. The dc-wires connecting the photovoltaic modules to the batteries via the voltage regulator must be able to withstand the maximum current generated by these modules.[
11].
3. Results and Discussion
3.1. Simulation result of grid connected system in Khartoum using homer
Homer is a software platform for analyzing, sizing, and analyzing the whole PVsyst. It focuses on grid-connected and DC-grid photovoltaic (PV) systems and has a database of general weather data and PV system parts. This software is made to meet the needs of engineers, architects, researchers, and teachers. It can also be used with general solar energy equipment. and Homer for The PV System Simulation Tool’s PV System Simulations [20] PV panel size and producer, array wire layout and associated losses, array tilt and azimuth, hourly weather data, and inverter size and type are all inputs to this model that were used to determine the predicted annual performance of home use in Khartoum. Inputs unique to the system, including battery capacity and wire losses from isolation transformers and arrays.
3.1.1. Simulation process using homer
Figure Expected Performance shows what the homer analysis came up with. Between putting in the system and keeping an eye on it, the load went from 3500 kW to 3.8 kW. This was because a new house was being built in Khartoum and lighting and other load requirements were being put in. This outcome was approved by [21] also [19] found the same procedure, but the main difference was that the location in Khartoum considers the amount of electricity used to control the size and performance of the system. This means that we can control the design of the system based on how much electricity was used.
3.1.2. Global solar radiation values on a horizontal surface in Khartoum,
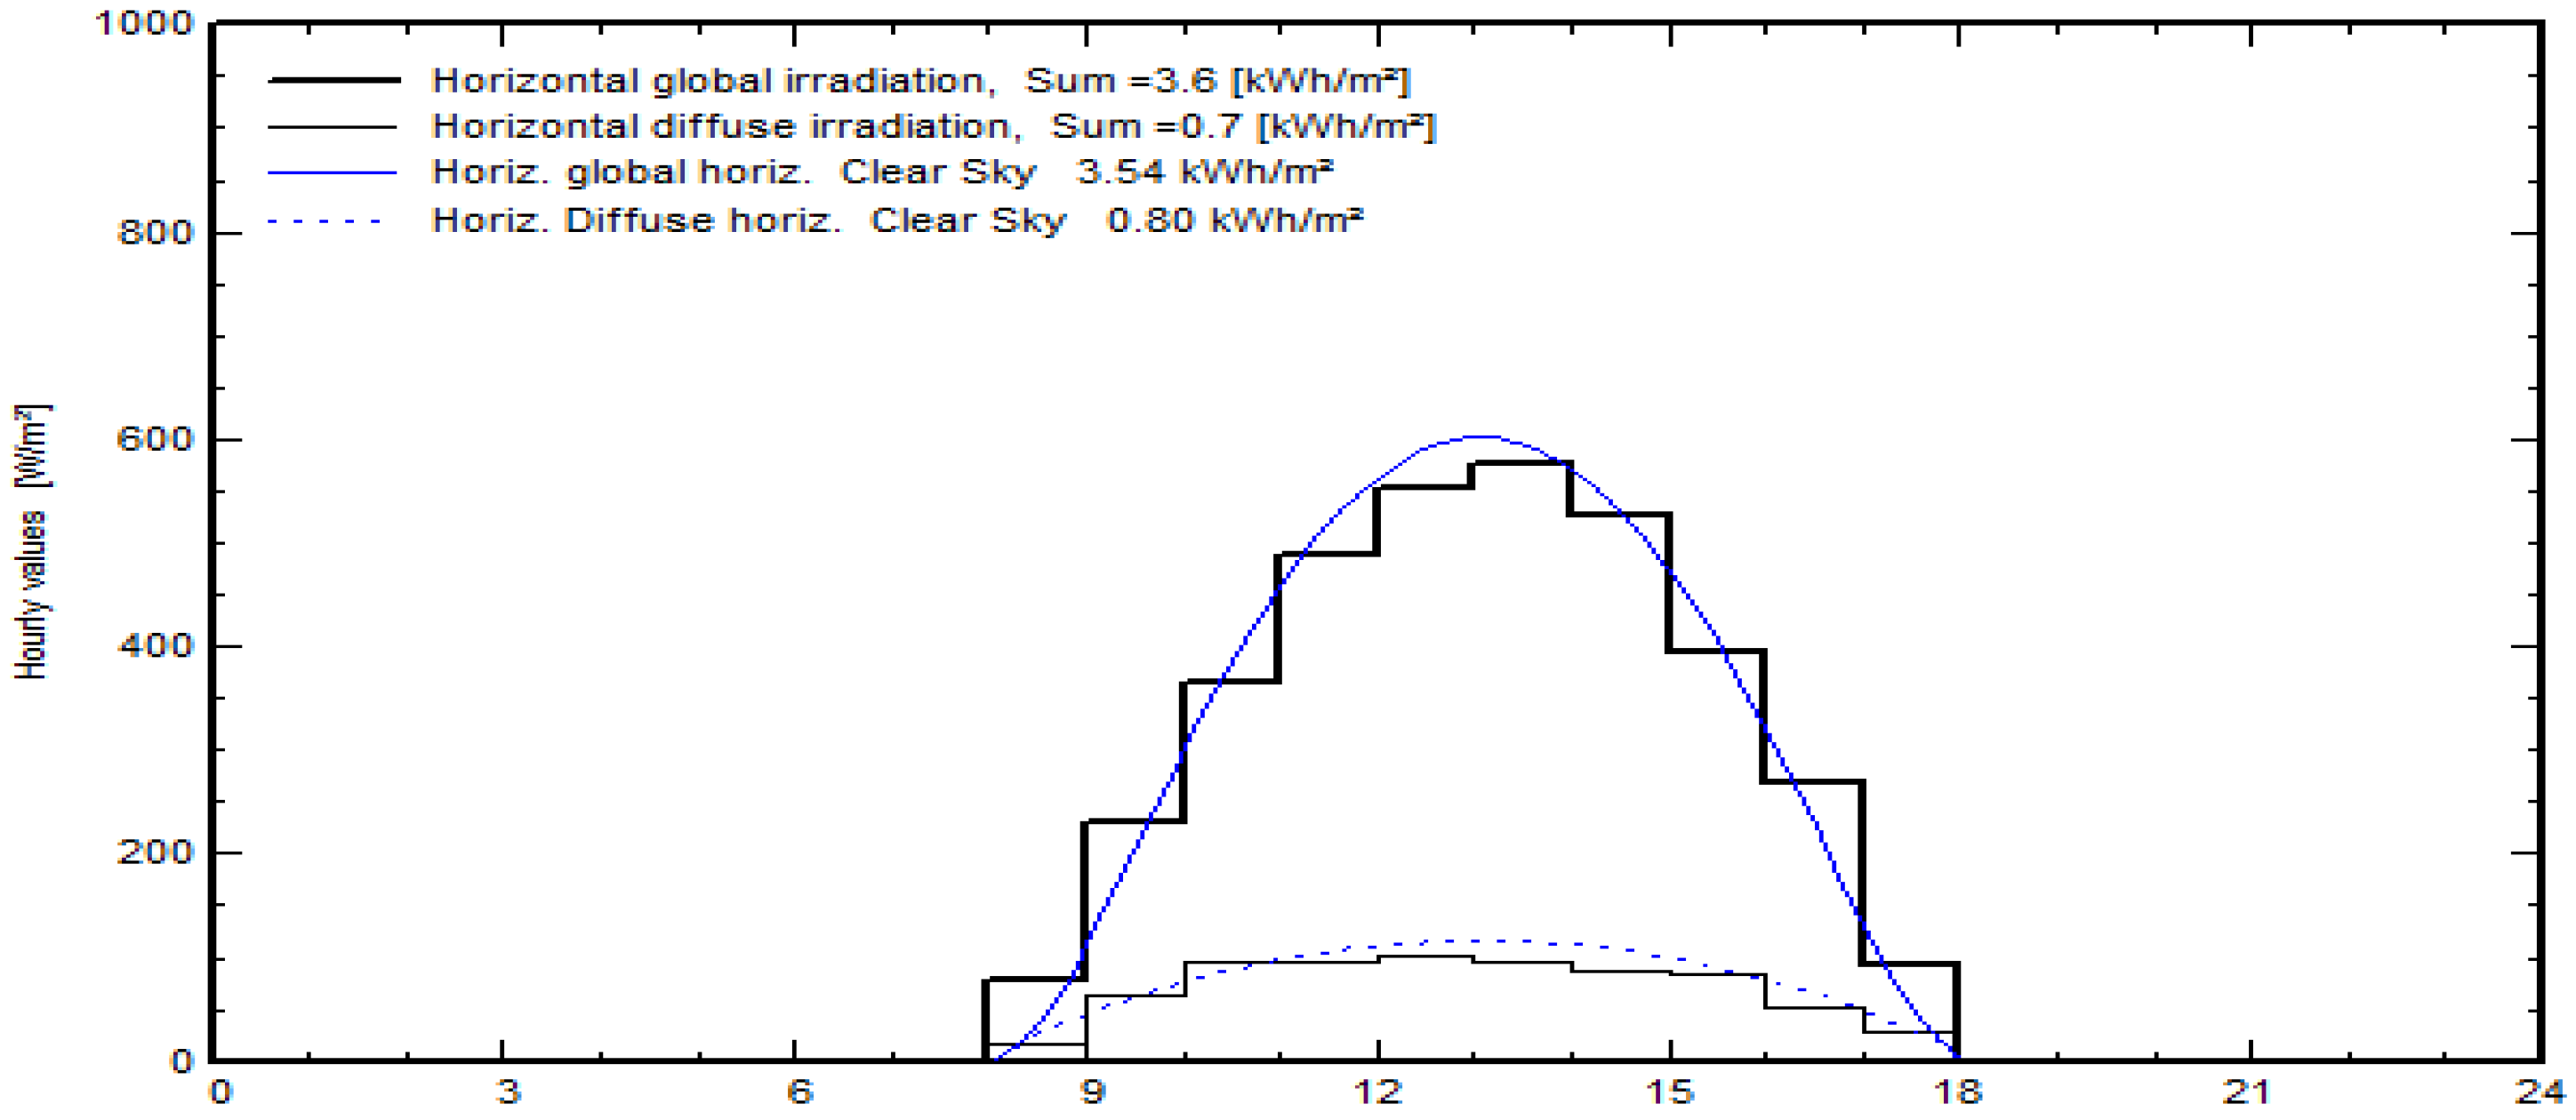
according to Table 6.23 below on average, 1100 kWh/m2 of horizontal solar radiation per year can be anticipated. This translates to 3.79 kWh/m2/day (1100/365 days). sections 2.3 System Design inputs. As seen by
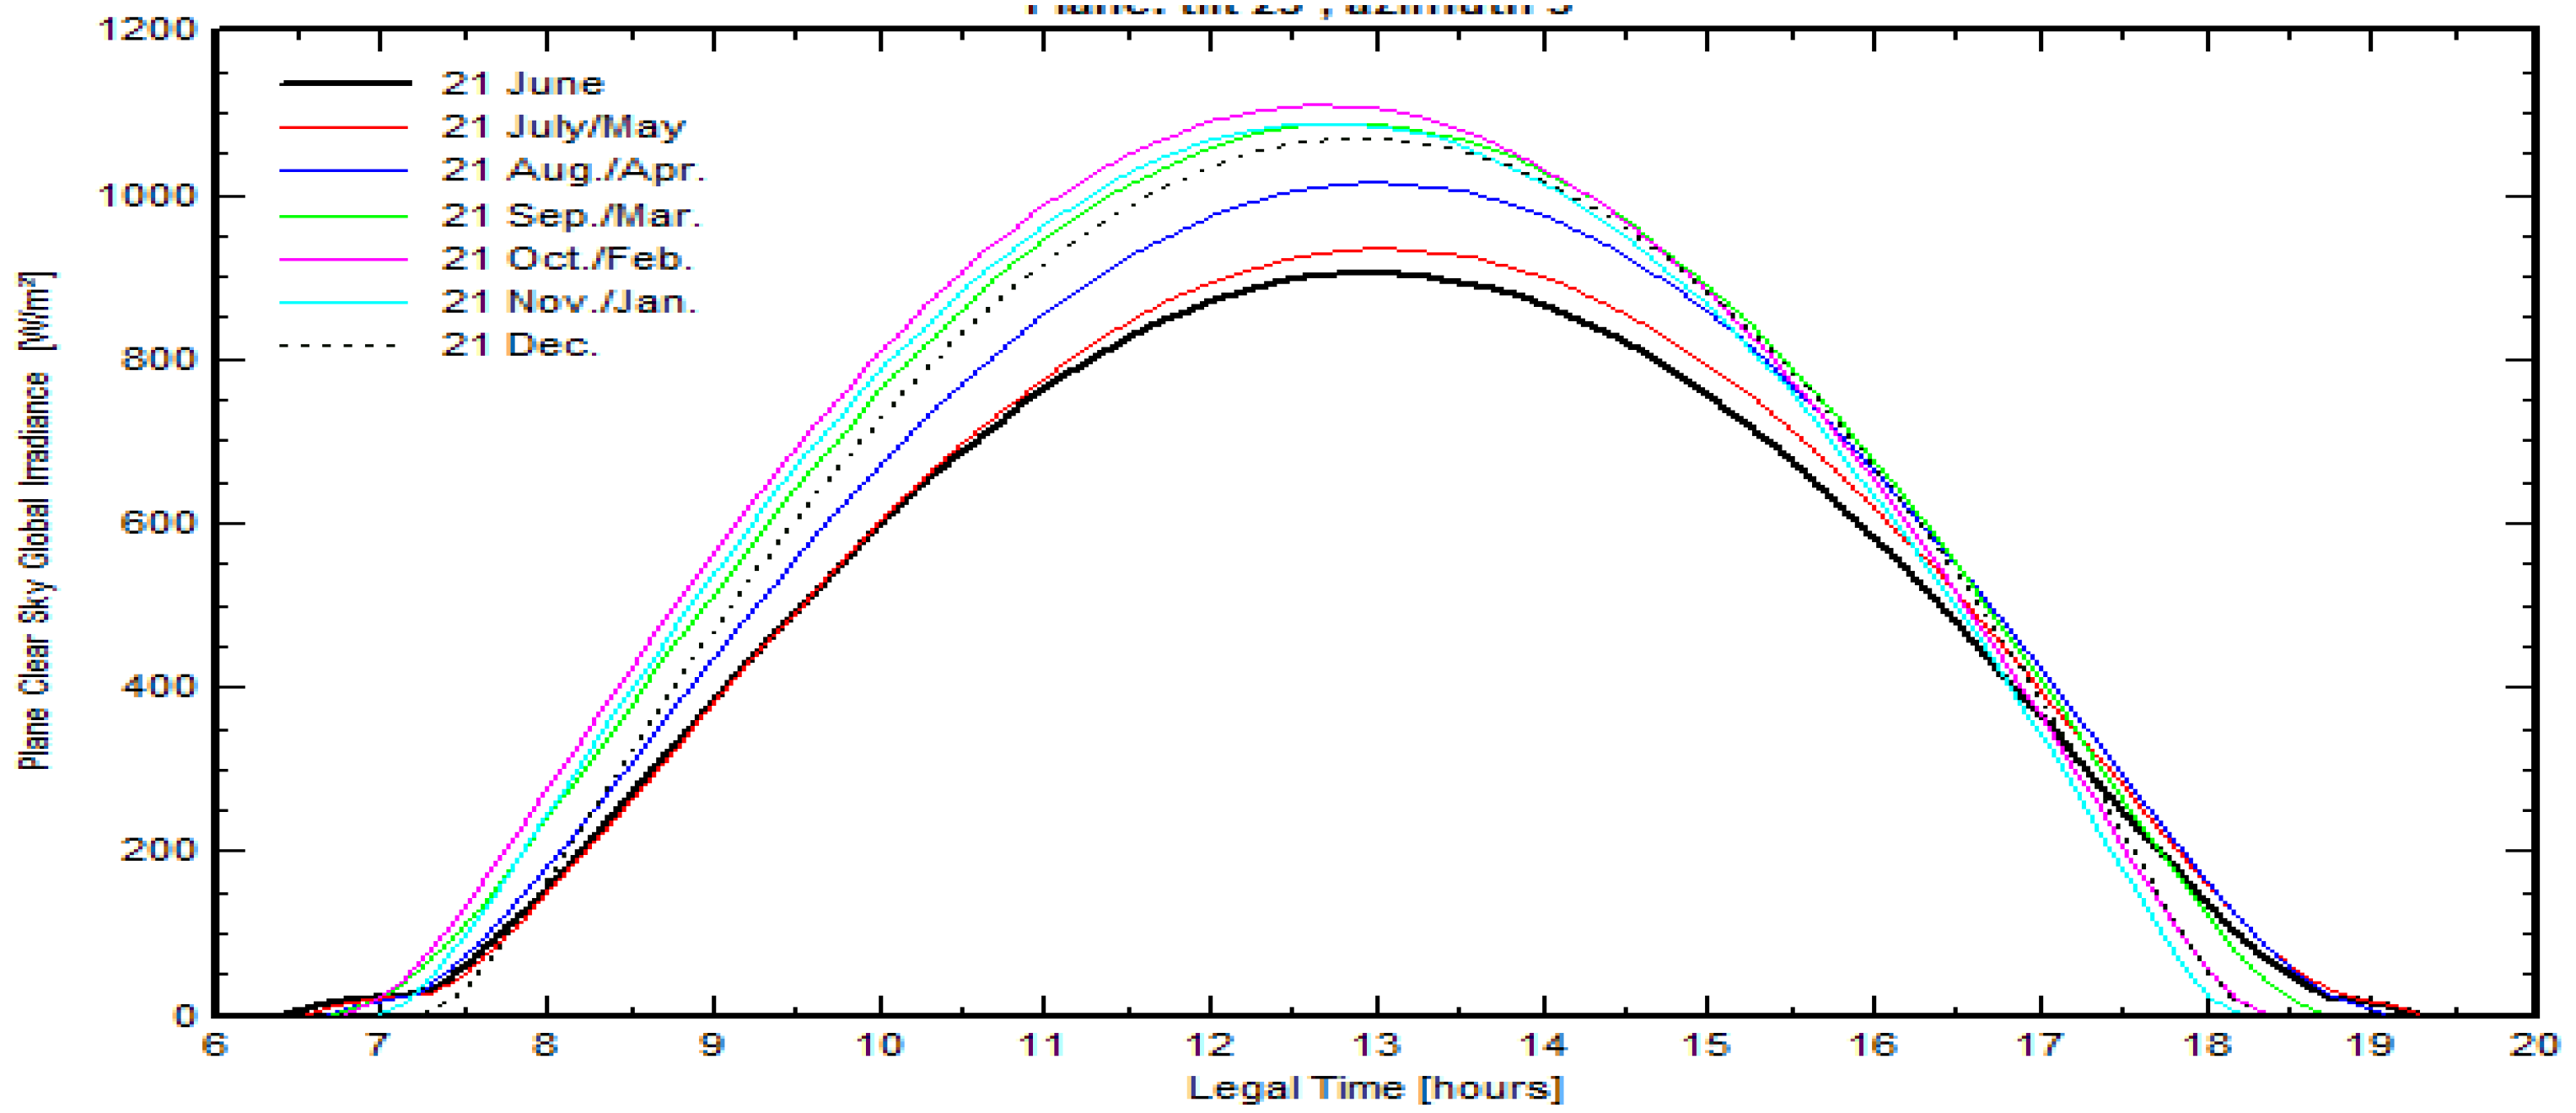
Figure 2 The array on a two-axis tracking system is anticipated to boost sun radiation. It is anticipated that the module will receive 1200kWh/m2/day of solar radiation annually. This is equivalent to an increase of 35.5%, or an average of 11000 / 365 days = 4.04kWh /m2/day. global plane inclined by 23 degrees, 23 degrees azimuth, and horizontal with horizon The GCS receives much more global solar radiation as a result of the PV tracking system than it would have otherwise, with an increase of 40.5% on average per year as illustrated above. When compared to other periods, the increase in module solar radiation is not necessarily as obvious. The numerical changes between July and November range from 2.00kWh/m2/day to 3.66kWh/m2/day. This result is comparable to [21]. If locals who have been educated to do so regularly adjust the tracker from north to south on a weekly basis, things might even get better. A 6–12-year-annual old’s solar system in Nepal was determined to be between 5 and 10%. Therefore, the average yearly global solar radiation measured on the system and on a horizontal surface is around 10% greater than what the Homer software predicts it should be (see
Table 3). Simply comparing actual data to an average design is insufficient.
3.1.3. Global horizontal monthly solar irradiation at Alazhari city at Khartoum
In a system that is connected to the grid, all the energy that is available goes into the grid, so there is no limit to the capacity of the batteries. So, the best unit is annual irradiation in kWh/m2/year, and monthly irradiation values in kWh/m/month are usually used as a starting point for calculating energy yield. The amount of annual radiation on a horizontal plane can change a lot over time. Based on the information that has been collected over the past few decades, it is important.
Figure 3 may also be affected by trends, time, and things that can’t be measured, such as more pollution in the air, changes in how rain falls, and other things. Meteonorm and NASA made the monthly radiation values shown in
Table 3.
3.1.4. Global radiation in the plane of array
The monthly average daily solar radiation in the array plane and the monthly average global radiation values.
Figure 11 shows the following: The average annual solar radiation in the array plane is 5.51kWh/m2/day, which is 39.5% higher than the average horizontal solar market Radiation value. This increase was more than what was expected. Homer thought the price would go up by 33%.
Figure 4 . As the guardian PV°, the measured values of solar radiation don’t change as much from season to season. August and November range from 6.47kWh /m2/day to 4.12kWh /m2/day, which is a 57% change from the year before, or an average change of -25.2% and +17.4%. as [22]
3.2. Load Profile
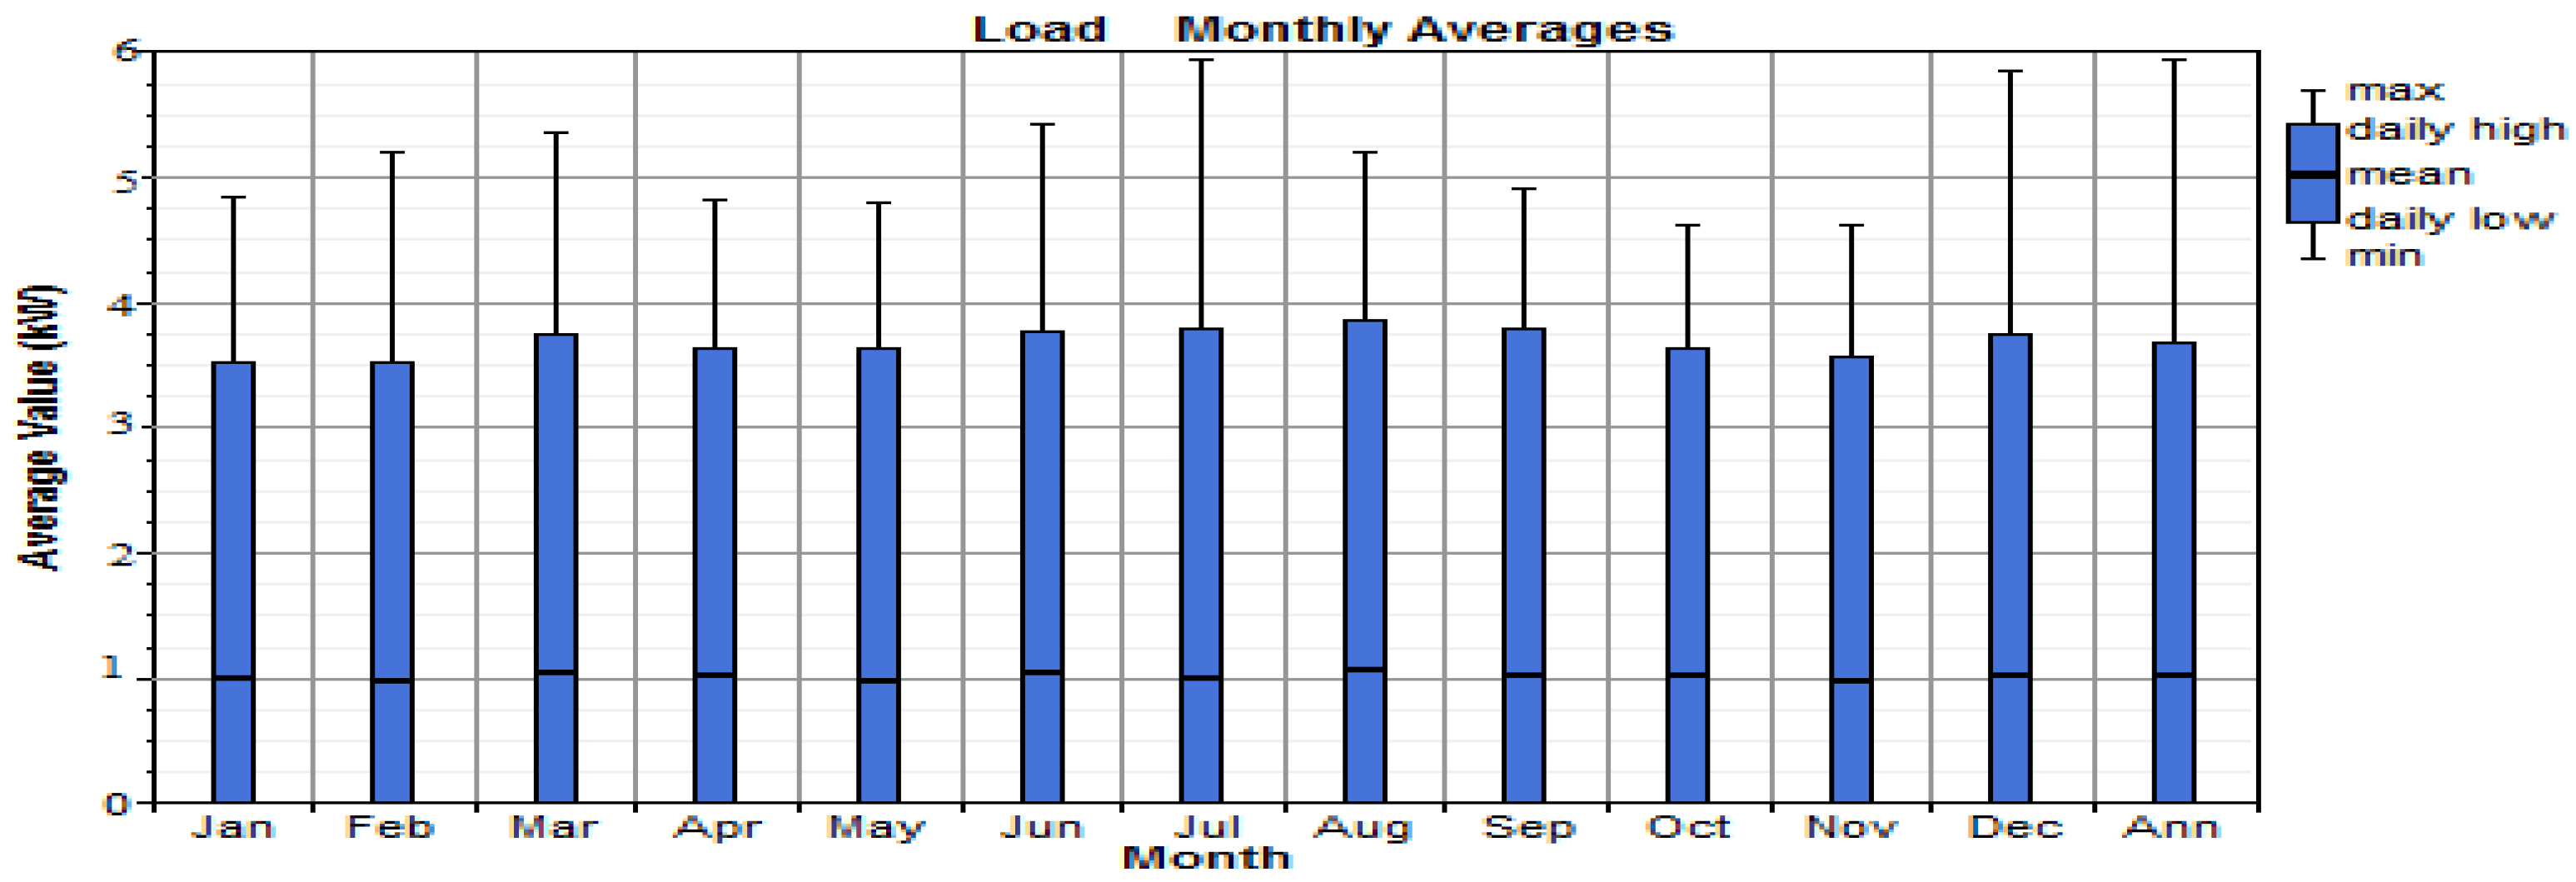
Figure 5 shows the average monthly load values including the maximum and minimum loads for each month. The average hourly load is between 2.2W and 3.9W and the average for the year is 31.0W. The average daily loads are presented in
Figure 14 below. The minimum load is never equal to zero. From the tracker and annual Schreiber driven by its own solar panels to charge the minimum base is the result of was light. The charge has a maximum of about 90W. A total of 28 Values greater than 90 W should be further investigated. The month of maximum load to be studied is February and September. Representative diurnal load profile for summer, winter and midseason represented by respectively June, January and May; this allows hourly maximum and minimum values to be noted. There is never a zero load, indicating that some lights are left on throughout the day and night. There is a different load profile to the design load of 7 hours use per day. Since the beginning of the monitoring period, the villagers requested the ability to switch the lights on and off according to their needs, as their mud and stone house are very dark inside even during the day. The maximum and minimum values indicated by the error bars show that Last profile remains relatively constant over time, with increases in Morning and afternoon and a bathroom in the middle of the day and Night.
There is a traditional notion that lights protect villagers from evil spirits. This may be at least partially responsible for this phenomenon. Due to the fact that nearly fifty percent of the residences in the villages keep their WLEDs on all night, the load profile provides strong evidence that this may be taking place. Because not all families are devoutly religious followers of Hinduism, there is a difference in the degree to which they are terrified of malevolent spirits. [
12]. This may explain why around half of families leave their lights on overnight. There is a correlation between the average load and the seasons, with a significant increase in the average daily load during the winter months despite the fact that the actual light consumption pattern varied throughout the day and not all lights were on simultaneously. Consequently, the average daily load has stayed constant, varying between 450Wh and 722Wh, with a monthly average of 370Wh.
3.2.1. Array voltage sizing
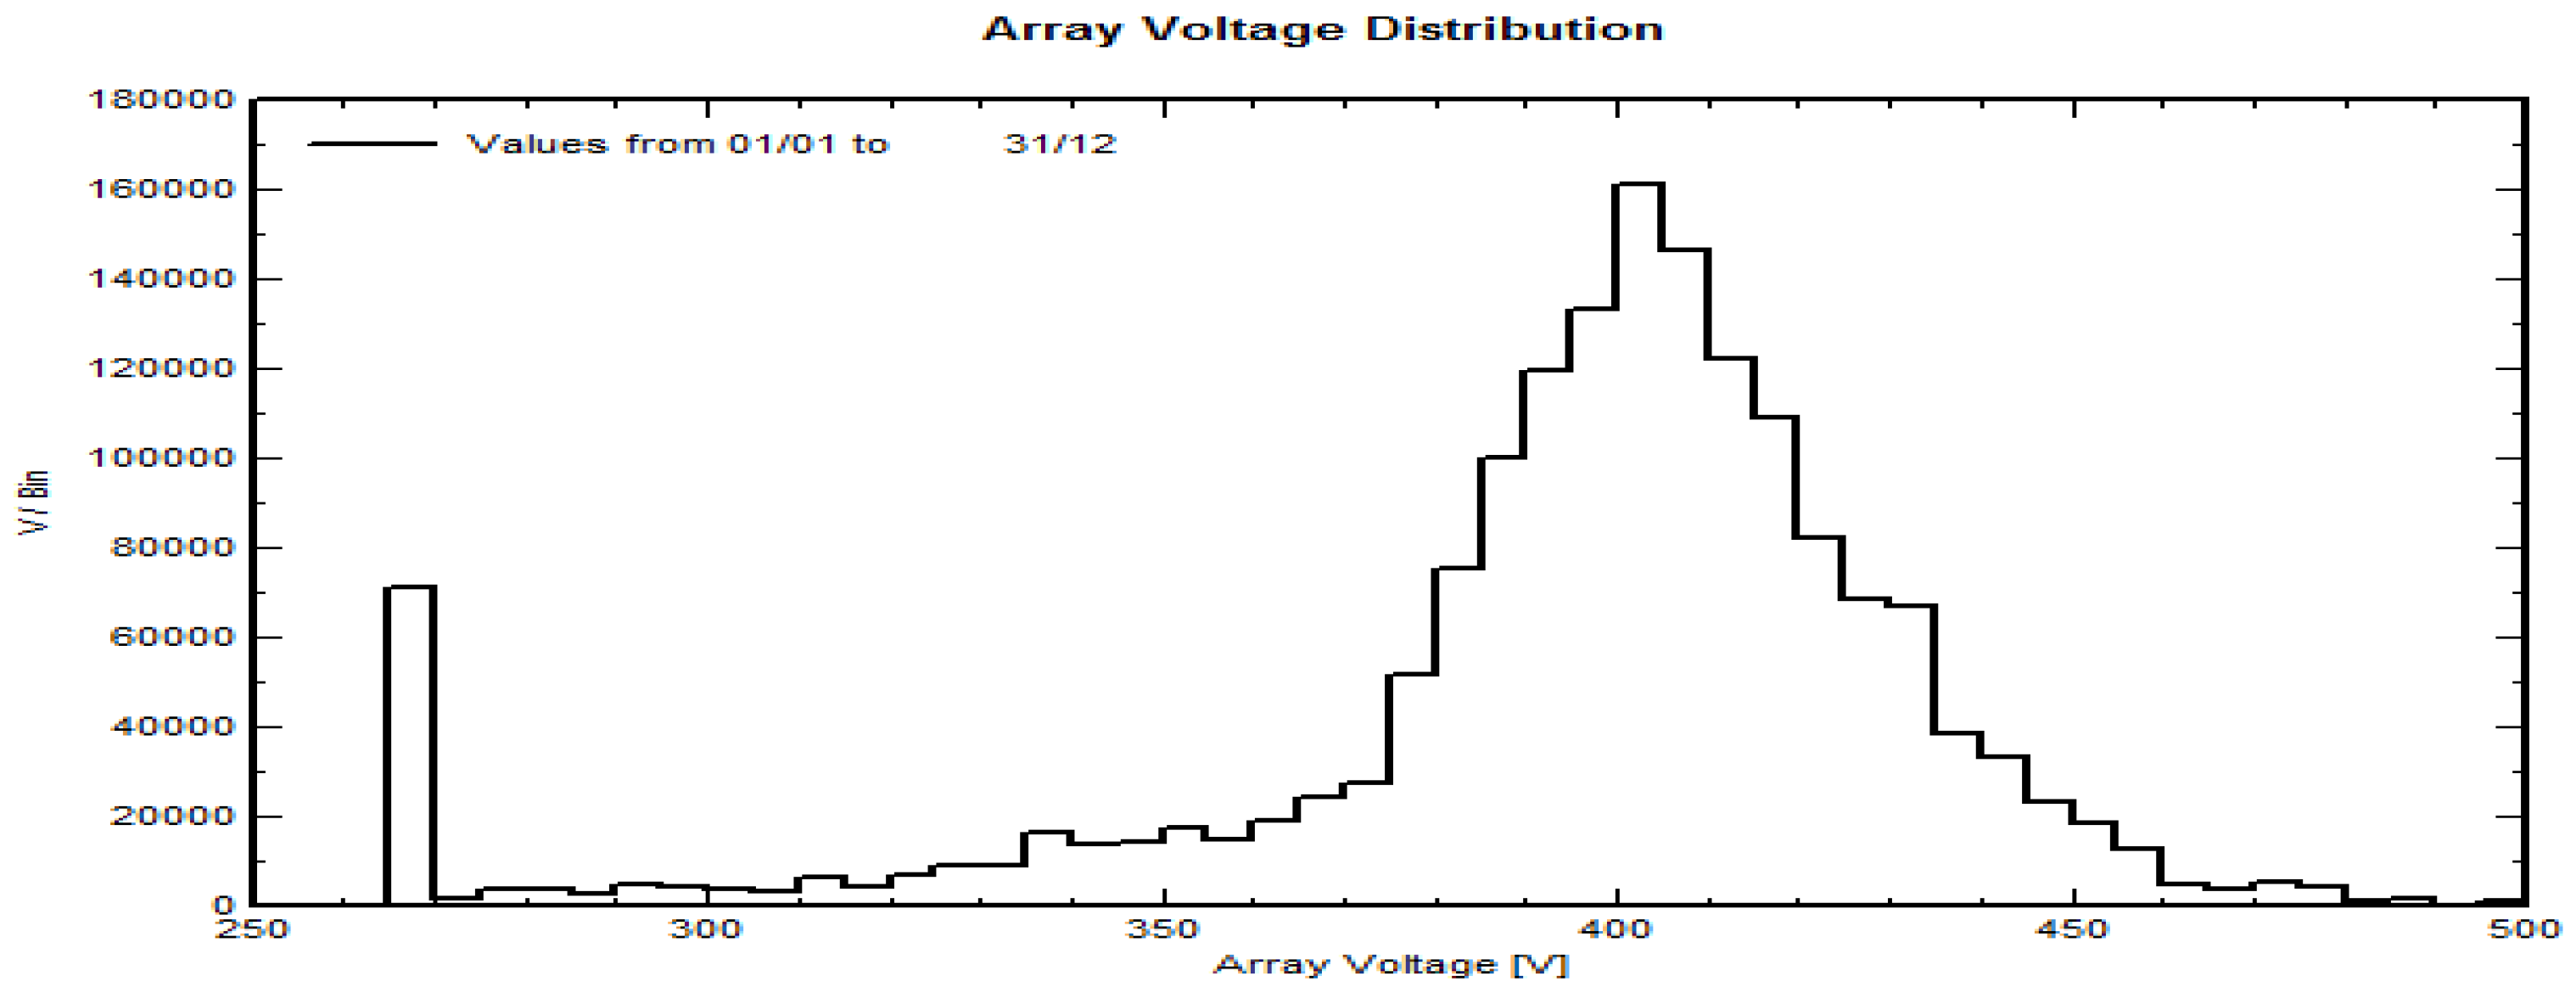
Figure 6 shows the result of sizing the voltage of the whole array, which has 10 polystirine modules. This was done by simulating the fixed input data of the pv modules, which are a fundamental part of the array. The homer was used to simulate the selected data of the module, the inverter, and the rest of the system. As you can see above, the system was designed based on the load requirements of the house in the city of Alazhari. The system and the battery were then simulated using homer. Because of this simulation, the design for the battery was found.
3.2.2. Probable Monthly Averages For The Battery Bank Voltage.
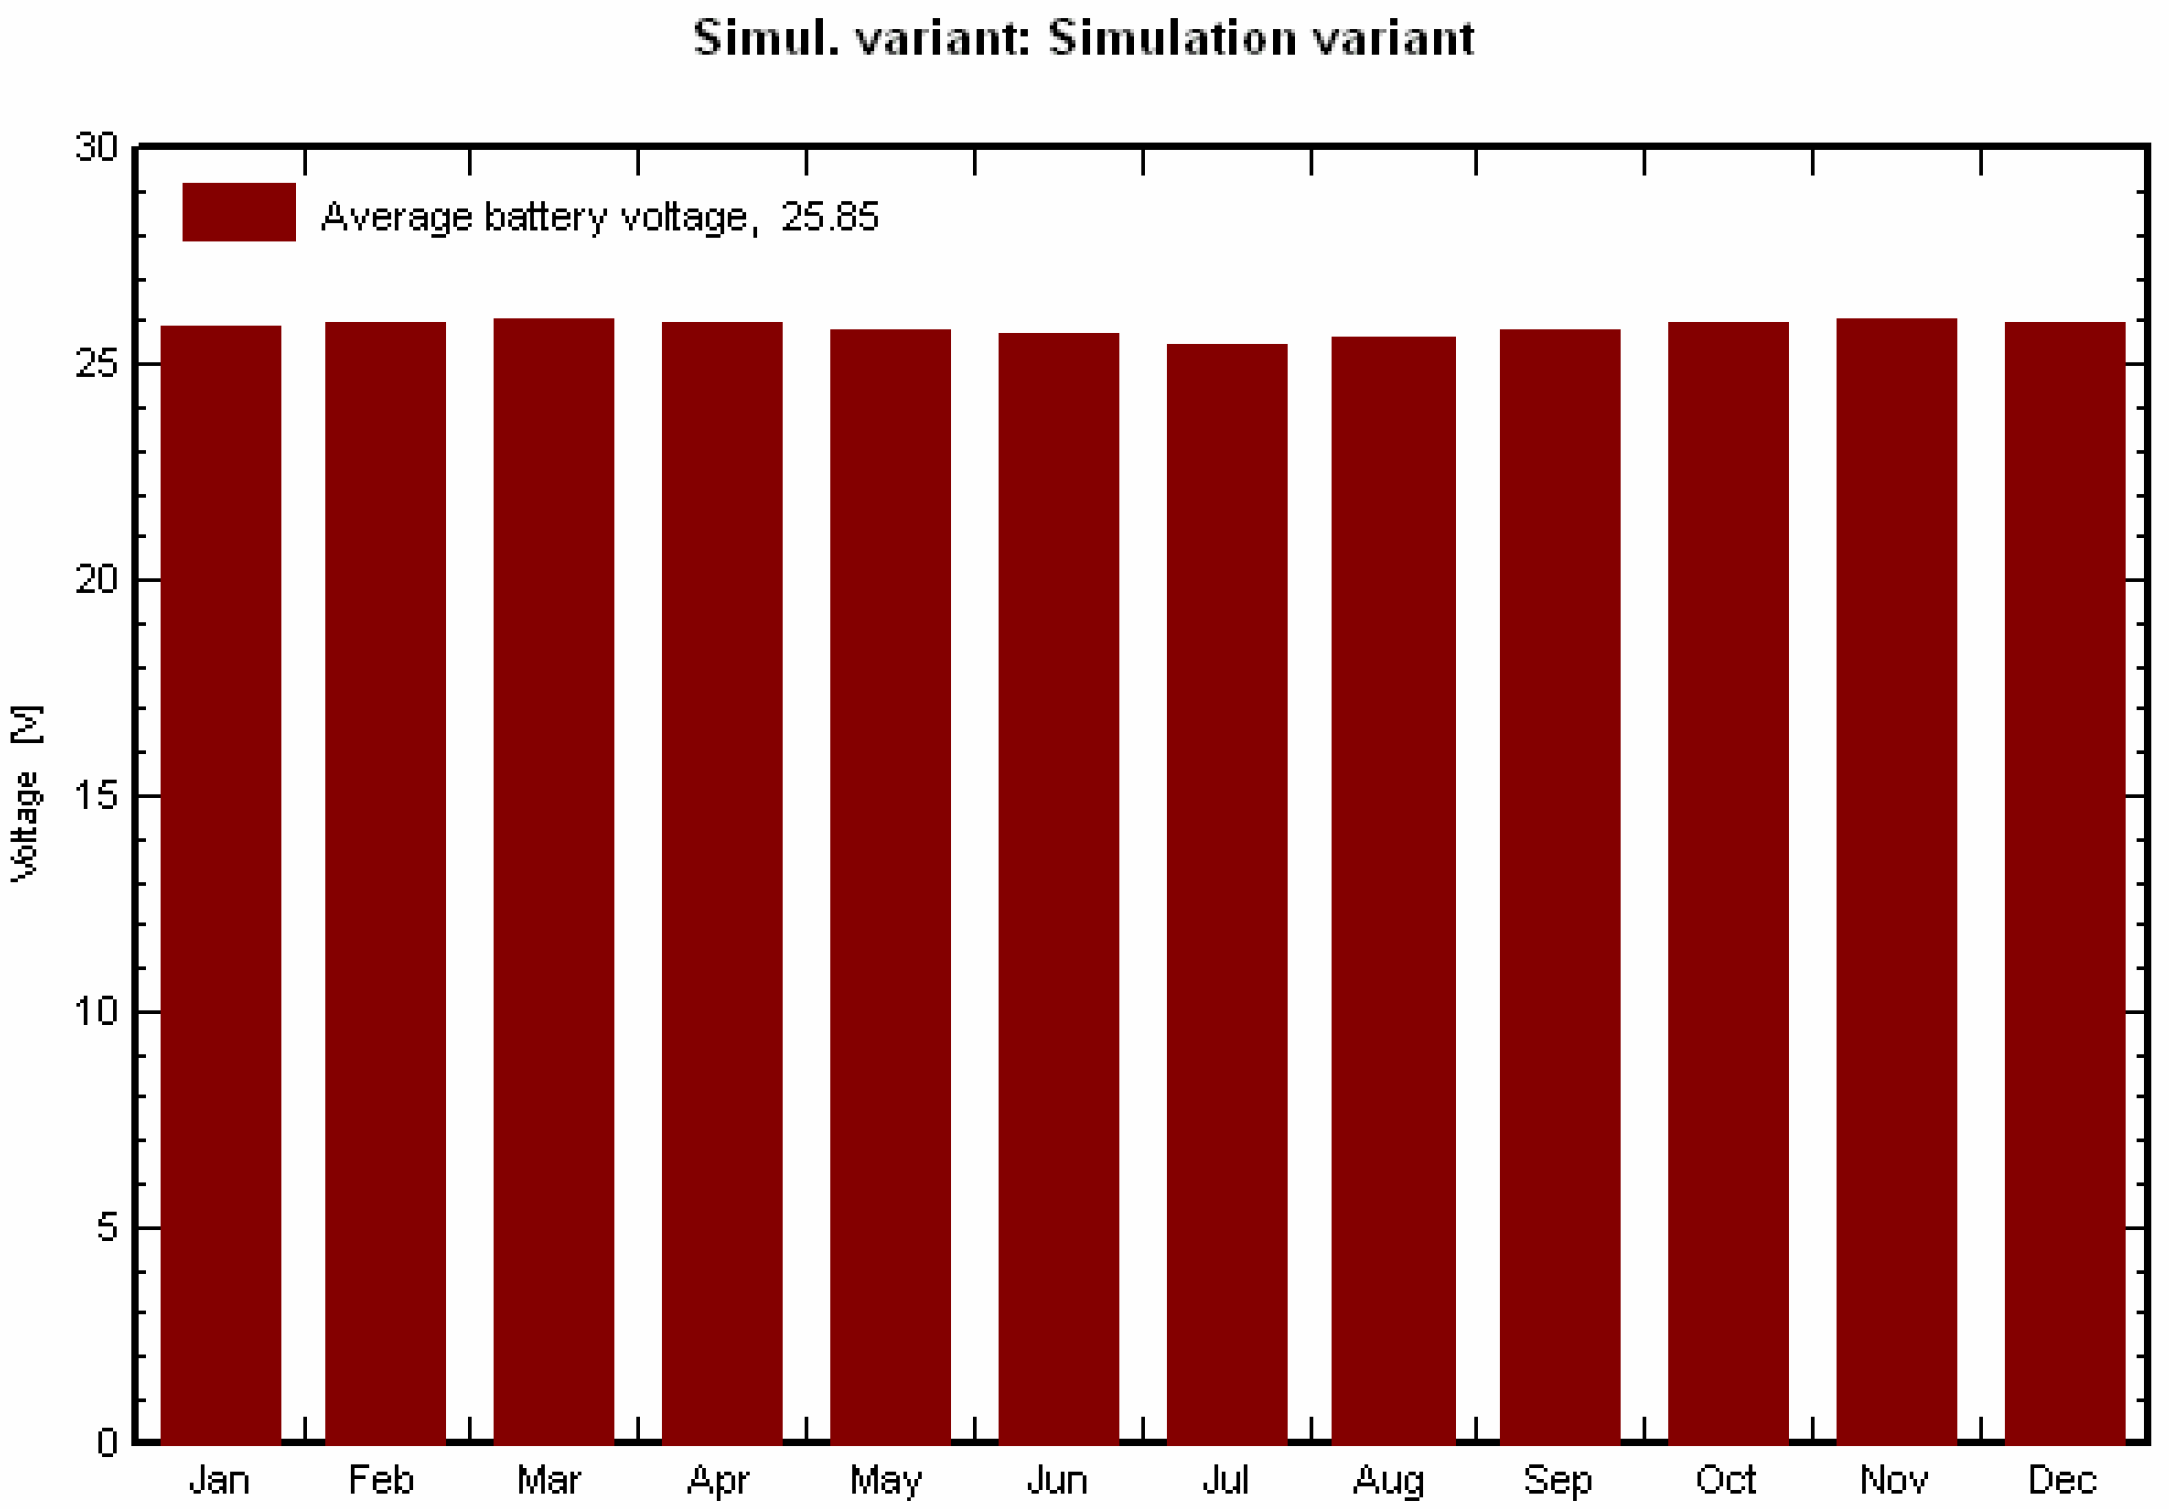
As can be seen from
Figure 7. The BB voltage is expected to remain fairly constant throughout the year. The BB voltage annual average is expected to be 25.85V.
As can be seen from
Figure 7 January is a winter month, thus the battery voltage is typically fully charged. There are no extended times when the BB’s charge level is low. On purpose, the battery voltage drops to 25.2 V on the 9th and 30th of the month. Battery function is generally good, with flight movements BB voltage of 26.2V and no extended intervals of low state of charge. The expected homer value of 25.9V, which can be seen in Table12 in 5.1, is extremely close to the annual average BB voltage. that happened The fact that the batteries are frequently full and must rely on the CC to lower the power output of the PV array shows that the PV system is too large for the current load requirements. According to[
13]), the PV system has been purposefully expanded so that it can supply all of the daily lighting needs in 4-5 years. Energy demand has risen by an anticipated 5–10% p.a. as the village population has grown (now at a rate of 2% p.a.). The simulation results contain a wealth of important information and quantify system losses at every level, making it possible to pinpoint system design flaws. By contrasting the performances offered under realistic circumstances over the course of an entire year, this should lead to a thorough comparison between various technical solutions that might be used. Inverter and grid injection losses have been put in place. When the transformer is exterior, they could include wire losses. Exhaustive loss diagram
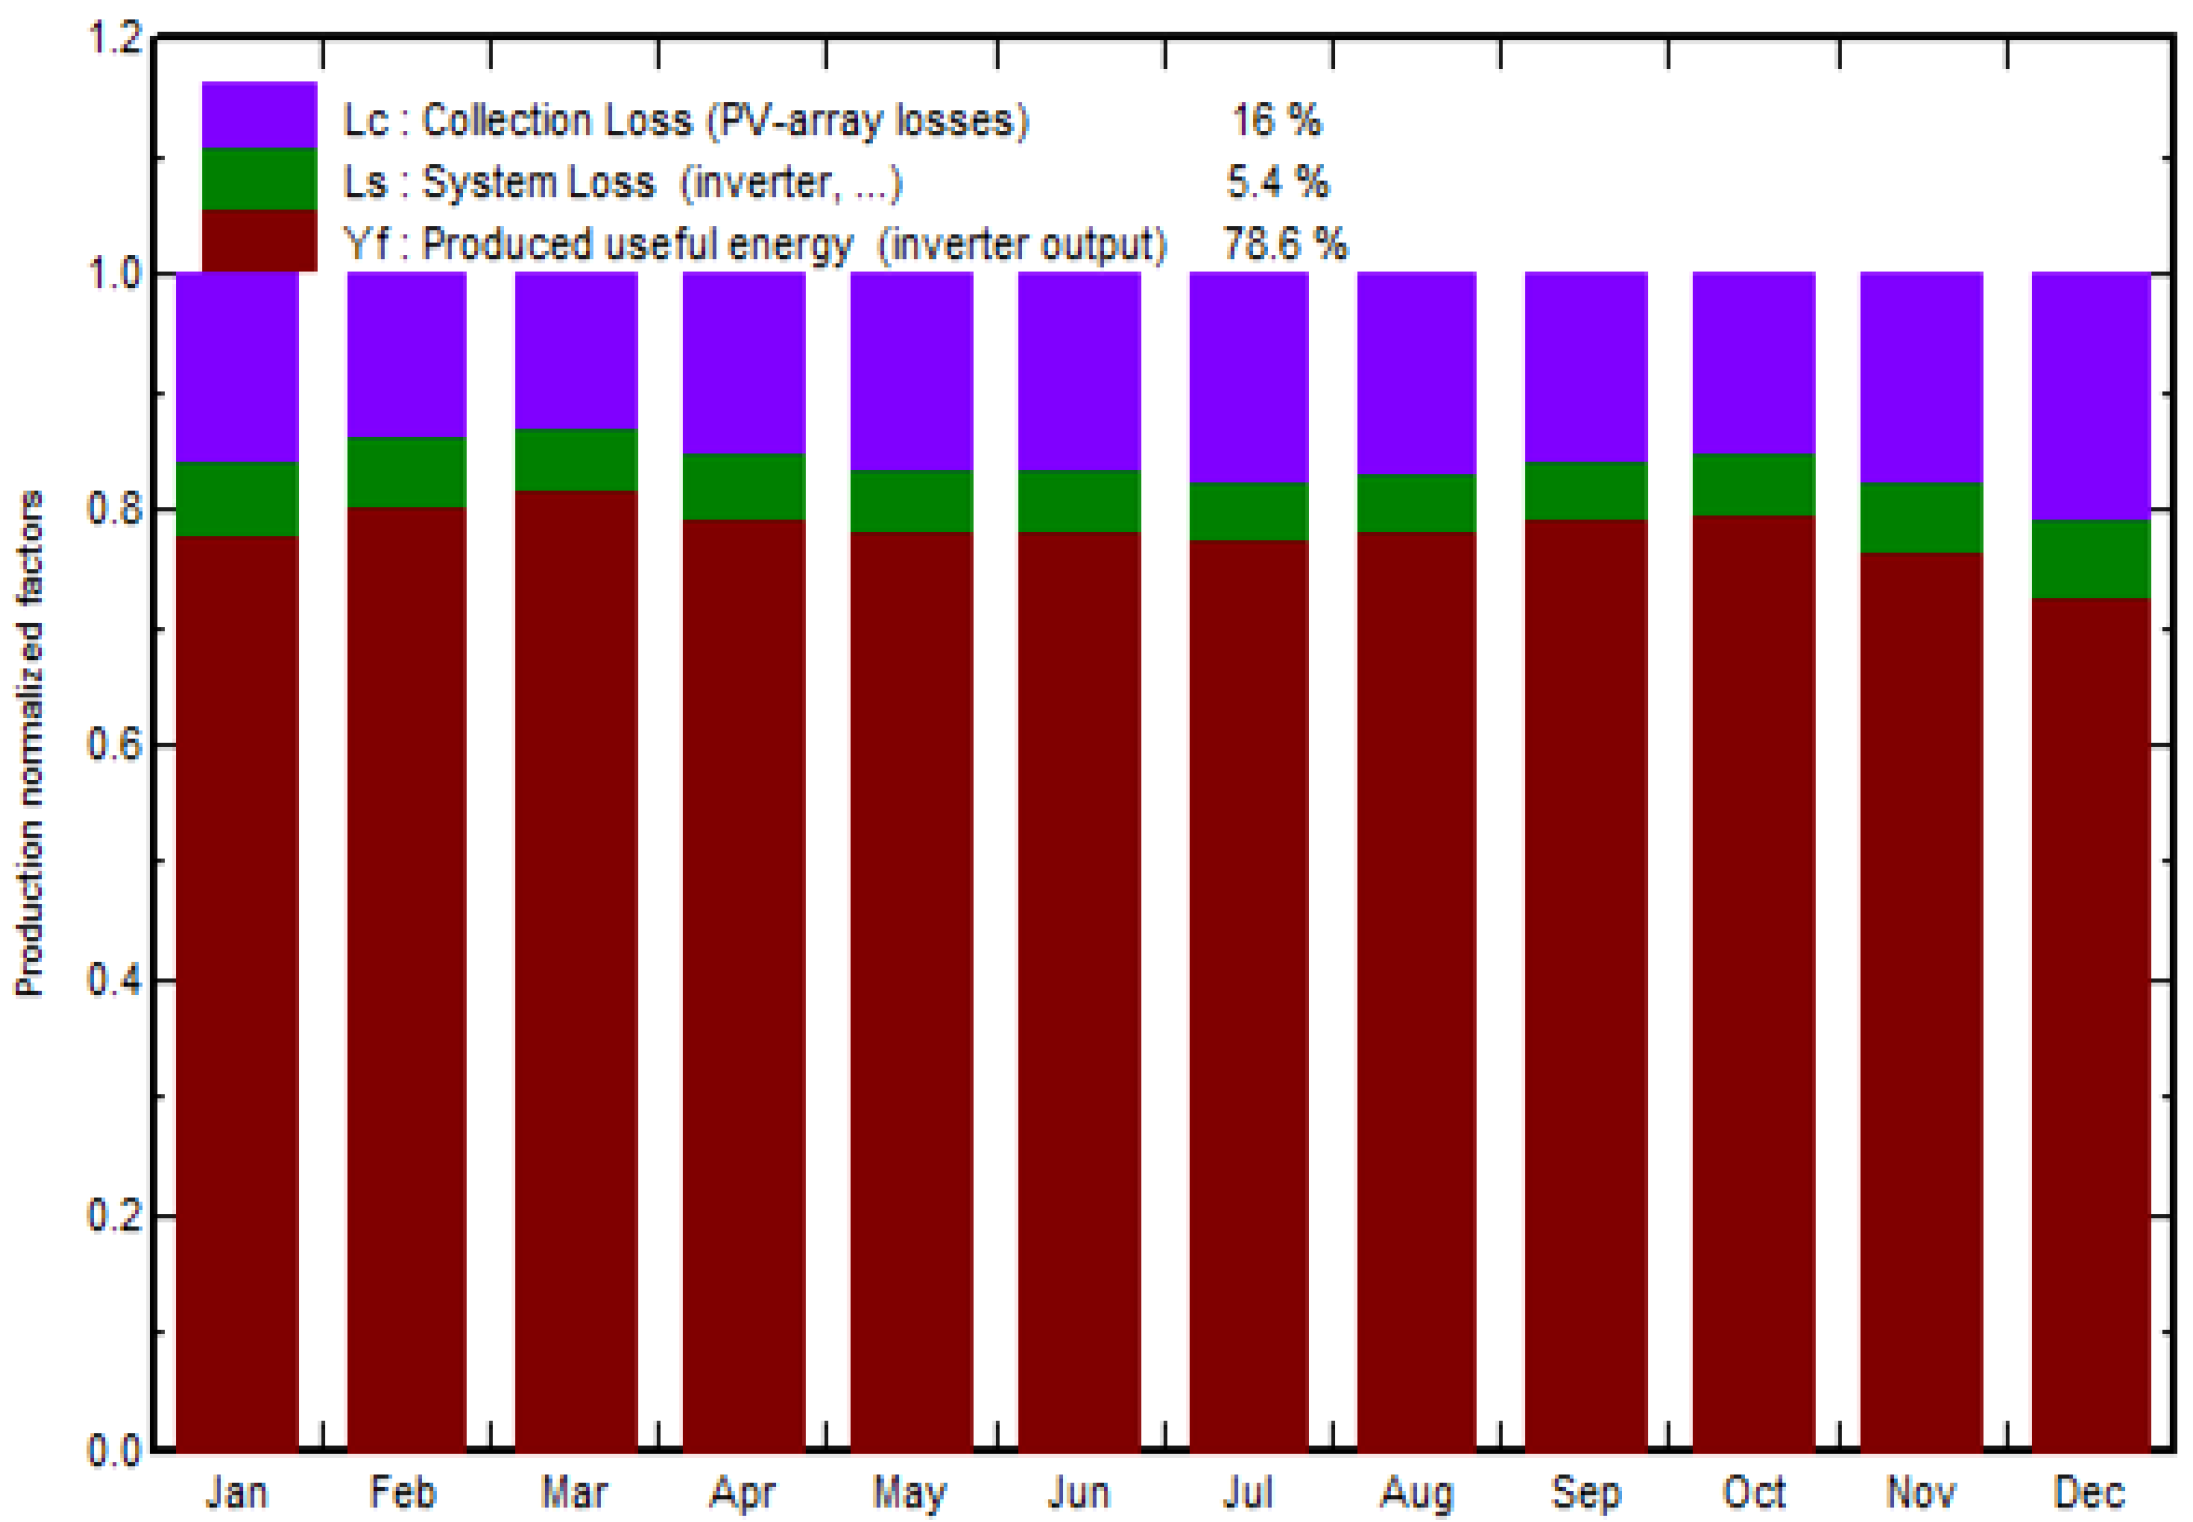
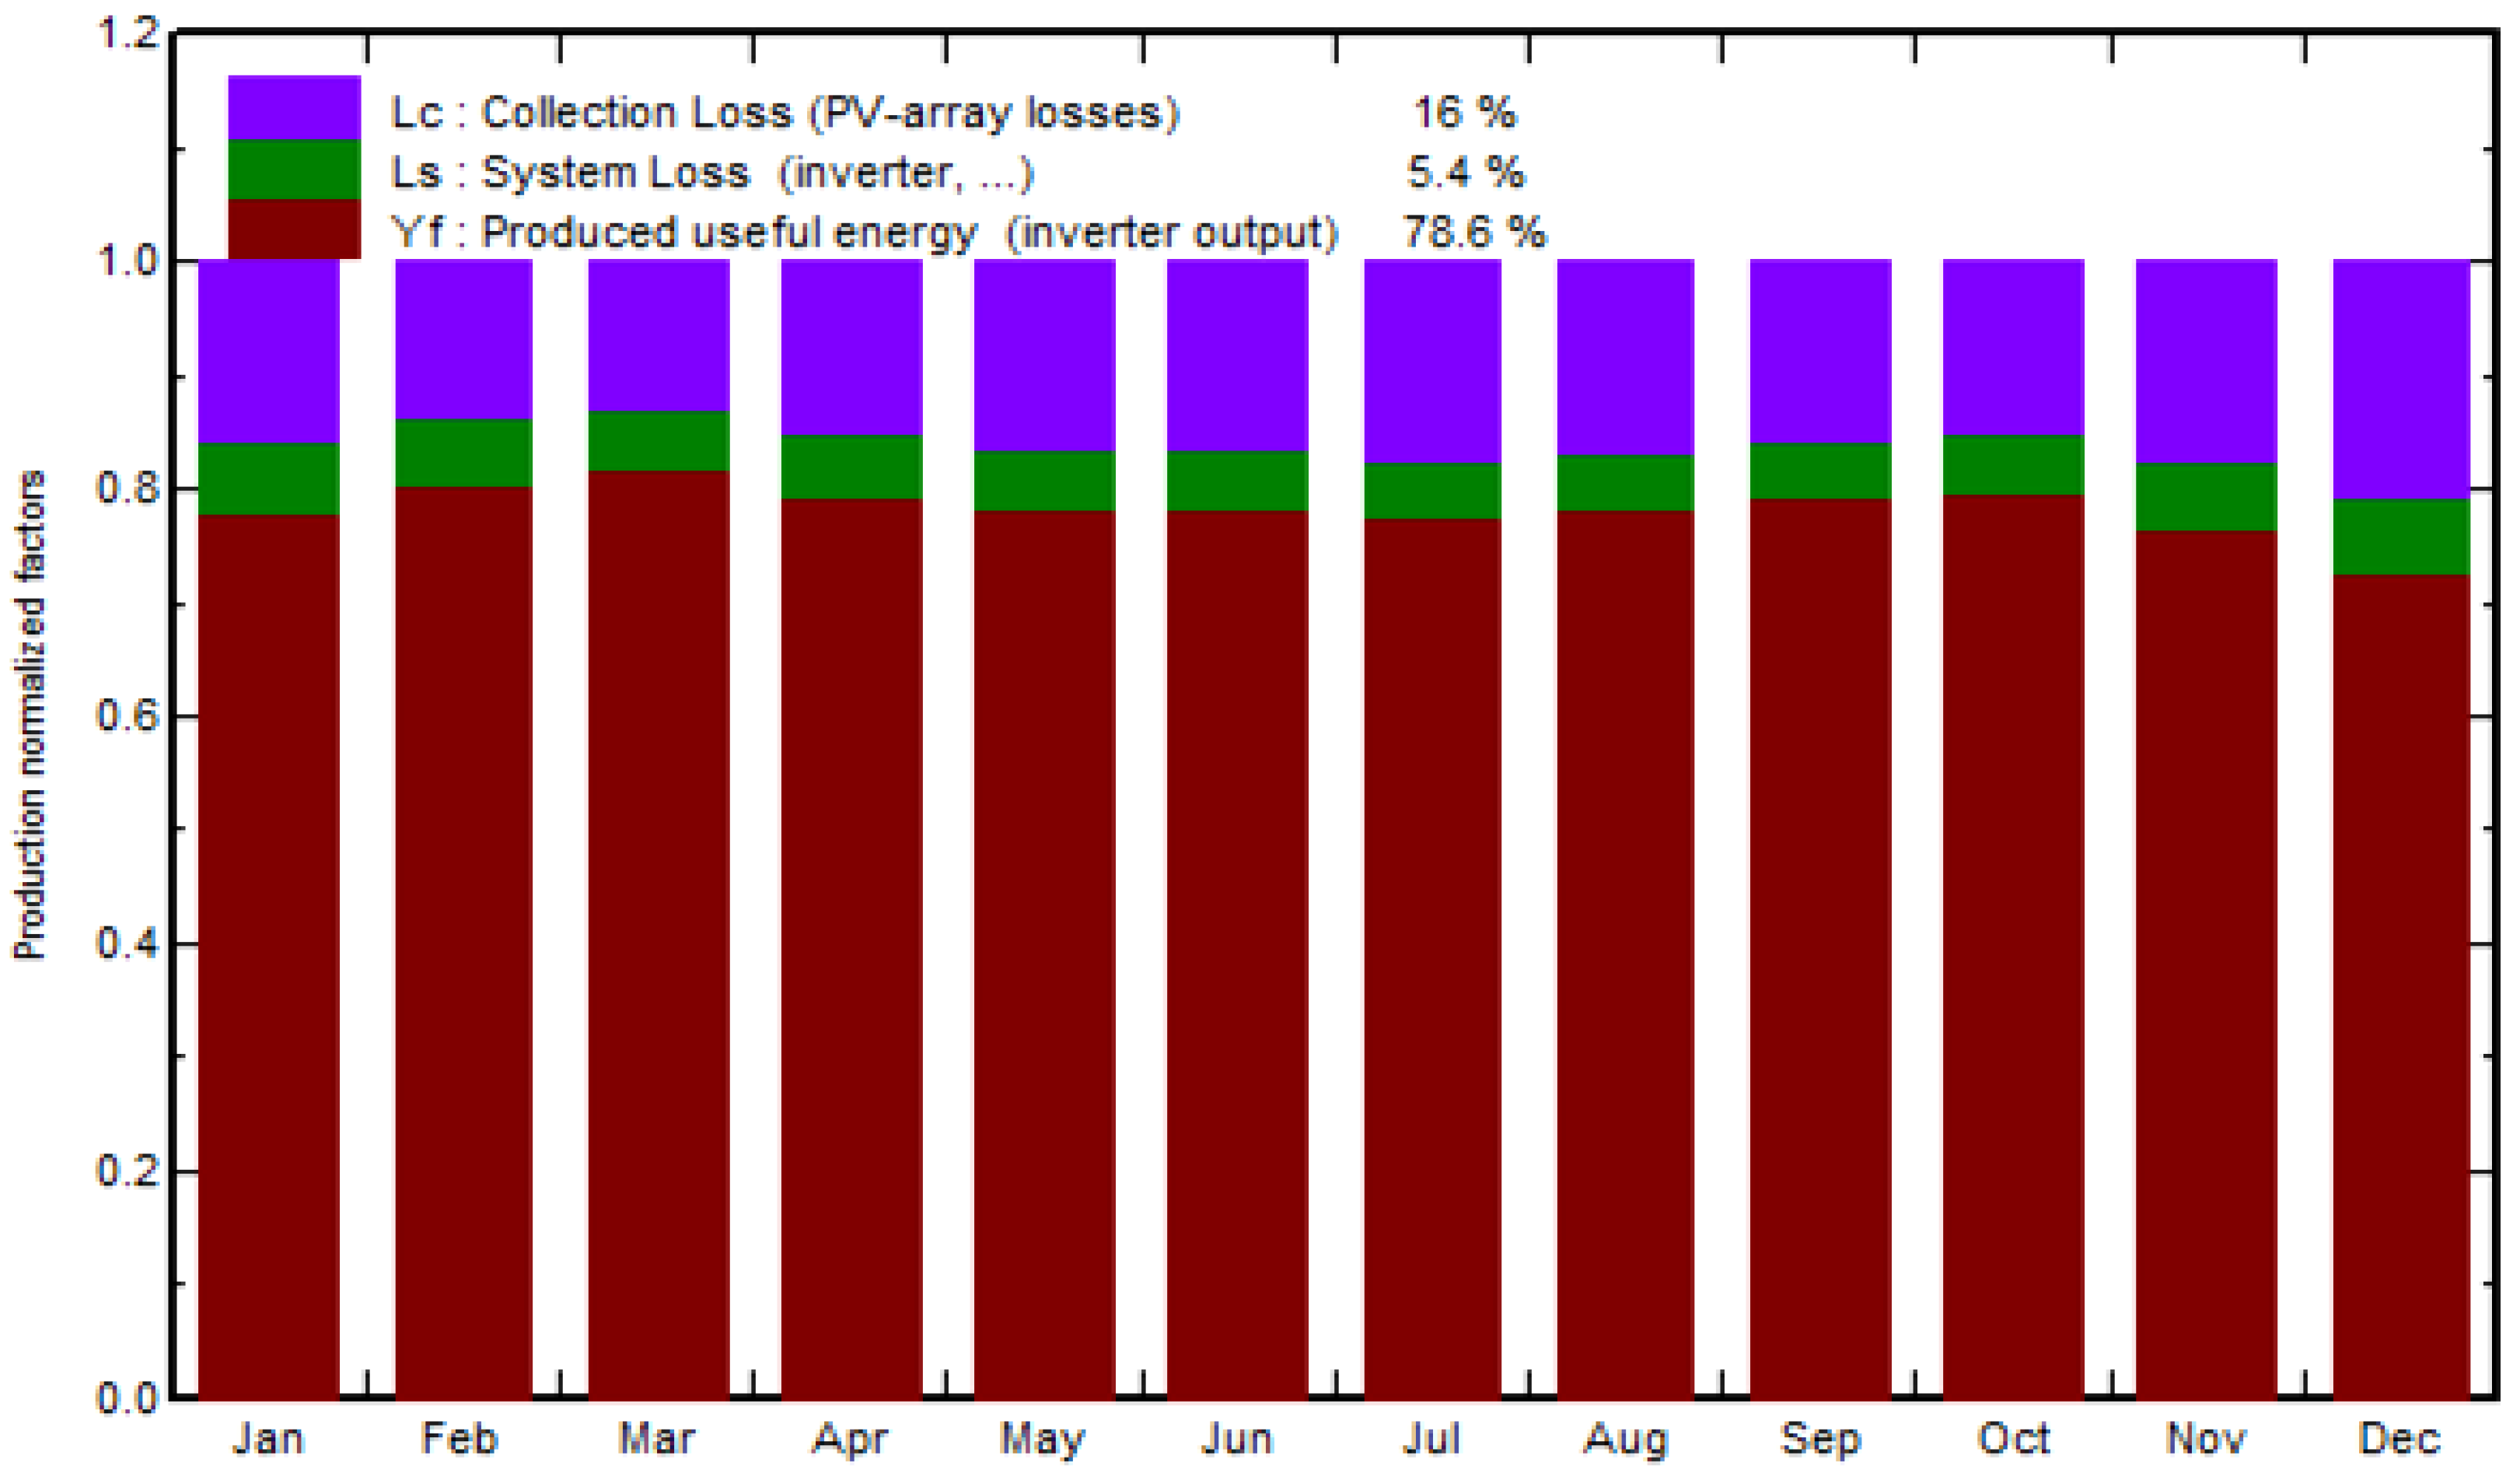
Figure 4.22, which quantifies all loss effects, provides a thorough understanding of the design quality of the PV system. Losses on each subsystem can be aggregated or enlarged with specific contributions, and the overall loss rate was 78.6%. As shown in
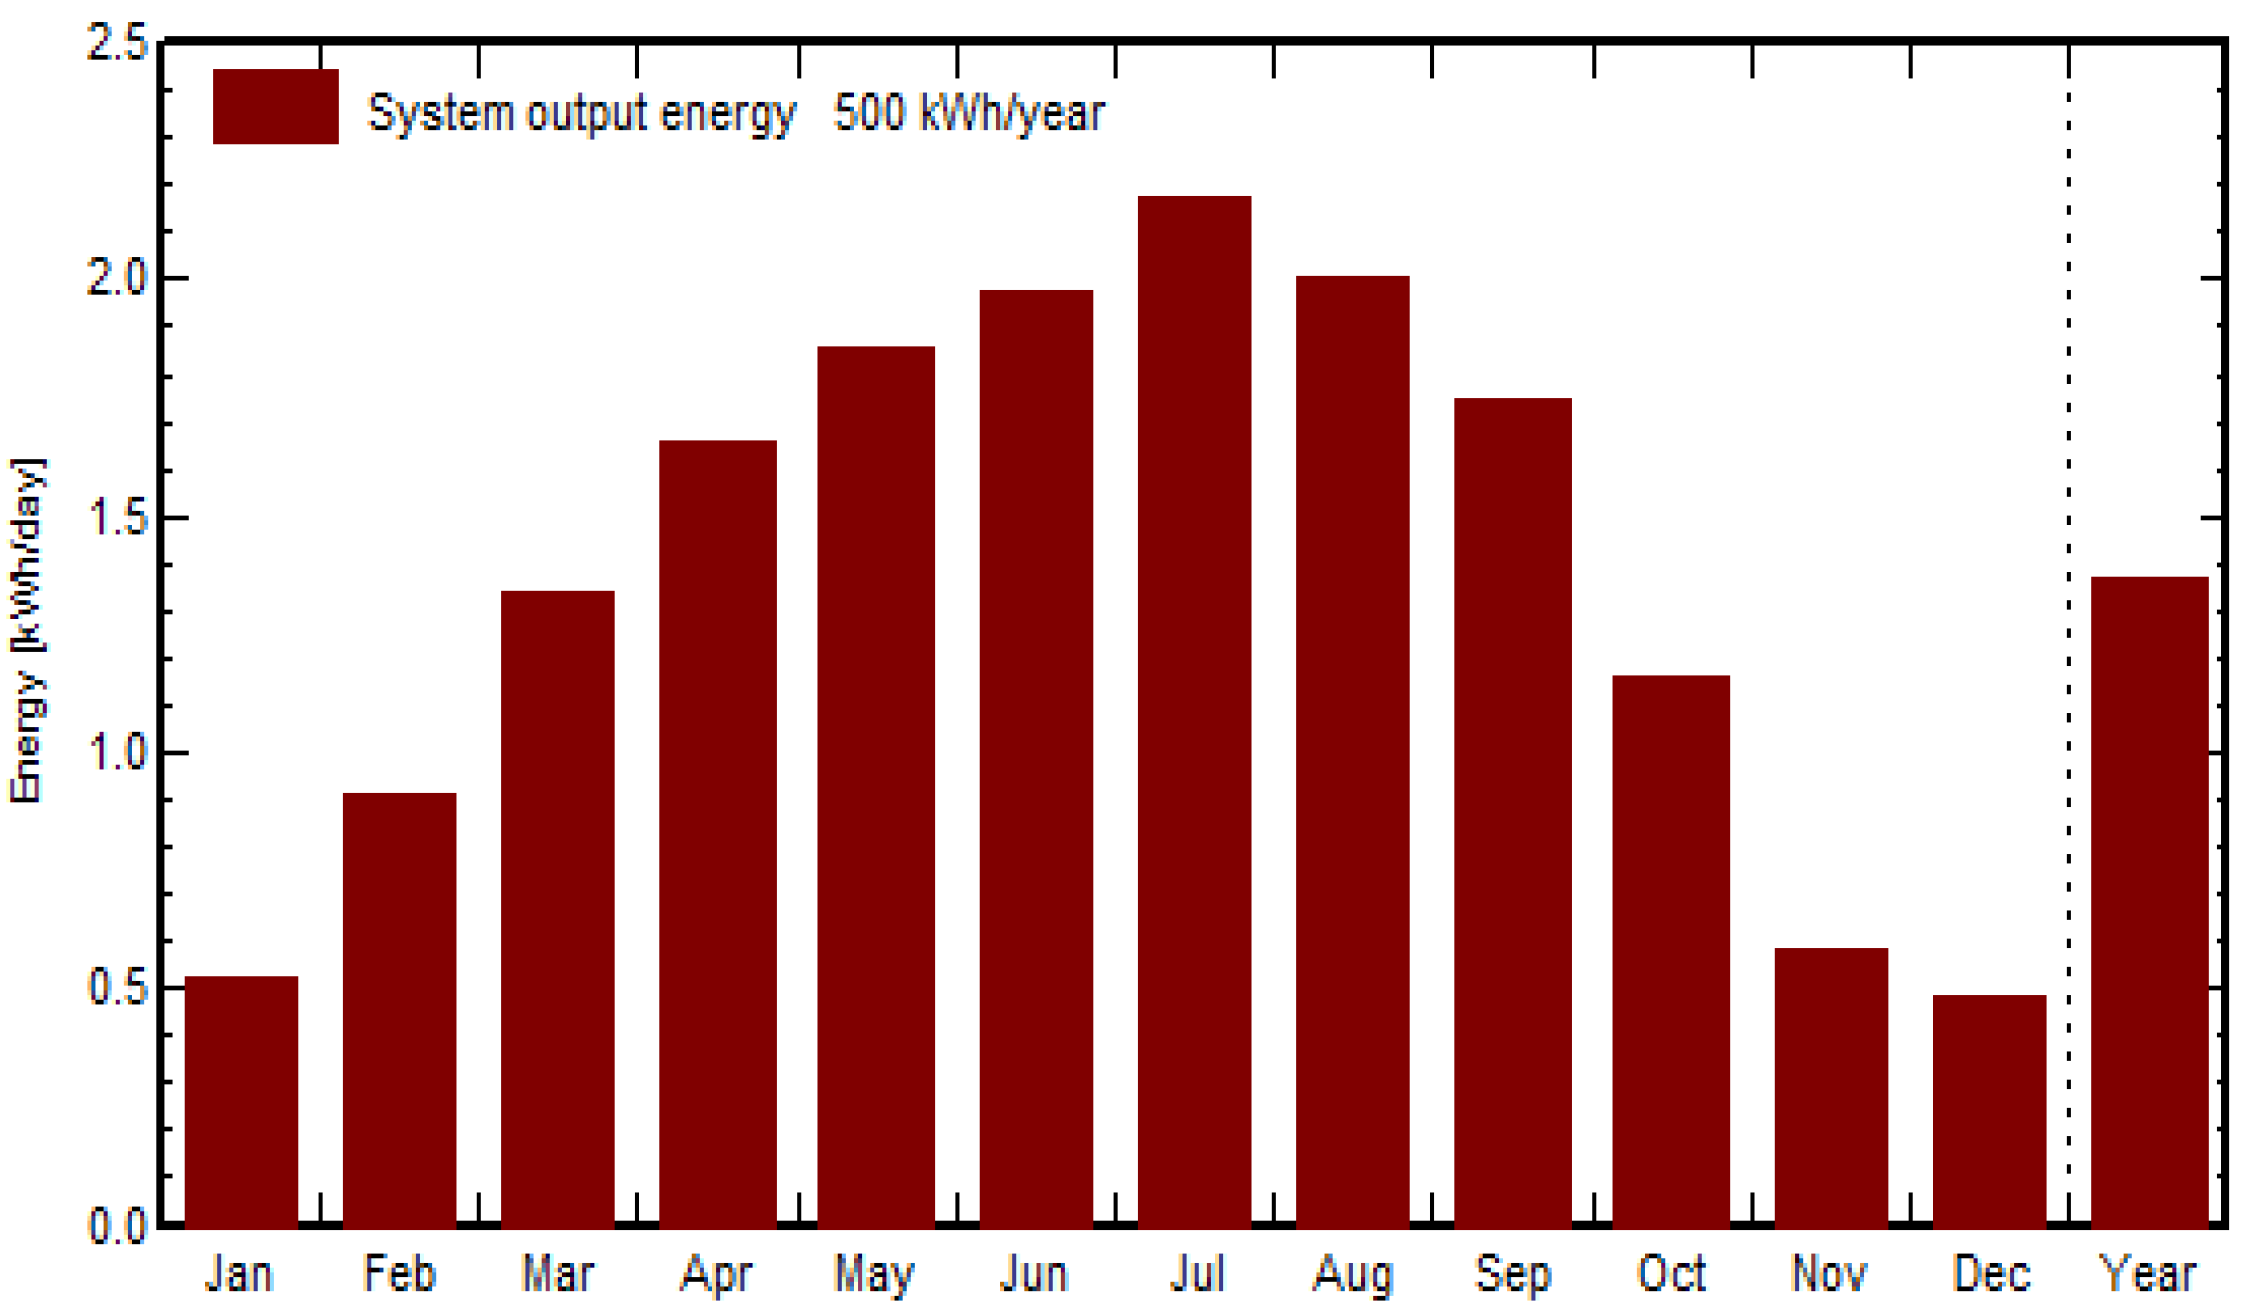
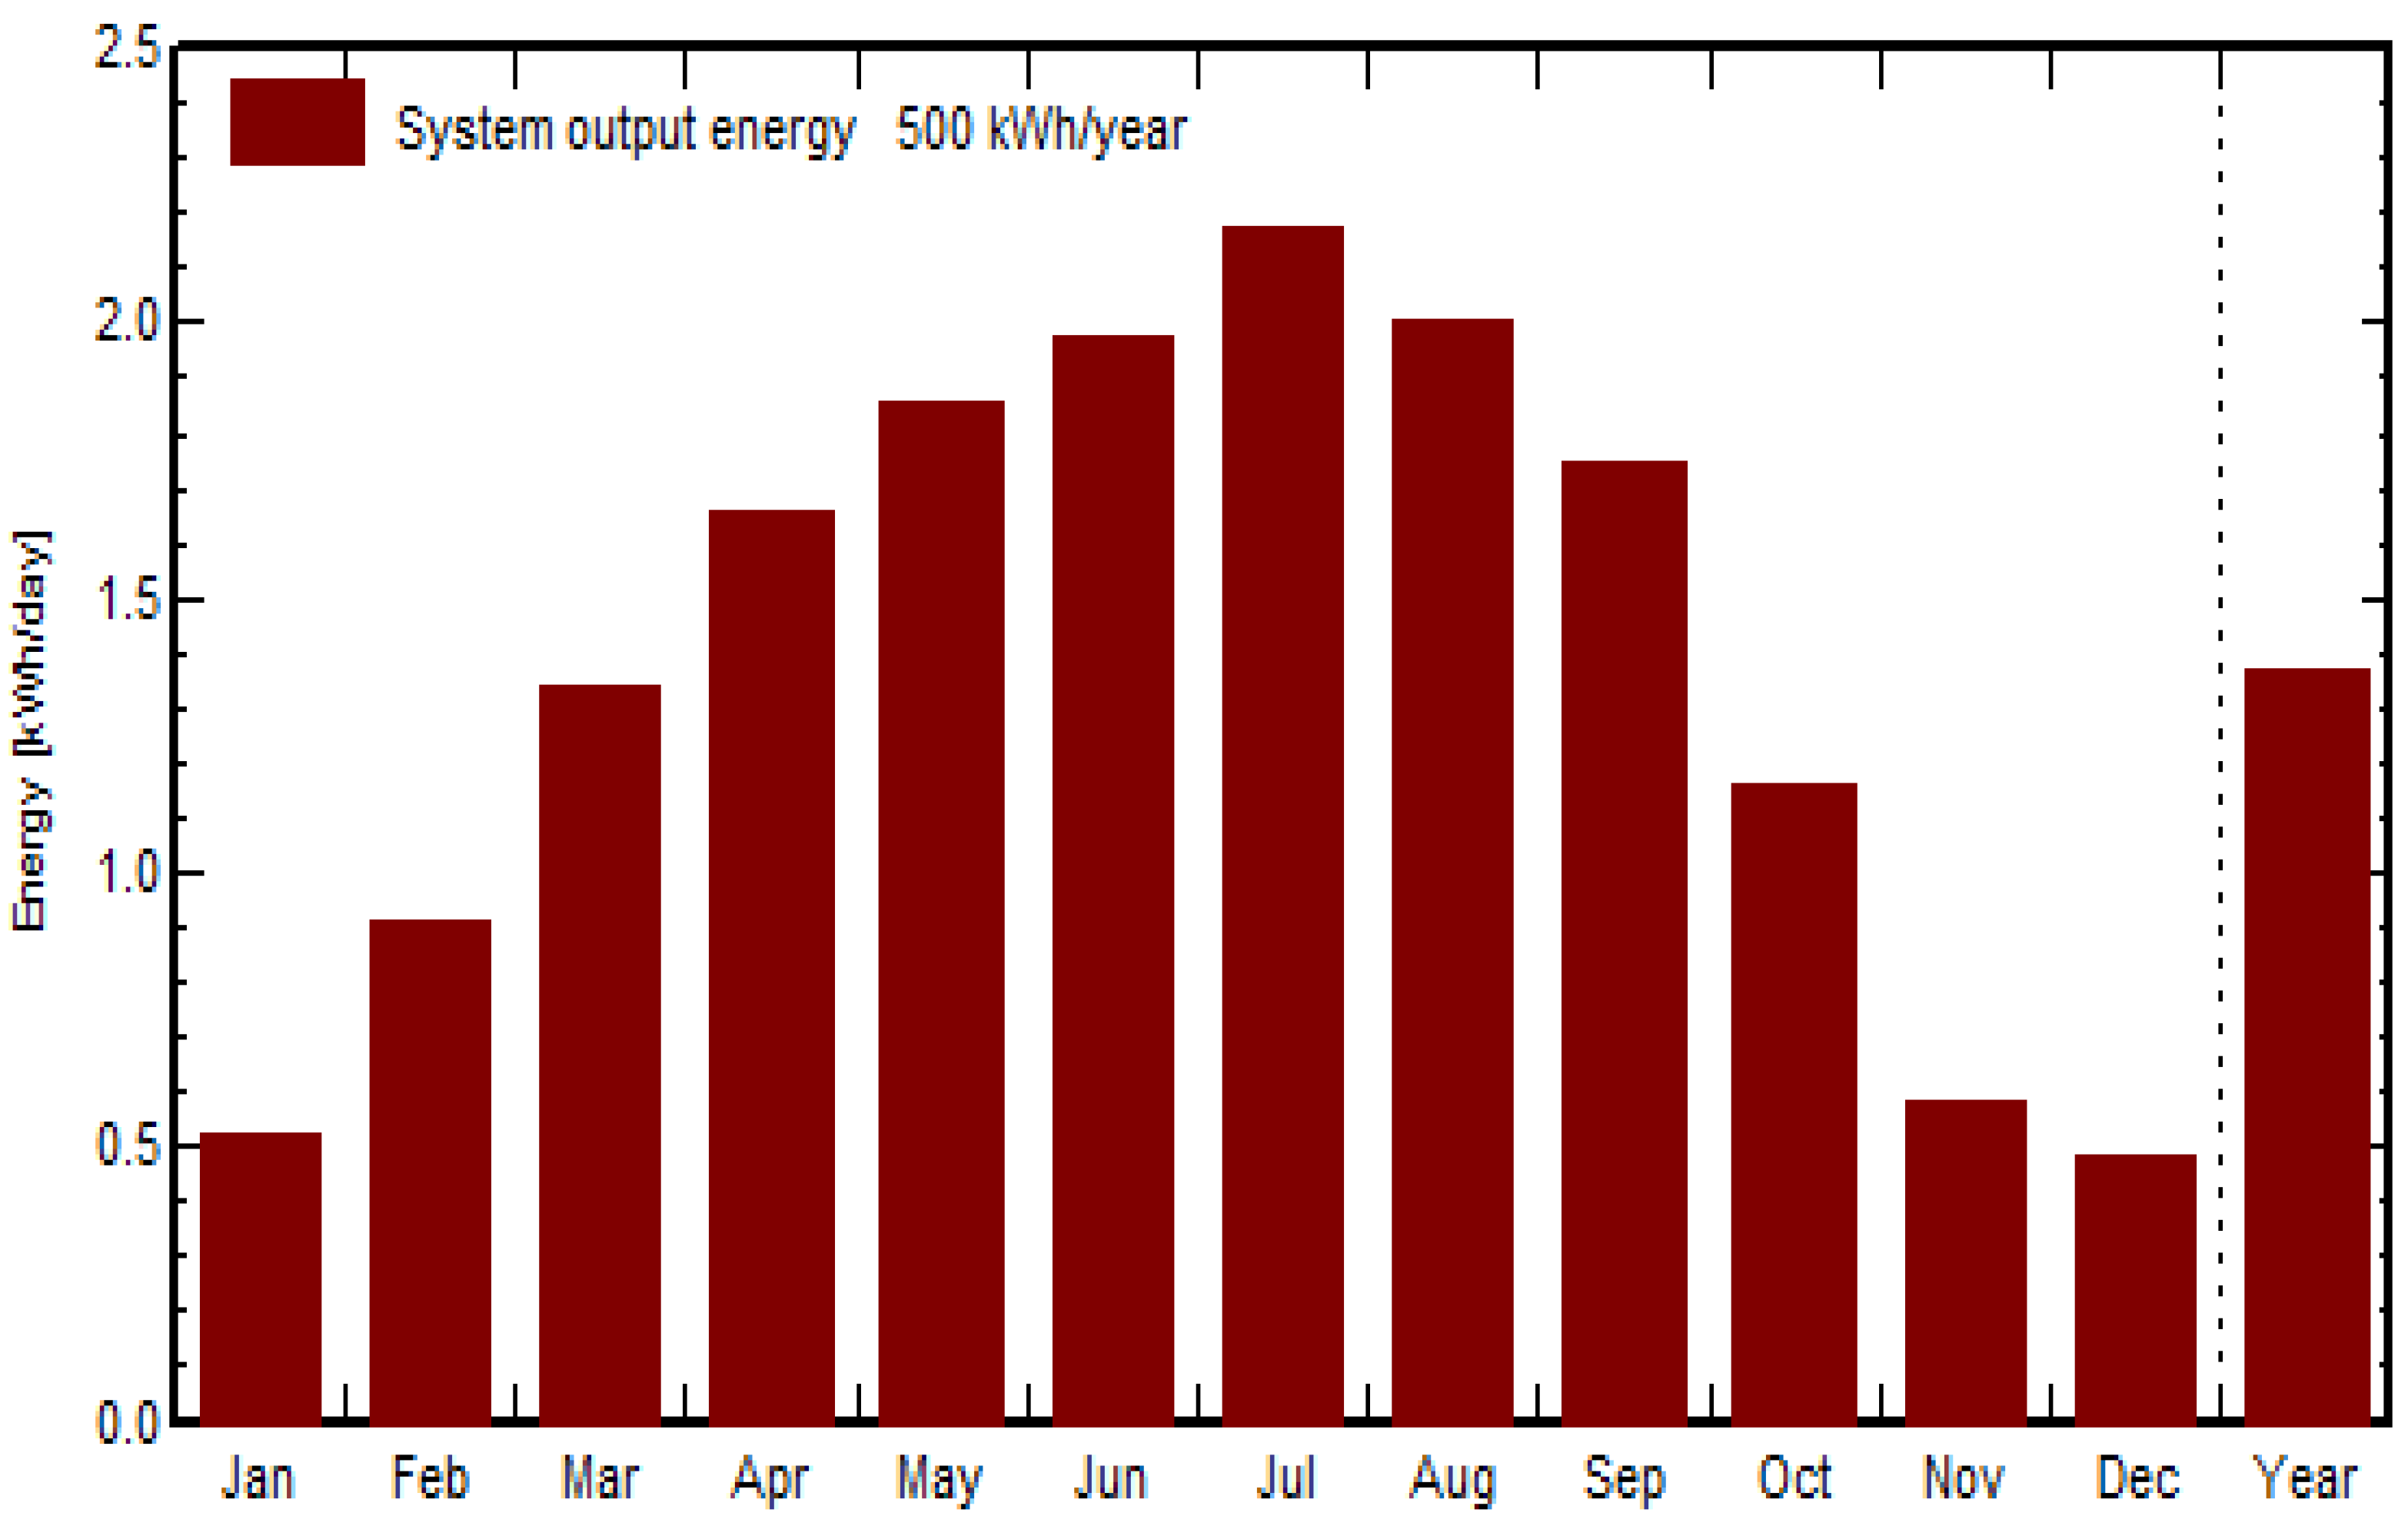
Figure 4.23, the yearly PV system energy output ranges from 0.5 to 2.17 kWh/kWp, with an average annual performance ratio of 78.6% (1.3 kWh/kWp).
Figure 4.22’s performance ratio illustrates how well-built a PV system is, and a value of 78.6% is high-quality. According to Goetzberger & Hoffmann (2005), the typical value of the performance ratio is between 60 and 80%. This demonstrates that due to variables like conduction losses, contact losses, the module and inverter efficiency factor, component faults, etc., around 21.3% of the solar energy that was present during the studied period was not transformed into useful energy.
3.2.3. Expected PV Output
The annual average production of the 300Wp PV array is anticipated to be 343,3 kWh. This equals 940.5Wh/day, or 343.3/365 days. As expected, the PV output does not coincide with the global sun radiation on the tracking axis. This could imply that the batteries are frequently full, reducing the PV.
Figure 8. depicts the average daily production (Wh) of the 300Wp PV array for each month, as well as the monthly worldwide sun radiation values on the POA.
Figure 6-70 makes this outcome crystal obvious.
Figure 8.
Normalized and Loss Factor.
Figure 8.
Normalized and Loss Factor.
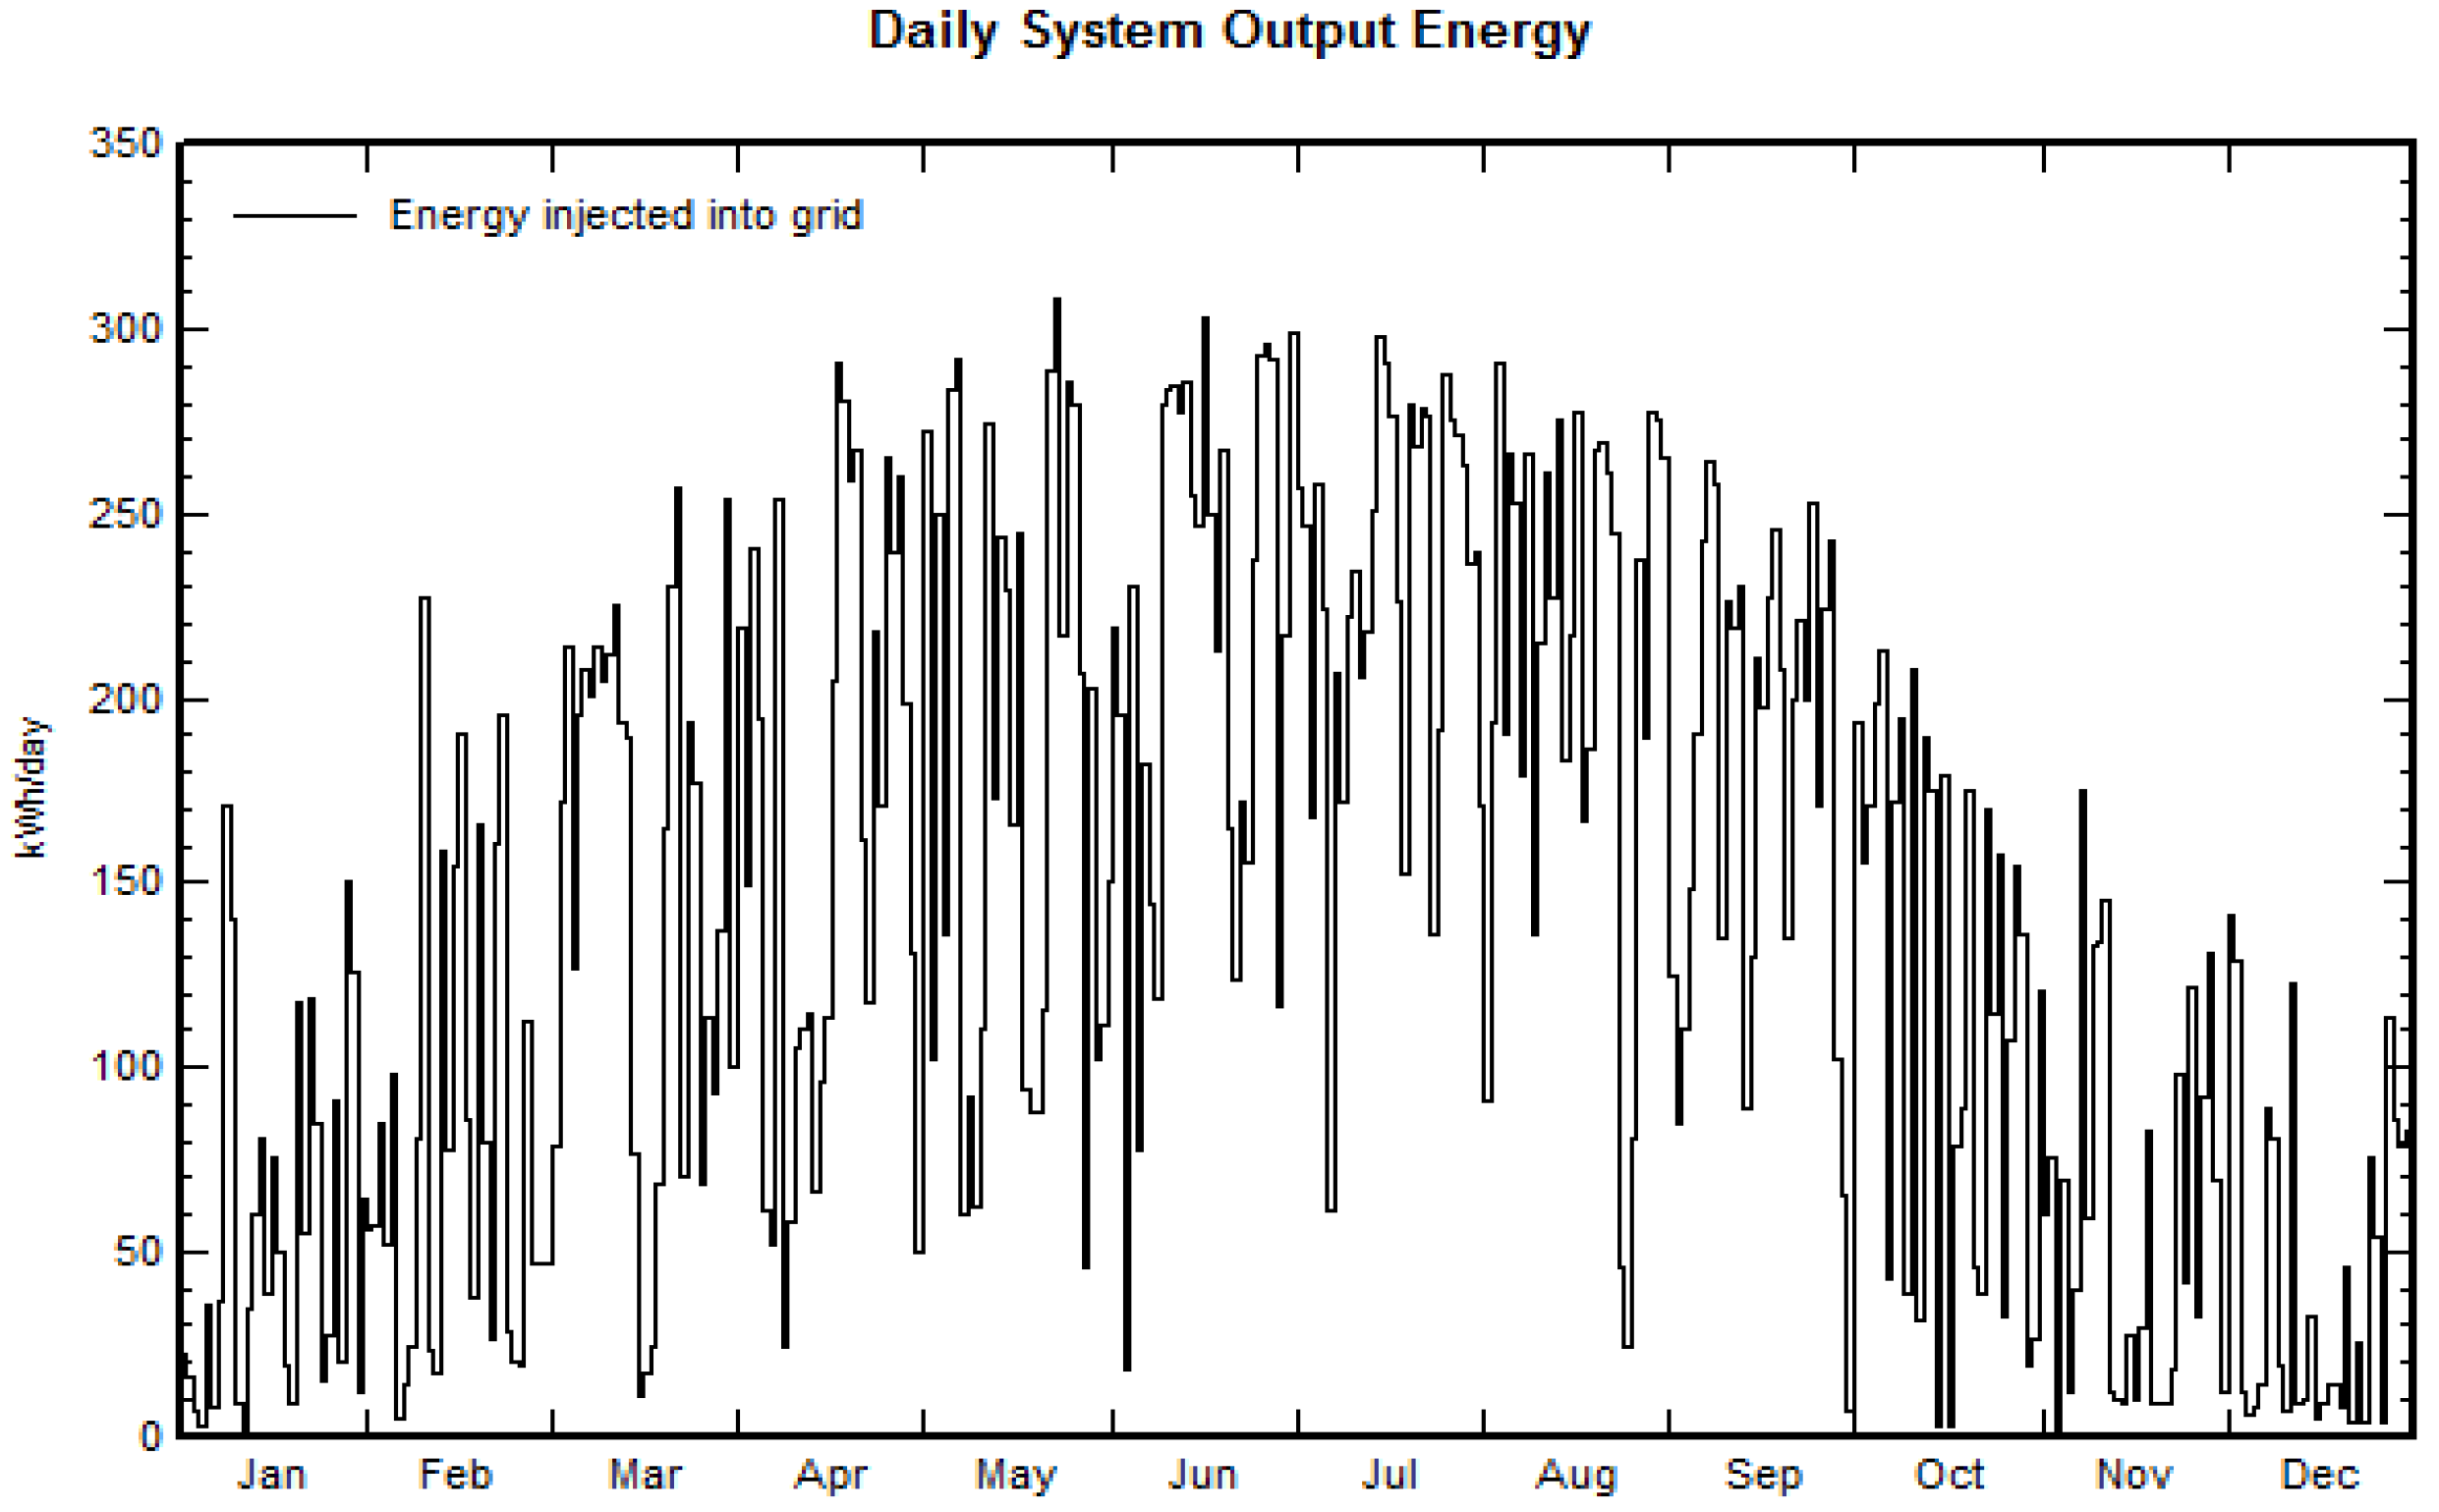
Figure 9.
System Output Energy.
Figure 9.
System Output Energy.
3.2.3. Size Inverter
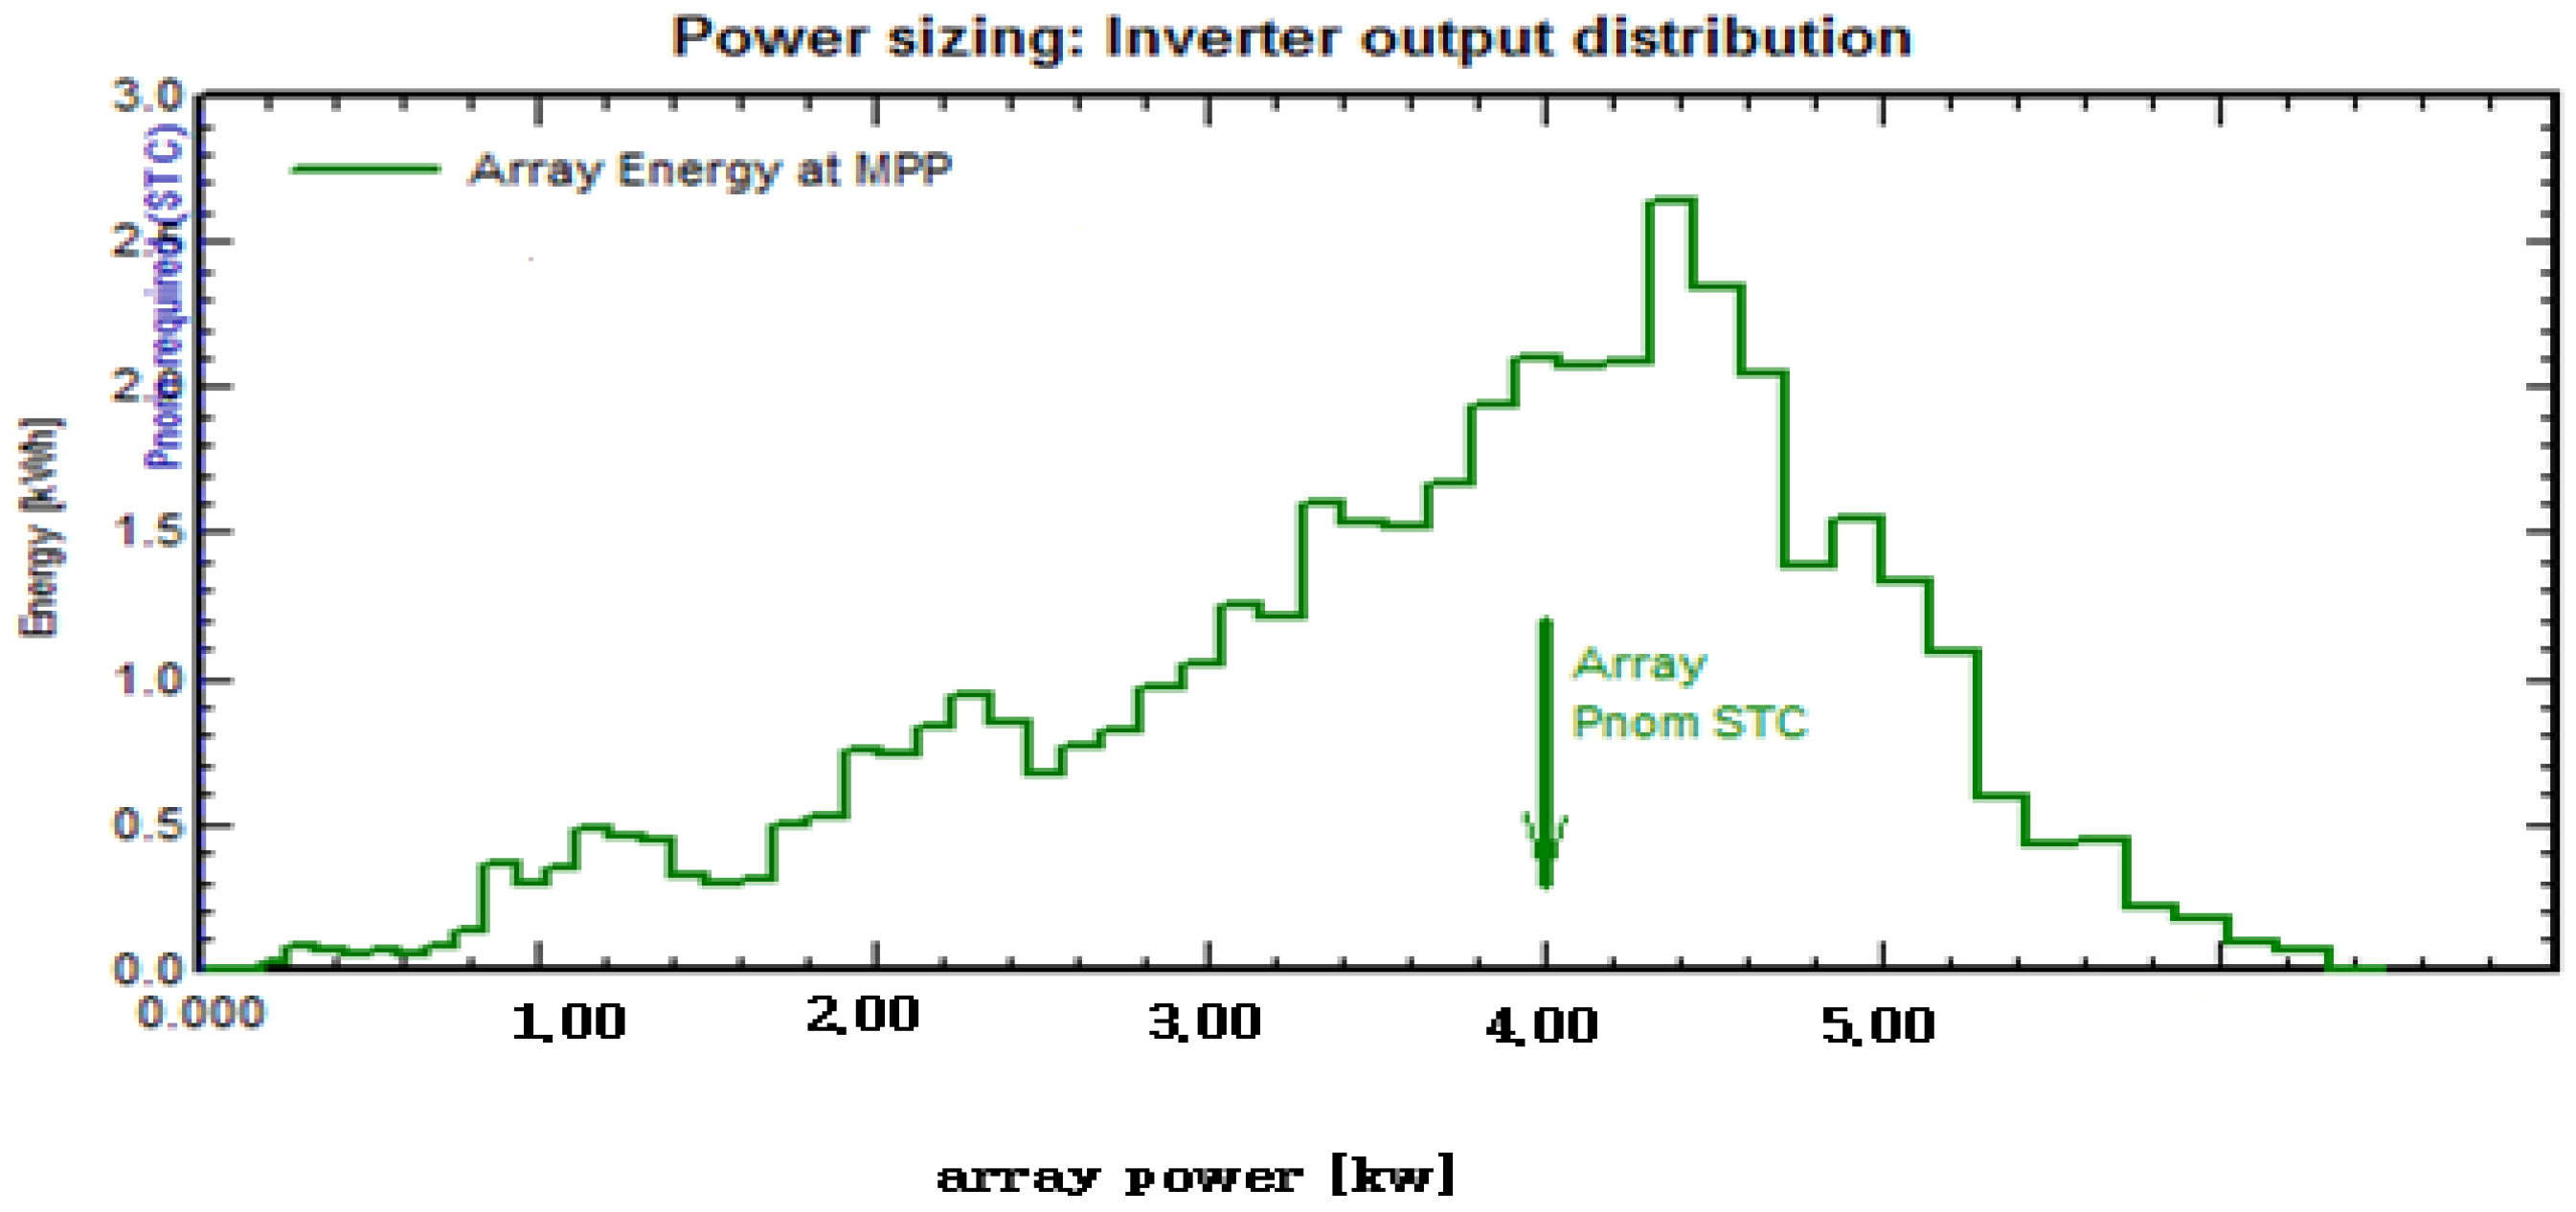
As a result of using Homer, it was discovered that as energy increased in KW/H, the array power increased systematically as shown in
Figure 9 . However, as energy increased to 2.5 KW/H with 0.025 KW, the distribution of output power decreased to 2.00 KW/H with 0.27 KW, and finally to 0.04 KW/H with 0.04 KW. When the energy increased more than the inverter’s design anticipated, the result was consistent with the inverter’s ability to limit the array’s power at 0.030. [23] as seen in the figure below
Figure 9.
inverter output distribution.
Figure 9.
inverter output distribution.
The simulation for the module in which we utilized the average annual energy output results in a maximum average power generation of 25 kw/m2. The average minimum power generated, which was measured in May, June, July, and January, was 20 kw/m2. It was reported in February. This was the outcome of a real experiment conducted by the researcher, and the outcome of a simulation of the overall system energy production as electrical power was 7600 kWh/year. [21].
3.2.4. Average daily PV array energy output values for each month.
The average amount of power that a 300Wp PV array makes in a year is 1260Wh/day. PV array power follows the same seasonal pattern as GCS global solar radiation, with the most power coming from PV arrays in April, May, October, and November, which are in the middle of the season. General input menu of the homer software for generating weather data based on the location of Khartoum. The average values from the last 10 years will be used to figure out the hourly values. The high horizon and inclination will also be taken into account.
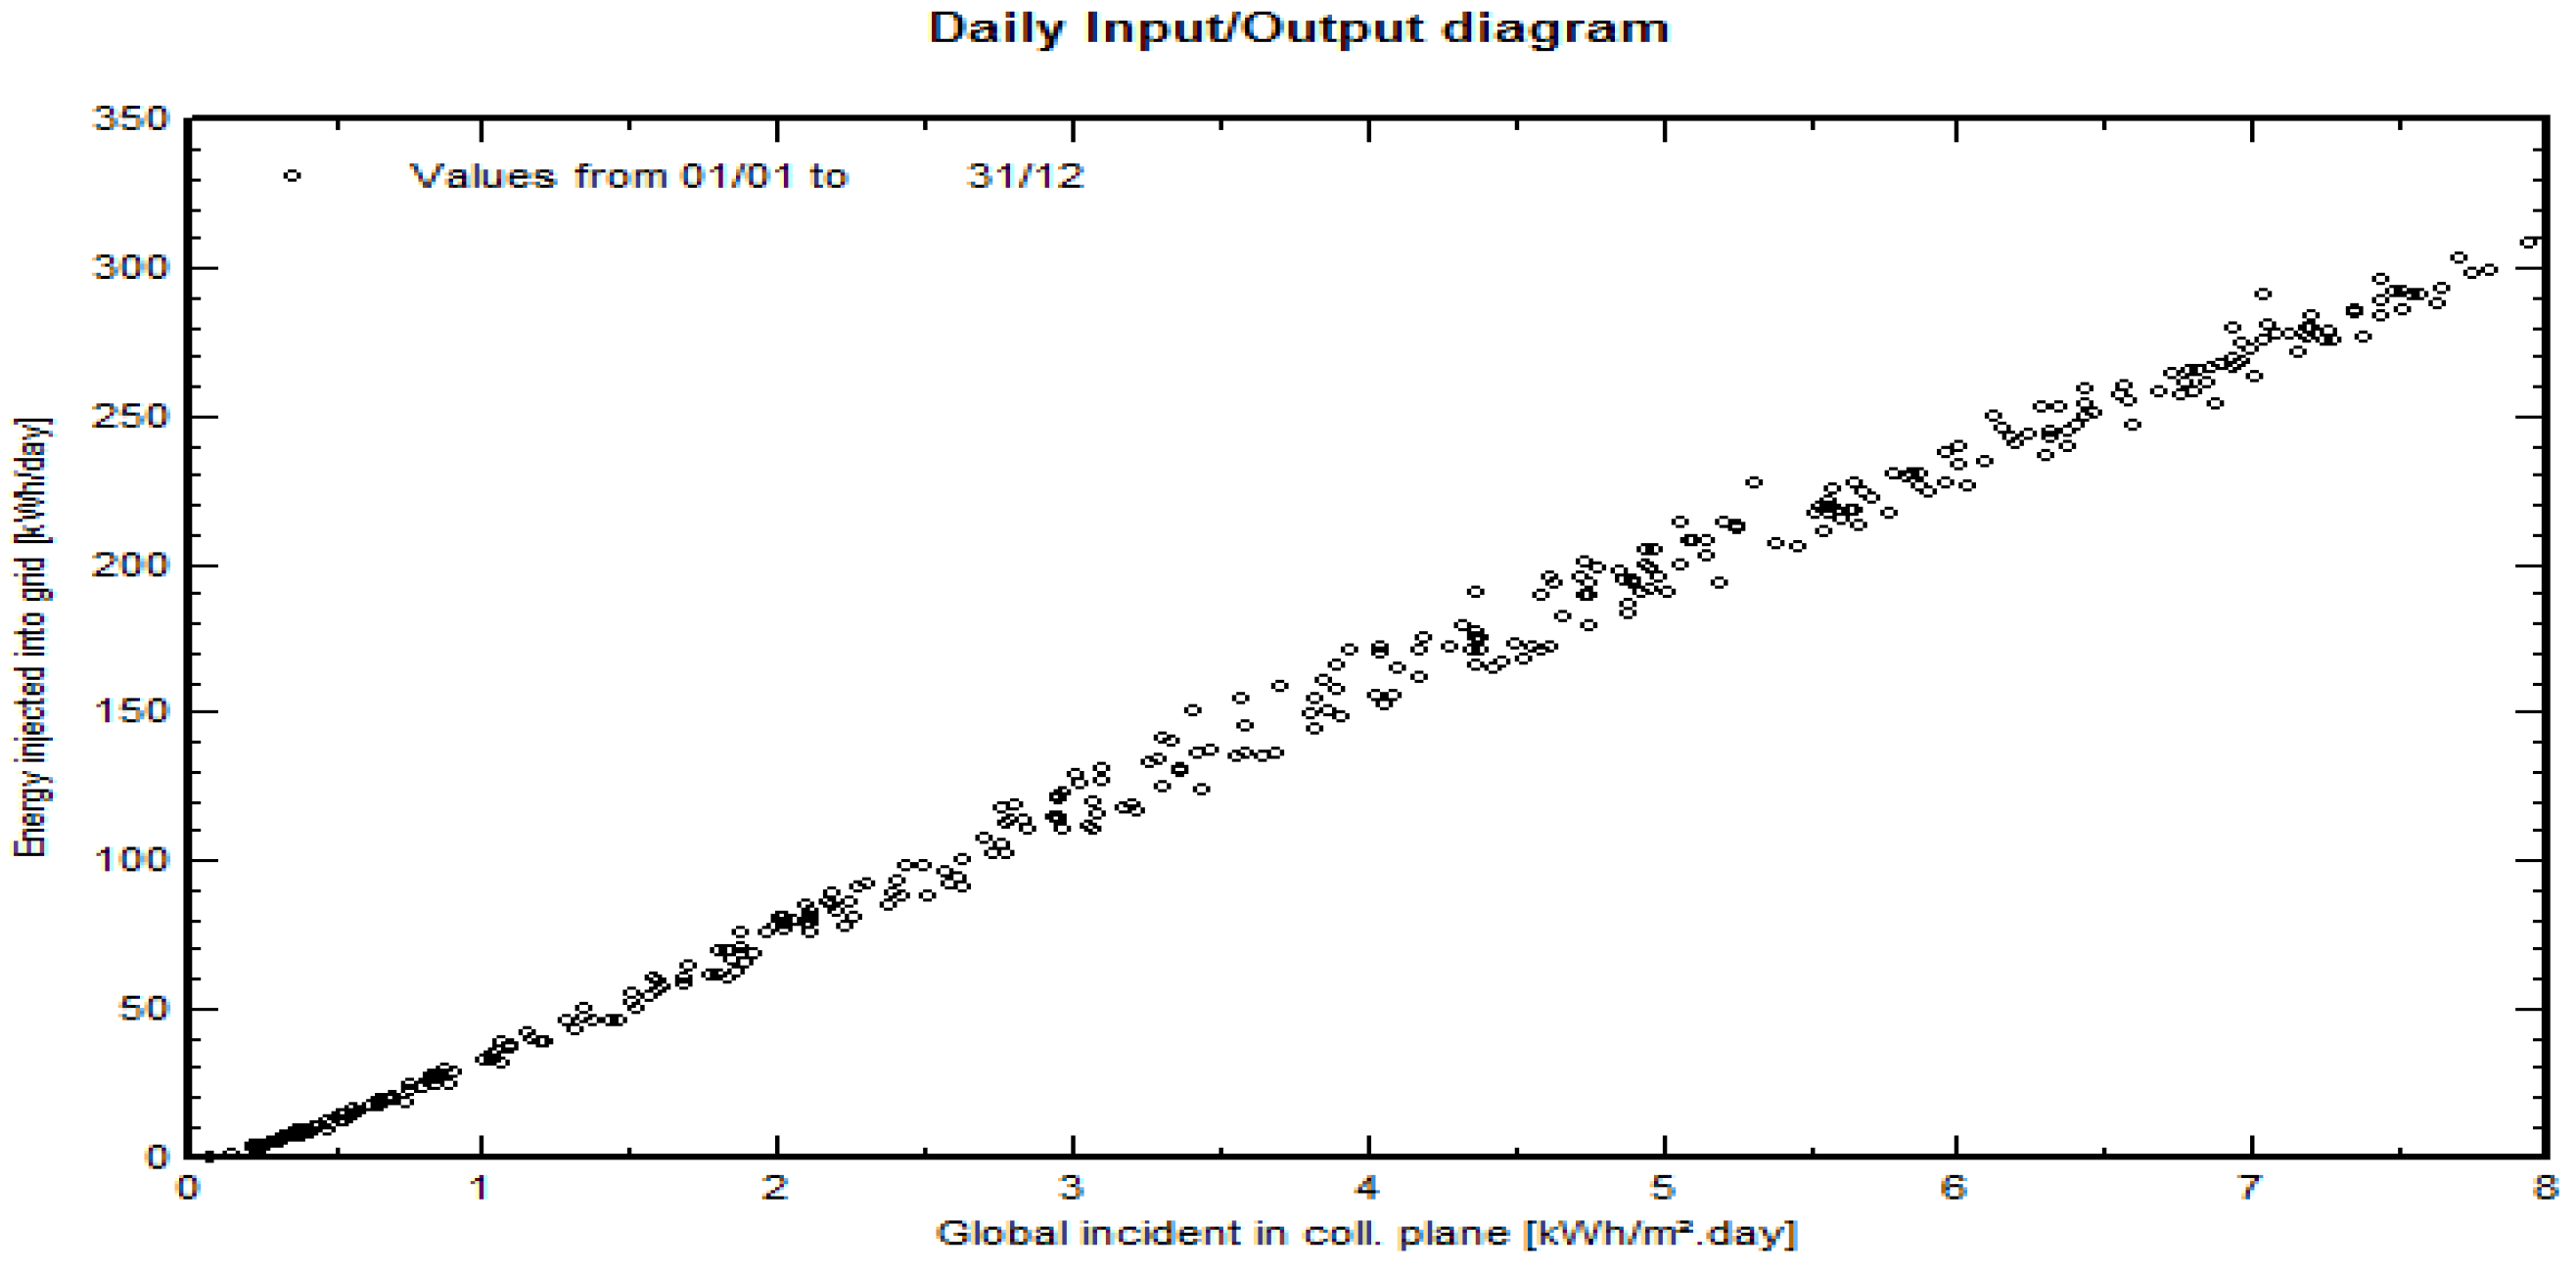
As details in Figure 10 and
Figure 11 Figure 12.
Figure 10.
daily input /output diagram.
Figure 10.
daily input /output diagram.
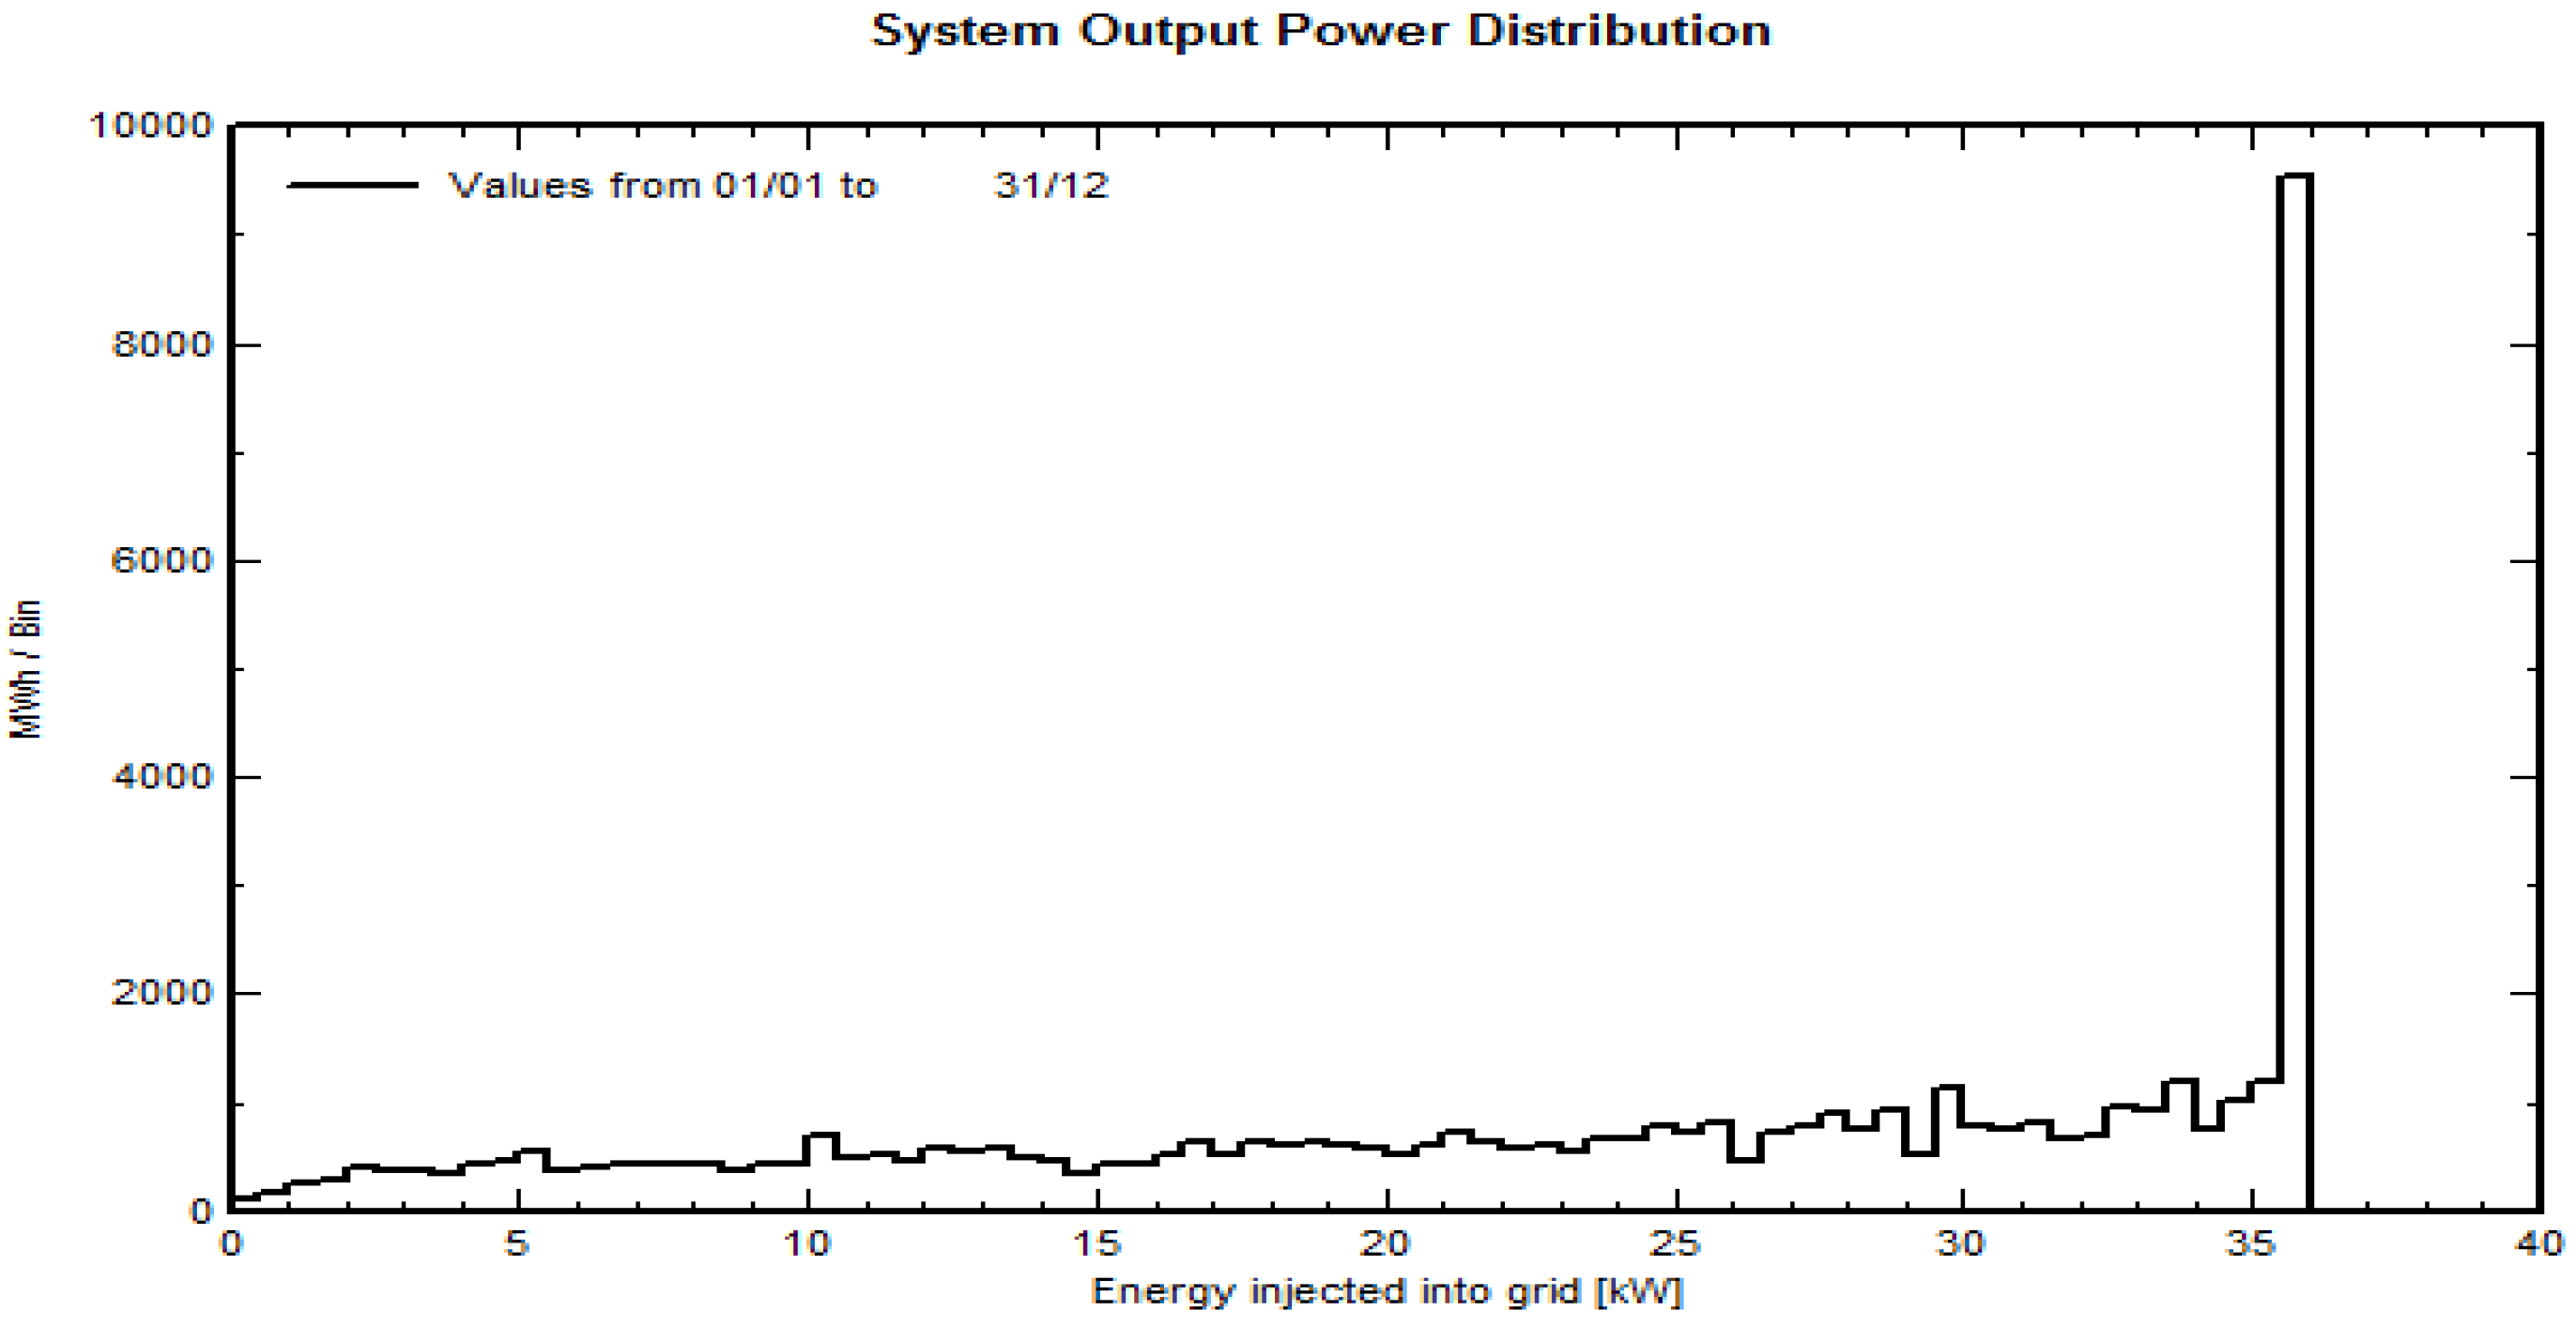
Figure 11.
system output power distribution.
Figure 11.
system output power distribution.
Figure 12.
Daily system output.
Figure 12.
Daily system output.
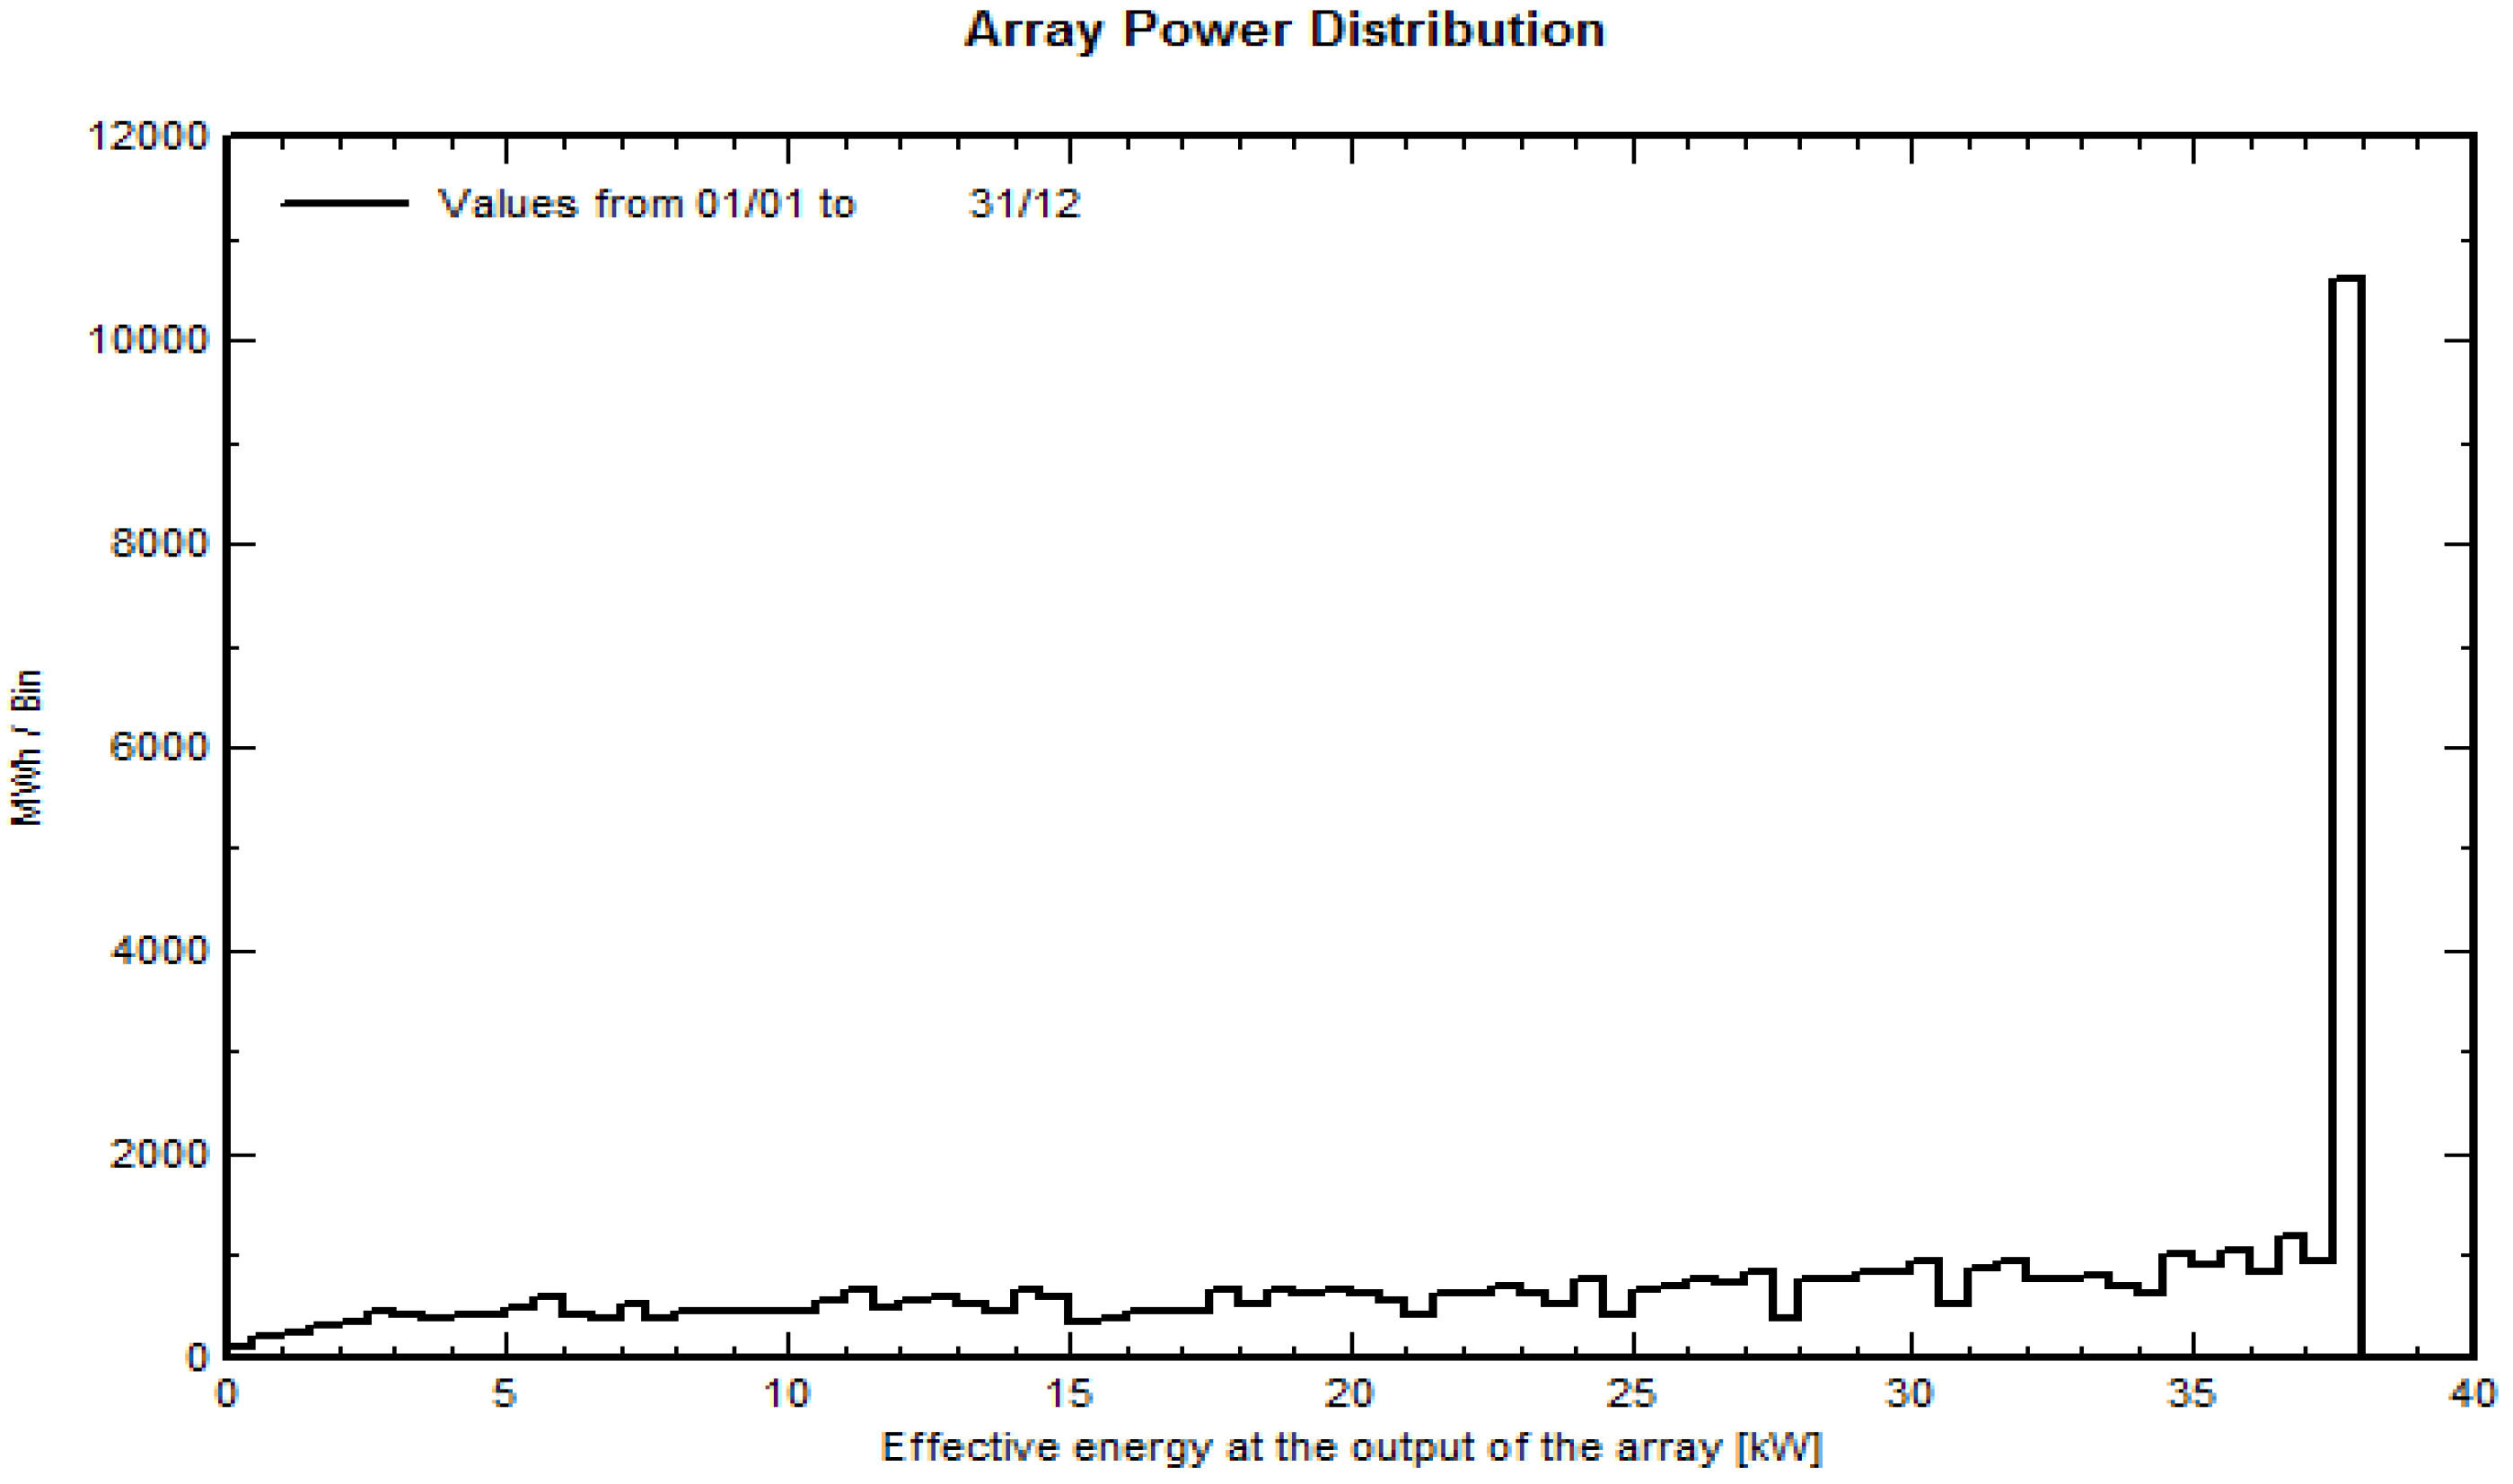
Figure 13.
Array power distribution.
Figure 13.
Array power distribution.
This similar with [21] and that power output is not used up to the full extent of what it could do. Because the batteries are full, a lot of power is being wasted. This is normal for the first few years of the GCS PV system, since it was made to meet the full energy needs of the local community after 5 years of growth in population and demand.
Figure 13. The PV power measured is more than what the PVSyst5.0 simulation predicted. This difference could be because the charge controller doesn’t always work the way it should.
3.2.5. Simulation of the PV System
This design used the computer program simulators PVsys, the design includes 23 separates’ module in a single house. PVsyst is a PC software package for the study, sizing, simulation and data analysis of complete PV systems. It is a tool that allows to analyse accurately different configurations and to evaluate its results in order to identify the best technical and economical performances of different technological options for any specific part. The simulation results include a great number of significant data, and quantify the losses at every level of the system, allowing identifying the system design weaknesses. This should lead to a deep comparison between several possible technological solutions, by comparing the available performances in realistic conditions over a whole year. Losses between inverters and grid injection have been implemented. These may be either wiring losses when the transformer is external. Detailed loss diagram
Figure 14 gives a deep sight of the quality of the PV system design, by quantifying all loss effects. Losses on each subsystem may be either grouped or expanded with detailed contributions it was 78.6%. The range of annual PV system energy output is between 0.5 - 2.17 kWh/kWp and average annual performance ratio of the PV system is 78.6 % (1.3 kWh/kWp) as shown in
Figure 4.23. The performance ratio in
Figure 14 and 15 shows the quality of a PV system and the value of 78.6% is indicative of good quality. Usually the value of performance ratio ranges from 60-80% similar to Goetzberger & Hoffmann (2005) detailed. This shows that about 21.3% of solar energy falling in the analysed period is not converted into usable energy due to factors such as losses in conduction, contact losses, the module and inverter efficiency factor, defects in components, etc.
Figure 14.
Normalized and Loss Factor.
Figure 14.
Normalized and Loss Factor.
Figure 15.
System Output Energy.
Figure 15.
System Output Energy.
3.2.6. Simulate the economic value
The most energy-efficient system for Khartoum has been optimized using HOMER while taking various load and wind-and-PV combination factors into account. The proposed scheme is depicted in the HOMER simulation tool in
Figure 1. The National Renewable Energy Laboratory (NREL), USA’s HOMER software was used to identify the most energy-efficient renewable-based hybrid system solutions for Khartoum. HOMER is a micro-power optimization model. It analyses acceptable technology solutions based on cost and resource availability and includes a number of energy component models. [24].
HOMER Depending on the energy resources available in particular places, the Plan offered optimal layouts of suitable power plants. [26]. Analysis has been done for a single home user as well as combinations of 10, and 50 home users to find the most economically and technically viable options. HOMER makes a model of each system configuration by simulating its operation hour by hour over the course of a year. It is worked out how much renewable power is available and compared to how much electricity is needed. [26].
3.3. Renewable Resources
Due to the lack of hourly data, monthly averaged global radiation data from HOMER has been used. This data introduces a clearness index based on the latitude information of the chosen site, and the values of this index are displayed in
Figure 15. Using the Graham algorithm, HOMER generates the synthesized 8760 hourly values for a year. [24] Consequently, a data sequence with realistic day-to-day and hour-to-hour fluctuation and autocorrelation is produced. In addition to height = 30 m, elevation = 3 m ASL, and surface roughness = 0.01 m, measured data from (SEI) were utilized to calculate the monthly mean wind speed (1999-2007).[27]. These monthly average data were generated by HOMER depending on additional parameters, such as Weibull factor "k" = 1.8 and autocorrelation factor, as depicted in
Figure 4. [28] Certain systematic outcomes are dependent on the place at which the analysis is conducted. Combining renewable energy generating with conventional wind and PV power generation will make renewable energy sources’ electricity more reliable and economical. [28].
3.3.1. Photovoltaic Module
The annual average production of the 300Wp PV array is anticipated to be 343,3 kWh. This equals 940.5Wh/day, or 343.3/365 days. As expected, the PV output does not coincide with the global sun radiation on the tracking axis. This could imply that the batteries are frequently full, reducing the PV.
Figure 6-71 depicts the average daily production (Wh) of the 300Wp PV array for each month, as well as the monthly worldwide sun radiation values on the POA.
Figure 6-70 makes this outcome crystal obvious. [29]. This system provide more efficiency, planning flexibility, and environmental benefits than nonrenewable energy sources. [28] observed that PV As the price of everyday supplies rises, calculations of the electric behavior of sizable, uniformly lit-up PV arrays obtained at the scale of photovoltaic modules should become more beautiful. Cost of useable energy, which is comparable to a solar home system, ranges from 24 to 39 cents per kWh due to capacity constraints and a small amount of excess electricity. [30]that mean the scale of solar system the one of the main factor of design the hybrid system.
3.3.2. Battery with Control
Battery and controller were also formed as a significant part of the performance evaluation of a 10 kW PV power system because the system only took into account the DC load. [27]. At a cost of 10,000.00 SP per battery with charge controller, a Trojan Company isolated battery (Model: Trojan T- 105, Nominal V: 6V, Nominal Capacity: 225 Ah) was used. Optimized Homer for Algiers is made from of solar panels, wind turbines, and batteries.[31]. Local inspections and analysis using the HOMER model led to the conclusion that the following design requirements are ideal for a solar penetration of roughly 25%: Maldives PV system with 12 kWp power, 108 kWh battery capacity (50 batteries, 360 Ah, 6 V), and 12 kWp converter [27].
3.3.2. Constraints and Economics
The projected project’s duration is 25 years, with an annual real interest rate of 4%. (IEA, 2002). Due to the system’s ability to support a single user as well as a large number of users (10 to 50), but due to the user’s low load, the annual cost of operation and maintenance has been set at 500 SP. The system has adequate capacity, and its operating reserve is equivalent to 10% of its hourly load. The system, which consists of 50 households, has a low cost per kilowatt-hour, according to an analysis. [32]
Table 3 displays the load demand for each group of residences, as well as the system architecture and a cost breakdown. Modeling and optimization results for the design of a hybrid system utilizing Homer software. Modelling demonstrated that, at 2004 prices, the NPC of the grid/RES hybrid arrangement is comparable to that of the grid-only supply, resulting in an RF of 73%, a payback period of 14 years, and a decrease of 65% in greenhouse gas emissions. A configuration of three Vest WECS (1.8 MW), an 800 kW converter, and three thousand five hundred batteries is anticipated to have the lowest NPC after twenty years and cost
$19.1 million. This is despite the fact that a RES-only configuration has the potential to meet 100 percent of the power demand. [27] As a result, it was determined that the benefit-cost ratio and payback period were roughly 16%, 8 years, and 2 respectively. When considering energy use, environmental consequences, and remote accessibility, the results in Table 15 show that the majority of coastal regions are suitable for residential systems.[27]
It was found that, with a daily demand of 207 kWh, the combination of a 12 Kwh PV system with a battery backup capacity of 108 kWh would be ideal, provided the most suited approach for the employment of the two different sized diesel generators now available. Simply changing the diesel generator operation plan a little bit can allow for increased demand in the future. The topologies of this system demand higher initial resources but have lower overall net current costs due to the better operating efficiency of the PV generators. By reducing solar radiation, the PV system shows that system emissions are likewise reduced. The system incentive also considers providing adequate electricity for domestic usage as necessary for residents of this particular isolated area as authorized in [29].
Table 4.
HOMER details results.
Table 4.
HOMER details results.
| Home |
Load |
PV module
(KW) |
Battery
(quantity) |
Initial Cost SP |
Total NPC |
COE
(SP/ Wh) |
| Single |
338 Wh/day
115KW Peak |
0.15 |
2 |
71,890 |
111,470 |
59.5 |
| 25 |
6.8KWh /day
2.3KW peak |
3.0 |
40 |
980,000 |
156,480 |
35.8 |
| 35 |
10.1KWh /day
3.5 KW |
4.5 |
60 |
1178,890 |
2,463,300 |
43.8 |
| 45 |
13.5KWh /day
4.6 KW |
6.0 |
80 |
2,188,330 |
2,999,590 |
54.7 |
| 55 |
16.9KWh /day
5.8 KW |
7.5 |
100 |
3,567,220 |
2,940,985 |
60.1 |
4. Conclusion
The value study of a PV roof panel -solar hybrid system in contrast to utility rate revealed that the hybrid system is just not economic and has a payback period of 33 years. At current The lowest cost option, central grid power is not available to the majority of isolated families. A pv -solar cell roof hybrid energy system would be cost-effective if the installation of several of these hybrid systems on a farm reduced component costs, hence lowering the investment cost per kilowatt. Its accessibility, durability, and environmental friendliness make it a viable energy source. The created model is fairly generic and may be acceptable for early energy consumption cost estimates for residential and industrial sectors eager to use renewable energy sources.
References
- Alnaser, W.E. and N. Alnaser, Solar and wind energy potential in GCC countries and some related projects. Journal of Renewable and Sustainable Energy, 2009. 1(2): p. 022301. [CrossRef]
- Alnaser, W., F. Trieb, and G. Knies, Solar energy technology in the Middle East and North Africa (MENA) for sustainable energy, water and environment. Advances in Solar Energy, 2007. 17: p. 261.
- Elagib, N.A. and M.G. Mansell, New approaches for estimating global solar radiation across Sudan. Energy conversion and management, 2000. 41(5): p. 419-434. [CrossRef]
- Omer, A.M., Renewable energy resources for electricity generation in Sudan. Renewable and Sustainable Energy Reviews, 2007. 11(7): p. 1481-1497. [CrossRef]
- Masters, G.M. and J. Wiley, Renewable and efficient electric power systems. 2004: Wiley Online Library.
- Atkinson, G. and S. Mourato, Environmental cost-benefit analysis. Annual review of environment and resources, 2008. 33(1): p. 317-344.
- Messenger, R.A. and J. Ventre, Photovoltaic systems engineering. 2004: CRC.
- Hossain, K.A., F. Khan, and K. Hawboldt, SusDesign-An Approach for a Sustainable Process System Design and its Application to a Thermal Power Plant. Applied Thermal Engineering, 2010. [CrossRef]
- Luque, A. and S. Hegedus, Handbook of photovoltaic science and engineering. 2003: John Wiley & Sons Inc.
- Tian, W., et al., Effect of urban climate on building integrated photovoltaics performance. Energy conversion and management, 2007. 48(1): p. 1-8. [CrossRef]
- Oliver, M. and T. Jackson, Energy and economic evaluation of building-integrated photovoltaics. Energy, 2001. 26(4): p. 431-439. [CrossRef]
- Bhusal, P., et al., Energy-efficient innovative lighting and energy supply solutions in developing countries. Electrical Engineering (IREE), 2007. 2(5): p. 665-670.
- Reinders, A., Sukatani revisited: on the performance of nine-year-old solar home systems and street lighting systems in Indonesia. Renewable and Sustainable Energy Reviews, 1999. 3(1): p. 1-47. [CrossRef]
- Bhusal, P., et al., Replacing fuel based lighting with light emitting diodes in developing countries: Energy and lighting in rural Nepali homes. J. Illum. Soc. North Am, 2007. 3: p. 277–291. [CrossRef]
- Reindl, D.T., W.A. Beckman, and J.A. Duffie, Evaluation of hourly tilted surface radiation models. Solar Energy, 1990. 45(1): p. 9-17. [CrossRef]
- Chel, A., G.N. Tiwari, and A. Chandra, Simplified method of sizing and life cycle cost assessment of building integrated photovoltaic system. Energy and Buildings, 2009. 41(11): p. 1172-1180. [CrossRef]
- Abdulridha, Z.S., A.S. Martyanov, and N.A. Martyanov. Simulation model of hybrid renewable energy system. in 2020 International Conference on Industrial Engineering, Applications and Manufacturing (ICIEAM). 2020. IEEE.
- Abu-Jasser, A., A STAND-ALONE PHOTOVOLTAIC SYSTEM, CASE STUDY: A RESIDENCE IN GAZA. Journal of Applied Sciences in Environmental Sanitation, 2010. 5(1): p. 81-91.
- Okedu, K.E. and R.J.I.J.o.R.E.R. Uhunmwangho, Optimization of renewable energy efficiency using HOMER. 2014. 4(2): p. 421-427.
- Mermoud, A., PVSYST Version 3.2. User’s Manual. Geneva: University of Geneva. University Center for the Study of Energy Problems, 1996.
- Ellul, A., Technical Analysis of the Performance of a Small-scale, Centralised Village Photovoltaic System in Tulin, Humla Nepal. 2008, Murdoch University.
- Zeinab, A.M.E., F.M.Z. Muhammad, and S.J.I.J.o.P.S. Kamaruzzaman, Design and performance of photovoltaic power system as a renewable energy source for residential in Khartoum. 2012. 7(25): p. 4036-4042.
- Zahnd, A. and H.M.K. Kimber, Benefits from a renewable energy village electrification system. Renewable Energy, 2009. 34(2): p. 362-368. [CrossRef]
- Givler, T. and P. Lilienthal, Using HOMER® Software, NREL’s Micropower Optimization Model, to Explore the Role of Gen-sets in Small Solar Power Systems. Case Study: Sri Lanka, National Renewable Energy Laboratory, Golden, Colorado, 2005.
- Zahnd, A. and H.M.K. Kimber, Benefits from a renewable energy village electrification system. Renewable Energy, 2009. 34(2): p. 362-368. [CrossRef]
- Mitra, I. and S.P.G. Chaudhuri. Remote village electrification plan through renewable energy in the Islands of Indian Sundarbans. 2006.
- Benemann, J., O. Chehab, and E. Schaar-Gabriel, Building-integrated PV modules. Solar energy materials and solar cells, 2001. 67(1-4): p. 345-354.
- Setiawan, A.A., Y. Zhao, and C. Nayar, Design, economic analysis and environmental considerations of mini-grid hybrid power system with reverse osmosis desalination plant for remote areas. Renewable Energy, 2009. 34(2): p. 374-383. [CrossRef]
- Elhassan, Z.A.M. and M.F.M. Zain, Design of Hybrid Power System of Renewable Energy for Domestic Used in Khartoum. 2011.
- Khadem, S.K. and M. Hussain, A pre-feasibility study of wind resources in Kutubdia Island, Bangladesh. Renewable Energy, 2006. 31(14): p. 2329-2341. [CrossRef]
- Amini, M., Renewable Energy Systems for Rural Health Clinics in Algeria: Homer Application. 2010.
- Roaf, S., M. Fuentes, and S. Thomas, Ecohouse: a design guide. 2007: Architectural press.
|
Disclaimer/Publisher’s Note: The statements, opinions and data contained in all publications are solely those of the individual author(s) and contributor(s) and not of MDPI and/or the editor(s). MDPI and/or the editor(s) disclaim responsibility for any injury to people or property resulting from any ideas, methods, instructions or products referred to in the content. |
© 2023 by the authors. Licensee MDPI, Basel, Switzerland. This article is an open access article distributed under the terms and conditions of the Creative Commons Attribution (CC BY) license (http://creativecommons.org/licenses/by/4.0/).


