Preprint
Article

Collagen Alpha 1(XI) Is Required for Chondrocyte Differentiation through the AKT/GSK3 β/β-Catenin Signaling Axis in ATDC5 Cells

Altmetrics

Downloads

180

Views

91

Comments

0

This version is not peer-reviewed

Submitted:

27 December 2022

Posted:

07 January 2023

You are already at the latest version

Alerts
Abstract
Cartilage development is a tightly regulated process that involves multiple molecules and signaling pathways. The loss of expression of a single gene can alter cell behavior and disrupt the development of the cartilage. Col11a1 encodes the alpha one chain of the minor fibrillar collagen type XI that is essential in skeletal development. We used an RNAi mediated knockdown approach to investigate the role of Col11a1 expression during chondrogenesis in ATDC5 cells. Col11a1 expression promotes the transition of mesenchymal cells to the chondrogenic phenotype, and reduction of Col11a1 expression interferes with cellular differentiation. Our results indicate that collagen α1(XI) protein is required for chondrocyte cell shape, matrix production, mineralization and gene expression through a mechanism that involves AKT/GSK3β/β-catenin and TCF/LEF activity in ATDC5 cells.
Keywords: 
Subject: Biology and Life Sciences  -   Cell and Developmental Biology

1. Introduction

Endochondral ossification requires that a cartilage template is formed prior to initiating ossification [1]. The process of endochondral ossification is the primary bone forming mechanism during vertebrate development [2]. Therefore, successful vertebrate development requires the formation of a cartilage template through chondrogenesis. To successfully form the cartilage analgen, the cells must proceed through a series of maturation steps that begin with prechondrogenic mesenchymal cells forming a condensation and initiating the expression of genes involved in chondrocyte differentiation and matrix formation. The chondrocytes continue to mature and further differentiate into hypertrophic chondrocytes that contribute to matrix remodeling and mineralization. Chondrocytes are also responsible for longitudinal growth as residents of the growth plate of the bone [2,3]. Errors occurring during the formation of the cartilage can cause skeletal dysplasia or increase the susceptibility to the early onset of connective tissue diseases such as osteoarthritis.
COL11A1 gene expression is essential for normal skeletal development, evident by human dysplasias and severe tissue disorganization in mice [4,5]. Fibrochondrogenesis and Stickler’s syndrome type II are human skeletal dysplasias associated with mutations in the COL11A1 gene [6,7]. Additionally, genetic mutations in COL11A1 contributes to intervertebral disc disease and degradation of the articular cartilage [8,9,10].
Collagen type XI is composed of three alpha chains, α1(XI), α2(XI), and α3(XI) [11,12]. Collagen type XI both nucleates fibril formation and regulates the fibril diameter [13,14,15]. The amino terminal domain of the α1(XI) chain is a unique domain to clade B fibrillar collagens that interacts with multiple extracellular molecules, making it essential in providing integrity to the matrix network [16,17,18,19]. Despite our knowledge of the structural role of collagen type XI in the extracellular matrix of cartilage, the biological impact of COL11A1 gene mutations on cell behavior and molecular phenotype remain unknown.
Previous studies have established the importance of collagen α1(XI) protein in skeletal development, maintenance and health, but they have not investigated how decreased COL11A1 expression affects the chondroprogenitor cell behavior during chondrogenesis. The chondroprogenitors are derived from mesenchymal stem cells and maturation into overt chondrocytes is a tightly regulated, sequential process [20]. The chondrocytes undergo proliferation and upregulate chondrogenic gene expression of COL2A1, ACAN, and SOX9. These cells further change their expression to include upregulation of the hypertrophic chondrocyte markers COL10A1, RUNX2, and MMP13. Deviation from the normal expression pattern may alter the extracellular matrix environment permanently, causing chondrodysplasia and susceptibility to degenerative cartilage disease.
We investigated the role that collagen α1(XI) plays during chondroprogenitor cell differentiation and cell signaling events during chondrogenesis using the mouse ATDC5 chondrogenic cell line. ATDC5 cells are a well-established murine cell line used for studying the process of chondrogenesis and the transcriptome has been well documented [21,22,23]. To investigate the early role of collagen α1(XI) in chondroprogenitor cells, we used an RNAi approach to inhibit Col11a1 expression during chondrocyte differentiation. We analyzed the expression of chondrogenic markers in the knockdown cell culture as well as the activity of the β-catenin signaling pathway. We found that in the presence of siRNA for Col11a1, chondrocyte cellular morphology was inhibited compared to control cells. We identified alteration in the phosphorylation of AKT, GSK3β, β-catenin, and activation levels of the TCF/LEF activity. The results of these studies indicate a role for collagen α1(XI) in cell signaling pathways that are required for chondrocyte differentiation of ATDC5 cells.

2. Results

2.1. Characterization of Col11a1 Expression during Chondrogenesis in ATDC5 Cells.

We characterized the expression profile of the Col11a1 gene in the mouse chondrogenic ATDC5 cell line induced to differentiate with ITS and A2P (Figure 1). Day 0 of the experiment was designated as the time at which culture medium was exchanged for differentiation medium in confluent cultures. Using quantitative RT-PCR, we determined that Col11a1 mRNA was increased 7.6-fold at day 7 relative to day 0, and 156-fold by day 14. We also demonstrated that Col11a1 mRNA levels significantly decreased between day 14 and 21 to 20% of the levels observed on day 14 (Figure 1A). Western blot analysis using two separate rabbit polyclonal antibody directed to the collagen α1(XI) chain epitopes confirmed protein production at each of the investigated time points (Figure 1B). Collagen α1(XI protein was detectable at day 0 and day 7 and, in agreement with the mRNA levels, collagen α1(XI) protein reached maximally detectable levels in cell lysates by day 14. The protein detected on day 21 remained high despite the significant decrease in mRNA levels, a result that is not surprising given the long half-life of collagen proteins [24,25].
In addition to Col11a1, we confirmed the expression of chondrogenic differentiation markers in culture (Figure 1C). The expression patterns that we observed were consistent with previously reported results in ATDC5 cells using ITS and A2P to induce chondrogenic differentiation [21,22]. Col2a1 and Acan mRNA were increased at day 7 of differentiation. We did not observe significant changes in Sox9 mRNA between day 0 and 7 (Figure 1C).

2.2. Col11a1 Knockdown Induces Fibroblast-like Morphology, Inhibits Chondrogenesis, and Increases Mineralization

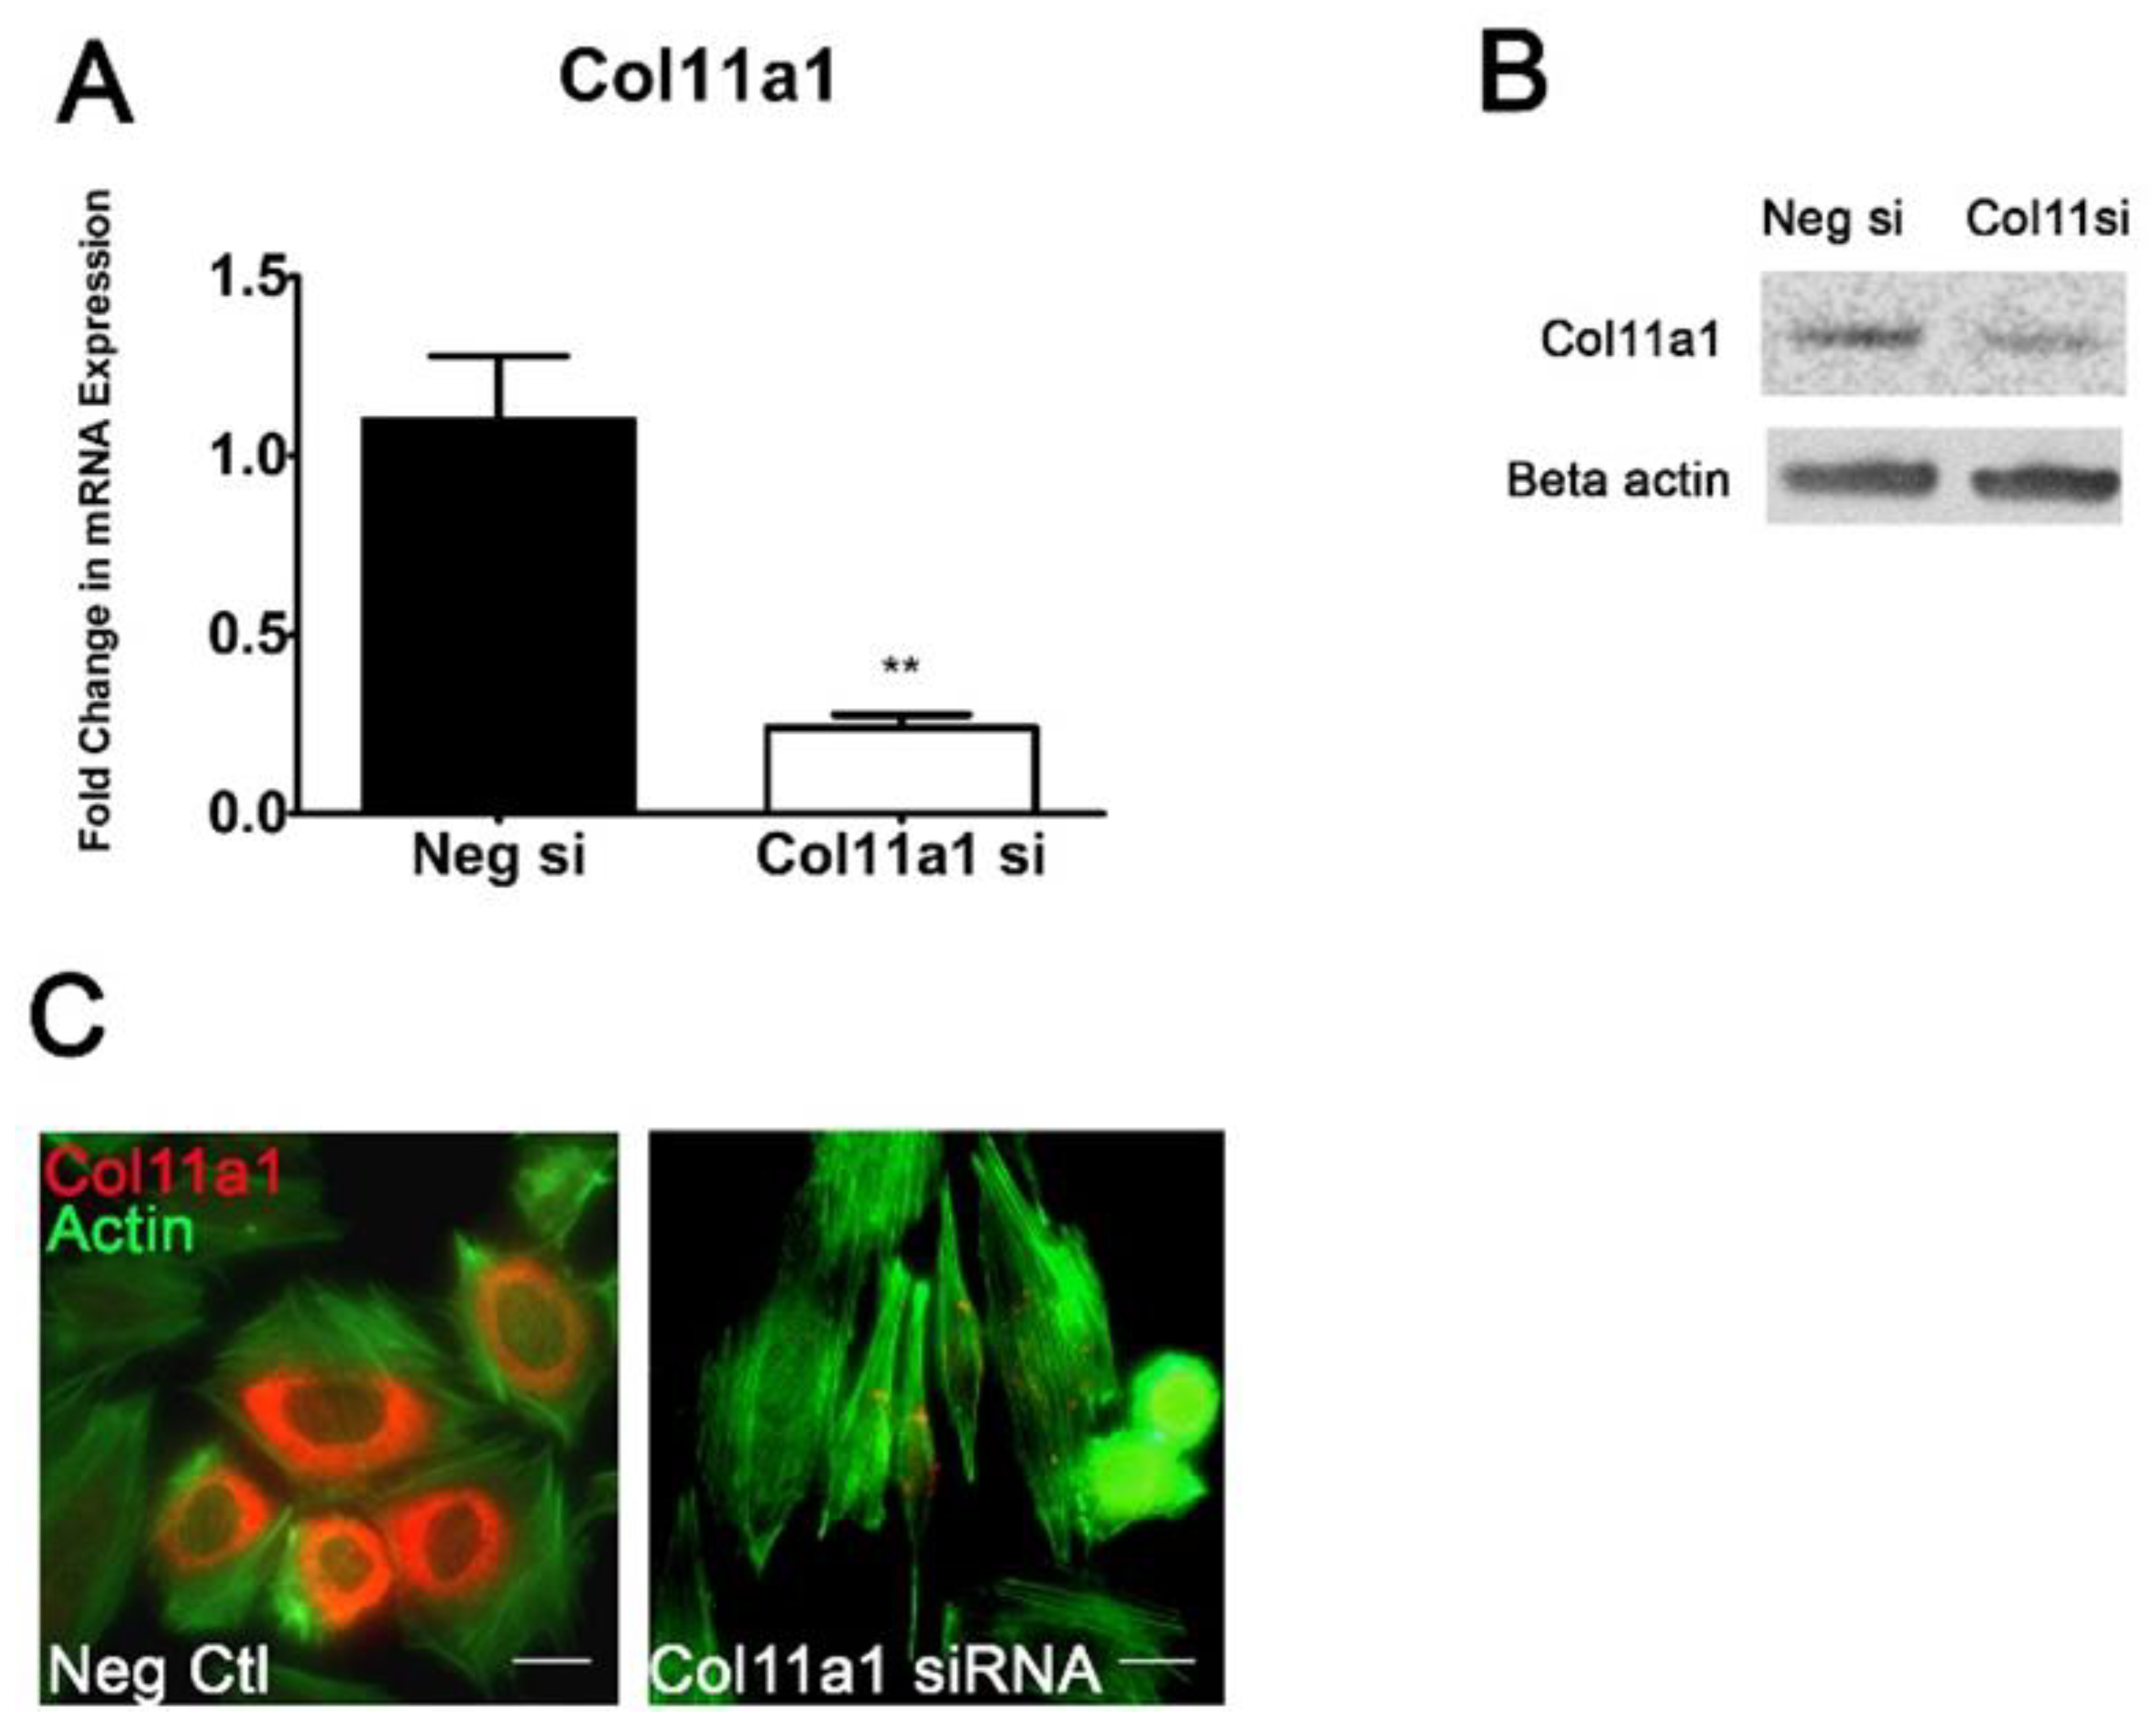
To investigate the requirement for Col11a1 expression during the transition of prechondrogenic cells to differentiated chondrocytes, we transfected ATDC5 cells with double stranded siRNA complexes targeting Col11a1 mRNA. We optimized and verified the effectiveness of this approach by monitoring mRNA and protein levels in ATDC5 cells. RNAi transfection prevented the increase in Col11a1 mRNA previously observed on day 7 (Figure 2). Expression on day 3 was decreased by 90% compared to negative control transfected cells and by more than 75% on day 7 (Figure 2A). Western blot analysis confirmed a decrease in total collagen α1(XI) chain protein levels in the cell lysates on day 7, although a low level of protein was detectable (Figure 2B). New protein translation was blocked through RNAi degradation complexes as we could not detect collagen α1(XI) chain by immunofluorescence in transfected cells (Figure 2C). The actin cytoskeleton showed marked changes in organization 3 days after Col11a1 siRNA transfection with cells appearing more elongated and fibroblast-like than control cells undergoing chondrogenesis (Figure 2C).
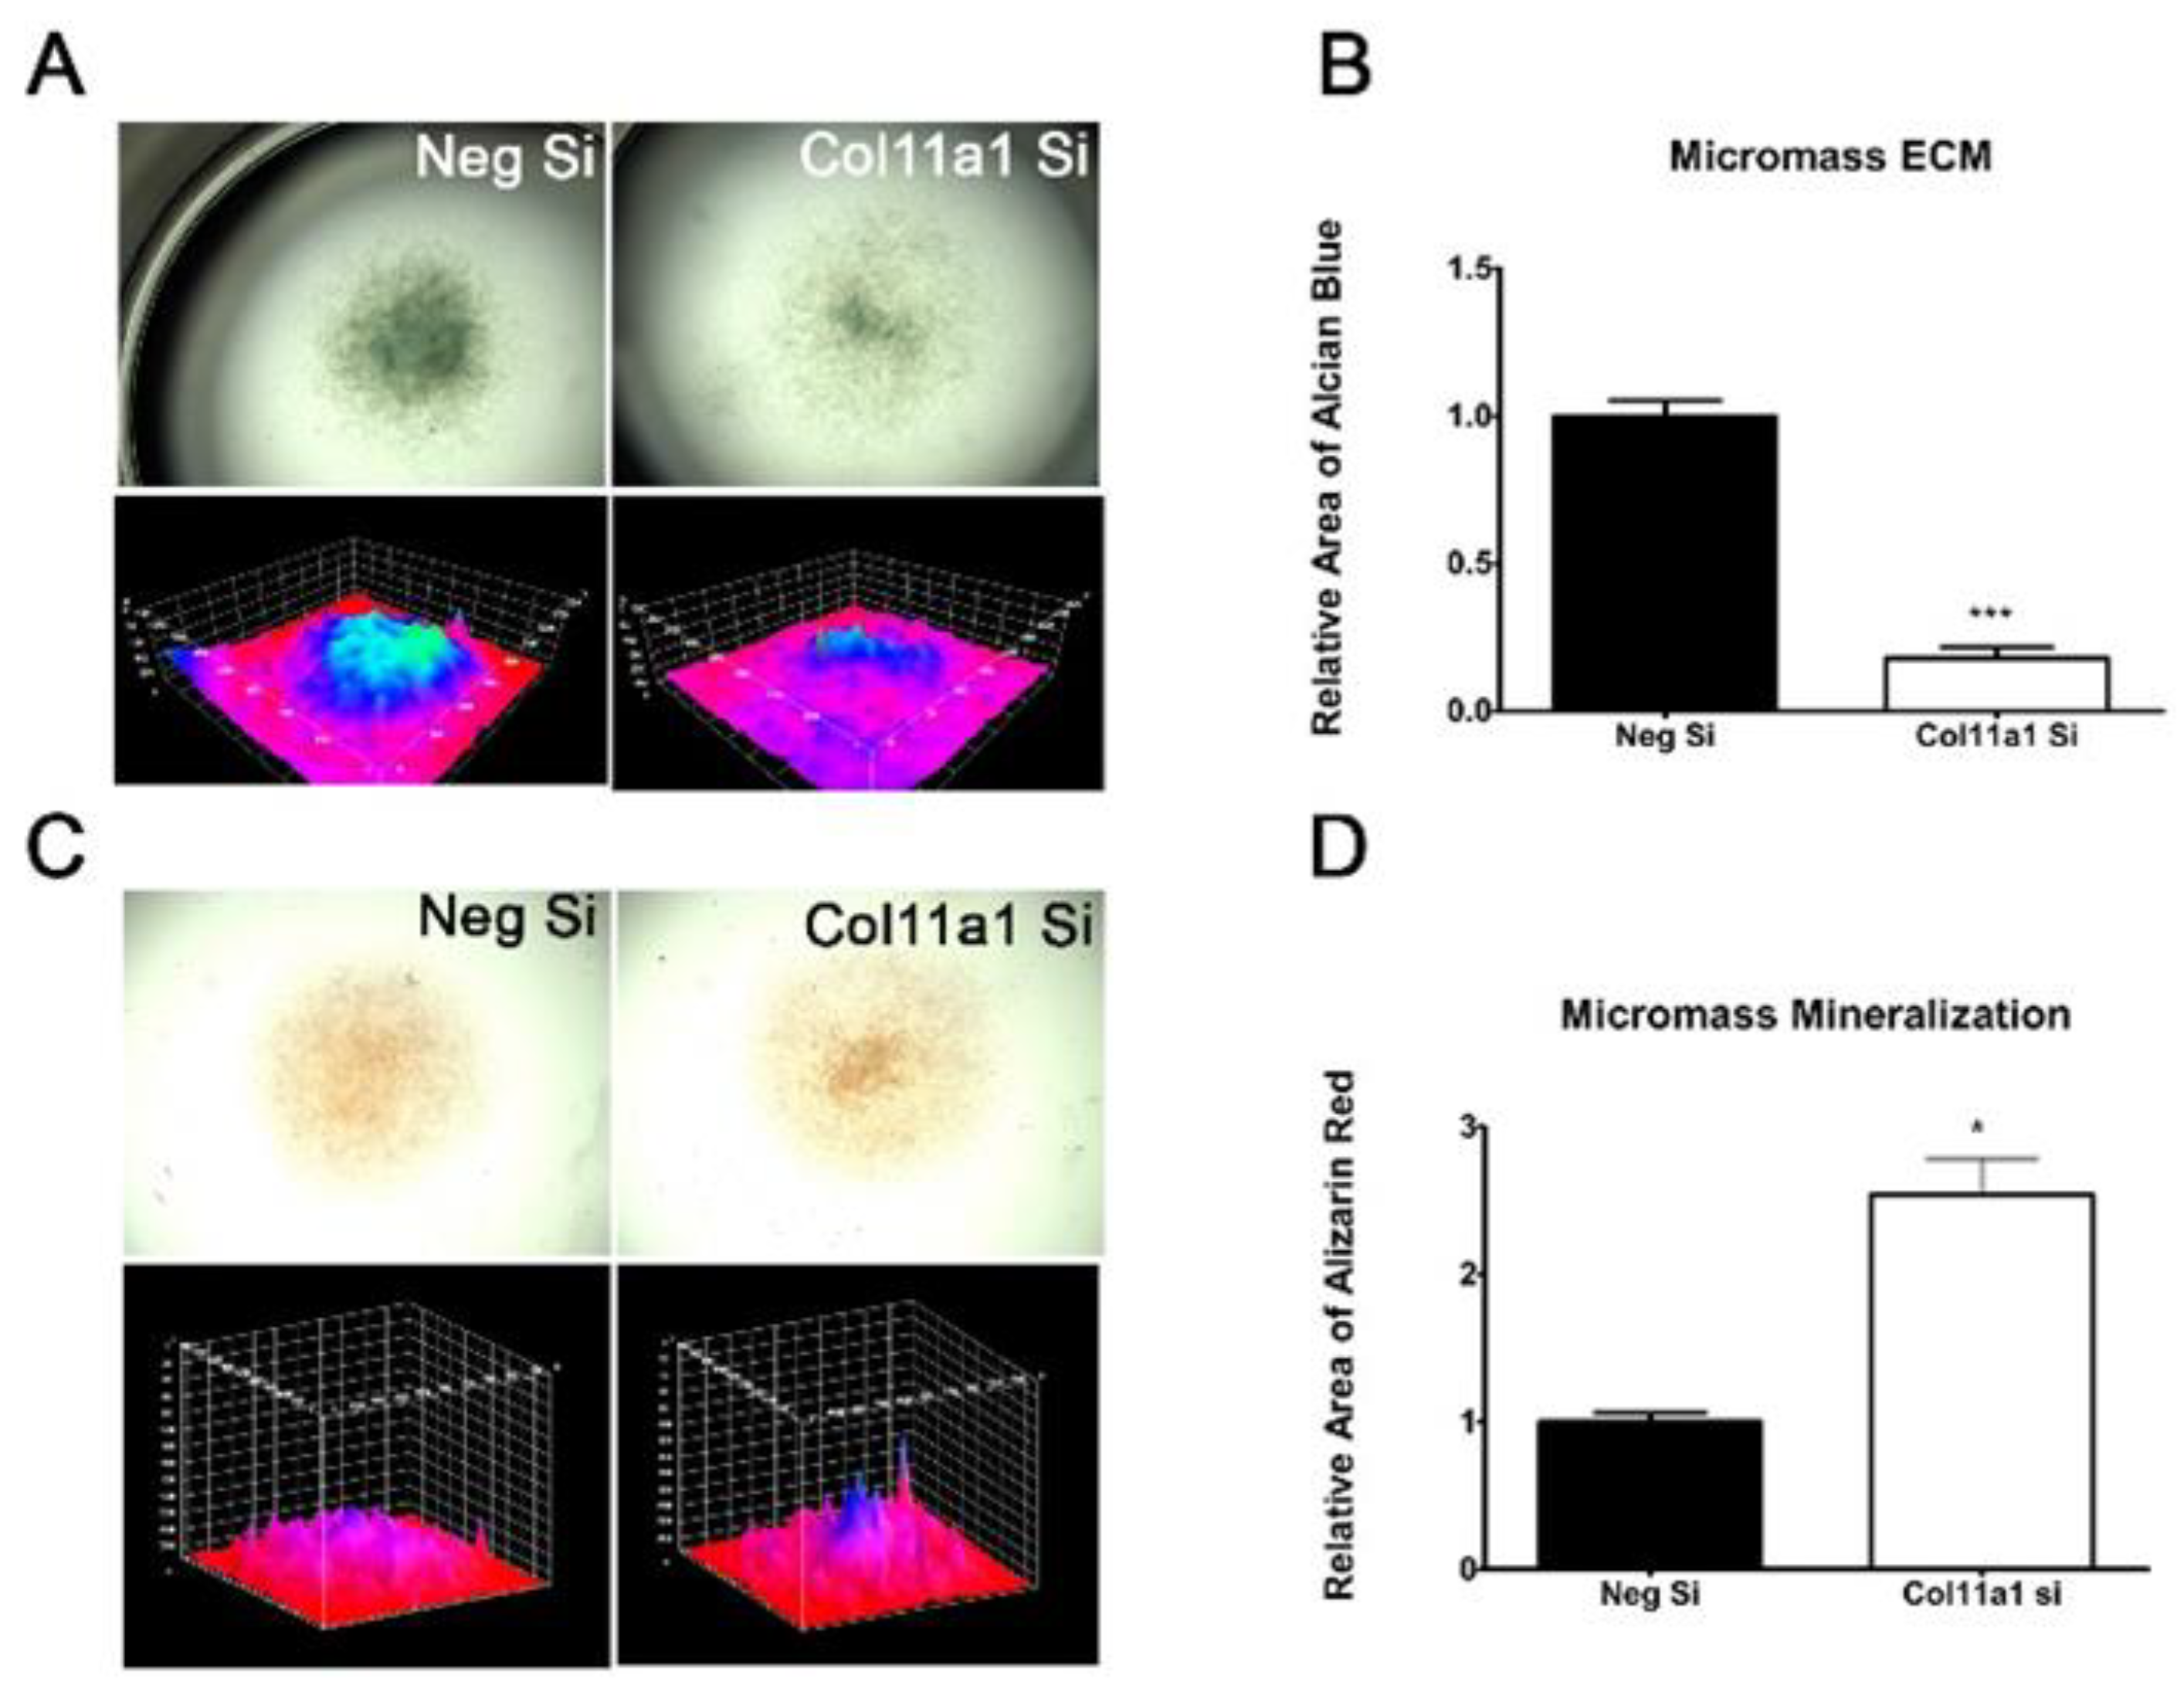
The production of the cartilage extracellular matrix can be monitored by the detection of sulfated glycosaminoglycans in developing cartilage nodules in micromass culture. Additionally, late stage chondrogenesis is marked by increased matrix calcification. Micromass cultures transfected with Col11a1 siRNA and subsequently grown for 7 days produced less extracellular matrix than cells transfected with negative control siRNA as indicated by a decreased Alcian Blue staining (Figure 3A and B). Additionally, increased Alizarin red staining was detectable in micromass cultures treated with siRNA to knockdown Col11a1 expression. The increase in Alizarin red staining is consistent with an increase in calcification or mineralization after 7 days in differentiation media (Figure 3C and D).

2.3. Inhibition of Col11a1 Expression Does Not Affect Genes Involved in Mesenchymal Condensation But Does Affect Genes Involved in Matrix Production and Remodeling

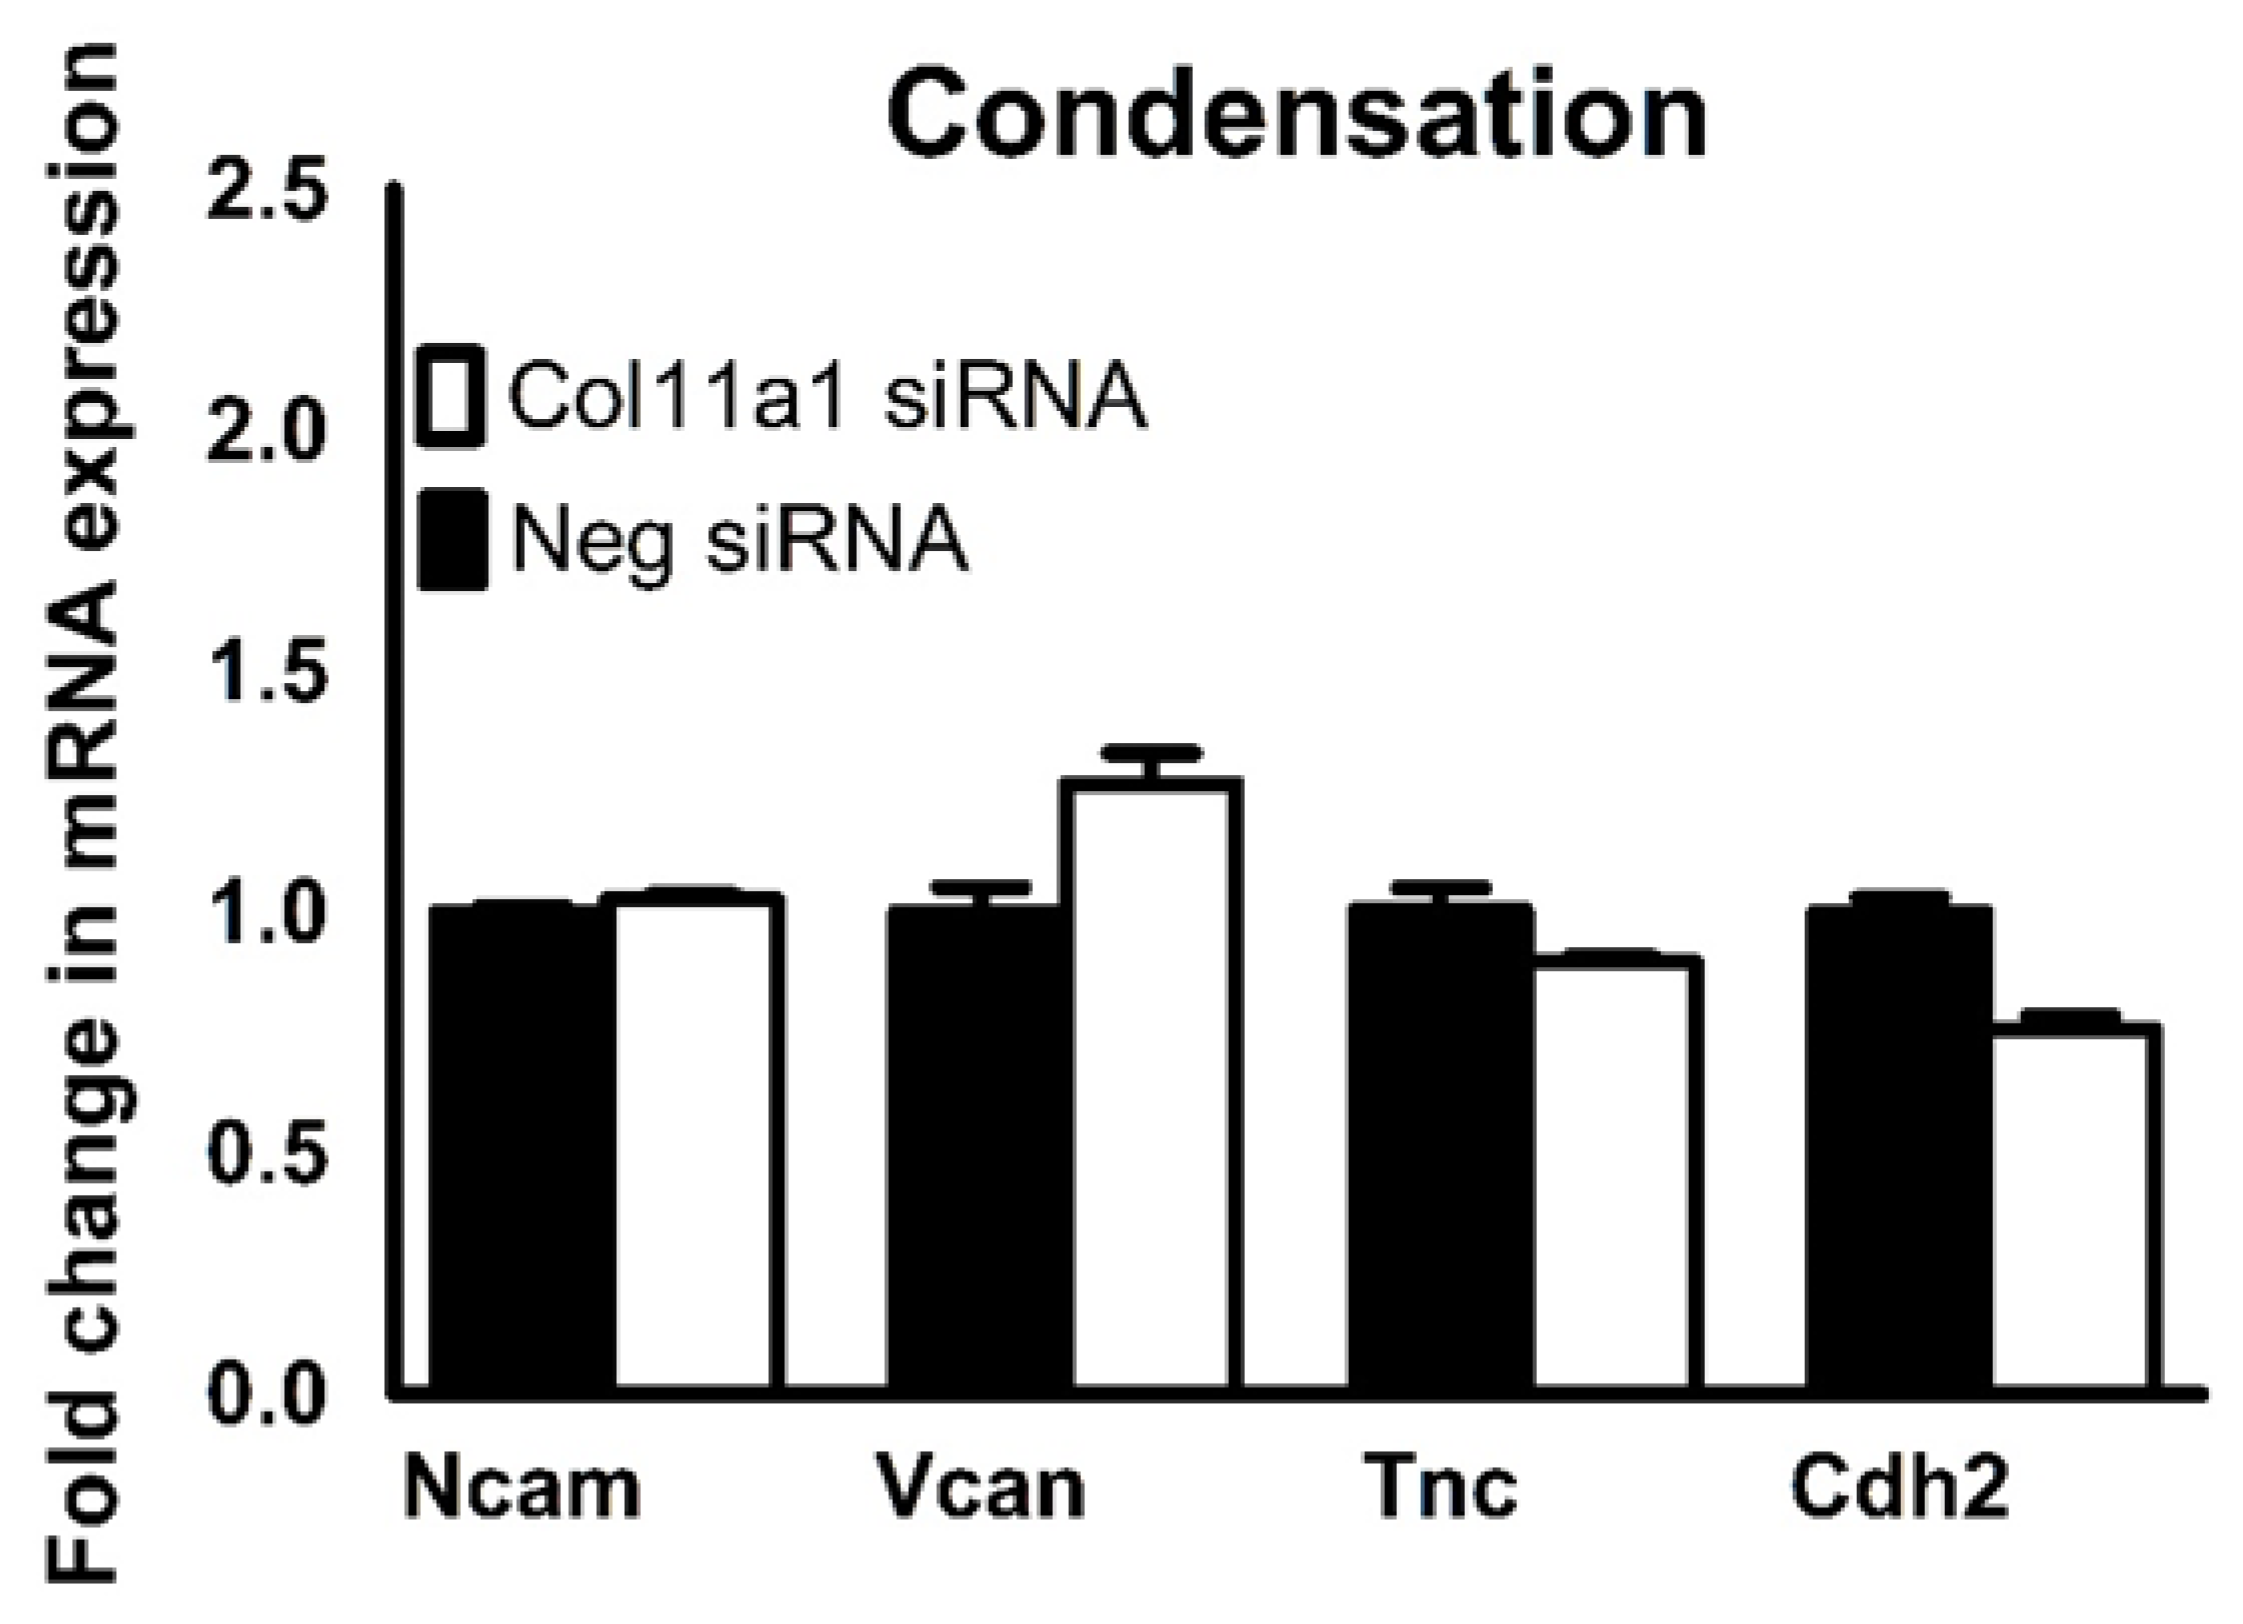
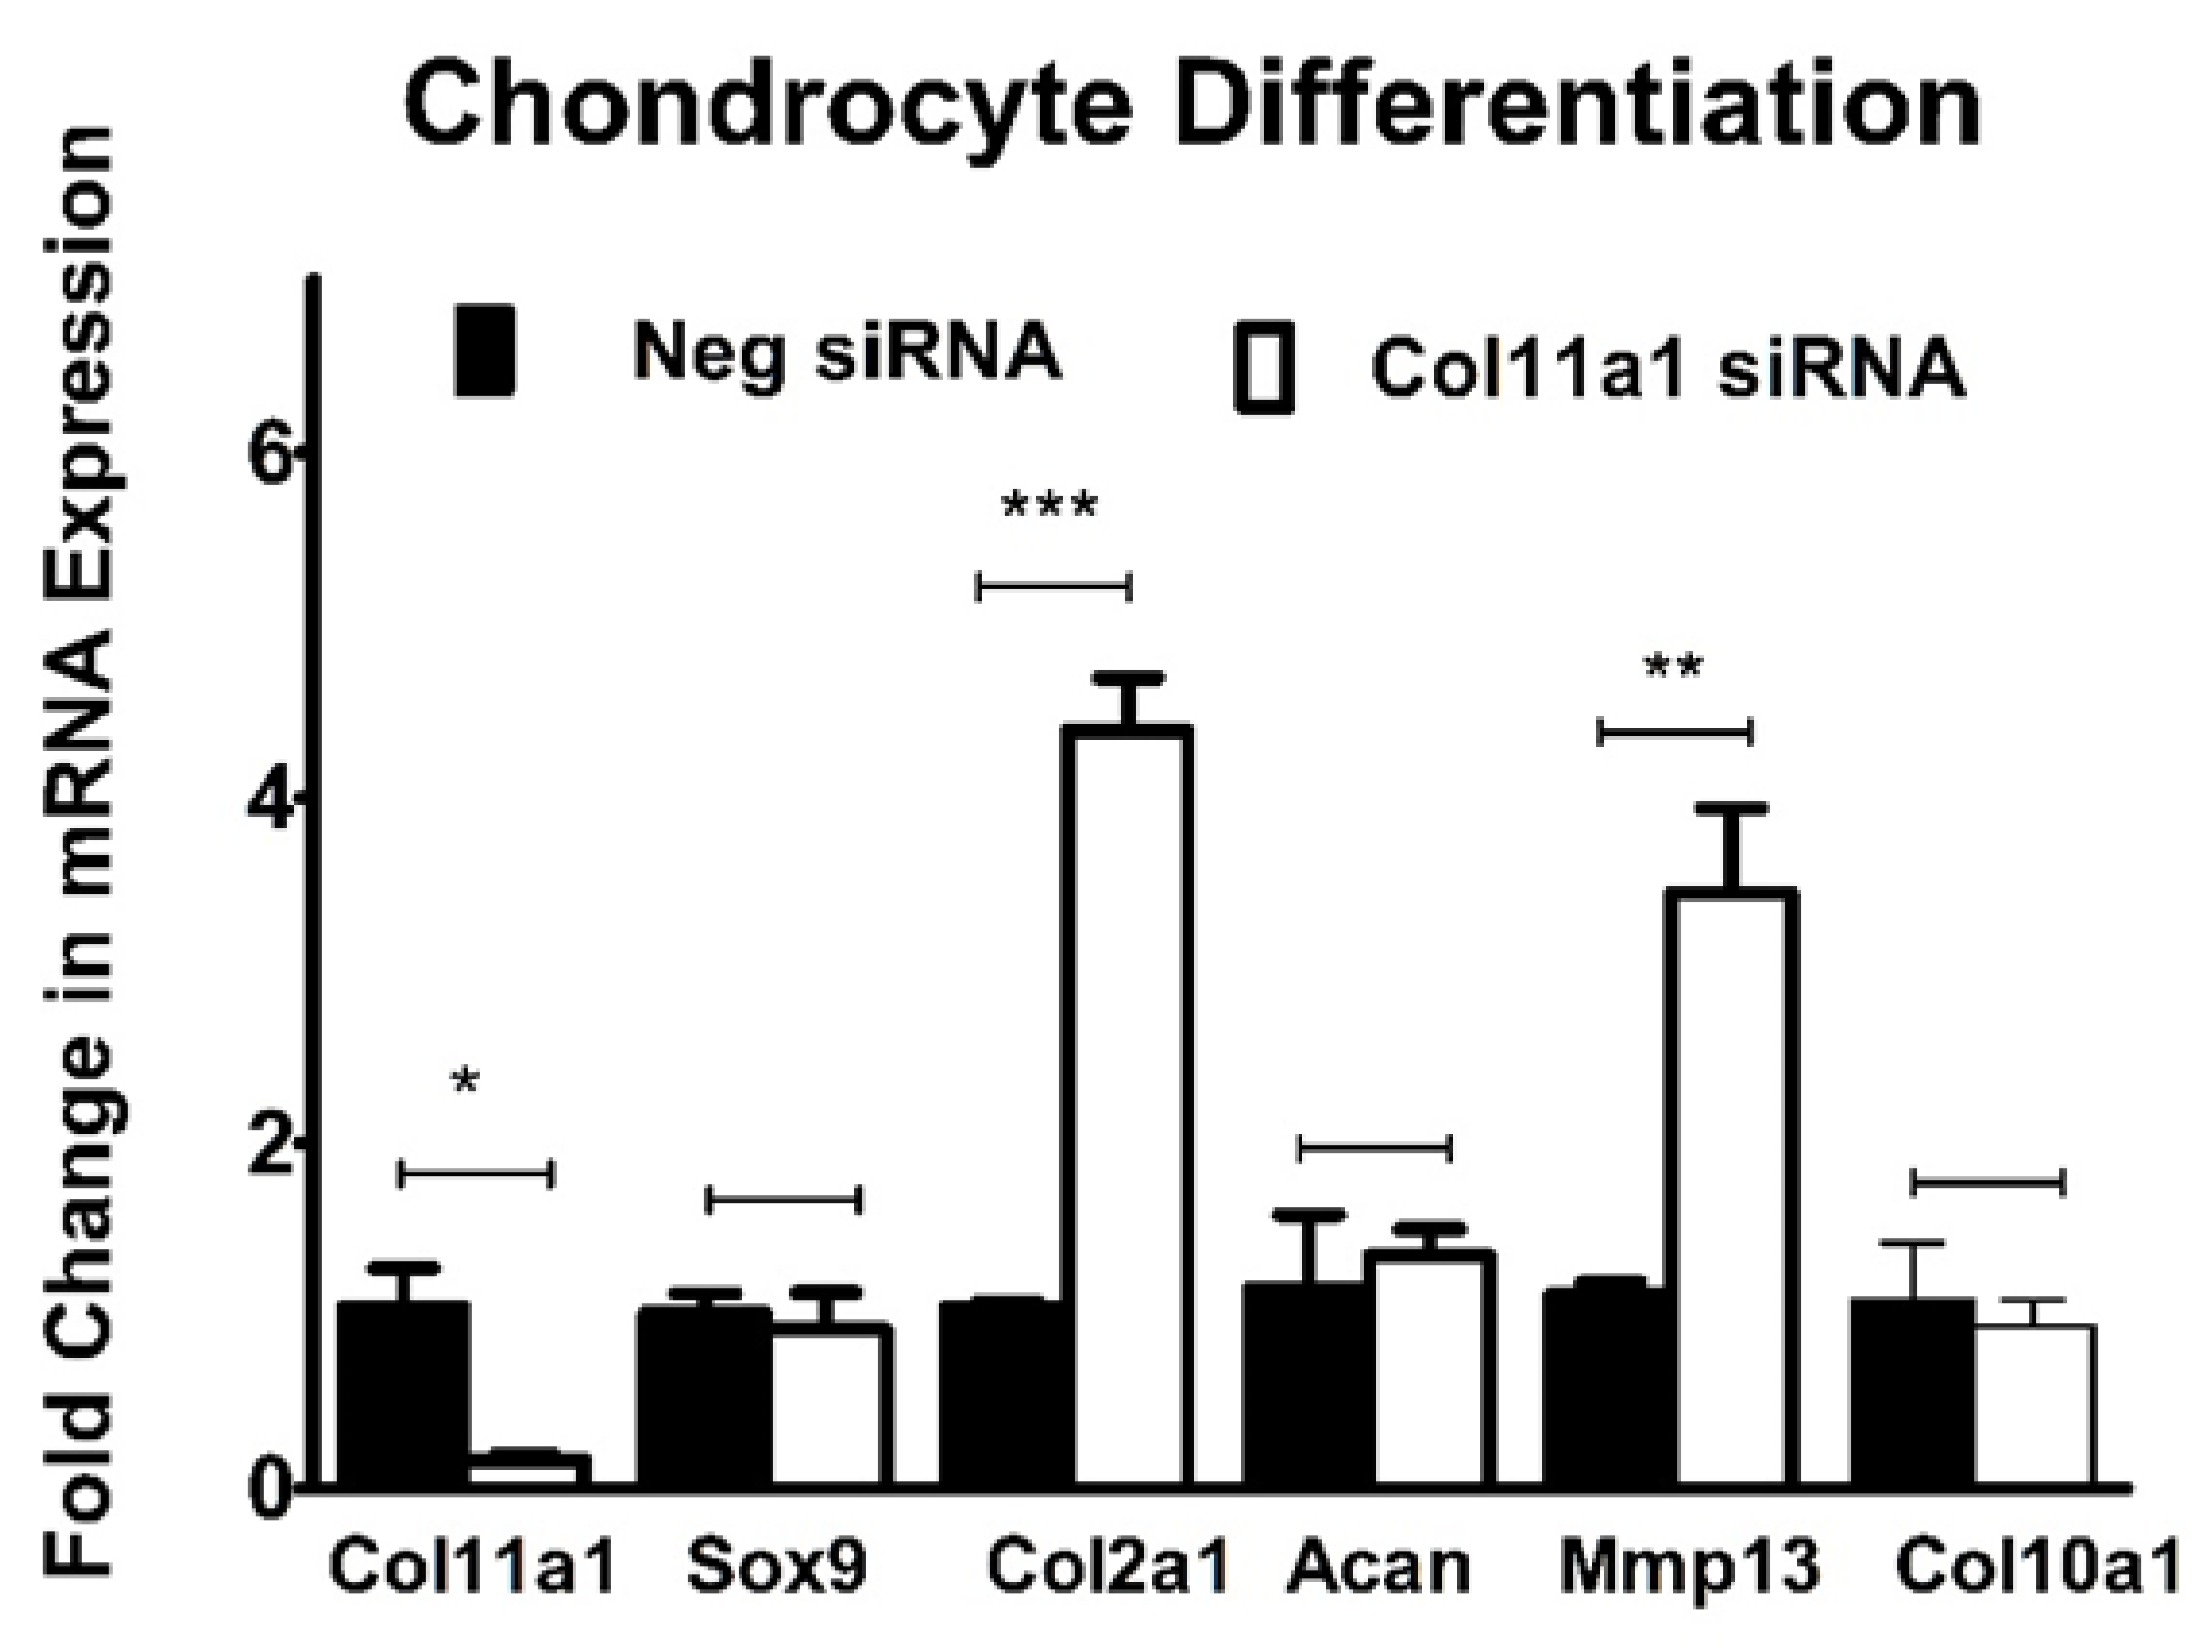
The expression of mesenchymal condensation and chondrogenic differentiation markers were analyzed by quantitative RT-PCR. Condensation of mesenchymal prechondrogenic cells is a prerequisite for chondrogenic differentiation and subsequent chondrocyte maturation. The expression of versican (Vcan), tenascin (Tnc), N-cadherin (Cdh2) and N-CAM (Ncam) are required for successful condensation to occur [1]. The expression of Vcan, Tnc, Cdh2, and Ncam were unaffected by Col11a1 knockdown in ATDC5 cells (Figure 4). However, in the absence of Col11a1 expression, the mRNA levels of collagen α1(II)chain (Col2a1) and matrix metallopeptidase-13 (Mmp13) were increased, while the expression of Sox9, Acan, and Col10a1 did not significantly change (Figure 5).
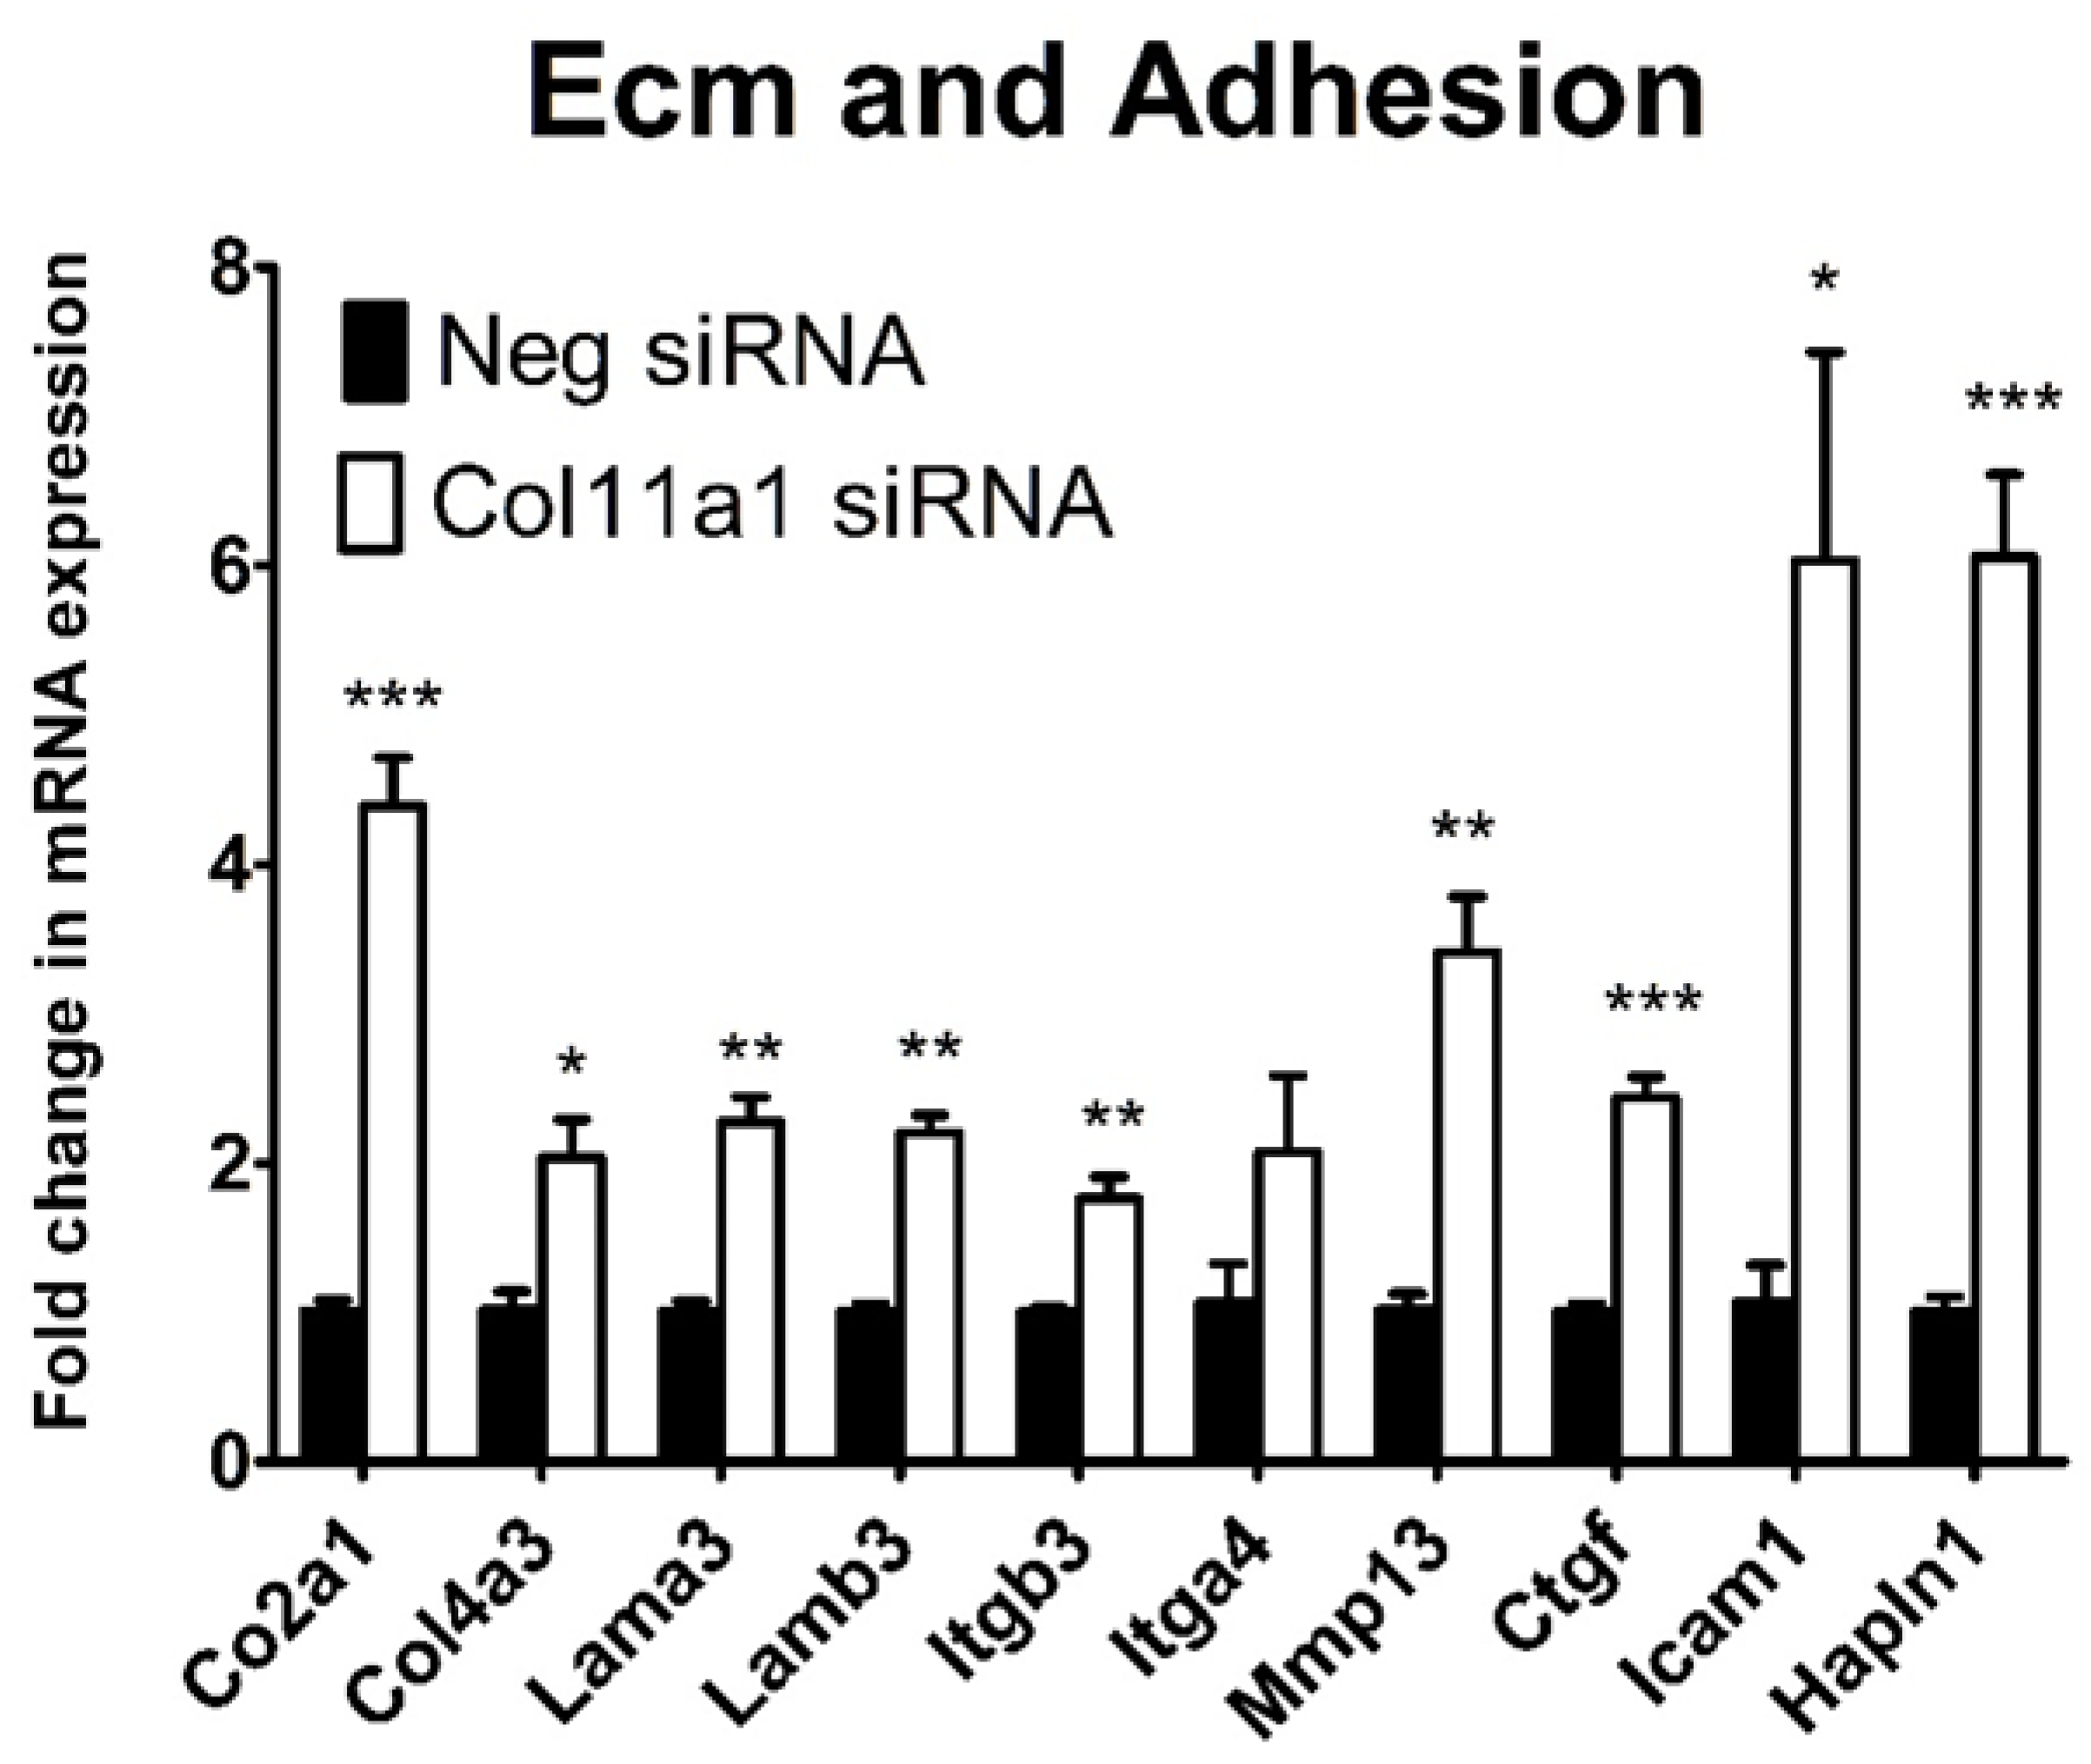
To further investigate the link of between Col11a1 mRNA expression and cartilage development, we utilized a quantitative RT-PCR profiler array for extracellular matrix and adhesion genes. Consistent with our previous results, Mmp13 and Col2a1 were upregulated in the assay. Additionally, Hyaluronan and Proteoglycan Link Protein 1 (Hapln1), Connective tissue growth factor (Ctgf), Integrin beta 3 (Itgb3), Intercellular adhesion molecule 1 (Icam1), Laminin beta 3 (Lamb3), Laminin alpha 3 (Lama3) and collagen α3(IV)chain (Col4a3) were significantly increased by Col11a1 knockdown (Figure 6).

2.4. β-Catenin Signaling Pathway Activity Is Increased When Col11a1 Expression Is Inhibited during Chondrogenesis and Is Independent of Wnt Induction

Wnt/β-catenin signaling and the regulation of TCF/LEF transcriptional activity is essential in the development of cartilage [26,27]. Wnt/β-catenin unregulated activity in cells of the chondrocyte lineage negatively influence tissue morphogenesis and consequently leads to disease [28]. GSK3β is a constitutively expressed, multifunction, protein kinase involved in a variety of cellular mechanisms, including homeostasis of the cartilage [29,30]. Phosphorylation of GSK3β at serine 9 uniquely inhibits the molecule’s kinase activity [29,31]. Active GSK3β can phosphorylate β-catenin when in complex with Axin2, leading to β-catenin degradation by an E3 ubiquitin ligase complex and proteasomes and a resulting decrease in the cytoplasmic levels of b-catenin [32,33]. In contrast, inactive GSK3β would not phosphorylate β-catenin, and not lead to β-catenin degradation by the proteasome.
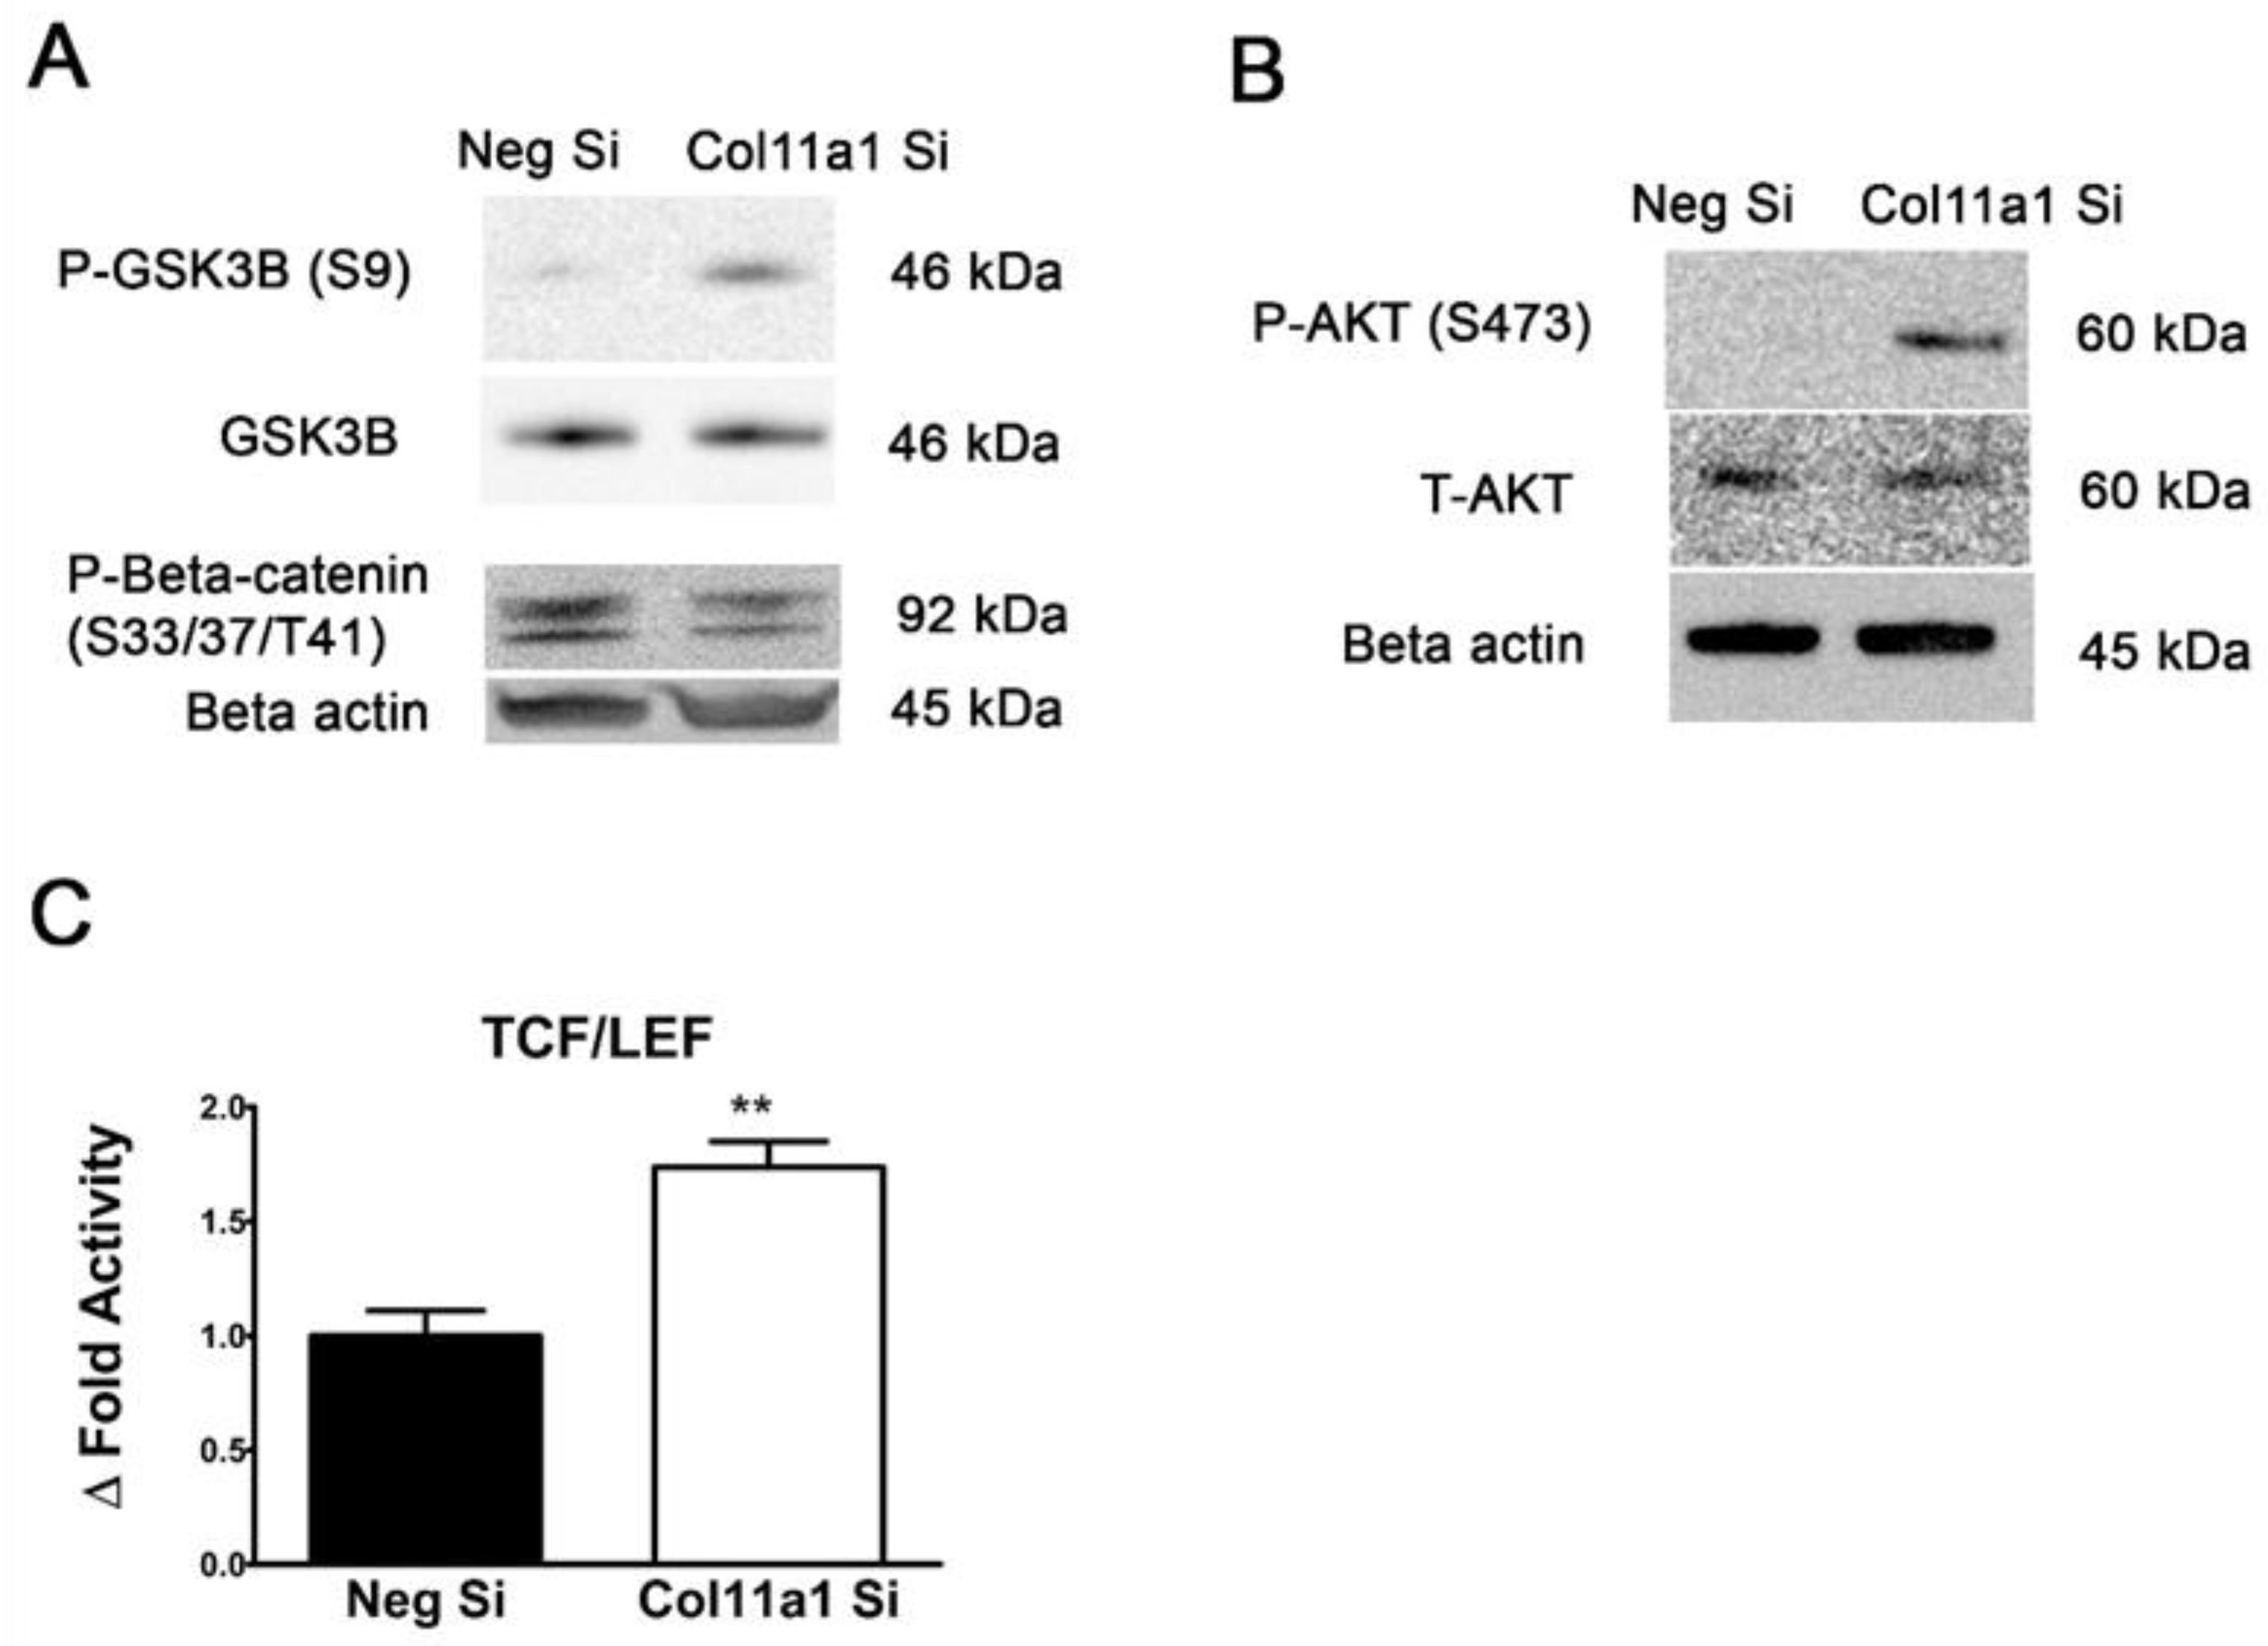
GSK3β is switched off by phosphorylation at serine 9 in response to stimuli that include Wnt3a and insulin. We observed that inhibition of Col11a1 expression increased the phosphorylation of GSK3β at serine 9, corresponding to a decrease in GSK3β kinase activity. Additionally, we observed a corresponding decrease in the amino terminal β-catenin phosphorylation (Figure 7A). Interestingly, we also observed increased AKT phosphorylation at serine 473 upon treatment with Col11a1 siRNA (Figure 7B).
In addition to changes in AKT, GSK3β, and β-catenin phosphorylation, we observed increased TCF/LEF activity when measured by luciferase assay with the TOP:FLASH reporter construct (Figure 7C), supporting the idea that Col11a1 knockdown resulted in increased Wnt/β-catenin signaling.
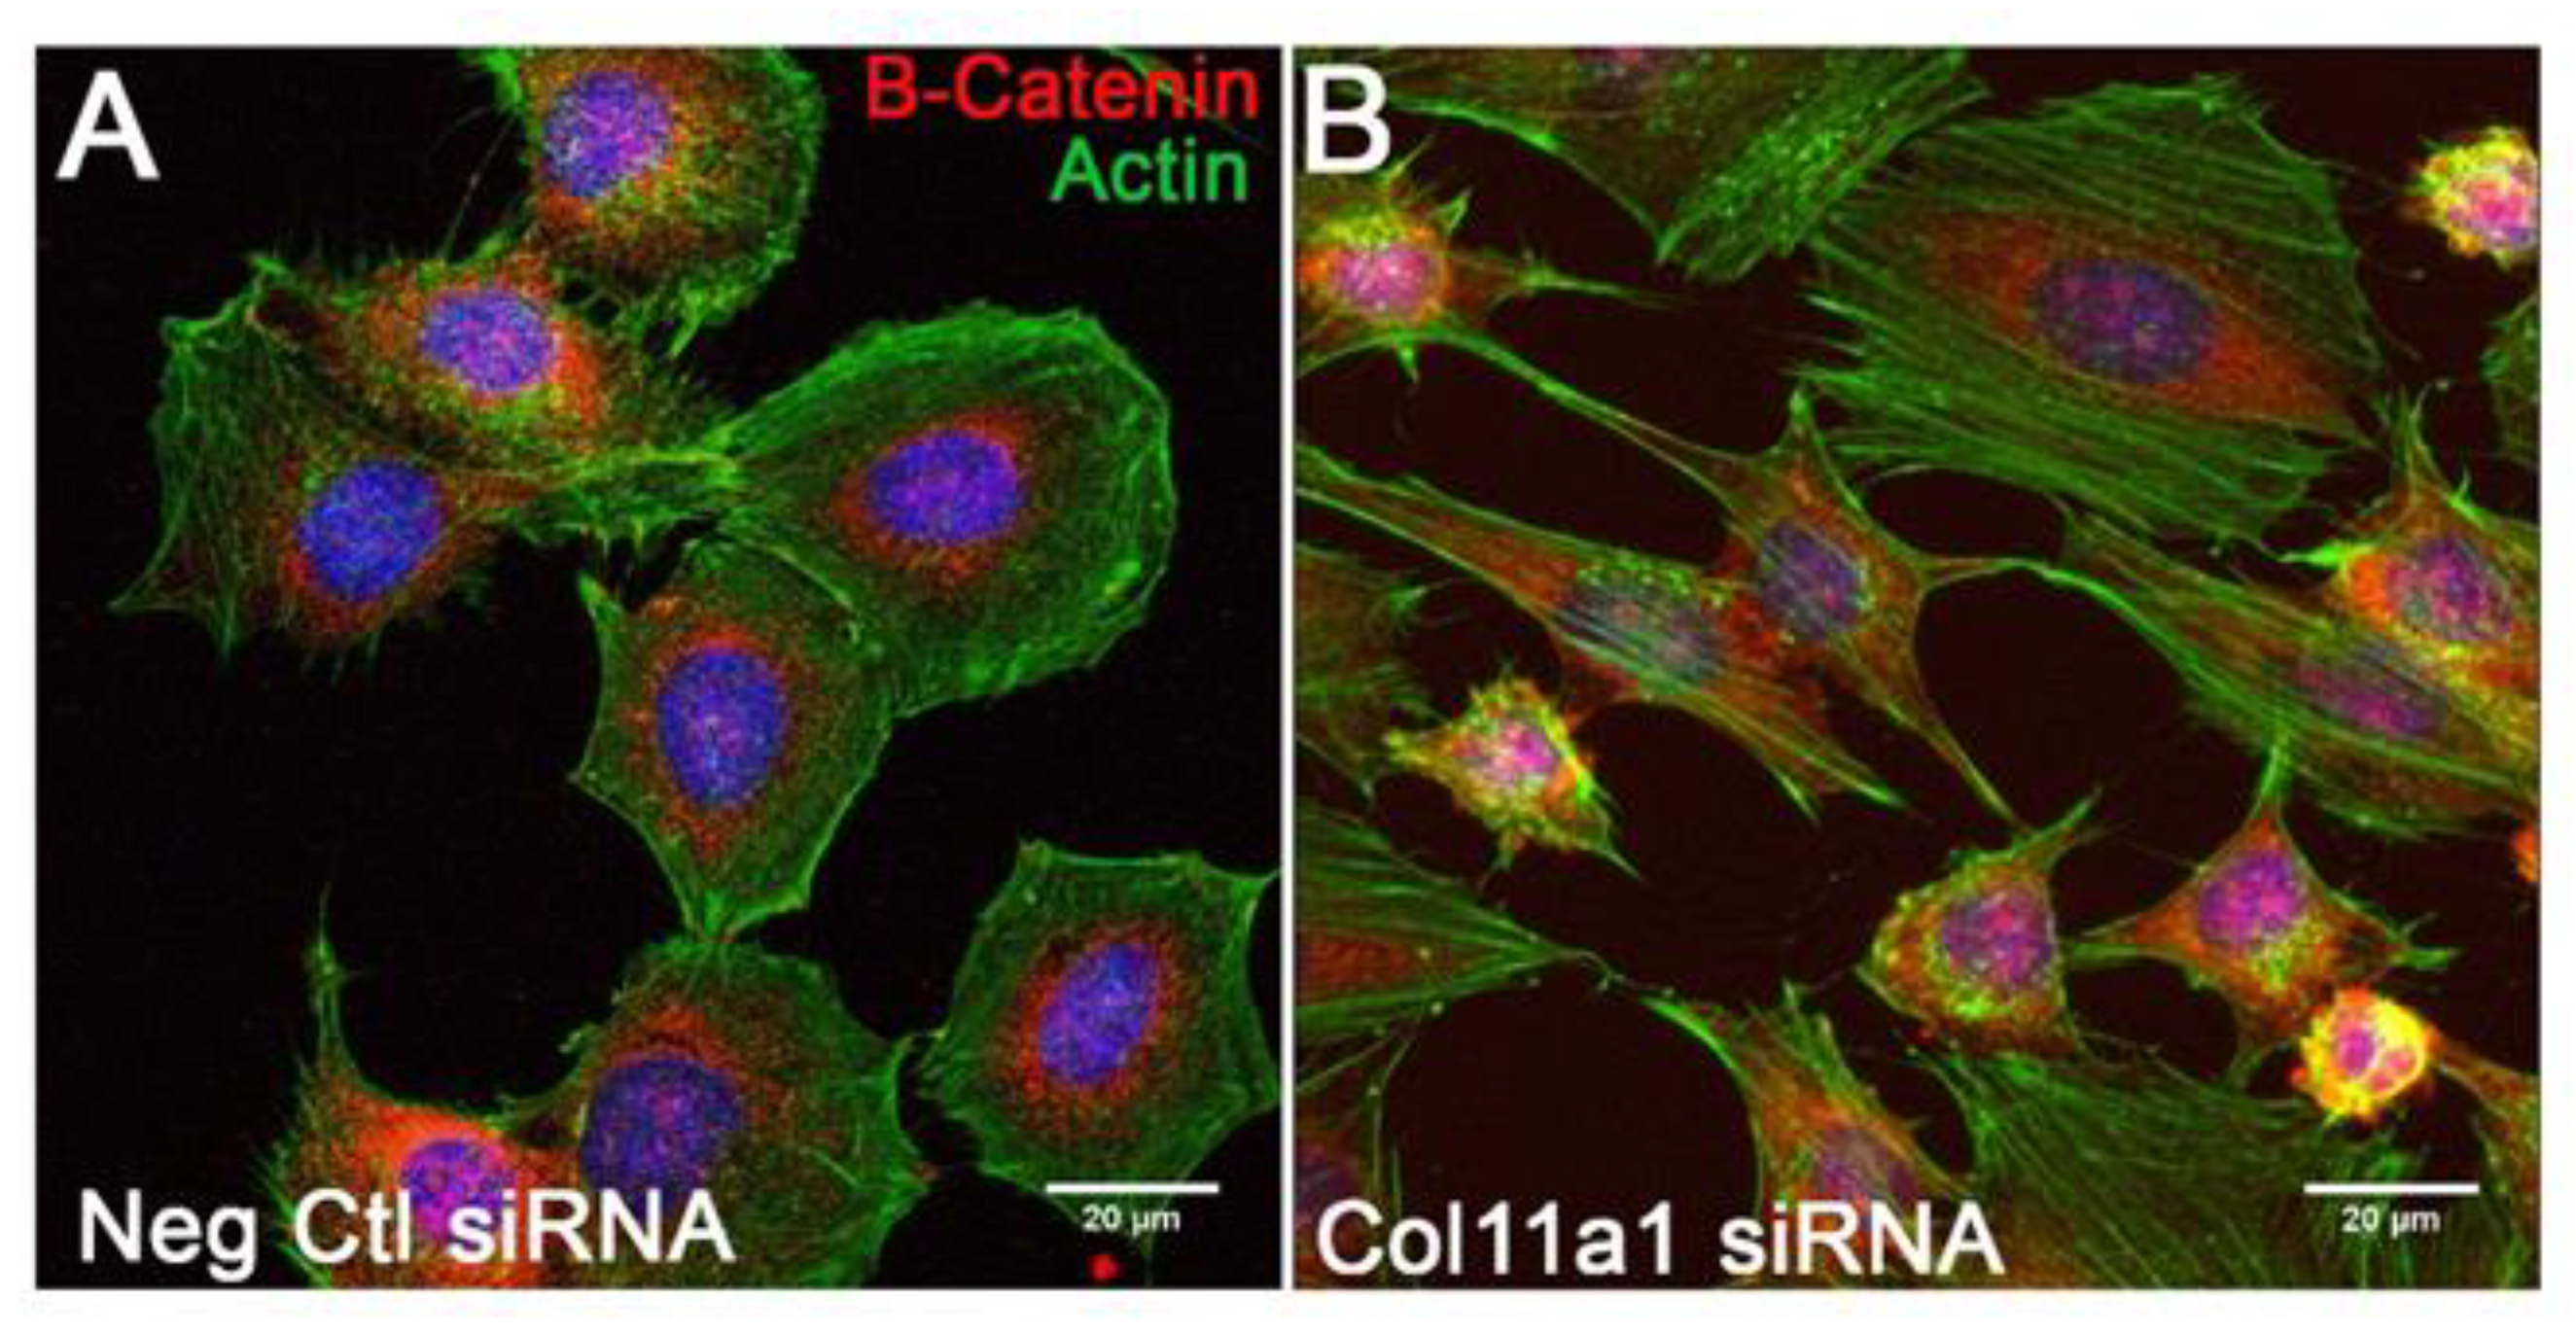
To identify changes in cell shape and localization of β-catenin caused by Col11a1 expression we used immunofluorescence microscopy. Actin fibers in control chondrocytes had a cortical actin distribution consistent with a chondrocyte phenotype. In contrast, inhibition of Col11a1 expression prevented cortical actin and favored cell spreading and stress fiber formation. Additionally, β-catenin was localized perinuclearly and β-catenin appeared throughout the cytoplasm of the cell (Figure 8).
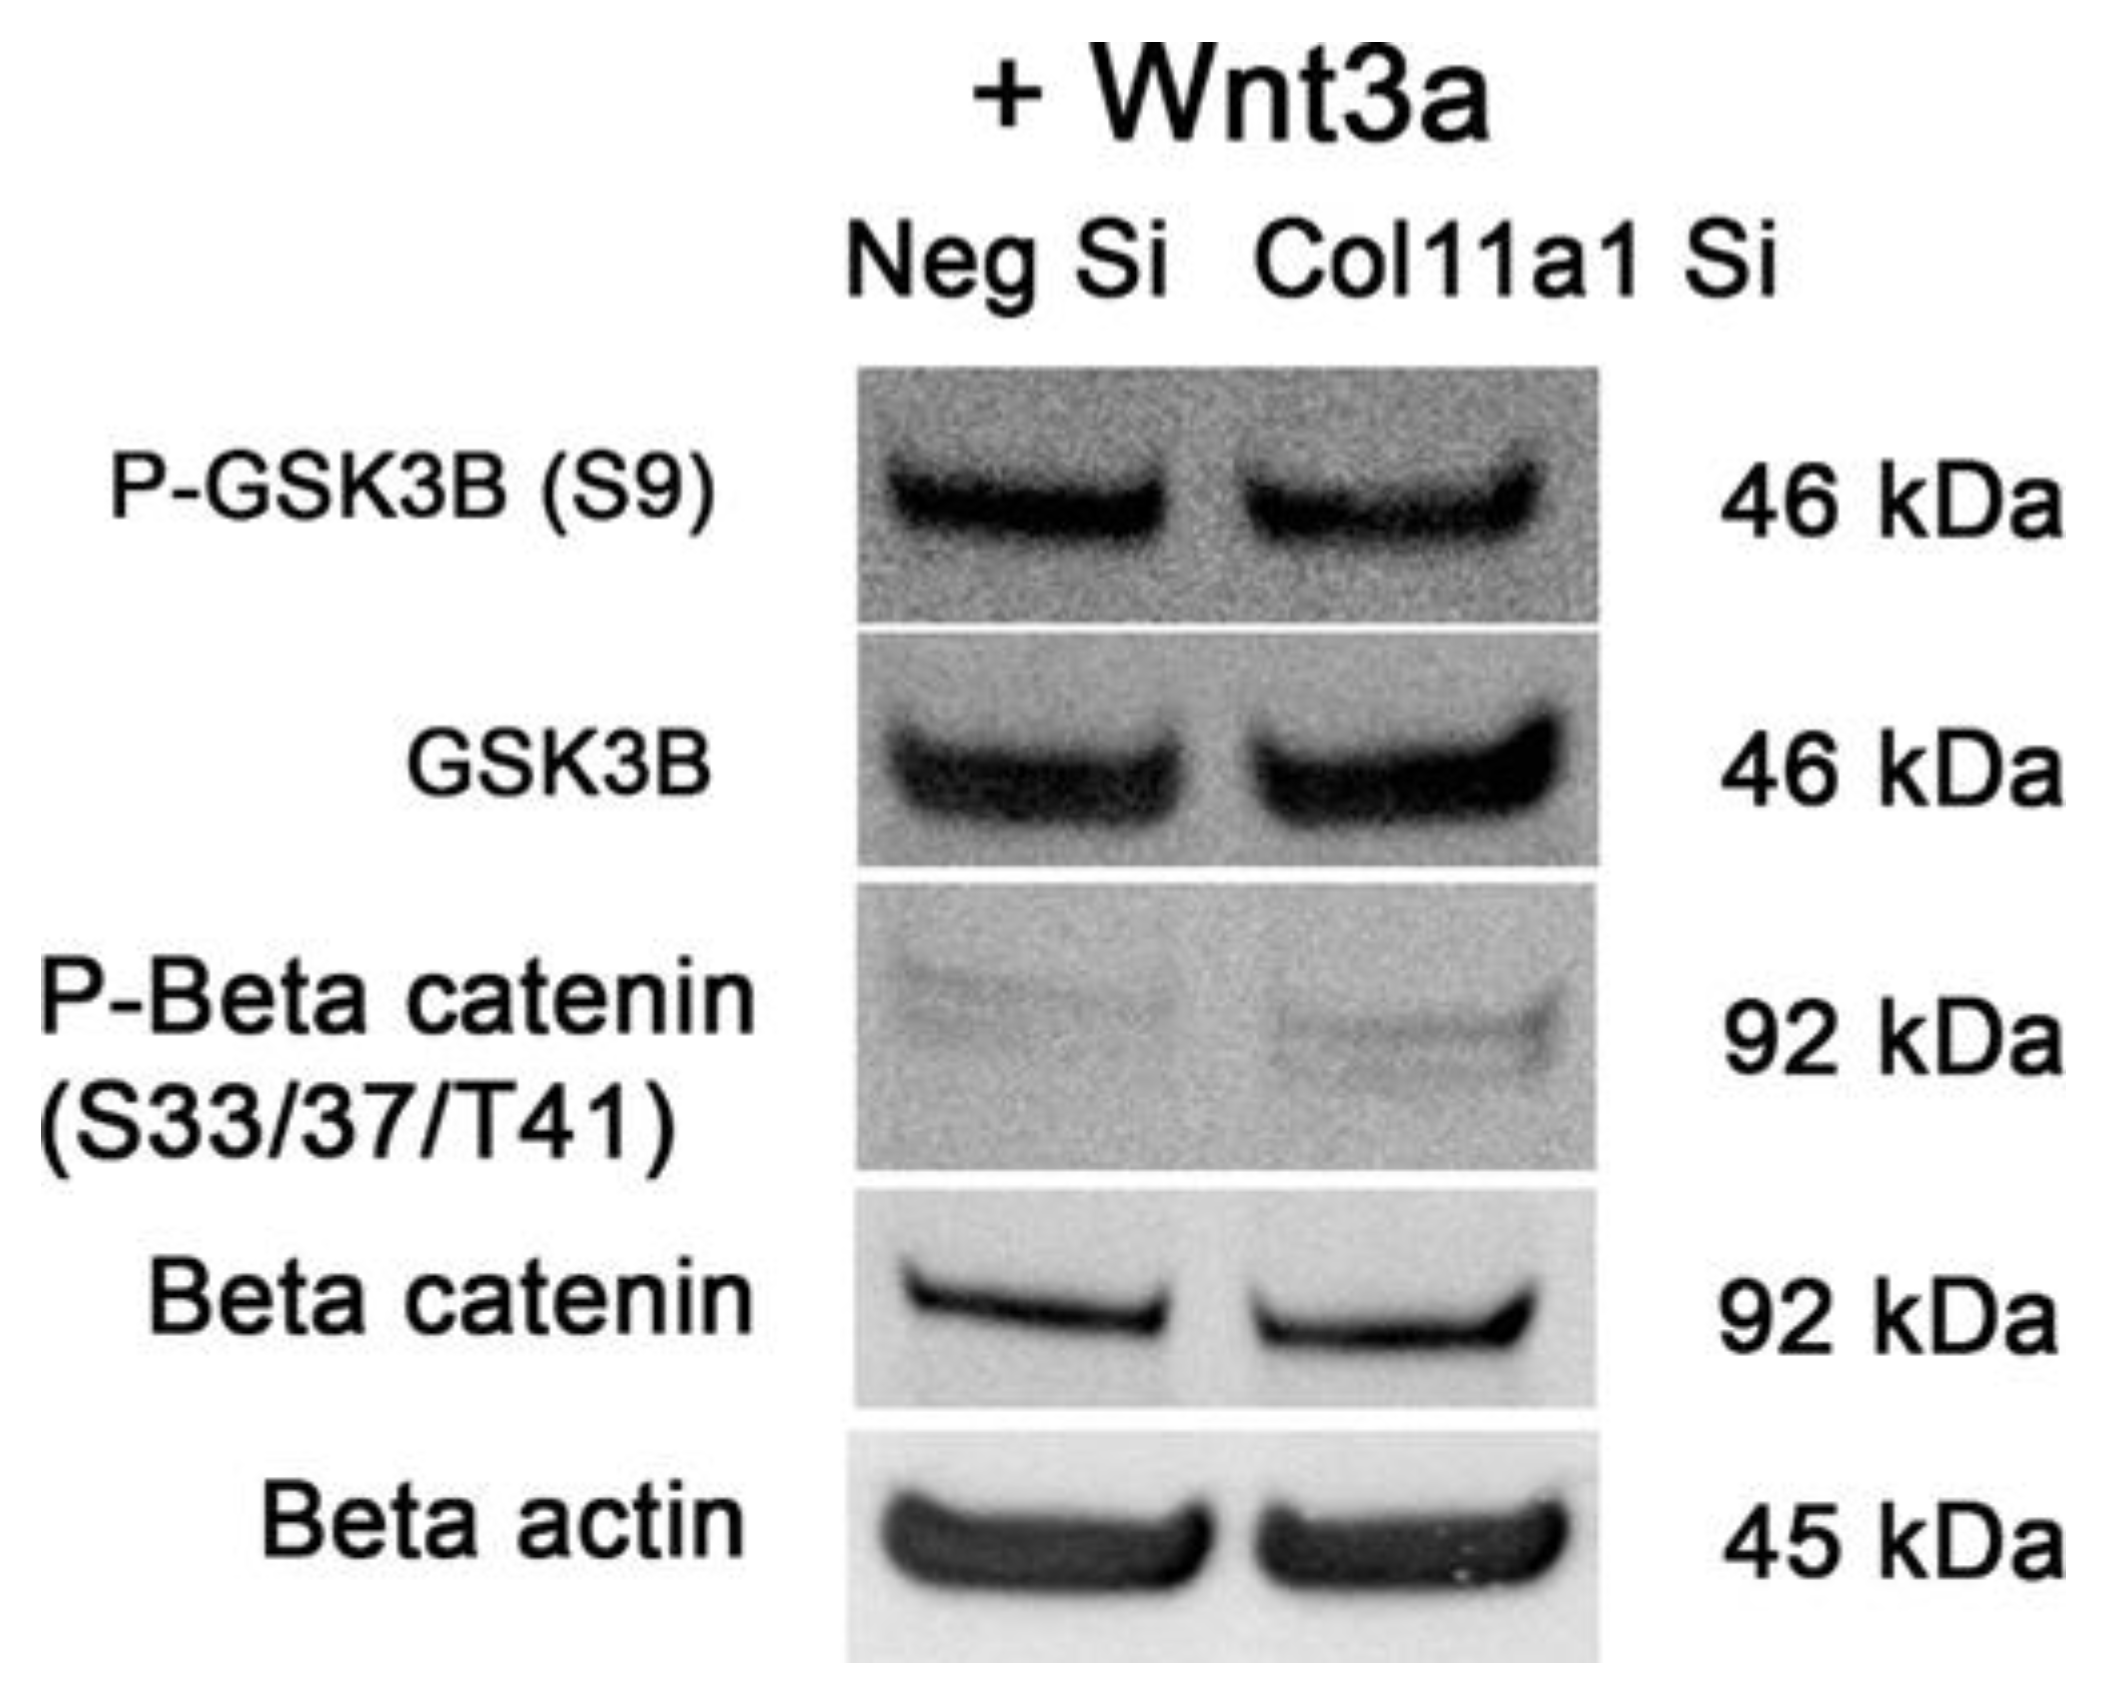
Stimulation of the canonical Wnt signaling pathway with recombinant Wnt3a protein was not inhibited by Col11a1 knockdown as indicated by substantial GSK3β phosphorylation and decreased β-catenin phosphorylation in both the negative control and Col11a1 siRNA treated samples (Figure 9). Wnt3a protein stimulated the Wnt/β-catenin pathway independent of Col11a1.

3. Discussion

This is the first demonstration of the link between the extracellular matrix protein collagen α1(XI) chain and the activation of the AKT/GSK3β/β-catenin pathway during skeletal development. This cell culture model system provides a means by which to ask questions relevant to chondrodysplasia in vitro. These results support the hypothesis that Col11a1 expression is required for chondrocyte differentiation and later steps of chondrocyte maturation during endochondral ossification. Mutations in the human COL11A1 gene cause severe chondrodysplasia, affecting bones that develop by endochondral ossification, including the craniofacial skeleton, long bones, and the vertebrae [4,5,6,34,35]. Although the shape and structure of skeletal tissues impacted by COL11A1 mutations have been described radiologically and at the ultrastructural level, the response of the cells to the altered matrix have not been fully characterized [12]. Since the cells are ultimately responsible for both generating and maintaining tissues, understanding the consequences of the absence or reduction of COL11A1 expression has important ramifications for skeletal development, disease progression and therapies. We hypothesize that COL11A1 expression is required for mesenchymal, prechondrogenic cells to transition to mature chondrocytes.
In this study, we investigated the relationship between chondrocyte phenotype and the expression of Col11a1 using a mouse cell culture model system. We inhibited the expression of Col11a1 during chondrogenesis by transfecting prechondrocytes with siRNA targeting Col11a1 mRNA prior to inducing differentiation with ITS and ascorbate 2-phosphate (A2P). The siRNA prevented the normal upregulation of Col11a1 expression, thus creating a cell culture model system in which to investigate the effects of collagen α1(XI) protein deficiency on chondroprogenitor differentiation during cartilage development. We found that cells adopt a non-chondrocytic morphology, reduce matrix production detected by Alcian blue, alter gene expression, and activate AKT/GSK3β/β-catenin pathway when treated with siRNA for Col11a1. Based on these results, we propose that Col11a1 expression attenuates signaling in chondroprogenitor cells to regulate chondrocyte maturation and endochondral ossification.
Collagen type XI’s role in skeletal development has previously been described as a structural constituent regulating collagen nucleation and fibril diameter. Additionally, Col11a1 expression in cell culture models, including ATDC5 cells, has been used to identify cells as having a chondrocyte phenotype [21,36]. This study supports the role for Col11a1 expression as essential for skeletal development (Li et al. 1995). Further, the results of this study are consistent with the idea that Col11a1 is an early mediator of chondrogenesis required to establish the overt chondrocyte phenotype from a mesenchymal prechondrocyte.
Mutations in the COL11A1 gene cause the severe skeletal dysplasia, fibrochondrogenesis. Skeletal development is severely affected in fibrochondrogenesis, causing craniofacial defects such as micrognathia and long bone defects with flared metaphysis attributed to disorganization of the growth plate [6,37,38]. Additionally, the cartilage of the larynx is often weak and causes respiratory distress, which is ultimately lethal. These morphological descriptions support collagen α1(XI)’s role to promote cell shape, behavior and cartilage growth. The results presented in this study suggest that the inability of cells to stabilize the cell shape and cortical actin, cell-cell interactions requiring N-cadherin and β-catenin promote cell shape, prechondrogenic cell condensations, and regulate Wnt signaling [39,40,41,42]. Down regulation of these cell adhesions in favor of matrix-cell interactions is an essential step in chondrogenesis. Therefore, the inability of cells to establish stable cell-cell adhesions or transition to cell-matrix interactions may cause changes at the cellular level consistent with Col11a1 associated chondrodysplasia in mouse.
The observed increases in mineralization may be due to accelerated hypertrophic differentiation or cartilage calcification in the absence of intermediate steps. Phosphorylation of GSK3β has previously been shown to promote hypertrophic differentiation [31]. Hypertrophic chondrocytes are a normal part of the endochondral ossification pathway and are required to initiate mineralization in the growth plate under normal conditions [43,44]. On the other hand, premature initiation of the hypertrophic differentiation program has detrimental effects on the cartilage growth and integrity [45,46]. Additionally, hypertrophic chondrocytes can potentially transdifferentiate into osteoblasts during normal endochondral ossification [47].
Interestingly, we found that increased expression of Col2a1 and Mmp13 occurred upon knockdown of Col11a1. These results indicate that the expression of Col2a1 and Mmp13 is linked to collagen α1(XI) through an unidentified genetic network. The upregulation of Mmp13 was previously described in the articular cartilage of chondrodysplasia (cho) mouse with heterozygous null mutation in Col11a1 [48,49]. The researchers proposed that increased Mmp13 expression degraded the pericellular matrix and exposed chondrocyte discoidin domain-2 receptor (DDR2) to interact with the surrounding matrix, mainly collagen type II. The changes in gene expression in this study agree with their hypothesis.
It is relevant to explain that the Col2a1 mRNA transcripts detected in our assays were total Col2a1 mRNA, and could not account for alternative splicing; therefore, it is possible that the increase in Col2a1 mRNA is primarily Col2a1 containing exon 2, which is highly expressed in mesenchymal cells. In contrast Col2a1 transcripts lacking exon 2 are primarily found in differentiated chondrocytes [50,51,52,53]. Future investigation will include analysis of the Col2a1 splicing pattern to further understand the cellular phenotype involved in Col11a1 expression.
The genes Hapln1, Ctgf, and Itgb3 each have essential roles in tissue morphogenesis and cartilage development and were upregulated by Col11a1 knockdown. Hapln1 is an essential constituent of the cartilage matrix whose expression stabilizes aggrecan and hyaluronan interaction [54]. Hapln1 overexpression has recently been linked to mesenchymal stem cell phenotype associated with the expression of β-catenin [55]. Ctgf is involved in both insulin-mediated AKT/GSK3β signaling and hypertrophic chondrocyte differentiation [56,57,58,59]. Additionally, the up regulation of Itgb3, which along with the ItgaV gene products, interact with the IGF-1 receptors enhances AKT signaling [60]. In agreement with the changes in gene expression, we observed that AKT and GSK3β phosphorylation was increased in the absence of collagen α1(XI) protein in ATDC5 cells and that TCF/LEF activity was increased overall. A previous study found that GSK3β inhibition in the cartilage induces cartilage degradation and decreases glycosaminoglycan detection [30]. Interestingly, inhibition of GSK3β was recently shown to increase the volume of trabecular bone [61,62]. Additionally, GSK3β inhibitors enhanced fracture healing by altering the mineralization pattern and skipping the formation of a cartilage template [63]. Consistent with these findings, we have observed in previous studies, that collagen α1(XI) protein deficiency alters mineralization patterns, increase bone collar thickness and leads to wider trabecular structures, yet this is the first time we have implicated chondroprogenitor cells in the process of calcification [5,64].
RNA silencing using siRNA knockdown has limitations in that it may not completely degrade all target mRNA and expression may recover over time. We confirmed the stability of the knockdown using quantitative RT-PCR, western blot analysis, and immunofluorescence microscopy. Because of the transient nature of the mRNA silencing, this study focused on expression occurring within the first week of culture. Differentiation was induced by including ITS and ascorbate 2-phosphate in the medium. This in vitro model provides insight into the cellular response to altered cartilage matrix induced by genetic defects in chondrocytes, yet cannot provide information about neighboring tissue interactions.
This work suggests that it may be possible to rescue some aspects of chondrodysplasia caused by collagen α1(XI) deficiency by modulating AKT, GSK3β, or β-catenin activity in mouse. Future directions will improve upon the understanding of the relationship between human COL11A1 and AKT/GSK3β/β-catenin, including activators and inhibitors of these cell signaling intermediates in cell culture and animal model systems. COL11A1 gene defects are also associated with intervertebral disc degeneration, nonsyndromic hearing loss [65], and osteoarthritis and may induce similar cellular responses in these conditions. Additionally, questions regarding the roles of the other collagen type XI and V alpha chains as well as alternative spliced forms of collagen α1(XI) remain to be investigated. This information may lead to development of cell based and tissue regeneration therapies for surgical intervention or fracture healing.
The requirement for Col11a1 gene expression to establish the chondrocyte phenotype during cartilage development is presented here. We show that although considered a structural protein, loss of Col11a1 gene expression impacts cellular behavior and cell signaling pathways. Undoubtedly the mechanisms influencing the cell behavior are diverse and complex and therefore we are unlikely to isolate a single factor responsible for any deviations in behavior and function. Yet, understanding the cell phenotype at a particular stage provides the opportunity for investigation of cell targeted therapies.

4. Materials and Methods

4.1. Cell Culture

Mouse chondrogenic cell line ATDC5 cells were cultured in DMEM/F12 containing 5% fetal bovine serum and 100 I.U./mL penicillin and 100 µg/mL streptomycin. Cells were passaged at 80% confluence by dissociating with 0.25% trypsin/EDTA for 3-5 mins at 37°C. For differentiation experiments, the culture media was replaced with differentiation media after the cells reached 100% confluency. Differentiation media was DMEM:F12 supplemented with Insulin (10 µg/mL), Transferrin (0.5 µg/mL) Selenium (0.0067 µg/mL) (ITS, Gibco) and 50 µg/mL ascorbic acid 2-phosphate (A2P) (Wako Chemicals, USA). The differentiation media was replaced every other day for the duration of the experiment.

4.2. Col11a1 Knockdown by siRNA Transfection

ATDC5 cells were seeded in 6-well plates with 2.5 x 10⁶ cells per well in culture media and allowed to reach 80-90% confluency prior to transfection. siRNA targeting Col11a1 was designed and purchased from Invitrogen. The 21-base pair double stranded siRNA was generated from interrogating RefSeq NM_007729.2 and targeting exon 2 at nucleotide location 590. Lipofectamine RNAiMAX was used for transfections following standard protocols. Transfections were performed in triplicate with a siRNA-lipid complex master mix prepared in Opti-MEM media. The final master mix solution contained 1 mL Opti-MEM, 10 µL of 10 µM siRNA stock and18 µL of Lipofectamine RNAiMAX. Control wells were transfected with negative control siRNA and performed in triplicate with each experiment under the same conditions as the experimental siRNA. BLOCK-iT Alexa Fluor Red Fluorescent Oligo was used to determine and optimize the transfection efficiency. A transfection efficiency of 90-100% was achieved when determined by monitoring uptake of the fluorescent oligonucleotide. Cell cultures recovered for 24 hours before changing the media to differentiation medium.

4.3. 3D Micromass Cultures

Micromass cultures were generated by dissociating cells with 0.25% trypsin/EDTA from the wells and resuspending to 2.0 x 10⁷ cells/mL in differentiation medium containing ITS and 50 µg/mL ascorbate 2-phosphate. Ten microliters of the cell suspension was gently spotted in tissue culture wells. The cells were allowed to adhere for 2-3 hours in a tissue culture incubator at 37°C with 5% CO2 before adding additional medium. The medium was changed every other day for the duration of the experiment.

4.4. Quantitative RT-PCR (qPCR) Analysis

RNA was extracted and purified using the RNAeasy minikit following manufacturer’s instructions (Qiagen). Isolated RNA was analyzed by spectrophotometry for purity and quantity and used immediately for cDNA synthesis or alternatively, aliquoted and stored at -80°C. RNA was reverse transcribed into cDNA using the RT2 first strand kit. The cDNA template was analyzed by qRT-PCR reaction using Sybr Green and specific primers or directly in RT2 profiler PCR arrays in 96 well format. Reactions were carried using the Roche Lightcycler 96 target specific primers (Table 1). The relative amount of PCR product was normalized to the indicated reference genes and the change in threshold cycle (dCt) was compared using Student’s t-test. The fold change was calculated using the 2-ΔΔCt method [66].

4.5. Luciferase Assays

Cignal 45-pathway reporter array was used to identify changes in transcription factor activity following manufactures instructions. Lipofectamine 2000 was used with Opti-Mem to simultaneously reverse transfect Col11a1 siRNA and a mixture of transcription factor responsive firefly luciferase reporter and a constitutively expressing Renilla constructs. 5.0 x10³ cells per well were added to each well of a 96-well plate containing 100 µL of transfection media containing 10 µM Col11a1 siRNA and 0.8 µL Lipofectamine 2000 per well. The cells were incubated at 37°C with 5% CO2 for 24 hours prior to changing the media to the indicated treatment. Dual luciferase reporter assay system and Glomax multi detection system was used to measure the activity of the transcription factors following standard protocol.

4.6. Western Blot Analysis

Cell lysates were extracted using ice-cold radioimmunoprecipitation (RIPA) cell lysis buffer (ThermoFisher Scientific) supplemented with protease and phosphatase inhibitor cocktails added directly to the wells of six-well plates after washing with cold phosphate buffered saline (PBS). The cell lysates were collected and added to microcentrifuge tubes and the supernatant was cleared by centrifugation at 4°C, 14,000xg for 15 min and transferred to a new tube. Protein lysates were quantified using bicinchoninic (BCA) protein assay (Pierce). Proteins were separated by SDS PAGE and then transferred to nitrocellulose membranes for western blot analysis. SDS-PAGE gels were stained with coomassie blue to verified equal amounts of loading and transfer for each sample. Membranes were blocked using a 5% (w/v) non-fat milk solution in Tris-buffered saline with 0.1% Tween-20, pH 7.4 (TBST) buffer for 1 hour at room temperature prior to incubation with primary antibodies. Primary antibodies were diluted in 5% (w/v) bovine serum albumin (BSA) in TBST prior to overnight incubation of the membranes at 4°C with shaking. Immunoblots were washed and then incubated with horseradish peroxidase (HRP) conjugated secondary antibodies for 1 hour at room temperature. Signal was detected using Pierce enhanced chemiluminescence (ECL) western blotting substrate. Western blots were performed using the following rabbit primary antibodies from Cell Signaling Technology at a dilution of 1:1000 unless otherwise stated: phospho-β-catenin (Ser33/37/Thr41), β-catenin (6B3) mAb, AKT, phospho-AKT (1:2000) (Ser473) (D9E) XP mAb, Gsk-3beta, phospho-GSK3-β (Ser9) (5B3) mAb, β-Actin (13E5) mAb. Collagen type XI α1 chain specific rabbit polyclonal antibodies were designed to recognize epitopes within the amino propeptide (7990) or variable region 2 (1703) [36].

4.7. Alcian Blue and Alizarin Red Staining

Cells were differentiated for the indicated times and then stained with 0.1% Alcian blue 8GX in 1N HCl at 4°C overnight. For detection of matrix calcification, Alizarin Red solution (pH 4.2) was added for 5 min at room temperature and then washed with deionized water three times before imaging.

4.8. Immunocytochemistry

Cells were seeded on sterilized coverslips in 6-well plates in differentiation medium. Cells were fixed with 4% paraformaldehyde in PBS for 10 min at room temperature and washed 3 times with cold PBS. When required, permeabilization was performed by incubating samples for 10 min in 0.1% Triton X-100. Non-specific binding was blocked using 1% (w/v) BSA in PBS + 0.1% Tween20 (PBST) for 30 min at room temperature. Samples were incubated with diluted antibodies in 1% (w/v) BSA/PBST in a covered chamber overnight. Cells were incubated with secondary antibodies for 1 hour at room temperature in the dark. Counter stain for nuclei was performed by using Prolong gold anti fade mounting media with DAPI.

Author Contributions

Conceptualization, methodology, formal analysis, investigation, writing, reviewing and editing J.C.R and J.T.O.; All authors have read and agreed to the published version of the manuscript.

Funding

We acknowledge support from the National Institutes of Health under Grants #P20GM109095, #R01AR47985, #K02AR48672, and #R15HD059949. We also acknowledge support from BSU-Biomolecular Research Center, RRID:SCR_019174; the M. J. Murdock Charitable Trust; Lori and Duane Stueckle, and the Idaho State Board of Education.

Institutional Review Board Statement

Not applicable.

Informed Consent Statement

Not applicable.

Data Availability Statement

Data supporting reported results is included in this manuscript.

Acknowledgments

Authors wish to acknowledge Diane Smith and Tracy Yarnell for technical and administrative support.

Conflicts of Interest

The authors declare no conflict of interest.

References

  1. Hall, B., and Miyake, T. 2000. All for one and one for all: condensations and the initiation of skeletal development. BioEssays 22(2): 138–147.
  2. Kronenberg, H.M. 2003. Developmental regulation of the growth plate. Nature 423(6937): 332–336. [CrossRef]
  3. Berendsen, A., and Olsen, B. 2015. Bone development. Bone 80: 14–8.
  4. Li, Y., Lacerda, D., Warman, M., Beier, D., Yoshioka, H., Ninomiya, Y., Oxford, J., Morris, N., et al. 1995. A fibrillar collagen gene, Col11a1, is essential for skeletal morphogenesis. Cell 80(3): 423–30. [CrossRef]
  5. Hafez, A., Squires, R., Pedracini, A., Joshi, A., Seegmiller, R., and Oxford, J. 2015. Col11a1 Regulates Bone Microarchitecture during Embryonic Development. J. Dev. Biol. 3(4): 158–176. [CrossRef]
  6. Tompson, S., Bacino, C., Safina, N., Bober, M., Proud, V., Funari, T., Wangler, M., Nevarez, L., Ala-Kokko, L., Wilcox, W., Eyre, D., Krakow, D., and Cohn, D. 2010. Fibrochondrogenesis results from mutations in the COL11A1 type XI collagen gene. Am. J. Hum. Genet. 87(5): 708–12. [CrossRef]
  7. Hufnagel, S., Weaver, K., Hufnagel, R., Bader, P., Schorry, E., and Hopkin, R. 2014. A novel dominant COL11A1 mutation resulting in a severe skeletal dysplasia. Am. J. Med. Genet. A 164A(10): 2607–12. [CrossRef]
  8. Noponen-Hietala, N., Kyllönen, E., Männikkö, M., Ilkko, E., Karppinen, J., Ott, J., and Ala-Kokko, L. 2003. Sequence variations in the collagen IX and XI genes are associated with degenerative lumbar spinal stenosis. Ann. Rheum. Dis. 62(12): 1208–14. [CrossRef]
  9. Rodriguez, R., Seegmiller, R., Stark, M., and Bridgewater, L. 2004. A type XI collagen mutation leads to increased degradation of type II collagen in articular cartilage11. Osteoarthr. Cartil. 12(4): 314–320. [CrossRef]
  10. Raine, E., Dodd, A., Reynard, L., and Loughlin, J. 2013. Allelic expression analysis of the osteoarthritis susceptibility gene COL11A1 in human joint tissues. BMC Musculoskelet. Disord. 14(1): 85. [CrossRef]
  11. Morris, N., and Bächinger, H. 1987. Type XI collagen is a heterotrimer with the composition (1 alpha, 2 alpha, 3 alpha) retaining non-triple-helical domains. J. Biol. Chem. 262(23): 11345–50. [CrossRef]
  12. Fernandes, R., Weis, M., Scott, M., Seegmiller, R., and Eyre, D. 2007. Collagen XI chain misassembly in cartilage of the chondrodysplasia (cho) mouse. Matrix Biol. 26(8): 597–603. [CrossRef]
  13. Blaschke, U., Eikenberry, E., Hulmes, D., Galla, H., and Bruckner, P. 2000. Collagen XI nucleates self-assembly and limits lateral growth of cartilage fibrils. J. Biol. Chem. 275(14): 10370–8. [CrossRef]
  14. Gregory, K., Oxford, J., Chen, Y., Gambee, J., Gygi, S., Aebersold, R., Neame, P., Mechling, D., Bächinger, H., and Morris, N. 2000. Structural organization of distinct domains within the non-collagenous N-terminal region of collagen type XI. J. Biol. Chem. 275(15): 11498–506. [CrossRef]
  15. Holmes, D., and Kadler, K. 2006. The 10+4 microfibril structure of thin cartilage fibrils. Proc. Natl. Acad. Sci. 103(46): 17249–17254. [CrossRef]
  16. Bernard, M., Yoshioka, H., Rodriguez, E., Van der Rest, M., Kimura, T., Ninomiya, Y., Olsen, B., and Ramirez, F. 1988. Cloning and sequencing of pro-alpha 1 (XI) collagen cDNA demonstrates that type XI belongs to the fibrillar class of collagens and reveals that the expression of the gene is not restricted to cartilagenous tissue. J. Biol. Chem. 263(32): 17159–66. [CrossRef]
  17. Oxford, J., DeScala, J., Morris, N., Gregory, K., Medeck, R., Irwin, K., Oxford, R., Brown, R., Mercer, L., and Cusack, S. 2004. Interaction between amino propeptides of type XI procollagen alpha1 chains. J. Biol. Chem. 279(12): 10939–45. [CrossRef]
  18. Warner, L., Brown, R., Yingst, S., and Oxford, J. 2006. Isoform-specific Heparan Sulfate Binding within the Amino-terminal Noncollagenous Domain of Collagen α1(XI). J. Biol. Chem. 281(51): 39507–39516. [CrossRef]
  19. Brown, R., Mallory, C., McDougal, O., and Oxford, J. 2011. Proteomic analysis of Col11a1-associated protein complexes. Proteomics 11(24): 4660–76. [CrossRef]
  20. Goldring, M., Tsuchimochi, K., and Ijiri, K. 2006. The control of chondrogenesis. J. Cell. Biochem. 97(1): 33–44. [CrossRef]
  21. Chen, L., Fink, T., Zhang, X., Ebbesen, P., and Zachar, V. 2005. Quantitative transcriptional profiling of ATDC5 mouse progenitor cells during chondrogenesis. Differentiation 73(7): 350–363. [CrossRef]
  22. Altaf, F., Hering, T., Kazmi, N., Yoo, J., and Johnstone, B. 2006. Ascorbate-enhanced chondrogenesis of ATDC5 cells. Eur. Cell. Mater. 12: 64-9-70. [CrossRef]
  23. Yao, Y., and Wang, Y. 2013. ATDC5: An excellent in vitro model cell line for skeletal development. J. Cell. Biochem. 114(6): 1223–1229. [CrossRef]
  24. Verzijl, N., DeGroot, J., Thorpe, S., Bank, R., Shaw, J., Lyons, T., Bijlsma, J., Lafeber, F., Baynes, J., and TeKoppele, J. 2000. Effect of collagen turnover on the accumulation of advanced glycation end products. J. Biol. Chem. 275(50): 39027–31. [CrossRef]
  25. Toyama, B., and Hetzer, M. 2013. Protein homeostasis: live long, won’t prosper. Nat. Rev. Mol. Cell Biol. 14(1): 55–61. [CrossRef]
  26. Tamamura, Y., Otani, T., Kanatani, N., Koyama, E., Kitagaki, J., Komori, T., Yamada, Y., Costantini, F., Wakisaka, S., Pacifici, M., Iwamoto, M., and Enomoto-Iwamoto, M. 2005. Developmental regulation of Wnt/beta-catenin signals is required for growth plate assembly, cartilage integrity, and endochondral ossification. J. Biol. Chem. 280(19): 19185–95.
  27. Dao, D., Jonason, J., Zhang, Y., Hsu, W., Chen, D., Hilton, M., and O’Keefe, R. 2012. Cartilage-specific β-catenin signaling regulates chondrocyte maturation, generation of ossification centers, and perichondrial bone formation during skeletal development. J. Bone Miner. Res. 27(8): 1680–94.
  28. Usami, Y., Gunawardena, A., Iwamoto, M., and Enomoto-Iwamoto, M. 2016. Wnt signaling in cartilage development and diseases: lessons from animal studies. Lab. Investig. 96(2): 186–196. [CrossRef]
  29. Doble, B., and Woodgett, J. 2003. GSK-3: tricks of the trade for a multi-tasking kinase. J. Cell Sci. 116(7). [CrossRef]
  30. Miclea, R., Siebelt, M., Finos, L., Goeman, J., Löwik, C., Oostdijk, W., Weinans, H., Wit, J., Robanus-Maandag, E., and Karperien, M. 2011. Inhibition of Gsk3β in cartilage induces osteoarthritic features through activation of the canonical Wnt signaling pathway. Osteoarthr. Cartil. 19(11): 1363–1372. [CrossRef]
  31. Kawasaki, Y., Kugimiya, F., Chikuda, H., Kamekura, S., Ikeda, T., Kawamura, N., Saito, T., Shinoda, Y., Higashikawa, A., Yano, F., Ogasawara, T., Ogata, N., Hoshi, K., Hofmann, F., Woodgett, J.R., Nakamura, K., Chung, U., and Kawaguchi, H. 2008. Phosphorylation of GSK-3beta by cGMP-dependent protein kinase II promotes hypertrophic differentiation of murine chondrocytes. J. Clin. Invest. 118(7): 2506–15.
  32. Aberle, H., Bauer, A., Stappert, J., Kispert, A., Kemler, R., Aberle, H., Butz, S., Stappert, J., Weissig, H., Kemler, R., Hoschützky, H., Aberle, H., and Moon, R. 1997. beta-catenin is a target for the ubiquitin-proteasome pathway. EMBO J. 16(13): 3797–804.
  33. Delcommenne, M., Tan, C., Gray, V., Rue, L., Woodgett, J., and Dedhar, S. 1998. Phosphoinositide-3-OH kinase-dependent regulation of glycogen synthase kinase 3 and protein kinase B/AKT by the integrin-linked kinase. Proc. Natl. Acad. Sci. U. S. A. 95(19): 11211–6.
  34. Stevenson, D., Vanzo, R., Damjanovich, K., Hanson, H., Muntz, H., Hoffman, R., and Bayrak-Toydemir, P. 2012. Mosaicism in Stickler syndrome. Eur. J. Med. Genet. 55(6–7): 418–22.
  35. Faletra, F., D’Adamo, A.P., Bruno, I., Athanasakis, E., Biskup, S., Esposito, L., and Gasparini, P. 2014. Autosomal recessive Stickler syndrome due to a loss of function mutation in the COL9A3 gene. Am. J. Med. Genet. A 164A(1): 42–7.
  36. Davies, G., Oxford, J., Hausafus, L., Smoody, B., and Morris, N. 1998. Temporal and spatial expression of alternative splice-forms of the α1(XI) collagen gene in fetal rat cartilage. Dev. Dyn. 213(1): 12–26.
  37. Eteson, D., Adomian, G., Ornoy, A., Koide, T., Sugiura, Y., Calabro, A., Lungarotti, S., Mastroiacovo, P., Lachman, R.S., and Rimoin, D.L. 1984. Fibrochondrogenesis: radiologic and histologic studies. Am. J. Med. Genet. 19(2): 277–90.
  38. Whitley, C., Langer, L., Ophoven, J., Gilbert, E., Gonzalez, C., Mammel, M., Coleman, M., Rosemberg, S., Rodriques, C., Sibley, R., Horton, W., Opitz, J., and Gorlin, R. 1984. Fibrochondrogenesis: Lethal, autosomal recessive chondrodysplasia with distinctive cartilage histopathology. Am. J. Med. Genet. 19(2): 265–275.
  39. Komori, T., Yagi, H., Nomura, S., Yamaguchi, A., Sasaki, K., Deguchi, K., Shimizu, Y., Bronson, R., Gao, Y.-H., Inada, M., Sato, M., Okamoto, R., Kitamura, Y., Yoshiki, S., and Kishimoto, T. 1997. Targeted Disruption of Cbfa1 Results in a Complete Lack of Bone Formation owing to Maturational Arrest of Osteoblasts. Cell 89(5): 755–764.
  40. Modarresi, R., Lafond, T., Roman-Blas, J.A., Danielson, K.G., Tuan, R.S., and Seghatoleslami, M. 2005. N-cadherin mediated distribution of β-catenin alters MAP kinase and BMP-2 signaling on chondrogenesis-related gene expression. J. Cell. Biochem. 95(1): 53–63.
  41. Gao, L., McBeath, R., and Chen, C. 2010. Stem cell shape regulates a chondrogenic versus myogenic fate through Rac1 and N-cadherin. Stem Cells 28(3): 564–72.
  42. Marie, P., Haÿ, E., Modrowski, D., Revollo, L., Mbalaviele, G., and Civitelli, R. 2014. Cadherin-mediated cell-cell adhesion and signaling in the skeleton. Calcif. Tissue Int. 94(1): 46–54.
  43. Ballock, R., Heydemann, A., Wakefield, L., Flanders, K., Roberts, A., and Sporn, M. 1993. TGF-β1 Prevents Hypertrophy of Epiphyseal Chondrocytes: Regulation of Gene Expression for Cartilage Matrix Proteins and Metalloproteases. Dev. Biol. 158(2): 414–429.
  44. Vega, R., Matsuda, K., Oh, J., Barbosa, A., Yang, X., Meadows, E., McAnally, J., Pomajzl, C., Shelton, J., Richardson, J., Karsenty, G., and Olson, E. 2004. Histone Deacetylase 4 Controls Chondrocyte Hypertrophy during Skeletogenesis. Cell 119(4): 555–566.
  45. van der Kraan, P.M., and van den Berg, W.B. 2012. Chondrocyte hypertrophy and osteoarthritis: role in initiation and progression of cartilage degeneration? Osteoarthr. Cartil. 20(3): 223–232.
  46. Jayasuriya, C., Zhou, F., Pei, M., Wang, Z., Lemme, N., Haines, P., and Chen, Q. 2014. Matrilin-3 chondrodysplasia mutations cause attenuated chondrogenesis, premature hypertrophy and aberrant response to TGF-β in chondroprogenitor cells. Int. J. Mol. Sci. 15(8): 14555–73.
  47. Yang, L., Tsang, K., Tang, H., Chan, D., and Cheah, K. 2014. Hypertrophic chondrocytes can become osteoblasts and osteocytes in endochondral bone formation. Proc. Natl. Acad. Sci. 111(33): 12097–12102.
  48. Xu, L., Flahiff, C., Waldman, B., Wu, D., Olsen, B., Setton, L., and Li, Y. 2003. Osteoarthritis-like changes and decreased mechanical function of articular cartilage in the joints of mice with the chondrodysplasia gene (cho). Arthritis Rheum. 48(9): 2509–2518.
  49. Xu, L., Servais, J., Polur, I., Kim, D., Lee, P.L., Chung, K., and Li, Y. 2010. Attenuation of osteoarthritis progression by reduction of discoidin domain receptor 2 in mice. Arthritis Rheum. 62(9): 2736–2744.
  50. Hering, T., Wirthlin, L., Ravindran, S., and McAlinden, A. 2014. Changes in type II procollagen isoform expression during chondrogenesis by disruption of an alternative 5’ splice site within Col2a1 exon 2. Matrix Biol. 36: 51–63.
  51. McAlinden, A., Johnstone, B., Kollar, J., Kazmi, N., and Hering, T. 2008. Expression of two novel alternatively spliced COL2A1 isoforms during chondrocyte differentiation. Matrix Biol. 27(3): 254–66.
  52. Sandell, L., Morris, N., Robbins, J., and Goldring, M. 1991. Alternatively spliced type II procollagen mRNAs define distinct populations of cells during vertebral development: differential expression of the amino-propeptide. J. Cell Biol. 114(6): 1307-19.
  53. Sandell, L., Nalin, A., and Reife, R. 1994. Alternative splice form of type II procollagen mRNA (IIA) is predominant in skeletal precursors and non-cartilaginous tissues during early mouse development. Dev. Dyn. 199(2): 129–140.
  54. Yamada, Y., and Watanabe, H. 1999. Mice lacking link protein develop dwarfism and craniofacial abnormalities. Nat. Genet. 21(2): 225–229.
  55. Mebarki, S., Désert, R., Sulpice, L., Sicard, M., Desille, M., Canal, F., Dubois-Pot Schneider, H., Bergeat, D., Turlin, B., Bellaud, P., Lavergne, E., Le Guével, R., Corlu, A., Perret, C., Coulouarn, C., Clément, B., and Musso, O. 2016. De novo HAPLN1 expression hallmarks Wnt-induced stem cell and fibrogenic networks leading to aggressive human hepatocellular carcinomas. Oncotarget 7(26): 39026–39043.
  56. Nishida, T., Kubota, S., Fukunaga, T., Kondo, S., Yosimichi, G., Nakanishi, T., Takano-Yamamoto, T., and Takigawa, M. 2003. CTGF/Hcs24, hypertrophic chondrocyte-specific gene product, interacts with perlecan in regulating the proliferation and differentiation of chondrocytes. J. Cell. Physiol. 196(2): 265–275.
  57. Zhou, Y., Capuco, A., and Jiang, H. 2008. Involvement of connective tissue growth factor (CTGF) in insulin-like growth factor-I (IGF1) stimulation of proliferation of a bovine mammary epithelial cell line. Domest. Anim. Endocrinol. 35(2): 180–189.
  58. Huang, B., Brugger, S., and Lyons, K. 2010. Stage-specific control of connective tissue growth factor (CTGF/CCN2) expression in chondrocytes by Sox9 and beta-catenin. J. Biol. Chem. 285(36): 27702–12.
  59. Oh, C., Yasuda, H., Zhao, W., Henry, S., Zhang, Z., Xue, M., de Crombrugghe, B., and Chen, D. 2016. SOX9 directly Regulates CTGF/CCN2 Transcription in Growth Plate Chondrocytes and in Nucleus Pulposus Cells of Intervertebral Disc. Sci. Rep. 6: 29916.
  60. Saegusa, J., Yamaji, S., Ieguchi, K., Wu, C., Lam, K., Liu, F., Takada, Y., and Takada, Y. 2009. The Direct Binding of Insulin-like Growth Factor-1 (IGF-1) to Integrin v 3 Is Involved in IGF-1 Signaling. J. Biol. Chem. 284(36): 24106–24114.
  61. Arioka, M., Takahashi-Yanaga, F., Sasaki, M., Yoshihara, T., Morimoto, S., Takashima, A., Mori, Y., and Sasaguri, T. 2013. Acceleration of bone development and regeneration through the Wnt/β-catenin signaling pathway in mice heterozygously deficient for GSK-3β. Biochem. Biophys. Res. Commun. 440(4): 677–682.
  62. Tatsumoto, N., Arioka, M., Yamada, S., Takahashi-Yanaga, F., Tokumoto, M., Tsuruya, K., Kitazono, T., and Sasaguri, T. 2016. Inhibition of GSK-3 β increases trabecular bone volume but not cortical bone volume in adenine-induced uremic mice with severe hyperparathyroidism. Physiol. Rep. 4(21): e13010.
  63. Sisask, G., Marsell, R., Sundgren-Andersson, A., Larsson, S., Nilsson, O., Ljunggren, Ö., and Jonsson, K. 2013. Rats treated with AZD2858, a GSK3 inhibitor, heal fractures rapidly without endochondral bone formation. Bone 54(1): 126–132.
  64. Kahler, R., Yingst, S., Hoeppner, L., Jensen, E., Krawczak, D., Oxford, J., and Westendorf, J. 2008. Collagen 11a1 is indirectly activated by lymphocyte enhancer-binding factor 1 (Lef1) and negatively regulates osteoblast maturation. Matrix Biol. 27(4): 330–8.
  65. Ciorba, A., Corazzi, V., Melegatti, M., Morgan, A., Pelliccione, G., Girotto, G., & Bigoni, S. (2021). Non-Syndromic Sensorineural Prelingual and Postlingual Hearing Loss due to COL11A1 Gene Mutation. The journal of international advanced otology, 17(1), 81–83. [CrossRef]
  66. Schmittgen, T., and Livak, K. 2008. Analyzing real-time PCR data by the comparative C(T) method. Nat. Protoc. 3(6): 1101–8.
Figure 1. Col11a1 gene expression during chondrogenesis in ATDC5 cells. Differentiation media was added to confluent cell cultures at day 0. Quantitative RT-PCR was performed to detect Col11a1 mRNA in ATDC5 during chondrogenesis (A). Western blot analysis using rabbit polyclonal antibodies that recognized distinct epitopes within collagen α1(XI) were used to detect protein expression over the same time course. The antibody to the Npp domain epitope recognized the 90 kDa fragment of collagen α1(XI) with minor fragments recognized at 105 kDa, 90 kDa, 80 kDa, and 60 kDa, while the V2 antibody recognized bands migrating with apparent molecular weights of 152 kDa, 150 kDa, and 105 kDa. (B). Col11a1 mRNA expression correlated with the expression of established chondrogenic markers Sox9, Col2a1, and Acan (C). Data is represented as mean and the standard deviation. Significance was determined using the t-test, n=3 *p < 0.05, **p<0.005, ***p < 0.0005.
Preprints 66685 g001
Figure 2. Col11a1 knockdown causes actin cytoskeletal reorganization and loss of chondrocyte cellular morphology in ATDC5 cells. qRT-PCR was used to quantify the decrease of Col11a1 mRNA and collagen α1(XI) protein 7 days after siRNA transfection. Col11a1 mRNA was decreased, relative to negative control siRNA transfections at day 7 (A). Protein levels detected using a collagen α1(XI) antibody showed a decrease in collagen α1(XI) protein. Beta actin was used to demonstrate equal loading per lane (B). Immunofluorescence detecting collagen α1(XI) protein (red) and actin (green) verified the loss of detectable collagen α1(XI) protein and changes in the actin cytoskeleton from primarily cortical to containing stress fibers, focal adhesions, lamellipodia or filopodia at 3-days post transfection. Scale bar in is 20 µm. Data is represented as mean and SD., data analyzed using the t-test, **p < 0.005. n=3.
Preprints 66685 g002
Figure 3. Knockdown of Col11a1 expression decreased Alcian blue staining and increased Alizarin Red staining. Alcian blue staining was used to quantify the proteoglycan production in 7-day micromasses. Col11a1 siRNA decreased the intensity and area of proteoglycan content of micromass cultures (A and B). Surface area maps provide a visual representation of the staining intensity and distribution within the micromass culture. Col11a1 siRNA increased the calcium content of micromass cultures. The relative area and intensity of Alizarin red staining increased in the presence of siRNA-mediated inhibition of Col11a1 expression in micromass cultures. (C and D). Data were analyzed using t-test and represented as the mean with standard deviation (n=3).
Preprints 66685 g003
Figure 4. Col11a1 expression was not required for the expression of cellular condensation markers in ATDC5 cells. The mRNA expression of Ncam, Vcan, Tnc, and Cdh2 were not significantly altered in response to Col11a1 knockdown during chondrogenesis. Data were analyzed using an unpaired t-test and represented as the mean with the standard deviation (n=3).
Preprints 66685 g004
Figure 5. The expression of Col2a1 and Mmp13 are regulated by Col11a1 knockdown. ATDC5 cells were transfected with either Neg siRNA or Col11a1 siRNA prior to chondrogenic differentiation. Expression of Sox9, Acan, and Col10a1 mRNA was not significantly different following inhibition of Col11a1 expression. Col2a1 and Mmp13 mRNA expression was significantly increased by the inhibition of Col11a1 expression. Data were analyzed using the unpaired t-test and represented as the mean with standard deviation (n=3). *=P-value <0.05, **<0.005, ***<0.0005.
Preprints 66685 g005
Figure 6. Extracellular matrix and adhesion gene transcription was regulated by Col11a1 expression. Changes in mRNA expression levels were determined by comparing the expression level of mRNA for each target gene relative to β-actin as housekeeping gene. The relative expression of the Col11a1 siRNA transfected cells was compared to the negative control siRNA transfected cells. The fold change was calculated using the 2-ΔΔCt method. The data were analyzed using unpaired t-test and represented as the mean and standard deviation (n=3). *=P-value <0.05, **<0.005, ***<0.0005.
Preprints 66685 g006
Figure 7. Col11a1 knockdown increased AKT/GSK3β/β-catenin signaling activity and increased TCF/LEF activity as an indication of Wnt/β-catenin activation. Col11a1 siRNA treatment increased the phosphorylation of GSK3β, inactivating the kinase activity, while decreasing phosphorylation levels of β-catenin, resulting in stabilization of the β-catenin (A). Additionally, Col11a1 siRNA induced phosphorylation of AKT at serine 473 (B). Col11a1 knockdown significantly increased TCF/LEF transcription factor activity indicative of Wnt/β-catenin signaling compared to negative control siRNA transfected cells. (C).
Preprints 66685 g007
Figure 8. Immunofluorescence imaging of the actin cytoskeleton and β-catenin localization upon Col11a1 knockdown. Increased cell spreading and increased β-catenin nuclear localization was found following Col11a1 knockdown. Immunofluorescence of the actin cytoskeleton (green) showed cortical actin in Neg Ctl siRNA transfected cells (A) and an increase in actin stress fibers and increased cell spreading in cells transfected with Col11a1 siRNA (B). β-catenin (red) was primarily perinuclear in the Neg Ctl transfected cells (A) and was present throughout the cytoplasm and localized to the nucleus. (B). Scale bars are 20 µm.
Preprints 66685 g008
Figure 9. Wnt3a induced phosphorylation of GSK3β as well as inhibition of β-catenin phosphorylation independent of Col11a1 knockdown. The addition of 100 ng/mL of recombinant Wnt3a induced phosphorylation of GSK3B independent of Col11a1 knockdown and inhibited β-catenin phosphorylation.
Preprints 66685 g009
Table 1. Primers used for RT-PCR.
Target Forward Sequence Reverse Sequence
Mouse Col2a1 ACGAAGCGGTGGCAACCTCA CCCTCGGCCCTCATCTCTACATCA
Mouse HPRT CTGGTGAAAAGGACCTCTCGAA CTGAAGTACTCATTATAGTCAAGGGCAT
Mouse PPIA CGCGTCTCCTTCGAGCTGTTTG TGTAAAGTCACCACCCTGGCACAT
Mouse
Col10a1
TGCCCGTGTCTGCTTTTACTGTCA TCAAATGGGATGGGGGCACCTACT
Mouse
Sox9
GAGGCCACGGAACAGACTCA CAGCGCCTTGAAGATAGCATT
Mouse
Acan
CCTCGGGCAGAAGAAAGA GTCTCATGCTCCGCTTCTGT
Mouse
Mmp13
AGTTGACAGGCTCCGAGAAA GGCACTCCACATCTTGGTTT
Mouse Col11a1 TGGAAACCCACACCGGAAA TGCCTCTGTTTGTGCTACTGT
Disclaimer/Publisher’s Note: The statements, opinions and data contained in all publications are solely those of the individual author(s) and contributor(s) and not of MDPI and/or the editor(s). MDPI and/or the editor(s) disclaim responsibility for any injury to people or property resulting from any ideas, methods, instructions or products referred to in the content.
Copyright: This open access article is published under a Creative Commons CC BY 4.0 license, which permit the free download, distribution, and reuse, provided that the author and preprint are cited in any reuse.
Prerpints.org logo

Preprints.org is a free preprint server supported by MDPI in Basel, Switzerland.

Subscribe

© 2024 MDPI (Basel, Switzerland) unless otherwise stated