
Submitted:
29 December 2022
Posted:
10 January 2023
You are already at the latest version
Abstract
Abstract: Changes in sugar composition occur continuously in plants tissues, at different develop-mental stages. Tuber dormancy induction, stability, and breaking are very critical developmental transitions in yam crop production. Prolonged tuber dormancy after physiological maturity has constituted a great challenge in yam genetic improvement and productivity. In the present study, biochemical profiling of non-structural sugar in yam tuber during dormancy was performed to determine the role of non-structural sugar in yam tuber dormancy regulation. Two genotypes of white yam specie; one local genotype (Obiaoturugo) and (TDr1100873) were used for this study. Tubers were sampled at (42, 56, 87, 101, 115, and 143) days after physiological maturity (DAPM). Obiaoturugo exhibited a short dormant phenotype and sprouted at 101DAPM, whereas TDr1100873 exhibited a long-dormant phenotype, and sprouted at 143DAPM. Significant metabolic changes were observed in non-structural sugar parameters, dry matter, and moisture content in Obiaoturugo from 56DAPM, whereas, in TDr1100873 significant metabolic changes were observed from 101DAPM. It was observed that the onset of these metabolic changes occurred at a point when the tubers of both genotypes exhibited dry matter content of 60%, indicating that dry matter content of 60% might be a critical threshold for white yam tuber sprouting. Nonreducing sugars increased by 9-10-fold during sprouting in both genotypes which indicates its key role in tuber dormancy regulation in white yam. This result implies that some key sugar metabolites can be targeted for dormancy manipulation of yam crop.
Keywords:
Sugars
; metabolism
; yam
; tuber
; genotypes
; dormancy
; regulation
Introduction
Yam (Dioscorea spp.) holds a key position among the staple tuber food crops, while possessing therapeutic potentials [1] and cultural significance[2] better organoleptic properties compared to cassava, potato (within Solanum spp.) and sweet potato (Ipomoea batatas (L.) [3]. It belongs to the monocotyledonous family, Dioscoreaceae and genus Dioscorea. Yam is a multi-species crop which has about 613 known species that produce tubers, bulbils or rhizomes [4]. Of these, about 10 are cultivated over larger area and serve as a staple food crop, about 50 other species are also eaten as wild-harvested staples famine food. Thus, this genus occupies a prominent position in global food insecurity combat [1,5].However, prolonged tuber dormancy after physiological maturity has constituted a great challenge in yam genetic improvement and productivity [6]. Tuber dormancy is the major cause of the prolonged inability of ware and seed tubers sprout. During dormancy, harvested tubers remain dormant; incapable of developing an internal or external shoot buds/sprout for 150 to 210 days depending on the physiological stage of harvest, species, growing and storage conditions [7,8,9]. Tuber dormancy induction, stability, and breaking are very critical developmental transitions in yam crop cycle and have constituted a great regulator of yam production activities as well as its tuber availability. Thus, making it impossible to have more than one crop cycle per year, and limiting the crop production, tuber availability, and the rate of genetic improvement through breeding [10].
Plant life largely depends on the photosynthetic fixation of carbon and energy in an energy rich molecules and concomitant production of oxygen. Sugars not only fuel growth and development in plants as carbon and energy source, but also plays important regulatory functions, controlling metabolism, stress resistance, growth and development in bacteria, yeast, plants, and animals [11,12]. The regulatory roles of sugar are most explicit in a free-living microorganism that are often challenged by the constant changing environment. In multicellular organisms, maintenance of nutrient and energy homeostasis within cells and tissues is very important and require constant monitoring and adjustment of either activities or energy availability [13]. In a photosynthetic sugar-producing and sessile organisms like plants, energy homeostasis maintenance requires even more sophisticated and flexible regulatory mechanism to maintain the complex physiological and development plasticity in plants. In the recent years, the pivotal roles of sugars signaling molecules, and their dramatic regulation of plant growth and development has been well investigated [14,15,16]. In plants, some of the well-characterized developmental processes that are regulated by sugars levels include; cell division, embryogenesis, seed germination, seedling development, hypocotyl elongation, leaf formation, nodule formation, pollen development, adventitious root formation, juvenile-to-adult phase transition, flowering, tuber formation, and senescence induction [17,18,19,20]. It has been shown that glucose, sucrose or trehalose-6-phosphate are the carbohydrates most involved in regulation of plants’ growth and development, acting independently as basal function and also as signaling molecules [13].
Generally, plants have two groups of sugar signaling pathways that respond to carbon availability status [21]. It has been observed that yam tuber dormancy induction concedes with onset of vine senescence, implying that tuber dormancy induction may be a physiological adjustment in response to change in continuous supply of sugar (low sugar condition), as a result of the stoppage of photosynthesis and supply of sucrose from the photosynthetic sites (source) to the tuber (the storage organ - sink). Therefore, yam tuber dormancy induction can be said to be one of the crop responses to carbon starvation due to stoppage of sugar supply from photosynthesis. This is supported by the fact that dormancy period is generally associated with minimum endogenous metabolic activity, resulting in minimal metabolic changes in order to maintain low energy economy [22]. Changes in composition and transport of sugars occur continuously in plants tissues, at different developmental stages [13,23]. Plants have developed an efficient system of perception and transmission of signals induced by these changes in sugars quantity (lower or higher sugar availability) [24]. Low and high sugar conditions have separate response pathways in plants, for instance, hexokinase (as a glucose sensor; HXK1), trehalose-6-phosphate (T6P) and target of rapamycin (TOR) are all high sugar availability responsive pathways, and they stimulate growth or development at any stage. While sucrose nonfermenting 1-related kinase1(SnRK1) and C/S1 bZIP transcription factor are responsive pathways for low sugar condition [14,25,26], and they act by inhibiting any activities that utilize sugar and energy, such as; growth and developmental processes. Studies on the biochemical changes in yam tuber during storage have revealed that there were changes in starch, sugars, and proteins as the storage progresses [27,28,29]. In this study, we performed biochemical profiling of vital sugar parameters in two white yam (Dioscorea rotundata) genotypes (Obiaoturugo and TDr1100873) from physiological mature stage of the tubers to sprouting to determine whether non-structural sugars metabolism play a role in yam tuber dormancy regulation. This will help to understand the molecular mechanism regulating yam tuber dormancy.
2. Materials and Methods
2.1. Genetic Material
The genetic materials comprised of two genotypes of white yam (D. rotundata), one local genotype (Obiaoturugo) and one improved genotype (TDr1100873) sourced from yam breeding program of National Root Crops Research Institute (NRCRI) Umudike, Nigeria.
2.2. Field Study Area
The field was established at the Eastern research farm of the National Root Crops Research Institute (NRCRI) Umudike, Nigeria. Umudike is a rainforest agroecology located at 5.4729° N, 7.5480° E, 152m ASL with mean annual rainfall of 2093mm, temperature of 27.3℃, relative humidity of 82%, and sandy loam soil with pH range from 4.3 to 5.27.
Uniform set size (200 g) of only proximal and distal regions of the genetic materials were planted in order to maintain relatively uniform germination time. A total of 30 plant stands of each genetic material were planted in randomized complete block design, replicated three times, with 10 plant stands of each genetic material per replicate. The field was adequately maintained under rainfed condition, and all cultural practices including application of NPK fertilizer at the recommended dose of 80:60:100kg/ha were carried out. Tubers were harvested at 50% senescence, which is the tuber physiological maturity stage.
2.3. Postharvest Study Area and Sampling
After harvesting, tubers were shipped to Centre of Plant Molecular Biology and Biotechnology, Department of Plant Biotechnology, Tamil Nadu Agricultural University, Coimbatore, India. Where the tubers were stored in green house facility, with natural light condition and sunshine that ranged from 10 to 12 hours per day, relative humidity range of 38% to 78%, maximum and minimum temperature range from 26 to 36.5℃ and 17.5 to 26.5℃ respectively. Tubers were sampled at the following days after physiological maturity (DAPM): 42DAPM, 56DAPM, 87DAPM, 101DAPM, 115DAPM and sprouted tuber (143DAPM). Six non-structural sugar parameters; total sugars, carbohydrates, reducing sugar, nonreducing sugar, amylose, and amylopectin were estimated at the biochemistry department laboratory of Tamil Nadu Agricultural University, Coimbatore, India. Dry matter and moisture content were also determined during sampling.
2.3.1. Parameters Recorded2.3.2. Dry matter and moisture content
At each sampling point, triplicate tubers samples were collected, and fresh weights were taken, after which the samples were oven dried to a constant weight at 720C. The moisture content was estimated by subtracting dry matter weight from the sample fresh weight.
2.3.2. Extraction and quantification of non-structural sugars
At each sampling point, tubers were sampled by sectioning a tuber vertically and longitudinally into 12 and six parts comprising of proximal, middle, and distal regions were used. Samples were quenched in liquid nitrogen, freeze dried and stored at -80℃. For further analysis, freeze-dried samples were microwaved for 5 minutes, and oven dried at 70℃ for 72hrs. Then samples were grinded into powder using commercial grinder and used for the analysis of six parameters of non-structural sugar including total sugars, carbohydrates, reducing sugar, nonreducing sugar, amylose and amylopectin.
2.3.3. Total sugar estimation
Total sugar was estimated using anthrona method following[30] procedure. Anthrona solution was prepared by dissolving 2g of anthrona in 1 litre of concentrated sulphuric acid (H2SO4). 100µg of glucose dissolved in 1ml of water was prepared as a standard stock, from which: 10mL was diluted to 100 mL with water and used as a working standard. 100mg of tuber sample was dissolved in 20ml of 80% ethanol and centrifuged for 5mins at 2000rpm and the supernatants were eluted. This was repeated twice to extract soluble sugar. The residues were dried and dissolved in 1ml of 52% perchloric (HCl), and heat for 20 mins in boiling water bath. After which it was neutralized with solid sodium carbonate (Na2Co3), plus 1ml of ethanol, and centrifuged for 5mins at 2000rpm and the supernatant was collected and added to the previously extracted soluble sugars and made up to 10ml with water. 0.2ml of the solution was pipetted out, and made up to 1ml with water, and 4ml of anthrona was added, before ODS reading was taken using colorimeter at 630nm. Total sugar was estimated from the ODS reading using the following equation according to[31] and value was multiplied by the conversion factor of 0.9 to estimated starch.
Where the absorbance is a dimensionless ratio which is equal to , T is percent transmittance, b is the length of light path expressed in centimeters, and c is the quantity micrograms of sugar per milliliter of the final volume.
2.3.4. Reducing and non-reducing sugars estimation
Reducing sugars was estimated by sodium thiosulphate titration method of[32]. 10ml of the extract of the total sugar was pipetted into iodine flask and 10ml of iodine was added, then followed by 10ml of NaOH drop by drop slowly for 4 mins until the red color of the sample solution was changed to colorless, and burette volume was noted as (V1). The flask was rinsed with water and made up to 50ml volume with water, stopped and allow for 15 mins, before 3ml of 10N HCl was added, which changed its color back to red. This was titrated against 0.1N sodium thiosulphate until the red color changes to straw yellow. Then, few drops of starch were added, and the titration was continued with sodium thiosulphates until the solution became colorless. The burette volume was taken as the titre value (V2). For blank, 10ml of water was titrated with sodium thoisulphate, and the titre value was denoted as (V3). 100mg glucose dissolved in 10ml of water and then made up to 100ml in a standard volumetric flask was used as a working standard. The volumetric calculations using the following equations were used to estimate the quantity of the reducing sugars, and nonreducing sugars were determined by subtracting reducing sugars from total sugar.
Volume of 0.1N thiosulphate = 0.1N iodine consumed by 10ml (10mg of glucose) =xml
Volume of 0.1N thiosulphate = 0.1N iodine consumed by glucose in 10ml of unknown solution = yml
Amount of glucose in 10ml of unknown solution = zmg
Amount of glucose in 100ml of unknown solution = the quantity of the reducing sugar
2.3.5. Amylose and Amylopectin
Amylose was determined using iodine method according to[33]. 50mg was weighed into a cylindrical tube, few drops of 80% alcohol and 5ml of 1N NaOH were added. The mixture was boiled for 15mins, cooled, and transferred to a 50mL standard flask and made up to 50ml with water. 0.5mL of the extract was pipetted out and 2.0 mL of water was added, followed by 2 drops of 1% phenolphthalein which gives pink color to the solution. Drops of 0.1N HCl were added while shaking until the pink color disappeared. 1mL of iodine reagent which was prepared by dissolving 1g of iodine in 500ml of water was added and made up to 10mL with water. The absorbance readings were taken using colorimeter at 600nm, and the quantity of amylose was calculated using the same equation as was used to estimate total sugar in subsection 2.3.4 above. Amylopectin was estimated by subtracting amylose from starch. 200µg of amylose was dissolved in 1ml of water was used as a standard stock, from which 50ml was added to 50ml of water and used as the working standard. All statistical analyses were performed using R software. Kruskal Wallis test was performed on all variables investigated at P≤0.05, and Duncan post hoc pairwise means comparison was done to ascertain the exact difference between means. The statistically significant differences among variable means were indicated with error bars and letters on the graphics.
3. Results
3.1. Tuber dormancy duration
The two genotypes exhibited different dormant genotypes. Figure 1 shows the result of t.test analysis at (p=0.05), and it indicates that the local genotype Obiaoturugo had a shorter dormancy duration, and sprouted on 101DAPM, compared to improved genotype (TDr1100873) which sprouted on 143DAPM demonstrating its longer dormant phenotype, with 42 days difference.
3.2. An overview changes in the metabolic status of non-structural sugar, dry matter and moisture content of white yam tubers during dormancy
The trend of metabolic changes in non-structural sugar, dry matter, and moisture content from tuber physiological maturity to sprouting in the two genotypes are similar. Figure2a-b show the changes in the estimated sugar parameters, dry matter, and moisture content from dormancy to sprouting in both genotypes. In TDr1100873, it was observed that all the non-structural sugar parameters investigated did not exhibit any significant metabolic change from 42DAPM to 101DAPM, but immediately after this period, spikes were observed in all until the sprouting point (143DAPM) (Figure 2a). It is worthy to note that the 101DAPM data point was 15days before the appearance of shoot bud in TDr1100873 which occurred at 115DAPM. No significant changes in non-structural sugar content, dry matter and moisture content were observed for Obiaoturugo between 42DAPM and 56DAPM, although, significant changes were observed between 56DAPM and 101DAPM. It was observed that amylopectin in Obiaoturugo increased from 56DAPM to 87DAPM and decreased as the genotype approaches physical sprouting. 56DAPM which mark the beginning of rapid increments was 31days to appearance of shoot bud (ASB) which occurred on 87DAPM in Obiaoturugo.
Dry matter in both genotypes increased gradually from 42DAPM up until the tuber sprouting points (143DAPM and 101DAPM) in TDr1100873 and Obiaoturugo, respectively. Conversely, similar trend was observed in moisture content in the reversed order in both genotypes. Moisture decreased gradually from 42DAPM until the 143DAPM and 101DAPM in TDr1100873 and Obiaoturugo, respectively.
3.3. Dry matter and moisture content
Changes in dry matter and moisture content in the two genotypes from dormancy to tuber sprouting are shown in Figure 3a-f. At 42DAPM dry matter content of (G1:TDr1100873) was significantly higher than that of the short dormant (G2: Obiaoturugo) (fig3a). However, as dormancy progresses, at 56DAPM there was a switch in the quantity of dry matter content, the dry matter in Obiaoturugo increased above that of TDr1100873 and maintained significantly higher dry matter content till it sprouted at 101DAPM. Figure3b shows that the dry matter of TDr1100873 increased from 46.12% at 42DAPM to 59.91% at 143DAPM, however, significant difference was observed only between dry matter content at 42DAPM and 143DAPM (sprouting point). Similarly, fig3c shows that dry matter content of Obiaoturugo increased from 32.83% at 42DAPM to 58.88% at 101DAPM, when it sprouted. The moisture content followed similar trend as dry matter in opposite order. Fig3d shows that moisture content decreased from 59.88% at 42DAPM to 40.09% at 143DAPM in TDr1100873, and from 67.17% at 42DAPM to 40.12% at 101DAPM in Obiaoturugo. The high moisture content of Obiaoturugo decreased to equal amount with that of TDr1100873 at 56DAPM, and maintained significantly lower values till 101DAPM when it sprouted. Fig3e shows the changes in moisture content from dormancy to tuber sprouting of TDr1100873. Significant change was observed only between 42DAPM and 143DAPM. Figure3f shows that in Obiaoturugo significant change in moisture content was observed only between 42DAPM and 101DAPM.
3.4. Metabolic status of non-structural sugar in white yam tubers from dormancy to sprouting
3.4.1. Total Sugar and starch
The metabolic changes in total sugar and starch from dormancy to tuber sprouting are shown in Figure 4a-f. Figure4a showed the trend of changes in total sugar between the two white yam genotypes. There were significant changes between TDr1100873 and Obiaoturugo across the sampled dormancy stages except at 56DAPM. In TDr1100873, there was gradual decrease in total sugar from DAPM to 101DAPM which is the data point before appearance of shoot bud (ASB), after which rapid increment was observed till the tuber sprouted. Similarly, in Obiaoturugo, there was no change in total sugar between 42DAPM and 56DAPM, but after 56DAPM which is also the dormancy stage before appearance of shoot bud (ASB), there was rapid increase till the tuber sprouting stage at 101DAPM. Figure4b showed that there were no significant changes in total sugar content in TDr1100873 from 42DAPM to 101DAPM, after which significant increments were observed from 115DAPM to 143DAPM. Total sugar content in TDr1100873 at 115DAPM and 143DAPM were 38.24mg/100mg and 48.47mg/100mg, respectively, which are higher than the total sugar content recorded at 101DAPM. Similarly, in Obiaoturugo, total sugar content at 87DAPM and 101DAPM were 28.03mg/100mg and 49.33 mg/100mg, respectively, and are higher than that at 42DAPM and 56DAPM (figure4c). Since starch content was estimated by multiplying the total sugar by the conversion factor of 0.9, similar trends as in total sugar content were observed in starch content shown in fig4d-f.
3.4.2. Amylose and Amylopectin
The metabolic changes in amylose and amylopectin in the two white yam genotypes from tuber dormancy to sprouting are shown in Figure 5a-f. The results indicate that at all sampled dormancy stages, amylopectin was more than double fold higher than amylose except at 101DAPM in TDr1100873. Significant changes were observed between the two yam genotypes in amylose content at 87DAPM and 101DAPM, but not at 42DAPM and 56DAPM (Figure5a). However, rapid increments were observed from 56DAPM to tuber sprouting. Figure5b shows the metabolic changes in amylose content across all the sampled dormancy stages in TDr1100873. Significant differences were observed between amylose content at 115DAPM and (101DAPM, 87DAPM, 56DAPM, 42DAPM). The highest amount of amylose content (29.97mg/100mg,) was observed at 115DAPM (appearance of shoot bud stage) while the lowest level(8.76mg/100mg) was observed at 56DAPM.
Figure5c shows significant differences in tuber amylose content of Obiaoturugo in all the sampled dormancy stages, except between 42DAPM and 56DAPM. Highest amount of amylose content (41.83 mg/100mg) was observed on sprouted tuber at 101DAPM, and it was 31.96 mg/100mg significantly higher than the 9.87mg/100mg (lowest value) observed at 56DAPM. Figure 5d shows the trend of amylopectin metabolism in the two genotypes during tuber dormancy. There were significant differences between the genotypes at all sampled dormancy stages, except at 56DAPM. After 56DAPM, Obiaoturugo recorded significant higher amylopectin content up until the tuber sprouted at 101DAPM. While, there were gradual decrease in amylopectin content from 42DAPM to 101DAPM in TDr1100873, and then, rapid increase from 101DAPM to 143DAPM, when the tuber sprouted (Figure5e). The highest amylopectin content (50.57mg/100mg) was observed on sprouted tuber at 143DAPM. It was 31.45mg/100mg higher than the lowest (19.12mg/100mg) content observed at 101DAPM. In Obiaoturugo, amylopectin content at 87DAPM and 101DAPM were significantly higher than at 42DAPM and 56DAPM (Figure 5f). The highest amylopectin content (43.78mg/100mg) was observed at the appearance of shoot bud stage(87DAPM). This was 15.41mg/100mg higher than the lowest quantity (28.37mg/100mg) recorded at 42DAPM.
3.4.3. Reducing and nonreducing sugars
Metabolic changes in reducing and nonreducing sugars in the two white yam genotypes during tuber dormancy are presented in Figure6a-f. Figure6a shows that Obiaoturugo recorded higher reducing sugars than TDr1100873 at all sampled stages, except at 42DAPM and 56DAPM. In both genotypes there were decrease in reducing sugar at 42DAPM, 56DAPM, and 101DAPM. After which, steadily increase were observed till the tubers sprouted at 101DAPM and 143DAPM, in Obiaoturugo and TDr1100873 respectively. Figure6b shows that significant change in reducing sugar content in TDr1100873 was observed between 87DAPM and 101DAPM only. Highest reducing sugars content was observed at 42DAPM, whereas lowest reducing sugar content was observed at 101DAPM. Figure6c shows that reducing sugar content in Obiaoturugo recorded no significant changes across the sampled points, except at 101DAPM (sprouted tuber).
The trend of metabolic changes in nonreducing sugars across the sampled dormancy stages in both genotypes are presented in figure6d. It was observed that between first two sampled points (42DAPM and 56DAPM) there were no significant differences between the genotypes. However, after 56DAPM, Obiaoturugo recorded significantly higher nonreducing sugars content than the TDr1100873.
Figure 6e shows that there were significant changes in nonreducing sugars content of TDr1100873 tuber from 101DAPM to 143DAPM. Highest value of nonreducing sugar (49.94 mg/100mg) was recorded on sprouted tuber at 143DAPM, and it was 44.25mg/100mg higher than lowest quantity (5.69mg/100mg) recorded at 42DAPM, which is equivalent to 9-fold change. Similarly, Obiaoturugo increased in nonreducing sugar content from 56DAPM to 101DAPM (figure 6f). Highest nonreducing sugars quantity (51.44 mg/100mg) was observed on sprouted tuber at 101DAPM, and it was 46.34mg/100mg higher than the lowest content (4.6 mg/100mg) recorded on deep dormant tuber at 42DAPM, which is equivalent to 10-fold change. The pattern of changes observed in the tubers of two yam genotypes studied with respect to non-structural sugar parameters, dry matter and moisture content is reported in Table 1.
3.5. Correlations among non-structural sugars, dry matter and moisture content in yam tuber from dormancy to sprouting
Figure 7a-b shows the correlations matrix among non-structural sugar parameters, dry matter, and moisture content in tubers of the two yam genotypes during dormancy. Figure7a shows that the coefficient of linear relationships between the non-structural sugar parameters, dry matter and moisture content variables range from r = 0.2 to 0.8 and -0.2 to -0.8 at P = 0.05. The nature of correlations among the variables (negative or positive) is indicated by red and blue color, respectively. Whereas the degree of the correlations is revealed by the correlation coefficient value and color intensity. Figure7b presents another visualization of the same linear relationships among the variables using nodes and edges networks diagram. Positive and negative correlations were indicated with green and red lines, respectively, while color intensity indicates the degree of correlations. Most of the variables exhibited positive and significant correlations between each other, except moisture content which exhibited negative and significant correlations with all other variables, with exception of reducing sugars which showed no correlations with dry matter and moisture content.
4. Discussions
The results of the present study indicate that the two-white yam genotypes investigated exhibited different dormancy phenotypes. Since both genotypes were subjected to the same treatment from field experimentation to post harvest study, the only valid source of such variation in dormancy phenotype could be genetic composition. This finding suggest that yam tuber dormancy is a variable trait. Significant changes in dry matter, moisture content and six non-structural sugar parameters (total storable sugars, starch, reducing and nonreducing sugars, amylose and amylopectin) in two white yam genotypes were observed at different stages of tuber dormancy progression. Observed trend signals changes with respect to aforementioned parameters. These changes are observed at the initial stage of dormancy breaking in both genotypes.
Dry matter was higher in TDr1100873. This genotype expresses long dormant period. At 56DAPM Obiaoturugo (short dormant phenotype) became higher in respect to dry matter when compared with TDr1100873. The high rate of dry matter increase in Obiaoturugo as dormancy progresses could be attributed to the rate of moisture loss which was higher in Obiaoturugo as compared with TDr1100873. The high rate of moisture loss leads to faster concentration of sugar solutes, especially the nonreducing sugar thus providing the sufficient energy required to initiate dormancy breaking process’. This further leads to early sprouting observed in cultivar Obiaoturugo at 101DAPM. This showed a differential of 42days when compared to cultivarTDr1100873. In each of the cultivar, there was a gradual increase in dry matter content. The lowest value was observed at 42DAPM while the highest value was observed at point of tuber sprouting. On average. both genotypes sprouted at 60% dry matter content irrespective of their dormant variations, indicating that the 60% dry matter content might be the critical threshold for tuber dormancy breaking in white yams. This is also in agreement with the findings of [29,34,35], who reported 60.1%, 60.3%, and 59.7% dry matter content at tuber sprouting in white yam (Dioscorea rotundata), water yam (Dioscorea alata) and Chinese yam (Dioscorea esculenta) respectively. Cultivar Obiaoturugo exhibited fast rate of moisture loss while expressing short dormancy. Obiaoturugo moisture loss ranged from 67.17% to 40.12 between 42DAPM and 101DAPM at which the tuber sprouting occurred. Cultivar TDr1100873 took 143DAPM to reach the equivalent moisture content of 40.09%. Average moisture content of 40% seems to be critical threshold for tuber sprouting in both genotypes. Muzac-Tuker et al, (1993) also found similar trend in water loss among Jamaica yams. This indicates that moisture content might have strong influence on other factors that regulate energy metabolism during yam tuber dormancy.
Total storable sugars and starch exhibited similar trend in both genotypes. There was a slow decrease in total storable sugars and starch at 42DAPM, 56DAPM, and 101DAPM. There was observed 31 days differential between 56DAPM and appearance of shoot bud at 87DAPM), whereas, in TDr1100873, it took 15 days between 101DAPM to 115 DAPM before the appearance of shoot bud. The results indicate that the molecular activities towards dormancy breaking starts between 6DAPM and 87DAPM in Obiaoturugo, and between 101DAPM to 115 DAPM in TDr1100873. These are indications that the total storable sugars might be playing some vital roles in the processes of yam tuber dormancy regulation. The upsurge of the total storable sugars at dormancy progression stage while appearance of shoot bud indicates possible degradation and mobilization of starch into sugars to provide the required energy for dormancy breaking activities. Huang, et al, (2007) reported 35% reduction in starch content in Dioscorea rotundata and Dioscorea cayenensis tubers at 90 days after storage. Though, in the current study starch reduction during dormancy break was not observed, but amylopectin content decreased. Our results also varied from the finding of Wingler (2018), who reported that addition of external 6% glucose to a germination medium inhibits seed germination and cotyledon greening, resulting in developmental arrest. It is significant to mention that reducing sugar which constitute mostly glucose and fructose was relatively stable throughout our study period (dormancy to sprouting), indicating that it might not be involved in modulating the tuber dormancy breaking process.
There was slight decrease in amylose from 42DAPM to 56DAPM before gradual increase from 87DAPM in both genotypes. Amylopectin decreased from 42DAPM to 101DAPM in TDr1100873 and from 42DAPM to 56DAPM in Obiaoturugo. Amylose and amylopectin are two factors that determine the quantity and quality of starch at any given stage of plant growth. While amylose determines the starch structure, amylopectin determines starch quantity. Both the proportion of amylose to amylopectin and structure of amylose and amylopectin molecules have been reported to vary with plant species, tissue and developmental stage [36]. The dynamic changes in the amylose/amylopectin ratio from dormancy to dormancy breaking indicate that there were reversible/irreversible alterations in starch structure and quantity at different stages. When the amylose increases as was observed from appearance of shoot bud to tuber sprouting in both genotypes, it decreases amylopectin. This significantly reduces the quantity of starch, since amylopectin is the determinant factor of the quantity of starch at any given developmental stage in plants [36,37,38]. Therefore, these changes further support our earlier postulation that starch was mobilized into sugars during the onset of dormancy breaking activities.
Reducing sugars decreased slightly from 42DAPM to the minimum value at 101DAPM before increasing rapidly to its initial quantity from 115DAPM to 143DAPM in TDr1100873. In contrast, Obiaoturugo, exhibited no significant reducing sugar change throughout duration of dormancy to tuber sprouting. The pattern of changes observed in the long dormant genotype conformed to the pattern proposed by [39] and[38]. Both reported that reducing sugar show two peaks between seed dormancy and dormancy breaking. The accumulation at onset of dormancy induction is attributed to break down of the nonreducing sucrose which is the primary product of photosynthesis and transportable sugar to glucose and other storable reducing sugars forms, while the reduction as dormancy progresses is occasioned by polymerization of these soluble storage sugars into starch (Pls cite here). This accumulation at onset of dormancy breaking and tuber sprouting is due to mobilization of starch into sugars to provide the required energy for dormancy breaking process. This trend had earlier been reported by [40,41,42]. The changes observed in reducing sugars in TDr1100873 during this study were too minimal to have contributed to any molecular process of dormancy regulation in white yam tuber. Reducing sugars are sugars that act as reducing agents because of the presence of free keto and aldehyde functional groups in their structure, and they include; glucose, fructose, galactose, maltose and lactose. They constitute major soluble storage carbohydrates in about 12-15% of all flowering plants including cereals, vegetables, ornamentals, and root [43]. These sugars serve as energy reserve in these plants while playing significant role in regulation of osmotic pressure, sink strength, and resistance to stress [26]. In our study, they appeared not to be involved in dormancy regulation.
The non-significant change in short dormant phenotype is a further indication that reducing sugars might not be playing any role in tuber dormancy regulation, this however needs to be investigated further using diverse cultivars across species/. In our study, it was observed that in both genotypes there were minimum quantity of nonreducing sugars during early dormancy stages, but as dormancy progresses towards breaking, which concedes with 56DAPM in Obiaoturugo and 101DAPM in TDr1100873, there were increases in nonreducing sugar content leading to accumulation of 9-10-fold at tuber sprouting stage in both genotypes in TDr1100873 and Obiaoturugo respectively. This constitutes the most profound changes in non-structural sugar metabolism in relation to yam tuber dormancy regulation observed in this study., The major proportion of nonreducing sugars accumulated from onset of dormancy breaking activities could be linked to degradation and mobilization of stored carbohydrates during these activities in order to provide optimum energy needed for dormancy breaking process. We infer that degradation of carbohydrates into sucrose and other nonreducing sugar forms the molecular basics of yam tuber dormancy breaking. Trehalose is another physiologically very important nonreducing sugar. The disaccharide serves essentially as an energy source, storage and transport molecule for glucose in similar fashion like sucrose, and as a stress-responsive compound for cellular protection during stress in all plant kingdom [44]. Though, the quantity of trehalose found in most plants in normal developmental situation is often very low, thus, indicating its presence as strong signaling over metabolic role. However, tre6p, an intermediate product of trehalose biosynthesis has been shown to have profound influence on plant metabolism, growth and developmental transition processes such as; embryonic and vegetative development, flowering time, meristem determinacy, and cell fate specification [45,46,47]. Hence, tre6p has been widely recognized as the global regulator of metabolism and transcription, promoting plant growth and initiating developmental phase transitions in response to sugar availability [48]. Increased nonreducing sugars quantity observed from the onset of dormancy breaking in this study is indicative of the possible involvement of tre6p or other nonreducing sugar specie in yam tuber dormancy regulation, although qualitative characterization of nonreducing sugars composition in yam tuber during dormancy breaking phase is required to validate this assertion. There are reports that tre6p initiates the process of growth from any plant part under growth arrest (dormancy), by targeting transcriptional members of sucrose-non-fermenting 1-related kinase1 (SnRK1) family, which are sensors of energy availability status in plant system, and inhibit plant growth and development on detection of change below optimum energy level during metabolic stress to maintain energy homeostasis [15,49,50,51,52]. Consequently, it could be suggested that Tre6P plays opposing role to the role of SnRK1 in dormancy regulation, while SnRK1 induce dormancy to maintain low energy economy situation, Tre6P breaks dormancy by inhibiting the action of SnRK1.
We visualized the relations among the non-structural sugar parameters, dry matter and moisture content with two correlation diagrams (correlation matrix, nude and edge network diagrams). Each of them presented clearly, the nature of linear relationships existing among the non-structural sugar parameters of dry matter and moisture content. The major relationship that has profound influence on the metabolic changes on most of the parameters investigated is the moisture content correlations with the rest of parameters. Going by sensory observation in yam tuber, which established the fact that the longer tuber is stored and more moisture it loses, the sweeter it becomes, as a result of increased concentration of glucose, fructose etc. Hence, it was expected that moisture content would be significant and negatively correlated to reducing sugars in this study. But surprisingly, reducing sugar is the only parameter that moisture content did not correlate with. On the contrary, it showed significant and negative correlation with nonreducing sugar quantity and other parameters. This suggests that, reducing sugars might not be playing any role in yam tuber dormancy regulation. Contrary to the conventional seeds that require hydration (imbibition) to initiate process of germination (dormancy breaking), yam tubers seem to require the opposite (dehydration) to a certain critical moisture threshold to be able to activate the molecular machineries towards dormancy breaking process. It was observed that all sugar parameters investigated, with exception of reducing sugar exhibited significant metabolic change at certain stage of tuber dormancy with critical average moisture content of 40.0% in both genotypes. This implies that as important as imbibition is in botanic seed dormancy breaking, so is dehydration is in tuber dormancy breaking. Furthermore, the significant and negative correlation observed between moisture content and non-reducing sugars further support the notion that the increase in total sugar observed during the tuber dormancy at stage which concedes with the stage of the critical moisture content was due to increase in nonreducing sugars, and it has profound influence in non-structural sugar metabolism during yam tuber dormancy and dormancy regulations. This preliminary finding forms a foundation for futuristic study while putting into context different genetic pools of the white yam. An understanding of transcriptional and metabolomics activities would further give insights at molecular levels.
5. Conclusions
Nonreducing sugar is one of the factors that is playing key role in yam tuber dormancy regulation. There was 9-10-fold change in its accumulation during tuber dormancy. Moisture content is a critical regulator of non-structural sugar metabolism including nonreducing sugar in yam tuber, hence playing role in yam tuber dormancy regulation.
Supplementary Materials
Not applicable here.
Author Contributions
Conceptualization Jeremiah S. Nwogha. Jude E. Obidiegwu and Muthurajan Raveendran.; methodology, Jeremiah S. Nwogha, D. Amirtham, and Adaku C. Chilaka; software, Jeremiah S. Nwogha and Adaku C. Chilaka; validation, D. Amirtham, and Muthurajan Raveendran and Adaku C. Chilaka; formal analysis, Jeremiah S. Nwogha and Adaku C. Chilaka; investigation, Jeremiah S. Nwogha and Adaku C.Chilaka; resources, D. Amirtham. Muthurajan Raveendran and Jude E. Obidiegwu; data curation, Jeremiah S. Nwogha and D. Amirtham.; writing—original draft preparation, Jeremiah S. Nwogha.; writing—review and editing, D. Amirtham, Muthurajan Raveendran, Jude E. Obidiegwu, and Wosene G. Abtew,; visualization, Jeremiah S. Nwogha.; supervision, Muthurajan Raveendran, Wosene G. Abtew. And Jude E. Obidiegwu; project administration, Happiness O. Oselebe.; funding acquisition, Happiness O. Oselebe. All authors have read and agreed to the published version of the manuscript.
Funding
This research was funded by GENES Intra-Africa Academic Mobility Project; “Mobility for plant genomics scholars to accelerate climate-smart adaptation options and food security in Africa (GENES)” funded by European Union. GENES Intra-Africa Academic Mobility Project. grant number EACEA/2017/2552. The APC will be funded by Jeremiah S. Nwogha.
Data Availability Statement
Not applicable.
Acknowledgments
The authors acknowledge the field staff of yam research programme of NRCRI, Umudike Nigeria, especially Mr. Anthony Udeagbara, and Dr Rohit Kambale of department Plant biotechnology Tamil Nadu Agricultural University, Coimbatore, India for their technical support in field and laboratory experimentations respectively.
Conflicts of Interest
The authors declare no conflict of interest.
References
- Obidiegwu, J.E.; Lyons, J.B.; Chilaka, C.A. The Dioscorea Genus (Yam)—An appraisal of nutritional and therapeutic potentials. Foods 2020, 9, 1304. [Google Scholar] [CrossRef]
- Obidiegwu, J.E.; Akpabio, E.M. The geography of yam cultivation in southern Nigeria: Exploring its social meanings and cultural functions. Journal of Ethnic Foods 2017, 4, 28–35. [Google Scholar] [CrossRef]
- Nwogha J. S.; J.E. Obidiegwu; R. N Okereke; R. Bhattacharjee; Oselebe, H.O. Preliminary verification of the adoption status of some yam (Dioscorea rotundata and Dioscorea alata) varieties in Nigeria using microsatellites markers. African Journal of Biotechnology 2022, 21, 198–207. [CrossRef]
- Price, E.J.; Wilkin, P.; Sarasan, V.; Fraser, P.D. Metabolite profiling of Dioscorea (yam) species reveals underutilised biodiversity and renewable sources for high-value compounds. Scientific reports 2016, 6, 1–10. [Google Scholar] [CrossRef]
- Mignouna, H.D.; Abang, M.M.; Asiedu, R. Harnessing modern biotechnology for tropical tuber crop improvement: Yam (Dioscorea spp.) molecular breeding. African Journal of Biotechnology 2003, 2, 478–485. [Google Scholar]
- Hartmann, H.; Trumbore, S. Understanding the roles of nonstructural carbohy- drates in forest trees–from what we can measure to what we want to know. New Phytol. 2016, 211, 386–403. [Google Scholar] [CrossRef] [PubMed]
- Ile, E.; Craufurd, P.; Battey, N.; Asiedu, R. Phases of dormancy in yam tubers (Dioscorea rotundata). Annals of Botany 2006, 97, 497–504. [Google Scholar] [CrossRef] [PubMed]
- Passam, H. Dormancy of yams in relation to storage. Yams. Ignames. 1982, 285–293. [Google Scholar]
- Yolou; Elie Idossou1 ADECHOKAN Hibath Audrey, A. ; Didier, M.Z.J. Evaluation of yam (Dioscorea cayenensis–Dioscorea rotundata) seed germination grown in Centre Benin. International Journal 2015, 3, 277–284. [Google Scholar]
- Hamadina, E.I. The control of yam tuber dormancy: a framework for manipulation. 2011.
- Zhang, Y.; He, J. Sugar-induced plant growth is dependent on brassinosteroids. Plant signaling & behavior 2015, 10, e1082700. [Google Scholar]
- Rolland, F.; Baena-Gonzalez, E.; Sheen, J. Sugar sensing and signaling in plants: conserved and novel mechanisms. Annu. Rev. Plant Biol. 2006, 57, 675–709. [Google Scholar] [CrossRef] [PubMed]
- Ciereszko, I. Regulatory roles of sugars in plant growth and development. Acta Societatis Botanicorum Poloniae 2018, 87. [Google Scholar] [CrossRef]
- Wingler, A. Transitioning to the next phase: the role of sugar signaling throughout the plant life cycle. Plant physiology 2018, 176, 1075–1084. [Google Scholar] [CrossRef] [PubMed]
- Damaris, R.N.; Lin, Z.; Yang, P.; He, D. The rice alpha-amylase, conserved regulator of seed maturation and germination. International journal of molecular sciences 2019, 20, 450. [Google Scholar] [CrossRef] [PubMed]
- Zhaowei, L.; Qian, Z.; Fangmin, C. Sugar starvation enhances leaf senescence and genes involved in sugar signaling pathways regulate early leaf senescence in mutant rice. Rice Science 2020, 27, 201–214. [Google Scholar] [CrossRef]
- Yaliang, W.; Yikai, Z.; Qinghua, S.; Huizhe, C.; Jing, X.; Guohui, H.; Yanhua, C.; Xiaodan, W.; Junke, W.; Zihao, Y. Decrement of sugar consumption in rice young panicle under high temperature aggravates spikelet number reduction. Rice Science 2020, 27, 44–55. [Google Scholar] [CrossRef]
- Rodriguez, M.; Parola, R.; Andreola, S.; Pereyra, C.; Martínez-Noël, G. TOR and SnRK1 signaling pathways in plant response to abiotic stresses: do they always act according to the “yin-yang” model? Plant Science 2019, 288, 110220. [Google Scholar] [CrossRef]
- Pokhilko, A.; Flis, A.; Sulpice, R.; Stitt, M.; Ebenhöh, O. Adjustment of carbon fluxes to light conditions regulates the daily turnover of starch in plants: a computational model. Molecular BioSystems 2014, 10, 613–627. [Google Scholar] [CrossRef]
- Gibson, S.I. Control of plant development and gene expression by sugar signaling. Current Opinion in Plant Biology 2005, 8, 93–102. [Google Scholar] [CrossRef]
- Dennis, R. The role of primary carbohydrate metabolism in wheat grain dormancy and germination. 2019.
- Graeber, K.; Nakabayashi, K.; Miatton, E.; Leubner-Metzger, G.; Soppe, W.J.J. Molecular mechanisms of seed dormancy. Plant, Cell and Environment 2012, 35, 1769–1786. [Google Scholar] [CrossRef]
- de Paiva Neto; Vespasiano Borges Otoni; Campos, W. Carbon sources and their osmotic potential in plant tissue culture: does it matter? Scientia Horticulturae 2003, 97, 193–202. [CrossRef]
- Sakr S; Wang M; Dédaldéchamp F; Perez-Garcia M-D; Ogé L; Hamama L; R., A. The sugar-signaling hub: overview of regulators and interaction with the hormonal and metabolic network. I. International journal of molecular sciences 2018., 19. [CrossRef]
- Wingler, A.; Henriques, R. Sugars and the speed of life—Metabolic signals that determine plant growth, development and death. Physiologia Plantarum 2022, 174, e13656. [Google Scholar] [CrossRef] [PubMed]
- Martín-Fontecha, E.S.; Tarancón, C.; Cubas, P. To grow or not to grow, a power-saving program induced in dormant buds. Current Opinion in Plant Biology 2018, 41, 102–109. [Google Scholar] [CrossRef] [PubMed]
- Jaleel, C.A.; Gopi, R.; Manivannan, P.; Kishorekumar, A.; Gomathinayagam, M.; Panneersel Vam, R. Changes in biochemical constituents and induction of early sprouting by triadimefon treatment in white yam (Dioscorea rotundata Poir.) tubers during storage. Journal of Zhejiang University Science B 2007, 8, 283–288. [Google Scholar] [CrossRef]
- Tschannen, A.B.; Girardin, O.; Nindjin, C.; Daouda, D.; Farah, Z.; Stamp, P.; Escher, F. Improving the application of gibberellic acid to prolong dormancy of yam tubers (Dioscorea spp). Journal of the Science of Food and Agriculture 2003, 83, 787–796. [Google Scholar] [CrossRef]
- Hariprakash, C.; Nambisan, B. Carbohydrate metabolism during dormancy and sprouting in yam (Dioscorea) tubers: changes in carbohydrate constituents in yam (Dioscorea) tubers during dormancy and sprouting. Journal of Agricultural and Food Chemistry 1996, 44, 3066–3069. [Google Scholar] [CrossRef]
- Landhäusser, M.S.; Pak, S. Chow, L.; Turin Dickman; E., M.; Furze, I.K.; JSandra Schmid, J.W.; Birgit Wild; Gerd Gleixner; Henrik Hartmann; Günter Hoch; et al. Standardized protocols and procedures can precisely and accurately quantify non-structural carbohydrates. Tree Physiology 2018, 38, 1764–1778. [Google Scholar] [CrossRef]
- DUBOIS, M., K. A. GILLES, J. K. HAMILTON, P. A. REBERS, and FRED SMITH. Colorimetric Method for Determination of Sugars and Related Substances. Analytical Chemistry 1956, 28, 3, 350-356. [CrossRef]
- Widdowson, E.M. A method for the determination of small quantities of mixed reducing sugars and its application to the estimation of the products of hydrolysis of starch. Imperial College of Science and Technology, London. 1931.
- Sowbhagya, C.M.a.K.R.B., Mysore. A Simplified Colorimetric Method for Determination of Amylose Content in Rice. Die Starke . Jahrg 1971, 23.
- Huang, C.-C.; Chiang, P.-Y.; Chen, Y.-Y.; Wang, C.-C. Chemical compositions and enzyme activity changes occurring in yam (Dioscorea alata L.) tubers during growth. LWT-Food Science and Technology 2007, 40, 1498–1506. [Google Scholar] [CrossRef]
- Muzac-Tucker, I.; Helen, N.; Ahmad, M. Biochemical composition and storage of Japanican yams (Dioscorea spp.). Journal of the Science of Food and Agriculture 1993, 62, 219–224. [Google Scholar] [CrossRef]
- Paul, M.J.; Lawlor, D.W. GENETIC MODIFICATION OF PRIMARY METABOLISM | Photosynthesis. Encyclopedia of Applied Plant Sciences 2003, 484–493. [Google Scholar] [CrossRef]
- Jabrin, S.; Ravanel, S.; Gambonnet, B.; Douce, R.; Rébeillé, F. One-carbon metabolism in plants. Regulation of tetrahydrofolate synthesis during germination and seedling development. Plant physiology 2003, 131, 1431–1439. [Google Scholar] [CrossRef] [PubMed]
- Landhäusser, S. Aspen shoots are carbon autonomous during bud break. Trees- Structure And Function 2011, 25. , 531–536. [CrossRef]
- Ohanenye, I.C.; Alamar, M.C.; Thompson, A.J.; Terry, L.A. Fructans redistribution prior to sprouting in stored onion bulbs is a potential marker for dormancy break. Postharvest Biology and Technology 2019, 149, 221–234. [Google Scholar] [CrossRef] [PubMed]
- Smeekens, S.; Hellmann; A., H. Sugar sensing and signaling in plants. Frontiers in Plant Science 2014, 5, 185–205.
- Lastdrager, J.; Hanson, J.; Smeekens, S. Sugar signals and the control of plant growth and development. Journal of experimental botany 2014, 65, 799–807. [Google Scholar] [CrossRef] [PubMed]
- Martínez-Vilalta, J.; Sala, A.; Asensio, D.; Galiano, L.; Hoch, G.; Palacio, S.; Piper, F.I.; Lloret, F. Dynamics of non-structural carbohydrates in terrestrial plants: a global synthesis. Ecological Monographs 2016, 86, 495–516. [Google Scholar] [CrossRef]
- Doblin, M.S.; Kurek, I.; Jacob-Wilk, D.; Delmer, D.P. Cellulose biosynthesis in plants: from genes to rosettes. Plant and cell physiology 2002, 43, 1407–1420. [Google Scholar] [CrossRef]
- Tsai, A., Y-L .,; Gazzarrini, S. Trehalose-6-phosphate and SnRK1 kinases in plant development and signaling: the emerging picture. Frontiers in Plant Science 2014, 5, 1–11. [CrossRef]
- Durán-Soria, S.; Pott, D.M.; Osorio, S.; Vallarino, J.G. Sugar signaling during fruit ripening. Frontiers in Plant Science 2020, 11, 564917. [Google Scholar] [CrossRef]
- Hartmann, H.; Adams, H.D.; Hammond, W.M.; Hoch, G.; Landhäusser, S.M.; Wiley, E.; Zaehle, S. Identifying differences in carbohydrate dynamics of seedlings and mature trees to improve carbon allocation in models for trees and forests. Environmental and Experimental Botany 2018, 152, 7–18. [Google Scholar] [CrossRef]
- Yadav, U.P.; Ivakov, A.; Feil, R.; Duan, G.Y.; Walther, D.; Giavalisco, P.; Piques, M.; Carillo, P.; Hubberten, H.-M.; Stitt, M. The sucrose–trehalose 6-phosphate (Tre6P) nexus: specificity and mechanisms of sucrose signalling by Tre6P. Journal of experimental botany 2014, 65, 1051–1068. [Google Scholar] [CrossRef]
- Baena-González, E.; Lunn, J.E. SnRK1 and trehalose 6-phosphate–two ancient pathways converge to regulate plant metabolism and growth. Current Opinion in Plant Biology 2020, 55, 52–59. [Google Scholar] [CrossRef]
- Goddijn, O.J.; van Dun, K. Trehalose metabolism in plants. Trends in plant science 1999, 4, 315–319. [Google Scholar] [CrossRef] [PubMed]
- Figueroa, C.M.; Feil, R.; Ishihara, H.; Watanabe, M.; Kölling, K.; Krause, U.; Höhne, M.; Encke, B.; Plaxton, W.C.; Zeeman, S.C. Trehalose 6–phosphate coordinates organic and amino acid metabolism with carbon availability. The Plant Journal 2016, 85, 410–423. [Google Scholar] [CrossRef] [PubMed]
- Zhang, Z.; Zhu, J.-Y.; Roh, J.; Marchive, C.; Kim, S.-K.; Meyer, C.; Sun, Y.; Wang, W.; Wang, Z.-Y. TOR signaling promotes accumulation of BZR1 to balance growth with carbon availability in Arabidopsis. Current Biology 2016, 26, 1854–1860. [Google Scholar] [CrossRef] [PubMed]
- Bledsoe, S.W.; Henry, C.; Griffiths, C.A.; Paul, M.J.; Feil, R.; Lunn, J.E.; Stitt, M.; Lagrimini, L.M. The role of Tre6P and SnRK1 in maize early kernel development and events leading to stress-induced kernel abortion. BMC Plant Biology 2017, 17, 1–17. [Google Scholar] [CrossRef]
Figure 1.
Dormancy duration of two white yam genotypes (Obiaoturugo and TDr1100873). Bars indicate statistically significant difference between the genotypes at P≤0.05.
Figure 1.
Dormancy duration of two white yam genotypes (Obiaoturugo and TDr1100873). Bars indicate statistically significant difference between the genotypes at P≤0.05.
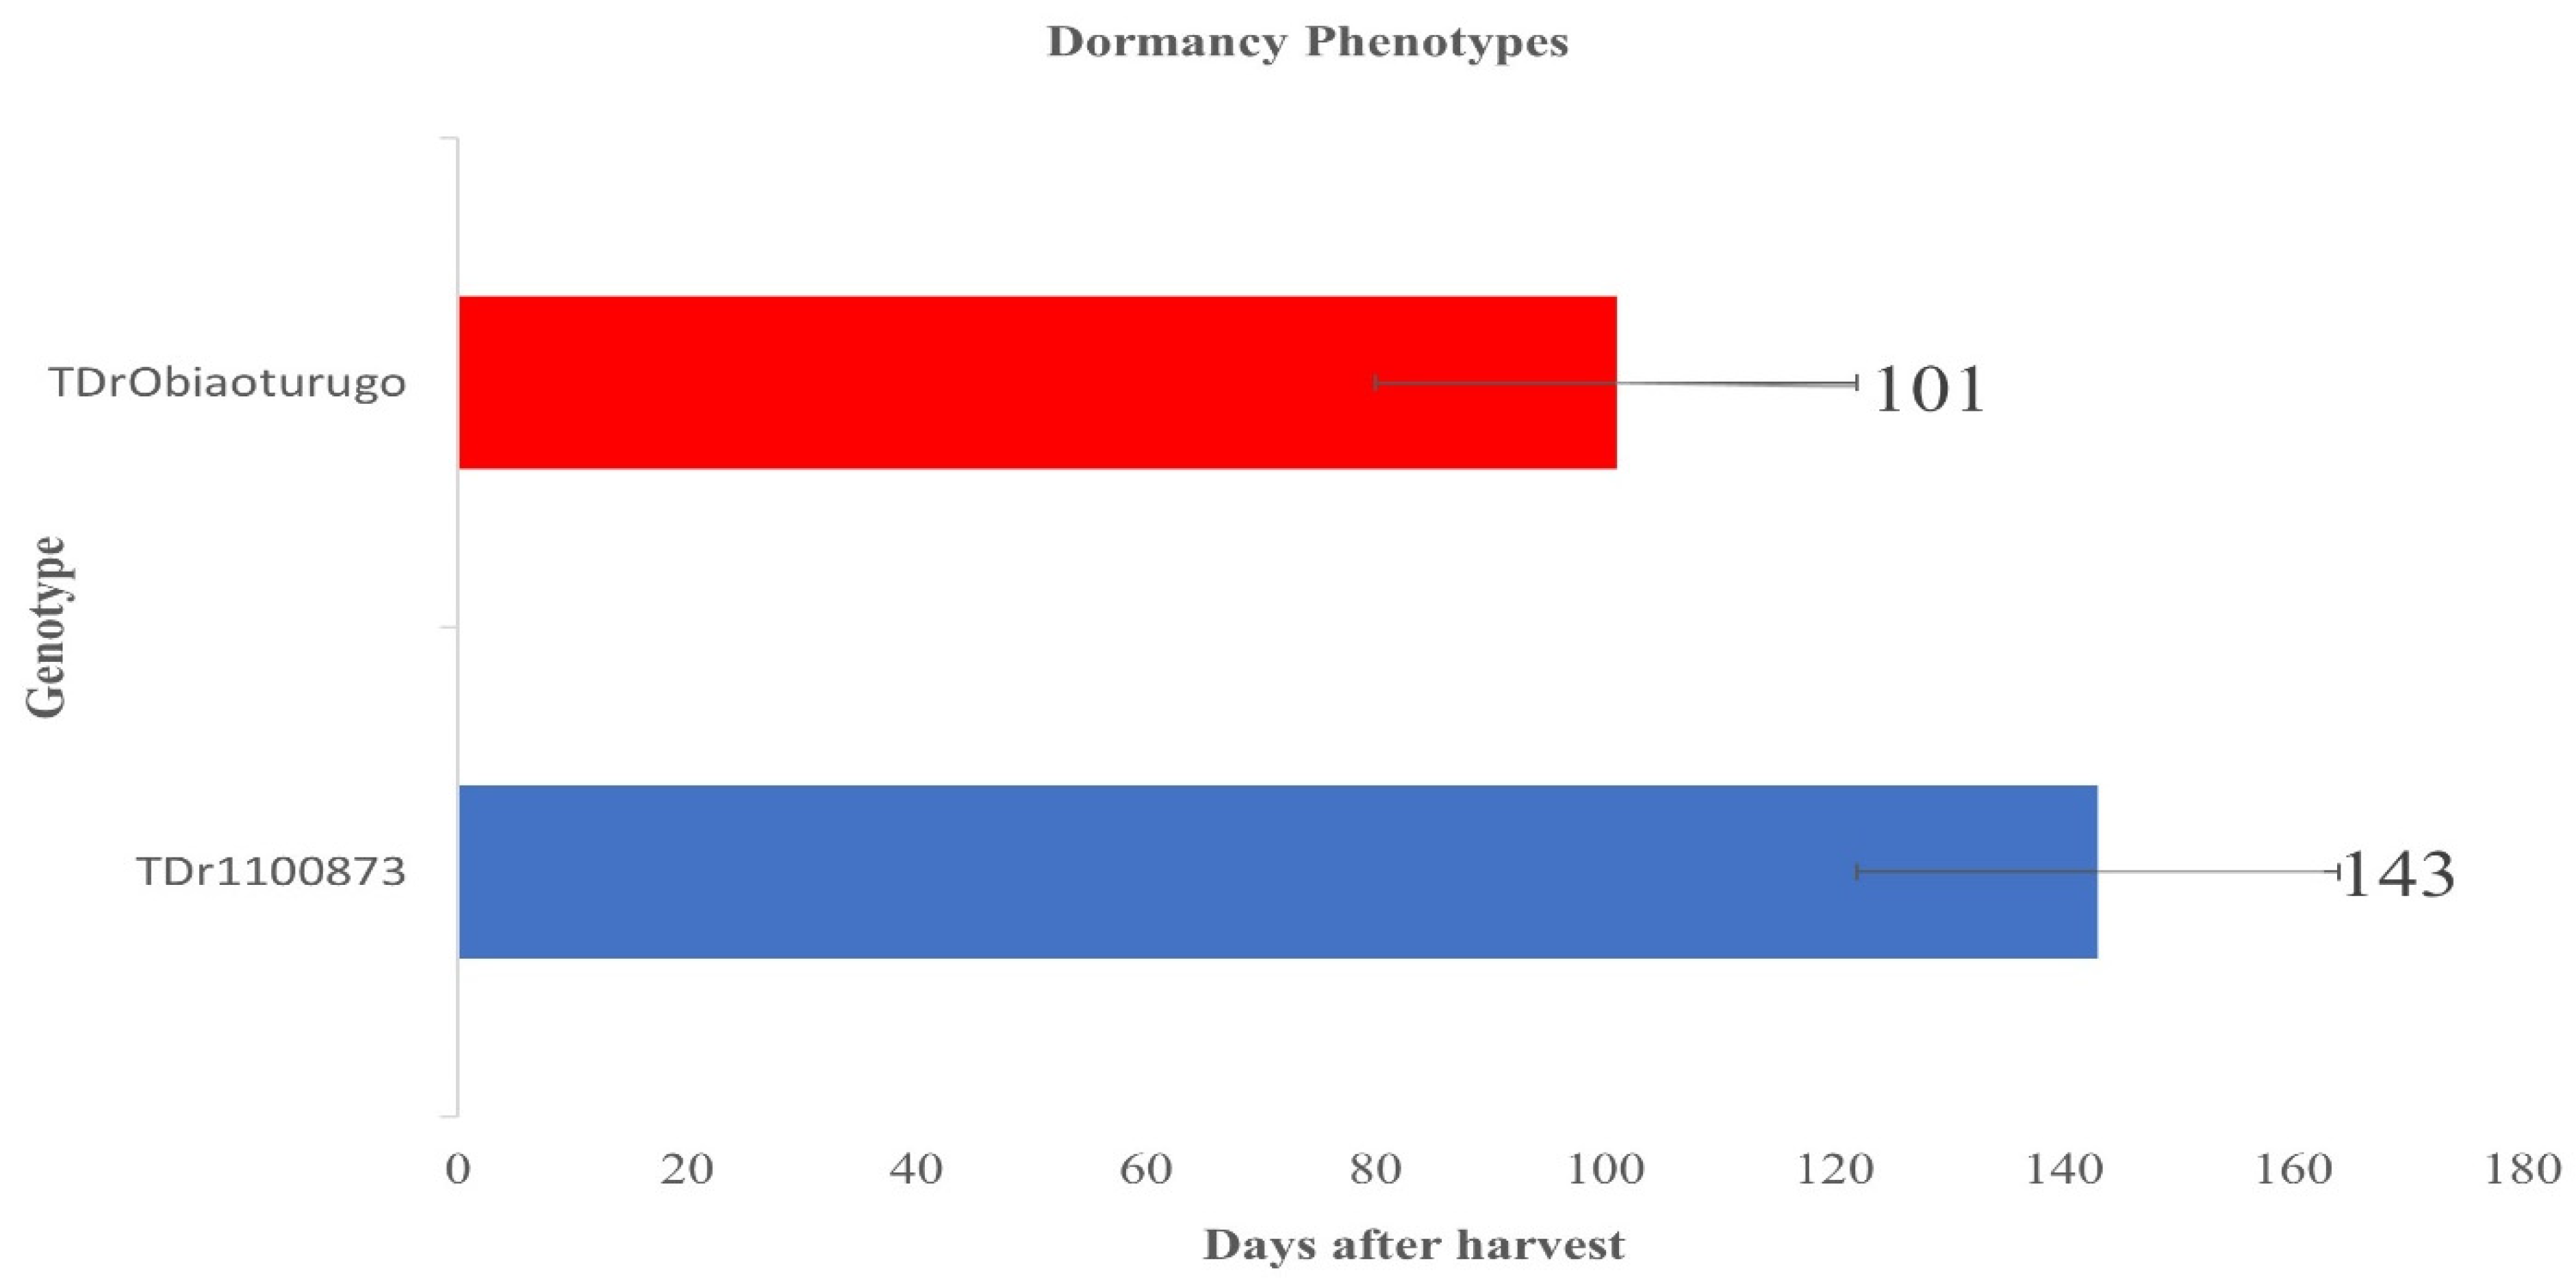
Figure 2.
a-b Metabolic changes in non-structural sugar, dry matter and moisture content in two white yam genotypes tuber from dormancy to sprouting. A is the data for TDr1100873, and B is the data for Obiaoturugo. Error bars indicate statistically significant differences among the variables at P≤0.05.
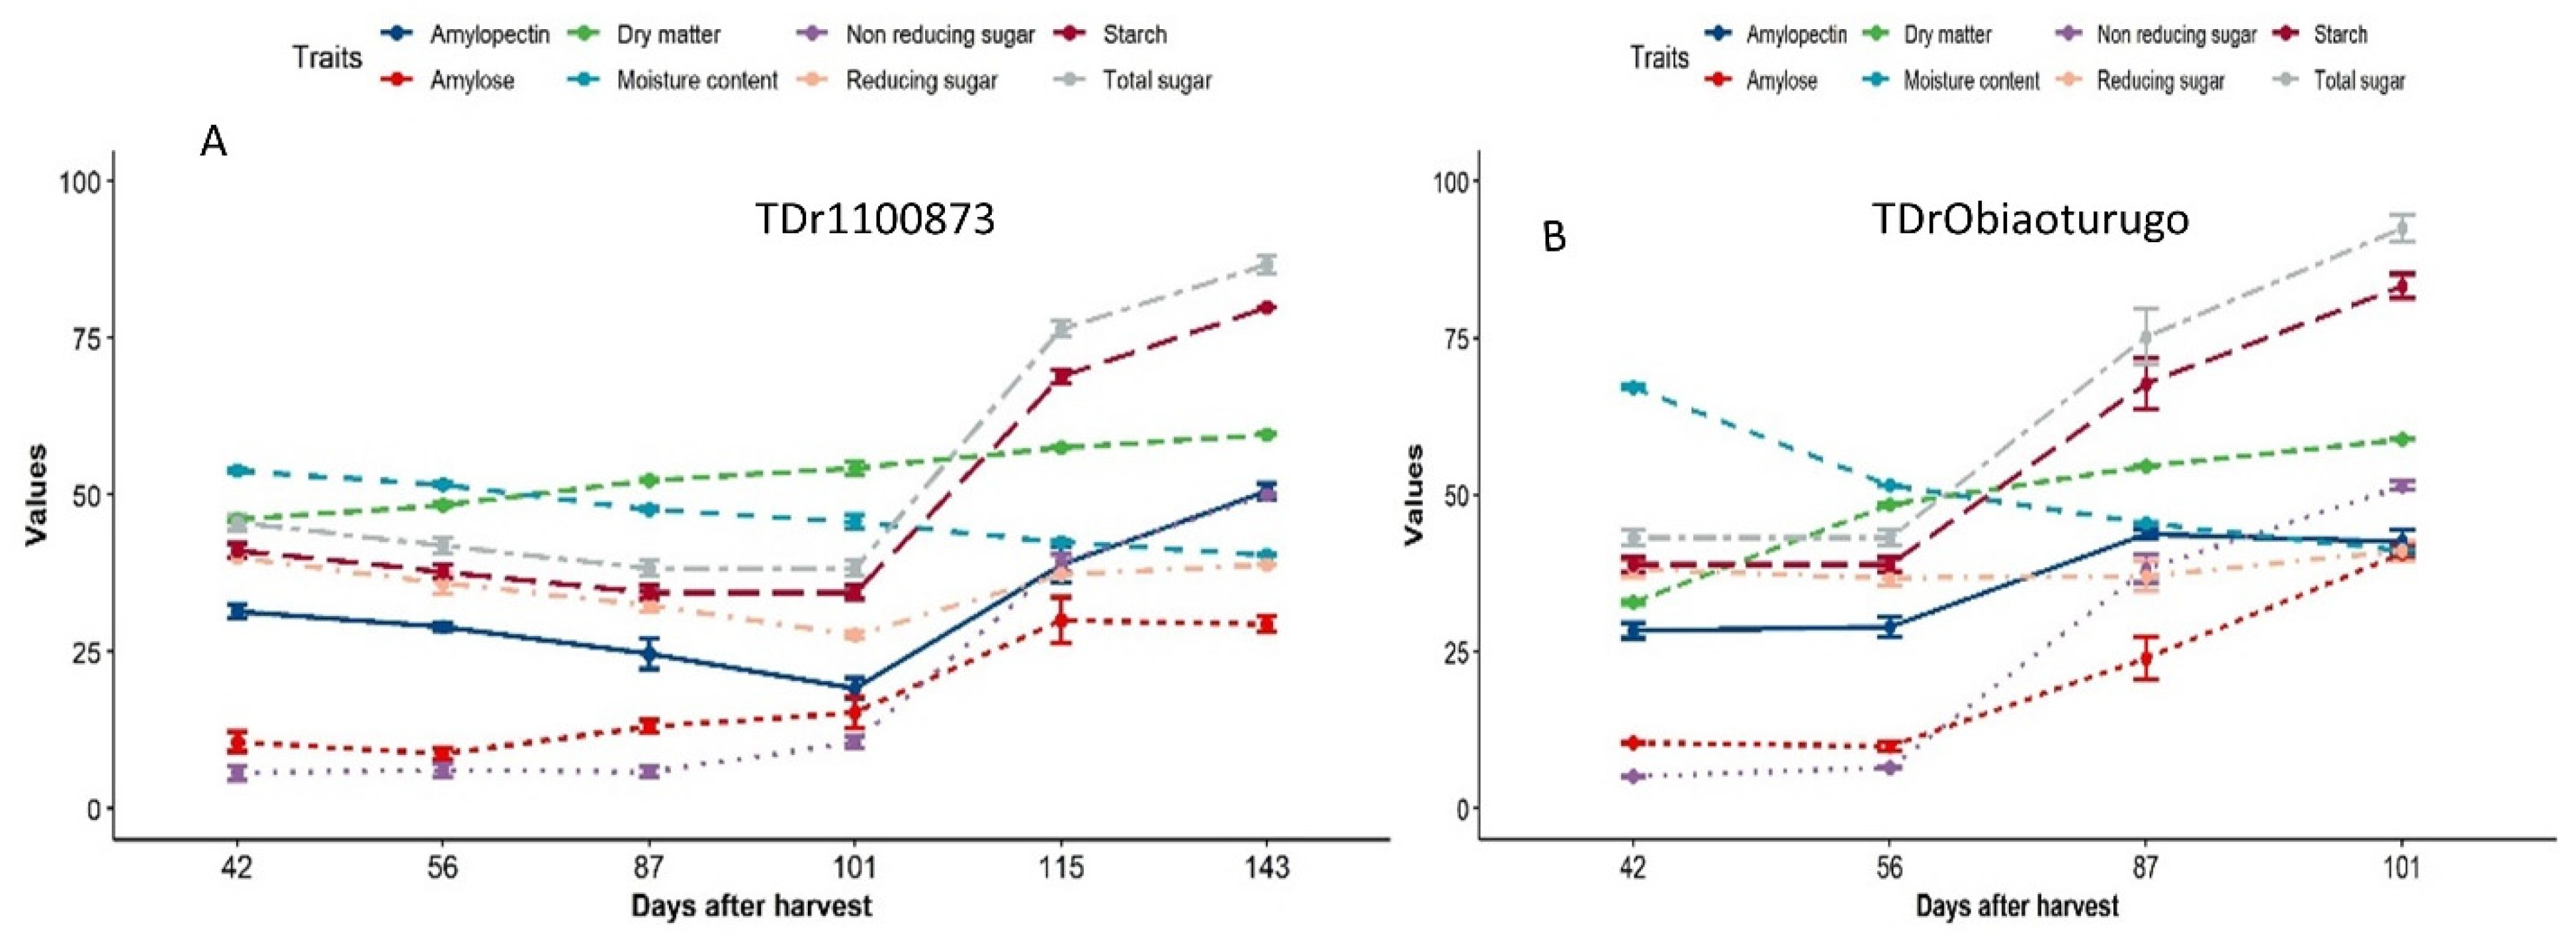
Figure 3.
a-f Changes in dry matter and moisture content in tubers of two white yam genotypes (TDr1100873 and Obiaoturugo) from tuber physiological maturity to sprouting. Bars with the same letters are not significantly different, while those with different are significantly different at P=0.05. G1=TDr1100873 and G2 = Obiaoturugo in figures a and d respectively. .
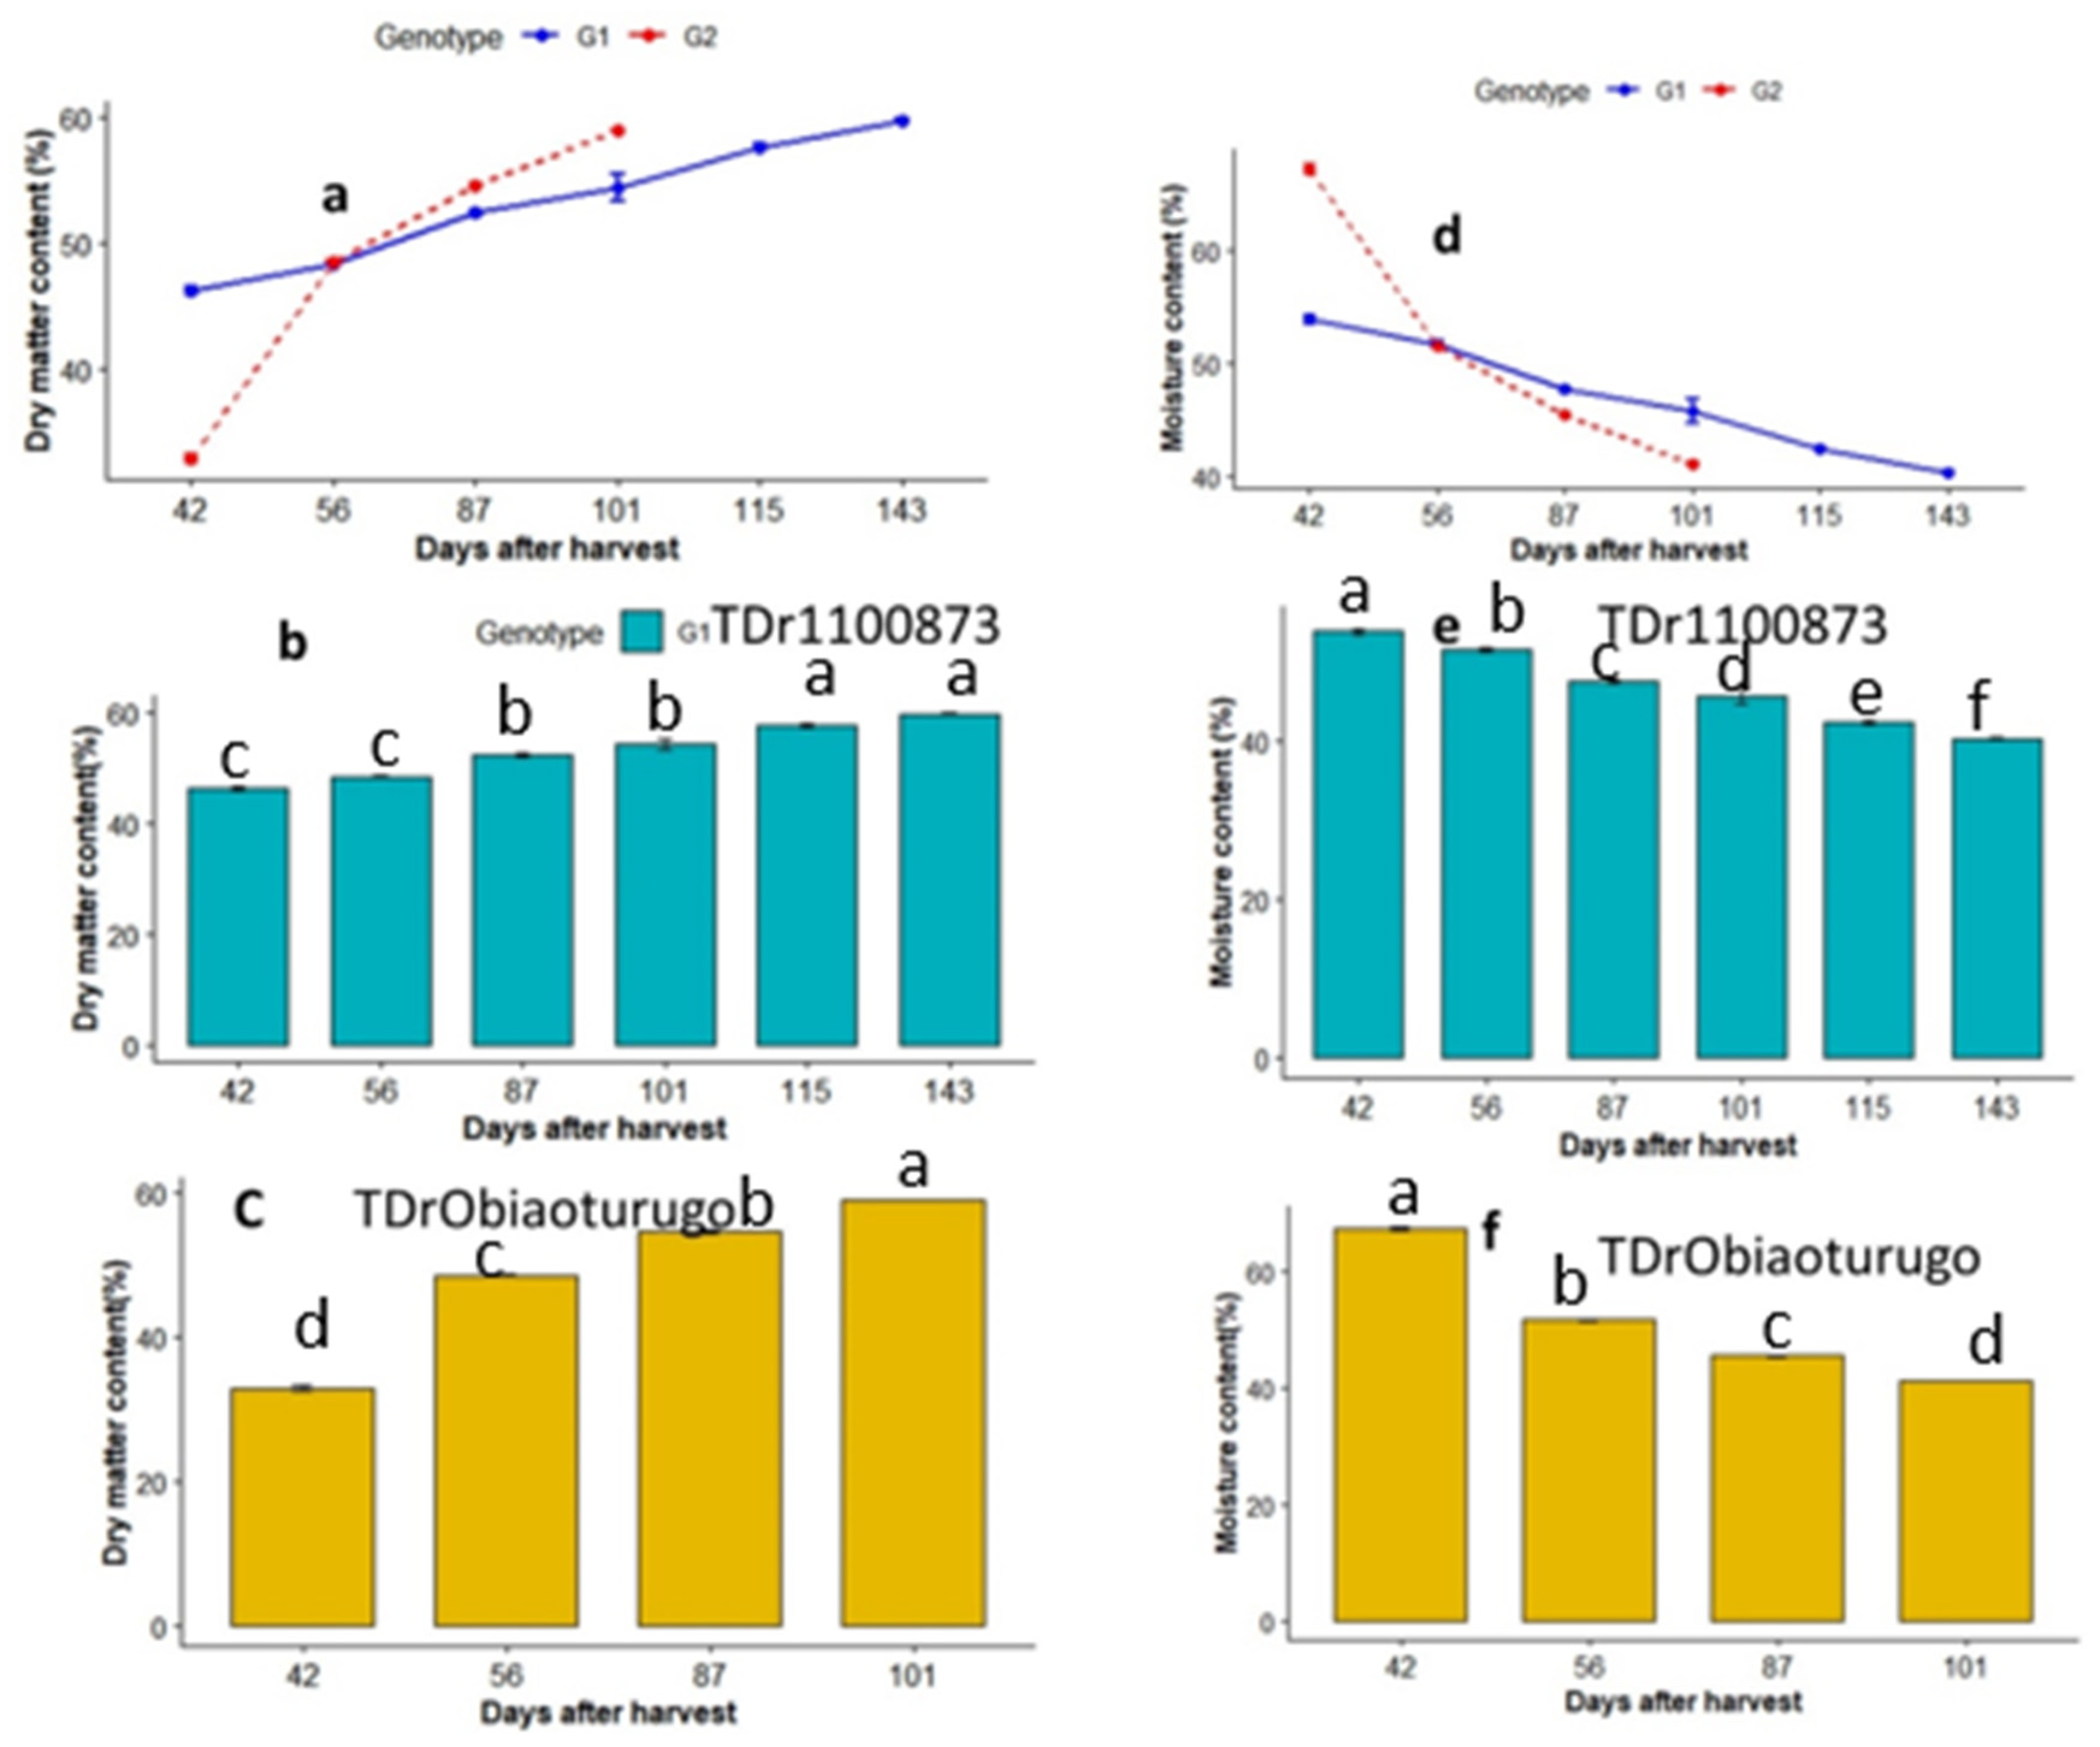
Figure 4.
a-f Total sugar and starch metabolic status in tubers of two white yam genotypes (TDr1100873 and Obiaoturugo) from physiological maturity to sprouting. Bars with the same letters are not significantly different, while those with different are significantly different at P=0.05. G1=TDr1100873 and G2 = Obiaoturugo in figures a and d respectively .
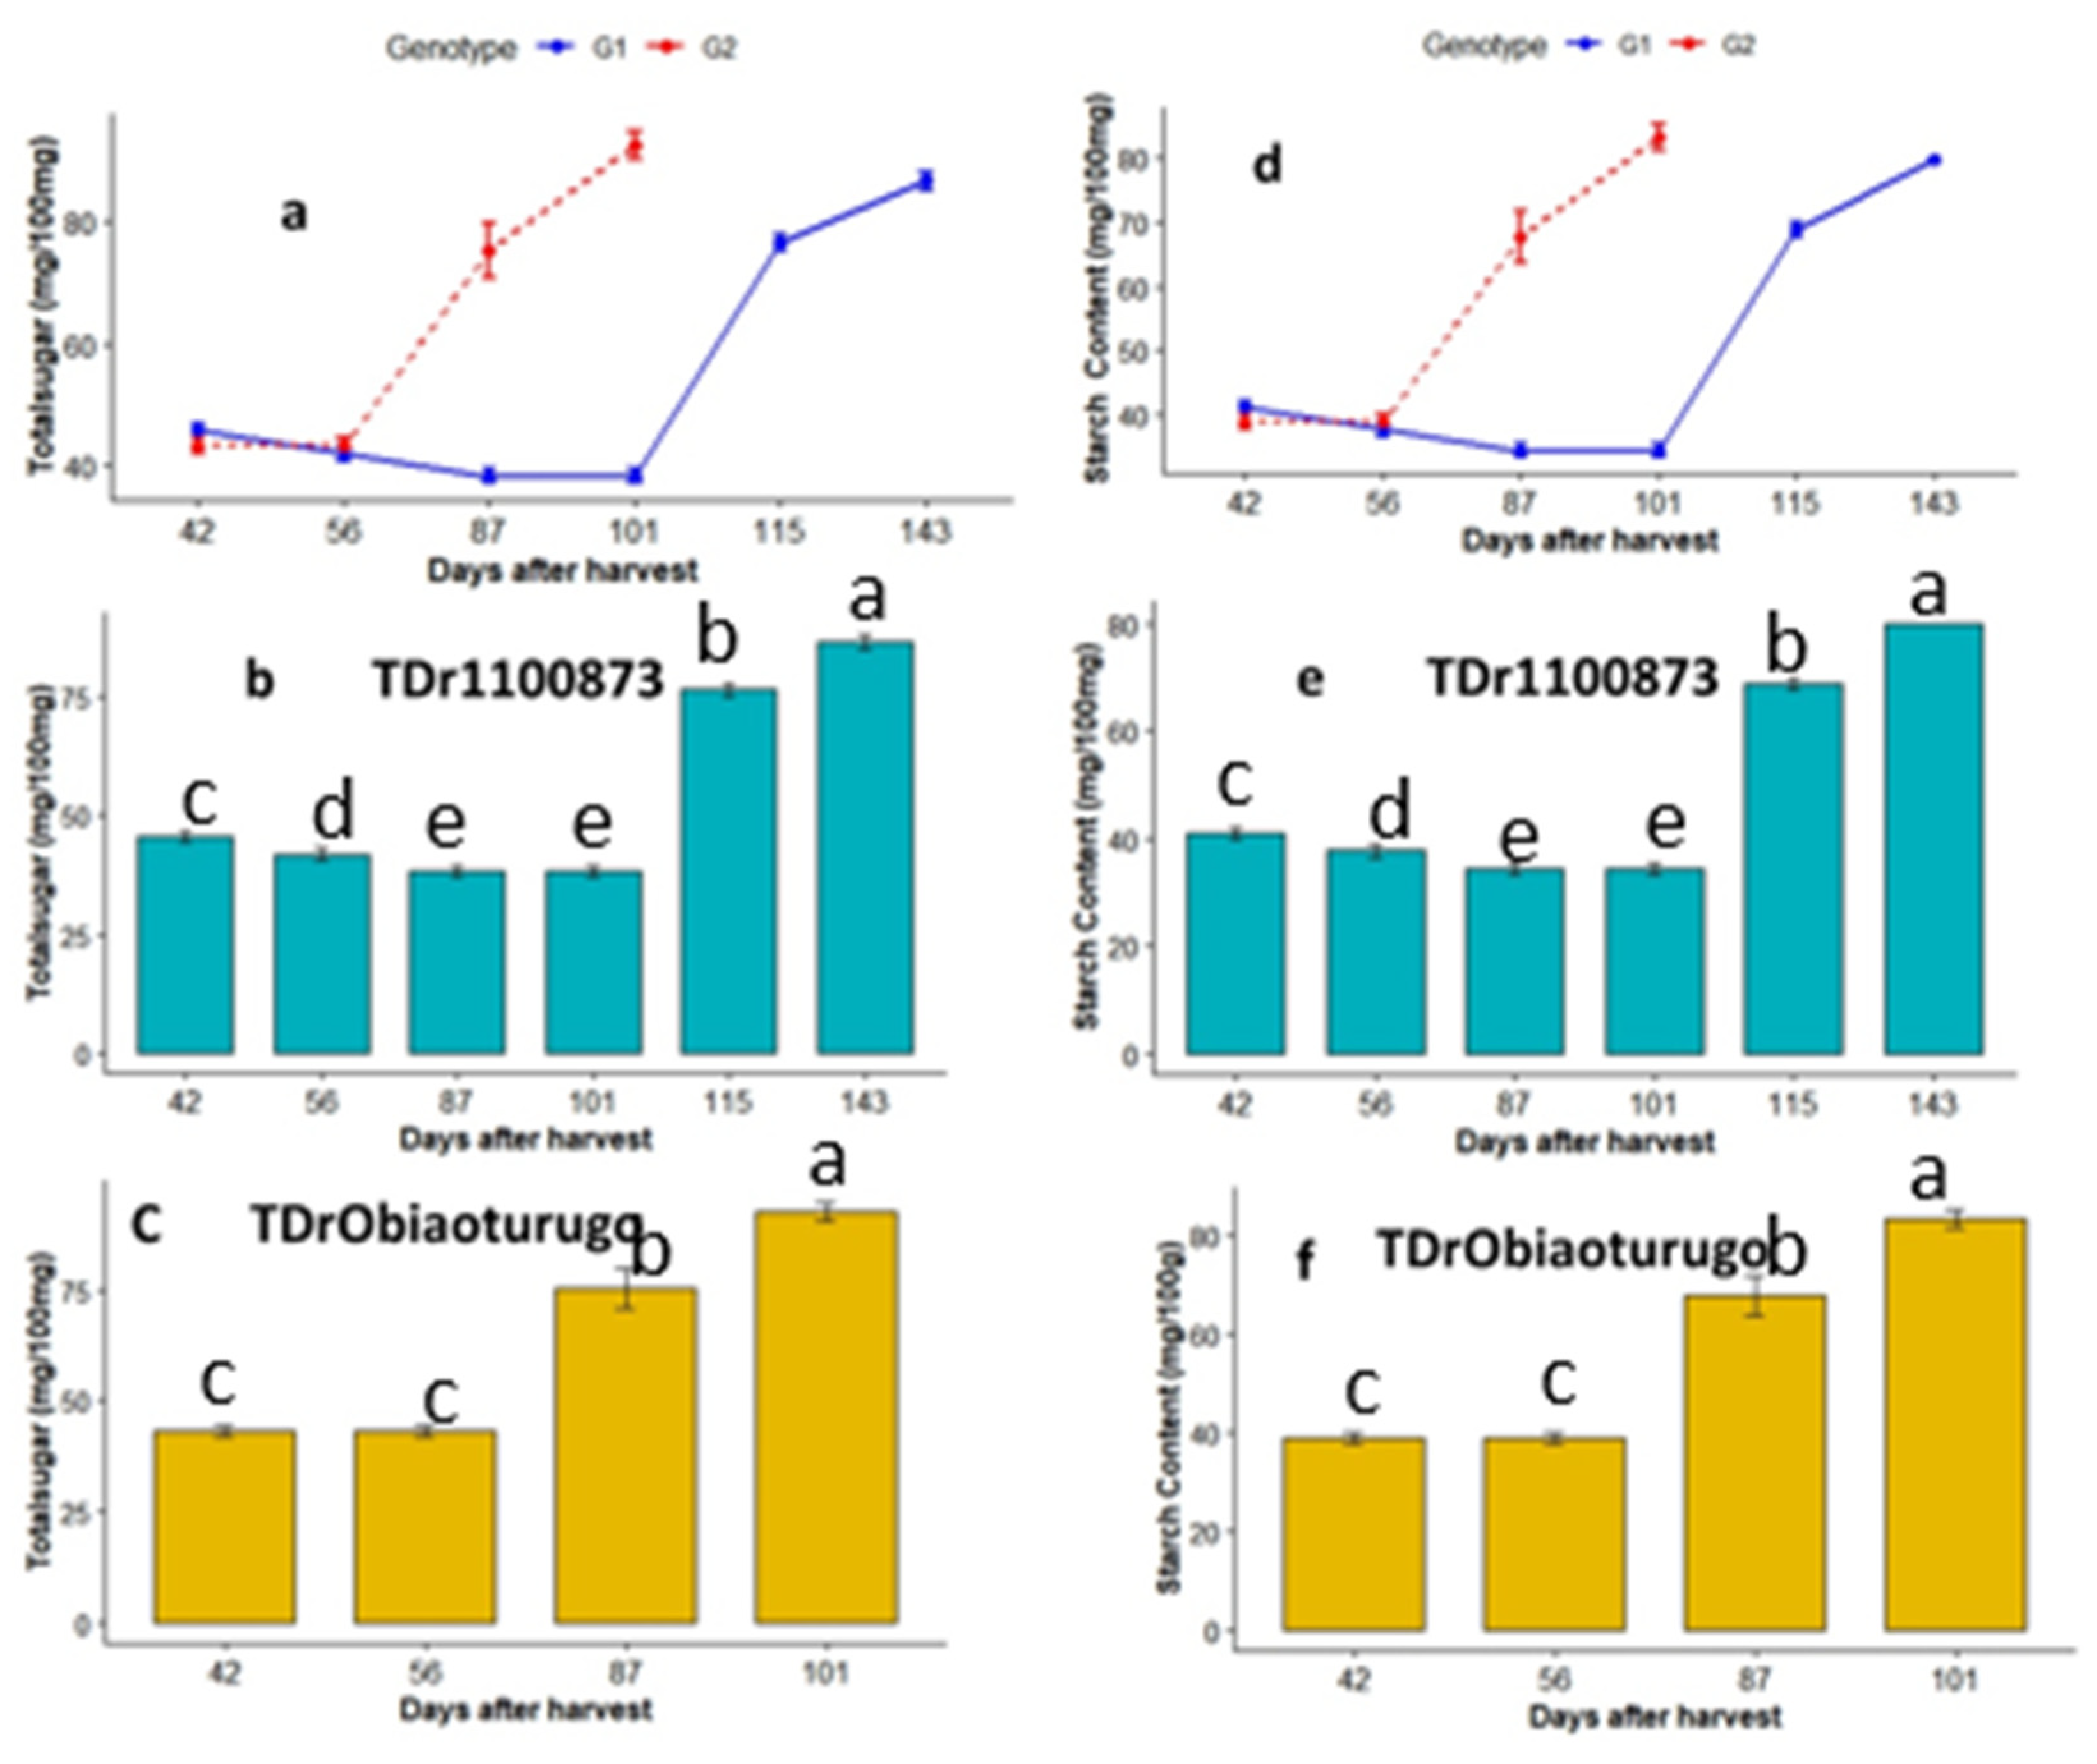
Figure 5.
a-f Amylose and Amylopectin metabolic status in tubers of two white yam genotypes (TDr1100873 and Obiaoturugo) from physiological maturity to sprouting. Bars with the same letters are not significantly different, while those with different are significantly different at P=0.05. G1=TDr1100873 and G2 = Obiaoturugo in figures a and d respectively .
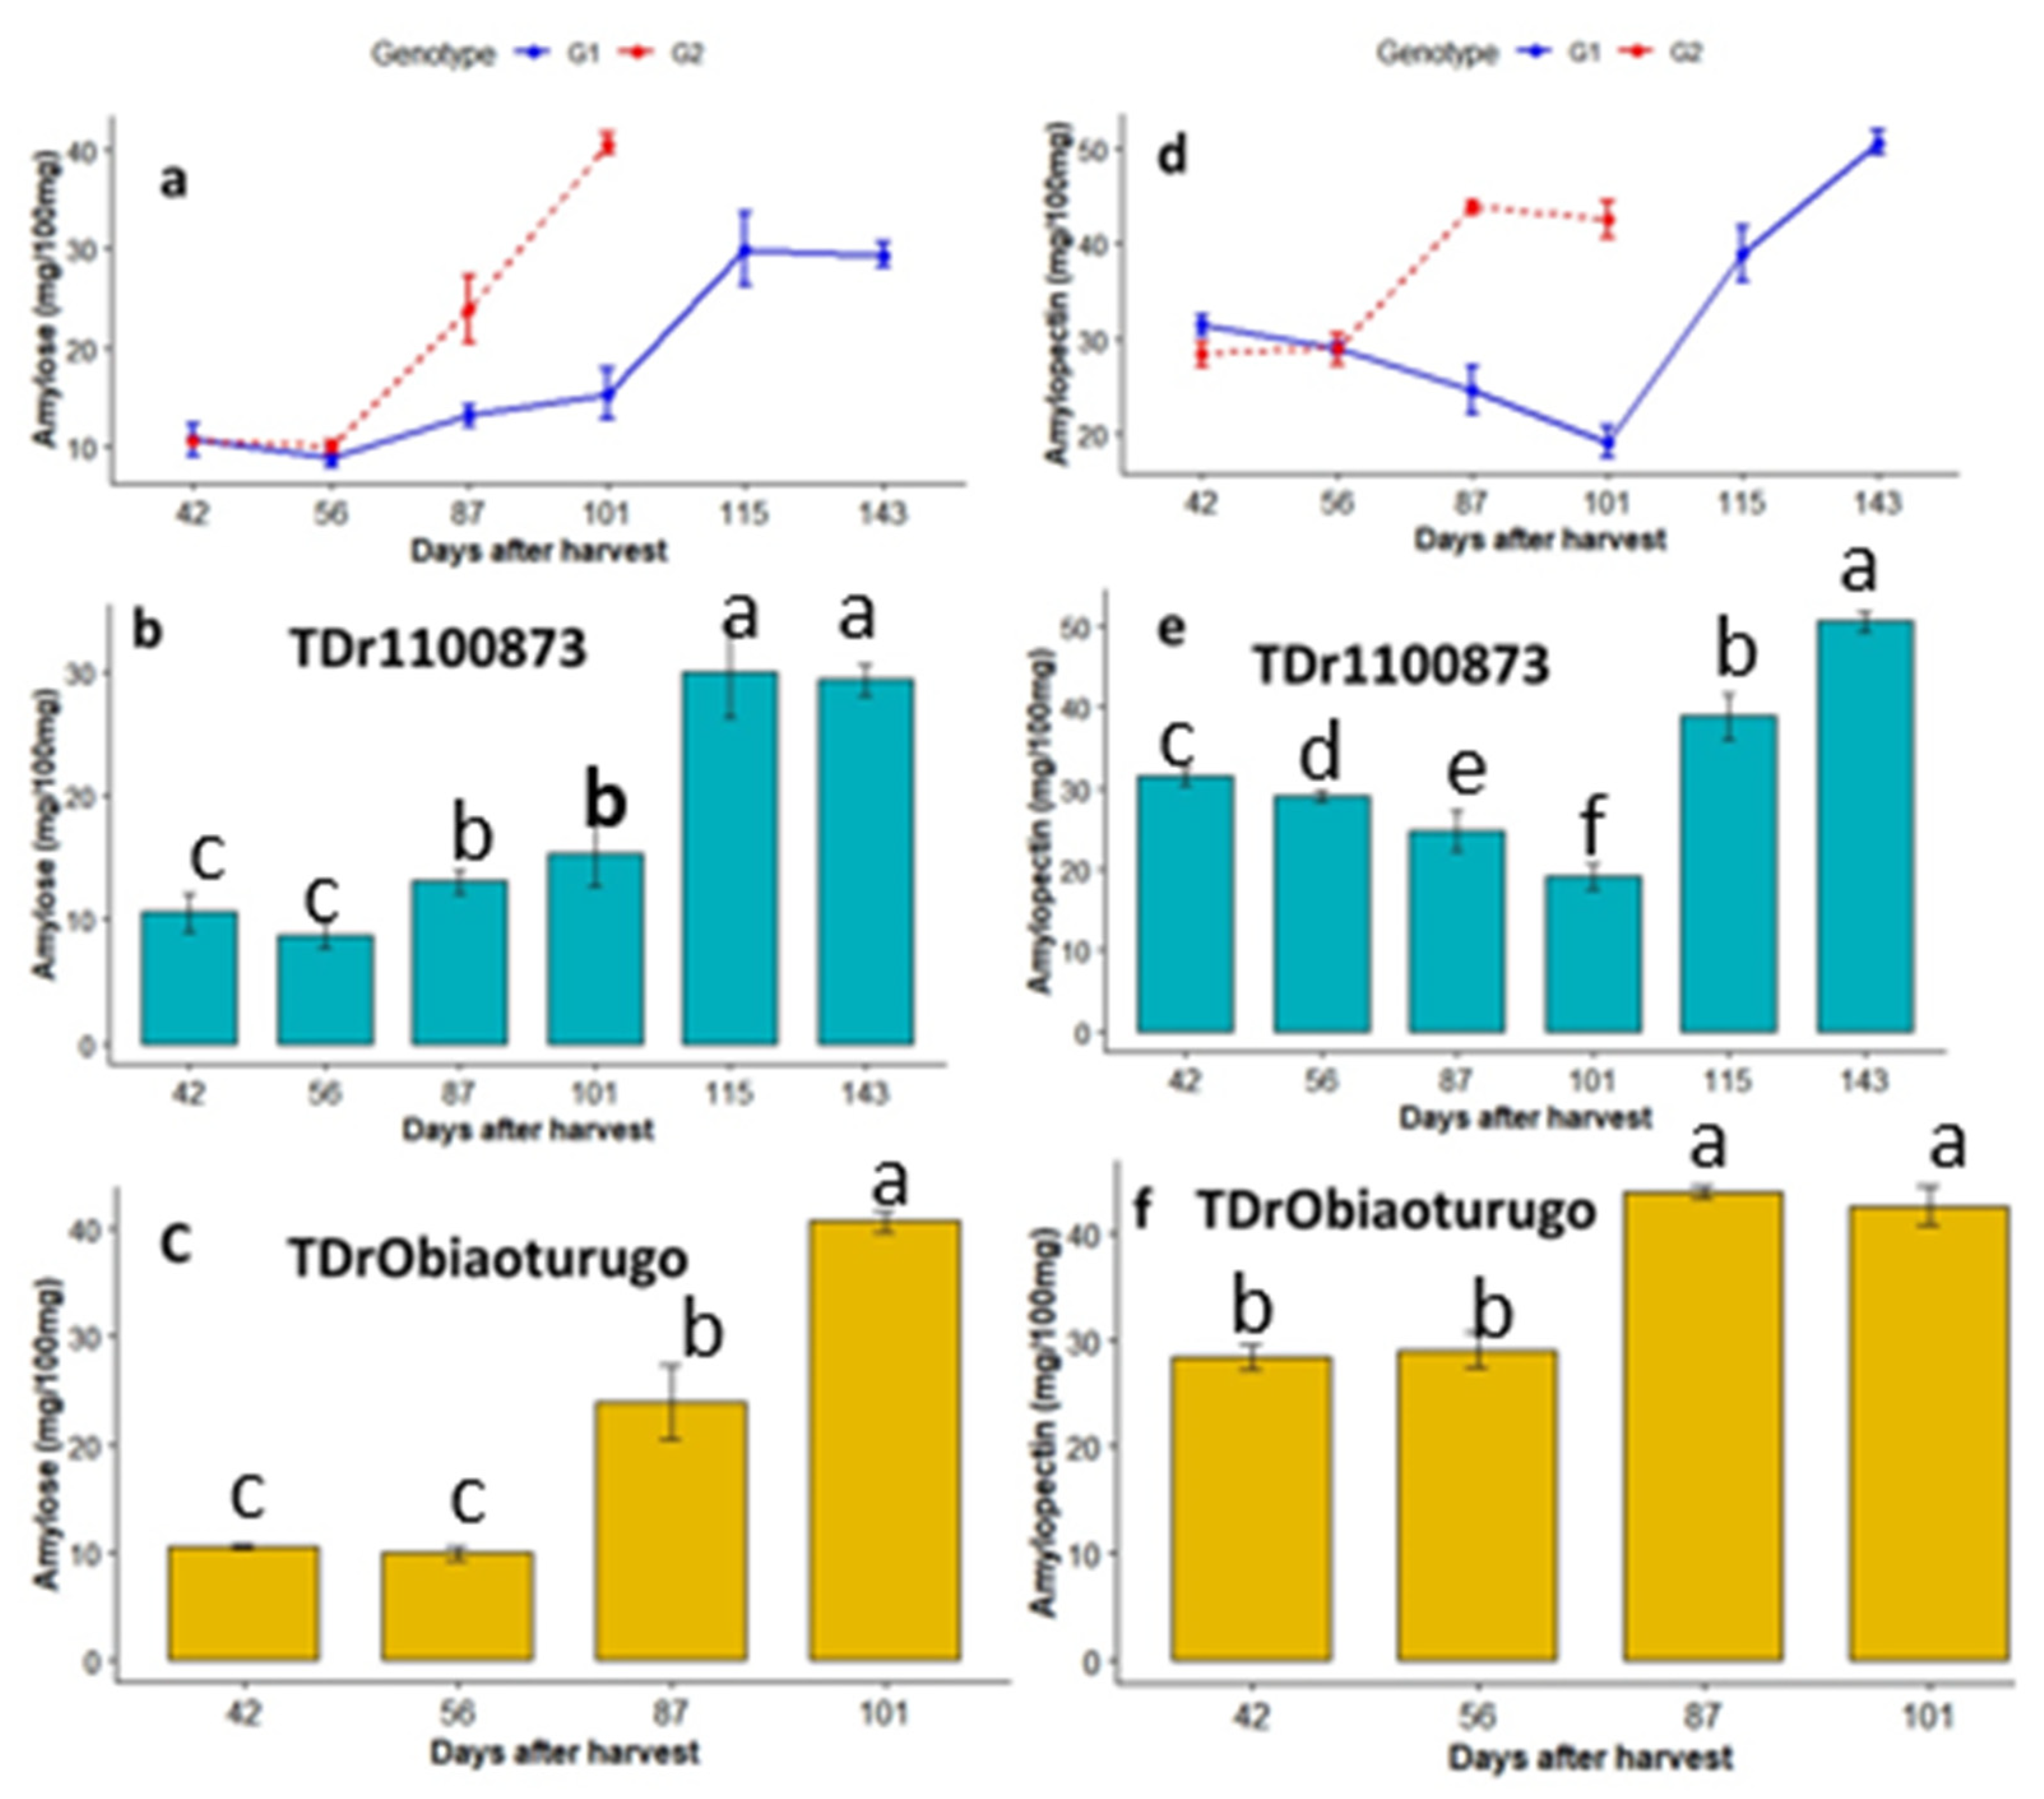
Figure 6.
a-f Reducing and Nonreducing sugars metabolic status in tubers of two white yam genotypes (TDr1100873 and Obiaoturugo) from physiological maturity to sprouting. Bars with the same letters are not significantly different, while those with different are significantly different at P=0.05 at P=0.05. G1=TDr1100873 and G2 = Obiaoturugo in figures a and d respectively.
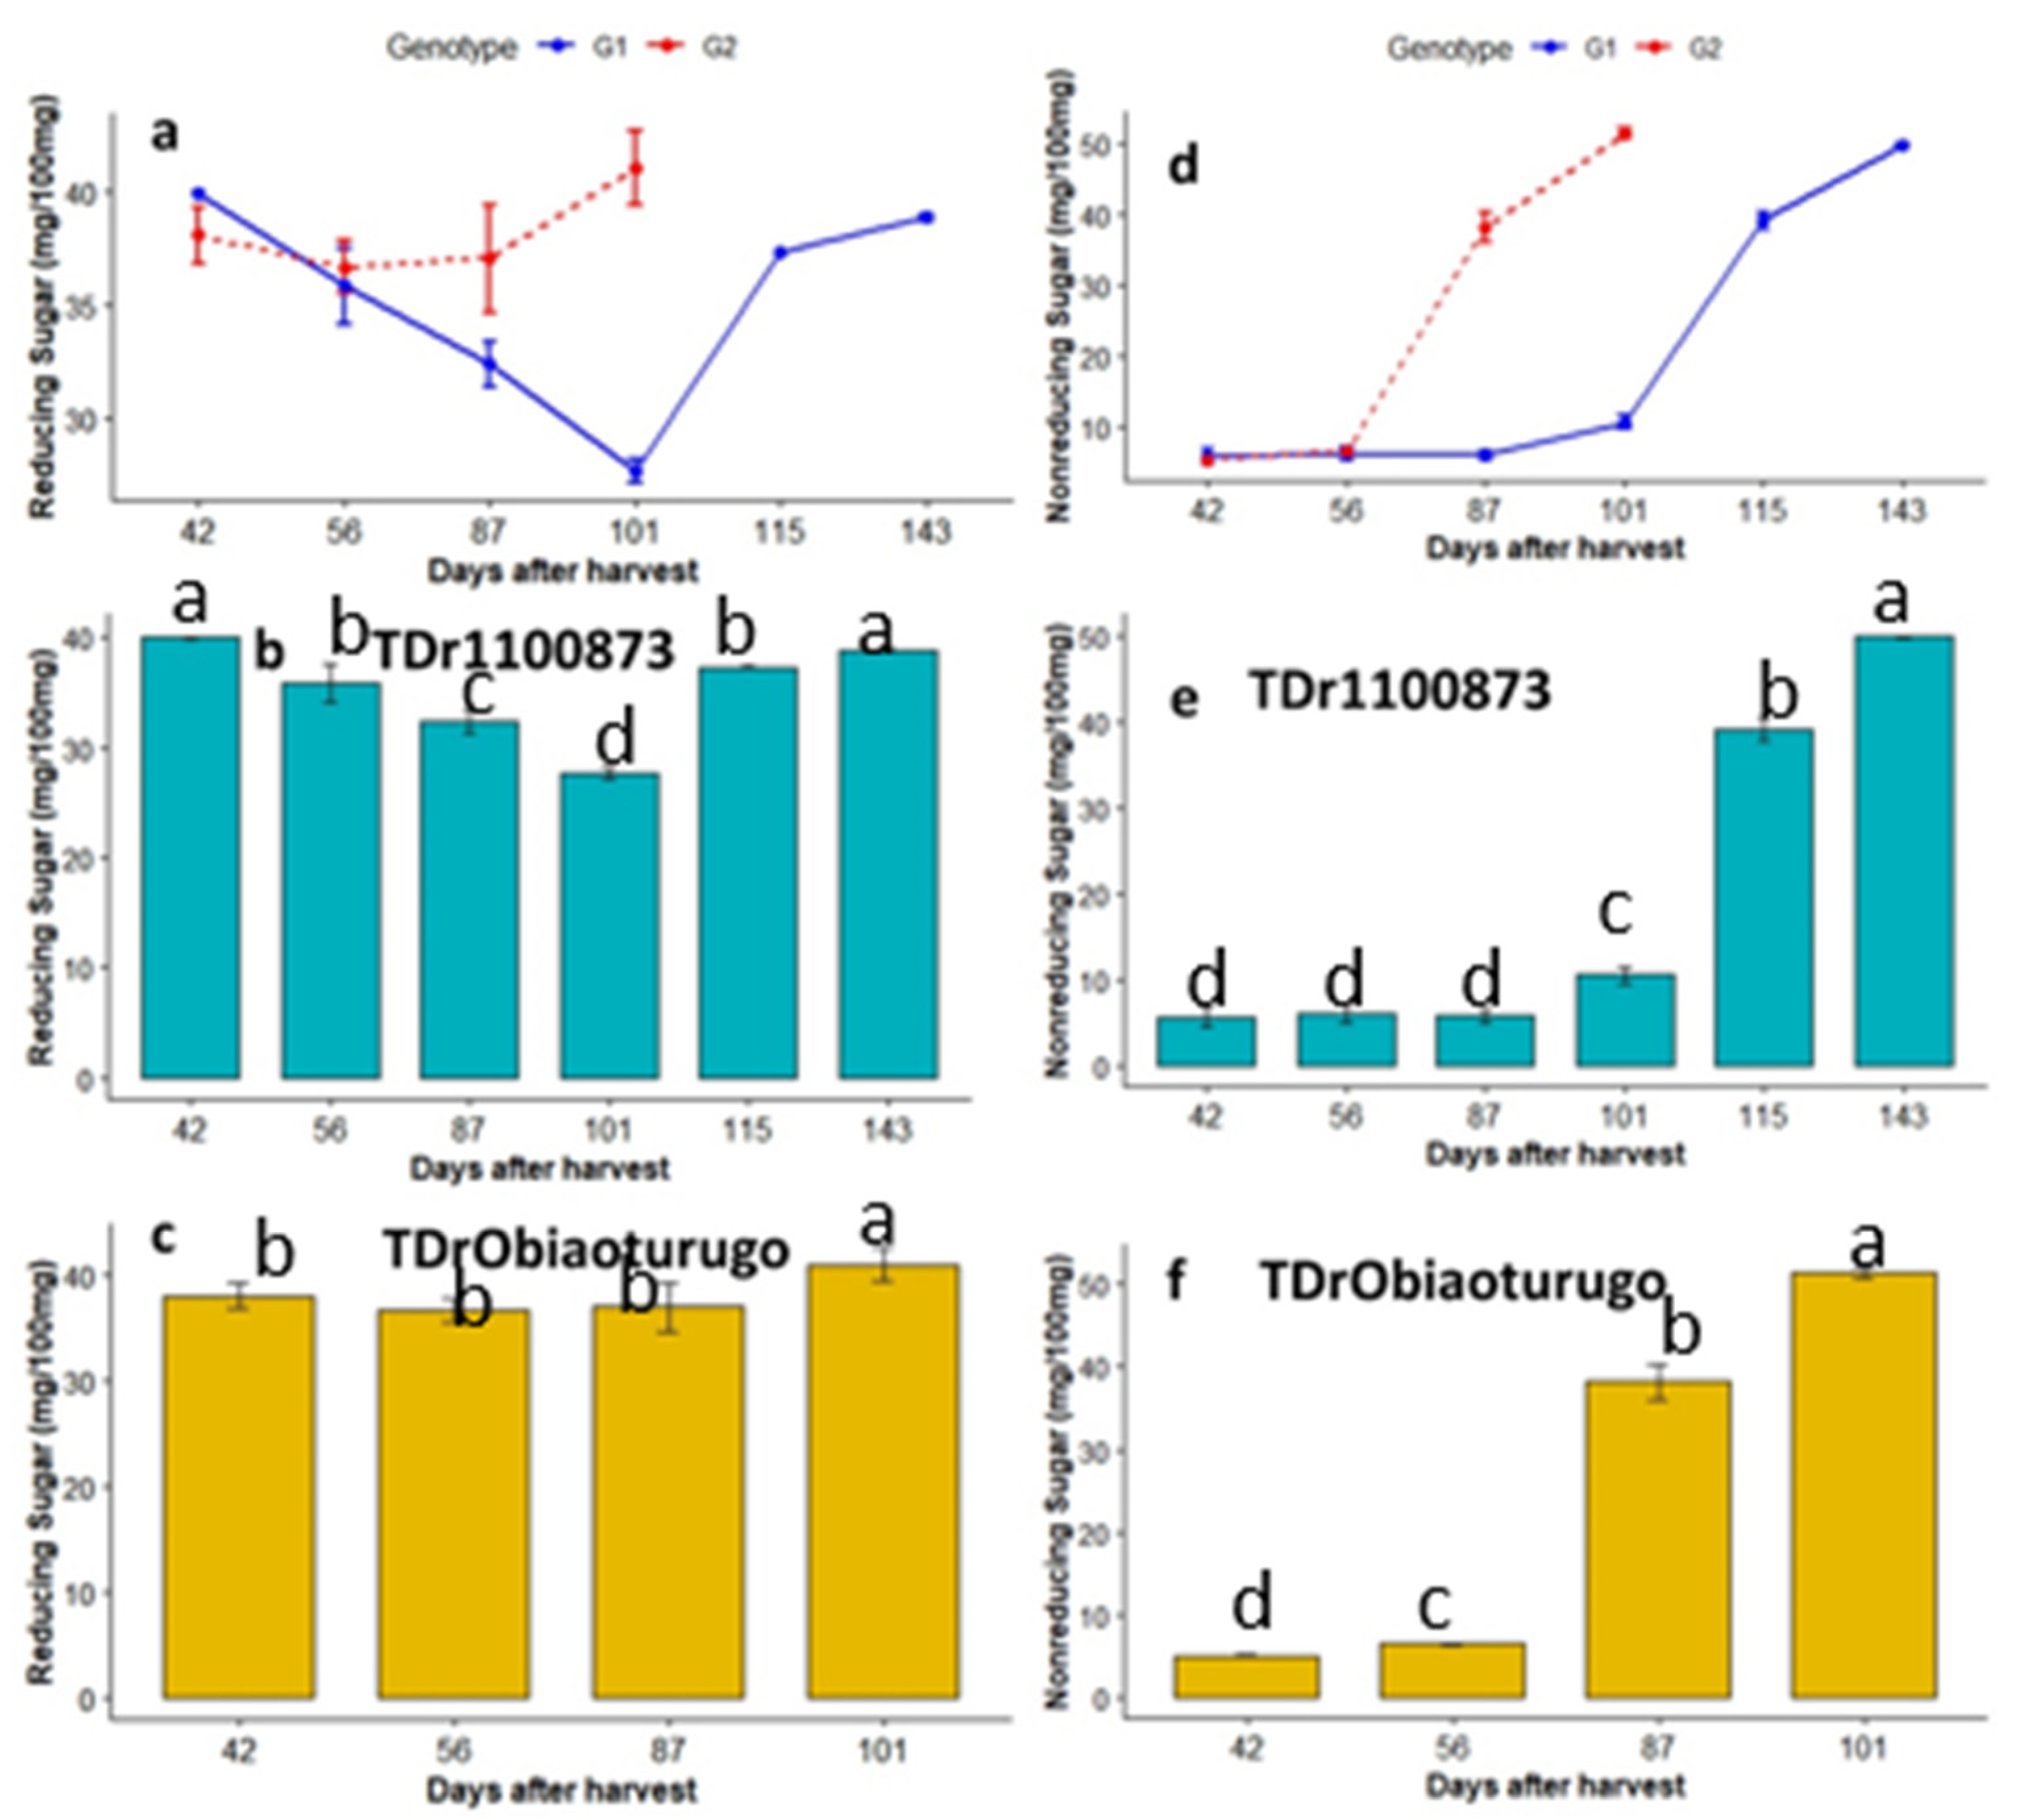
Figure 7.
a-b Correlation matrix showing linear relationships between non-structural sugars parameters, dry matter and moisture content in yam tuber from dormancy to sprouting. Both a and b are visualizing the same relationships in different formats. In both figures, color shades indicate the degree of relationship between two variables connected in the box or on edge at P = 0.05. In fig a, variables connected by blue are positively correlated to each other, while those connected by red are negatively correlated. In fig b, variable connected to each other at the edge by green-green lines are positively correlated, while those connected by red and green lines negatively correlated.
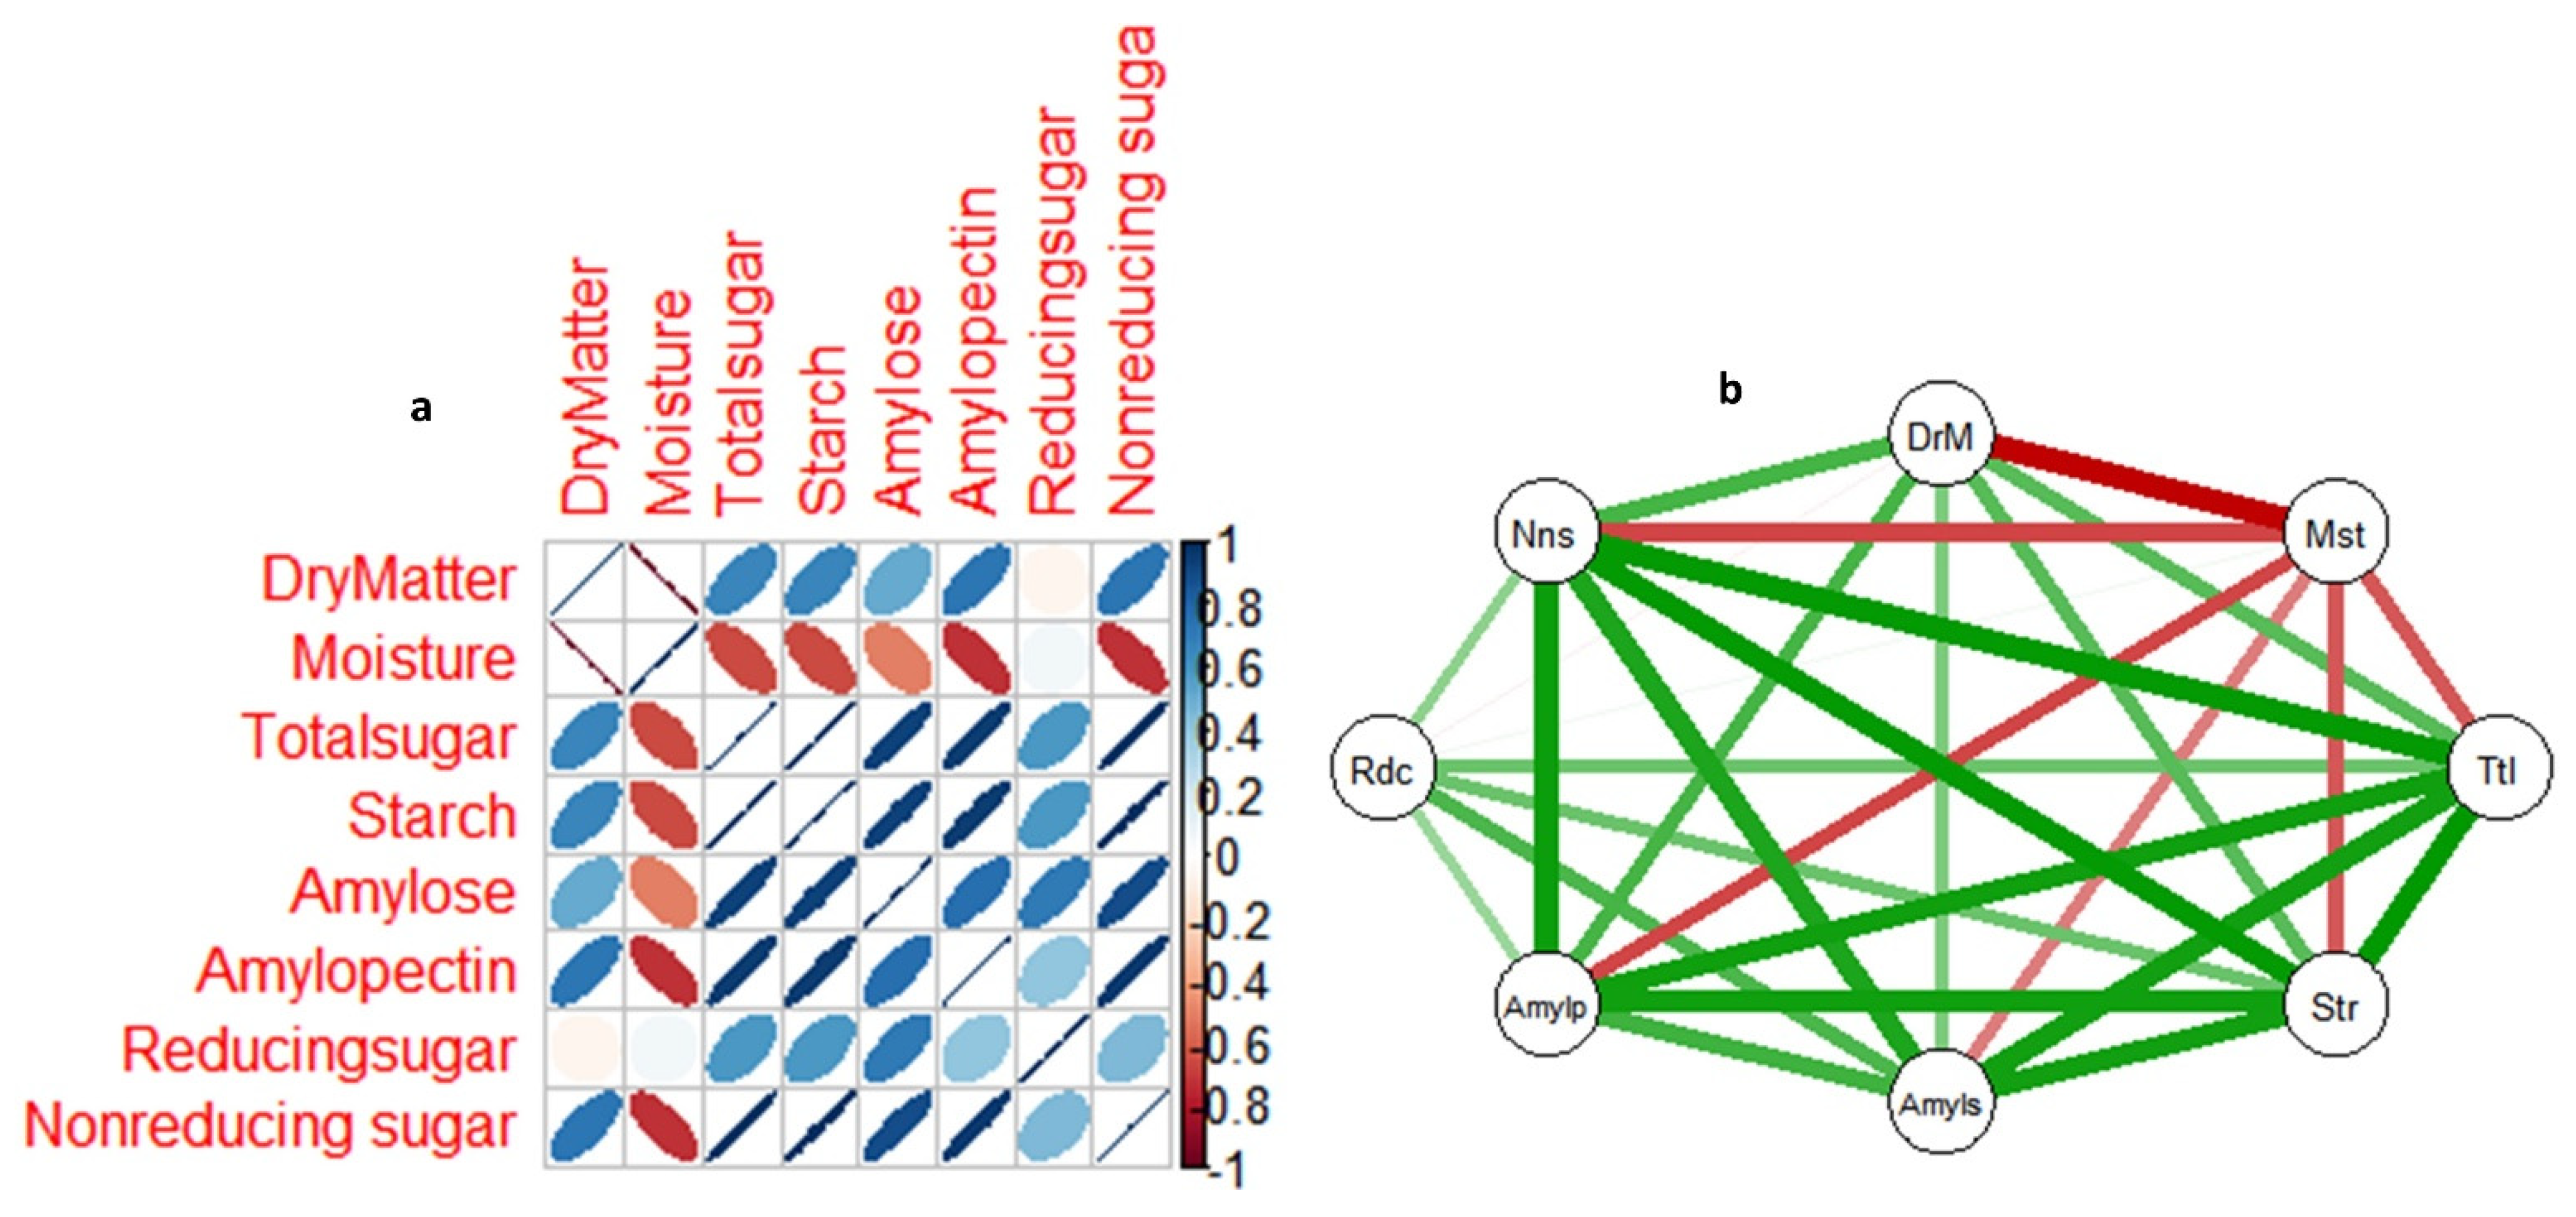

Table 1.
Summary of the changes in six sugar parameters, dry matter and moisture content in TDr1100873 and Obiaoturugo during dormancy
Table 1.
Summary of the changes in six sugar parameters, dry matter and moisture content in TDr1100873 and Obiaoturugo during dormancy
| Genotype | DAPM | DM% | Moisture% | Total Sugar(mg/100mg) | Starch(mg/100mg) | Amylopectin(mg/100mg) | Amylose(mg/100mg) | Reducing Sugar(mg/100mg) | Nonreducing Sugar(mg/100mg) | |
|---|---|---|---|---|---|---|---|---|---|---|
| TDr1100873 | 42days | 46.12c | 53.88a | 45.63c | 41.07c | 31.45c | 10.62c | 39.97a | 5.66d | |
| TDr1100873 | 56days | 48.35c | 51.65b | 41.93d | 37.74d | 28.98d | 8.76c | 35.87b | 6.07d | |
| TDr1100873 | 87days | 52.3b | 47.69c | 38.23e | 34.41e | 24.67e | 13.07b | 32.42c | 5.81d | |
| TDr1100873 | 101days | 54.29b | 45.72d | 38.23e | 34.41e | 19.12f | 15.29b | 27.68d | 10.56c | |
| TDr1100873 | 115days | 57.55a | 42.45e | 76.47b | 68.82b | 38.85b | 27.5a | 37.32b | 39.15b | |
| TDr1100873 | 143days | 59.91a | 40.09f | 86.7a | 79.92a | 50.57a | 29.35a | 38.87a | 49.94a | |
| TDrObia | 42days | 43.24d | 67.17a | 44.4c | 38.85c | 28.37b | 10.48c | 38.1ab | 5.07d | |
| TDrObia | 56days | 48.5c | 51.5b | 43.17c | 38.85c | 28.98b | 9.86c | 36.71b | 6.46c | |
| TDrObia | 87days | 54.47b | 45.46c | 75.23b | 67.71b | 43.78a | 23.93b | 37.14ab | 38.18b | |
| TDrObia | 101days | 59.88a | 40.12d | 92.5a | 83.25a | 42.55a | 40.7a | 41.1a | 51.44a |
Each variable was analyzed separately for each variety. Means were compared across the sampling points in days after physiological maturity at P≤0.05, pairwise means comparison was done using duncan post hoc test, and variables with same letter were not significantly different at p=0.05
Disclaimer/Publisher’s Note: The statements, opinions and data contained in all publications are solely those of the individual author(s) and contributor(s) and not of MDPI and/or the editor(s). MDPI and/or the editor(s) disclaim responsibility for any injury to people or property resulting from any ideas, methods, instructions or products referred to in the content. |
© 2023 by the authors. Licensee MDPI, Basel, Switzerland. This article is an open access article distributed under the terms and conditions of the Creative Commons Attribution (CC BY) license (http://creativecommons.org/licenses/by/4.0/).
Copyright: This open access article is published under a Creative Commons CC BY 4.0 license, which permit the free download, distribution, and reuse, provided that the author and preprint are cited in any reuse.


