Submitted:
03 February 2023
Posted:
06 February 2023
You are already at the latest version
Abstract
Keywords:
1. Introduction
2. Methodology
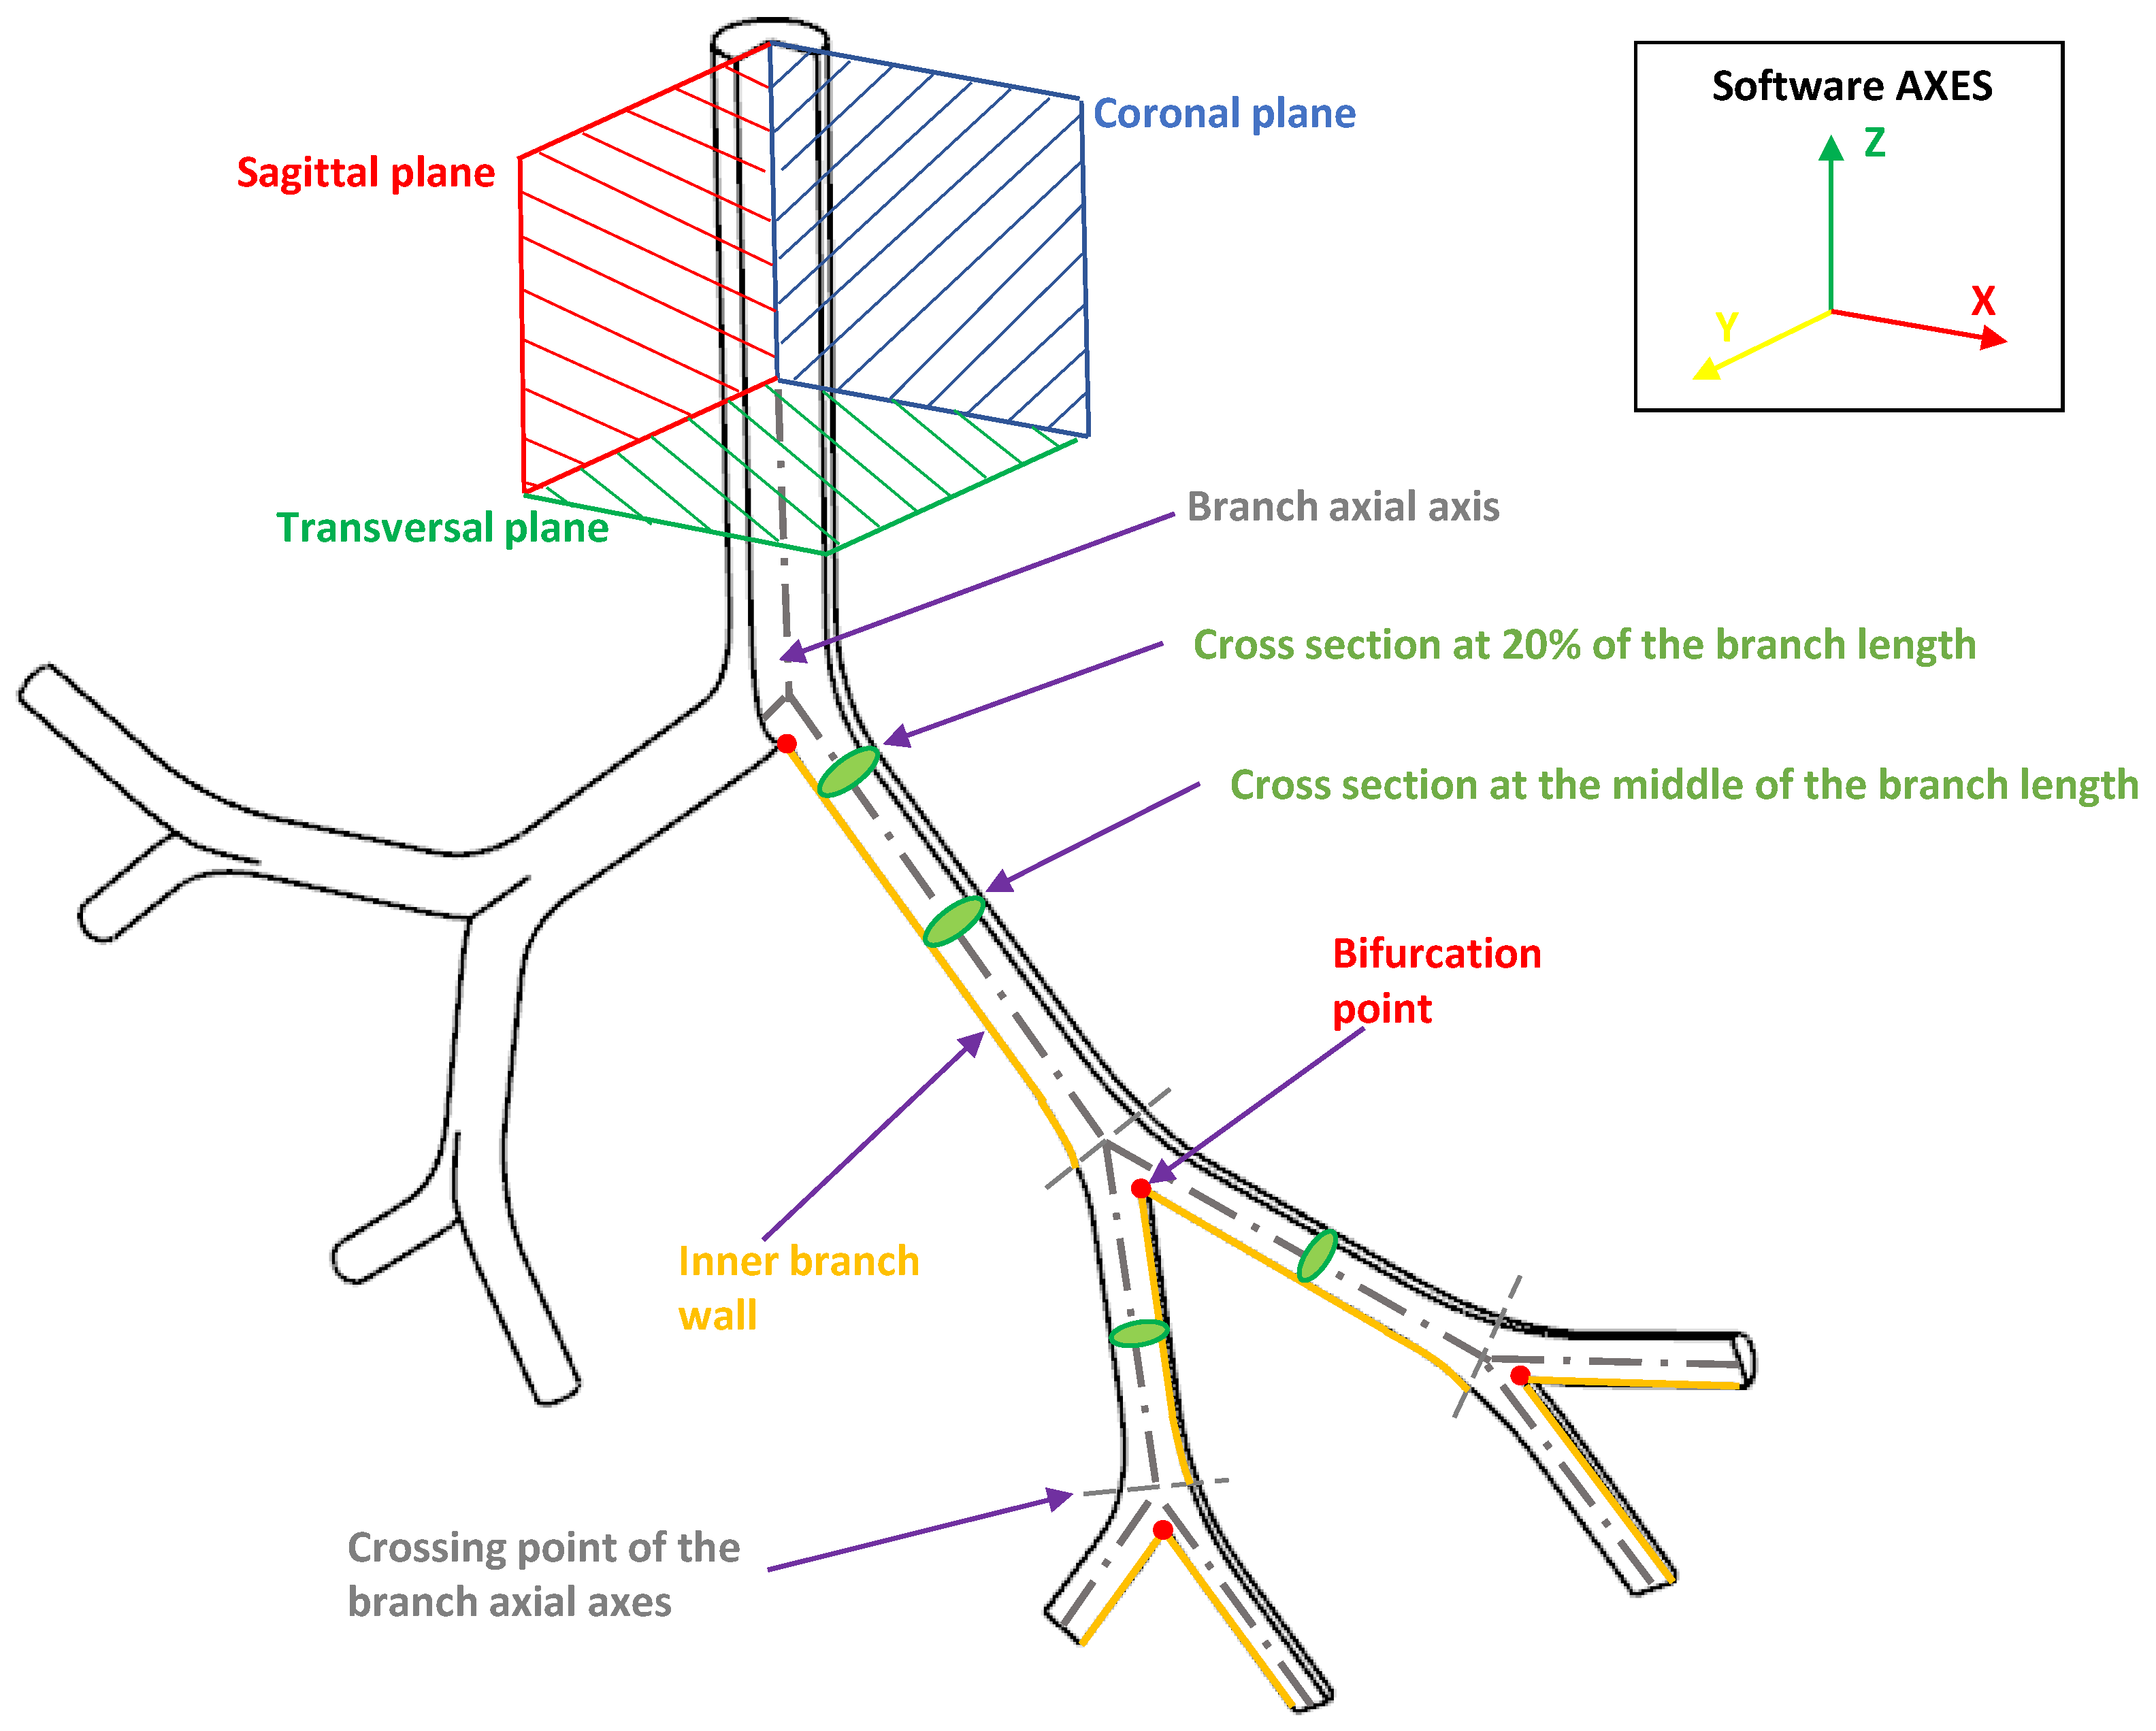
2.1. Bifurcation angle (BA). Morphological definition
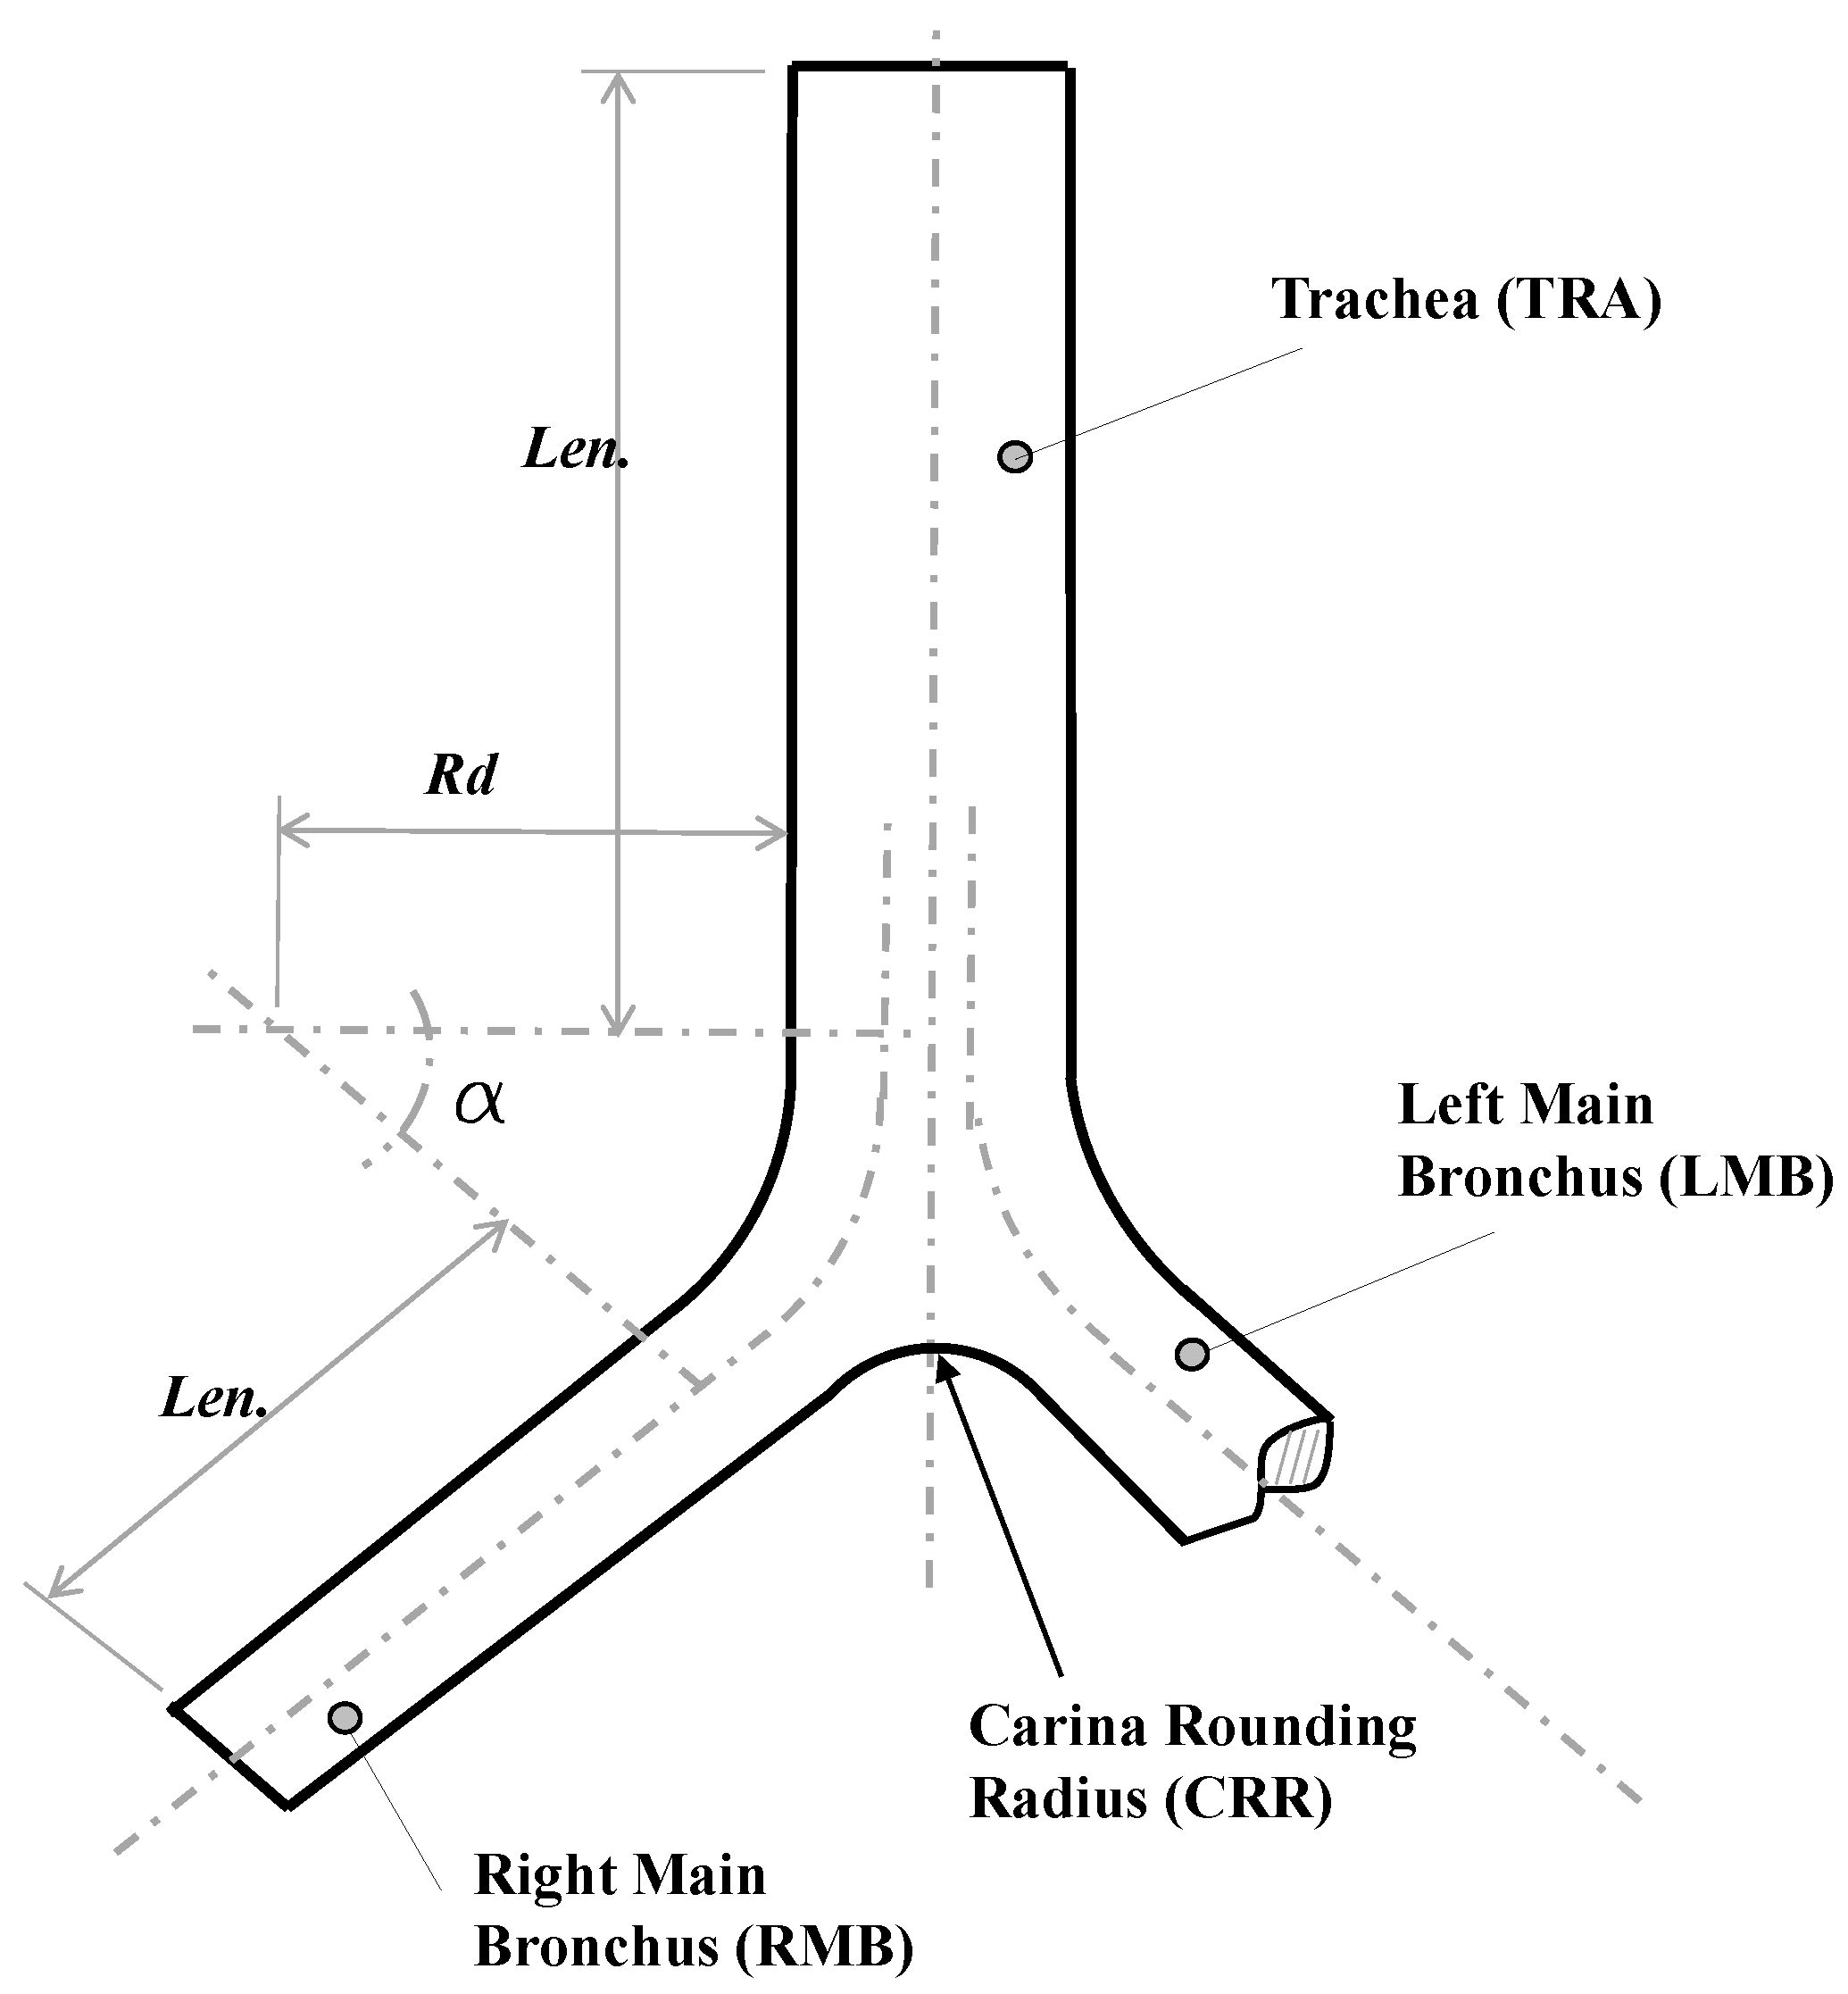
2.2. Carina rounding radius (CRR). Morphological definition
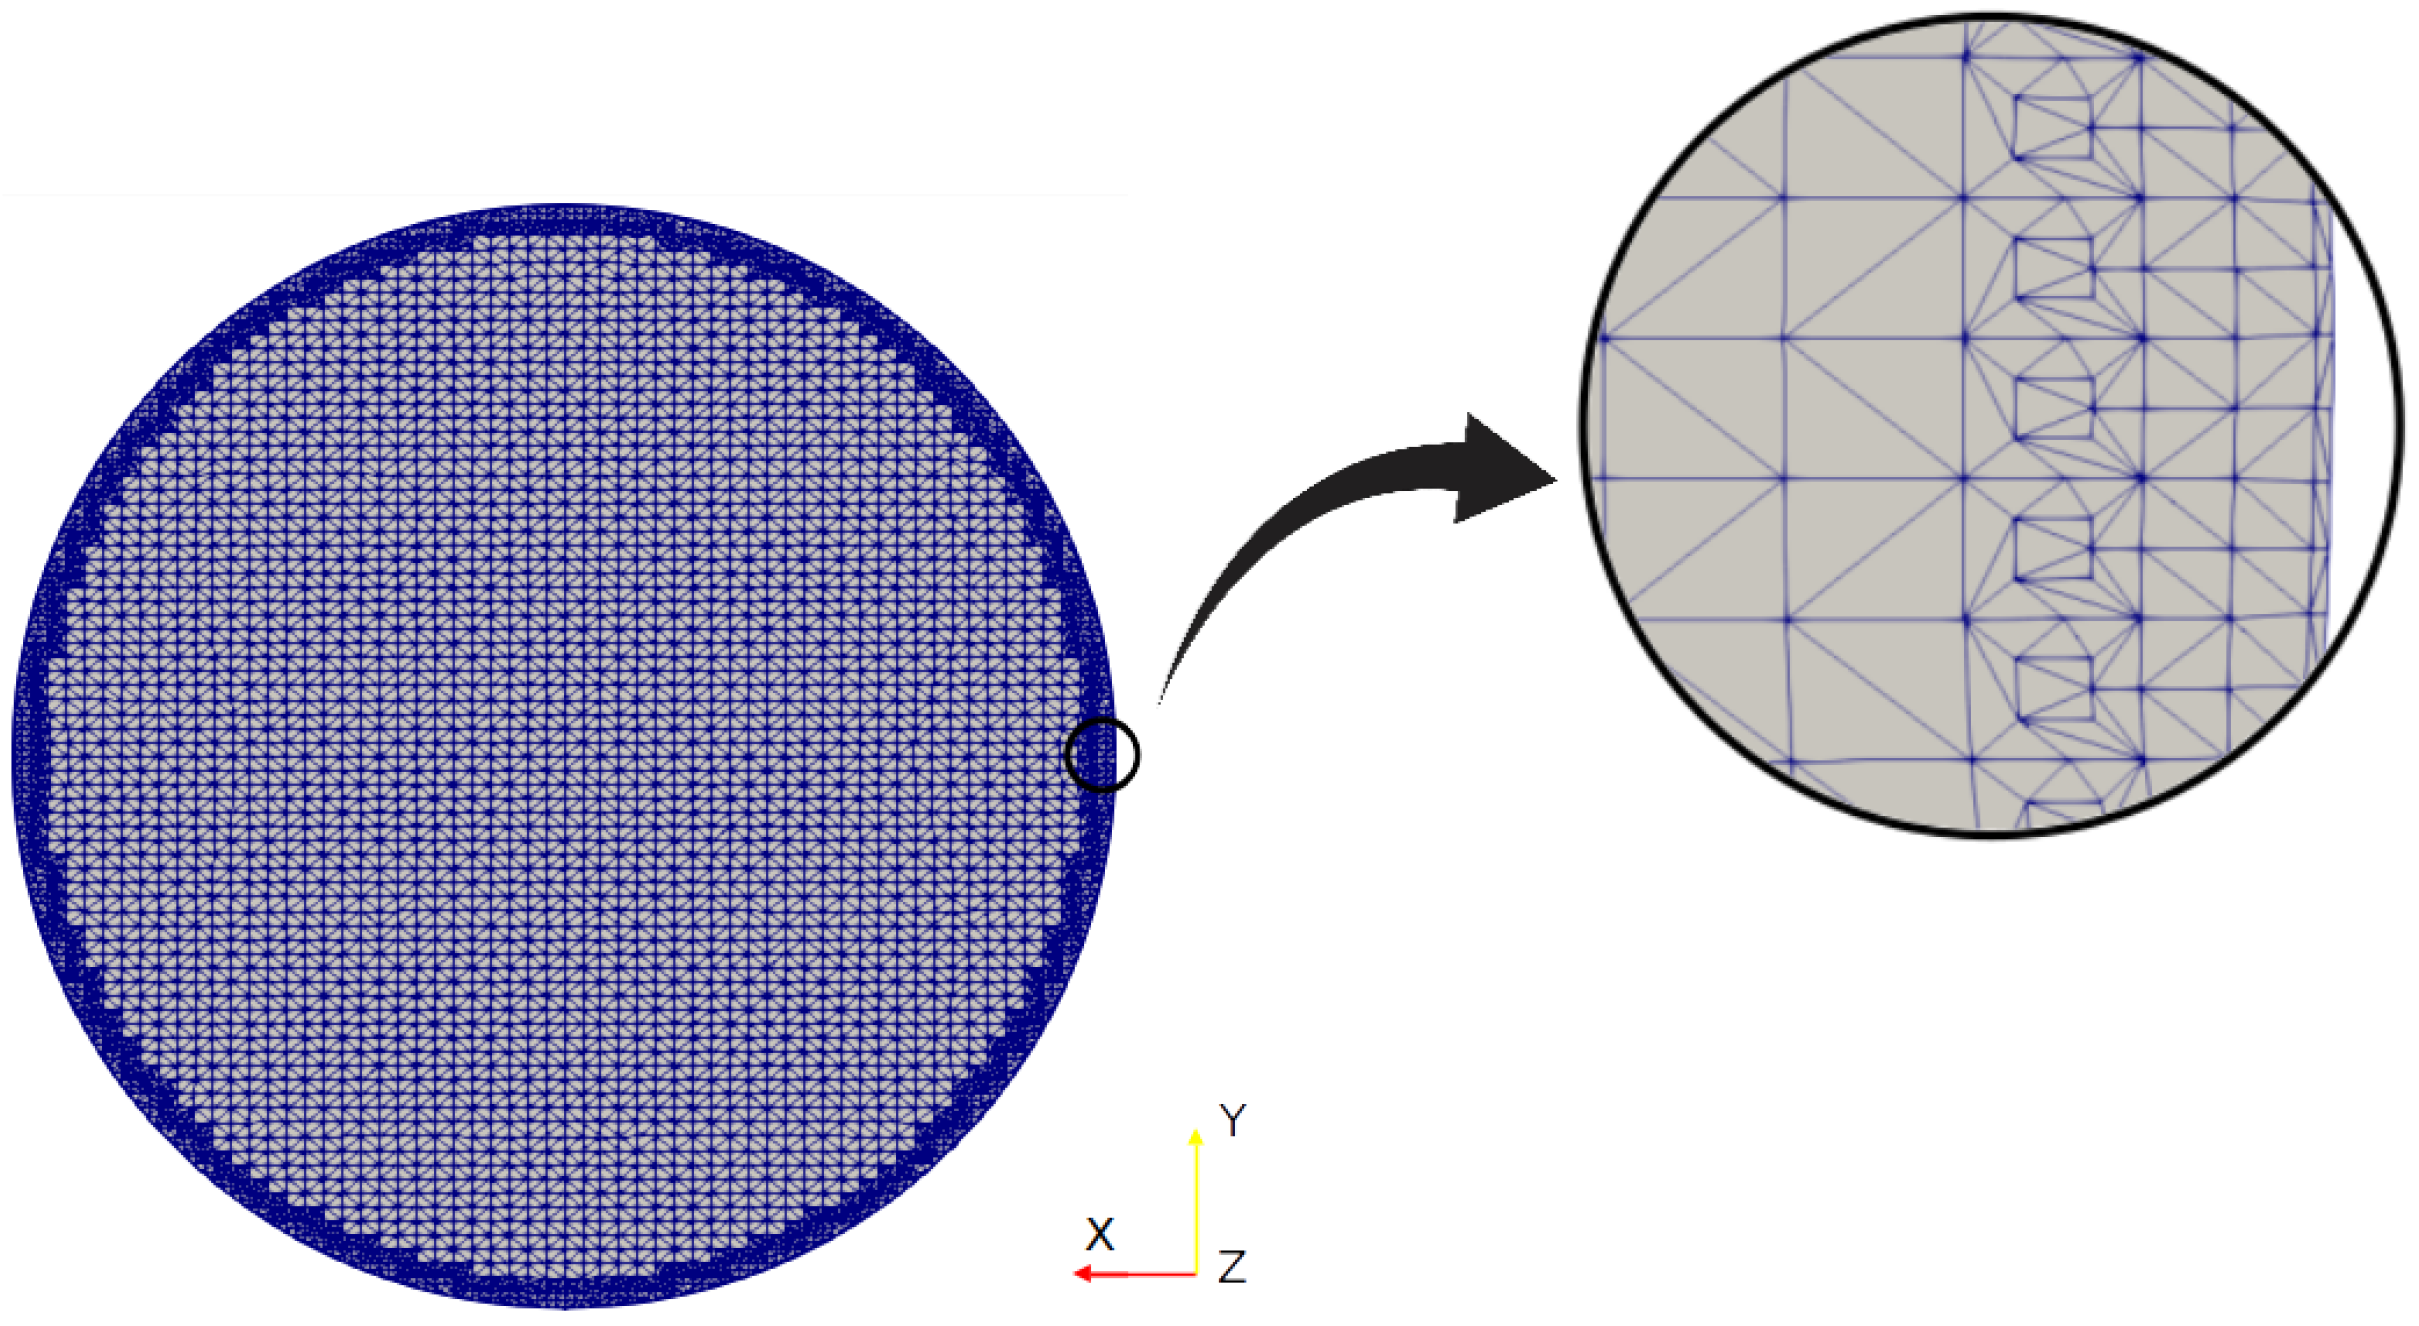
2.3. Governing equations and computational model.
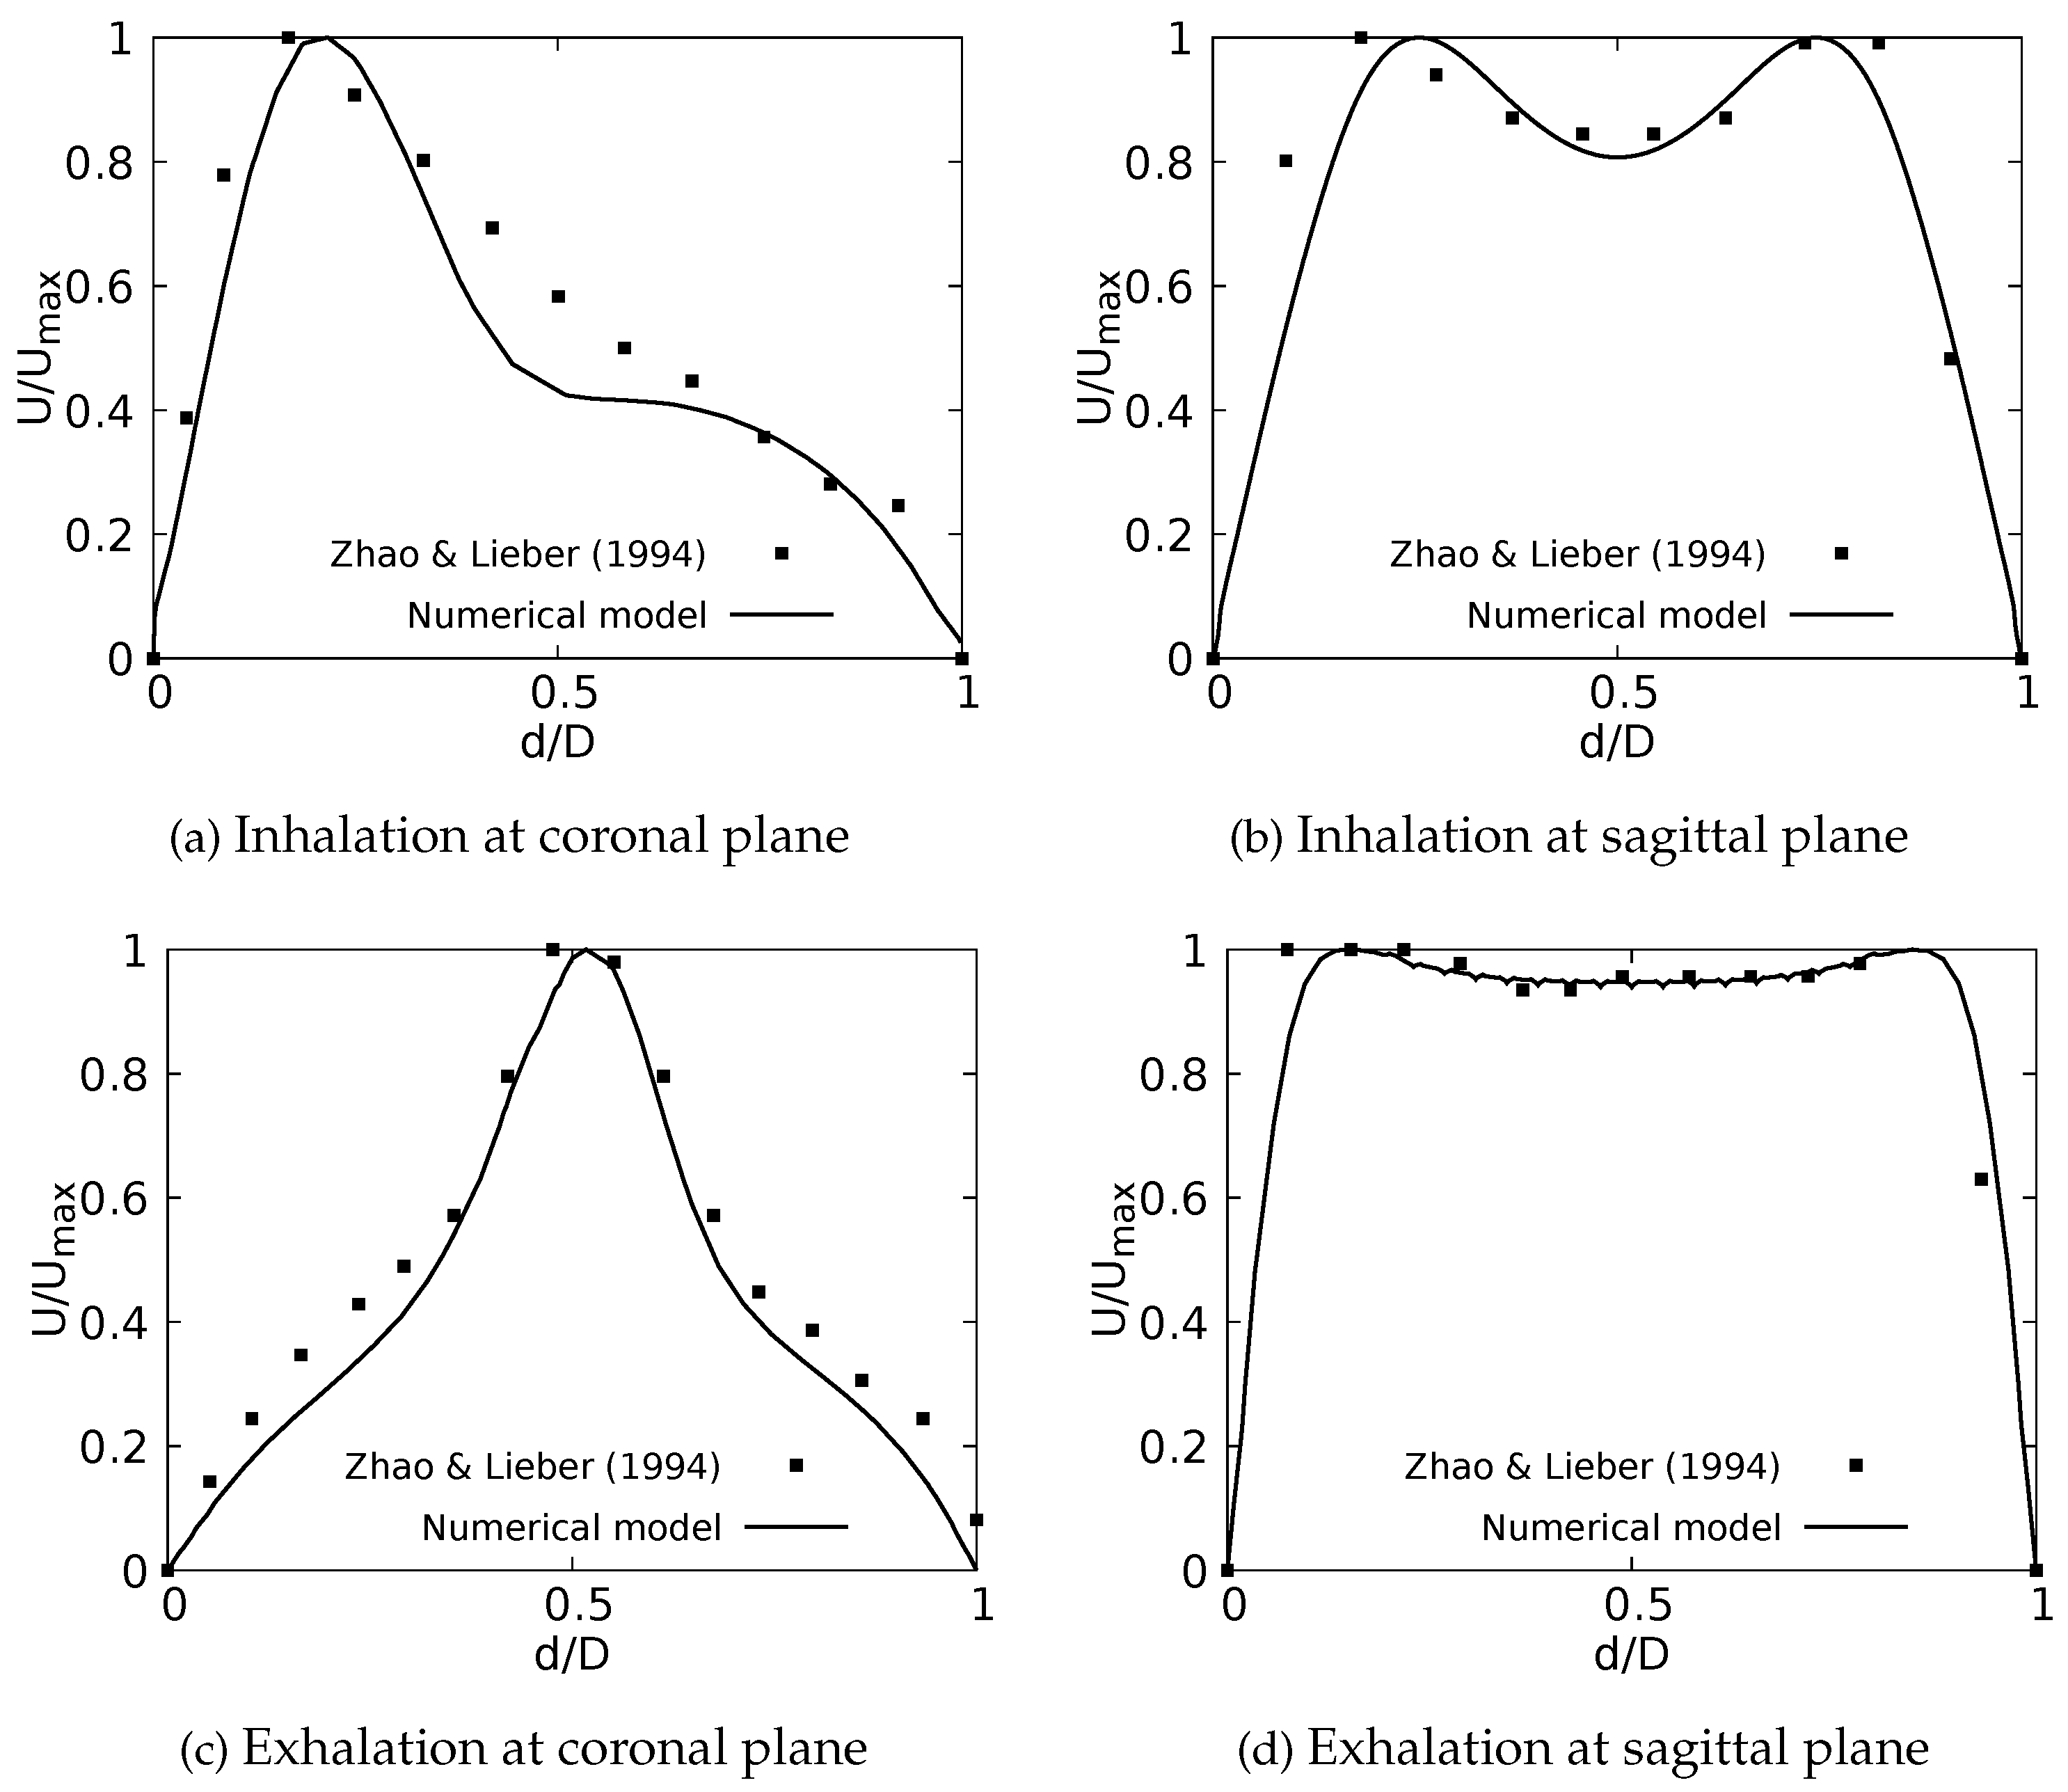
2.4. Validation of the numerical model.
3. Results I. Effect of variations of the bifurcation angle (BA)
3.1. Velocity Profiles
3.2. Flow patterns
3.3. Pressure behaviour
3.4. Wall Shear Stresses
4. Results II. Effect of variations of the carina rounding radius (CRR)
4.1. Velocity profiles
4.2. Flow patterns
4.3. Pressure behaviour
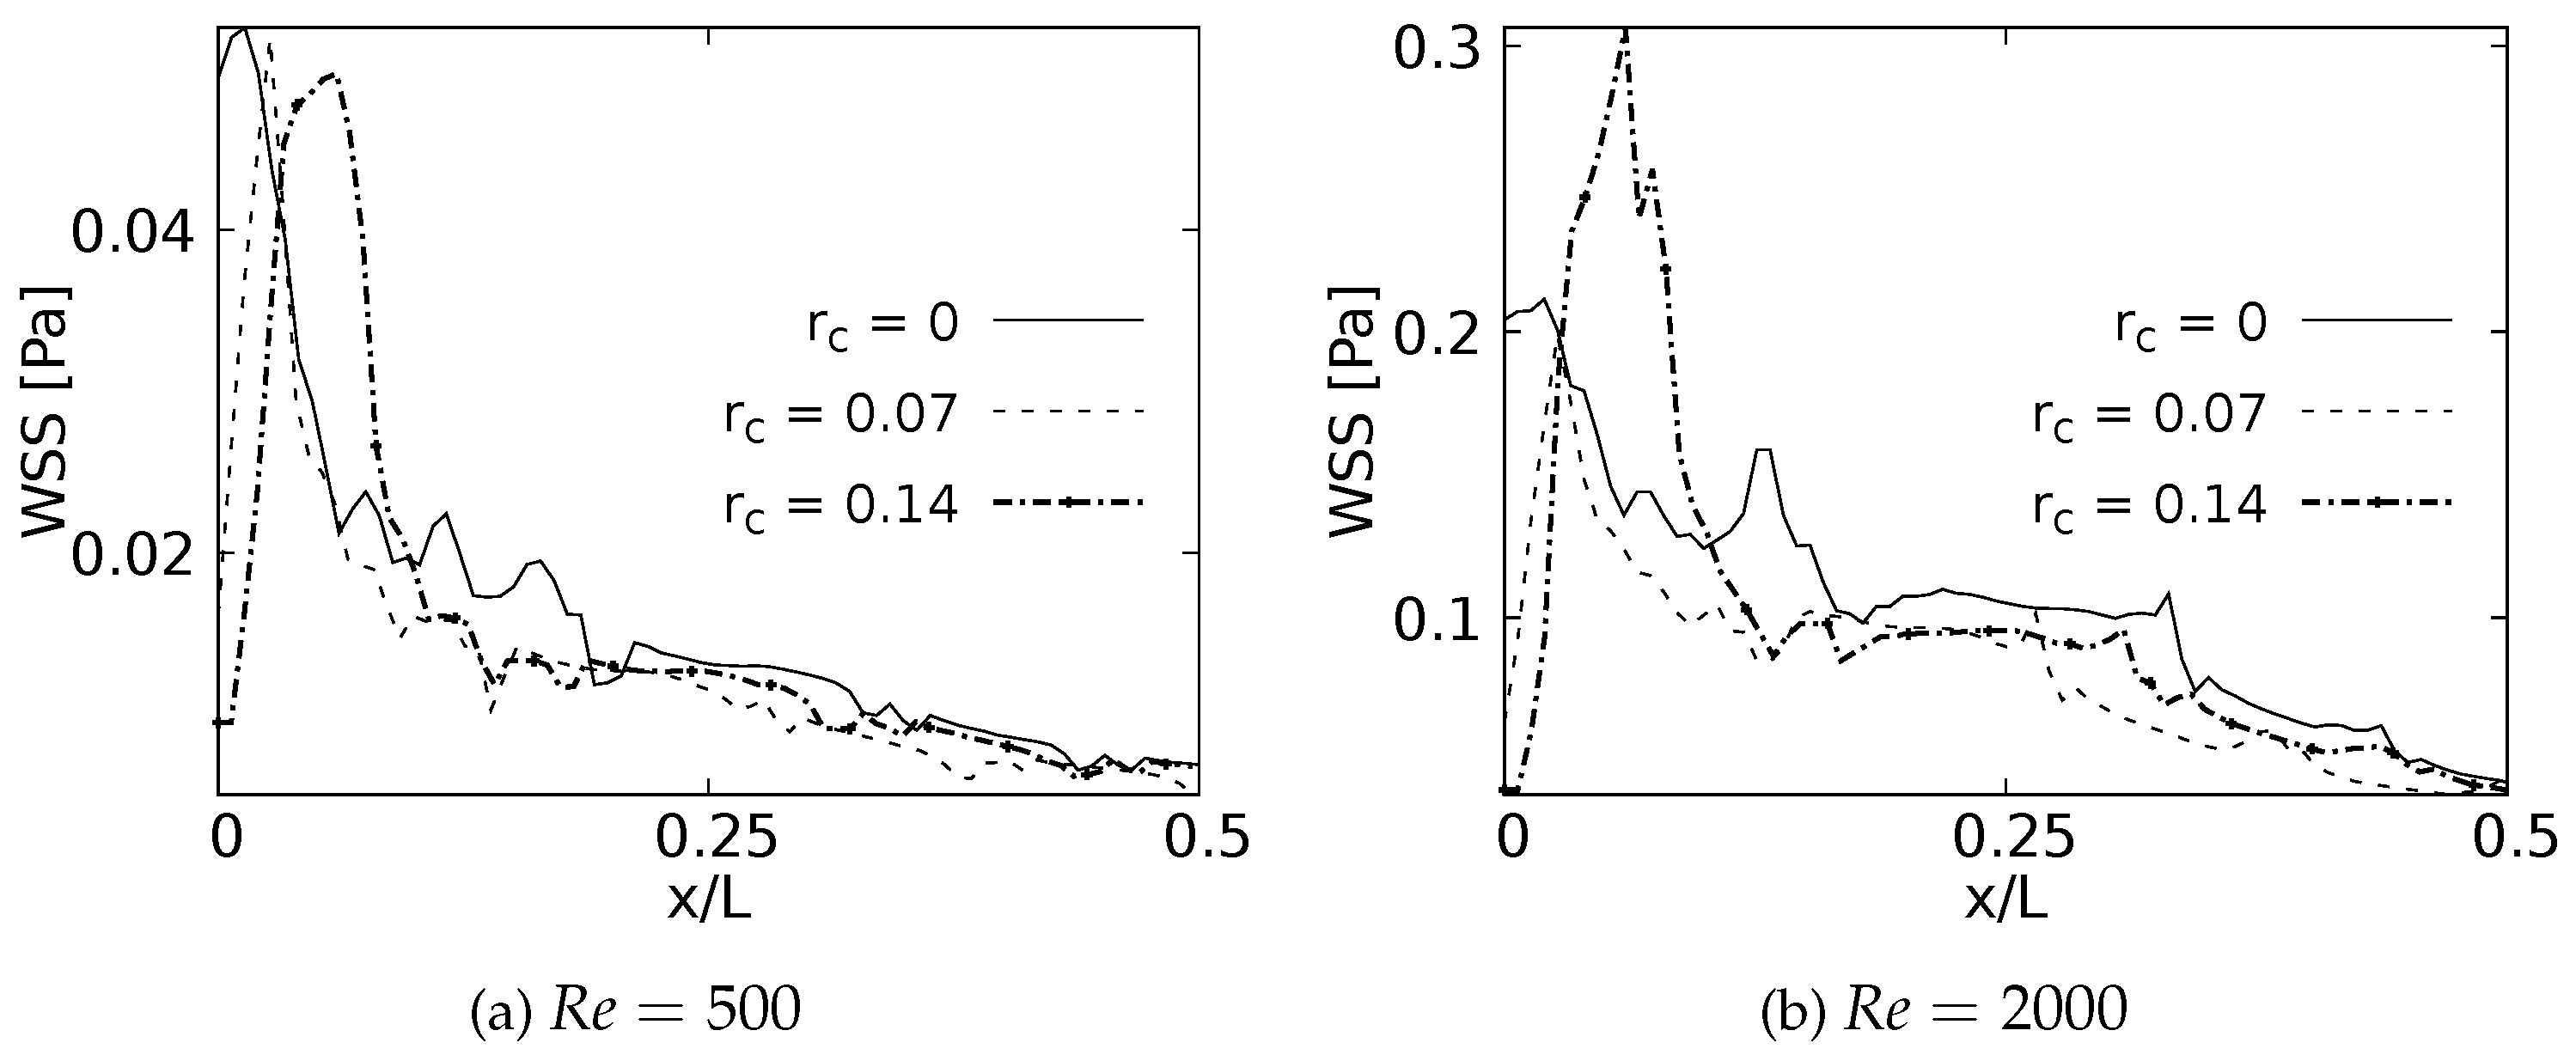
4.4. Wall Shear Stresses
5. Discussion and Conclusions
Author Contributions
Funding
Institutional Review Board Statement
Informed Consent Statement
Data Availability Statement
Acknowledgments
Conflicts of Interest
Nomenclature and Abbreviations
Nomenclature
| D | Branch diameter [] |
| R | Branch radius [] |
| L | Branch length [] |
| Dimensionless rounding radius | |
| y | Grid length in the normal direction of the wall [m] |
| U | Inlet velocity []] |
| Maximun velocity [] | |
| Average velocity [] | |
| Friction velocity [] | |
| p | Fluid pressure [] |
| Reynolds number | |
| fluid density [] | |
| kinematic viscosity [] | |
| Dynamic viscosity [] |
Abbreviations
| CFD | Computational Fluids Dynamics |
| WSS | Wall Shear Stress |
| BA | Bifurcation angle |
| CRR | Carina rounding radius |
| TRA | Trachea |
| RMB | Right Main Bronchus |
| LMB | Left Main Bronchus |
| RUB | Right Upper Lobar Bronchus |
| LUB | Left Upper Lobar Bronchus |
| RIB | Right Intermediate Bronchus |
| LLB | Left Lower Lobar Bronchus |
References
- Adler, K. and Brücker, C. Dynamic flow in a realistic model of the upper human lung airways. Experiments in Fluids 2007, 43(2-3), 411.
- Alavi, S. M., Keats, T. E., & O’Brien, W. M. The angle of tracheal bifurcation: its normal mensuration. American Journal of Roentgenology 1970, 108(3), 546–549.
- Balashazy, I., Heistracher, T., & HOFMANN, W. (1996). Air flow and particle deposition patterns in bronchial airway bifurcations: the effect of different CFD models and bifurcation geometries. Journal of Aerosol Medicine 1996, 9(3), 287-301.
- Bauer, K. and Brücker, C.The influence of airway tree geometry and ventilation frequency on airflow distribution. Journal of biomechanical engineering 2015, 137(8) 081001.
- Bipinchandra, K., Waheed, A. R. A., Yadav, N., & Diwan, C. Study of sub carinal angle of human trachea by computerized tomography. International Journal of Anatomy and Researchy 2016, 4(3), 2828–2832.
- Calay, R., Kurujareon, J., & Holdø, A. E. Numerical simulation of respiratory flow patterns within human lung. Respiratory physiology & neurobiology 2002, 130(2), 201–221.
- Chen, J., Putman, C. E., Hedlund, L. W., Dahmash, N., & Roberts, L. Widening of the subcarinal angle by pericardial effusion. American Journal of Roentgenology 1982, 139(5) 883–887.
- Choi, S., Yoon, S., Jeon, J., Zou, C., Choi, J., Tawhai, M. H., & Lin, C. L. 1D network simulations for evaluating regional flow and pressure distributions in healthy and asthmatic human lungs. Journal of Applied Physiology 2019, 127(1), 122-133.
- Christou, S., Chatziathanasiou, T., Angeli, S., Koullapis, P., Stylianou, F., Sznitman, J. & Kassinos, S. C. Anatomical variability in the upper tracheobronchial tree: sex-based differences and implications for personalized inhalation therapies. Journal of Applied Physiology, 2021, 130(3), 678-707.
- Comer, J. K., Kleinstreuer, C., & Kim, C. S. Flow structures and particle deposition patterns in double-bifurcation airway models. Part 2. Aerosol transport and deposition. Journal of Fluid Mechanics 2001, 435, 55-80.
- Corieri, P. Experimental and numerical investigation of flows in bifurcations within lung airways. Doctoral dissertation, Ph. D. thesis, von Karman Institute for Fluid Dynamics, Université Libre de Bruxelles and Rheinisch-Westfälische Technische Hochschule Aachen, 1994.
- Dean, W. R. Note on the motion of fluid in a curved pipe. The London, Edinburgh, and Dublin Philosophical Magazine and Journal of Science 1927, 4(20), 208–223. [Google Scholar] [CrossRef]
- Duque-Daza, C. A., Ramirez-Pastran, J., & Lain, S. Influence of particle mass fraction over the turbulent behaviour of an incompressible particle-laden flow. Fluids 2020, 6(11), 374.
- Faizal, W. M., Ghazali, N. N. N., Khor, C. Y., Badruddin, I. A., Zainon, M. Z., Yazid, A. A., & Razi, R. M. Computational fluid dynamics modelling of human upper airway: A review. Computer methods and programs in biomedicine 2020, 196, 105627.
- Fresconi, F. E. & Prasad, A. K. Secondary velocity fields in the conducting airways of the human lung. Journal of biomechanical engineering 2007, 129(5), 722–732.
- Green, A. S. Modelling of peak-flow wall shear stress in major airways of the lung. Journal of Biomechanics, 2004; 37, 661–667. [Google Scholar]
- Han, F., Liu, Y., Lan, Q., Li, W., & Wang, Z. CFD investigation on secondary flow characteristics in double-curved subsea pipelines with different spatial structures. Journal of Marine Science and Engineering 2022, 10(9), 1264.
- Hariprasad, D. S., Sul, B., Liu, C., Kiger, K. T., Altes, T., Ruppert, K., & Wallqvist, A. Obstructions in the lower airways lead to altered airflow patterns in the central airway. Respiratory Physiology & Neurobiology 2020, 272, 103311.
- Haskin, P. H. & Goodman, L. Normal tracheal bifurcation angle: a reassessment. American Journal of Roentgenology 1982, 139(5), 879–882.
- Hassani, K., & Khorramymehr, S. In silico investigation of sneezing in a full real human upper airway using computational fluid dynamics method. Computer methods and programs in biomedicine 2019, 177, 203–209.
- Hofmann, W. (2011). Modelling inhaled particle deposition in the human lung: a review. Journal of Aerosol Science 2011, 42(10), 693–724.
- Horsfield, K. and Cumming, G. Angles of branching and diameters of branches in the human bronchial tree. The Bulletin of mathematical biophysics 1967, 29(2), 245–259. [CrossRef] [PubMed]
- Horsfield, K., Dart, G., Olson, D. E., Filley, G. F.and Cumming, G. Models of the human bronchial tree. Journal of applied physiology 1971, 31, 207–217.
- Islam, M. S., Paul, G., Ong, H. X., Young, P. M., Gu, Y. T., & Saha, S. C. A review of respiratory anatomical development, air flow characterization and particle deposition. International journal of environmental research and public health 2020, 17(2), 380.
- Kadota, K., Matsumoto, K., Uchiyama, H., Tobita, S., Maeda, M., Maki, D., & Tozuka, Y. In silico evaluation of particle transport and deposition in the airways of individual patients with chronic obstructive pulmonary disease. European Journal of Pharmaceutics and Biopharmaceutics 2022, 174, 10–19.
- Kim, Y., Tong, Z., Chan, H., & Yang, R. CFD modelling of air and particle flows in different airway models. Journal of Aerosol Science 2019, 134, 14–28.
- Koombua, K., Pidaparti, R. M., Longest, P. W., & Ward, K. R. Computational analysis of fluid characteristics in rigid and flexible human respiratory airway models. Engineering Applications of Computational Fluid Mechanics 2008, 2(2), 185–194.
- Lai, T. C., Morsi, Y. S., Das, S., & Owida, A. Numerical analysis of particle deposition in asymmetrical human upper airways under different inhalation cycles. Journal of Mechanics in Medicine and Biology 2013, 13(04), 1350068.
- Lee, D., Park, S. S., Ban-Weiss, G. A., Fanucchi, M. V., Plopper, C. G. & Wexler, A. S. Bifurcation model for characterization of pulmonary architecture. The Anatomical Record 2008, 291(4), 379–389.
- Lin, C., Lee, J.-H., & Hsieh, C.-M. The correlation between subcarinal angle and left atrial volume. Acta Cardiologica Sinica 2012, 28(4), 332–336.
- Liu, Y., So, R., & Zhang, C. Modeling the bifurcating flow in a human lung airway. Journal of biomechanics 2002, 35(4), 465–473.
- Martonen, T., Yang, Y., & Xue, Z. Effects of carinal ridge shapes on lung airstreams. Aerosol science and technology 1994, 21(2), 119–136.
- Mason, E. C., Wu, Z., McGhee, S., Markley, J., Koenigs, M., Onwuka, A., & Zhao, K. Computational fluid dynamic modeling reveals nonlinear airway stress during trachea development. The Journal of Pediatrics 2021, 238, 324–328.
- Minnich, D. J., & Mathisen, D. J. Anatomy of the trachea, carina, and bronchi. Thoracic surgery clinics 2007, 17.4, 571–585.
- Morita, K., Takeishi, N., Wada, S., & Hatakeyama, T. Computational fluid dynamics assessment of congenital tracheal stenosis. Pediatric Surgery International 2022, 38(12), 1769–1776.
- Murray, J., Brown, A., Anagnostou, E., and Senior, R. Widening of the tracheal bifurcation on chest radiographs: value as a sign of left atrial enlargement. AJR. American journal of roentgenology 1995, 164(5), 1089–1092.
- Nucci, Gianluca; SUKI, Béla; Lutchen, Kenneth. Modeling airflow-related shear stress during heterogeneous constriction and mechanical ventilation. Journal of Applied Physiology 2003, vol. 95, no 1, p. 348-356.
- Pedley, T., Schroter, R., and Sudlow, M. Energy losses and pressure drop in models of human airways. Respiration physiology, 1970; 9, 3, 371–386.
- Pedley, T., Schroter, R., and Sudlow, M. Flow and pressure drop in systems of repeatedly branching tubes. Flow and pressure drop in systems of repeatedly branching tubes. Journal of Fluid Mechanics 1971, 46(02), 365–383.
- Piemjaiswang, R., Shiratori, S., Chaiwatanarat, T., Piumsomboon, P., & Chalermsinsuwan, B. Computational fluid dynamics simulation of full breathing cycle for aerosol deposition in trachea: effect of breathing frequency. Journal of the Taiwan Institute of Chemical Engineers, 97, 66-79.
- Ren, S., Li, W., Wang, L., Shi, Y., Cai, M., Hao, L., & Luo, Z. Numerical analysis of airway mucus clearance effectiveness using assisted coughing techniques. Scientific reports 2020, 10(1), 1–10.
- Sahni, D., Batra, Y. K., & Rajeev, S. Anatomical dimensions of trachea, main bronchi, subcarinal and bronchial angles in fetuses measured ex vivo. Pediatric Anesthesia 2006 , 18(11), 1029–1034.
- Singhal, S., Henderson, R., Horsfield, K., Harding, K., & Cumming, G. Morphometry of the human pulmonary arterial tree. Circulation Research 1973, 33(2), 190–197.
- Schroter, R. and Sudlow, M. Flow patterns in models of the human bronchial airways. Respiration physiology 1969, 7(3), 341–355. [CrossRef]
- Tran, T. M., Huh, S., Kim, S., Cui, X., & Choi, S. Numerical investigation of the effect of tracheostomy on flow and particle transport characteristics in human airways. Physics of Fluids 2022, 34(12), 121901.
- Tsega, E. G., Katiyar, V. K., & Gupta, P. Numerical Simulation of Transport and Deposition of Dust Particles in Human Tracheobronchial Airways. International Journal of Biomedical Science and Engineering 2019, 7(1), 8.
- Wall, W. A., & Rabczuk, T. Fluid–structure interaction in lower airways of CT-based lung geometries. International Journal for Numerical Methods in Fluids 2008, 57(5), 653-675.
- Wang, Y., Liu, Y., Sun, X., Yu, S., & Gao, F. Numerical analysis of respiratory flow patterns within human upper airway. Acta Mechanica Sinica 2009, 25(6), 737-746.
- Wang, W., Dai, Z., Li, J., & Zhou, L. A hybrid Laplace transform finite analytic method for solving transport problems with large Peclet and Courant numbers. Computers & geosciences 2009, 49, 182–189.
- Wang, X.-Q., Mujumdar, A. S., & Yap, C. Effect of bifurcation angle in tree-shaped microchannel networks. Journal of Applied Physics 2007, 102(7), 073530.
- Weibel, E. R.; Cournand, A. F.; Richards, D. W. Morphometry of the human lung, 1st ed.; Springer Verlag OHG Berlin Goltigen Heidelberg: Berlin, Germany, 1963. [Google Scholar]
- West, J. B. Respiratory physiology: the essentials, 9th ed.; Lippincott Williams & Wilkins: United States, 2012. [Google Scholar]
- Liu, W., Sun, H., Lai, D., Xue, Y., Kabanshi, A., & Hu, S. Performance of fast fluid dynamics with a semi-Lagrangian scheme and an implicit upwind scheme in simulating indoor/outdoor airflow. Building and Environment 2022, 207, 108477.
- Van Ertbruggen, C., Hirsch, C., & Paiva, M. Anatomically based three-dimensional model of airways to simulate flow and particle transport using computational fluid dynamics. Journal of Applied Physiology 2005, 98(3), 970–980.
- Xia, G., Tawhai, M. H., Hoffman, E. A., & Lin, C.-L. Airway wall stiffening increases peak wall shear stress: a fluid-structure interaction study in rigid and compliant airways. Annals of biomedical engineering 2010, 38(5), 1836–1853.
- Xu, X., Wu, J., Weng, W., & Fu, M. Investigation of inhalation and exhalation flow pattern in a realistic human upper airway model by PIV experiments and CFD simulations. Biomechanics and modeling in mechanobiology 2020, 19(5), 1679–1695.
- Yang, X., Liu, Y., So, R., & Yang, J. (2006). The effect of inlet velocity profile on the bifurcation COPD airway flow. Computers in biology and medicine 2006, 36(2), 181–194.
- Yu, G., Zhang, Z., & Lessmann, R. Computer simulation of the flow field and particle deposition by diffusion in a 3-D human airway bifurcation. Aerosol Science and Technology 1996, 25(3), 338-352.
- Zhang, W., Xiang, Y., Lu, C., Ou, C., & Deng, Q. Numerical modeling of particle deposition in the conducting airways of asthmatic children. Medical Engineering & Physics 2020, 76, 40-46.
- Zhang, Z., Kleinstreuer, C., & Kim, C. S. Effects of curved inlet tubes on air flow and particle deposition in bifurcating lung models. Journal of Biomechanics 2001, 34(5), 659-669.
- Zhao, Y. and Lieber, B. B. Steady inspiratory flow in a model symmetric bifurcation. Transactions of the ASME-K-Journal of Biomechanical Engineering 1994, 116(4), 488–496.
- Zhao, Y., & Lieber, B. B. Steady expiratory flow in a model symmetric bifurcation. (1994).
- Zobaer, T., & Sutradhar, A. Modeling the effect of tumor compression on airflow dynamics in trachea using contact simulation and CFD analysis. Computers in Biology and Medicine 2021, 135, 104574.


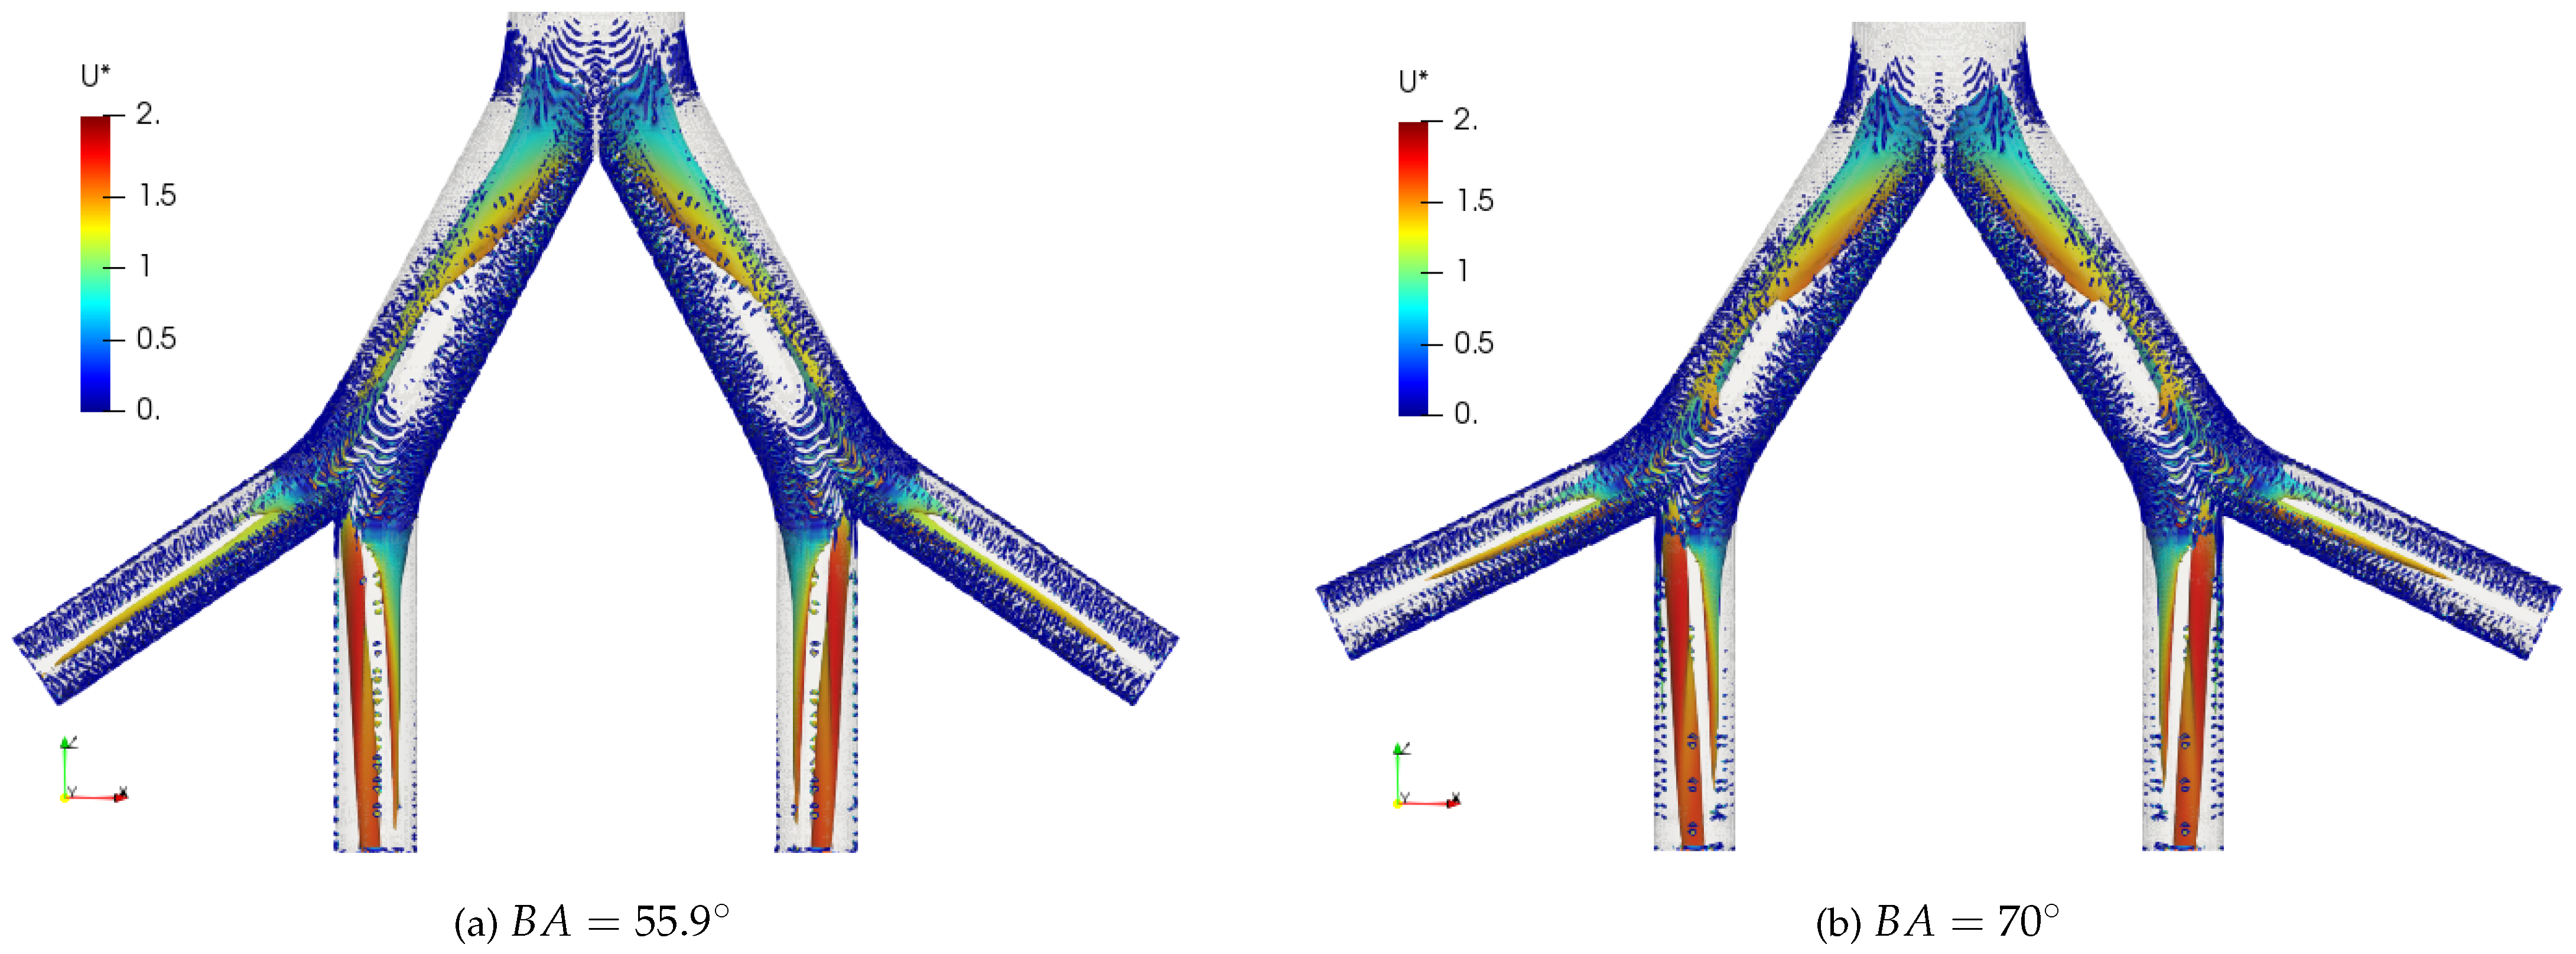
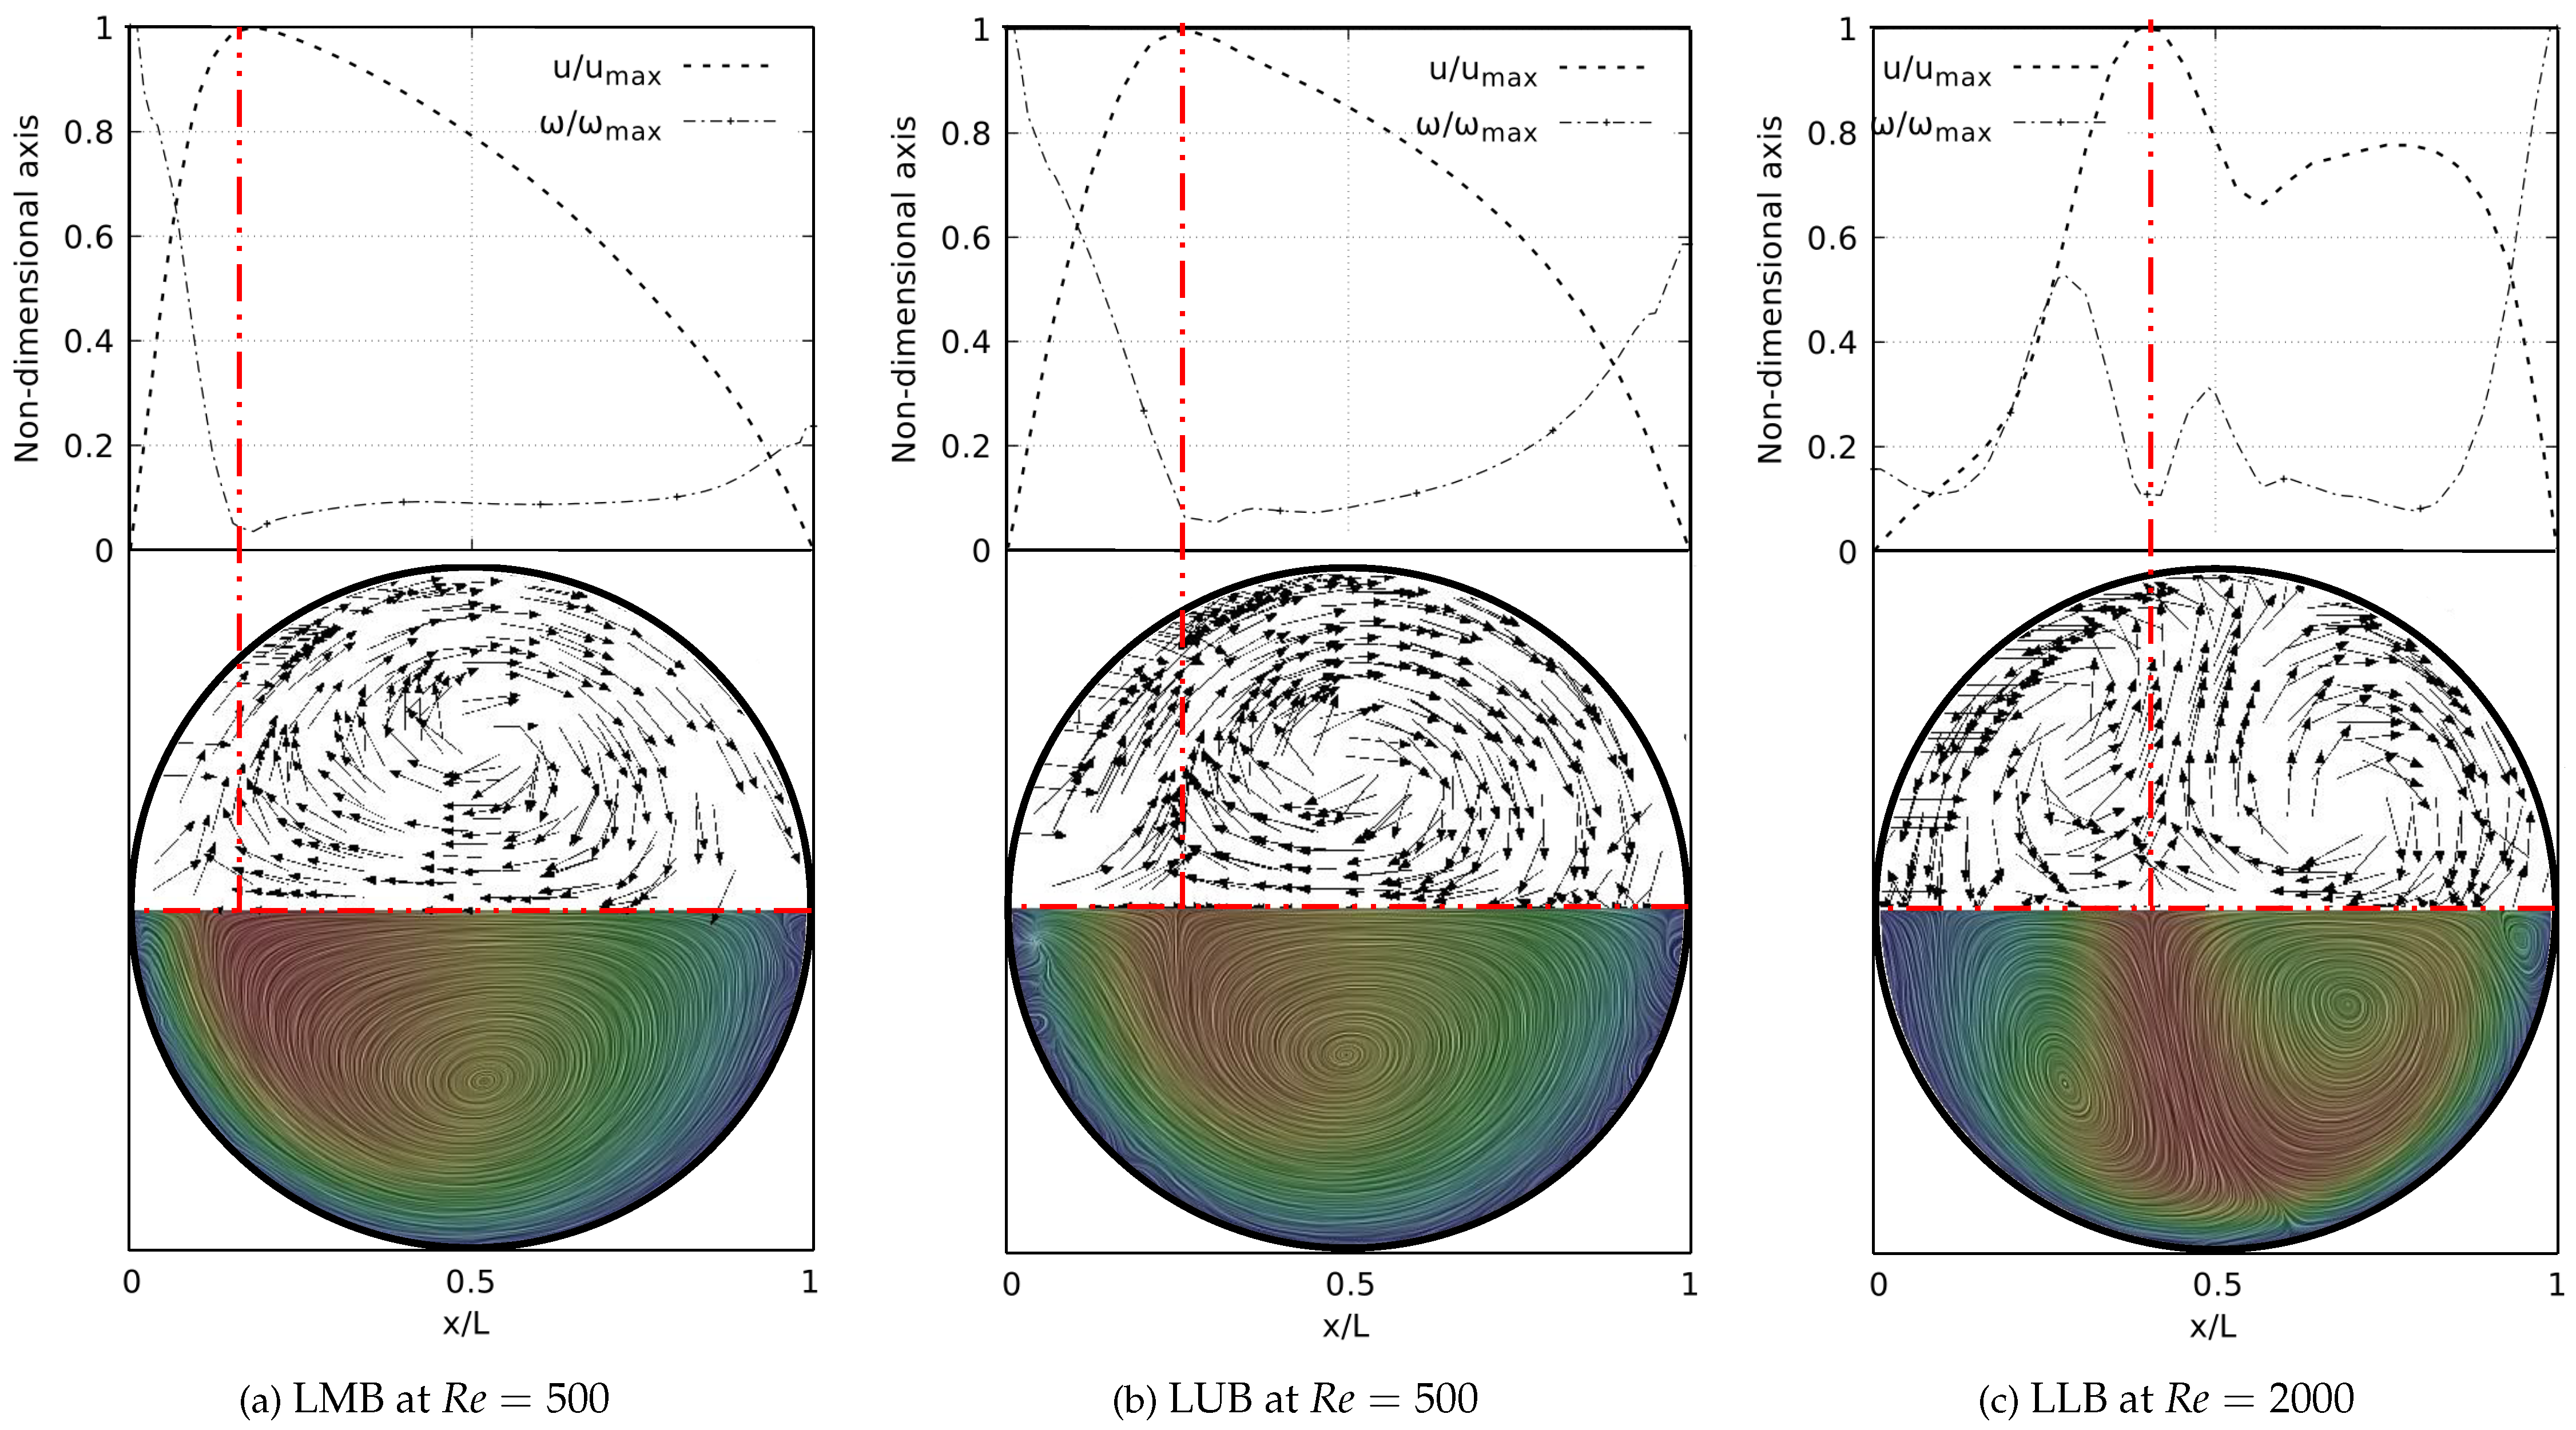
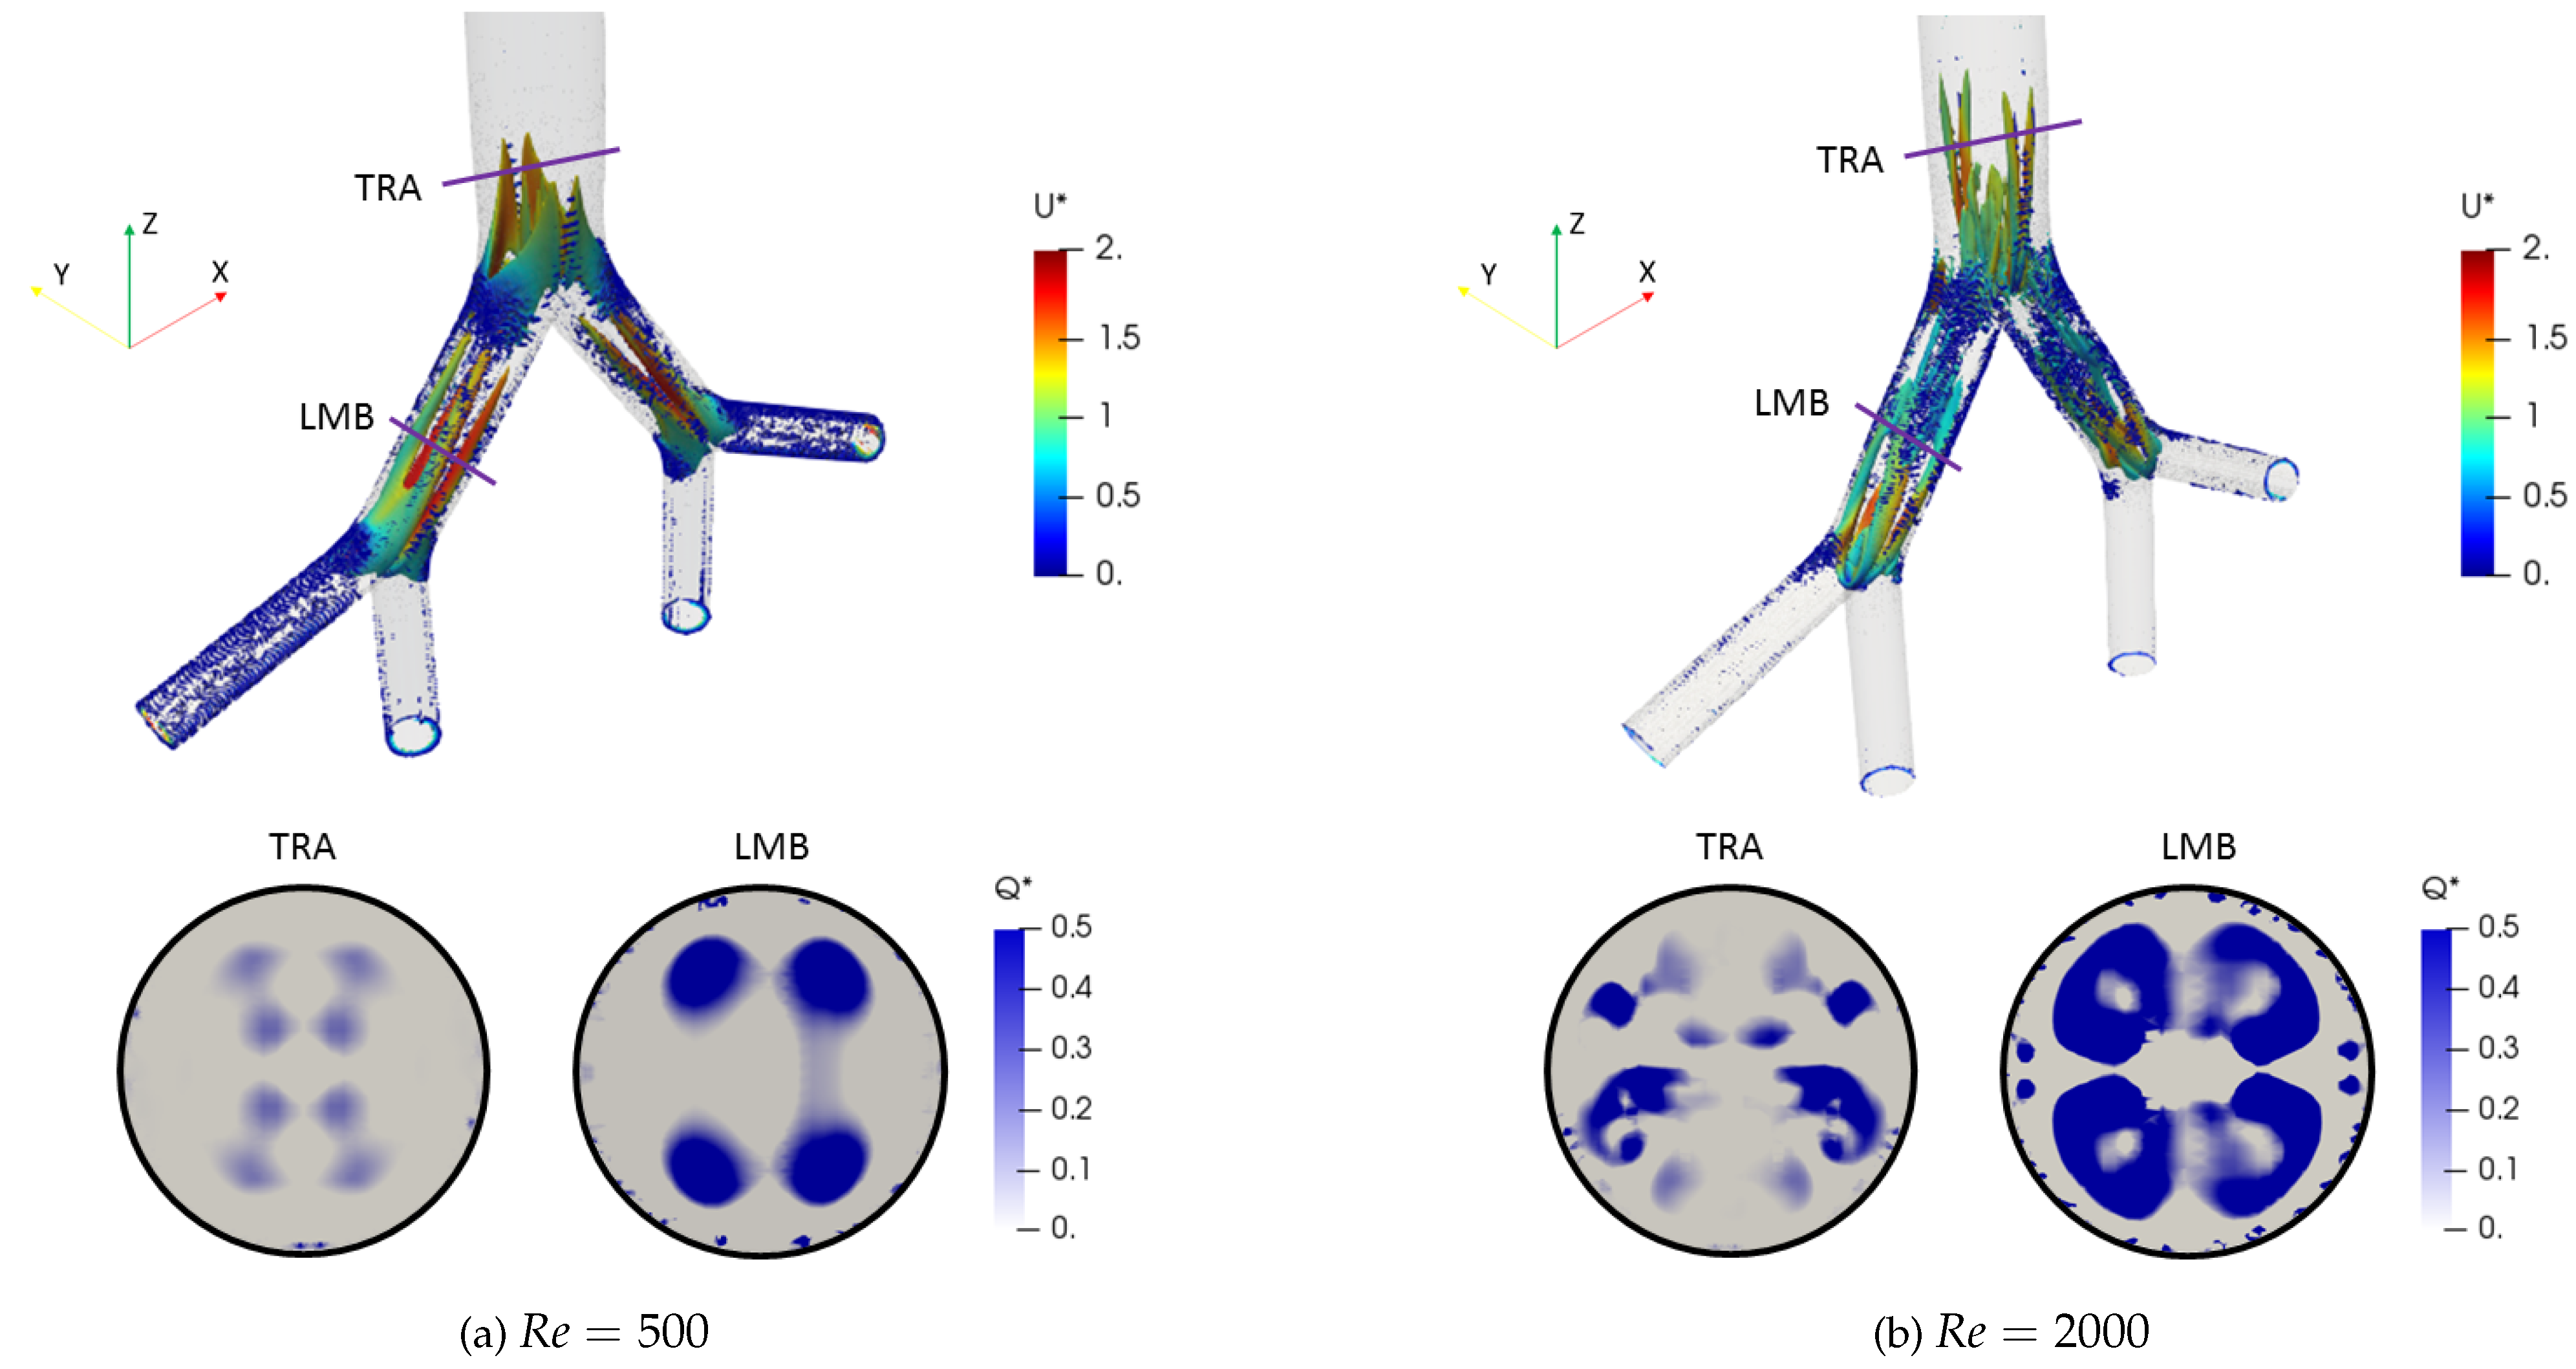
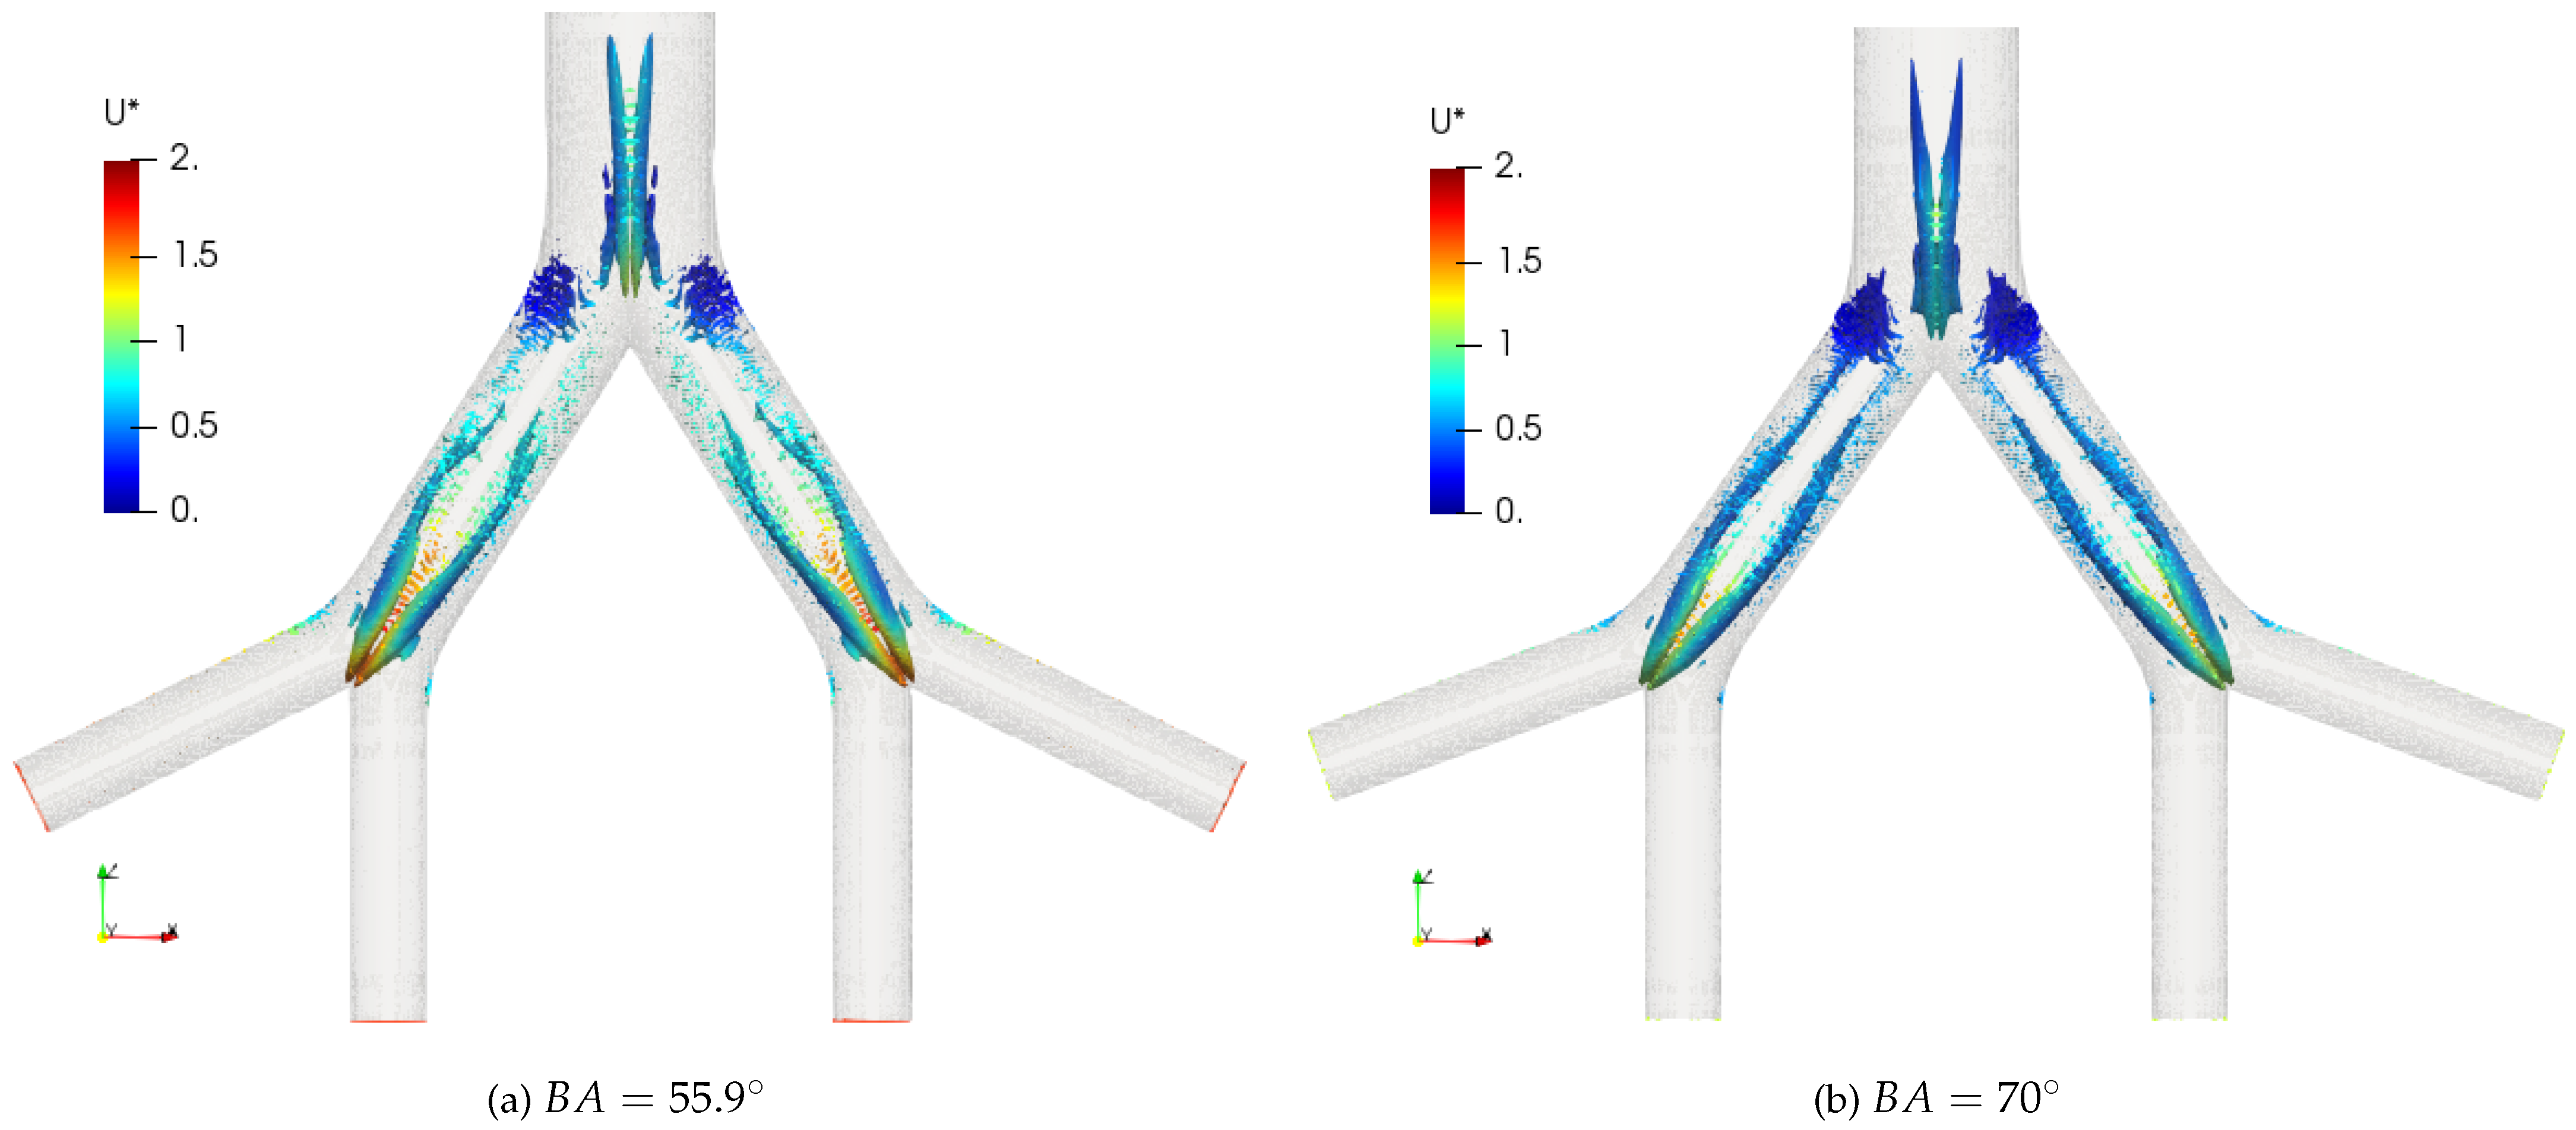


| AIRWAY | D (mm) | L (mm) |
|---|---|---|
| TRA | 18 | 120 |
| LMB / RMB | 12 | 47.6 |
| LUB / RUB / LLB / RIB | 8.3 | 41.5 |
| AGE [YEARS] | ANGLE [°] |
|---|---|
| 21 - 30 | 64.2 |
| 31 - 40 | 58.9 |
| 41 - 50 | 61.9 |
| 51 - 60 | 63.1 |
| 61 - + | 55.9 |
| All ages | 60.8 |
| Branch | D (mm) | Len. (mm) | (°) | Rd (mm) |
|---|---|---|---|---|
| TRA | 16 | 80 | 35 | 81.5 |
| LMB / RMB | 14 | 70 |
Disclaimer/Publisher’s Note: The statements, opinions and data contained in all publications are solely those of the individual author(s) and contributor(s) and not of MDPI and/or the editor(s). MDPI and/or the editor(s) disclaim responsibility for any injury to people or property resulting from any ideas, methods, instructions or products referred to in the content. |
© 2023 by the authors. Licensee MDPI, Basel, Switzerland. This article is an open access article distributed under the terms and conditions of the Creative Commons Attribution (CC BY) license (http://creativecommons.org/licenses/by/4.0/).


