1. Introduction
The coronary artery is one of the essential blood arteries that ensure the heart receives a steady blood flow. The heart muscle (myocardium) receives oxygenated blood via the coronary arteries; when these are clogged or obstructed, the myocardium starts to deteriorate, a condition known as ischemia. The most significant cause of death worldwide is coronary artery disease (CAD), also known as ischemic heart disease. According to a report by the World Health Organization, CAD causes nearly 50% of disease-related death in Kazakhstan [
1]. An American will experience a coronary episode roughly every 25 seconds; statistically, the pass-away rate is approximately every minute [
2].
Coronary angiography may offer information on anatomical stenosis, the gold standard for diagnosing coronary heart disease. Evaluations of fractional flow reserve (FFR) from CT in Europe and the United States suggest that it has the potential to decrease false diagnoses before patients are referred for invasive testing [
3].
Coronary artery computerized tomography (CT) imaging is preferred over coronary angiography for pre-screening asymptomatic individuals. Due to its noninvasive nature, ease of use, cheap cost, and excellent repeatability. Since FFR from CT is based on high-quality coronary artery CT angiography (CTA) image data, it doesn't need extra load, scanning, or dosage. Although there is a grey area that necessitates additional functional measures for diagnosis, the diagnostic accuracy and specificity are greater than those of coronary artery CT imaging. The quantitative coronary artery CT imaging index may objectively identify functional coronary stenosis [
4].
Compared to angiography alone, FFR is one of the few diagnostic tools that can effectively lead therapeutic approaches, improve safety and efficacy, and reduce costs. The angio-FFR, a noninvasive estimate of FFR generated from computed tomography coronary angiography, employs specialized software to model the 3-dimensional coronary blood flow. The DISCOVER-FLOW research revealed an 84.3 percent diagnosis accuracy for lesions contextually assessed using FFR. Similarly, the HEARTFLOW-NXT research found an 86 percent per-vessel diagnosis accuracy [
5].
As an optional tool for hemodynamic evaluation in patients with single-vessel CAD, the excellent diagnostic accuracy of SPECT CFR for diagnosing functionally significant stenosis justifies its usage. SPECT CFR was supported by superior diagnostic accuracy for identifying functionally significant stenosis. An aberrant CFR may suggest microvascular dysfunction in individuals whose FFR and CFR differ, which needs more research [
6].
The CT scans may be used to construct three-dimensional (3D) solid models that can be seen on display, printed on film or by a 3D printer, or used by a Computational Fluid Dynamics (CFD) approach that enables doctors to quantify the coronary physiology inside the artery. Current CFD programs that have undergone clinical examination in significant clinical investigations include Discover Flow, HeartFlow - NXT, and other Platforms for the physiologic study of coronary artery function [
7]. Additionally, using CFD to estimate FFR has been offered as a potential noninvasive alternative to Fractional Flow Reserve Invasive Coronary Angiography measurement [
8].
Consequently, computational analysis of FFR utilizing CCTA imaging data enables noninvasive lesion-specific decline assessment. This anatomical and functional assessment may identify people with lesion-causing coronary pressure decreases. This noninvasive approach may be superior to invasive ICA with FFR for patient treatment. We need more information on incorporating the new strategy into “real-world” clinical practice to influence future patient care decisions [
9].
Instead of simulating maximum hyperemia, boundary conditions are specified to create a pressure-flow curve for stenosis. Then, stenosis is functionally diagnosed using pressure-flow curve characteristics. The suggested strategy is verified with invasive FFR in six individuals using idealized and patient-specific models. According to the results, stenosis flow resistances cannot be directly acquired from anatomy. Simulated pressure-flow parameters correlate linearly and significantly with invasive FFR. The suggested technique may estimate flow resistances using pressure flow from curve-derived parameters. Furthermore, flow resistances can be assessed without modeling maximum hyperemia [
10].
However, since a cardiac tree often includes multiple capillary branches connecting with downstream microcirculation, it is almost impossible to measure the outflow border conditions experimentally owing to their tiny branch diameters. Consequently, the Windkessel-type boundary conditions are based on the so-called Lumped Parameter Model (LPM) and the more complex Lumped Parameter Network Model (LPNM). Both methods are typically adopted in approximating the outflow boundary conditions that represent the highly complex dynamic interactions between the tree and its downstream microvasculature. These approaches are based on the circuit analogy theory, which necessitates the measurement of resistances, capacitances, and empirical correlations, which are sometimes challenging to compute without patient-specific data and are not physiologically grounded. The connection of the generated Ordinary Differential Equations (ODEs) from these approaches with the CFD solver also creates unclear boundary conditions, which may often result in slow convergence or even divergence of numerical solutions [
11,
12].
The problem addressed in this work is the diagnosis of stenosis (obstruction or narrowing) in the coronary arteries of individual patients. Traditional methods for diagnosing stenosis, such as coronary angiography, have limitations and can be invasive, costly, and carry risks for the patient. There is a need for more effective and noninvasive diagnostic methods for stenosis.
The PBA method proposed in this work is based on an extension of Murray’s law and different inlet criteria [
13], and is designed to be used alternately and iteratively to compute the outflow boundary conditions of the coronary tree for individual patients. The PBA method has been validated using FFR measurements in actual patient arteries and benchmarking with the FDA’s nozzle. It is intended to provide realistic and tailored outflow boundary conditions for the diagnosis of stenosis without requiring measurable data. The unique contribution of the PBA method to the field is its use of Murray's law to establish initial boundary conditions that are then modified through the addition of new inlet boundary conditions and iterations, resulting in numerical convergence. This approach may provide a more effective and noninvasive method for diagnosing stenosis in the coronary arteries of individual patients.
In the cardiovascular system, an agreement between experiments and the Murray diameter model has been found only in small arteries [
14] and arterioles [
15,
16], which is our CAD case. The final conditions at the outlets are ultimately decided by the tree's geometry, the conservation laws built into CFD, the numerical iterations, and the additional inlet patient-specific parameters; we only utilize Murray’s formula to estimate their initial conditions. The third law may not accurately predict the outcome since we use it as a preliminary approximationIn the cardiovascular system, an agreement between experiments and the Murray diameter model has been found only in small arteries [
14] and arterioles [
15,
16], which is our CAD case. The final conditions at the outlets are ultimately decided by the tree's geometry, the conservation laws built into CFD, the numerical iterations, and the additional inlet patient-specific parameters; we only utilize Murray's formula to estimate their initial conditions. The third law may not accurately predict the outcome since we use it as a preliminary approximation.
Unlike machine learning-based data-driven simulation models, which depend on a significant quantity of data to verify, this PBA model is entirely based on physiology and physics. We are currently in the conceptual model-proof stage. It is undoubtedly desirable to undertake large-scale clinical testing, which we hope to accomplish in the next step for possible commercialization and future clinical uses. Because of this, we are doing model validation using experimental benchmark data and output from other simulations.
IREC did the study related to the patient's data collection and ethical approval.
3. Results and Discussion
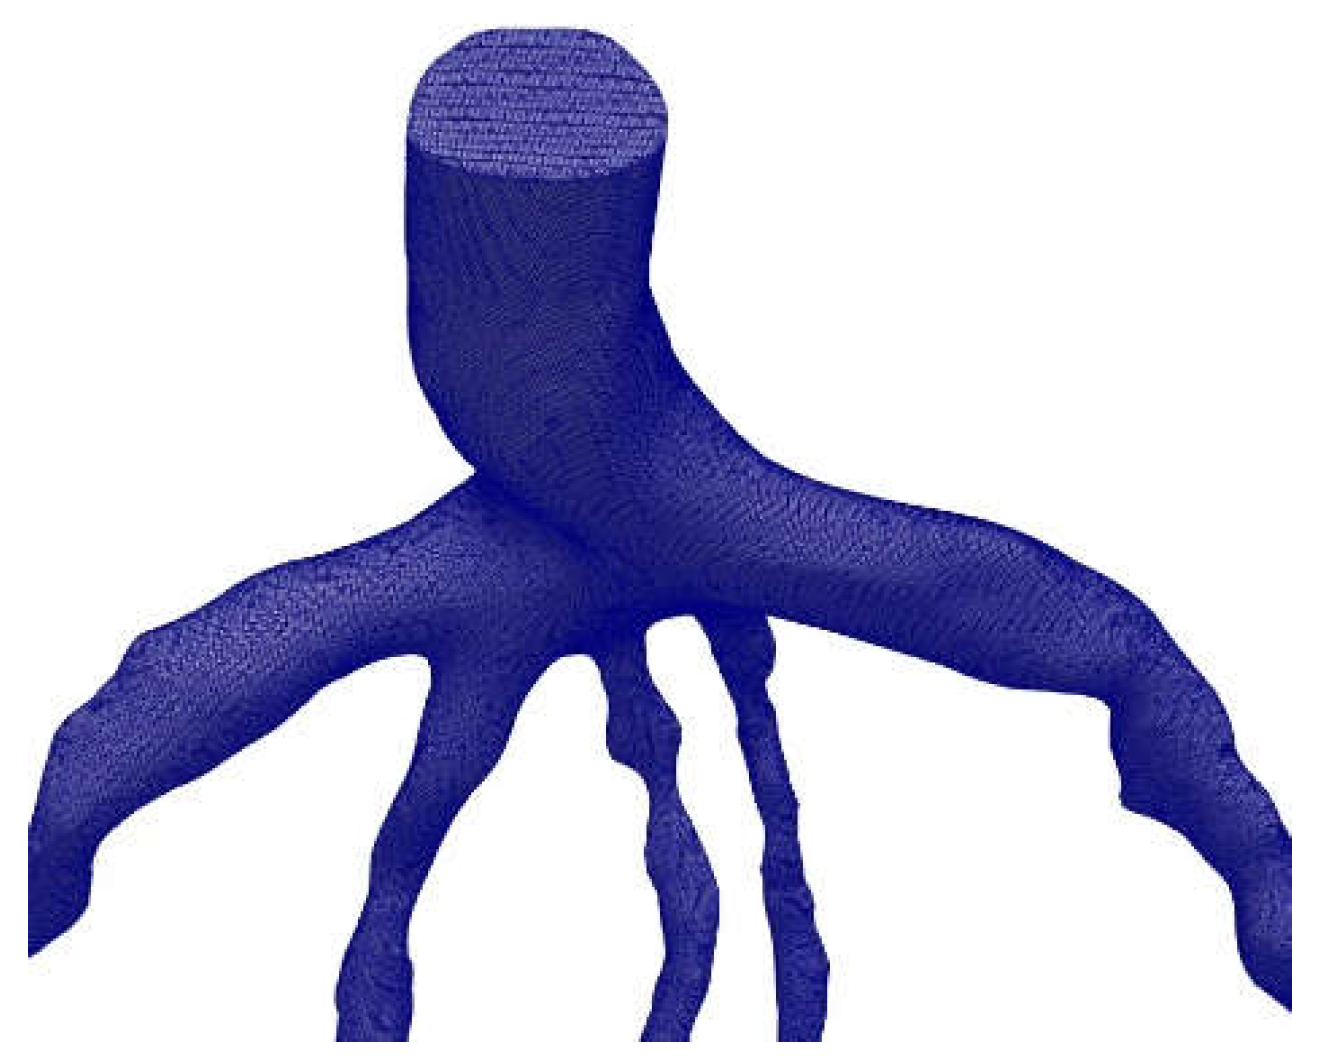
The mesh generation for the blood vessels was done using the open-source CFmesh utility, which is part of OpenFOAM and generates volumetric meshes of unstructured Cartesian type. CFmesh is also able to automatically generate tetrahedral meshes for a variety of geometries, as shown in
Figure 9. Mesh sensitivity analysis was conducted [
18], and the same models were used in this study. For the arteries CT209, CHN13, and CHN03, our research group [
21] selected mesh sizes of 0.17mm, 0.22mm, and 0.2 mm, respectively, based on the results of the mesh sensitivity analysis.
FFR is calculated using Equation (13), and for the CT209 model, it has an experimental value of 0.76 [
20].
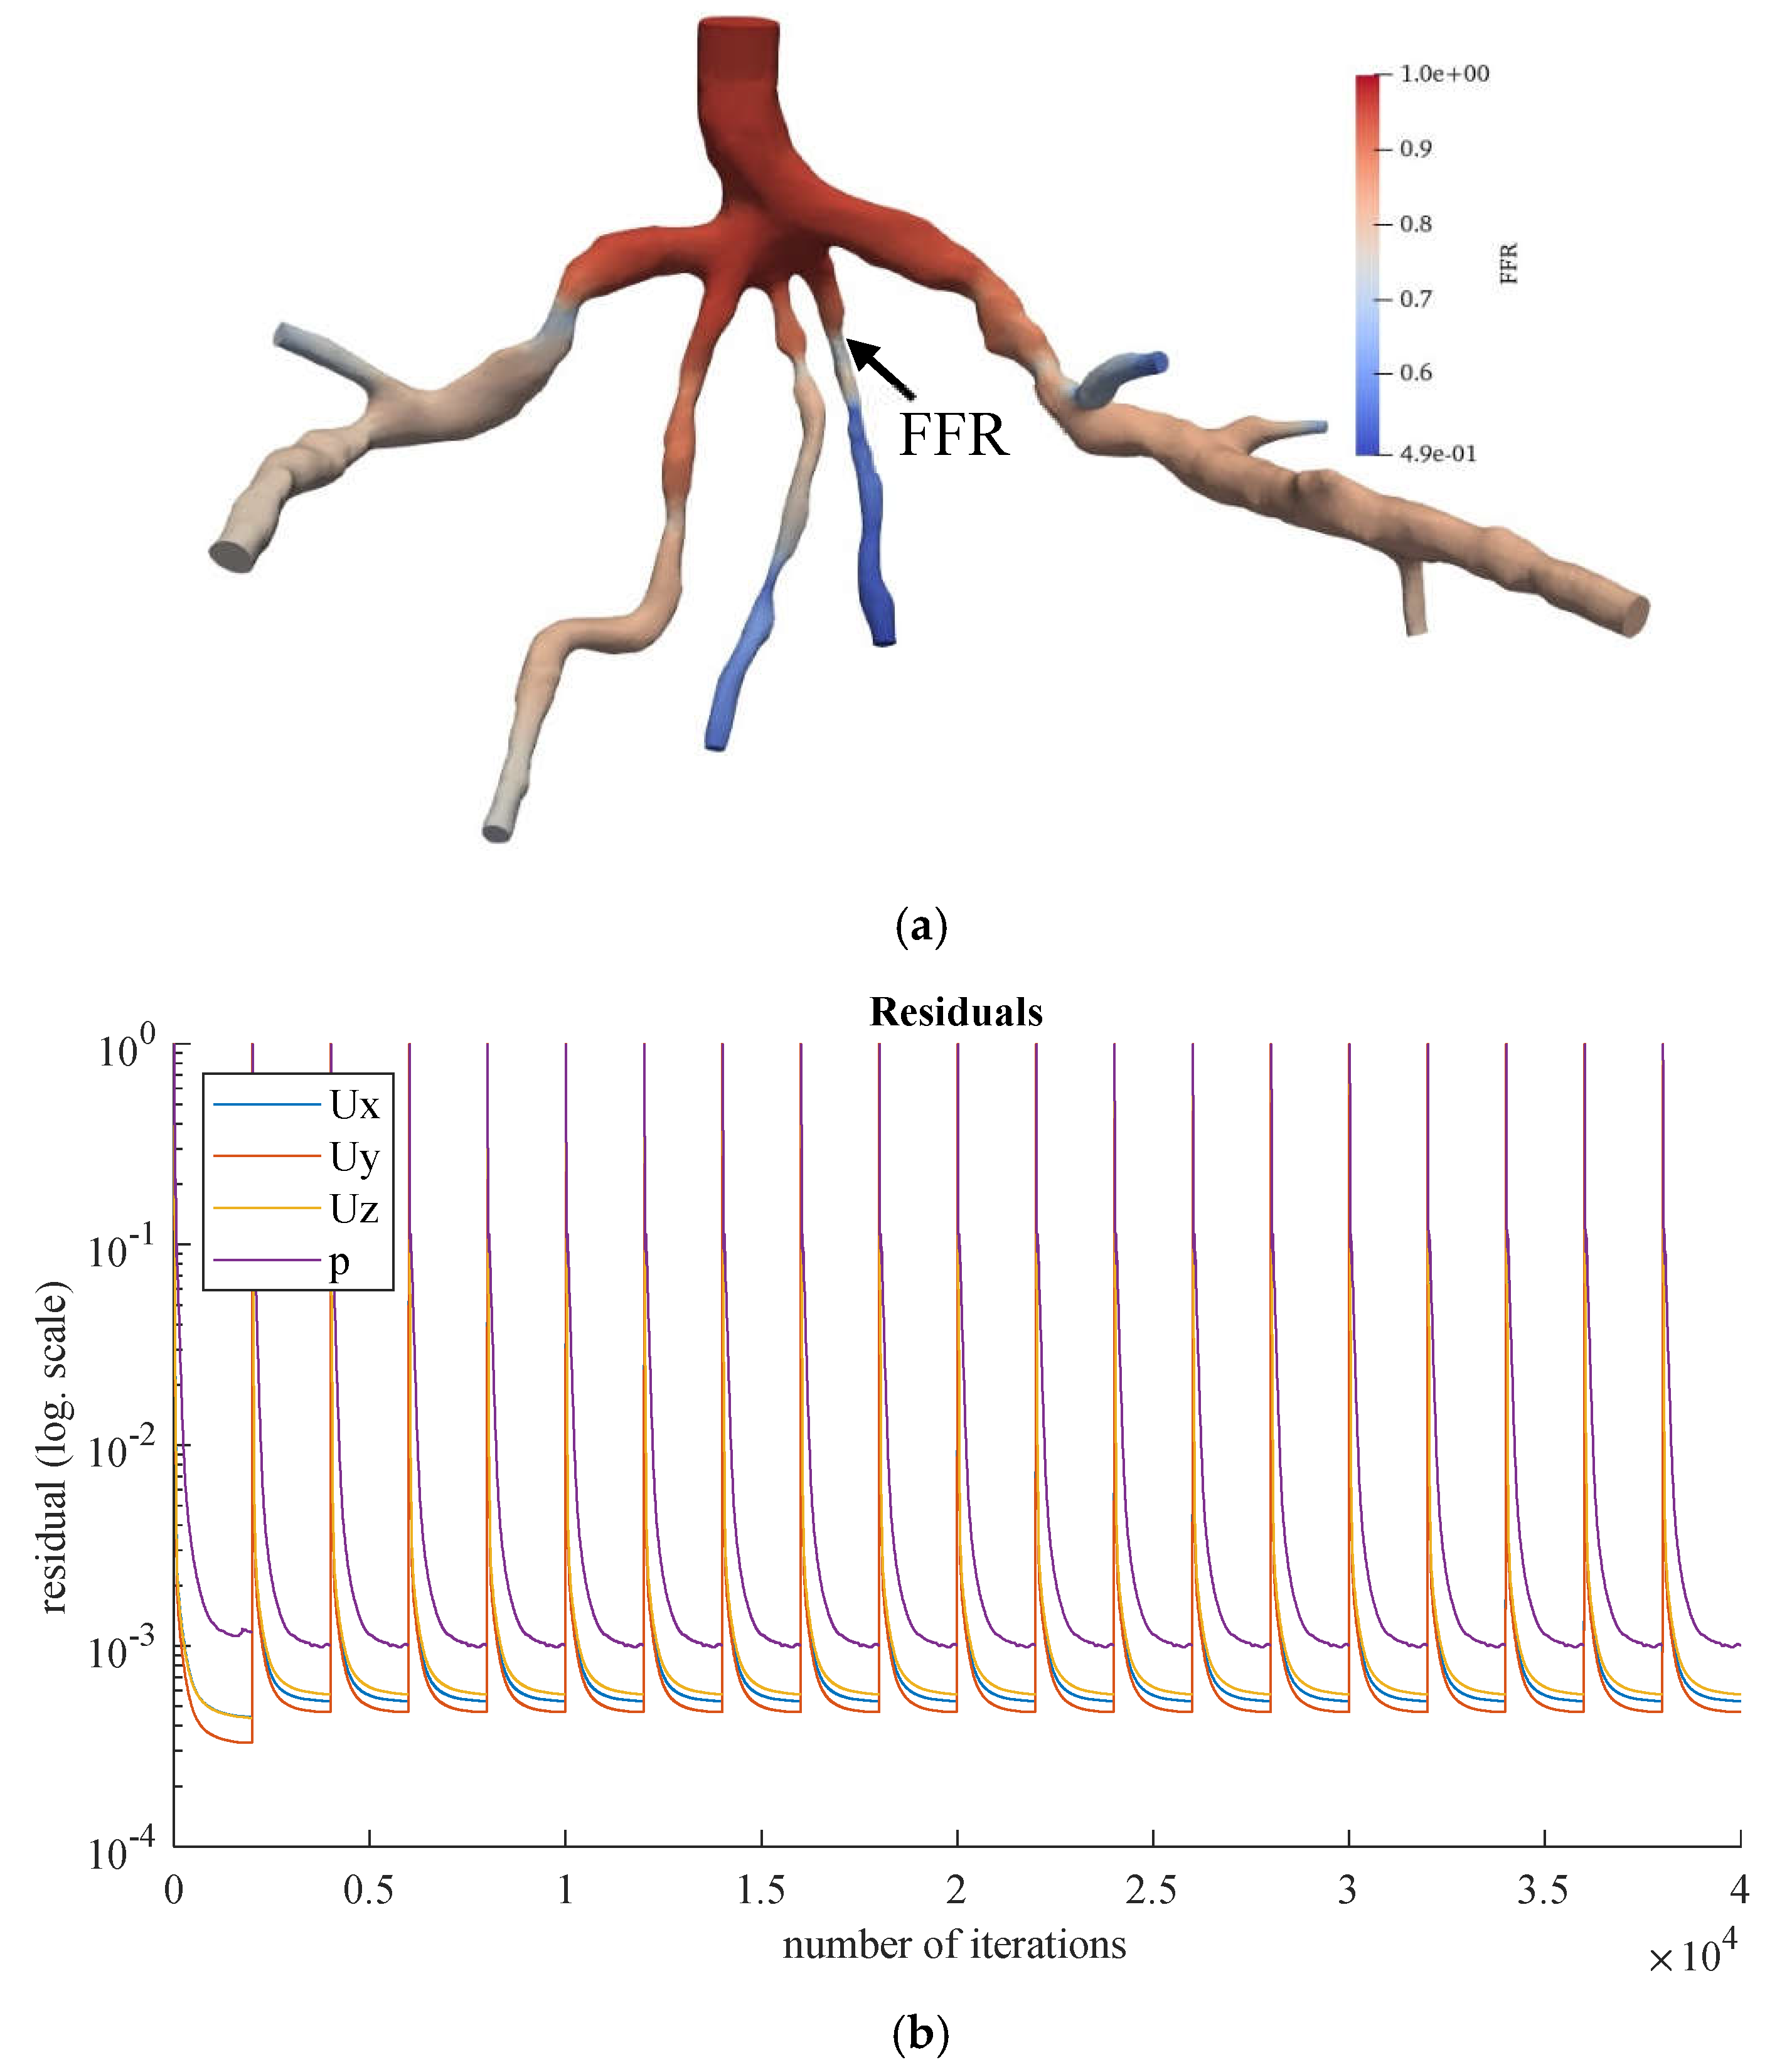
Figure 10 shows the derived FFR values from the most recent iteration, along with the relative percentage difference between the computed and experimental FFR (the degree of deviation from the experimentally obtained FFR). The calculated noninvasive FFR value of 0.73 by Zhang et al. [
17] is different from the experimental (ICA) FFR value of approximately 0.76 for the CT209 model. After conducting mesh sensitivity analysis, Sumbekova et al. [
21] from our research group obtained final FFR values of FFR=0.757, which was very close to the ICA FFR. The same algorithm implemented in OpenFOAM produced results that were similar to the ICA measurement, with final FFR values of FFR=0.762.
According to Zhang et al. [
20], the Left Anterior Descending (LAD) Proximal artery is the site of arterial stenosis in the CT209 model [
20]. In
Figure 10, the LAD Proximal is the dark blue area of the blood artery, and it is observed that the artery stenosis is in the same location as identified by Zhang et al. [
20].
Figure 10a includes the visualized FFR findings from the tenth iteration of the steady-state PBA.
We compared the
steady-state results obtained by the PBA method in OpenFOAM with those obtained using the traditional lumped parameter method and the current approach used by our research group [
21], as well as with the ICA measurement results. It was found that the PBA method demonstrates good accuracy and efficiency, similar to the traditional methods.
Figure 11 and
Figure 12 show the visualized FFR distributions for the CHN13 and CHN03 models, respectively. The calculated FFRs for CHN03 and CHN13 by the OpenFOAM PBA are 0.88 and 0.683, respectively, which are in excellent agreement with the corresponding experimental values of 0.86 and 0.68.
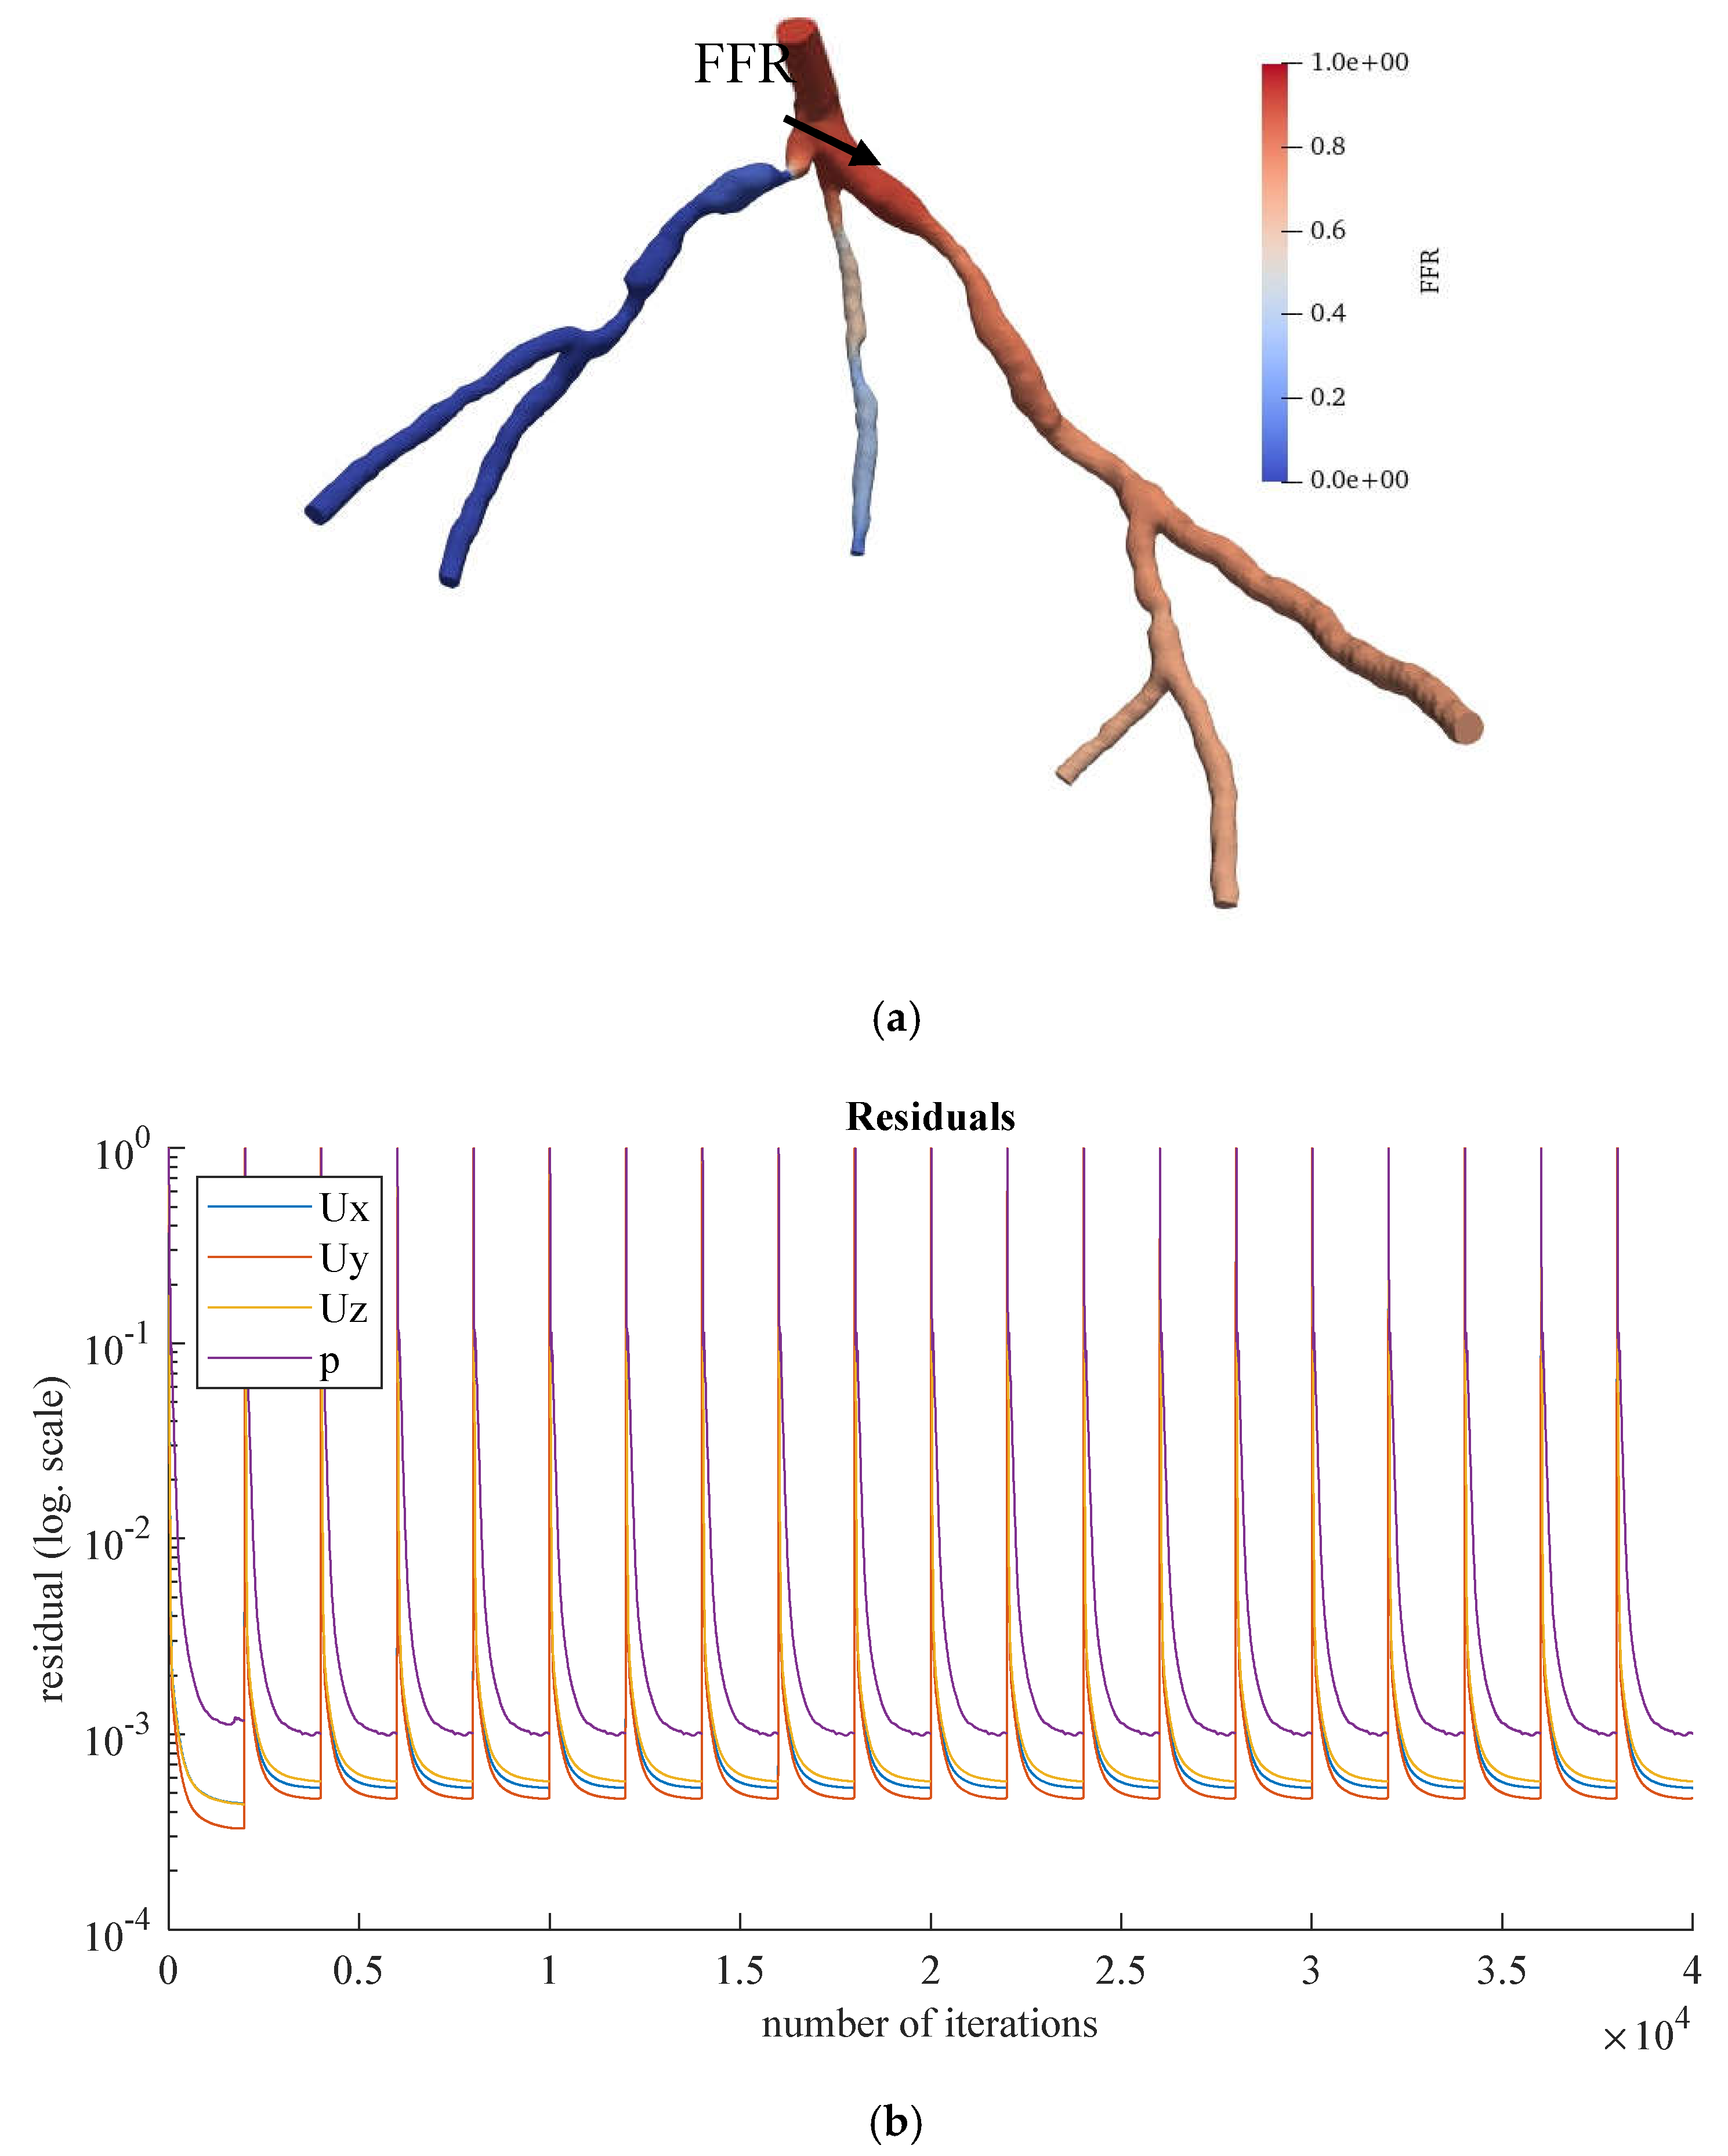
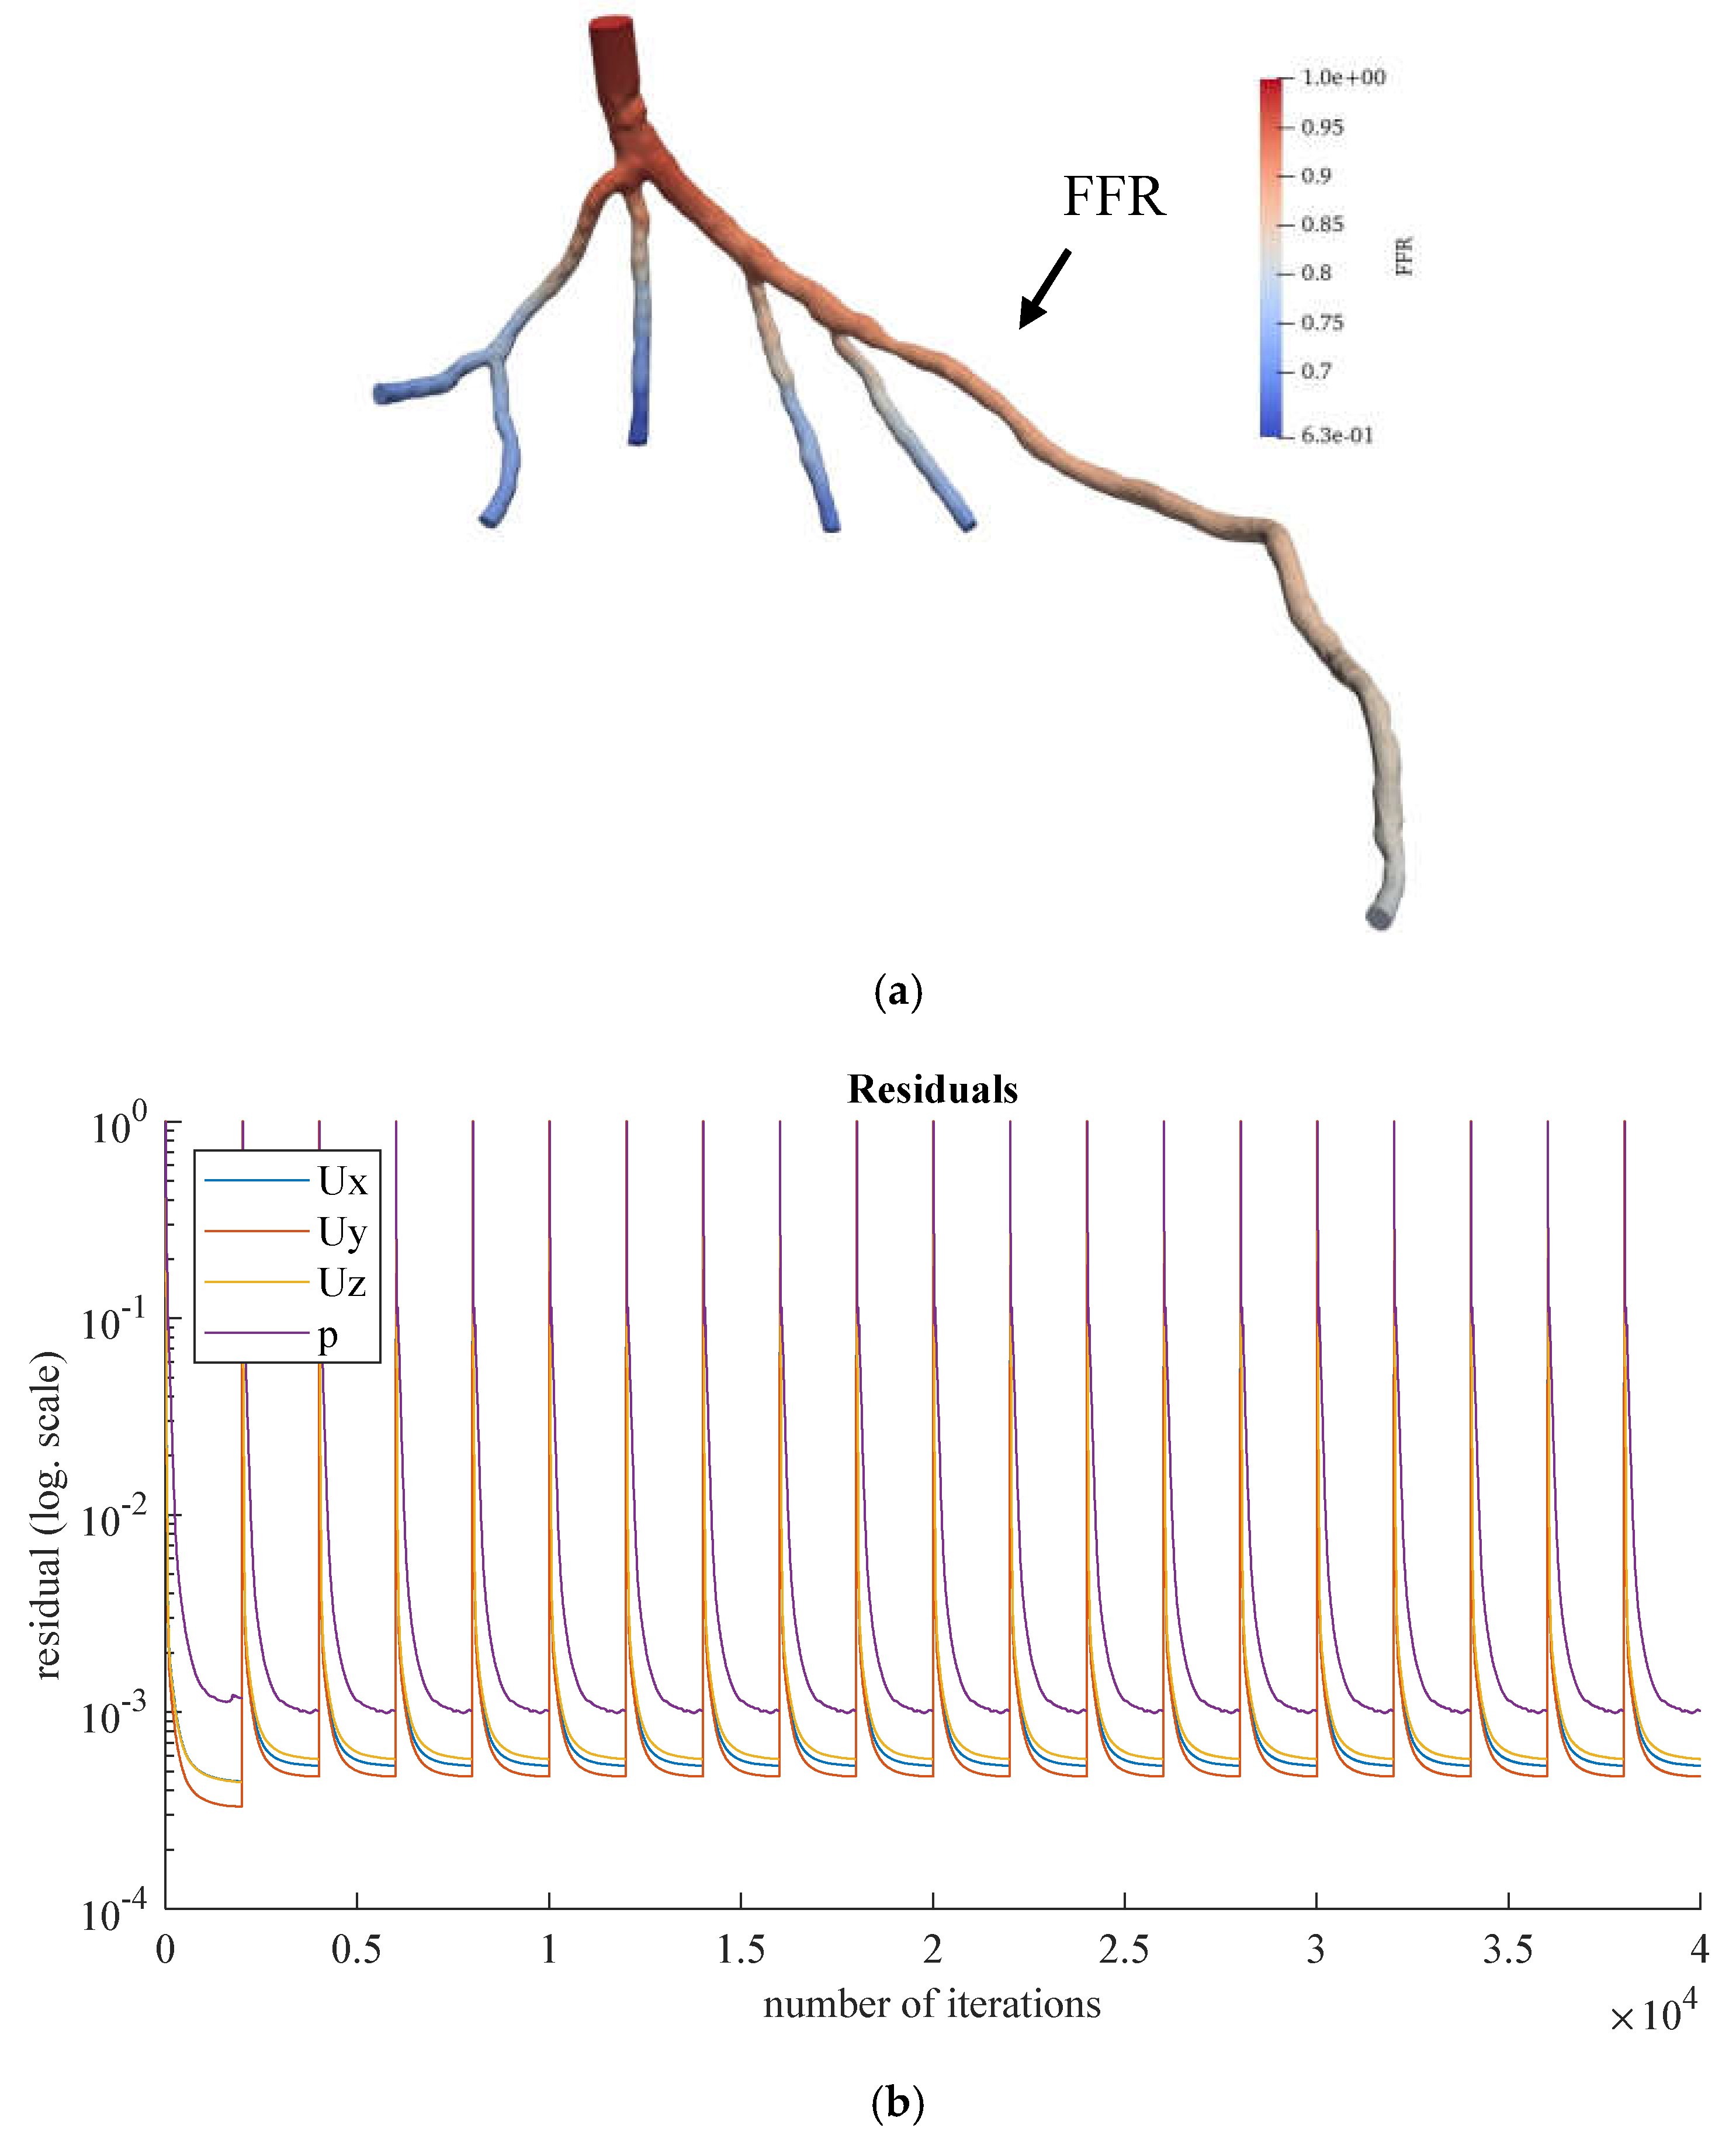
Figure 13,
Figure 14 and
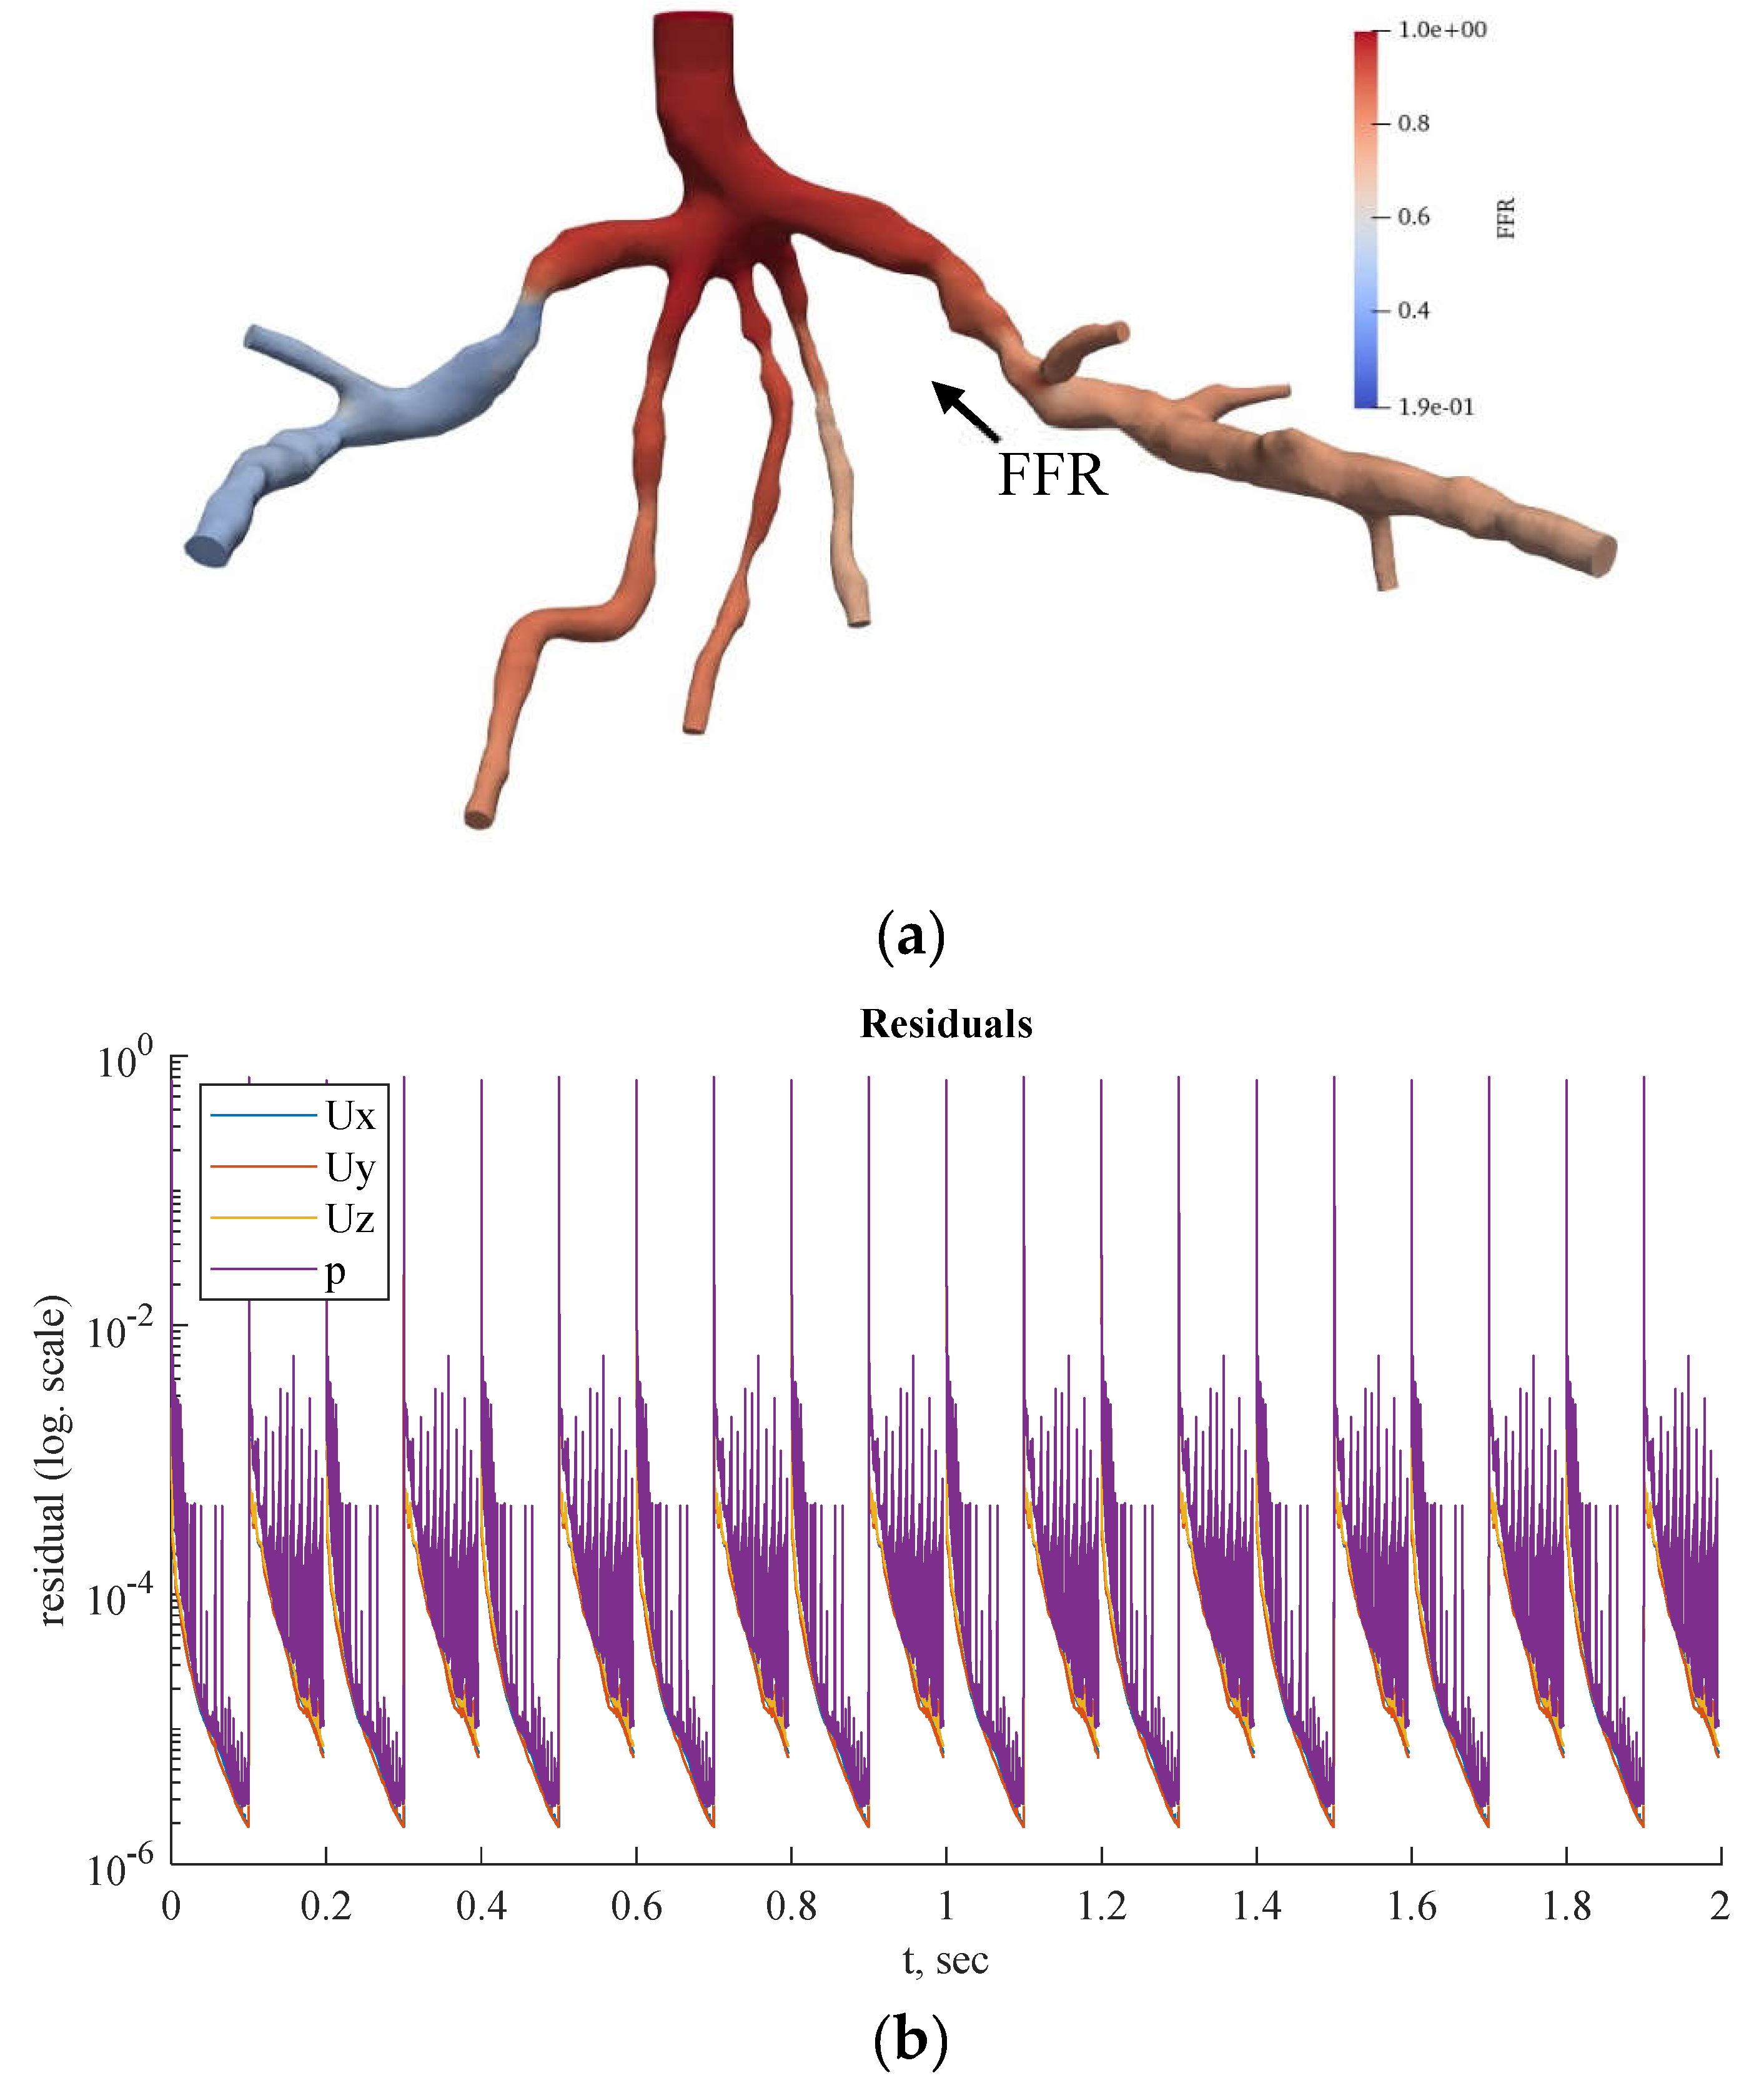
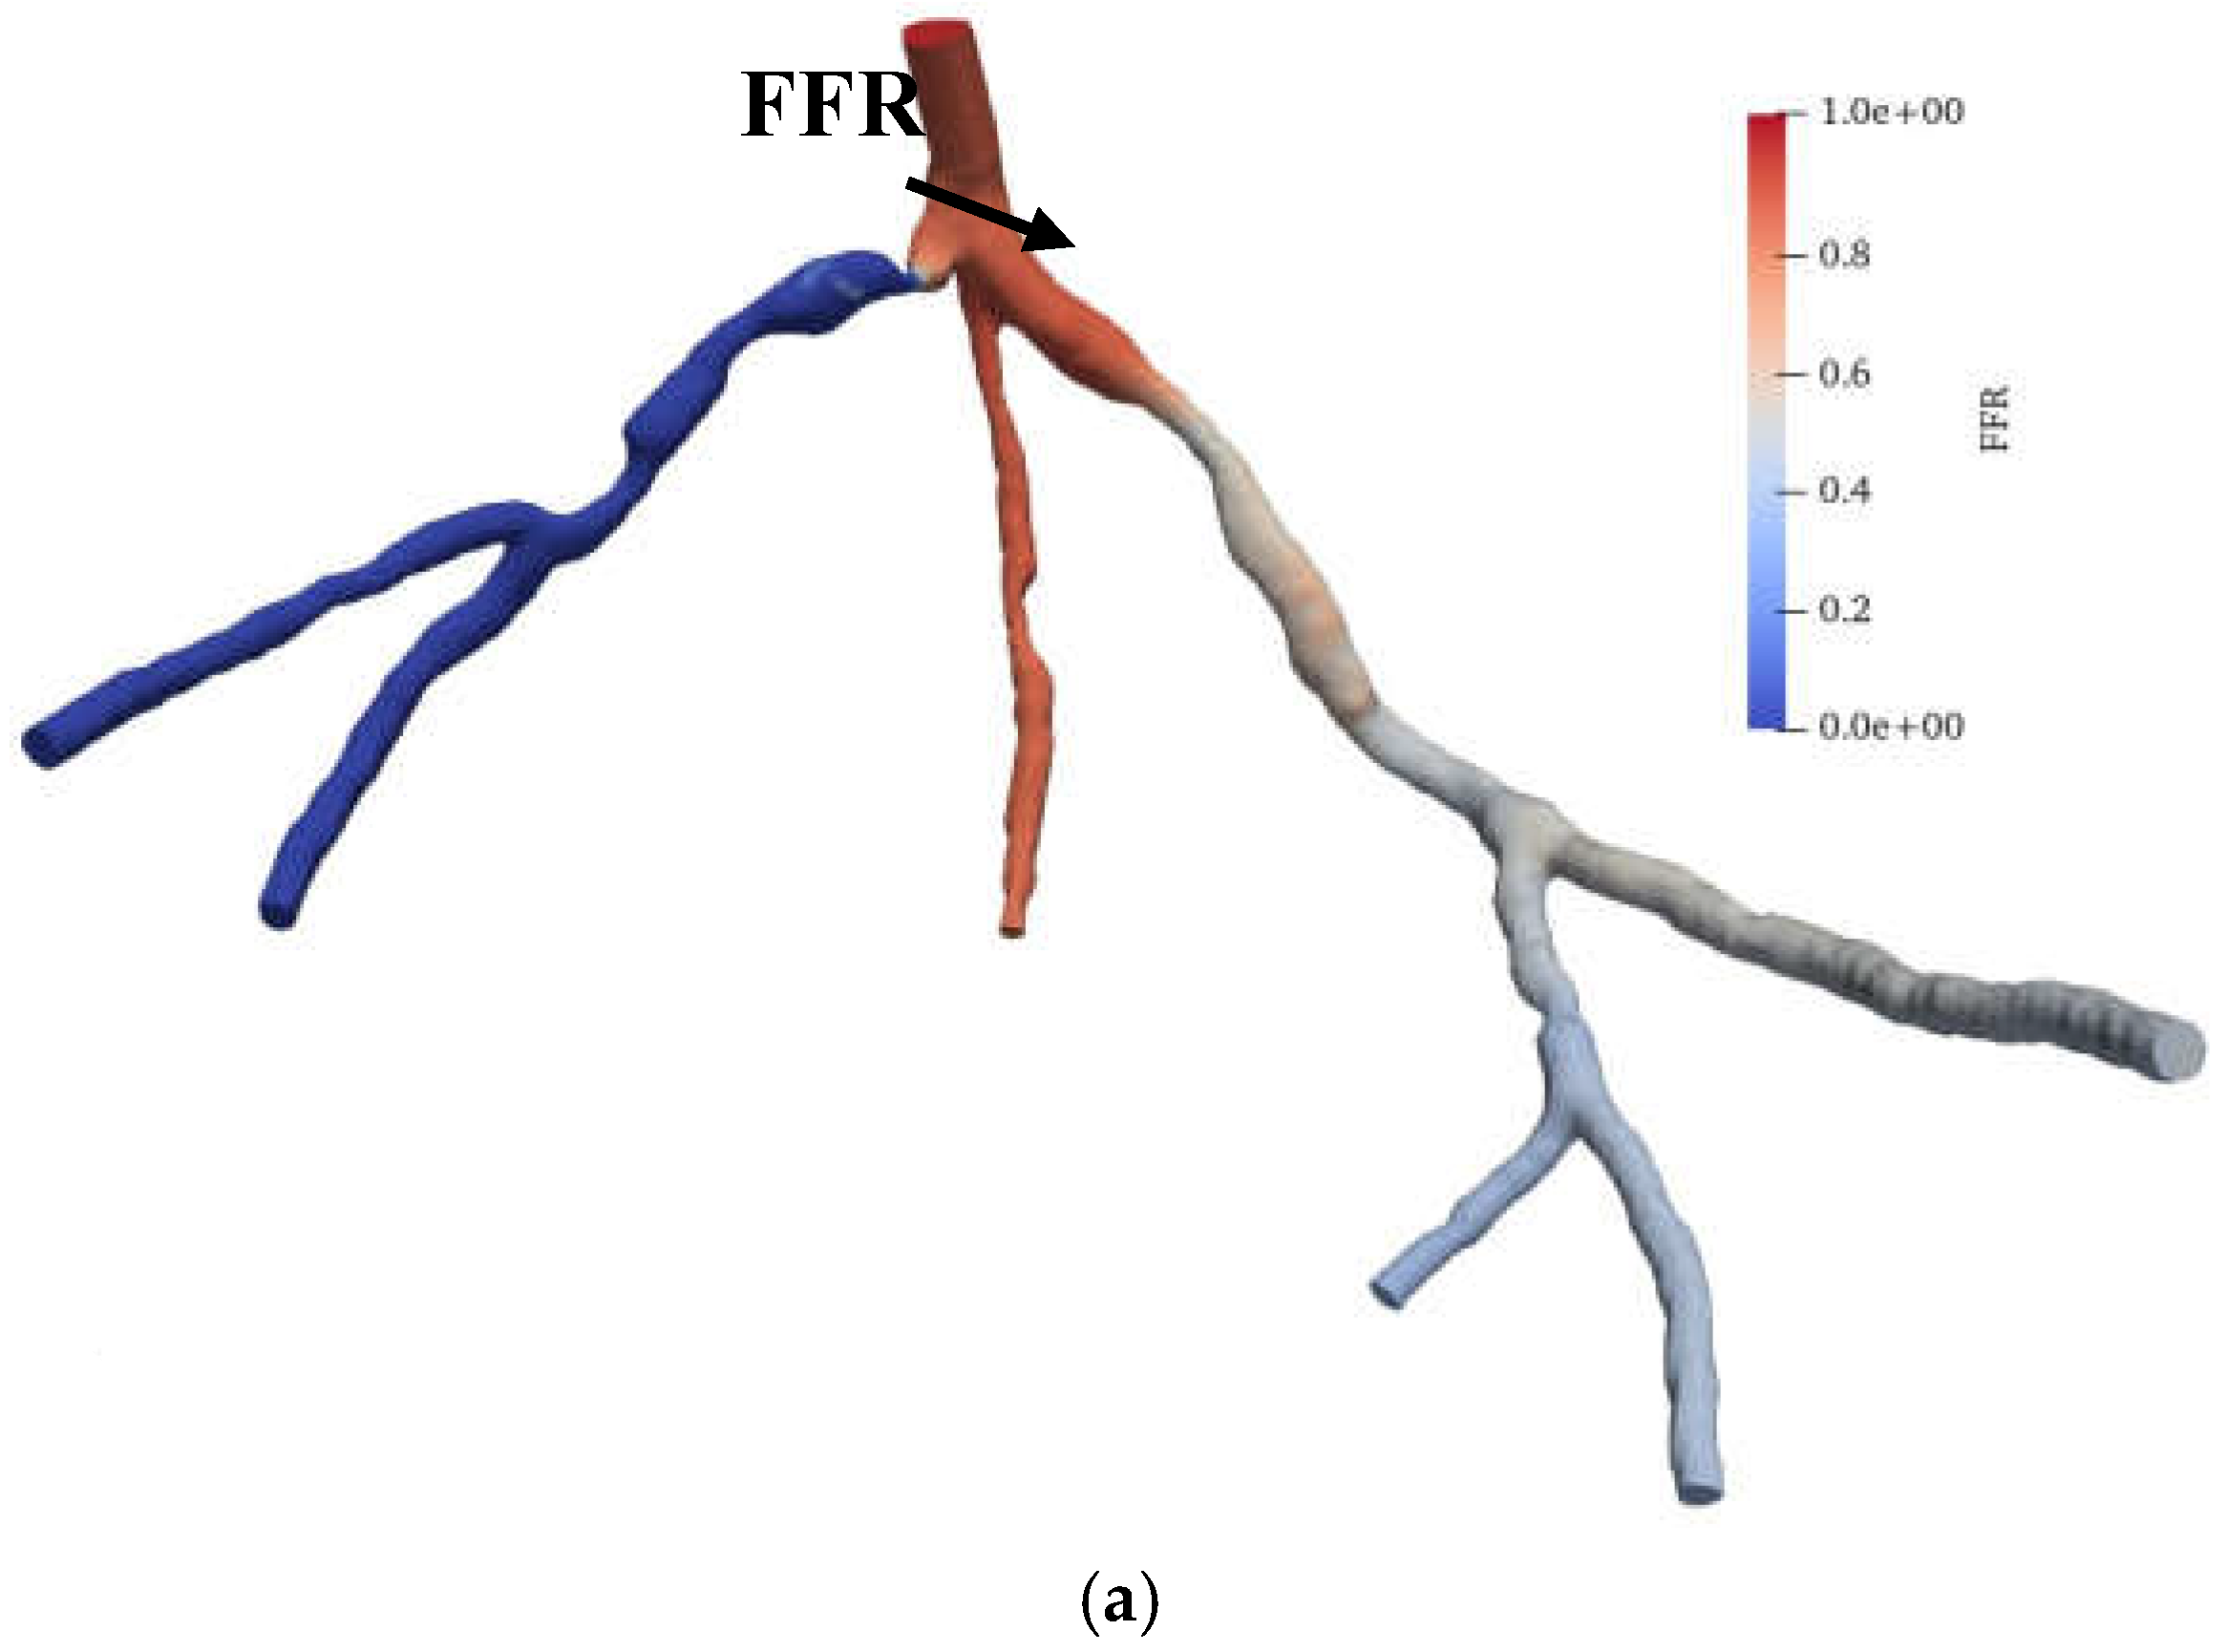
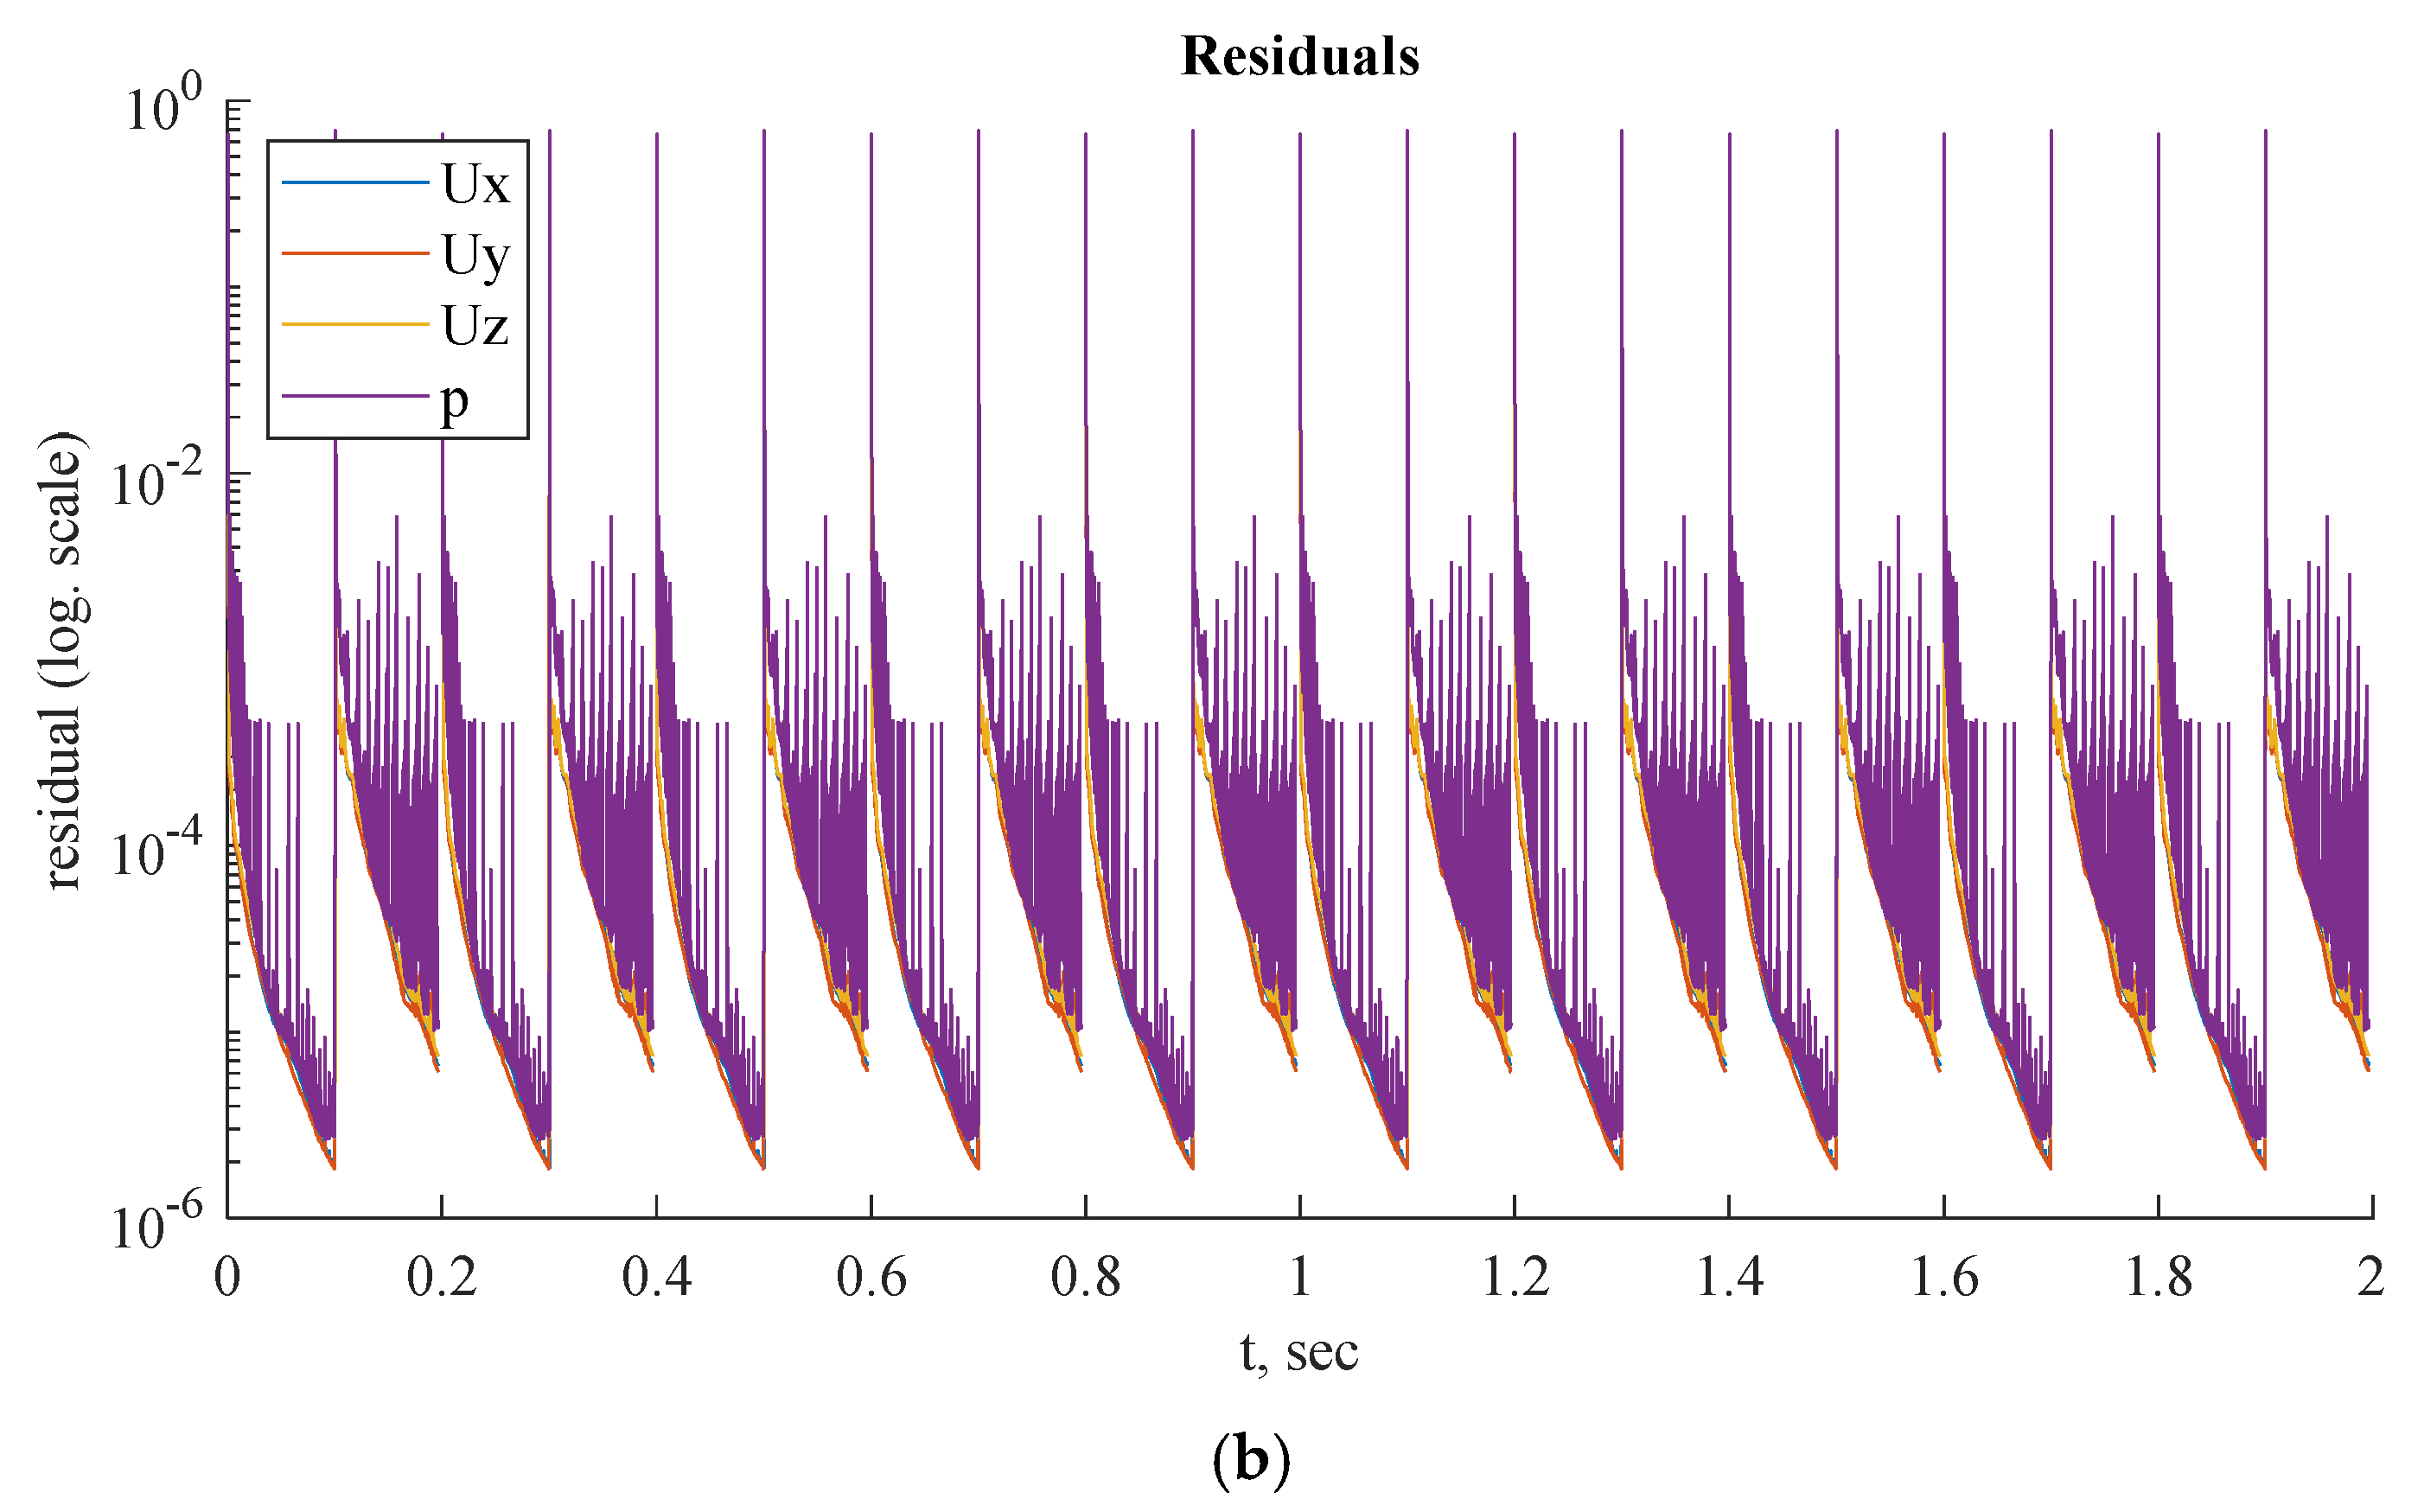
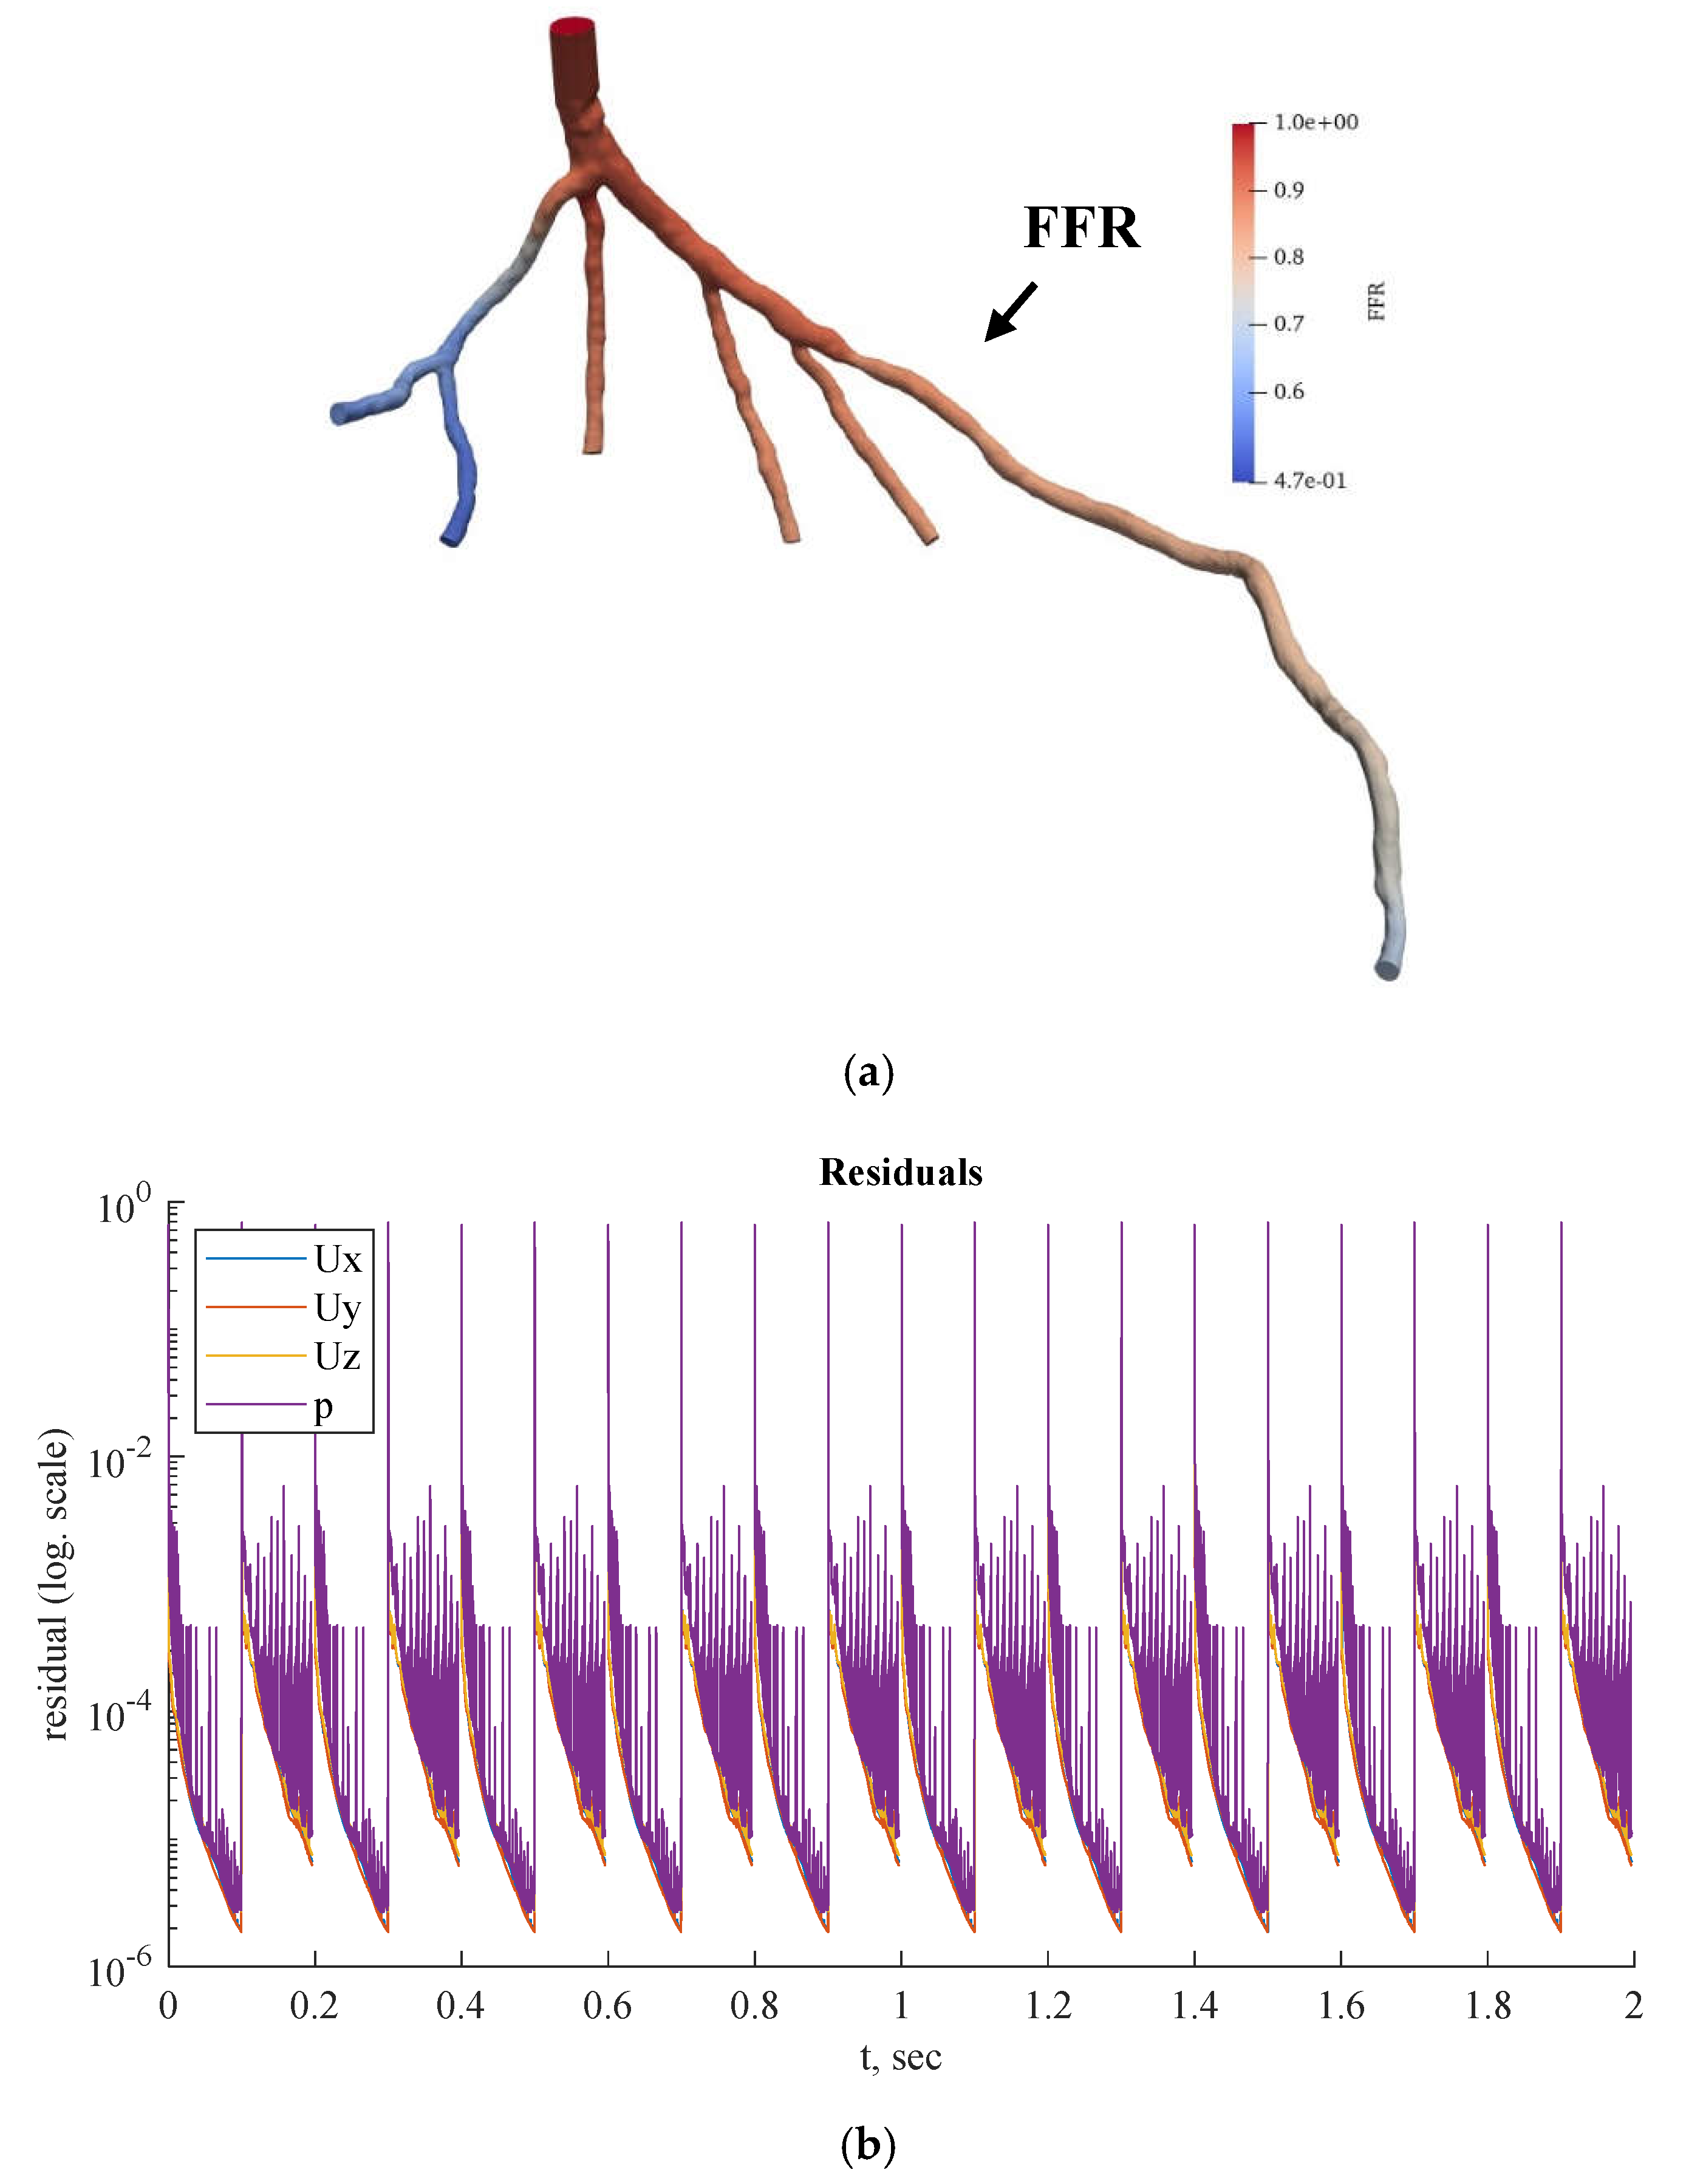
Figure 15 show the FFR distributions in transient simulations for the CT209, CHN13, and CHN03 models, respectively. The PBA residuals also demonstrate convergence in the velocity and pressure equations.
Preliminary steady-state simulations were conducted to achieve convergence of the model before performing OpenFOAM transient PBA simulations using the mapFields package. The mapFields utility converts one or more fields that are specific to a geometry into their equivalents, and it is universal because there is no requirement for the geometries to be similar [
22].
In
Figure 13bb, during iterations, the PBA method switches the boundary conditions, which can lead to high-frequency oscillations. For transient simulations, it is necessary to drive the solution to convergence at each time step, which results in fluctuations that appear to have a high frequency. The solution may exhibit wave reflections resembling high-frequency oscillations due to the complex geometry.
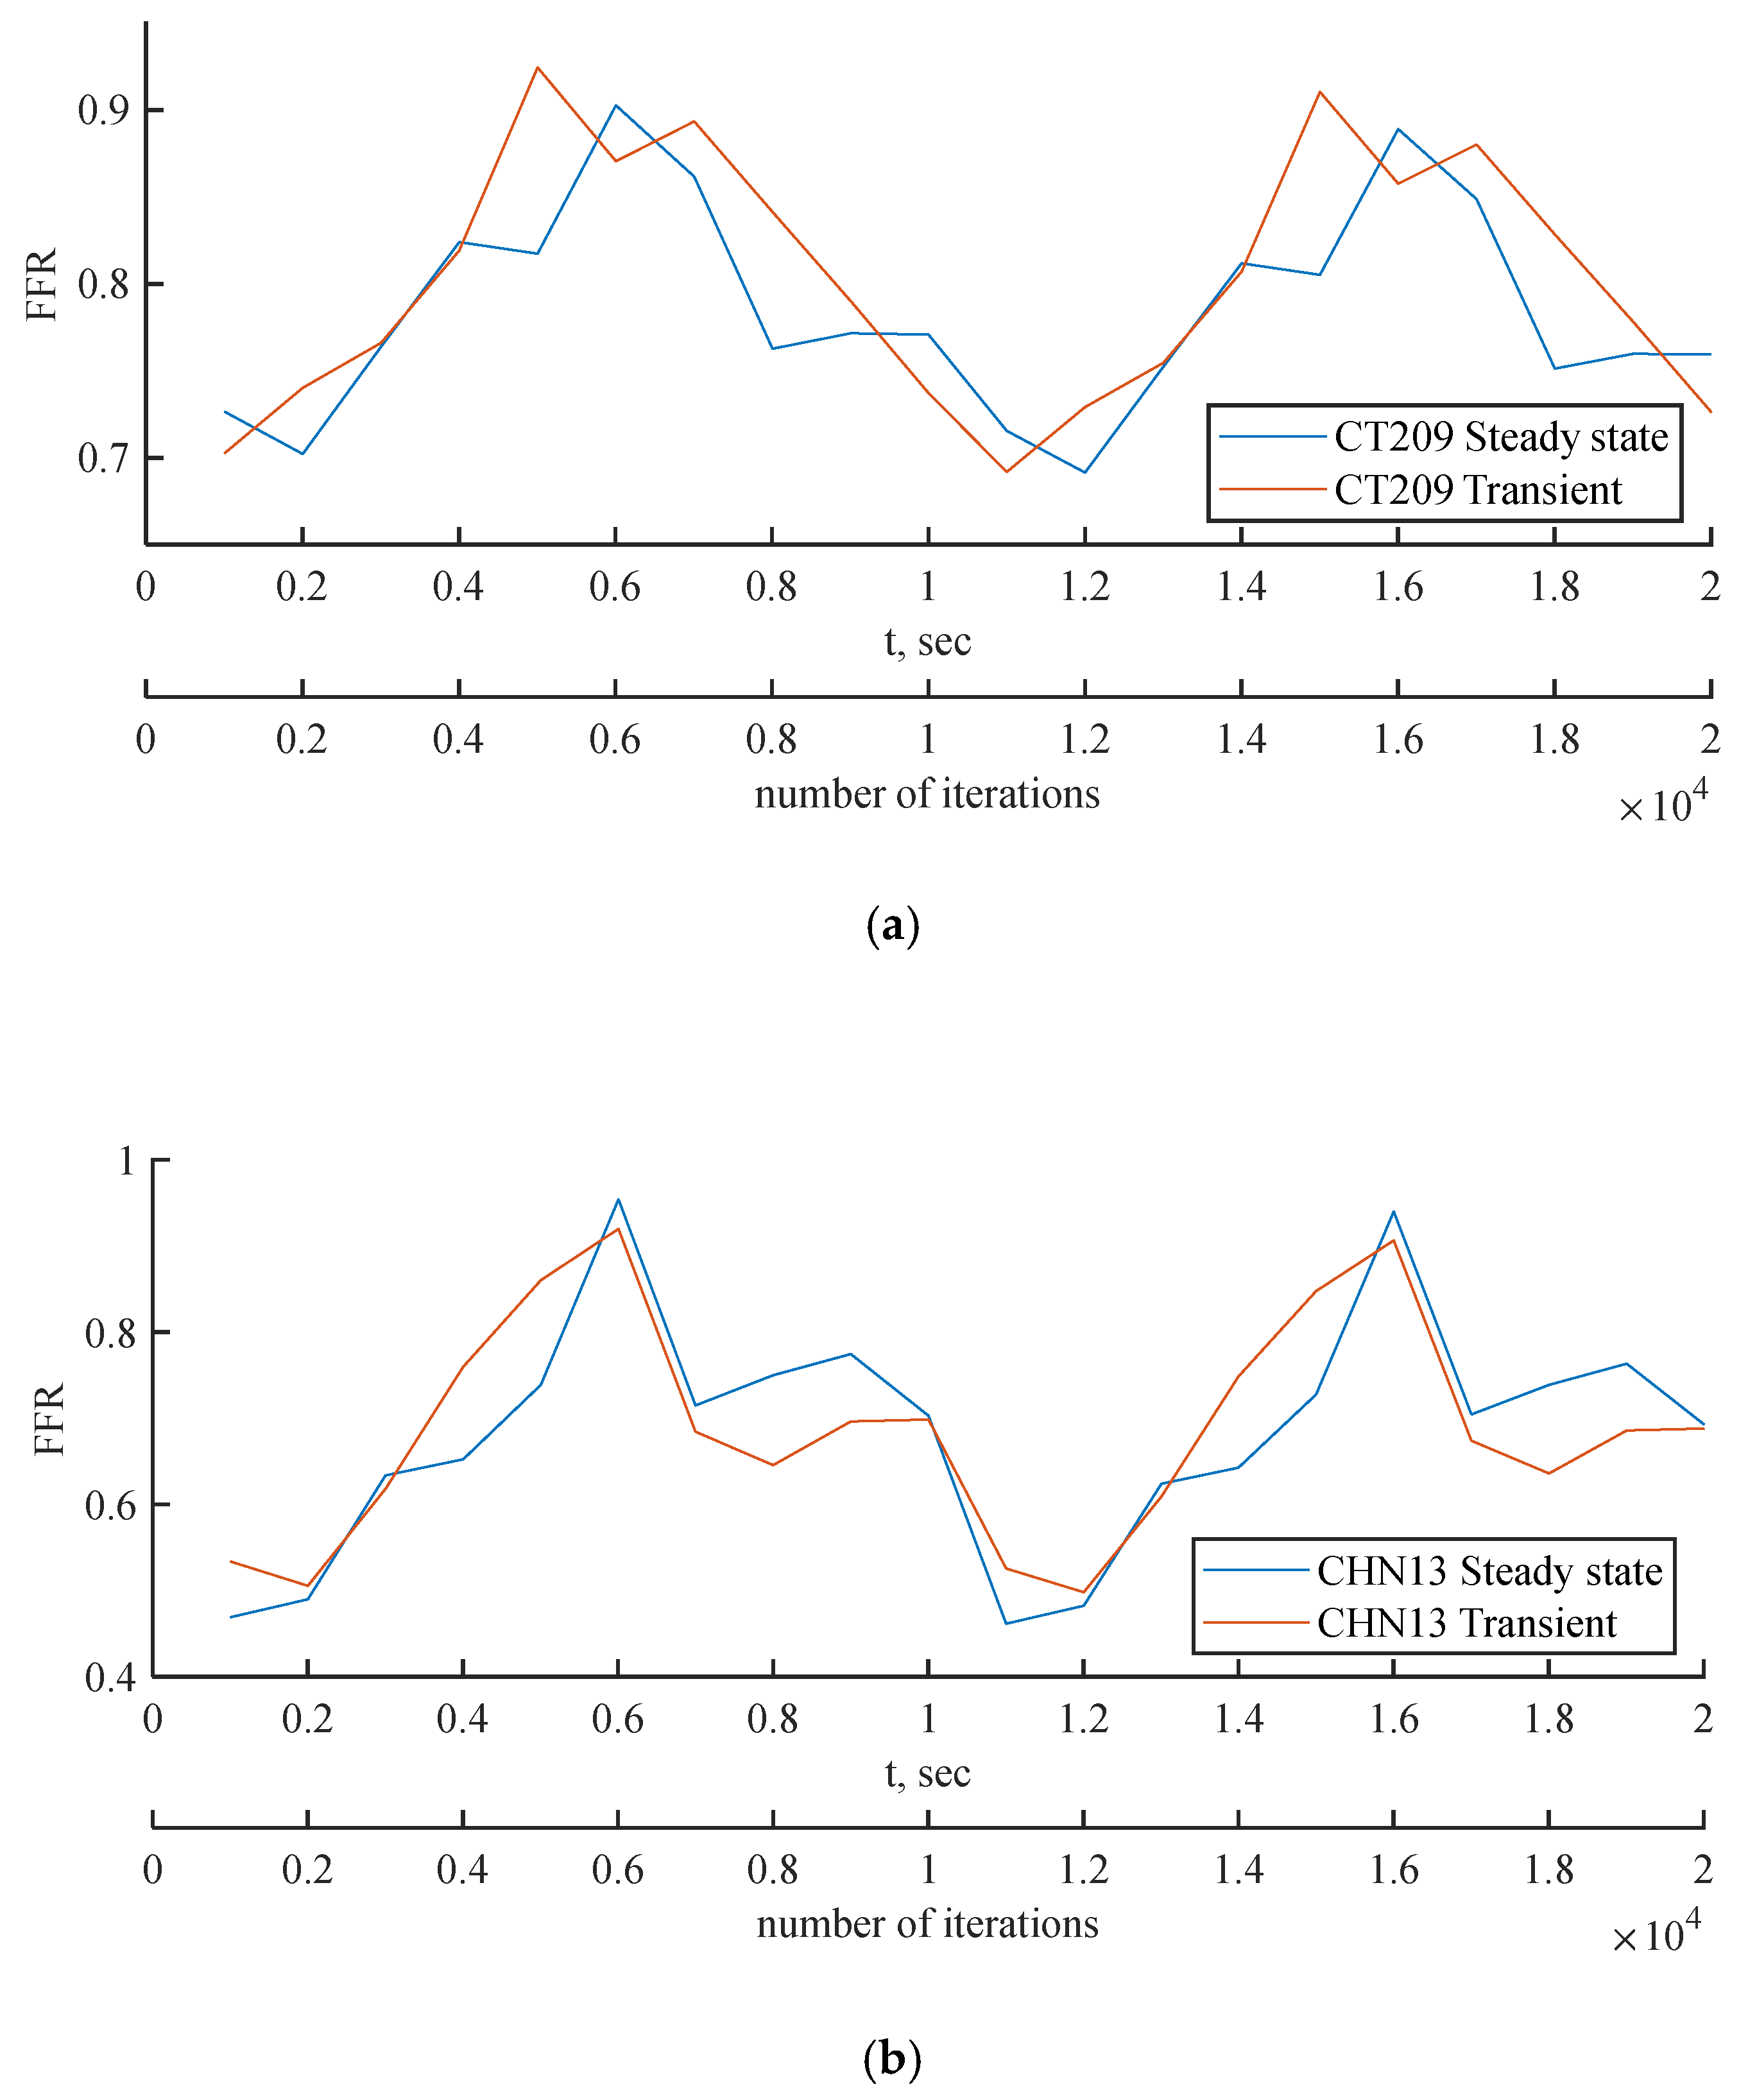
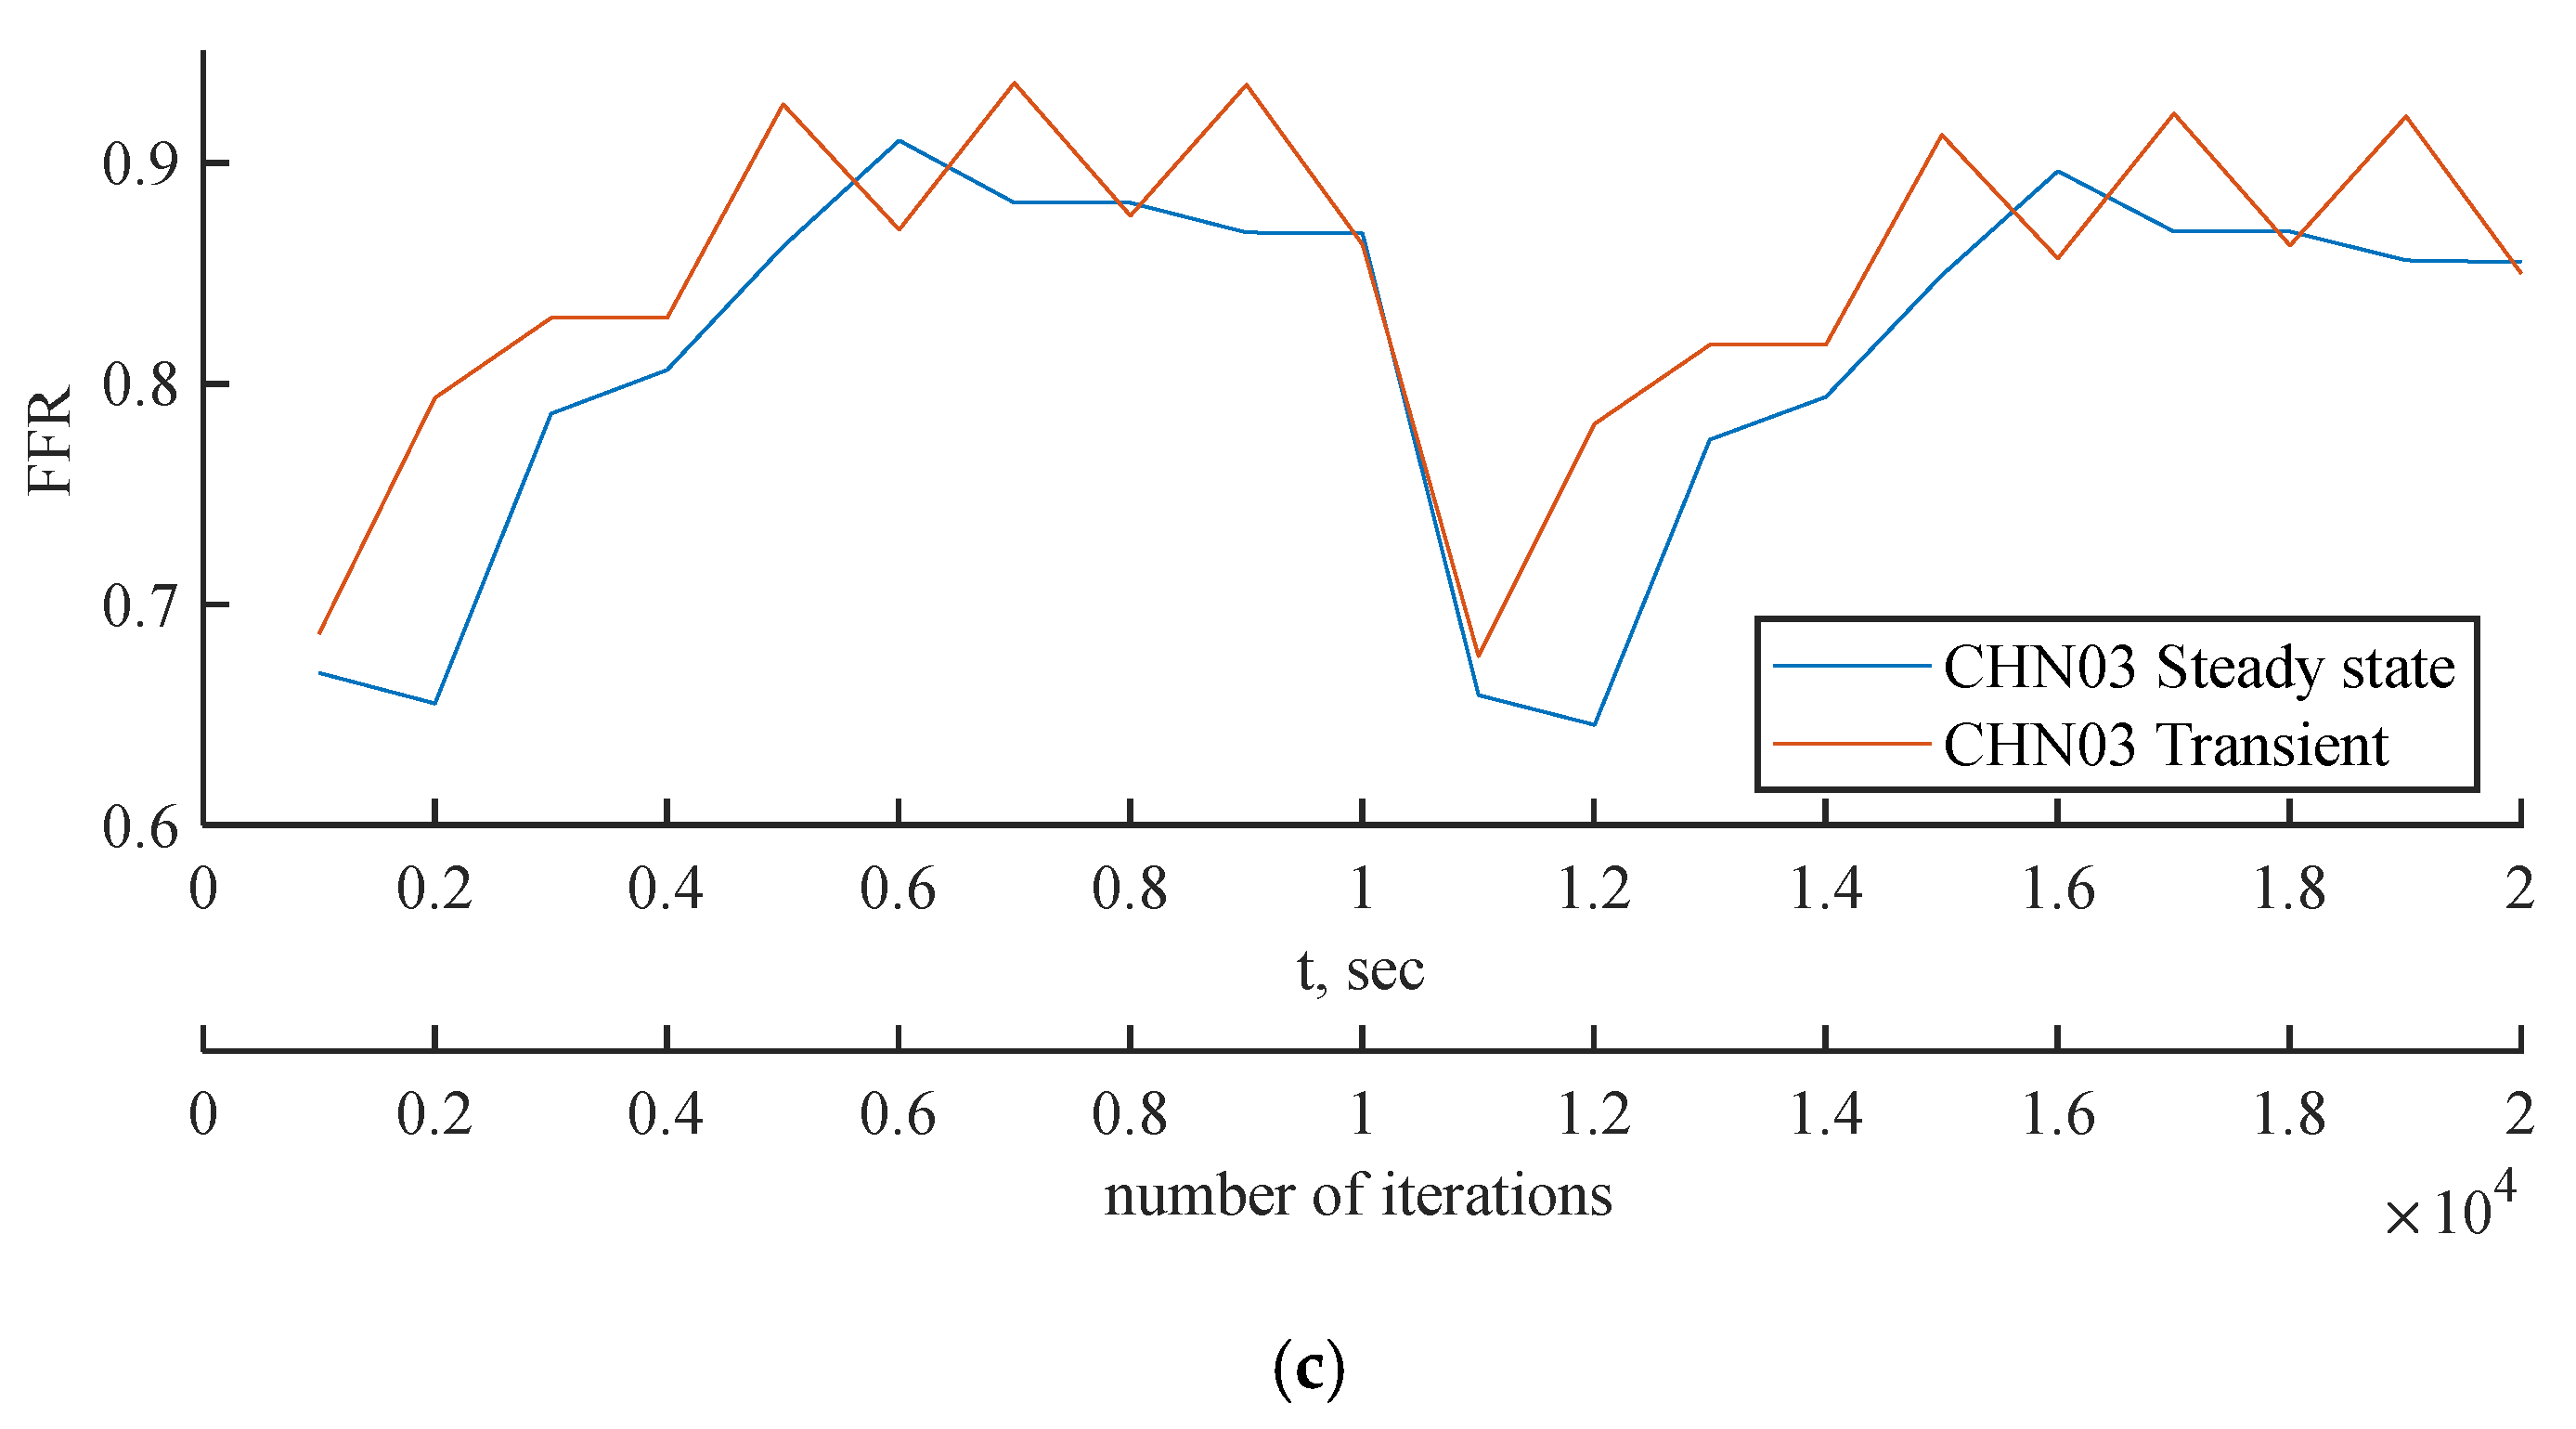
Figure 16 compares the FFR values between steady-state and transient simulations at the locations indicated by the FFR arrows in
Figure 11,
Figure 12,
Figure 13,
Figure 14 and
Figure 15. The FFR values increase in all three scenarios and tend to decrease due to alignment with the flow rate waveform.
The mean FFR values are included in
Table 9 as the outcome value for transient simulations. As shown in
Figure 16c, the second half of the transient instance exhibits rapid fluctuations in the FFR due to changes in the PBA boundary conditions. In
Figure 16a and
Figure 16b, the models show good agreement with the flow rate inputs, indicating that the PBA method may converge over several flow rate cycles.
Three artery models were analyzed using both methods: the standard LPM technique was used in ANSYS [
21], while the suggested PBA was implemented in Simvascular [
21] and OpenFOAM for steady-state and transient cases, respectively, as described in Appendix A and B.
Table 9 provides a summary of the comparison between the computed and experimental ICA FFRs [
21]. This table shows that the recommended PBA produces results that are independent of the solver. Simvascular and OpenFOAM were used for the suggested PBA, while ANSYS was used for the conventional LPM approach.
The findings indicate that the relative errors or discrepancies across steady-state simulations in ANSYS CFX, Simvascular, and OpenFOAM do not exceed 3.24%. The results also show that the relative error disparities in transient simulations in OpenFOAM do not exceed 5.26%. The smallest inaccuracy was observed in Simvascular and OpenFOAM steady-state PBA for CT209, at 0.26%. The largest inaccuracy for CT209 was in the OpenFOAM transient PBA, at 5.26%. This may be due to the highest flow rate values, which could increase the overall FFR readings in the tested artery. The error in OpenFOAM transient PBA for CHN03 was the smallest recorded, at 0.02%, while the largest inaccuracy for CHN03 was in the OpenFOAM steady-state PBA, at 2.33%. The error in OpenFOAM steady-state PBA for CHN13 was the lowest, at 0.44%, while the highest error was in ANSYS CFX, at 3.24%. Despite the error peaks associated with various methods, the PBA approach shows promising performance.
The classic LPM and LPNM techniques, which involve the calculation of capacitance, resistance, inductance, and the creation of a fictitious downstream capillary vessel network using fractal techniques, are fundamentally different from the PBA approach. The LPM and LPNM techniques require the calculation of resistance at the outlets and the use of additional inlet measurement conditions and numerical iterations, which are not based purely on physiology. In contrast, the PBA technique is patient-specific and physiologically based. It estimates the initial conditions at the outlets using Murray's law and then uses the geometry of the arterial tree, the conservation laws incorporated into CFD, the suggested numerical iteration scheme, and the additional measured inlet patient-specific conditions to determine the final conditions at the outlets. The suggested PBA strategy, which is completely based on physics and physiology and is patient-specific, has also been shown to be computationally effective. It is integrated into the standard CFD pressure correction iterations as an iterative boundary-switching system that does not require two simulation rounds.
The PBA approach was further validated using the standard LPM method published in Zhang et al. [
20] for real-patient arteries. The LPM method employs a reference pressure, resistances at every outlet representing the flow resistance from the downstream microvasculature, and an overall resistance for the entire CAT that is related to the outlet resistances through a population-averaged empirical scaling law [
20]. The LPM is an iterative procedure that calculates the resistances and reference pressure to determine the outlet pressures in each branch outlet. It has been found that the LPM does not always ensure convergence to a unique solution for every situation. In contrast, the suggested PBA also achieves convergence to precise answers for all three analyzed scenarios. The PBA approach is more reliable than the LPM because it is physiologically based and patient-specific, while the LPM does not consider these characteristics.
Additionally, the PBA approach was verified using the benchmark model of the FDA nozzle. The goal was to replicate the study by Stiehm et al. [
19] using the PBA approach. The computational results of the axial velocity along the centerline of the nozzle geometry were compared to the CFD data from the FDA's round-robin study [
19] for validation. The inlet conditions, shown in
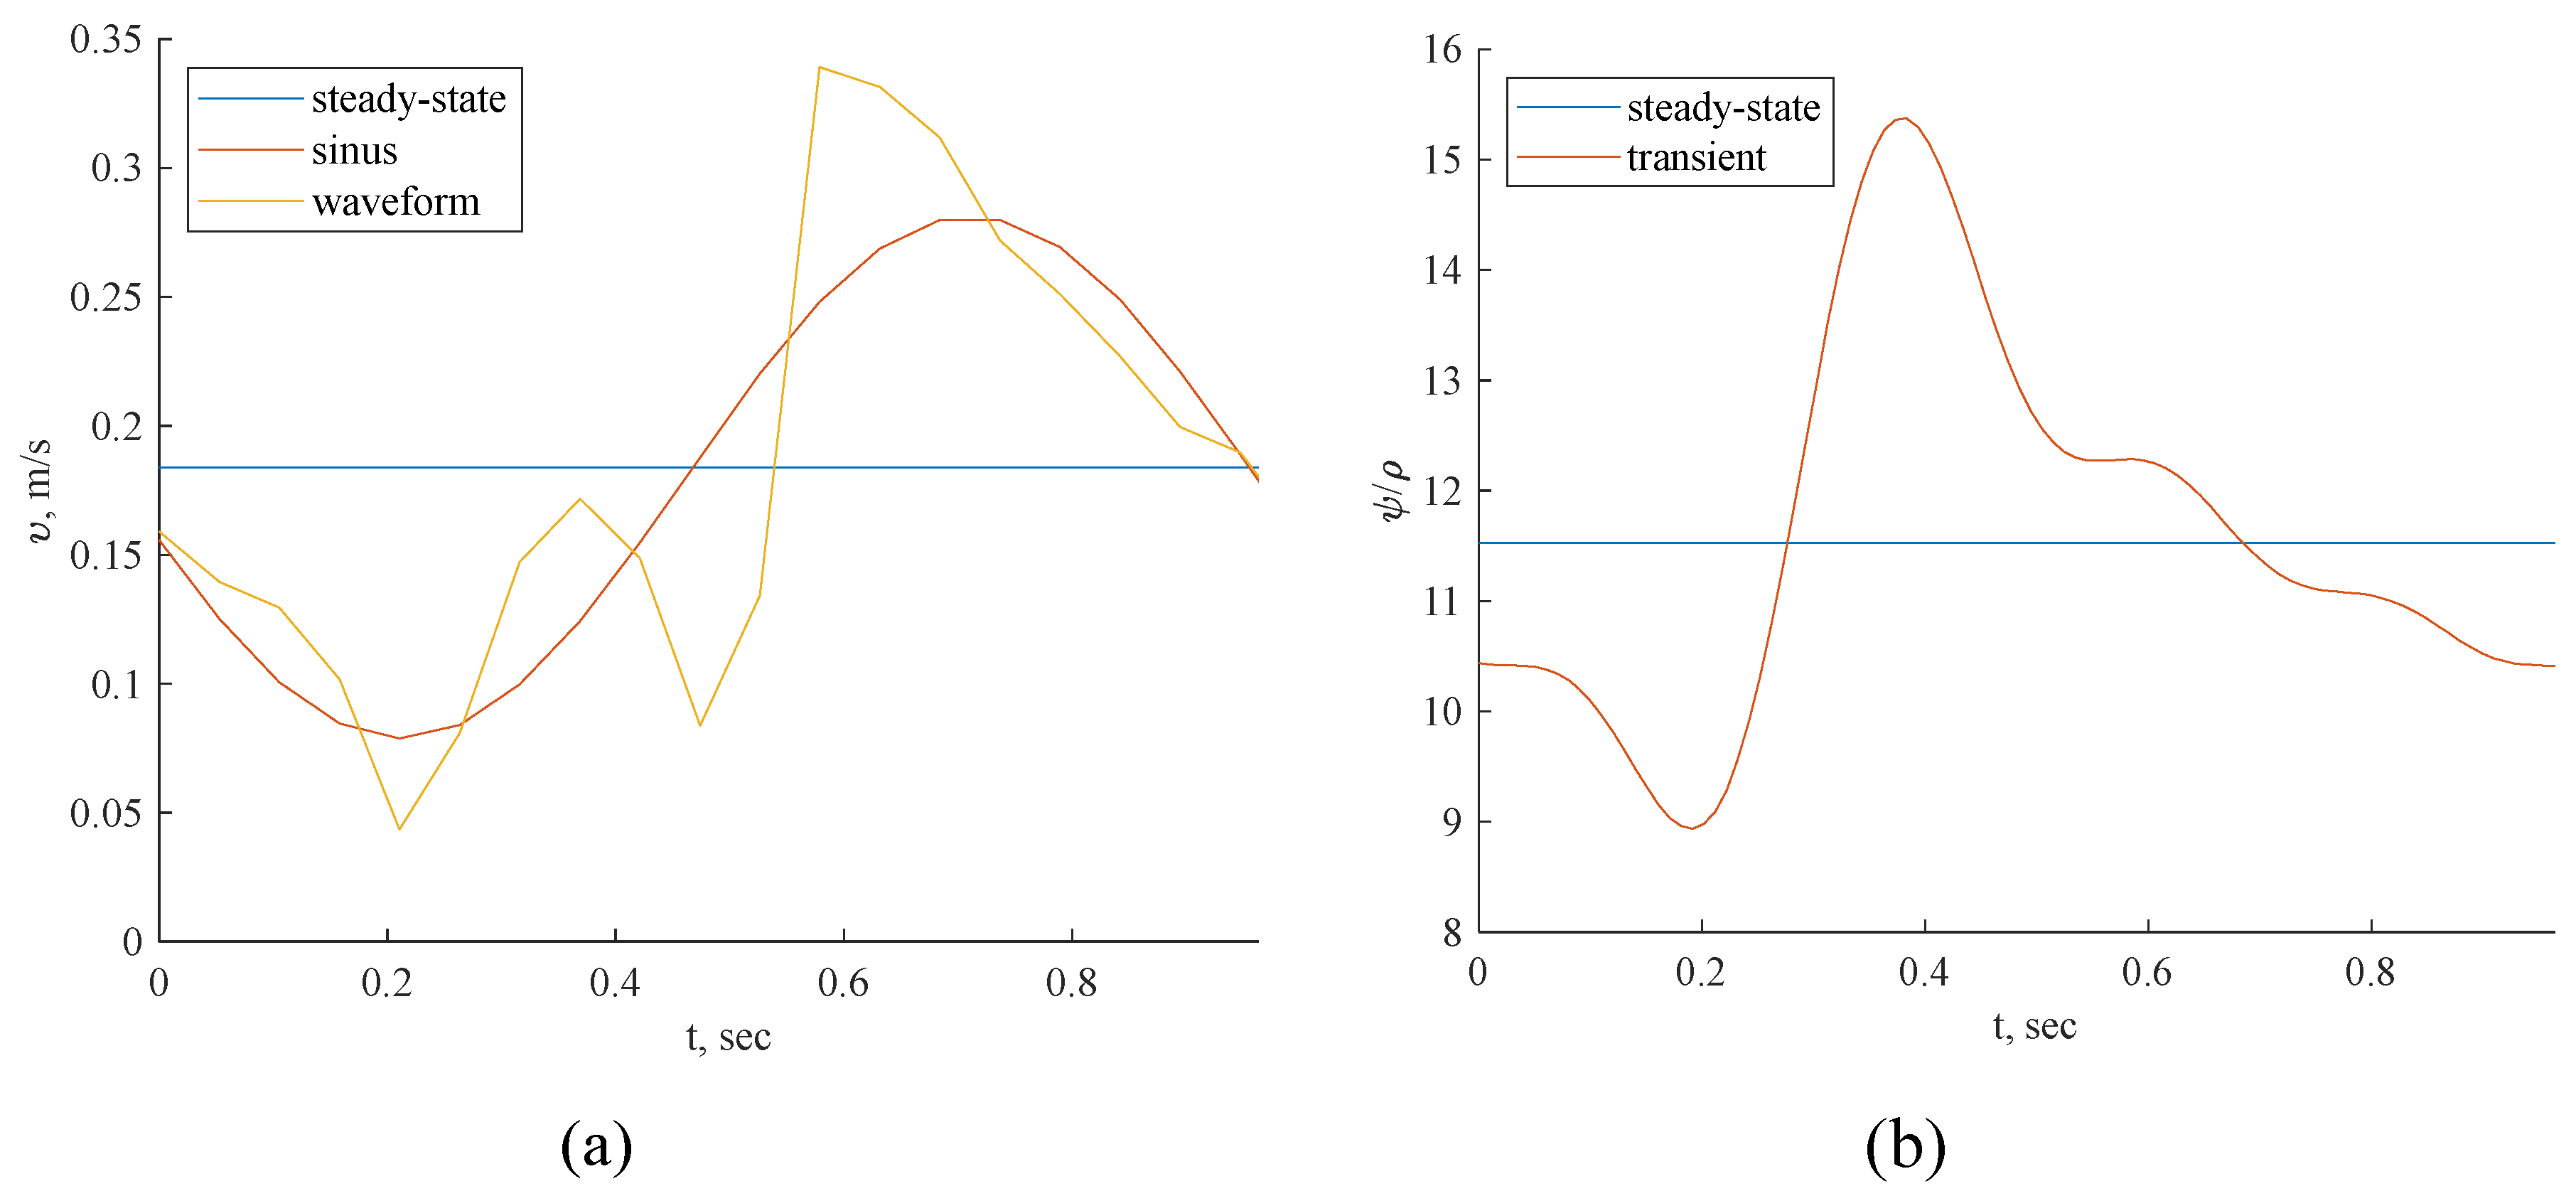
Figure 7 and
Figure 8, were the same as in the Stiehm et al. [
19] study. The FFR distribution along the profile of the FDA nozzle can be seen in
Figure 17, but we used the velocity results along the centerline for validation.
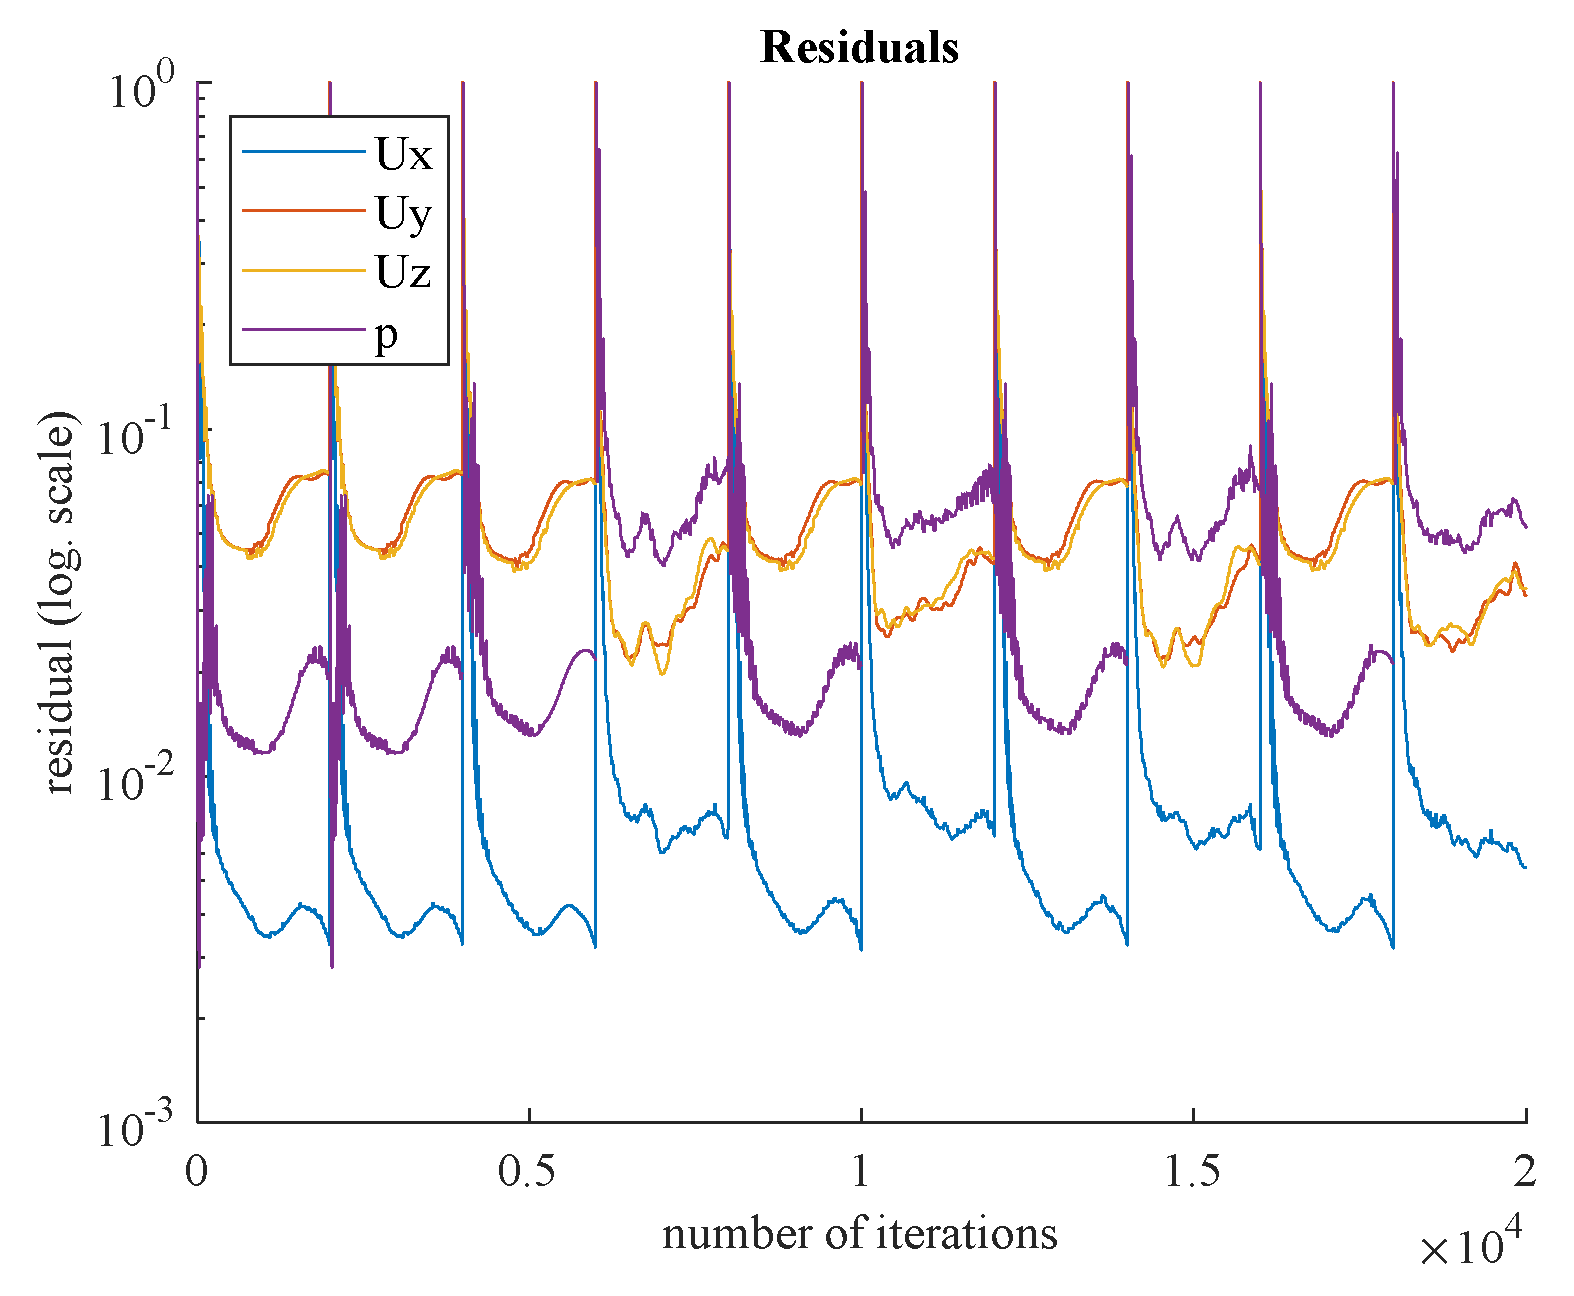
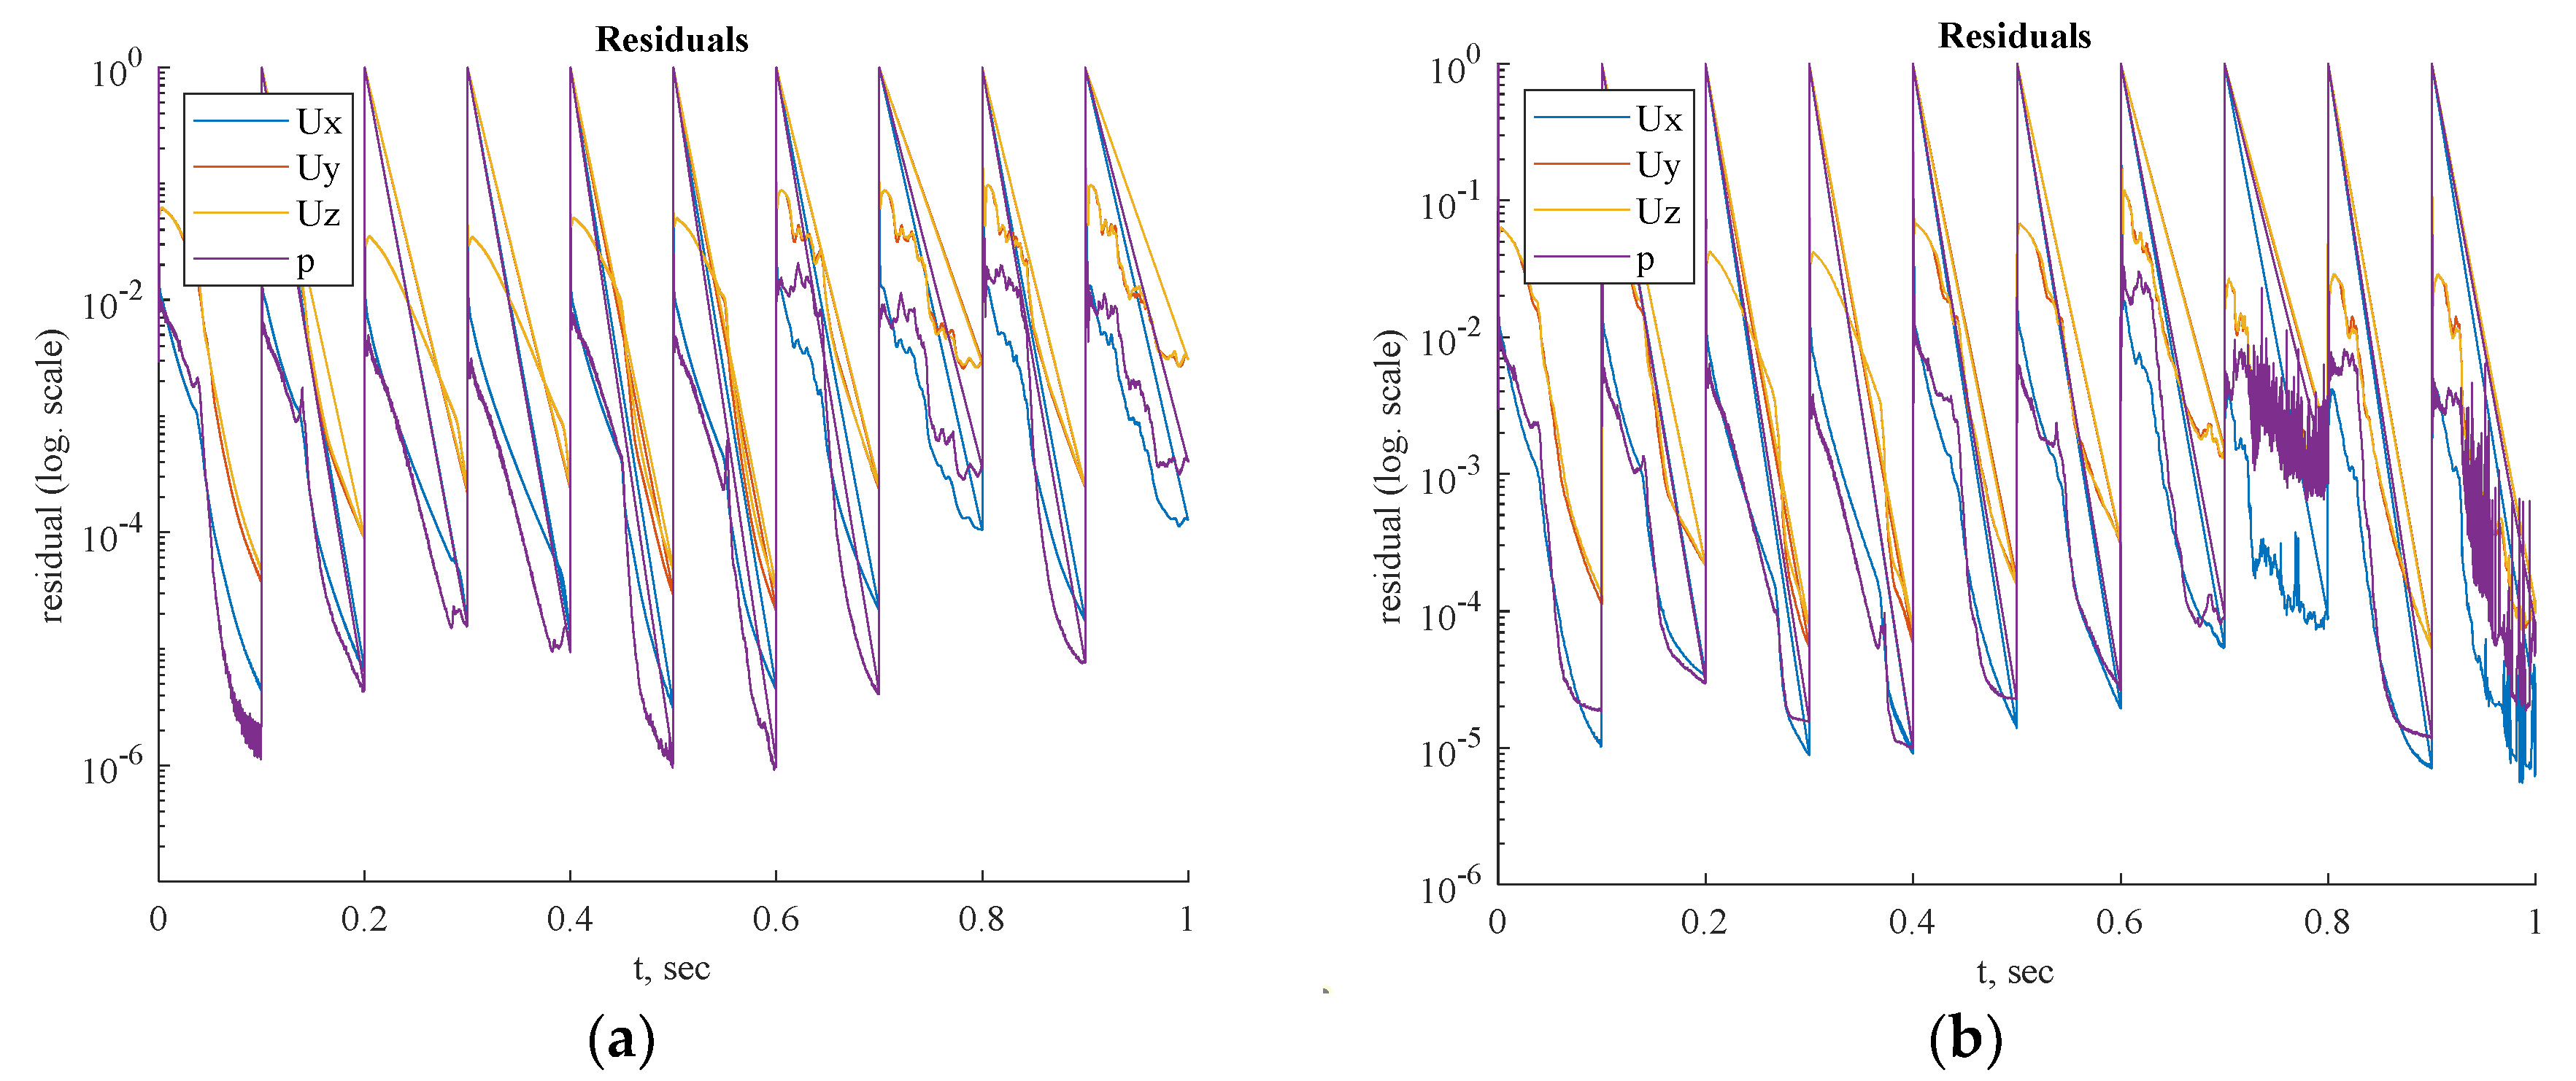
Residual values for steady-state and transient simulations are shown in
Figure 18 and
Figure 19, respectively. Based on the appropriate convergence of the residual values, the findings can be considered acceptable.
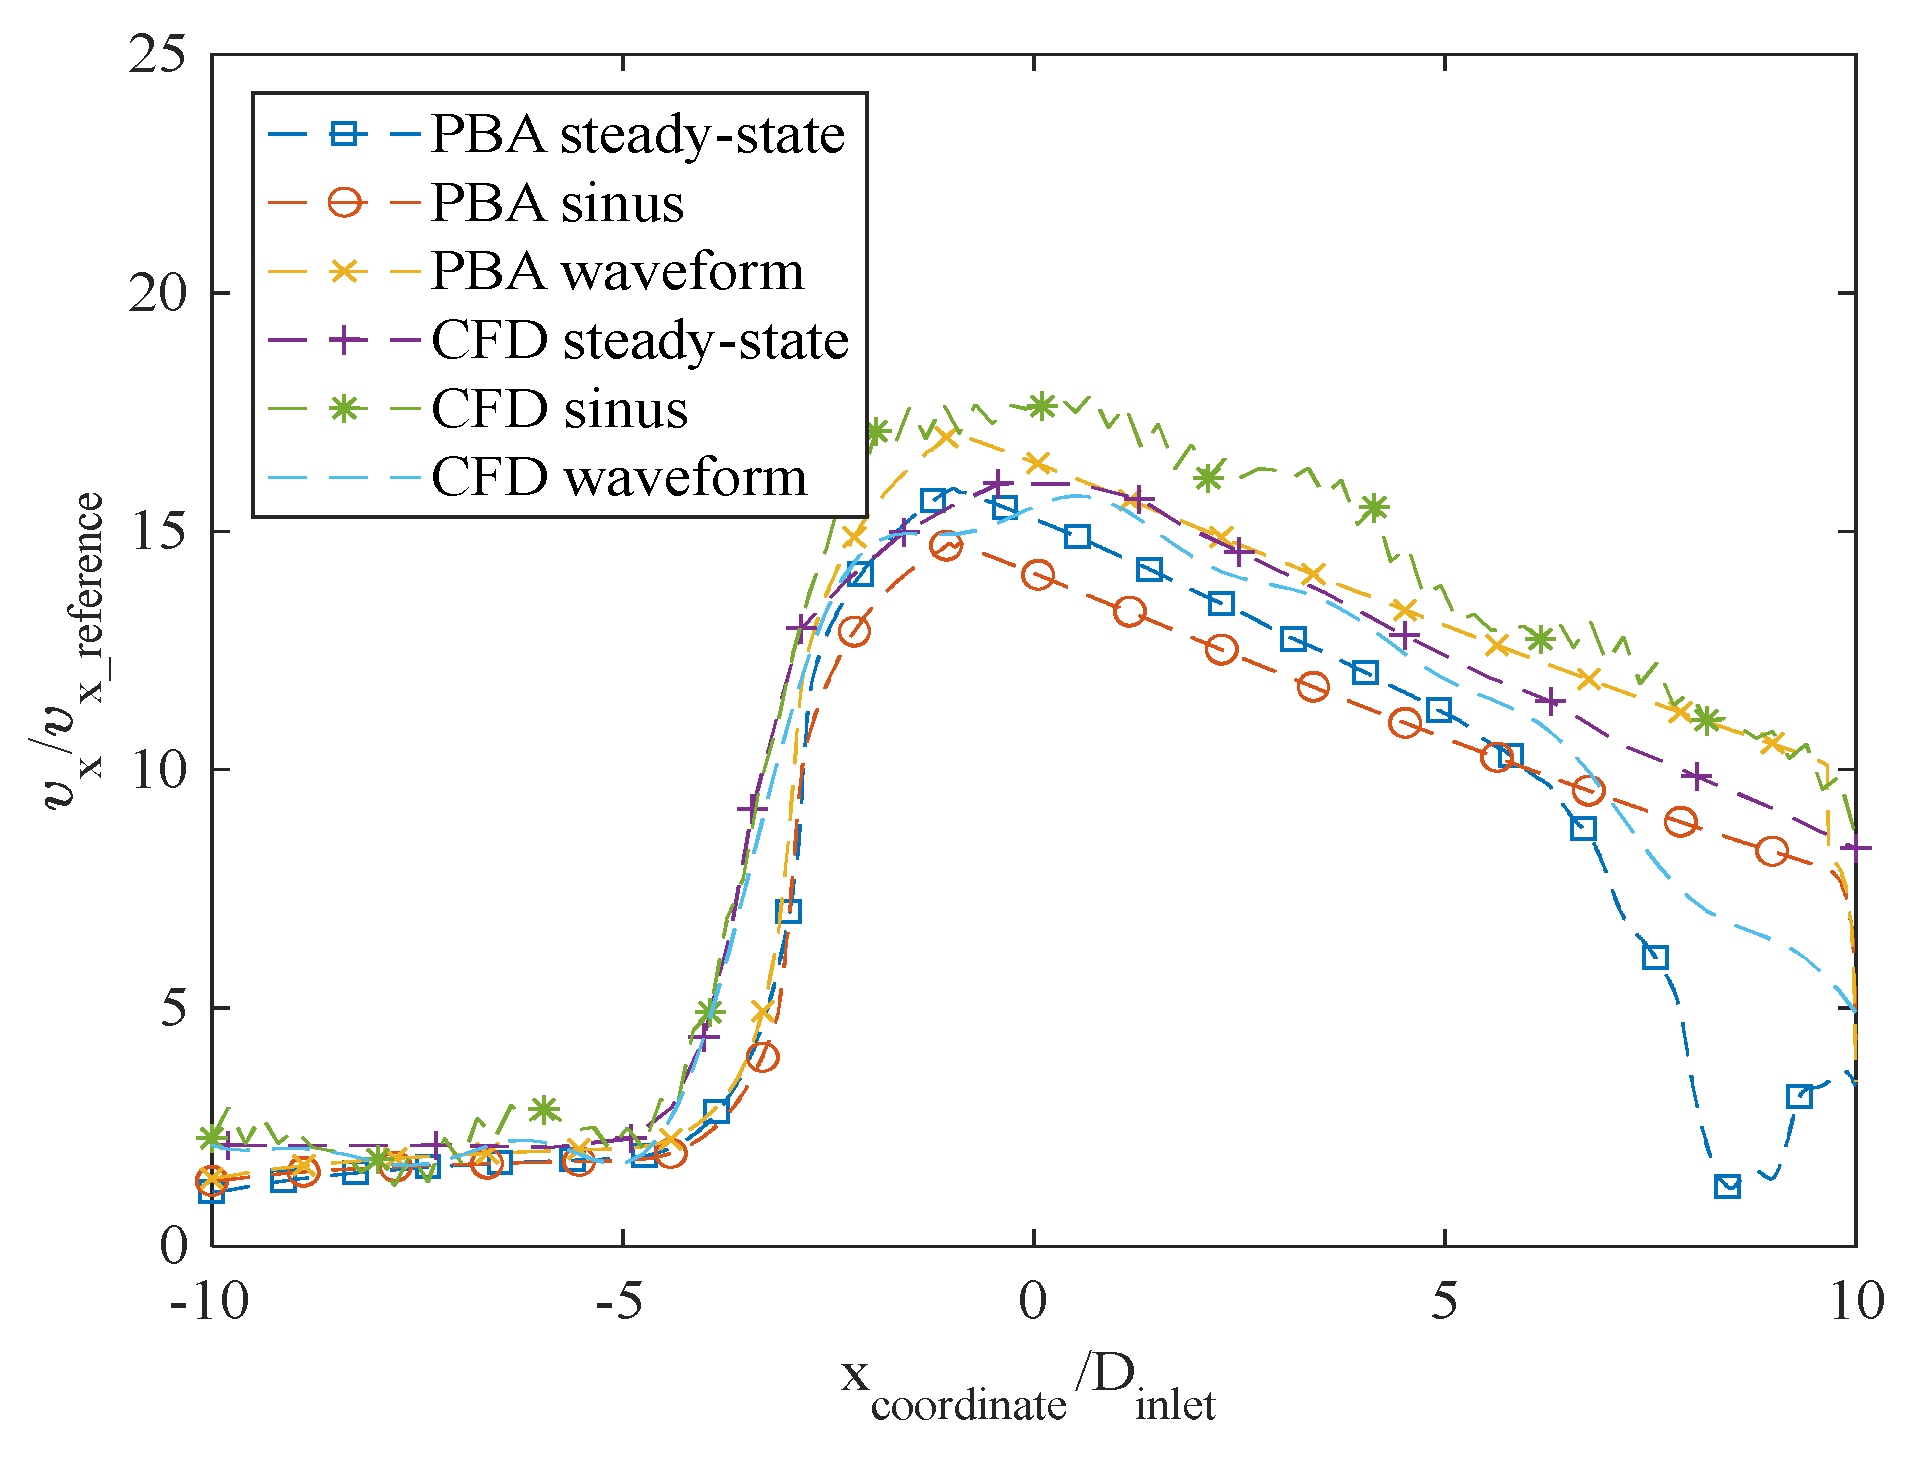
The axial velocity results for the CFD steady-state and CFDPBA databases for the idealized FDA nozzle match closely, as shown in
Figure 20. Additionally, the time-averaged axial velocity obtained from the transient CFD simulation with waveform inlet conditions agrees well with the steady-state PBA velocity data. However, there are minor differences downstream of the nozzle between 5D and 10D (
Figure 7). The inclusion of wave pressure in the PBA algorithm causes the PBA sinus and waveform deviation. Since the pressure is constant in the steady-state example, the findings are not affected, but the waveform pressure causes a slight fluctuation in the centerline velocity values.
4. Conclusions
In this work, a physiologically based algorithm (PBA) was proposed and implemented in the OpenFOAM CFD solver to simulate blood flow in three coronary artery tree models and the FDA nozzle model. The performance of the proposed PBA was assessed using OpenFOAM and other CFD solvers [
21]. The PBA, which is based on Murray's law and patient-specific conditions at the inlet, can accurately calculate the outlet boundary conditions iteratively, a task that is difficult for both traditional LPM methods and invasive measurement. The PBA was found to work well with all the CFD solvers, such as Simvascular and OpenFOAM, and it can accurately predict FFR values in the cases tested. The results of the PBA were also compared with the LPM method, which was performed in ANSYS CFX [
21]. The FFR values obtained from simulations using the suggested PBA are in excellent agreement with experimental ICA measurements. Unlike traditional methods, the PBA always guarantees quick convergence in steady-state cases to an accurate solution for every situation. Because it is significantly more accessible and effective than the conventional Windkessel circuit analogy technique, this noninvasive FFR estimate using the PBA is a potential strategy for patient-specific detection of coronary stenosis. Our study further suggests that the suggested PBA, combined with an effective CFD solver, can be used as a low-cost, effective, and precise tool for diagnosing CAD. In individual patients, the PBA method has the potential to replace the expensive and risky invasive coronary angiography (ICA) procedure. Future research on pulsatile flows in CATs with fluid-structure interaction using the PBA is suggested.
We also used a nozzle model in this work that is based on the FDA’s benchmark geometry. By comparing the estimated axial velocity profile to CFD and CFDPBA data provided by the FDA, normalized fluid mechanical quantities can be used to further validate the method and its results.
Finally, two different transient CFD simulations were performed utilizing a sinus inlet condition and a physiological waveform. We conclude that if only time-averaged results are examined, steady-state simulations are appropriate for hemodynamic studies. This approach may reduce the need for computing resources in further hemodynamic studies.
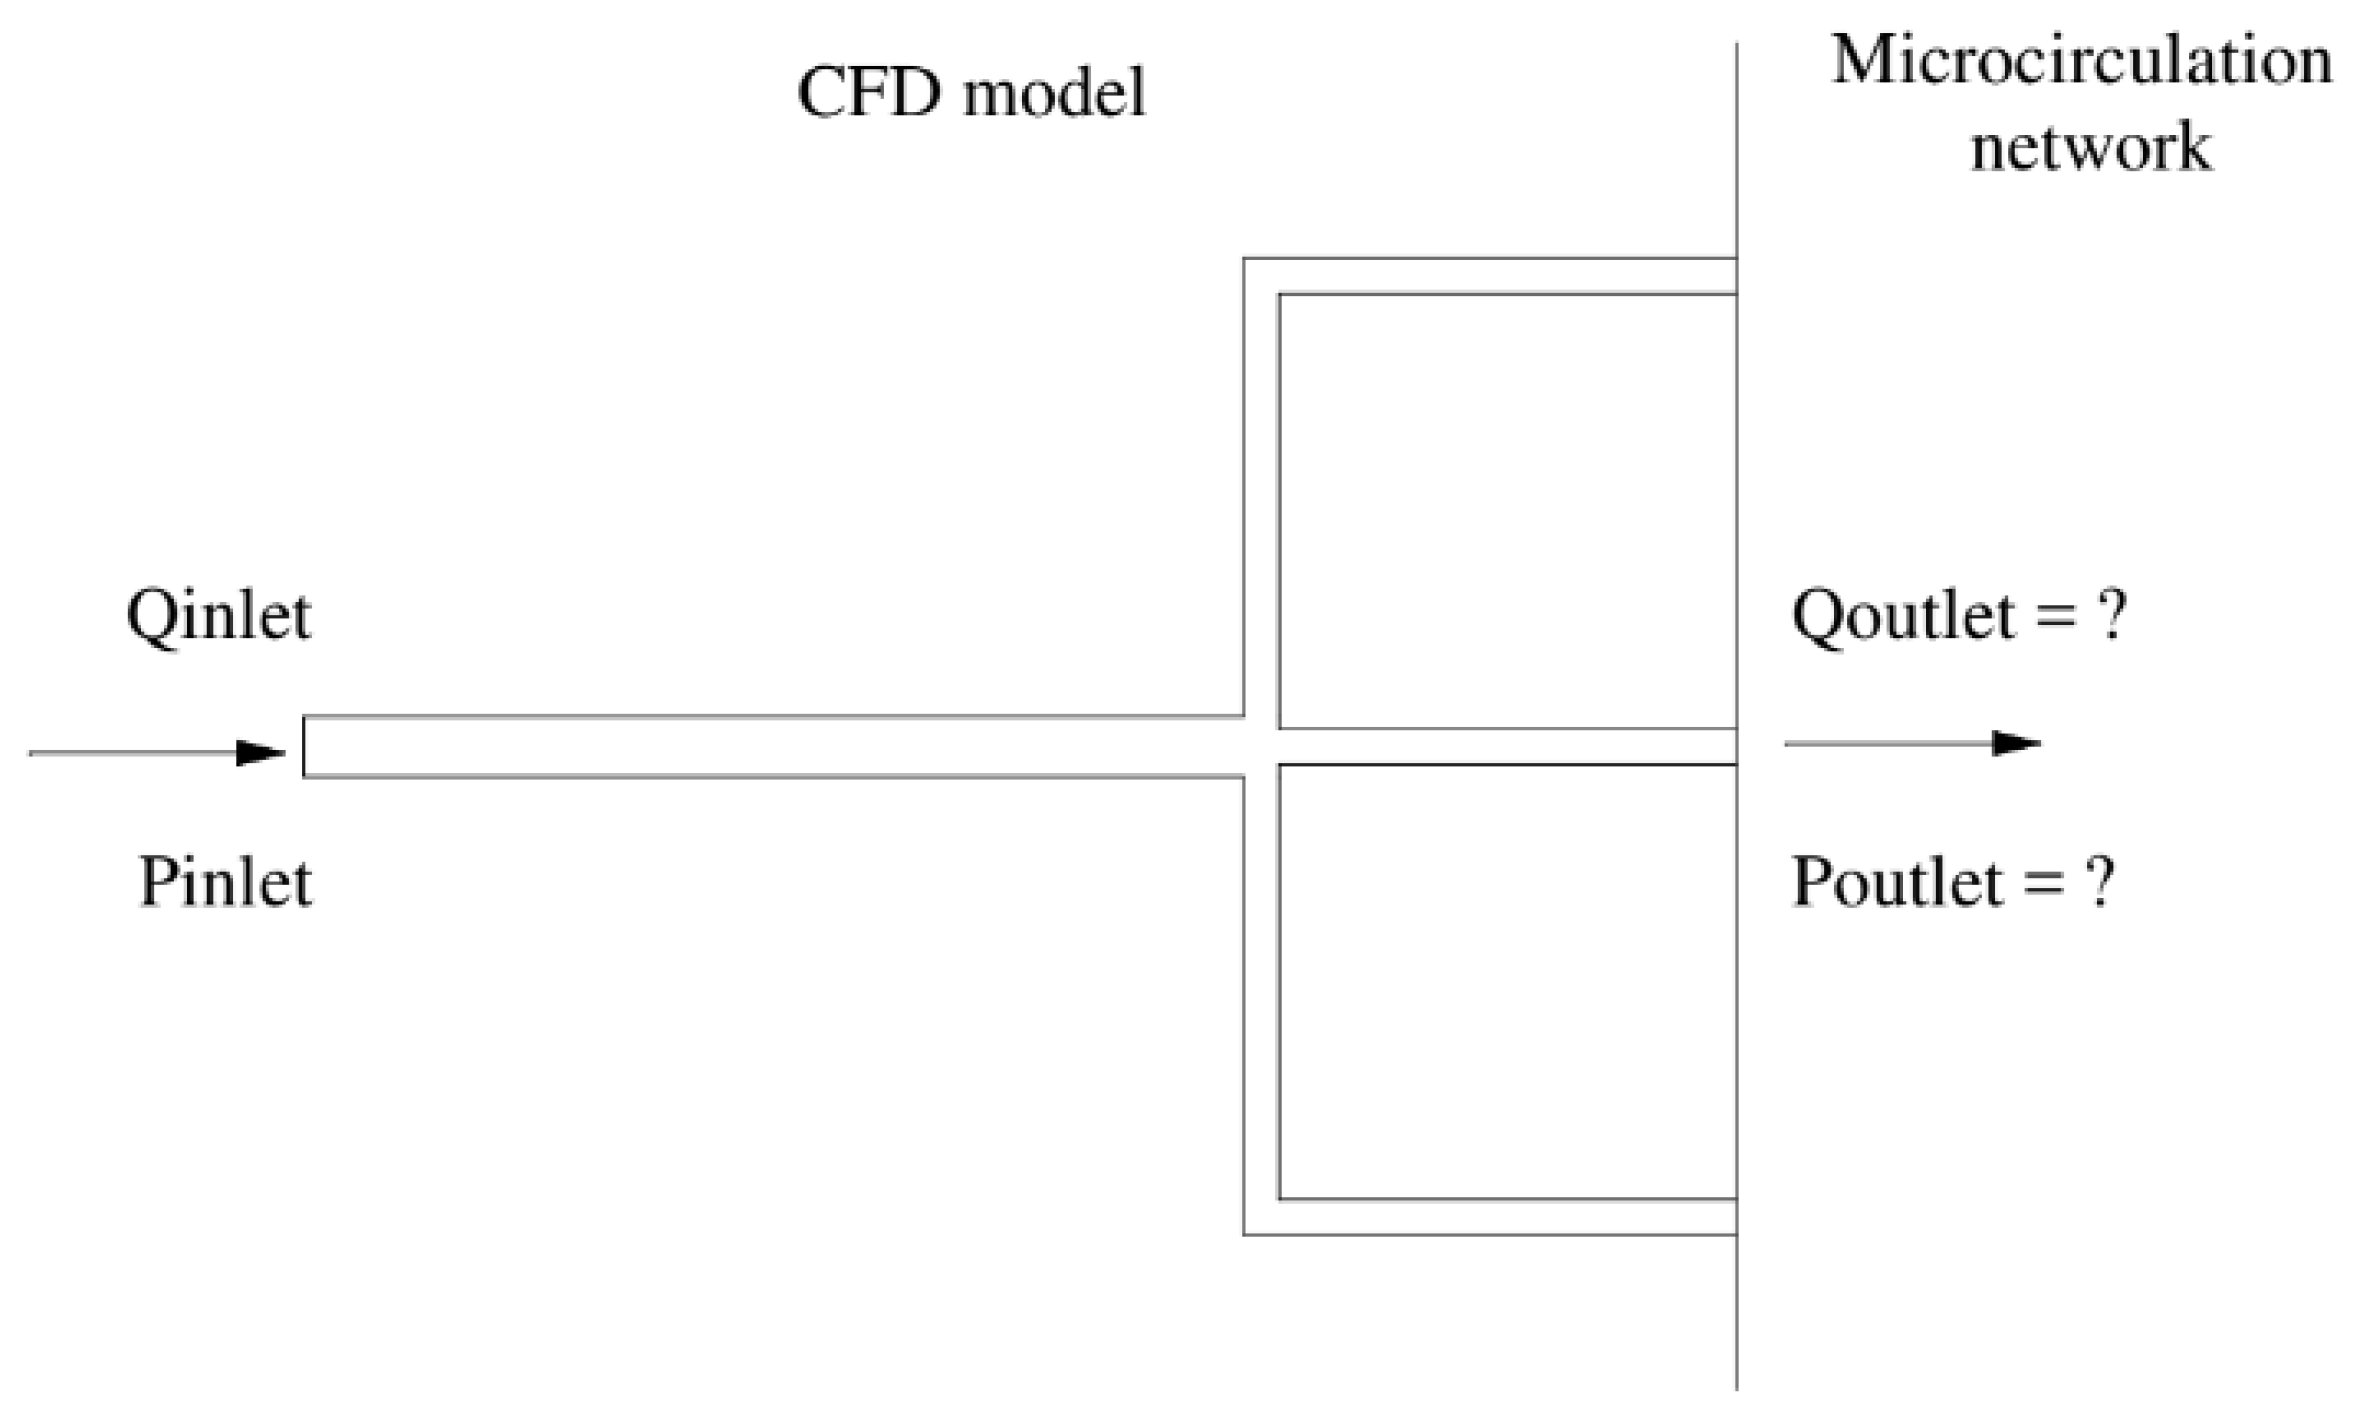
Figure 1.
Schematic of the new boundary model.
Figure 1.
Schematic of the new boundary model.
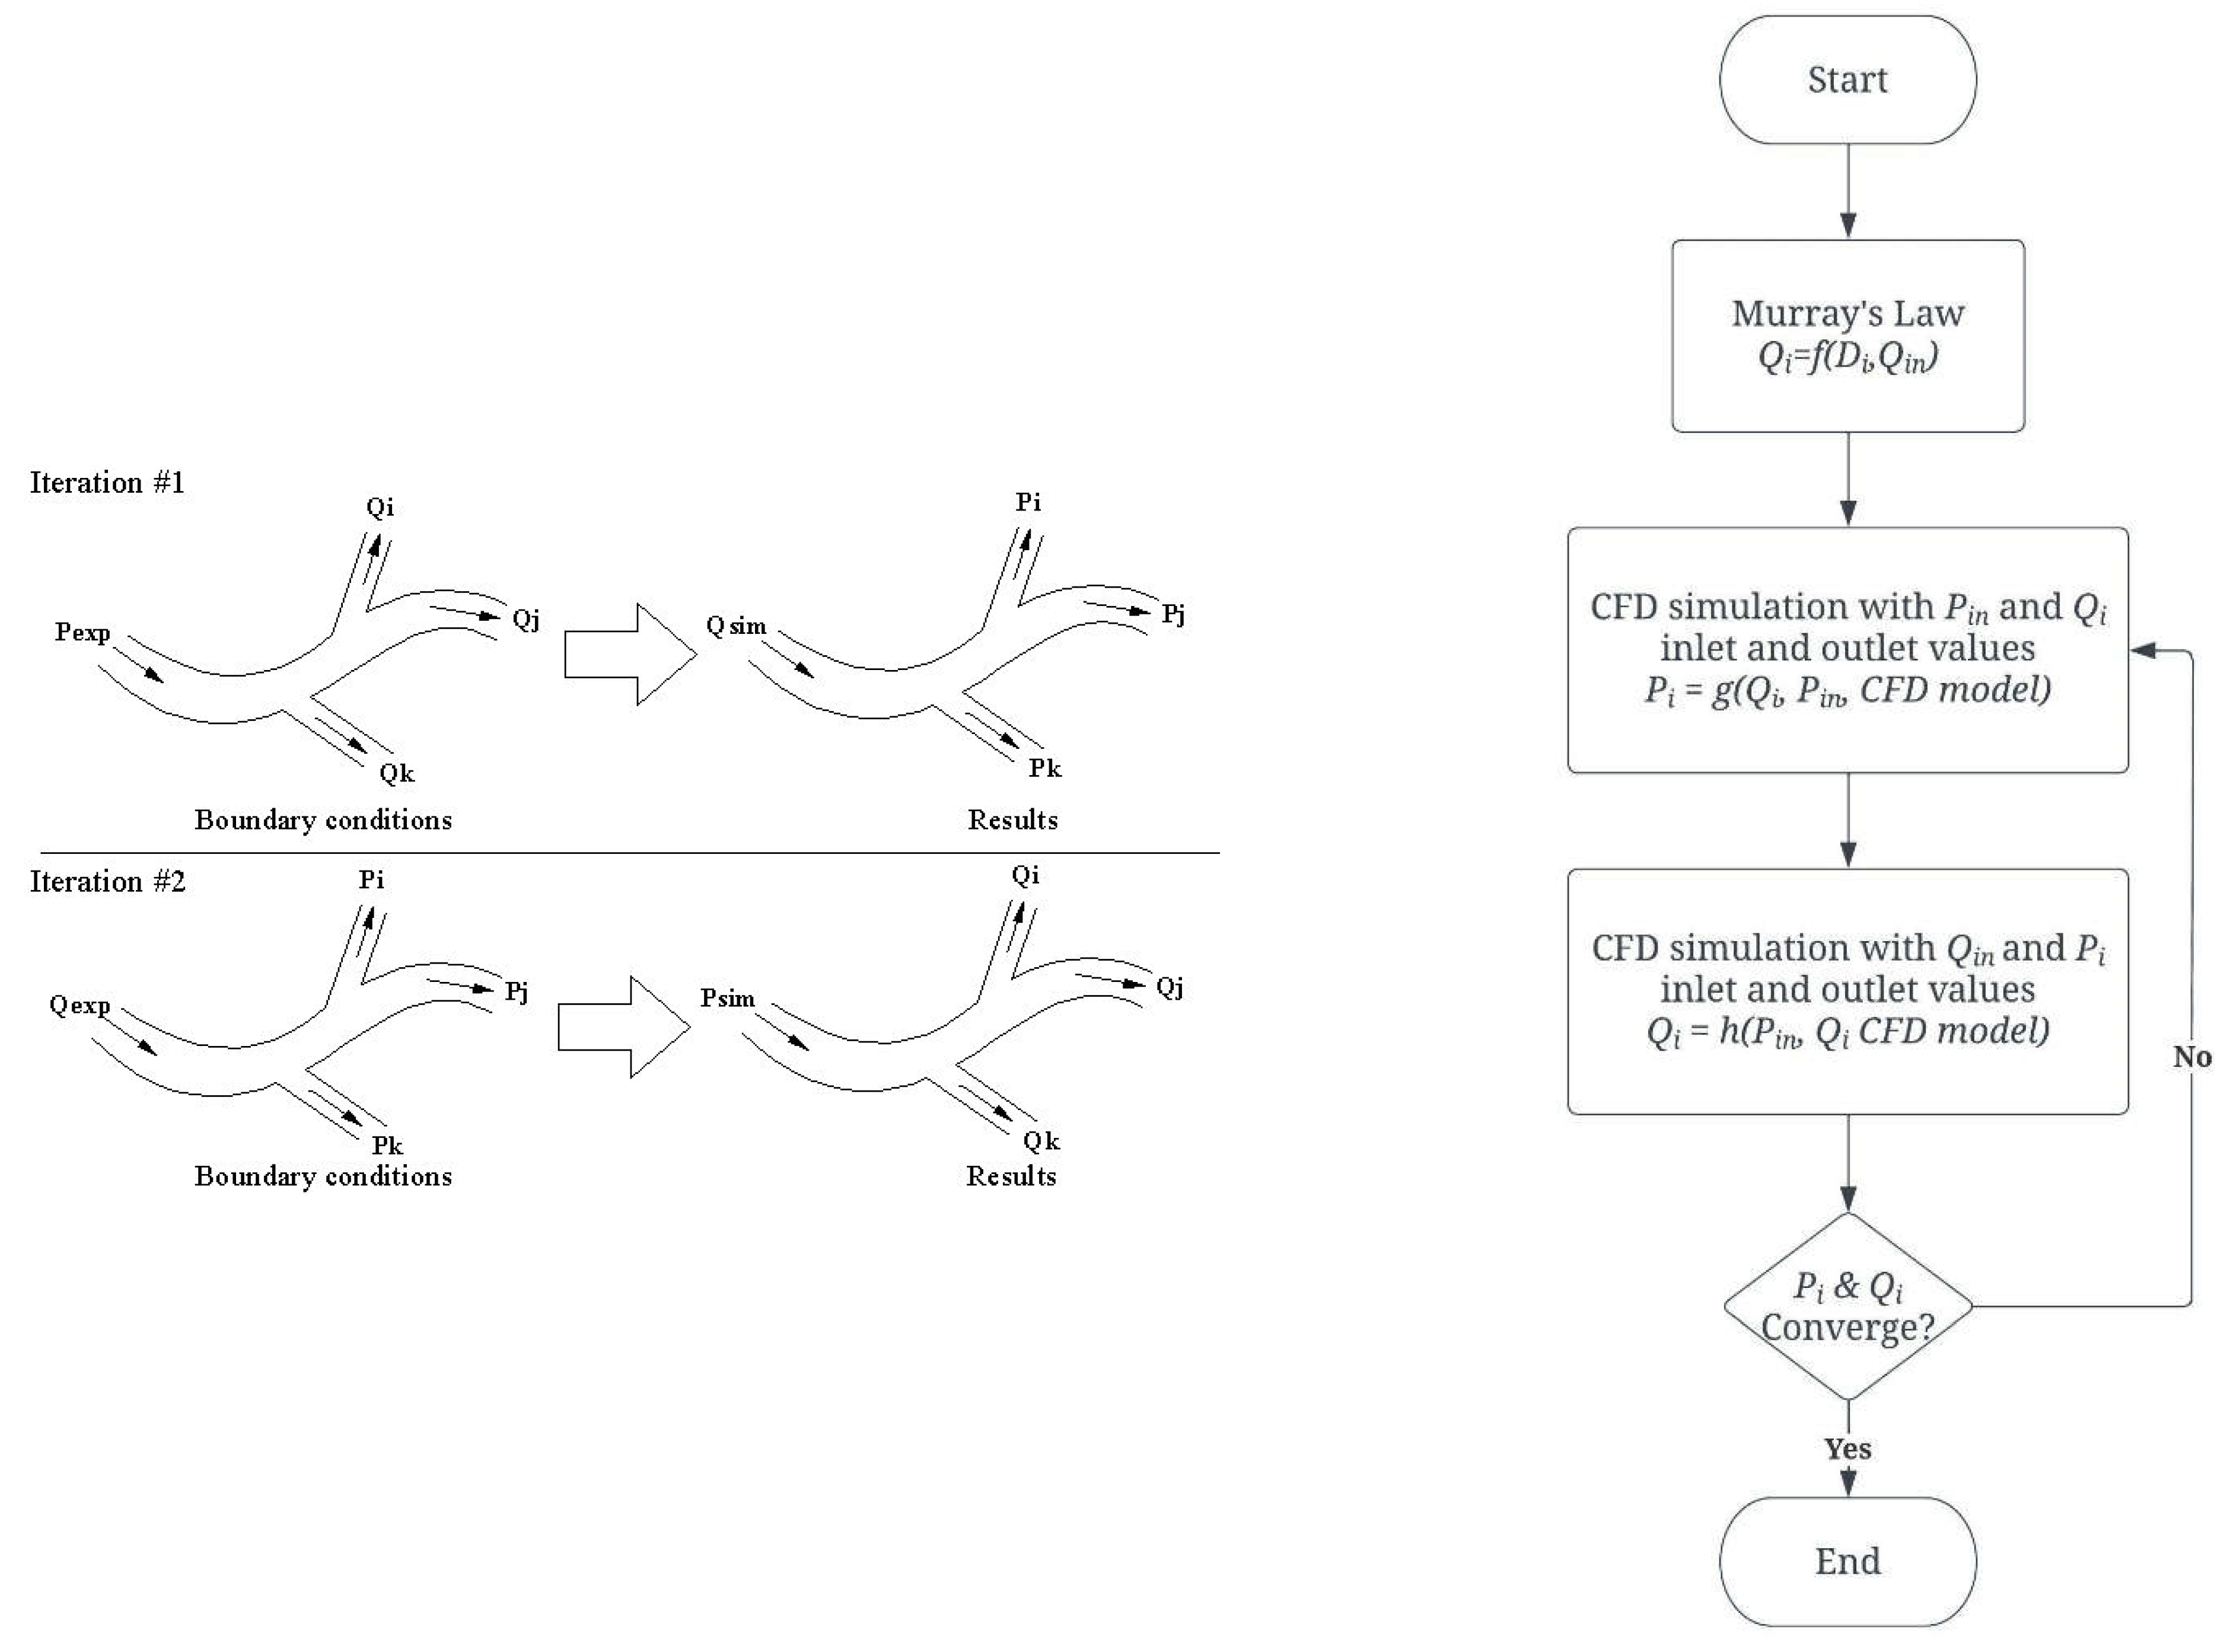
Figure 2.
Algorithm for the outflow boundary conditions.
Figure 2.
Algorithm for the outflow boundary conditions.
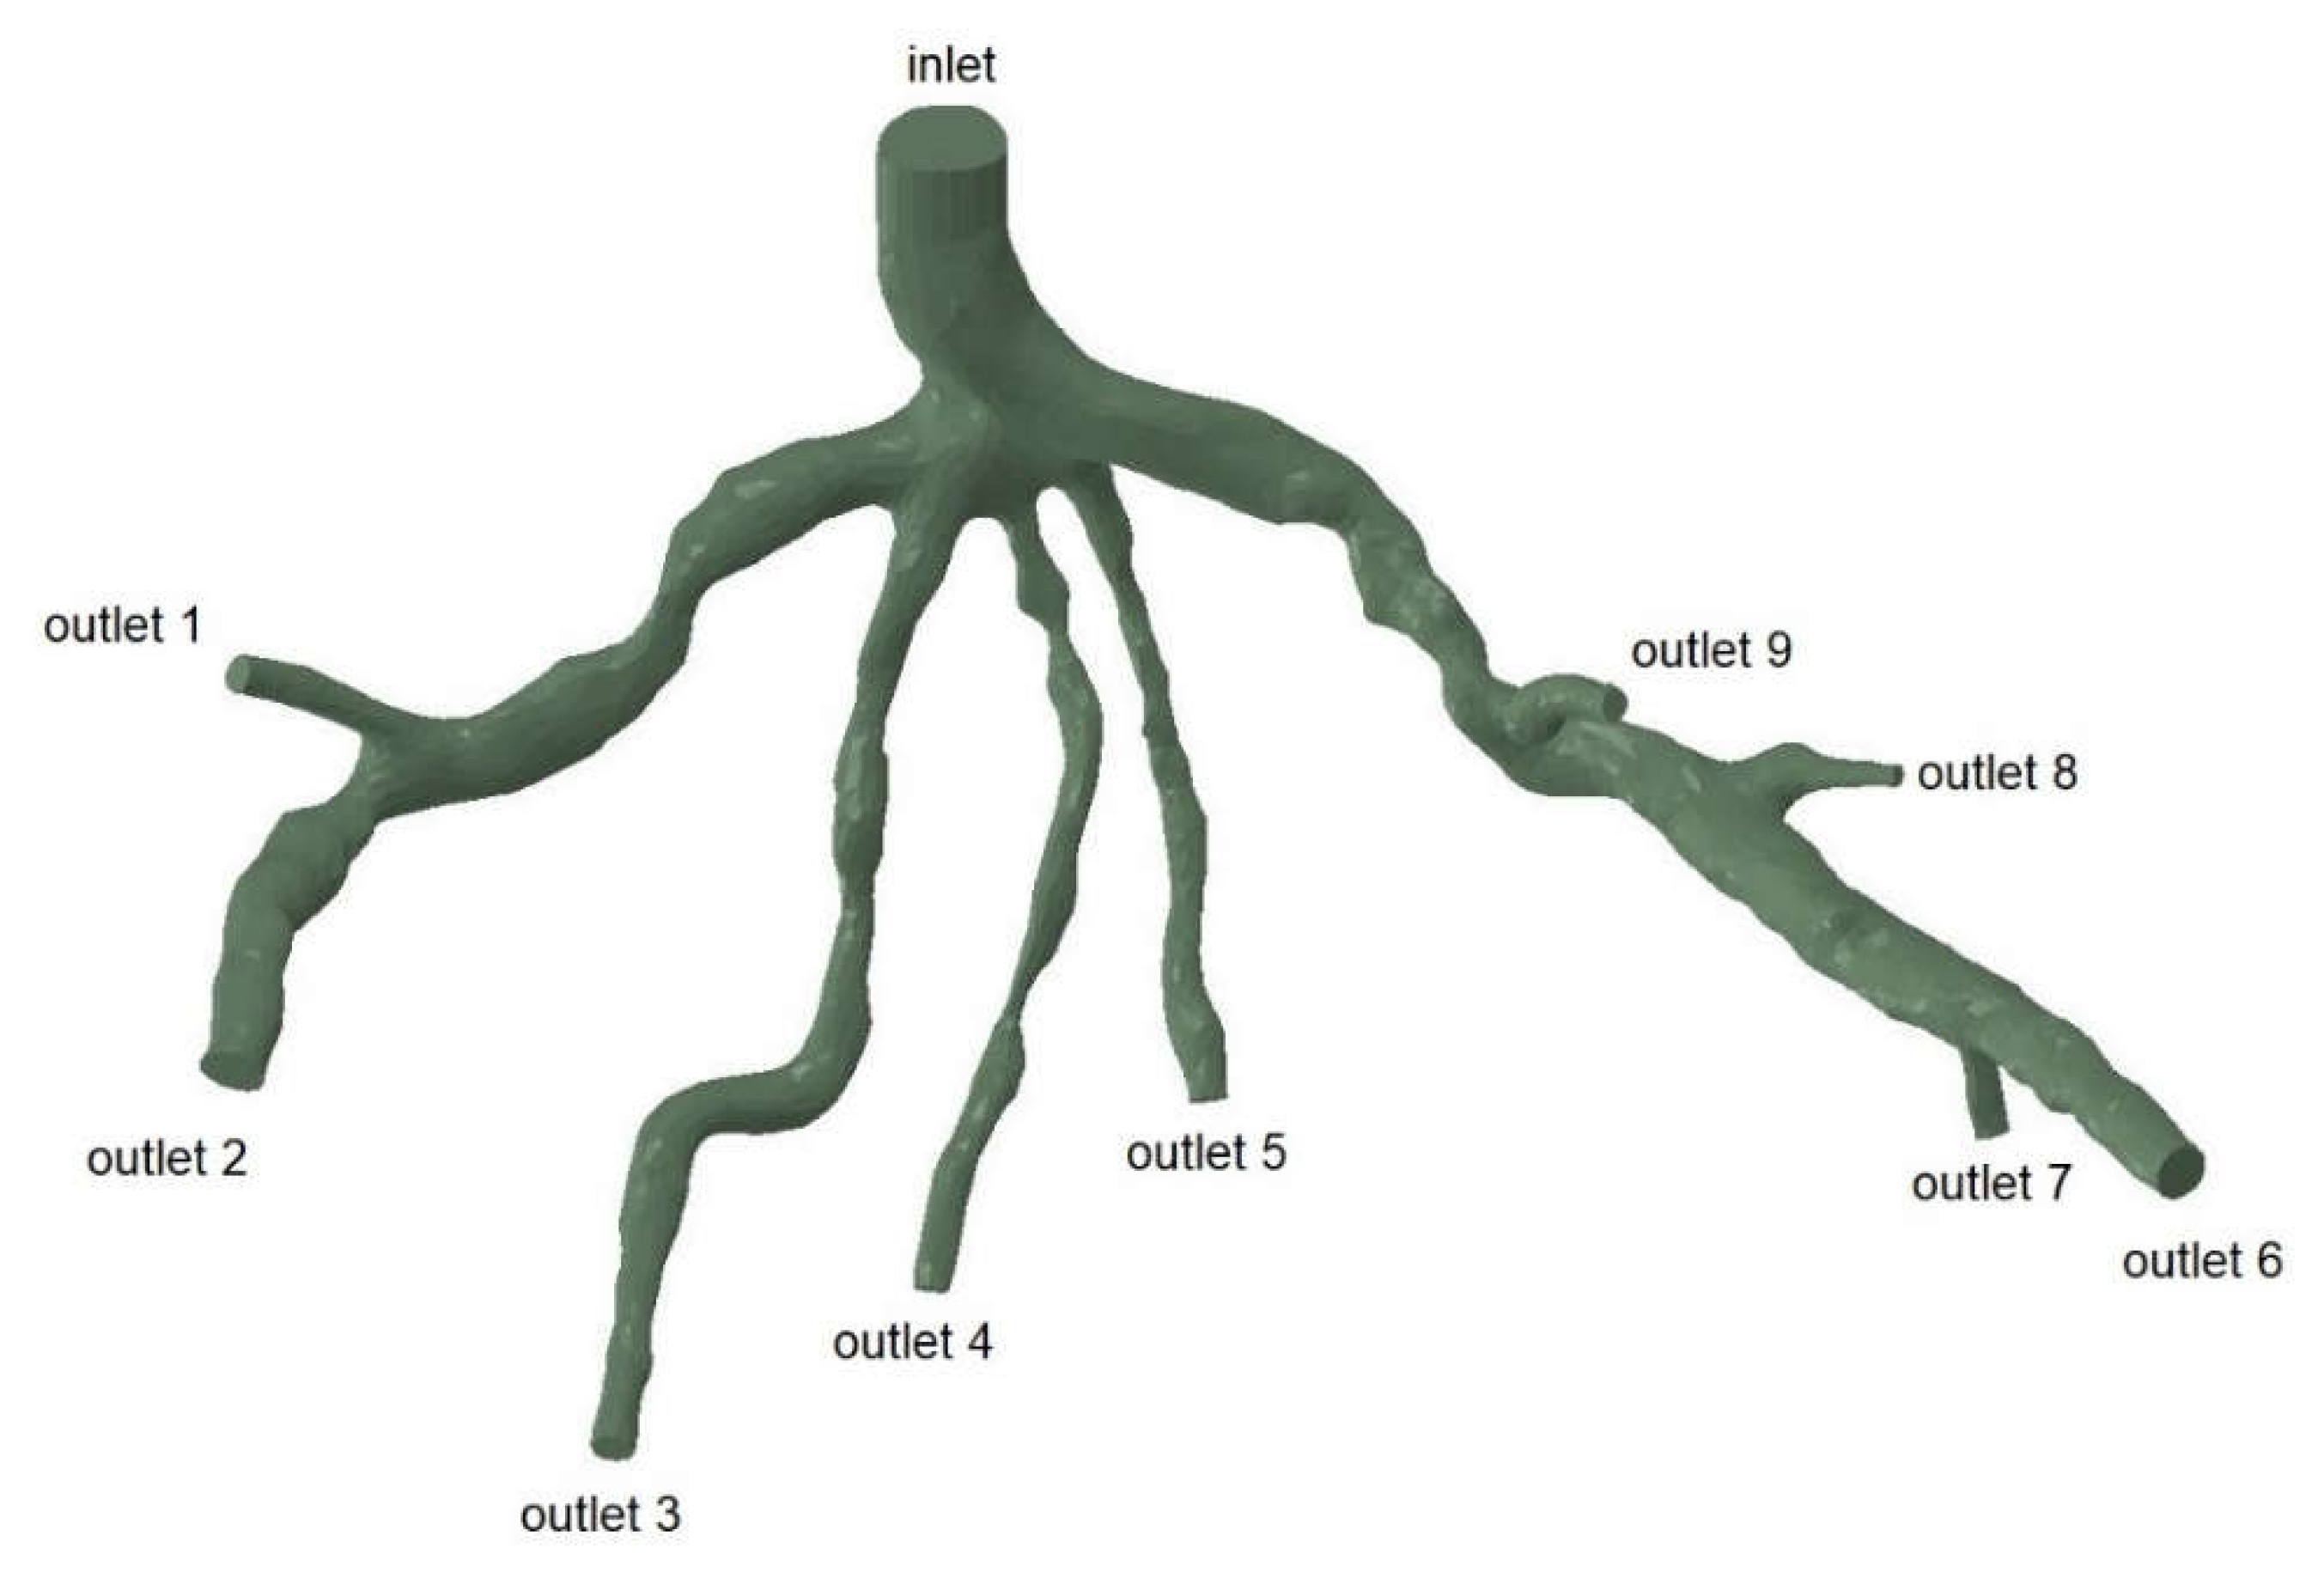
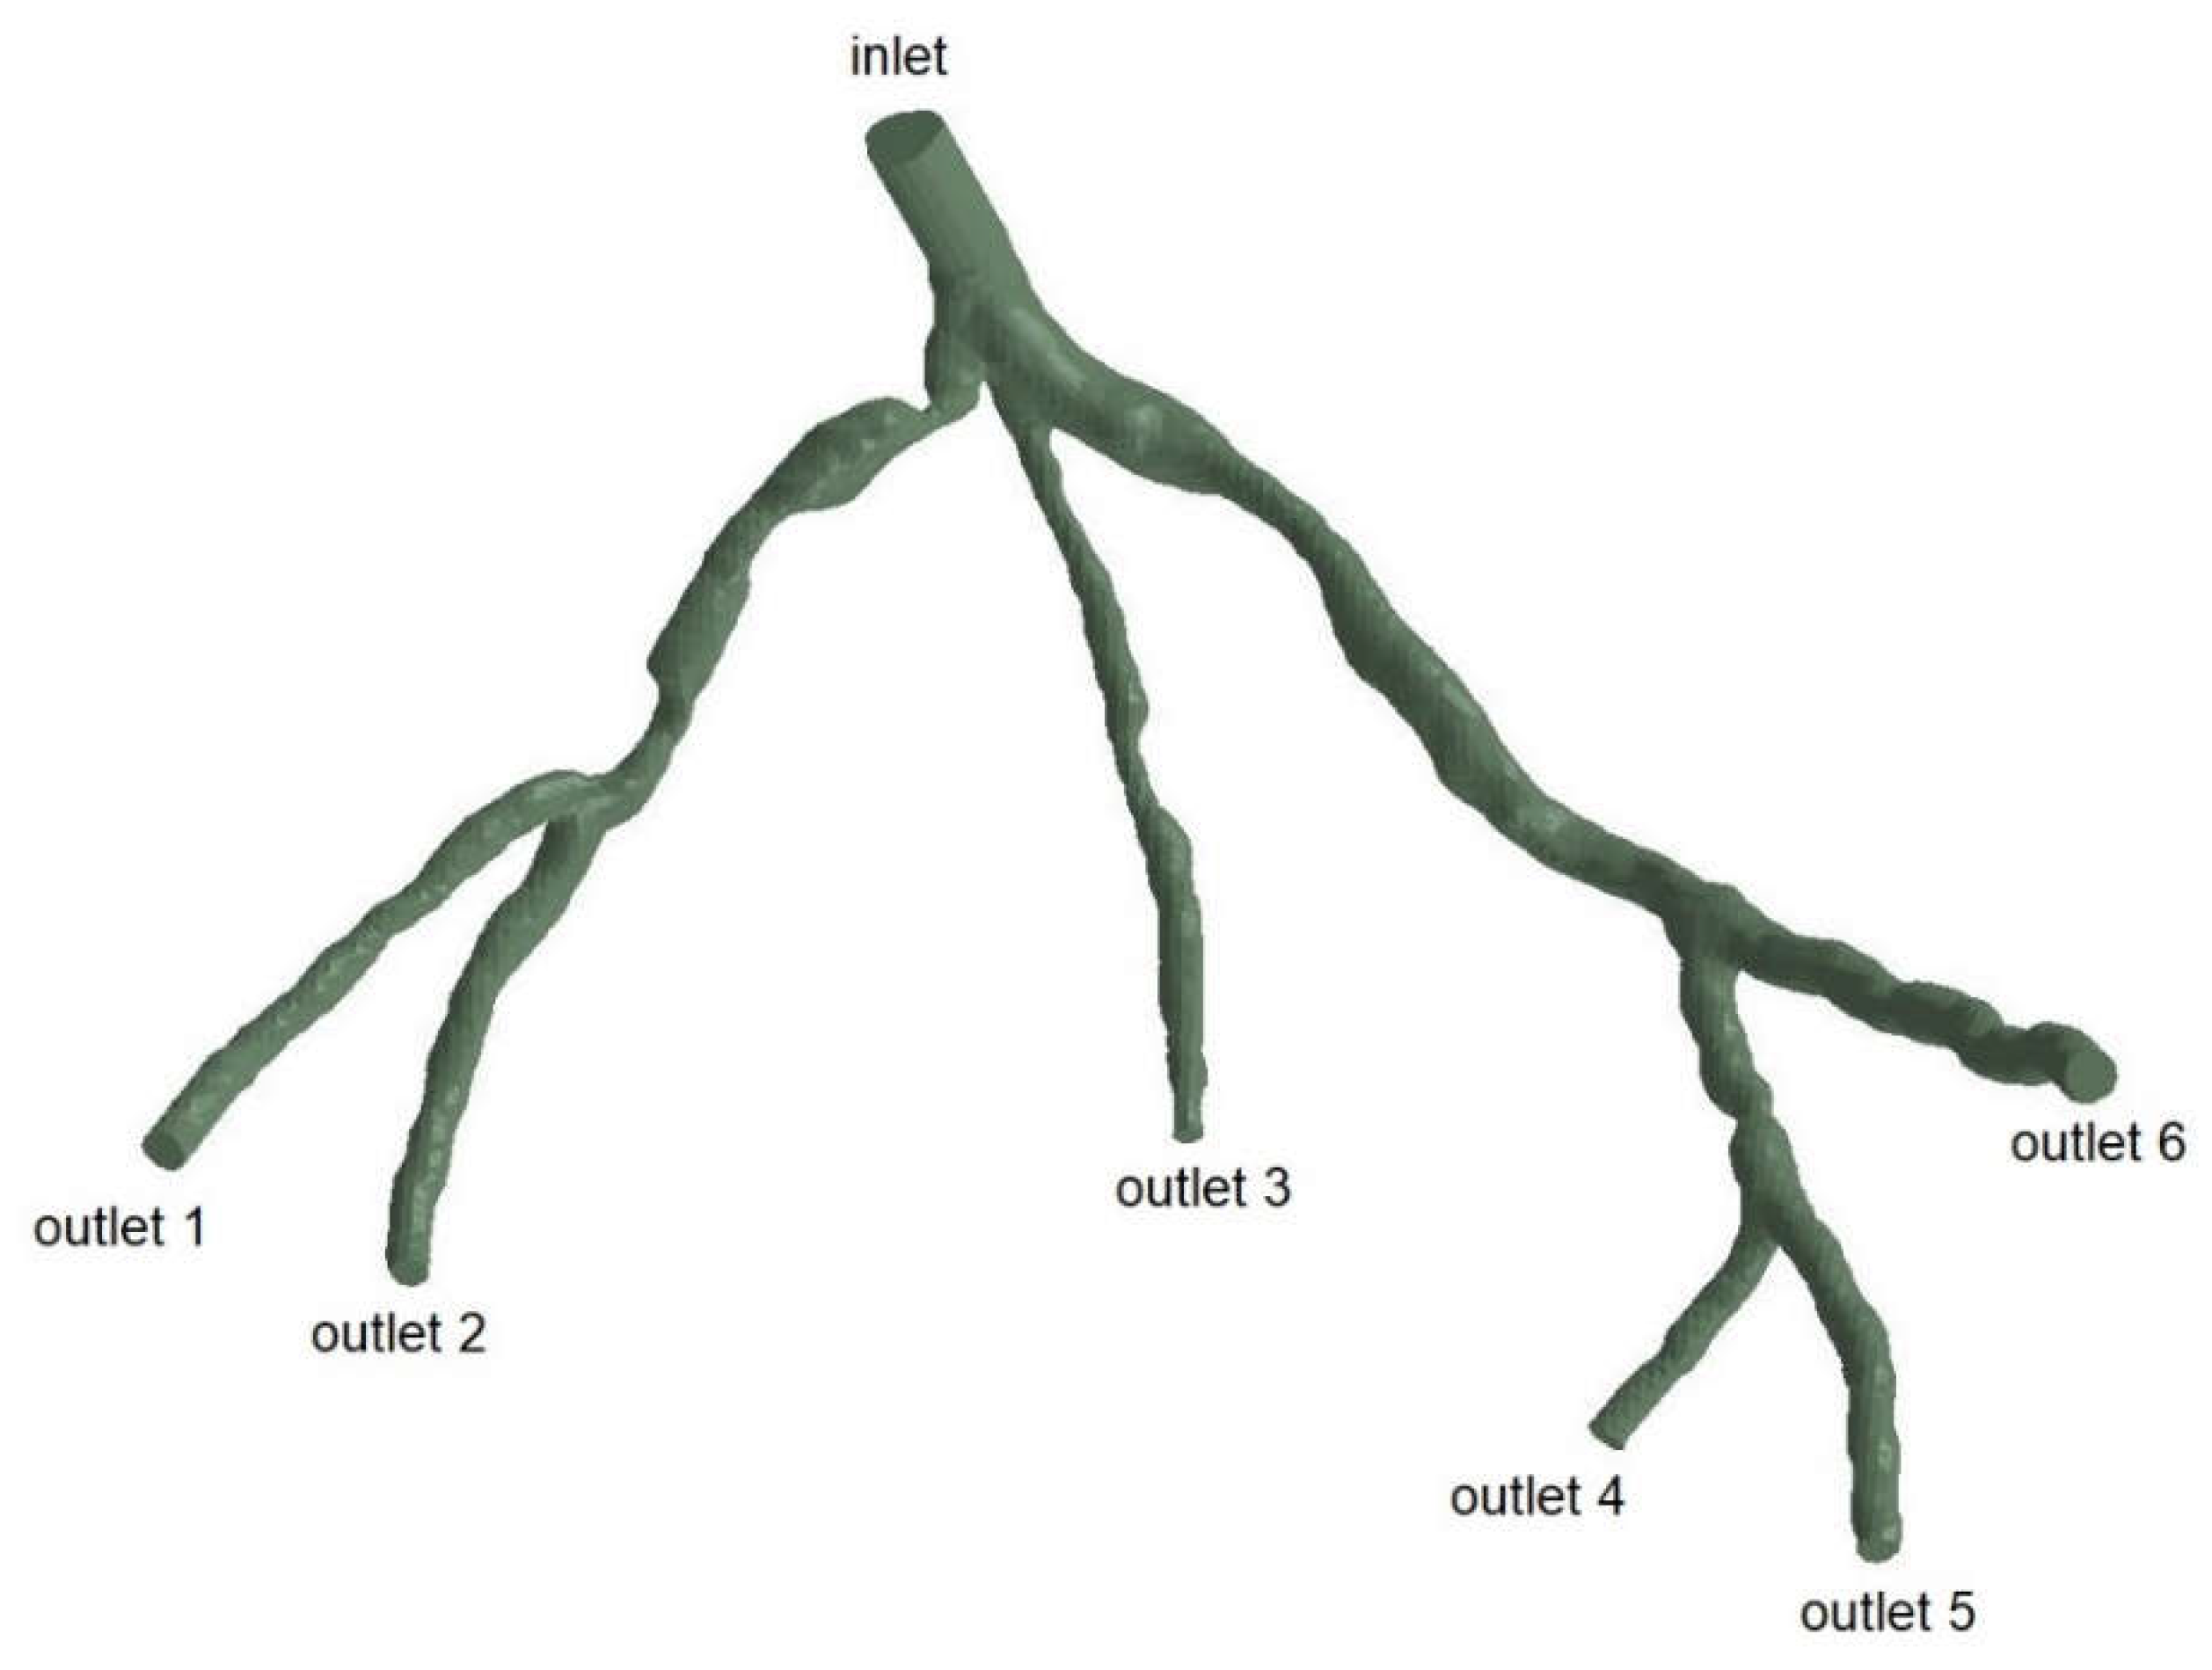
Figure 3.
Geometry and Inlet/Outlets of the CT209 model.
Figure 3.
Geometry and Inlet/Outlets of the CT209 model.
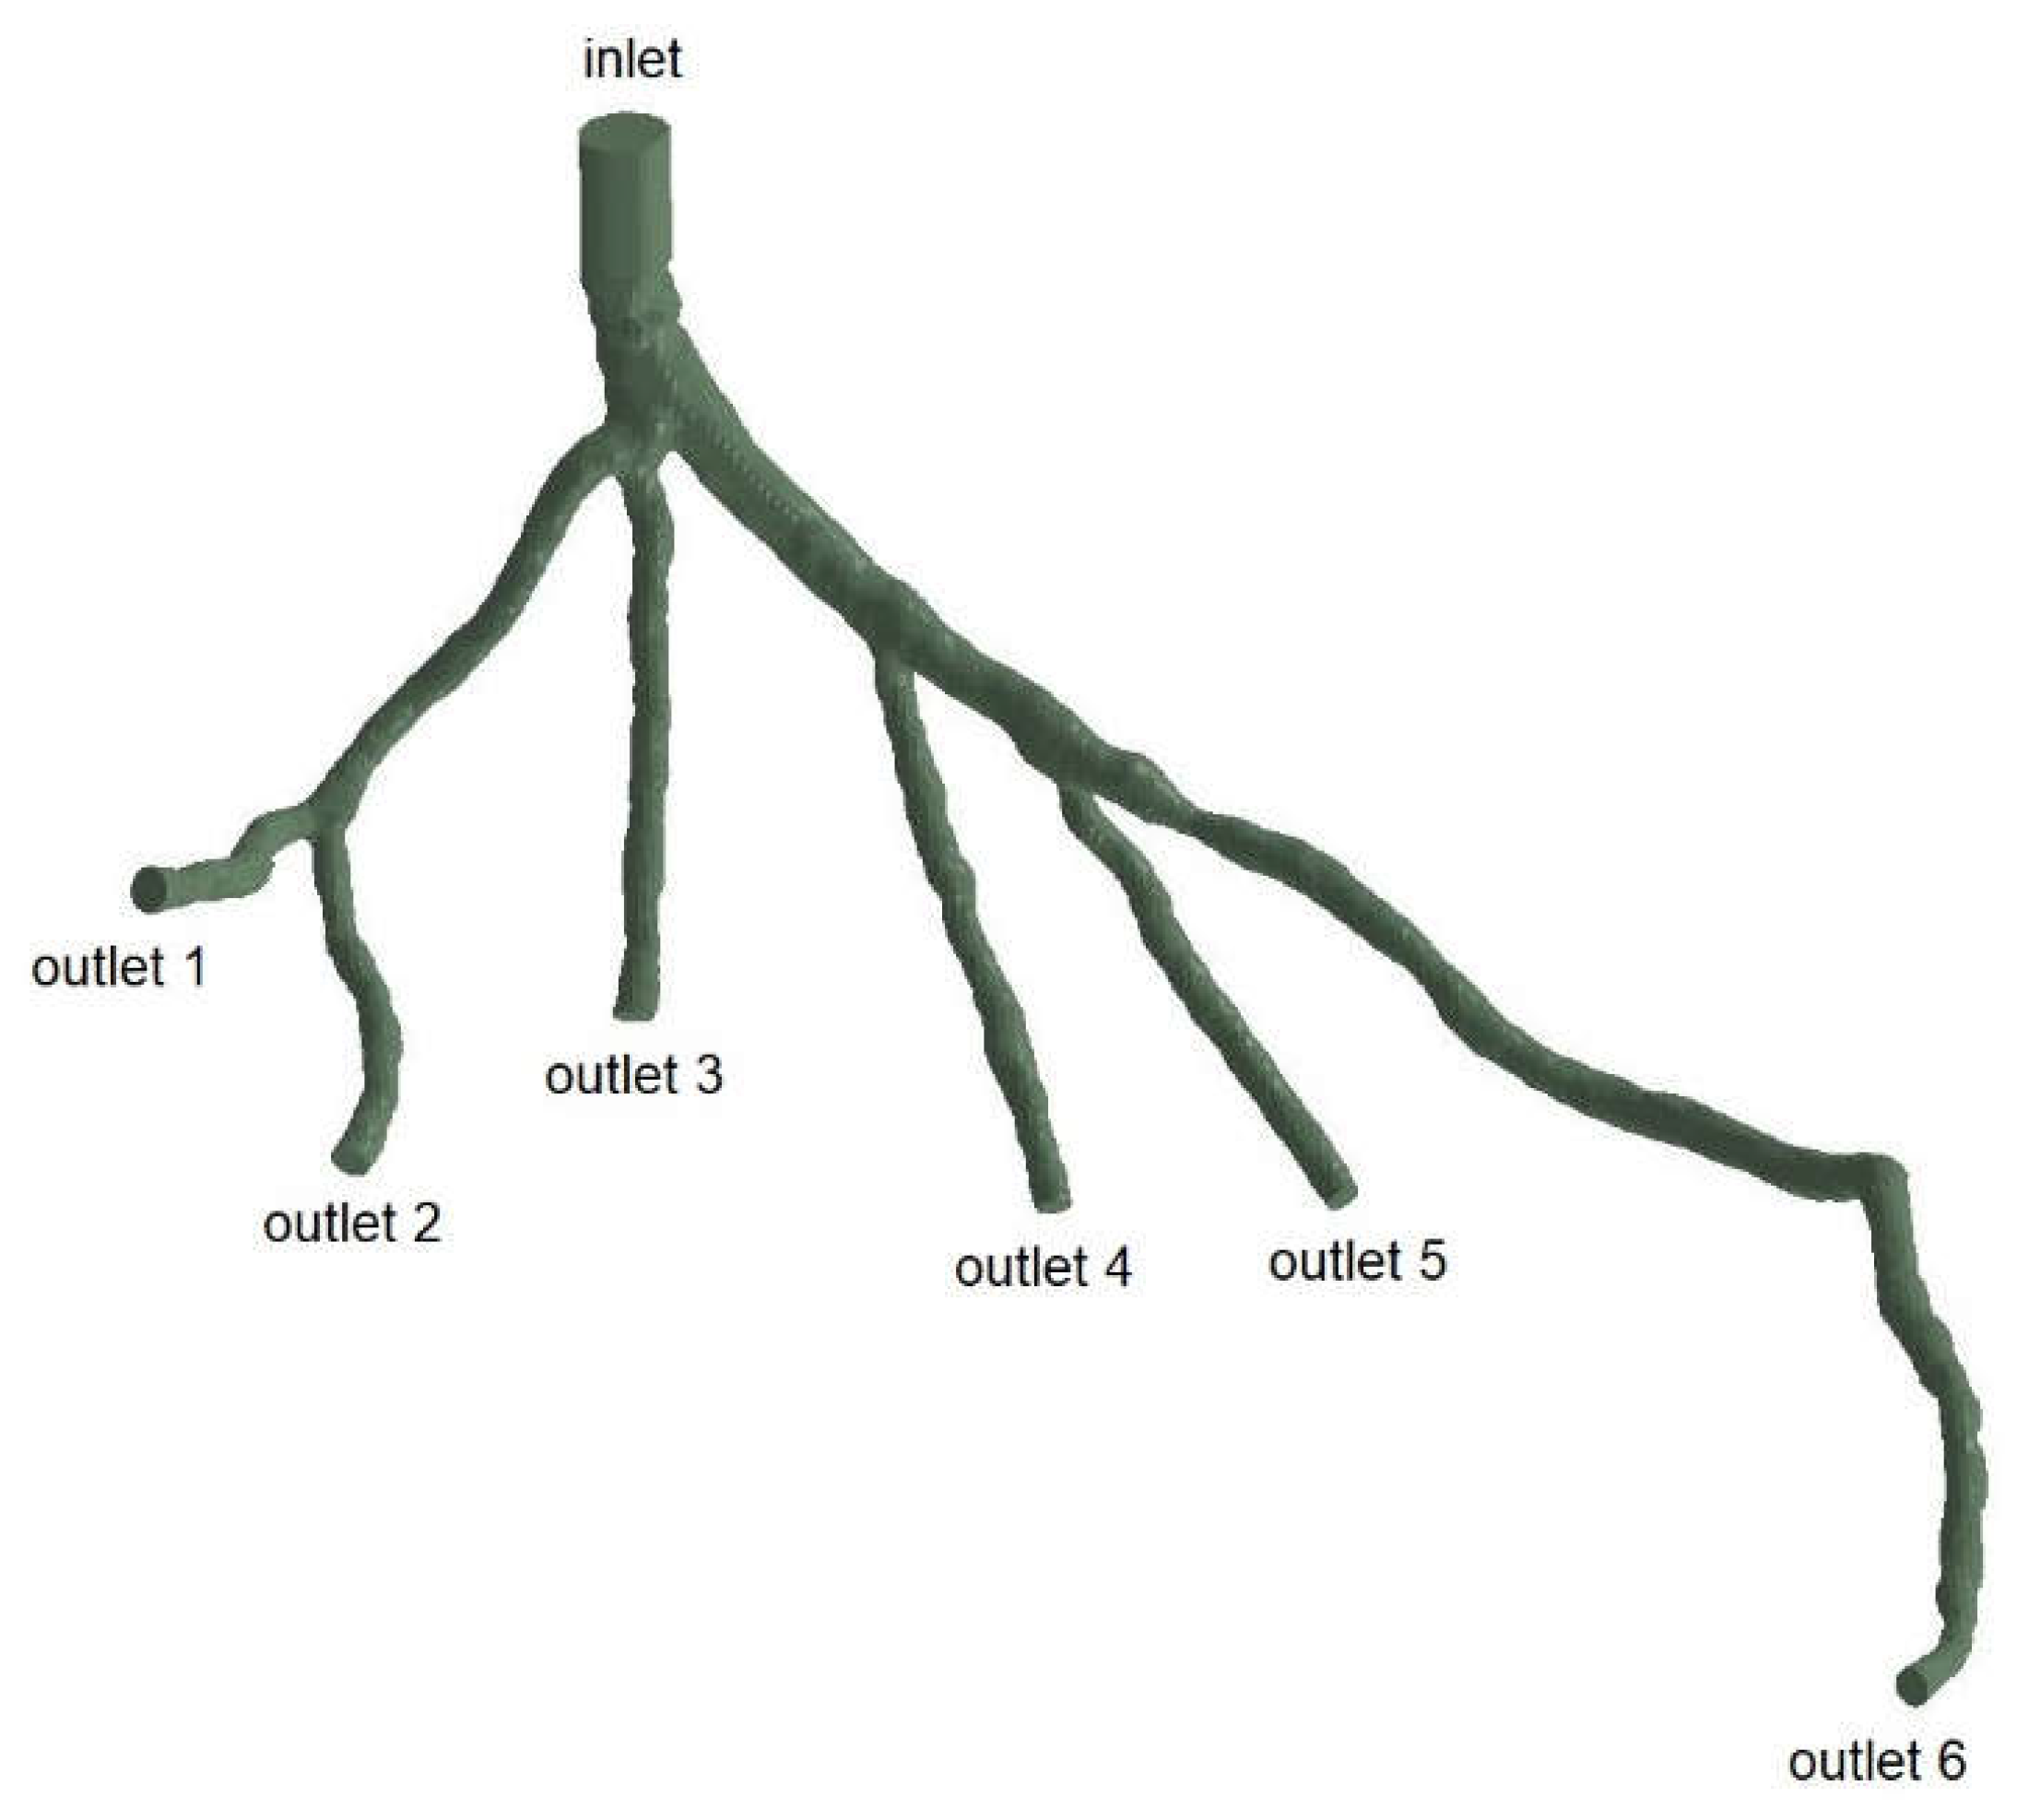
Figure 4.
Geometry and Inlet/Outlets of the CHN13 model.
Figure 4.
Geometry and Inlet/Outlets of the CHN13 model.
Figure 5.
Geometry and Inlet/Outlets of the CHN03 model.
Figure 5.
Geometry and Inlet/Outlets of the CHN03 model.
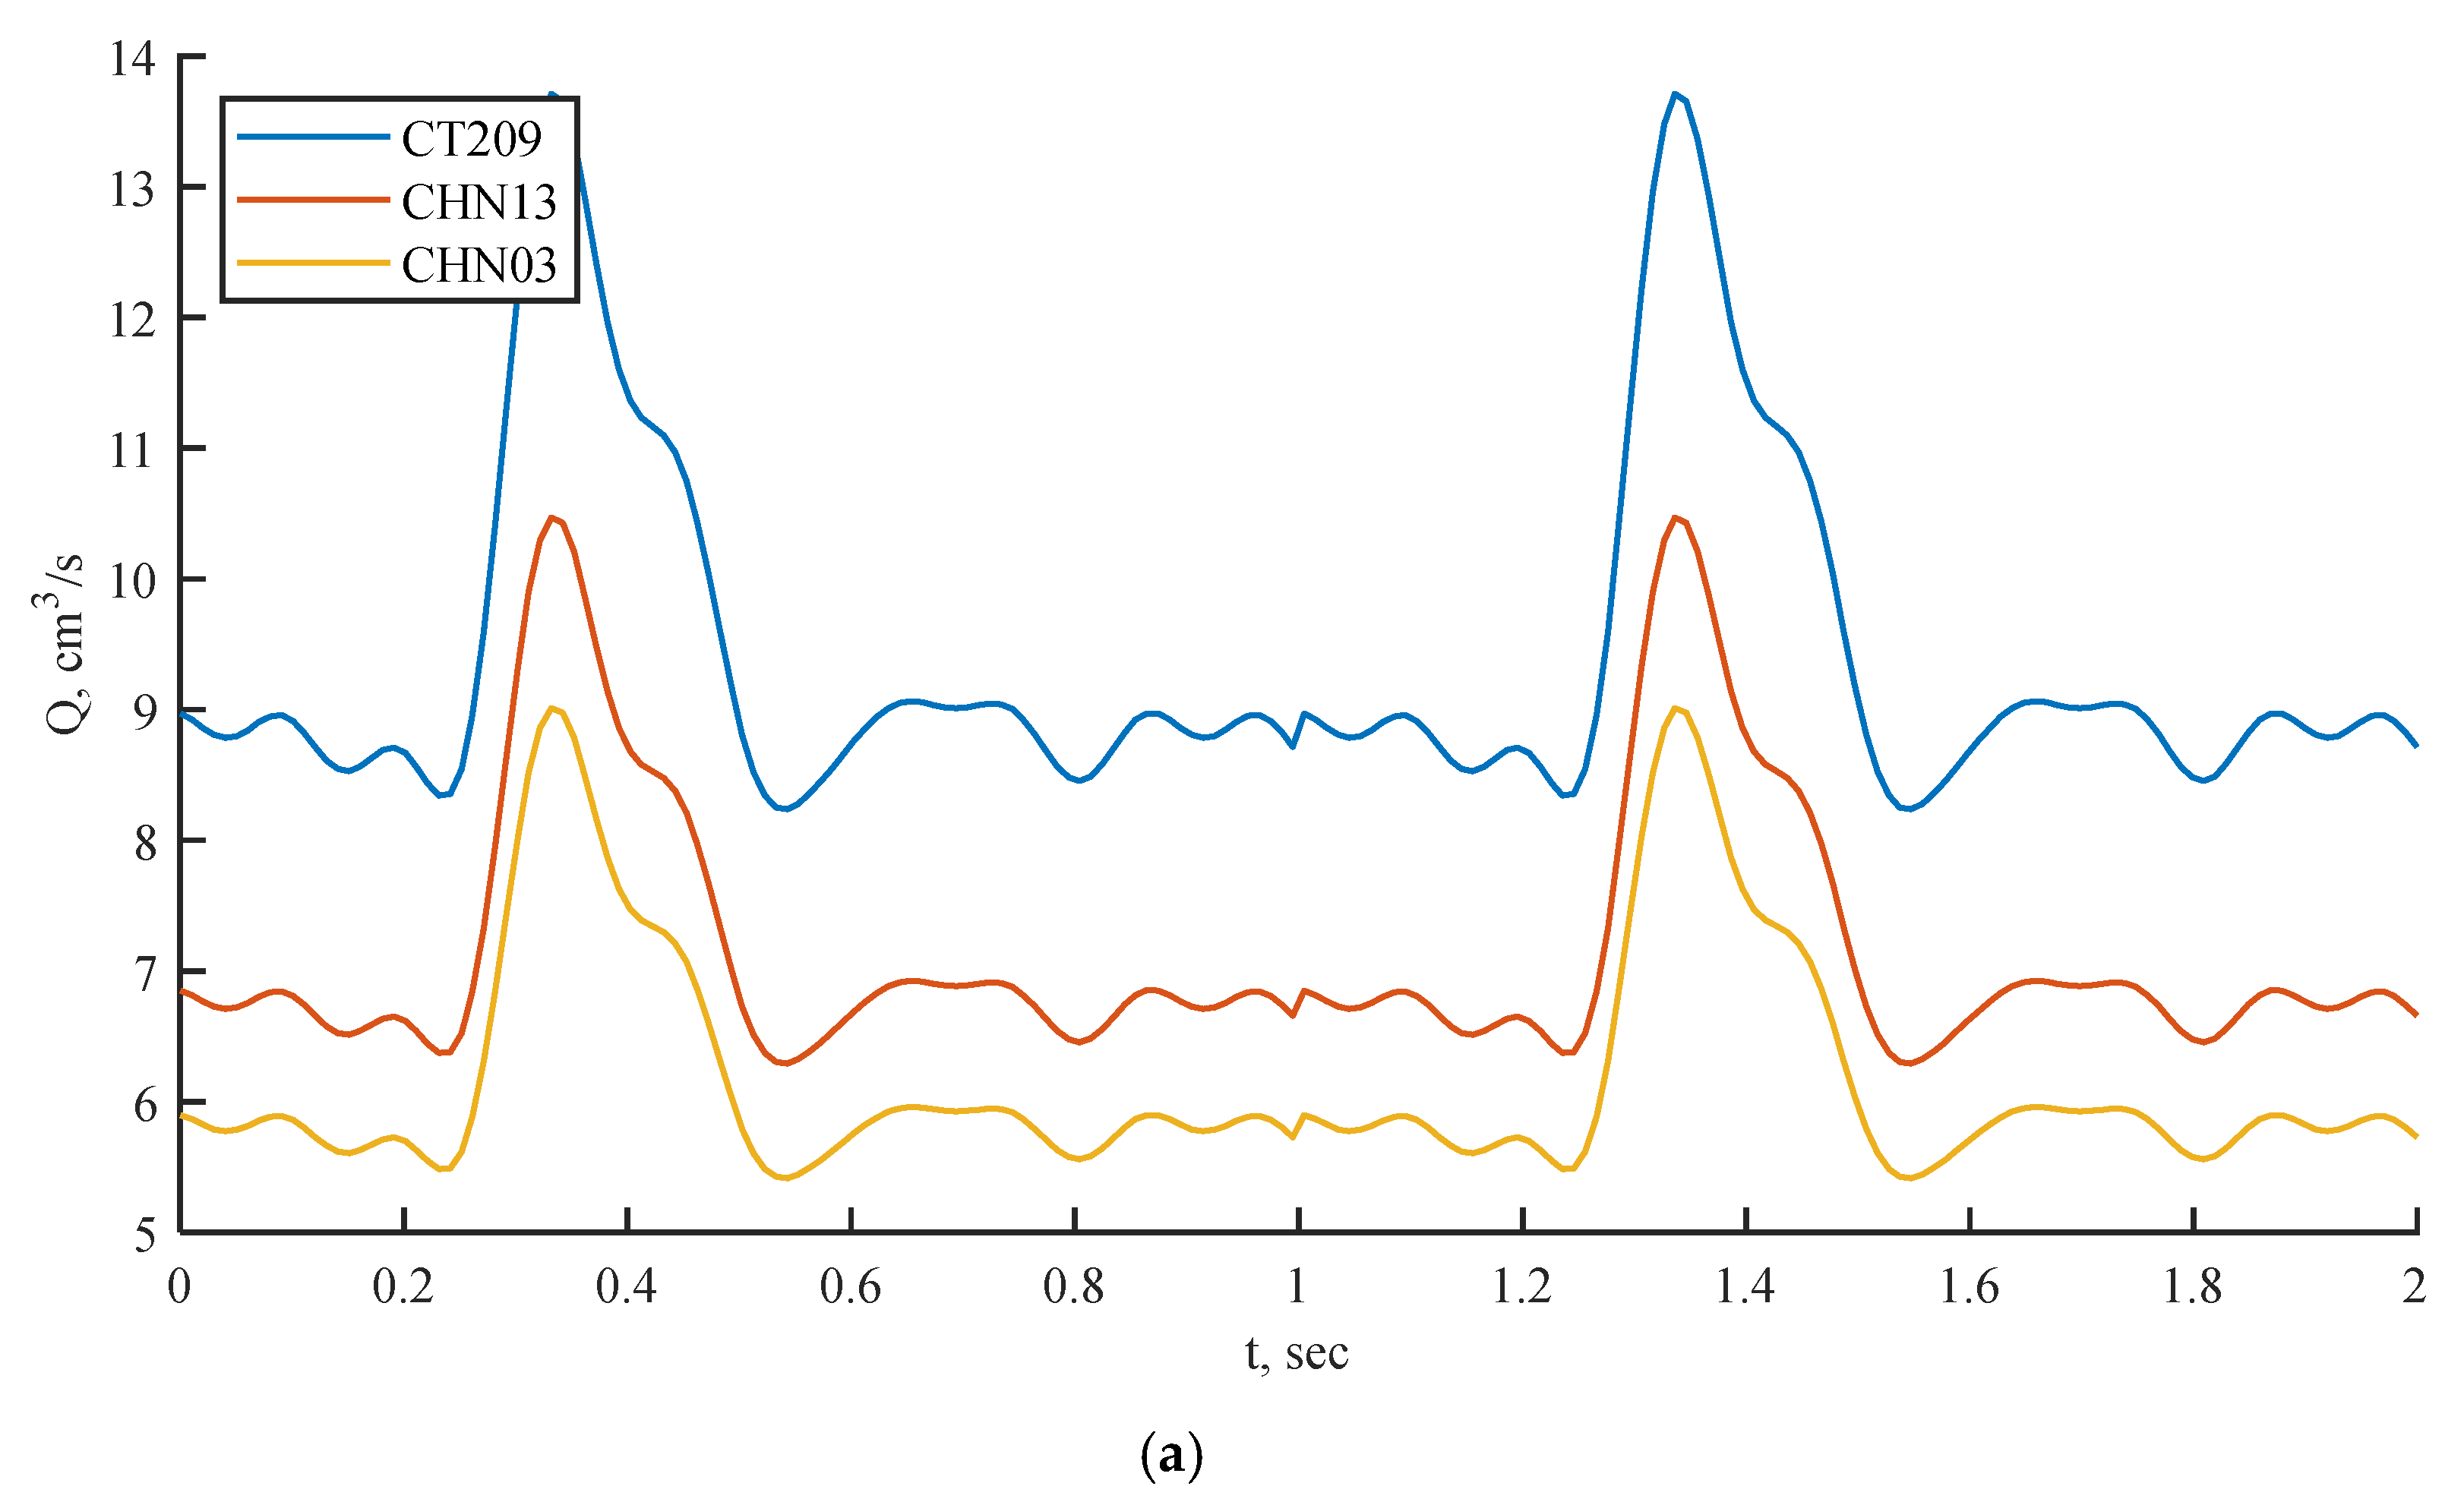
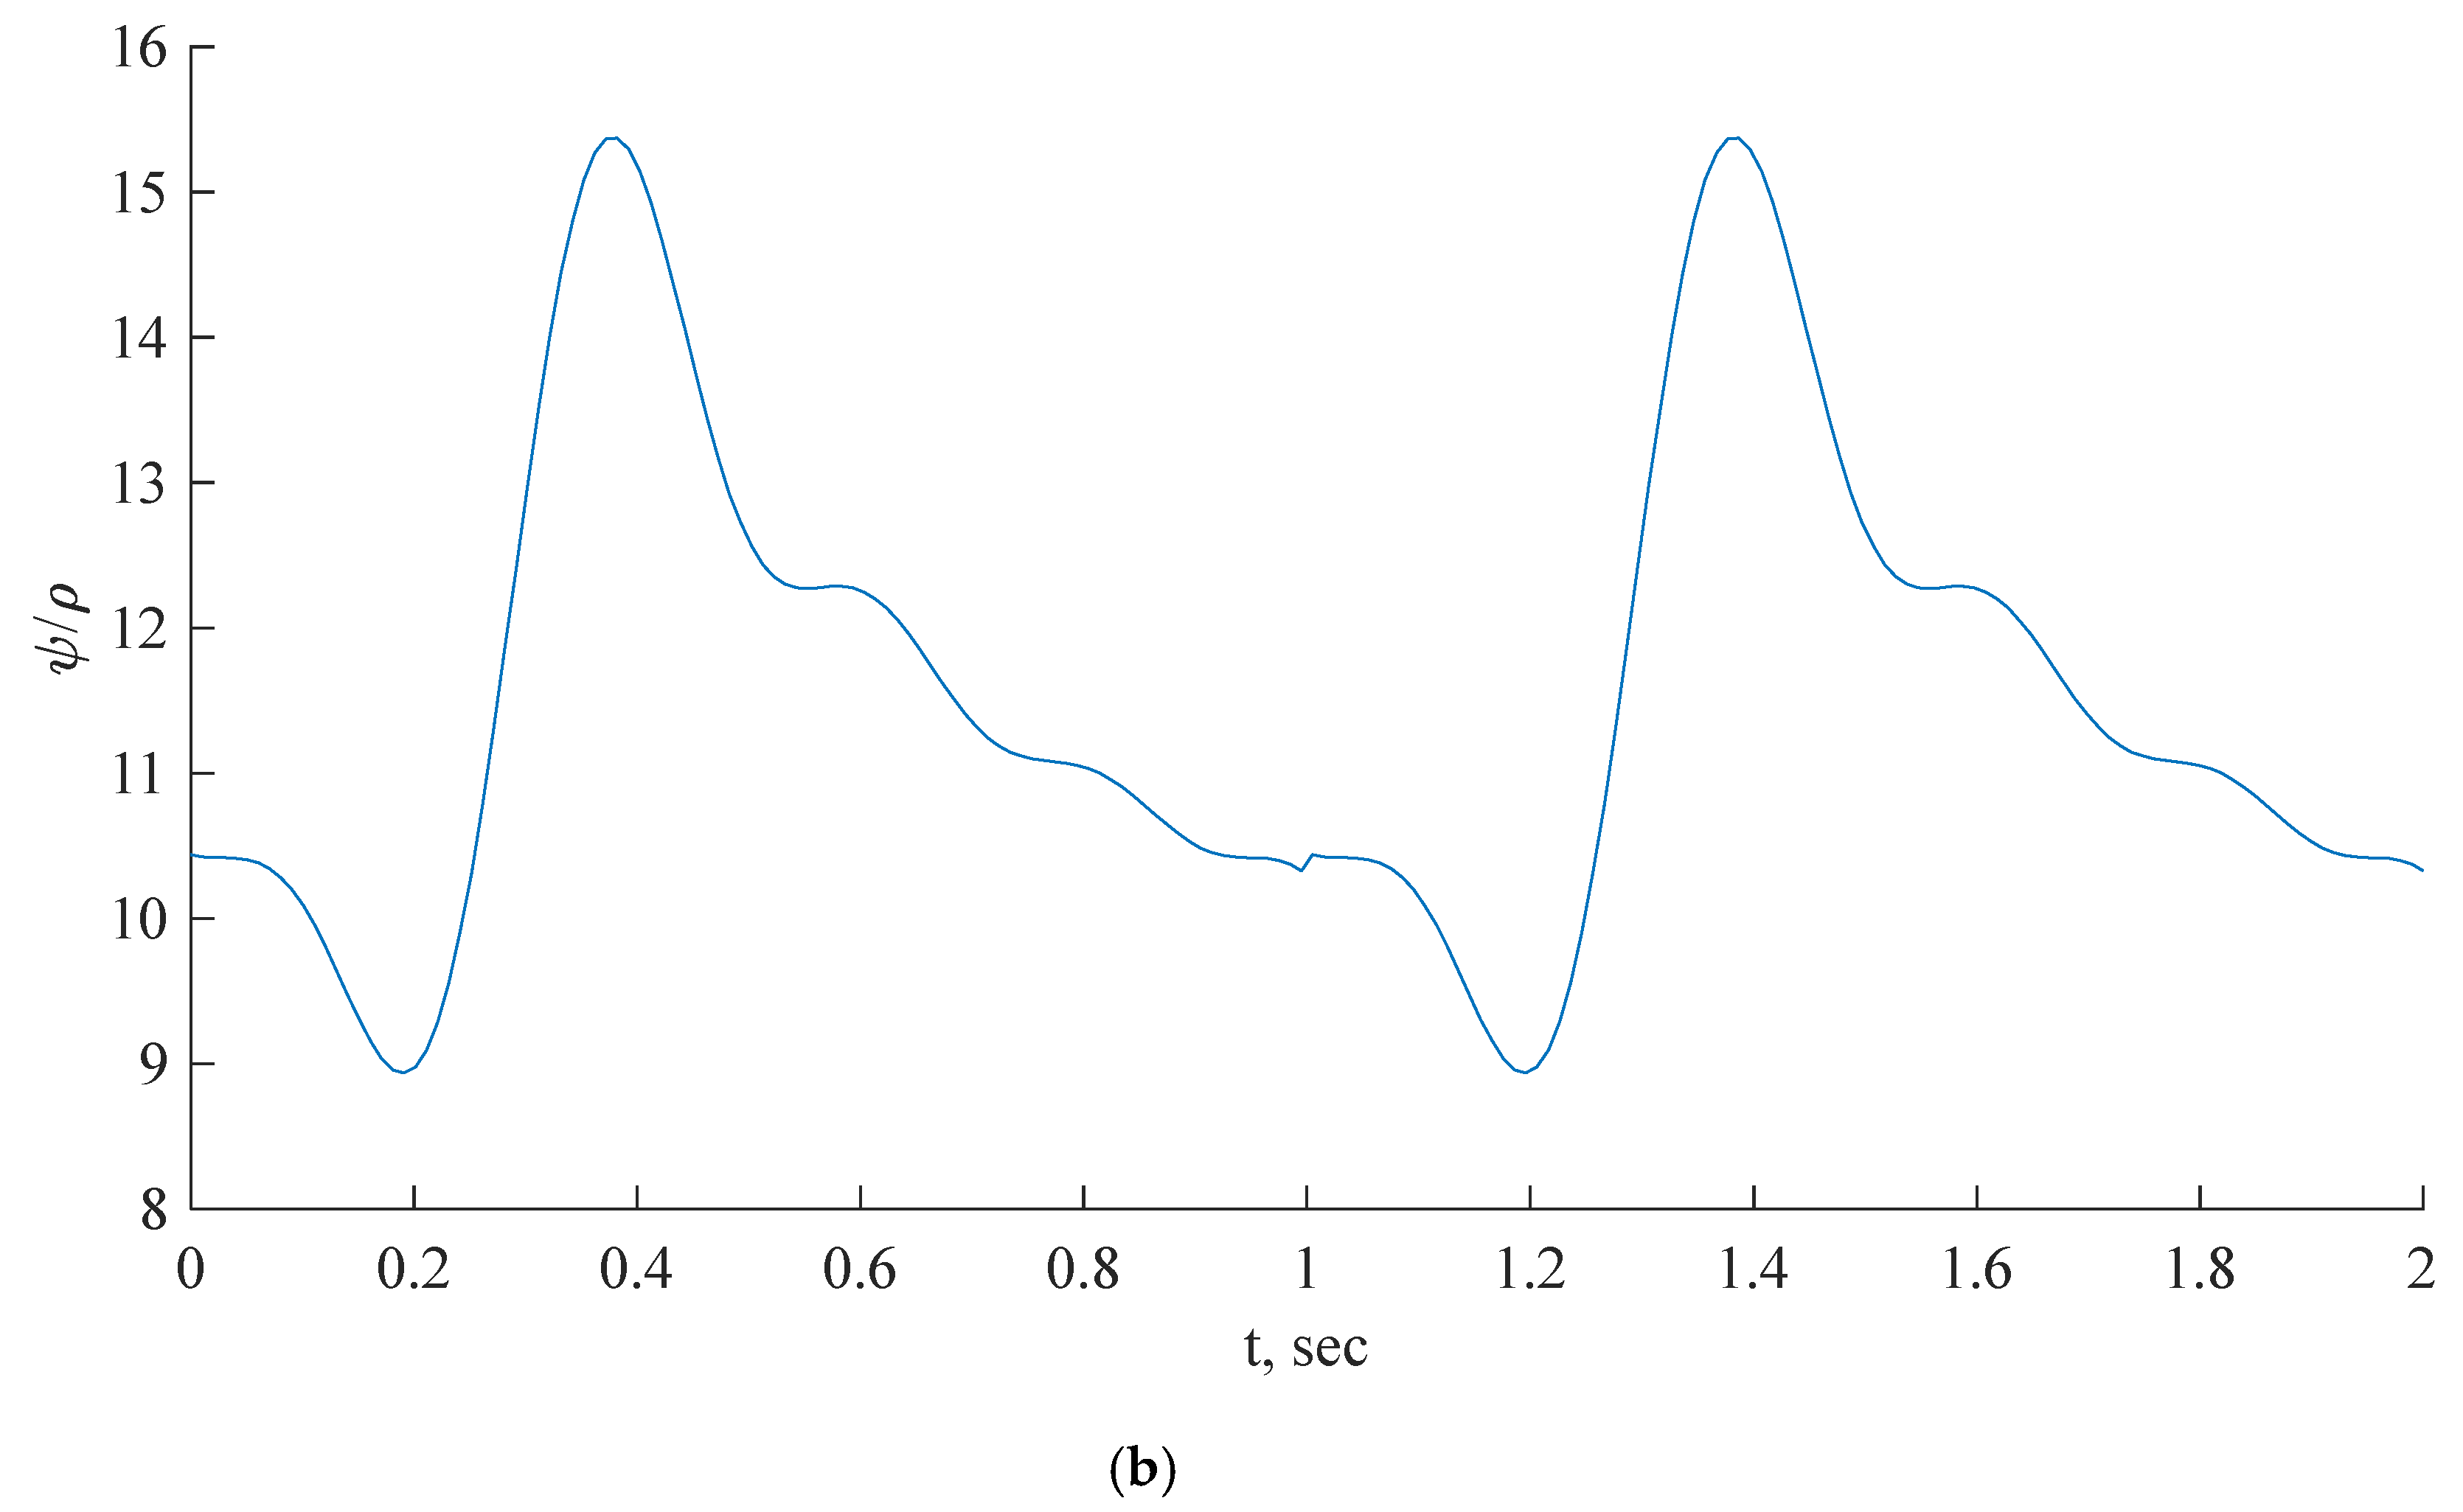
Figure 6.
Inlet boundary conditions: transient flow rate (a) and normalized pressure (b) waveform of coronary blood flow.
Figure 6.
Inlet boundary conditions: transient flow rate (a) and normalized pressure (b) waveform of coronary blood flow.
Figure 7.
Geometry of coronary nozzle [
16].
Figure 7.
Geometry of coronary nozzle [
16].
Figure 9.
Cartesian mesh example.
Figure 9.
Cartesian mesh example.
Figure 10.
(a) FFR distribution along with the shape of CT209 steady-state PBA model and (b) PBA residual history.
Figure 10.
(a) FFR distribution along with the shape of CT209 steady-state PBA model and (b) PBA residual history.
Figure 11.
(a) FFR distribution along with the shape of CHN13 steady-state PBA model and (b) PBA residual history.
Figure 11.
(a) FFR distribution along with the shape of CHN13 steady-state PBA model and (b) PBA residual history.
Figure 12.
(a) FFR distribution along with the shape of CHN03 steady-state PBA model and (b) PBA residual history.
Figure 12.
(a) FFR distribution along with the shape of CHN03 steady-state PBA model and (b) PBA residual history.
Figure 13.
(a) FFR distribution along with the shape of CT209 transient PBA model and (b) PBA residual history.
Figure 13.
(a) FFR distribution along with the shape of CT209 transient PBA model and (b) PBA residual history.
Figure 14.
(a) FFR distribution along with the shape of CHN13 transient PBA model and (b) PBA residual history.
Figure 14.
(a) FFR distribution along with the shape of CHN13 transient PBA model and (b) PBA residual history.
Figure 15.
(a) FFR distribution along with the shape of CHN03 transient PBA model and (b) PBA residual history.
Figure 15.
(a) FFR distribution along with the shape of CHN03 transient PBA model and (b) PBA residual history.
Figure 16.
(a) FFR probe values comparison between steady state and transient PBA models for (a) CT209, (b) CHN13 and (c) CHN03.
Figure 16.
(a) FFR probe values comparison between steady state and transient PBA models for (a) CT209, (b) CHN13 and (c) CHN03.
Figure 17.
FFR distribution along with the shape of FDA nozzle model.
Figure 17.
FFR distribution along with the shape of FDA nozzle model.
Figure 18.
Residual history for steady-state along with the shape of FDA nozzle model.
Figure 18.
Residual history for steady-state along with the shape of FDA nozzle model.
Figure 19.
Residual histories for transient sinus (a) and waveform (b) along with the shape of FDA nozzle model.
Figure 19.
Residual histories for transient sinus (a) and waveform (b) along with the shape of FDA nozzle model.
Figure 20.
Axial flow rate along nozzle centreline: CFD results under steady state and transient conditions and CFD PBA results under steady state and transient conditions.
Figure 20.
Axial flow rate along nozzle centreline: CFD results under steady state and transient conditions and CFD PBA results under steady state and transient conditions.
Table 1.
Workflow procedure of Rapid Iterative algorithm.
Table 1.
Workflow procedure of Rapid Iterative algorithm.
| Timestep |
Initial conditions |
Recorded |
| Inlet |
Outlet |
Inlet |
Outlet |
| 1st round of iteration |
pin (table value)a
|
Q*i
|
Q2i
|
p2i
|
| 2nd round of iteration |
Qin (table value)b
|
p2i
|
p3i
|
Q3i
|
| 3rd round of iteration |
pin (table value) |
Q3i
|
Q4i
|
P4i
|
| … |
… |
… |
… |
… |
Table 2.
Experimentally obtained input parameters for simulation for CT209.
Table 2.
Experimentally obtained input parameters for simulation for CT209.
| Parameter |
Value |
| Experimental inlet pressure
|
90.53 mm Hg (12070.12 Pa) |
| Experimental inlet flow rate
|
9.39944 cm3/s |
Table 3.
Experimentally obtained input parameters for simulation for CHN13.
Table 3.
Experimentally obtained input parameters for simulation for CHN13.
| Parameter |
Value |
| Experimental inlet pressure
|
90.61 mm Hg (12870.12 Pa) |
| Experimental inlet flow rate
|
7.17551 cm3/s |
Table 4.
Experimentally obtained input parameters for simulation for CHN03.
Table 4.
Experimentally obtained input parameters for simulation for CHN03.
| Parameter |
Value |
| Experimental inlet pressure
|
76.5 mm Hg (10201.9 Pa) |
| Experimental inlet flow rate
|
6.18 cm3/s |
Table 5.
Initial calculated flow rates at each outlet by Murray's law for CT209 [
21].
Table 5.
Initial calculated flow rates at each outlet by Murray's law for CT209 [
21].
| Murray’s law calculation for outlet flow rates |
|---|
| |
(cm2) |
(cm) |
(cm3) |
|
(cm3/s) |
| outlet 1 |
1.674 |
1.46 |
3.111 |
0.082 |
0.769 |
| outlet 2 |
4.105 |
2.286 |
11.948 |
0.314 |
2.955 |
| outlet 3 |
1.802 |
1.515 |
3.475 |
0.091 |
0.859 |
| outlet 4 |
0.977 |
1.116 |
1.388 |
0.037 |
0.343 |
| outlet 5 |
1.398 |
1.334 |
2.374 |
0.062 |
0.587 |
| outlet 6 |
4.114 |
2.289 |
11.988 |
0.315 |
2.965 |
| outlet 7 |
0.925 |
1.085 |
1.279 |
0.034 |
0.316 |
| outlet 8 |
0.568 |
0.851 |
0.616 |
0.016 |
0.152 |
| outlet 9 |
1.173 |
1.222 |
1.824 |
0.048 |
0.451 |
Table 6.
Initial calculated flow rates at each outlet by Murray's law for CHN13 [
21].
Table 6.
Initial calculated flow rates at each outlet by Murray's law for CHN13 [
21].
| Murray’s law calculation for outlet flow rates |
|---|
| |
(cm2) |
(cm) |
(cm3) |
|
(cm3/s) |
| outlet 1 |
2.712 |
1.858 |
6.418 |
0.227 |
1.630 |
| outlet 2 |
1.832 |
1.527 |
3.564 |
0.126 |
0.905 |
| outlet 3 |
1.005 |
1.131 |
1.447 |
0.051 |
0.368 |
| outlet 4 |
1.950 |
1.576 |
3.913 |
0.139 |
0.994 |
| outlet 5 |
1.969 |
1.583 |
3.970 |
0.141 |
1.009 |
| outlet 6 |
3.382 |
2.075 |
8.936 |
0.316 |
2.270 |
Table 7.
Initial calculated flow rates at each outlet by Murray's law for CHN03 [
21].
Table 7.
Initial calculated flow rates at each outlet by Murray's law for CHN03 [
21].
| Murray’s law calculation for outlet flow rates |
|---|
| |
|
(cm2) |
(cm) |
(cm3) |
|
(cm3/s) |
| outlet 1 |
1 |
2.5675 |
1.8081 |
5.9106 |
0.2240 |
1.3847 |
| outlet 2 |
2 |
2.2262 |
1.6836 |
4.7721 |
0.1808 |
1.1179 |
| outlet 3 |
3 |
2.1930 |
1.6710 |
4.6658 |
0.1768 |
1.0930 |
| outlet 4 |
4 |
1.8206 |
1.5225 |
3.5293 |
0.1338 |
0.8268 |
| outlet 5 |
5 |
1.7784 |
1.5048 |
3.4074 |
0.1291 |
0.7982 |
| outlet 6 |
6 |
2.0126 |
1.6008 |
4.1021 |
0.1555 |
0.9610 |
Table 9.
Relative errors calculated between the invasive and calculated FFRs by Simvascular, Ansys CFX and OpenFOAM.
Table 9.
Relative errors calculated between the invasive and calculated FFRs by Simvascular, Ansys CFX and OpenFOAM.
| model |
Calculated FFR |
Invasive FFR |
Relative error, % |
| Ansys CFX |
Simvascular |
OpenFOAM
Steady-state PBA |
OpenFOAM
Transient PBA |
Ansys CFX |
Simvascular |
OpenFOAM
Steady-state PBA |
OpenFOAM
Transient PBA |
| CT209 |
0.753 |
0.758 |
0.762 |
0.80 |
0.76 |
0.92 |
0.26 |
0.26 |
5.26 |
| CHN03 |
0.87 |
0.872 |
0.86 |
0.859 |
0.86 |
1.16 |
1.38 |
2.33 |
0.02 |
| CHN13 |
0.658 |
0.691 |
0.683 |
0.69 |
0.68 |
3.24 |
1.59 |
0.44 |
1.47 |
