Submitted:
23 March 2023
Posted:
23 March 2023
You are already at the latest version
Abstract
Keywords:
1. Introduction
|
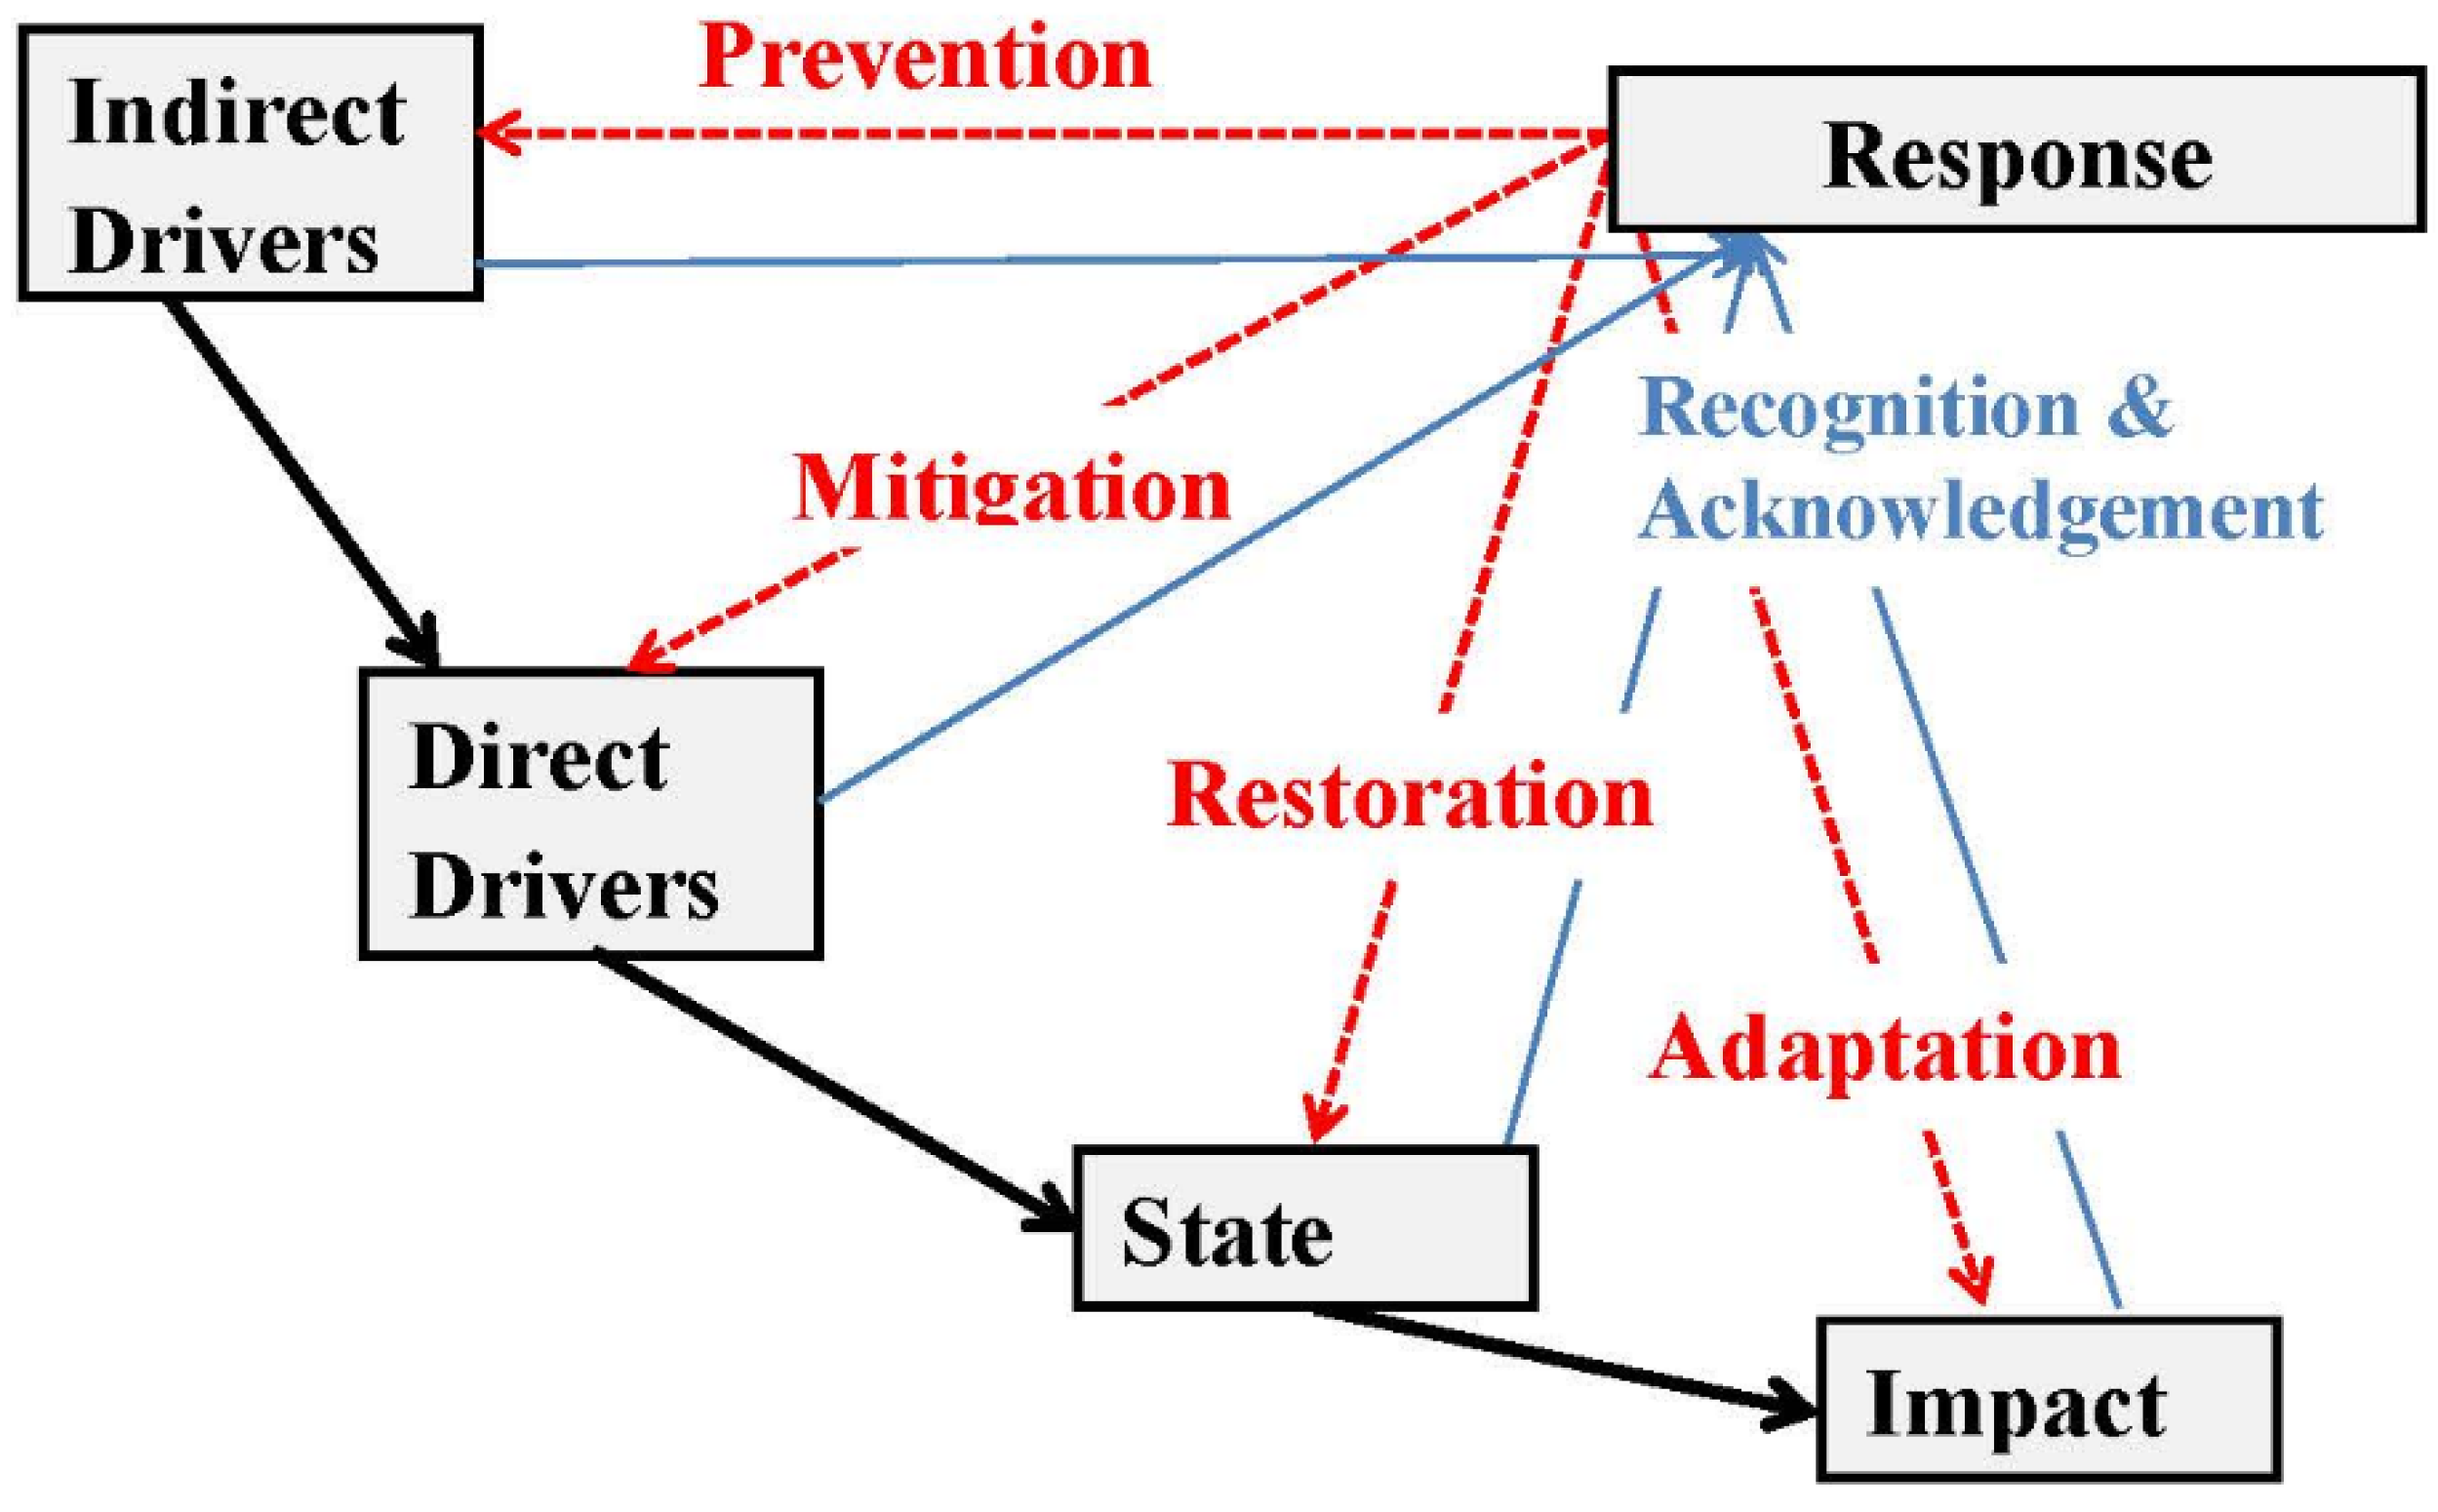
From the Kunming-Montreal Global Biodiversity Framework In section E, § 27, the GBF calls for “urgent policy action […] so that the drivers of undesirable change that have exacerbated biodiversity loss will be reduced and/or reversed”. For this behalf, section in H (§ 31, 2030 Targets. 1. Reducing threats to biodiversity), it specifically points to eliminating, minimising, reducing and/or mitigating the impacts of invasive alien species (target 6), but makes no reference to the indirect drivers behind the spread of invasive species, i.e., global trade and insufficient controls. It demands reduction of pollution from all sources, by 2030, to levels that are not harmful (target 7), but does not spell out the responsibility of industrial producers. As opposed to this, it is much clearer regarding consumption, demanding that, a. o., governments establish supportive policy, legislative or regulatory frameworks to ensure that consumers significantly reduce overconsumption and substantially reduce waste generation, including through halving global food waste (target 16). It appears that the CBD and its parties, and in result the GBF, shy away from admitting the need for a deep structural change of our economic systems. The necessity of such a systemic change has been shown in chapter 6 of the IPBES report the GBF claims to respond to, and a multitude of subsequent publications, with frequent participation of the IPBES authors [5,6,7]. The size of the challenge has been clearly shown as well in the European Environment Agency’s 2019 report [8], the recent IPCC reports and a plethora of other research reviews. |
2. Methodological background – the role of LUI
3. Hemeroby and the Land Use Intensity Index LUI
3.1. Hemeroby
3.2. Calculating LUI
3.3. Linking LUI back to GBF and IUCN
- ➢
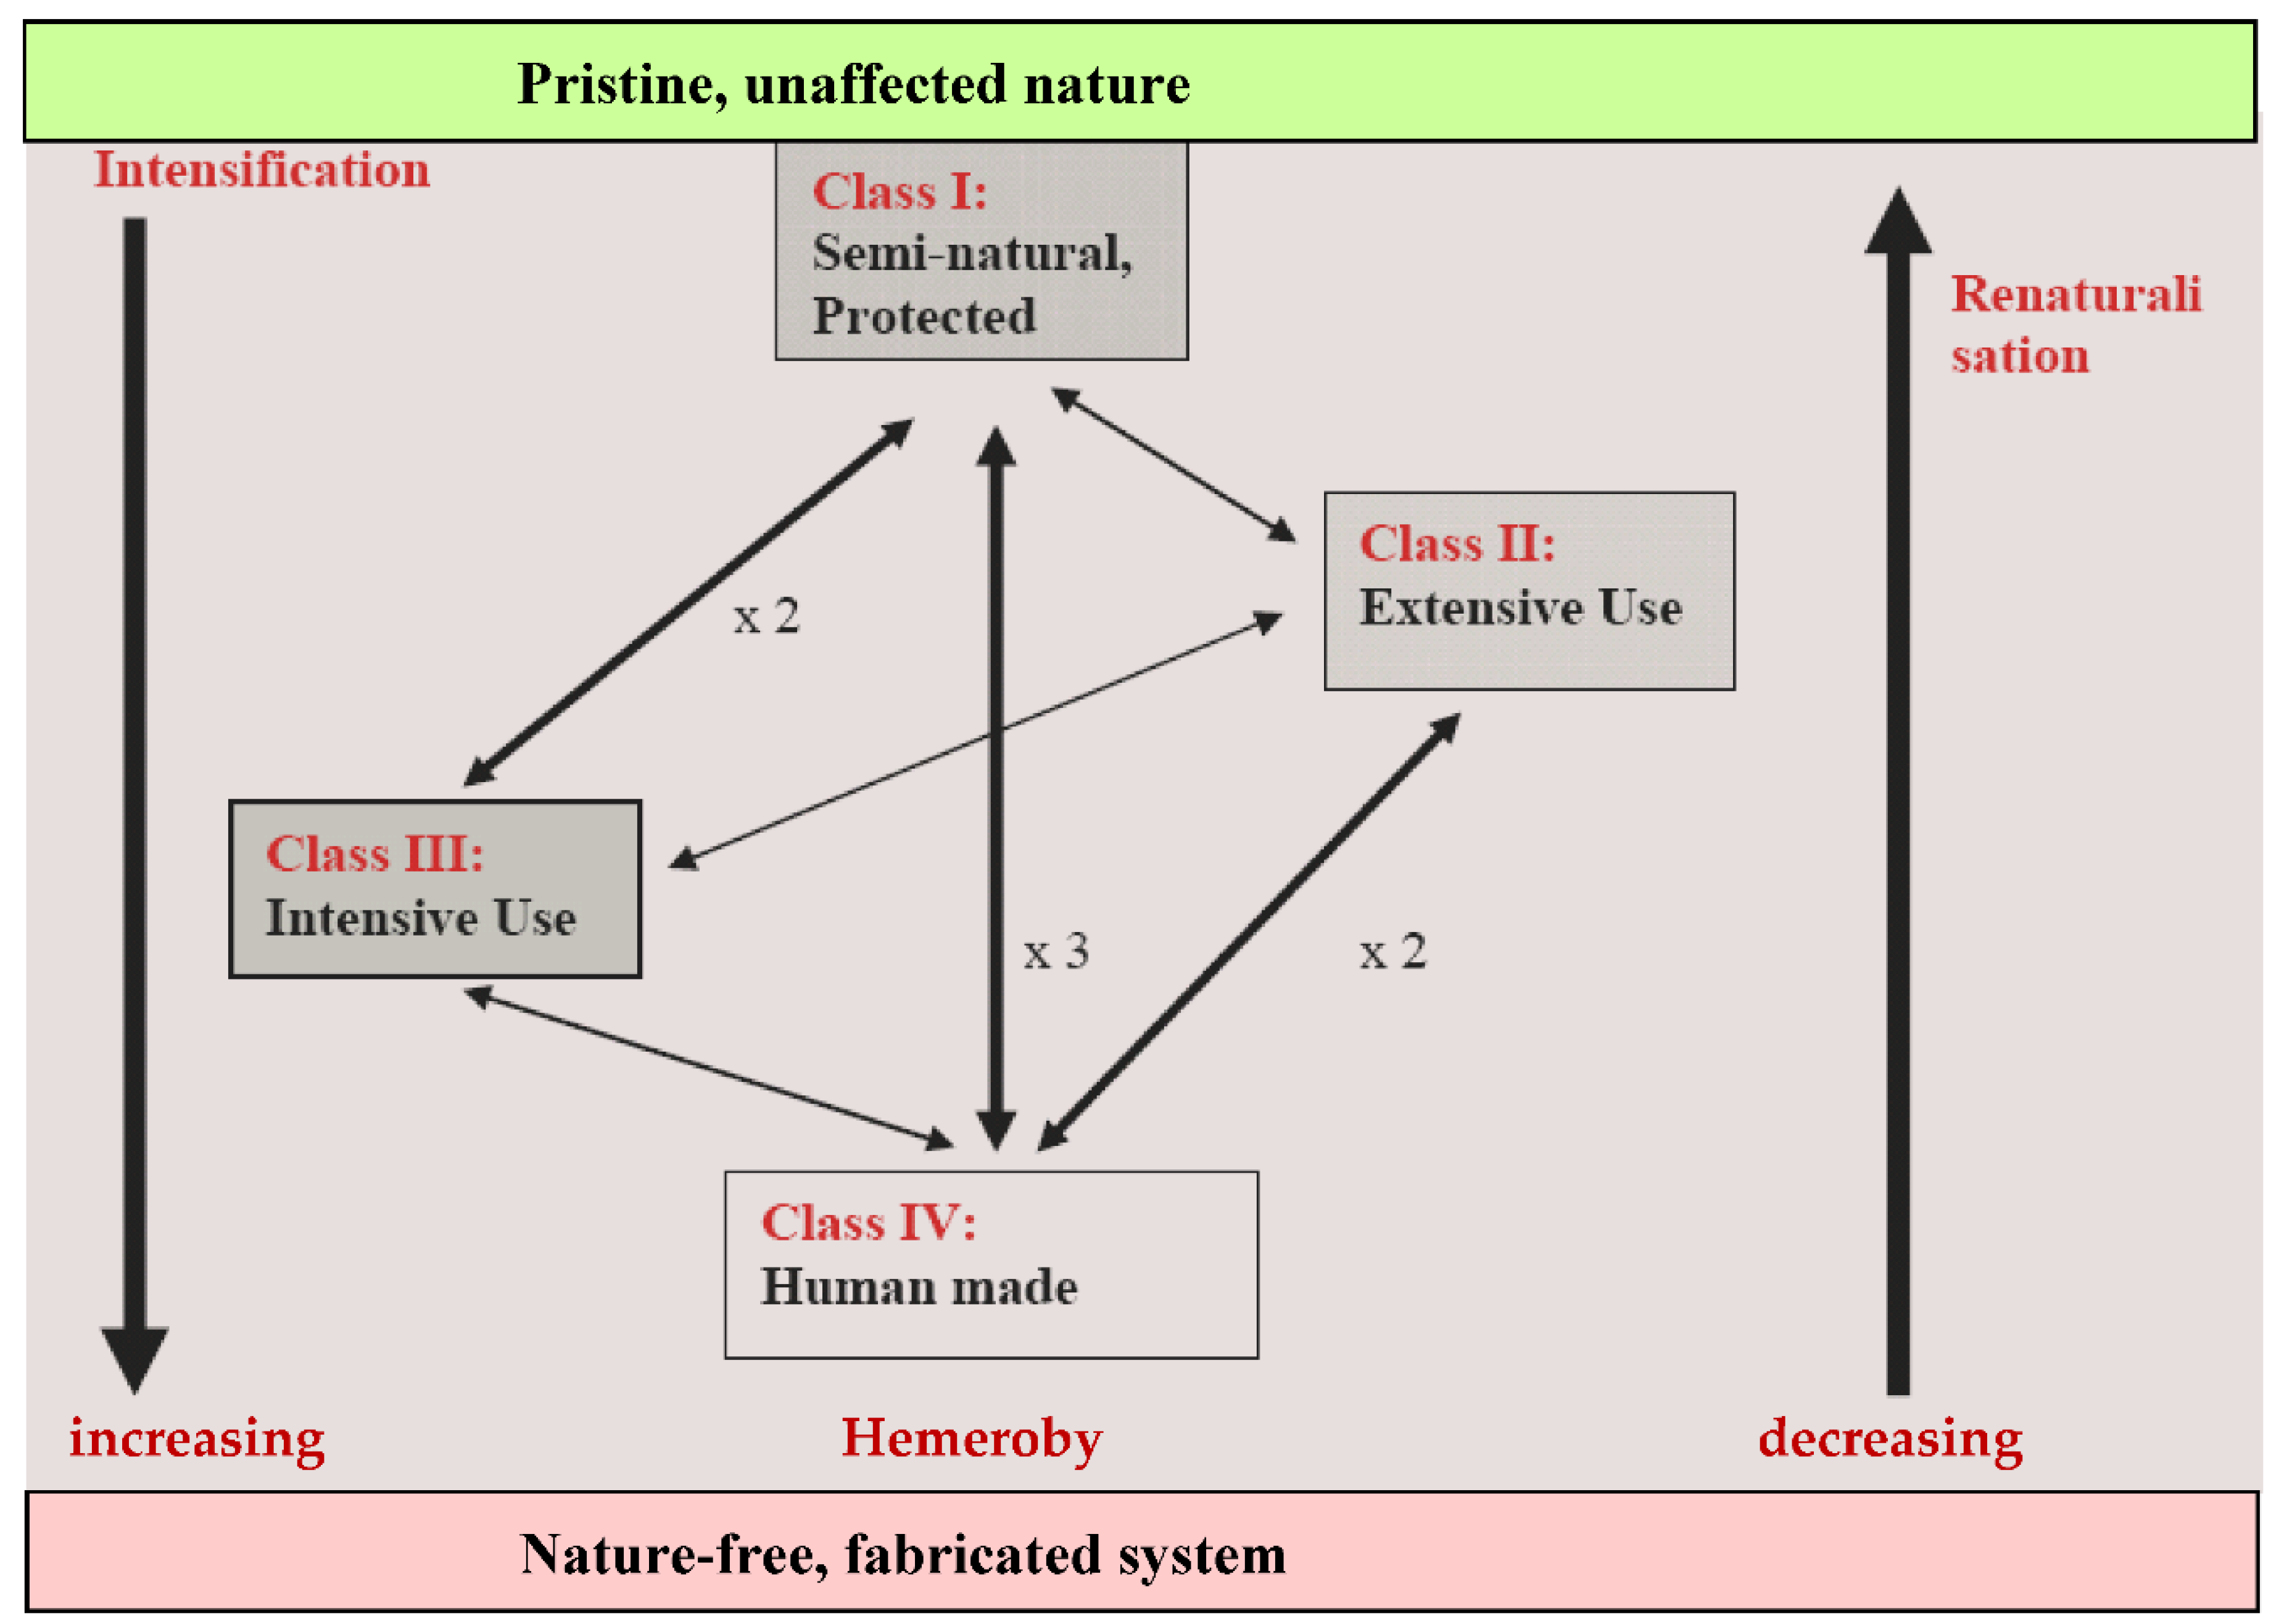
- Human made systems (LUI class IV) can be related to IUCN category T7.4, the land underlying buildings and structures. It refers to building and adjacent open land, commercial/industrial land (including mining land), traffic areas, i.e., built environment, characterised by humans replacing natural regulation processes. In the IUCN CMP classification of threats to biodiversity, this corresponds to residential and commercial development, plus from the transportation category, road and railroads. While in LUI mining areas and soil under infrastructure is considered “nature-free” and not covered, the reminder of IUCN category T7.4 falls under the definition of LUI class IV.
- ➢
- Intensively used systems (LUI class III) covers anthropogenically controlled ecosystems with high input levels, corresponding to several IUCN categories. Category T7.3 comprises plantations including intensive forestry areas, category T7.2 sown pastures and fields, plus intensive lifestock farming, for instance for beef and dairy farming, and annual croplands. Category T7.1 refers to special forms of intensive agriculture like gardens and vineyards, but should be extended to include land use as liquid manure dump. They are dependent on hands-on steering of the system dynamics, humans dominating natural regulation processes. IUCN CMP classification of threats to biodiversityis worse – the category cover agriculture, but orchards and agroforestry are closer to LUI class II than class III.
- ➢
- Extensively used systems (LUI class II) are anthropogenically cultivated ecosystems with low external inputs (cultivation meaning to use rather than suppress the natural regulation mechanisms to produce the harvest). It corresponds to IUCN category T7.5 comprising derived semi-natural pastures and old fields (the IUCN CMP categorisation as ‘partly biological resource use’ is even less helpful). Based on its use intensity, it should be understood to also include peatlands, heaths, orchards, cemeteries, fallow land and areas of sustainable forestry, hunting, plant gathering, fishing, bee-keeping and grazing.
- ➢
- semi-natural or protected systems (LUI class I) comprise protected or unused areas, including abandonned land. This corresponds to IUCN categories T1 to T6, including non-cultivated wooded land and major water bodies. For CMP this falls under land/water protection, with elements of biological resource use. In such areas, humans harvest a share of the yield from natural regulation, like small scale forest dwellers or indigenous peoples do.
4. Discussion and conclusions
Funding
Data Availability Statement
Acknowledgments
Conflicts of Interest
References
- CBD Conference of the Parties to the Convention on Biological Diversity 2022a. Fifteenth meeting, Part II, Montreal, Canada, 7-19 December 2022.Agenda item 9A, Document CBD/COP/15/L.25: Kunming-Montreal Global biodiversity framework. Convention on Biological Diversity, COP Decisions, Decision 15/4. Available online: https://www.cbd.int/decisions/cop/?m=cop-15 (accessed on 27 December 2022).
- IPBES Intergovernmental Science-Policy Platform on Biodiversity and Ecosystem Services [Brondizio, E. S. IPBES Intergovernmental Science-Policy Platform on Biodiversity and Ecosystem Services [Brondizio, E. S., Díaz, S., Settele, J.]. The IPBES Global Assessment on Biodiversity and Ecosystem Services, Secretariat of the Intergovernmental Science-Policy Platform on Biodiversity and Ecosystem Services: Bonn, Germany, 2019; 1148 pp.
- CBD Convention on Biological Diversity. Global Biodiversity Outlook 5., CBD Secretariat: Montreal, Canada 2020.
- UNEP IRP United Nations Environment Programme International Resource Panel [Oberle, B. UNEP IRP United Nations Environment Programme International Resource Panel [Oberle, B., Bringezu, S., Hatfeld-Dodds, S., Hellweg, S., Schandl, H., Clement, J., Cabernard, L., et al.]. Global Resources Outlook 2019: Natural Resources for the Future We Want. Summary for Policy Makers. UNEP: Nairobi, Kenya, 2019.
- McElwee, P., Turnout, E., Chiroleu-Assouline, M., Clapp, J., Isenhour, C., Jackson, T., Kelemen, E., et al.. Ensuring a Post-COVID Economic Agenda Tackles Global Biodiversity Loss. One Earth. 2020, 3, 448–461. [CrossRef]
- Turnhout, E., McElwee, P., Chiroleu-Assouline, M., Clapp, J., Isenhour, C., Kelemen, E., Jackson, T., et al.. Enabling transformative economic change in the post-2020 biodiversity agenda. Conservation Letters. 2021, 14, e12805. [CrossRef]
- Visseren-Hamakers, I. J., Razzaque, J., McElwee, P., Turnhout, E., Kelemen, E., Rusch, G. M., Fernández-Llamazares, Á., et al.. Transformative governance of biodiversity: insights for sustainable development. Current Opinion in Environmental Sustainability. 2021, 53, 20–28. [CrossRef]
- EEA European Environment Agency. The European Environment — State and Outlook 2020: Knowledge for transition to a sustainable Europe, Publications Office of the European Union: Luxembourg, Luxembourg, 2019.
- CBD Conference of the Parties to the Convention on Biological Diversity 2022b. Fifteenth meeting, Part II, Montreal, Canada, 7-19 December 2022. Agenda item 9B. Document CBD/COP/15/L.26: Monitoring framework for the Kunming-Montreal global biodiversity framework. Convention on Biological Diversity, COP Decisions, Decision 15/5. Available online: https://www.cbd.int/decisions/cop/?m=cop-15 (accessed on 27 December 2022).
- United Nations et al. (2021). System of Environmental-Economic Accounting—Ecosystem Accounting (SEEA EA). White cover publication, Version: 29 September 2021, pre-edited text subject to official editing. Available online: https://seea.un.org/ecosystem-accounting (accessed on 27 December 2022).
- Salafsky, N., Salzer, D., Stattersfield, A. J., Hilton-Taylor, C., Neugarten, R., Butchart, S. H. M., Collen, B. E. N., et al., A Standard Lexicon for Biodiversity Conservation: Unified Classifications of Threats and Actions. Conservation Biology. 2008, 22, 897–911.
- CMP Conservation Measures Partnership 2020. Open Standards for the Practice of Conservation Version 4.0, Available online: https://conservationstandards.org/wp-content/uploads/sites/3/2020/10/CMP-Open-Standards-for-the-Practice-of-Conservation-v4.0.pdf (accessed on 18 March 2023).
- CMP Conservation Measures Partnership 2016. Direct Threats Classification 2.0: https://docs.google.com/spreadsheets/d/1rJSNz1LG_KOqoudVFglodx47HZ9LR-M6iVlRYMvn9Wk/edit#gid=310830663. (accessed on 18 March 2023).
- Spangenberg, J. H. Hot air or comprehensive progress? A critical assessment of the SDGs. Sustainable Development 2016, 25, 311–321. [Google Scholar] [CrossRef]
- Spangenberg, J.H., Zimmermann, R. So lasst uns denn ein Pinienwäldchen pflanzen.... FIF Forum für interdisziplinäre Forschung. 1990, 3, 23–26.
- Gazol, A. , Camarero, J. J. Compound climate events increase tree drought mortality across European forests. Science of The Total Environment 2022, 816, 151604. [Google Scholar] [CrossRef]
- Wieler, A. Ein Beitrag zum Verständnis des Wesens der Bodenazidität und ihres Einflusses auf das Wurzelwachstum. In Jahrbücher für wissenschaftliche Botanik, Germany, 1932, Volume 76, pp 333-406.
- Mack, M. C., D’Antonio, C. M. Impacts of biological invasions on disturbance regimes. Trends in Ecology & Evolution. 1998, 13, 195–198. [CrossRef]
- University of South Florida Optical Oceanography Lab 2023. Outlook of 2023 Saragassum blooms in the Caribbean Sea and Gulf of Mexico. Available online: https://optics.marine.usf.edu/projects/SaWS/pdf/Sargassum_outlook_2023_bulletin2_USF.pdf (accessed on 18 March 2023).
- Lindenmayer, D. B., Hobbs, R. J., Likens, G. E., Krebs, C. J., Banks, S. C. Newly discovered landscape traps produce regime shifts in wet forests. Proceedings of the National Academy of Sciences. 2011, 108, 15887–15891. [CrossRef]
- Rockström, J., Steffen, W., Noone, K., Persson, Å., Chapin, F. S. I., Lambin, E. F., Lenton, T. M., et al. Planetary boundaries: exploring the safe operating space for humanity, Ecology and Society. 2009, 14, 1–32.
- Steffen, W., et al. Planetary boundaries: Guiding human development on a changing planet.” Science. 2015, 347, 736–1259855. [CrossRef]
- Battisti, F., Campo, O., Manganelli, B. Land Management in Territorial Planning: Analysis, Appraisal, Strategies for Sustainability—A Review of Studies and Research. Land. 2022, 11, 1007. [CrossRef]
- Battisti, C., Fanelli, G. Applying indicators of disturbance from plant ecology to vertebrates: The hemeroby of bird species. Ecological Indicators. 2016, 61, 799–805. [CrossRef]
- Fanelli, G., Battisti, C. Comparing disturbance-sensitivity between plants and birds: a fine-grained analysis in a suburban remnant wetland. Israel Journal of Ecology & Evolution. 2014, 60, 11–17. [CrossRef]
- Li, Y. , Ma, Z., Liu, Y., Cui, Z., Mo, Q., Zhang, C., Sheng, H., et al. Variation in Soil Aggregate Stability Due to Land Use Changes from Alpine Grassland in a High-Altitude Watershed. Land 2023, 12. [CrossRef]
- Ghorbani, M. , Amirahmadi, E., Konvalina, P., Moudrý, J., Kopecký, M., Hoang, T. N. Carbon Pool Dynamic and Soil Microbial Respiration Affected by Land Use Alteration: A Case Study in Humid Subtropical Area. Land 2023, 12. [CrossRef]
- Hammen, V. C., Settele, J. Biodiversity and the loss of biodiversity affecting human health. In Encyclopedia of Environmental Health. Nriagu, J. O., Ed. in chief; Elsevier Science BV: Amsterdam, Netherlands, 2011, pp. 353–362.
- Kowarik, I. Natürlichkeit, Naturnähe und Hemerobie als Bewertungskriterien. In Handbuch der Umweltwissenschaften: Grundlagen und Anwendungen der Ökosystemforschung. Schröder, W., Müller, F. Eds., VCH Verlag, Landsberg, Germany, 2006, Section VI-3.12. [CrossRef]
- Jalas, J. Hemerobe und hemerochore Pflanzenarten – ein terminologischer Reformversuch. Acta Societatis pro Fauna et Flora Fennica 1955, 72, 1–15. [Google Scholar]
- Sukopp, H. Wandel von Flora und Vegetation in Mitteleuropa unter dem Einfluβ des Menschen. Berichte für Landwirtschaft 1972, 50, 112–139. [Google Scholar]
- Sukopp, H. Dynamik und Konstanz in der Flora der Bundesrepublik Deutschland: Dynamics and constancy in the flora of the 1972, Federal Republic of Germany. Schriftenreihe für Vegetationskunde 1976, 9-27.
- Kowarik, I. Natürlichkeit, Naturnähe und Hemerobie als Bewertungskriterien. In Handbuch Naturschutz und Landschaftspflege. W. Konold, W., Böcker, R., Hampicke, U. Eds. Wiley--VCH Verlag Hoboken, NJ, USA, 2014, 1-18.
- Erb, K.-H., Haberl, H., Jepsen, M. R., Kuemmerle, T., Lindner, M., Müller, D., Verburg, P. H., et al. A conceptual framework for analysing and measuring land-use intensity. Current Opinion in Environmental Sustainability. 2013, 5, 464–470. [CrossRef]
- Erb, K.-H. , Fetzel, T., Haberl, H., Kastner, T., Kroisleitner, C., Lauk, C., Niedertscheider, M., et al. Beyond Inputs and Outputs: Opening the Black-Box of Land-Use Intensity. In Social Ecology: Society-Nature Relations across Time and Space. Haberl, H., Fischer-Kowalski, M., Krausmann, F., Winiwarter, V. Eds. Springer International Publishing, Cham, Switzerland, 2016, pp. 93-124.
- Hill, M. O., Roy, D. B., Thompson, K. Hemeroby, urbanity and ruderality: bioindicators of disturbance and human impact. Journal of Applied Ecology. 2002, 39, 708–720. [CrossRef]
- Steinhardt, U. , Herzog, F., Lausch, A., Müller, E., Lehmann, S. Hemeroby index for landscape monitoring and evaluation. In Environmental indices - system analysis approach. Pykh, Y. A., Hyatt, D. E., Lenz, R. J. Eds. EOLSS Publ., Oxford, 1999, pp. 237-254.
- Takasaki, Y., Coomes, O. T., Abizaid, C., Kalacska, M. Landscape-scale concordance between local ecological knowledge for tropical wild species and remote sensing of land cover. Proceedings of the National Academy of Sciences. 2022, 119, e2116446119. [CrossRef]
- Goussios, D., Faraslis, I. The Driving Role of 3D Geovisualization in the Reanimation of Local Collective Memory and Historical Sources for the Reconstitution of Rural Landscapes. Land. 2023, 12. [CrossRef]
- Sousa, A., García-Murillo, P. Can place names be used as indicators of landscape changes? Application to the Doñana Natural Park (Spain). Landscape Ecology. 2001, 16, 391–406. [CrossRef]
- Serra, P., Salvati, L. Land Change Science and the STEPLand Framework: An Assessment of its Progress. Land. 2022, 11, 1065. [CrossRef]


Semi-natural and protected: In such areas, humans harvest a share of the yield from natural regulation, like small scale forest dwellers or regulatory hunters (game only) and careful gatherers do. Extensively used: eco-systems with low external inputs. Extensive use sets some framework conditions and uses the natural regulation mechanisms to produce the harvest. Intensively used: eco-systems with high input levels. They are dependent on hands-on steering of the system dynamics, humans dominating natural regulation processes. Human made: area, i.e., built environment, characterised by humans suppressing and replacing natural regulation processes. Hemeroby classification following Steinhardt et al. [37], who refer to Sukopp [32]. Following Kowarik [29], we understand hemeroby as an inverse measure of naturalness if anthropogenic interventions are reversible. Hence, unimpacted nature and irreversibly damaged systems are excluded from LUI. Reversibility estimates from past experience. Source: author. | |||||
| Nature-free | Class IV | Class III | Class II | Class I | Nature |
| fabricated systems | human made systems | intensively used systems | extensively used systems | semi-natural & protected systems | uninfluenced systems |
| metahemerobe | polyhemerobe | euhemerobe | mesohemerobe | oligohemerobe | ahemerobe |
| biocenoses destruction irreversible | partial reversibility, support dependent | partial reversibility, time consuming | almost full reversibility, natural process | full reversibility, natural process | no reversibility required |
| Examples: | |||||
| mining, quarrying, sealed soil under infrastructure | settlement areas with green & blue elements (patchwork) | intensive agriculture, tree plantations, high yielding monocultures | organic agriculture, sustainable forestry, agroforestry | protected and abandoned systems indigenous land use | don’t exist due to long-distance impacts |
| Selected references: | |||||
| (WBGU 1999) | use without protection | protection despite use | protection by use | protection from use | |
| (Haberl 2002) | industrial mode | intensive agricultural mode | organic agricultural mode | hunter and gatherer mode | |
| human made capital (Daly 1996) | cultivated natural capital | used/exploited natural capital | undisturbed natural capital | ||
| sterile use (Binswanger, Chakrabarty 2000) | productive use | protective use | |||
| Use intensity | Intensively used | Extensively used | Semi-natural &protected |
|---|---|---|---|
| Land type | |||
| Forest | monocultures, age classes, clear cutting, high yielding varieties IUCN category T7.3 | mixed age and species, natural rejuvenation, some neophyt species; certified forestry is no IUCN category | indigenous and primary forests, local species, selective extraction IUCN category T1 – T3 |
| Pasture land | grazing cattle and goats IUCN category T7.2 | low impact grazing, e.g., sheep or deer IUCN category T7.5 | game only, regulatory hunting, IUCN category T4 |
| Agricultural land | intensive agriculture IUCN category T7.1 | Organic agriculture, agroforestry, agroecology (as mentioned in the GBF) IUCN category T7.5 | cautious gathering, no IUCN category yet |
| 1 | However, it does not mention the UNEP International Resource Panel, which found that 90% of biodiversity loss and water stress are caused by resource extraction and processing, the same activities which also contribute to about half of global greenhouse gas emissions [4]. |
Disclaimer/Publisher’s Note: The statements, opinions and data contained in all publications are solely those of the individual author(s) and contributor(s) and not of MDPI and/or the editor(s). MDPI and/or the editor(s) disclaim responsibility for any injury to people or property resulting from any ideas, methods, instructions or products referred to in the content. |
© 2023 by the authors. Licensee MDPI, Basel, Switzerland. This article is an open access article distributed under the terms and conditions of the Creative Commons Attribution (CC BY) license (http://creativecommons.org/licenses/by/4.0/).


