1. Introduction
The increasing awareness and sensibility on environmental impacts of production and consumption patterns have pointed out the need to enhance the sustainability of industries and consumers [
1,
2]. Life cycle assessment (LCA), based on ISO 14,040 and ISO 14044, is a standardized tool that may help decision-makers develop a strategic plan based on environmental aspects [
3,
4,
5]. This methodology quantifies the environmental impacts in all stages of the process, from raw material withdrawal to final disposal (i.e. from cradle to grave), to improve the environmental performance of products/organizations along their life cycle or compare different services/products in terms of sustainability [
6,
7,
8]. Based on ISO 14,040 and ISO 14044, several methodological approaches were developed to carry out a life cycle impact assessment yielding a puzzling situation for both producers and consumers [
9]. In 2011, the European Commission Joint Research Centre (EC-JRC) published the International Reference Life Cycle Data System (ILCD) Handbook recommendations in 2011 to detail guidance and standards for applying LCA with quality and robustness. Hence, the Recommendation 2013/179/EU defines a uniform method for assessing and disclosing a product's (PEF) and organization's (OEF) environmental footprint and develops a single market for green product initiatives. From 2013 to 2018, during a pilot phase, volunteering companies developed product and sector rules (PEFCR and OEFCR, respectively) which defined a category benchmark. In 2019, a subsequential transition phase began, with the extension of the category rules to other products/sectors and the adoption of policies implementing these procedures [
9]. Finally in the 2021, the EU issued a more detailed recommendation (2279/2021/EU) gathering the information during the pilot phases [
7].
Within the field of wastewater treatment plants (WWTPs), the PEF/OEF can be leveraged to identify the best alternatives to adopt in an upgrade scenario or to establish the best operation decision from an environmental footprint standpoint. Furthermore, this methodology can be applied to estimate the overall environmental impact in terms of both direct impacts and indirect impacts [
10,
11,
12,
13,
14,
15,
16,
17,
18,
19,
20,
21,
22]. The direct impacts are linked to effluents and other emissions, whereas the indirect impacts are linked to energy and resources consumed. The PEF/OEF allows for the establishment of an impact score for each of the sixteen categories listed in the Recommendation. It is based on the mass flows of pollutants released in different environmental contexts as well as the resources used.
Since it is impossible to measure every pollutant (primary and secondary) present in an emission, non-targeted analyses have been receiving more attention, in an effort to describe these complex mixtures more accurately, while going beyond the lists of standards outlined in regulations and guidelines [
23,
24,
25]. The execution of bioassays (possibly organized in batteries, including various modes of toxicity action, biological complexity systems, and trophic roles) has been increasingly proposed, which is even more significant [
26,
27,
28,
29,
30,
31,
32]. Rather than focusing on a subset of known contaminants, this final strategy promotes the biological response by including both known and unknown chemicals in the mixture. Several researchers have been applied this bioanalytical approach on the wastewater [
30,
31,
32,
33,
34], drinking water [
35,
36,
37] and surface water [
38].
We have applied an alternative PEF/OEF procedure, based on the outcomes of the bioassays, to overcome the conventional protocol's shortcomings. Both procedures (current and alternative) were used on three different wastewater treatment plants that use conventional and advanced treatment processes, with a focus on two categories of impacts: human toxicity and freshwater ecotoxicity.
The goal of this study was to critically examine the protocols provided for defining risk to human health and the aquatic water ecosystem in order to understand their persistent criticalities (it should be noted that the calculation of OEF/PEF cannot yet officially include toxicity categories, precisely because of the uncertainty in risk estimation) and to propose alternative methods of overcoming them.
The parallel application of the two protocols (in force and innovative) was successfully carried out on case studies that were well known to the authors, who had access to reliable and historical data sets.
Because of their unique sensitivity, the results suggest that bioassay performance could be included in LCA protocols.
2. Materials and Methods
2.1. Wastewater Treatment Plants
The three wastewater treatment plants, chosen as case studies, are located in Northern Italy.
WWTP A (design size 370,000 population equivalent, p.e.) is a conventional activated sludge system treating municipal wastewater with the contribution of agro-food industrial discharge. The scheme of the plant is reported in
Figure 1.
WWTP B (design size 60,000 p.e.) consists of a conventional activated sludge system. This plant has a significant winery effluent during the grape harvest period (September and October) that increases the organic pollution load. The scheme of the plant is depicted in
Figure 2.
WWTP C (design size 380,000 p.e.) uses three process lines to treat primarily municipal wastewater: two CAS (conventional activated sludge) lines and one MBR (membrane bioreactor) line. The two treatment lines are depicted in
Figure 3 and
Figure 4.
A detailed description of the WWTPs and the main operational parameters are reported in [
29,
39].
2.2. Sampling Procedures
All effluents were monitored using 24-hour flow proportional composite samples (refrigerated autosampler). The samples were collected in WWTP A and C during a single monitoring campaign, whereas in WWTP B, two monitoring campaigns were conducted to account for both routine time and grape harvest period. [
40] provides more detailed information on the sampling procedure, while [
41] summarizes sample pre-treatments after collection.
2.3. PEF/OEF Procedures
The goal of this research is a comparison between the environmental footprint obtained with the conventional method and the environmental impact calculated from the bioassay outcomes, using 1 m3 of treated wastewater as a functional unit.
The environmental footprint of the aforementioned WWTPs is calculated using only two impact categories: freshwater ecotoxicity and human toxicity cancer. The system boundaries coincide with the boundaries of the case study WWTPs. However, only the direct emissions in the water bodies are considered in the evaluation, disregarding other direct emissions and indirect emissions such as raw material consumption, the construction phase, energy consumption, sludge production, and waste production. This decision is motivated by the strong correlation between the residual pollution in the discharged water and the two impact categories chosen.
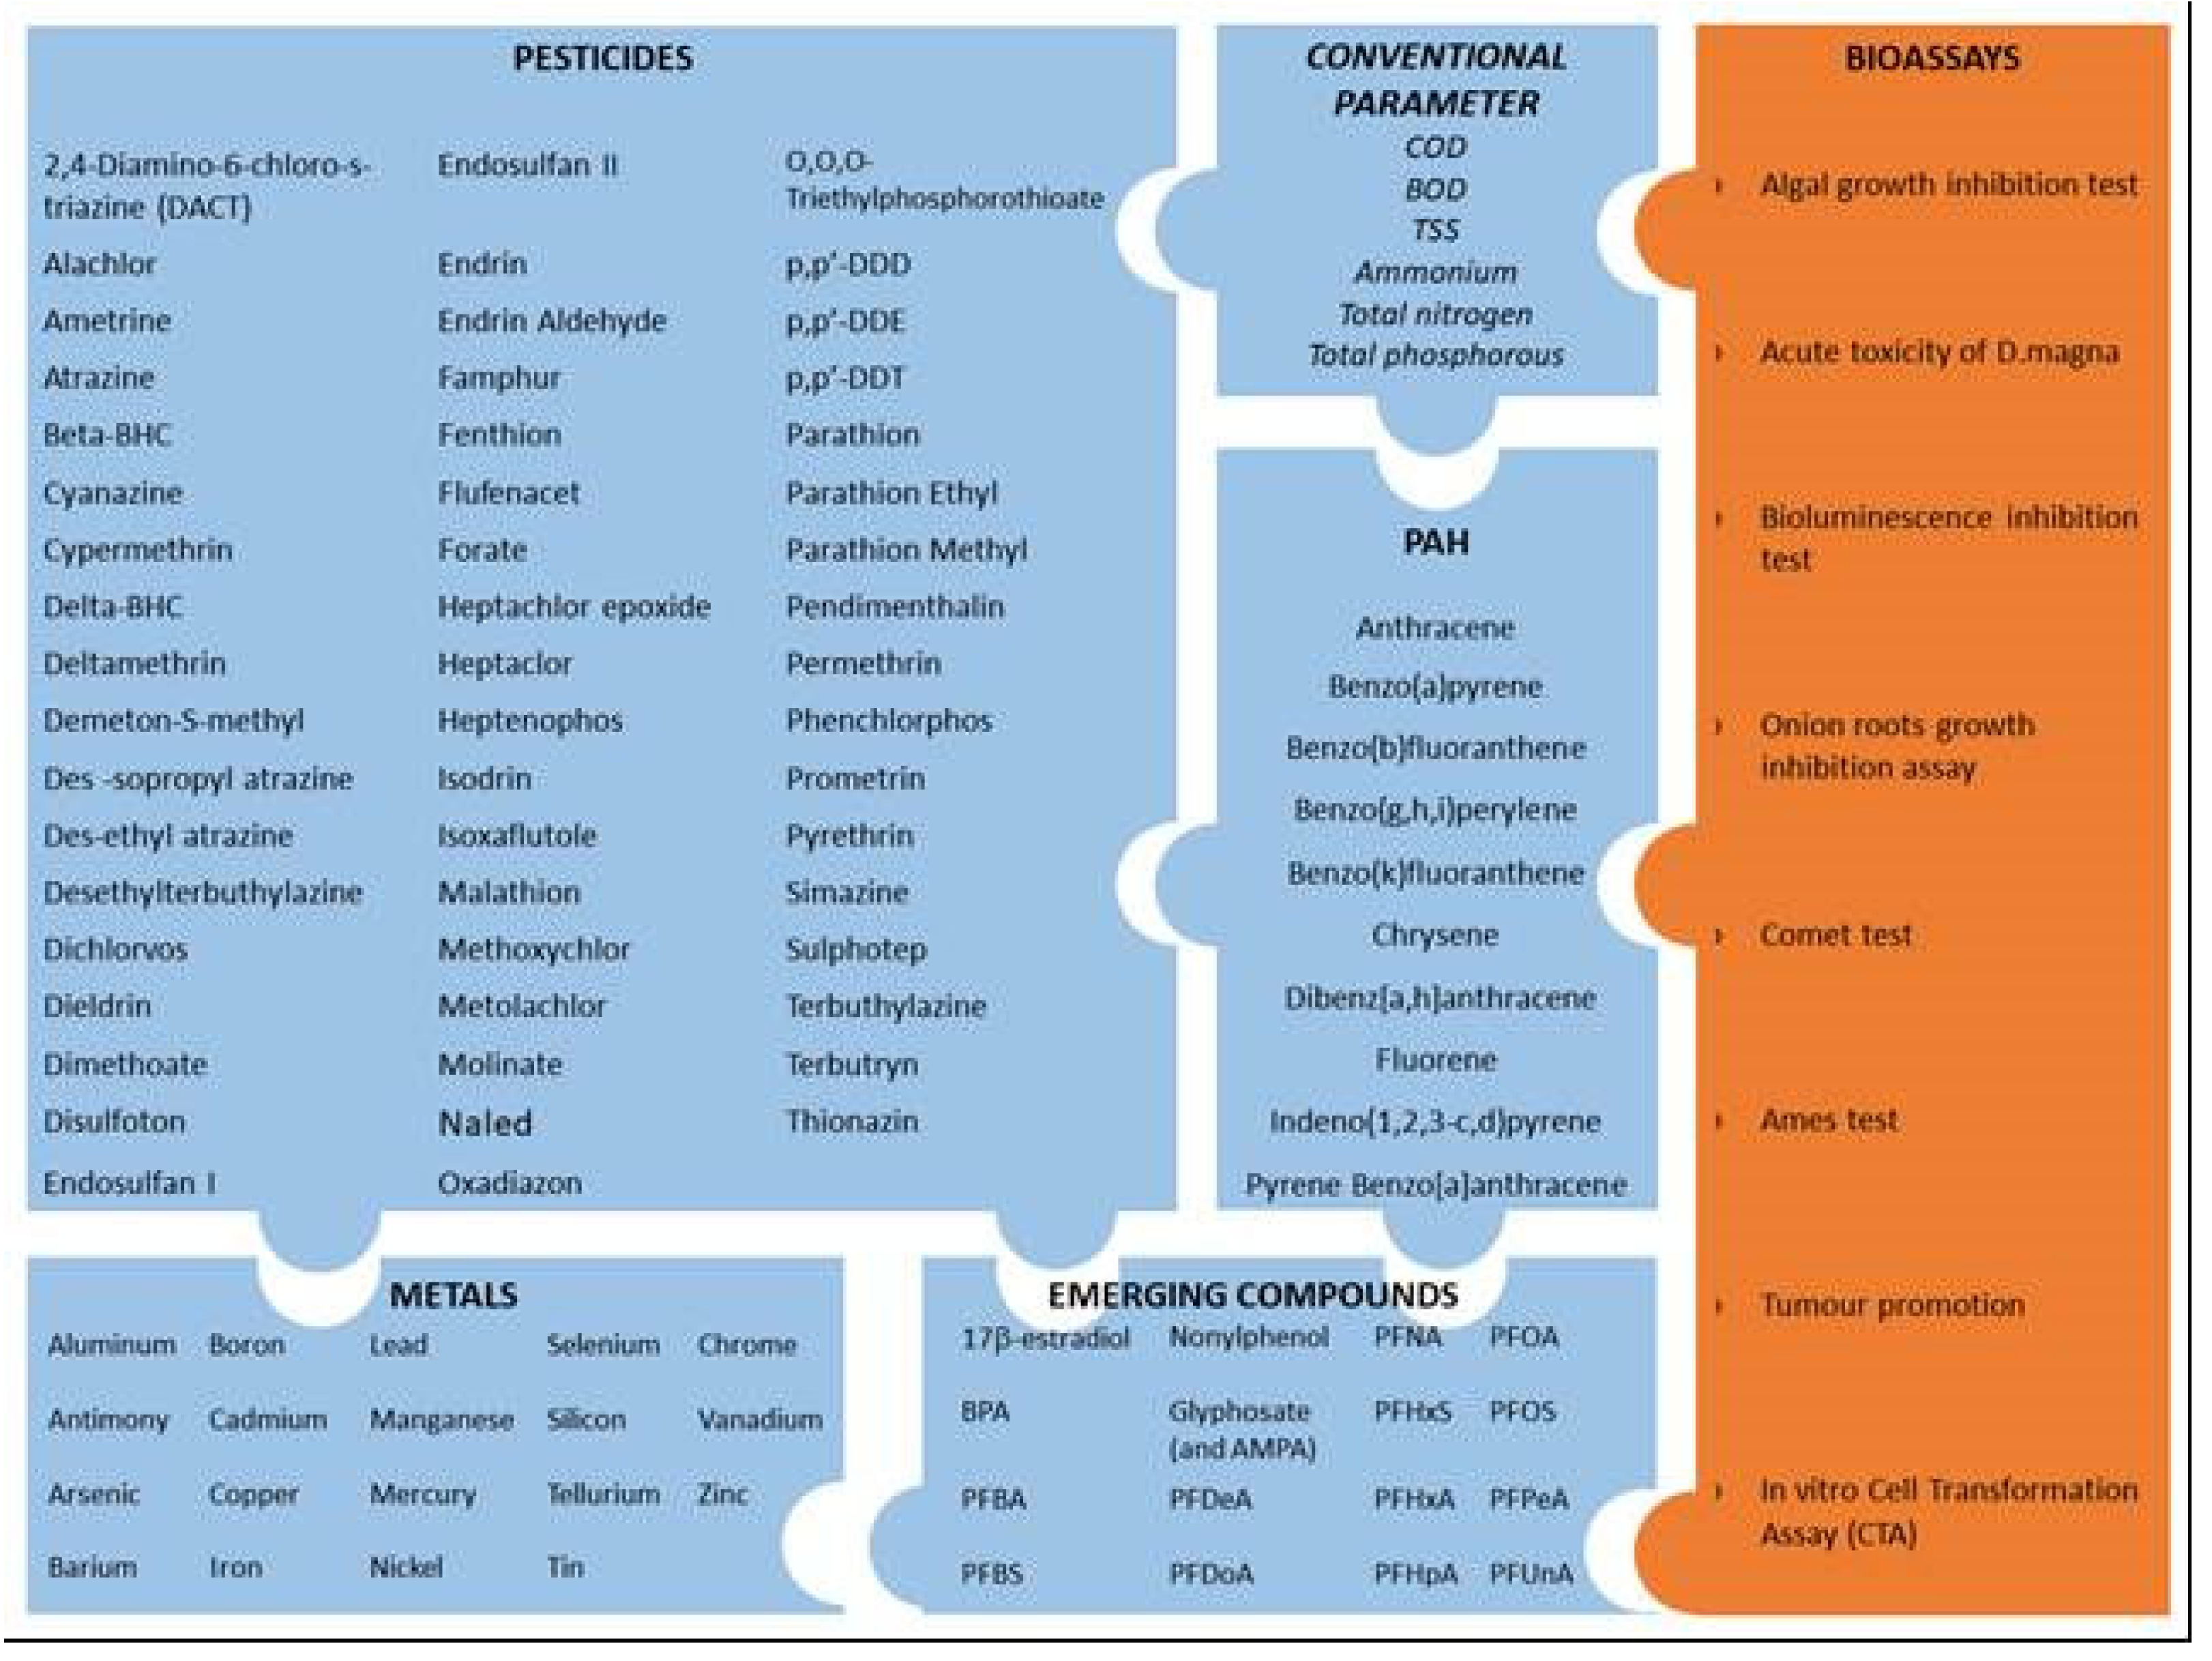
During the inventory phase, primary data were collected in order to create an input data folder. Primary data include effluent characteristics (for the conventional environmental footprint method) as well as bioassay results (for alternative environmental footprint approach). Effluent properties include standard parameters (BOD, COD, TSS, N, P, and others) as well as metals, semimetals, and organic compounds (see
Figure 5) [
29,
39].
The same composite samples, which were also subjected to chemical analyses, were subjected to eight bioassays in order to test organisms at various levels of the trophic chain and investigate various modes of action. To assess the cytotoxicity, four bioassays were performed:
algal growth inhibition test [
42]
crustacean cladocera acute toxicity [
43]
inhibition of bacteria bioluminescence [
44]
inhibition of onion root growth [
45].
Baseline toxicity identifies damaged living cells, which may result in planned or unplanned cell and tissue death [
28]. To detect genetic toxicity, two bioassays were used: the Comet test [
46,
47,
48], and the Ames test [
46,
49].
The Comet assay detects damaged DNA in human leukocytes, whereas the Ames test looks into point reverse mutations in
S. typhimurium strains (frameshift mutation, TA 98, and base-pair substitution, TA 100) with and without metabolic activation (S9). Finally, to assess carcinogenicity, two ecotoxicological assays were performed: tumor promotion and in vitro Cell Transformation Assay (CTA). The first test is related to the duplication of initiated cells (progression phase), whereas the second test is related to the subsequential phase in which unstable promoted cells become stable malignant tumors (progression phase) [
28]. [
41] provides detailed information.
The subsequent stage of the life cycle involves calculating the impact. Thus, the magnitude of potential environmental impacts of discharged water was calculated using the USEtox model for both human toxicity cancer and freshwater ecotoxicity, as shown in the Equation (1) below:
where:
: Impact Score for the considered impact category
: Characterization Factor of the substance emitted to compartment
is the emitted ass of substance to compartment .
This model depicts the relative importance of each emission reported in the inventory. The calculation of impact categories indicators in the PEF/OEF methodologies is based on mass flows of measured chemicals in discharged water. The environmental footprint, based solely on chemical analyses, serves as the standard against which the impacts obtained through the alternative procedure are measured.
The novel methodology used to calculate the environmental impact of these two categories is based on biological equivalent concentration. Using a dose-response calibration curve of a reference compound, the bioassay results were converted into biological equivalent concentrations. The biological equivalent concentration is the amount of the reference compound that produces the same effect as the tested mixture (i.e., discharge water). In this case, five reference substances (inorganics: cadmium and zinc; organic: 3,5-dichlorophenol, dodecylbenzene sulphonic acid, and maleic hydrazide acid) were used to create specific scenarios for each wastewater treatment plant. The remaining four ecotoxicological assay results were also used to evaluate the "human toxicity cancer" category, where three reference substances (3-methylcholanthrene, lindane, and methyl methanesulfonate) yield specific scenarios for each wastewater treatment plant.
Two different datasets of characterization factors (CFs) were used in both environmental footprint methods to evaluate how CFs affect the impact score. The first CF dataset came from the International Reference Life Cycle Data System (ILCD v.1.09), while the second came from the EF 3.0 package. The following section goes into greater detail about the characterization factors.
Two different datasets of characterization factors (CFs) were used in both environmental footprint methods to evaluate how CFs affect the impact score. The first CF dataset came from the International Reference Life Cycle Data System (ILCD v.1.09), while the second came from the EF 3.0 package.
The United Nations Environment Program (UNEP)-Society for Environmental Toxicology and Chemistry (SETAC) Lyfe Cycle Initiative conducted an overall comparison of seven life cycle impact assessment toxicity characterization models (CalTOX, IMPACT 2002, USES-LCA, BETR, EDIP, WTSON, and EcoSense) in 2005 to develop a scientific consensus model. The USEtox 1.01, a meaningful toxic impact characterization model that calculates the CFs for freshwater ecotoxicity and human toxicity, was the result of this process [
50]. The product of three matrices filled with the corresponding factors for the successive steps of fate (FF), exposure (XF), and effects (EF) yields CFs, as shown in the following equation:
USEtox expresses CFs in two ways depending on the impact category: for freshwater ecotoxicity, the unit is the potentially affected fraction of species (PAF) integrated over the freshwater volume (m3) and the duration of 1 day (d) per kg of emission (PAF.m3.d/kg), whereas for human toxicity, the unit is the number of disease cases per kg of emission (cases/kg). The CFs are then summarized as comparative toxic units (CTU) per kg of emission in the software calculation (specifically CTUe/kg for the first examined category and CTUh/kg for the second). USEtox has been included in the ILCD recommendations and the EU Commission Product and Organization Environmental Footprint 2013/179/EU (PEF/OEF) in its pristine version 1.01. Following the emergence of several concerns during the PEF pilot phase's use of the USEtox 1.01, the PEF Technical Advisory Board (TAB) removed freshwater ecotoxicity, human cancer, and human not cancer toxicity impact categories from the mandatory impact categories to be communicated in the context of PEF/OEF in December 2016. Using physicochemical and toxicity data from the Registration, Evaluation, Authorisation and Restriction of Chemicals (REACH), European Food Safety Authority (EFSA), and Pesticide Properties Database (PPDB) databases, the EC-JRC calculated new freshwater ecotoxicity characterization factors for 6011 substances, 3423 CFs for human toxicity non cancer, and 621 CFs for human toxicity cancer using the USEtox 2.1. The three impact categories mentioned above are then recommended to be used in the EF context with the level of recommendation III (recommended but to be employed with caution) [
51].
Table 1 and
Table 2 show the values of the characterizing factors of the adopted reference substances based on the ILCD and the EFs inventory, respectively, for freshwater ecotoxicity and human toxicity/non-cancer.
3. Results and Discussion
3.1. Standard Approach
A thorough examination of the standardized approach reveals some flaws in the methodology that introduce uncertainty into the final impact score. The following are the weaknesses (•,♦,∗,~):
The characterization factor is an important parameter in determining the impact score. It is influenced by the results of a battery of bioassays as well as physicochemical and fate properties (such as n-Octanol/Water partition coefficient, water solubility, vapor pressure, and so on). Indeed, these values represent the USEtox model's input data, which generates the characterization factor. The physicochemical data are classified into three quality levels (low, intermediate, and high) based on the reliability, adequacy of the study, type of study, qualifier, and compliance with good laboratory practices. Only the data labeled as "high" in terms of quality score are retained for each substance and each physicochemical parameter. When more data associated with the same quality score are available, the geometric mean is calculated to generate a unique value. However, not all chemicals are subjected to the same number and type of bioassays (both in terms of lifetime and tested organism), resulting in toxicity data of varying trustworthiness.
As a result, new reliability input data and/or an update to the USEtox model can alter the value of the CFs and, as a result, the impact score. As shown in
Table 1 and
Table 2, the updated version of USEtox, as well as some adjustments or additions to physicochemical and toxicity data, resulted in a significant change in the impact score.
The increased impact score in freshwater ecotoxicity (
Table 3) is primarily due to aluminum, a substance for which no factors were anticipated in the ILCD factor set. This substance has a significant impact on the assessment's impact factor, accounting for between 89 and 98 percent.
Unlike the previous category, the environmental footprint obtained with the new CF is significantly reduced in the human toxicity cancer category because the CF of arsenic, nickel, mercury, and lead have been diminished by an order of magnitude (see
Table 2).
- ♦
The expression of the limit of quantification (LOQ) in the chemical analyses.
There are three possible approaches to consider the concentration of released substances detected below the LOQ:
1) nil,
2) half the LOQ value,
3) equal to the LOQ.
The conventional method follows hypothesis 1; however, a concentration below the LOQ does not automatically imply the absence of the substance. Hypotheses 2 and 3 represent a safe condition that raises the impact score. Indeed, as shown in
Table 5, the three-hypotheses result in impact score values that differ by up to two orders of magnitude.
Because all contaminants are detected below the detection limit, hypotheses 2 and 3 theoretically lead to a baseline impact score that can be applied to any WWTP. As a result, this factor introduces a new level of unpredictability to the impact score.
Finally, another critical issue is the possibility of different measurement methods used in different laboratories, resulting in different LOQs for the same substance. As a result, comparing environmental footprint values becomes difficult.
The iceberg model proposed by [
28] explains another level of uncertainty in the impact score calculated using the standard protocol. The wastewater monitoring program evaluates the regulated chemicals, which are a subset of the known substances on a regular basis (the tip of the iceberg model). A significant unknown group of chemicals, representing the submerged portion of the iceberg, remain in the dark. Regardless of advances in analytical chemistry, it will never be possible to detect all the constituents of a mixture like wastewater. Despite the fact that suspect and non-target screening can identify far more chemicals than target analyses, unknown substances cannot be identified.
Furthermore, because this methodology focuses the evaluation on a subset of compounds for which a characterisation factor has been defined, the assessment of the true environmental impact of WWTPs is severely limited. Indeed, taking into account the most recent version of the characterization factor (EF 3.0), some emerging compounds detected in effluent above the limit of quantification (such as PFAS, per and polyfluoroalkyl substances and AMPA, α-amino-3-hydroxy-5-methyl-4-isoxazole-propionic acid) are not correlated with a characterization factor, effectively excluding substances from the evaluation. As a result, the environmental footprint calculated using this protocol does not provide a comprehensive assessment of the true impact of the WWTPs.
Chemicals exist as mixtures in wastewater effluent and all environmental water samples. The interactions between the individual chemicals that occur in the mixture are a critical factor in determining the toxicity of the sample. In fact, even if the substances are detected below the LOQ, the effect of the mixture may be concerning [
28].
The traditional protocol only takes into account the addition effect; however, the environmental footprint is the sum of the impacts caused by the detected substances. This aspect adds another layer of uncertainty because the synergistic/antagonistic effect can increase/decrease the impact score.
3.2. Alternative Approach
3.2.1. Critical Issues in Impact Score Evaluation
Using the results of bioassays, the innovative approach shifts the focus from individual chemicals to the overall toxicity of the mixture. It attempts to improve the robustness of the impact score by addressing the following flaws identified in the conventional protocol:
- ♦
The expression of the limit of quantification (LOQ) in the chemical analyses.
Instead of the emitted chemical concentration, the alternative approach uses the corresponding concentration as input data. This correction eliminates the LOQ issue because each response in the biological test corresponds to a value of biological equivalent concentration.
- ∗
Regulated, known and unknown chemicals.
- ~
Mixture effect.
Despite their inability to resolve single compounds, bioassays provide a comprehensive picture of the toxicity exerted by all chemicals present in a sample. The observed responses reflect a mixture of known and unknown substances (such as transformation products) measuring toxicity while considering the true interactions between the single components. As a result, the innovative procedure returns an impact score that considers the entire iceberg of pollutants rather than just the tip of the iceberg, as stated in the conventional approach. Chemicals can affect living organisms in a variety of ways. Some have non-specific effects, while others have specific toxic effects or reactive toxicity. As a result, it is critical to develop a battery of bioassays that includes both in vivo and in vitro assays.
It is worth noting that the novel method introduces a new level of variability in comparison to the traditional protocol. Indeed, the response of the tested organism is characterized by inherent variability in terms of experiment repeatability. This is a new weakness introduced by the alternative methodology, which is added to the first criticality (•).
Overall, the alternative protocol reduces the total number of criticalities, lowering the impact score's variability.
3.2.1. Freshwater Ecotoxicity: Outcomes
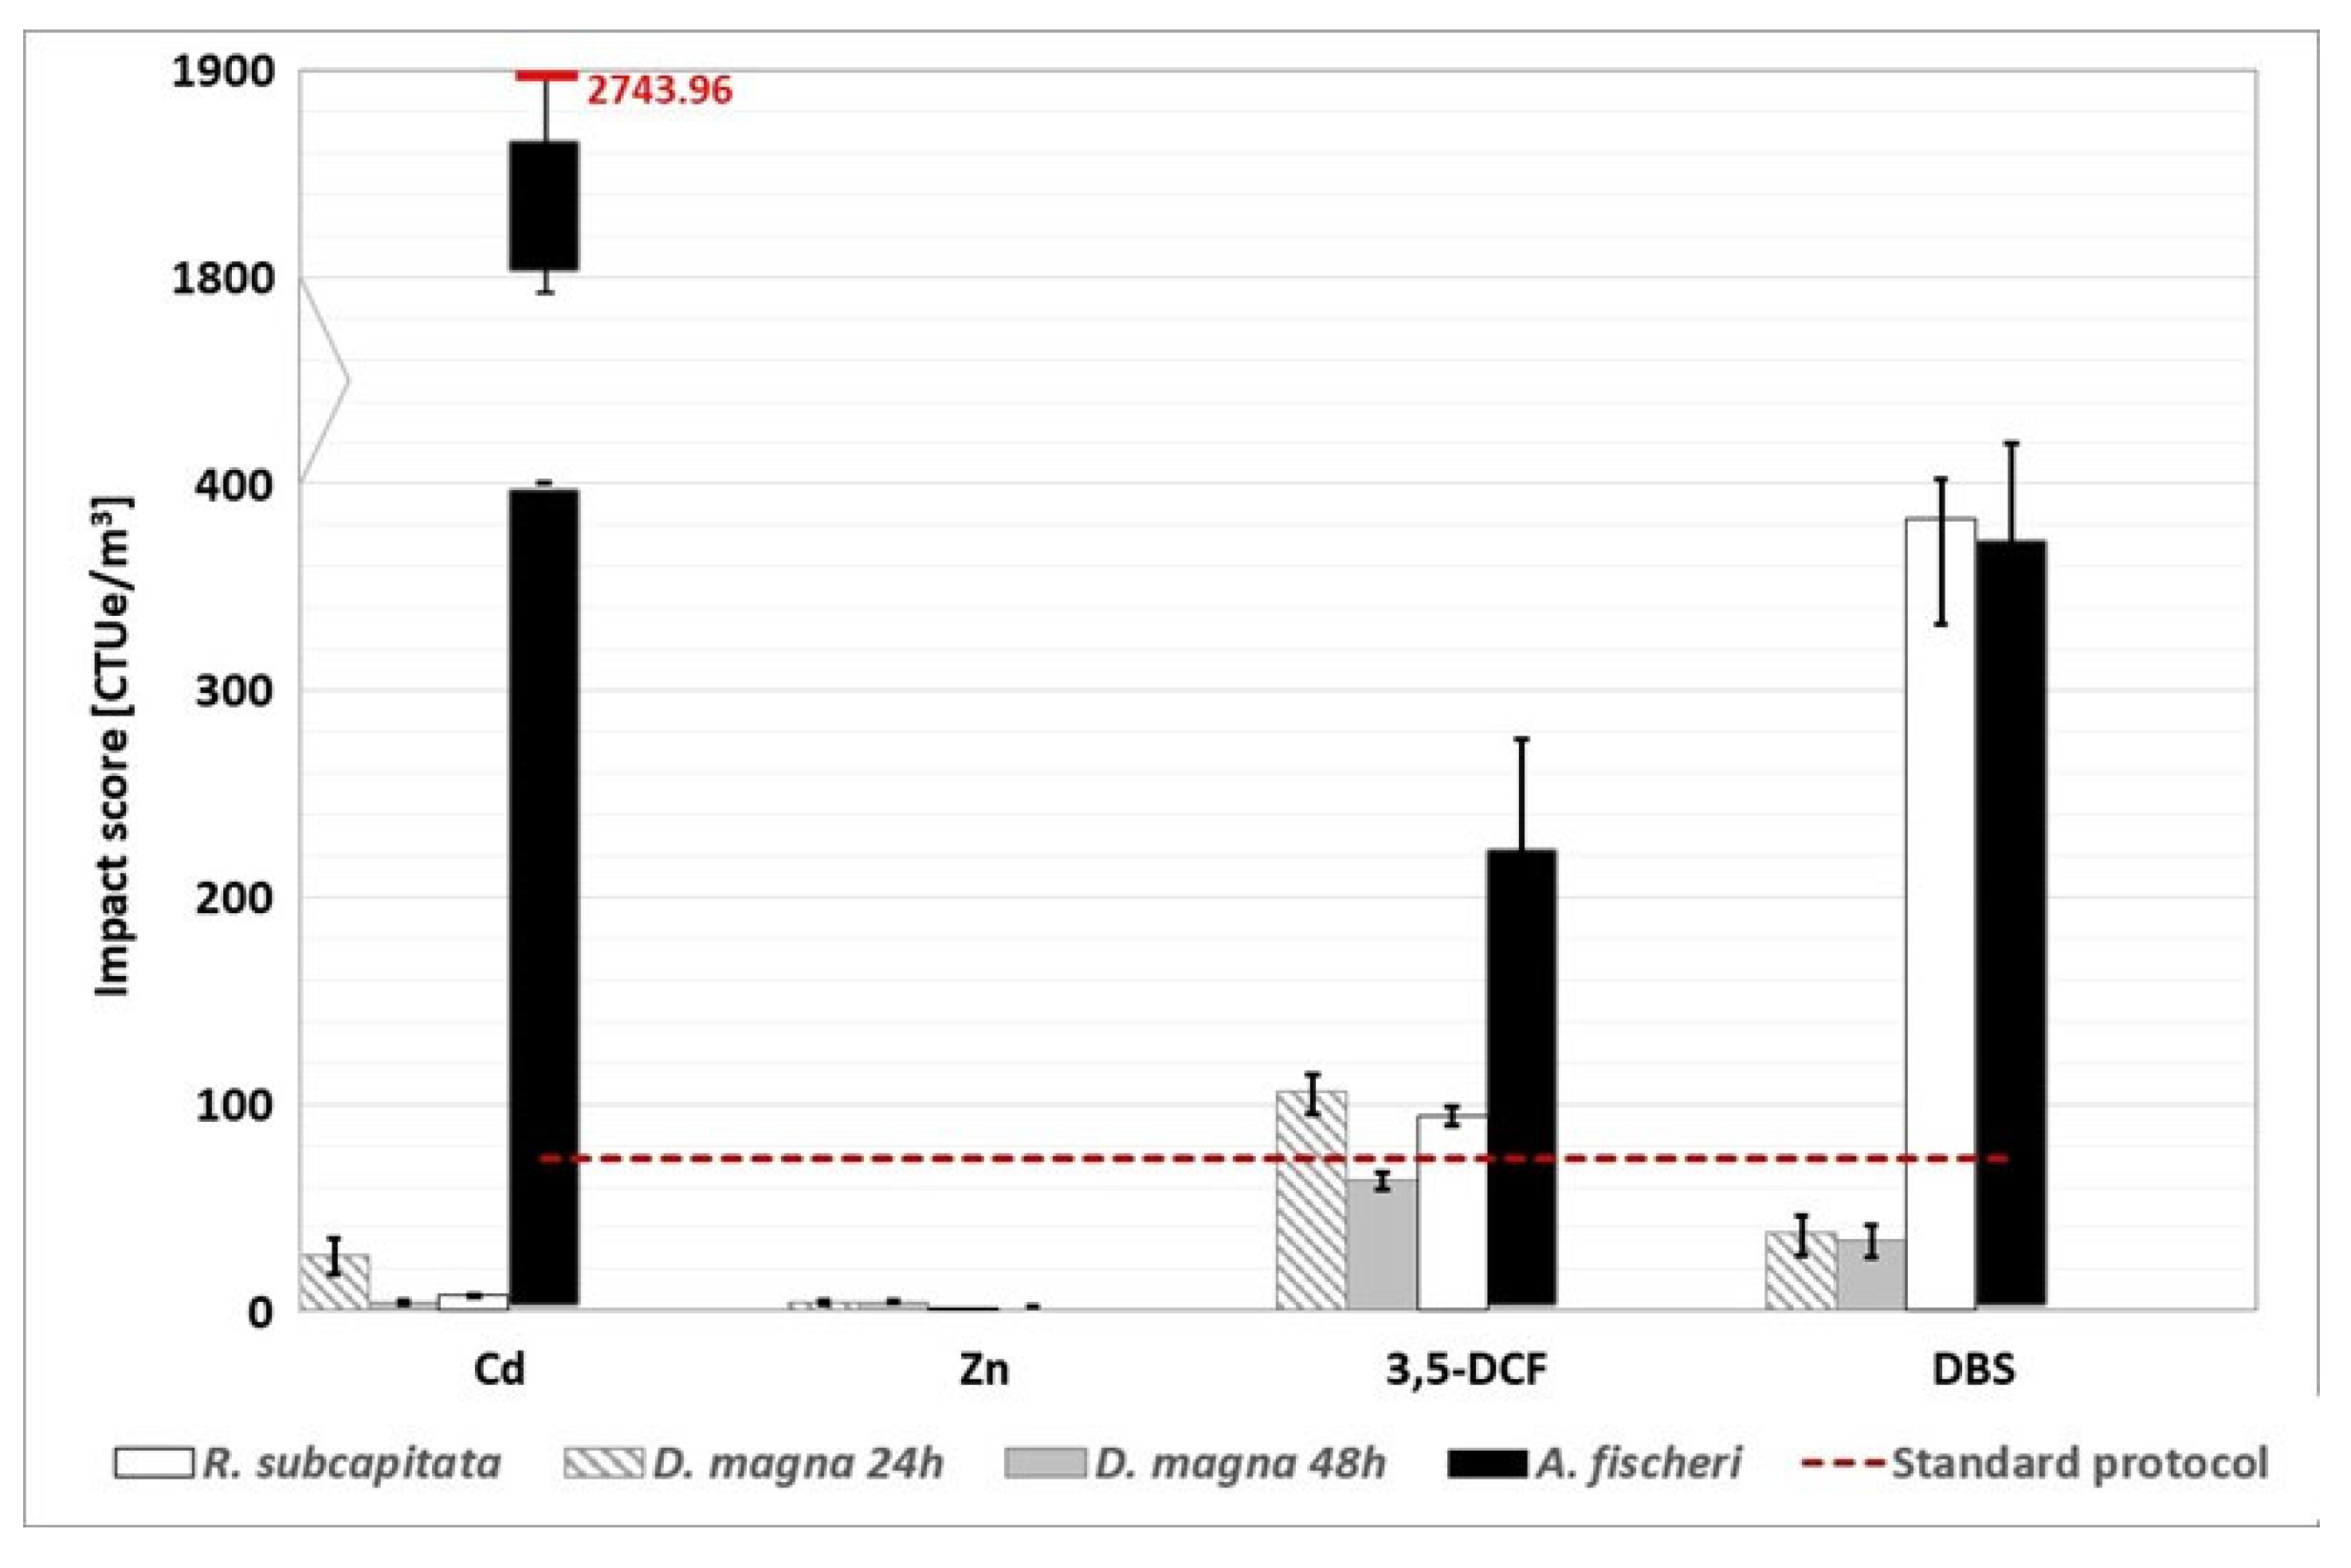
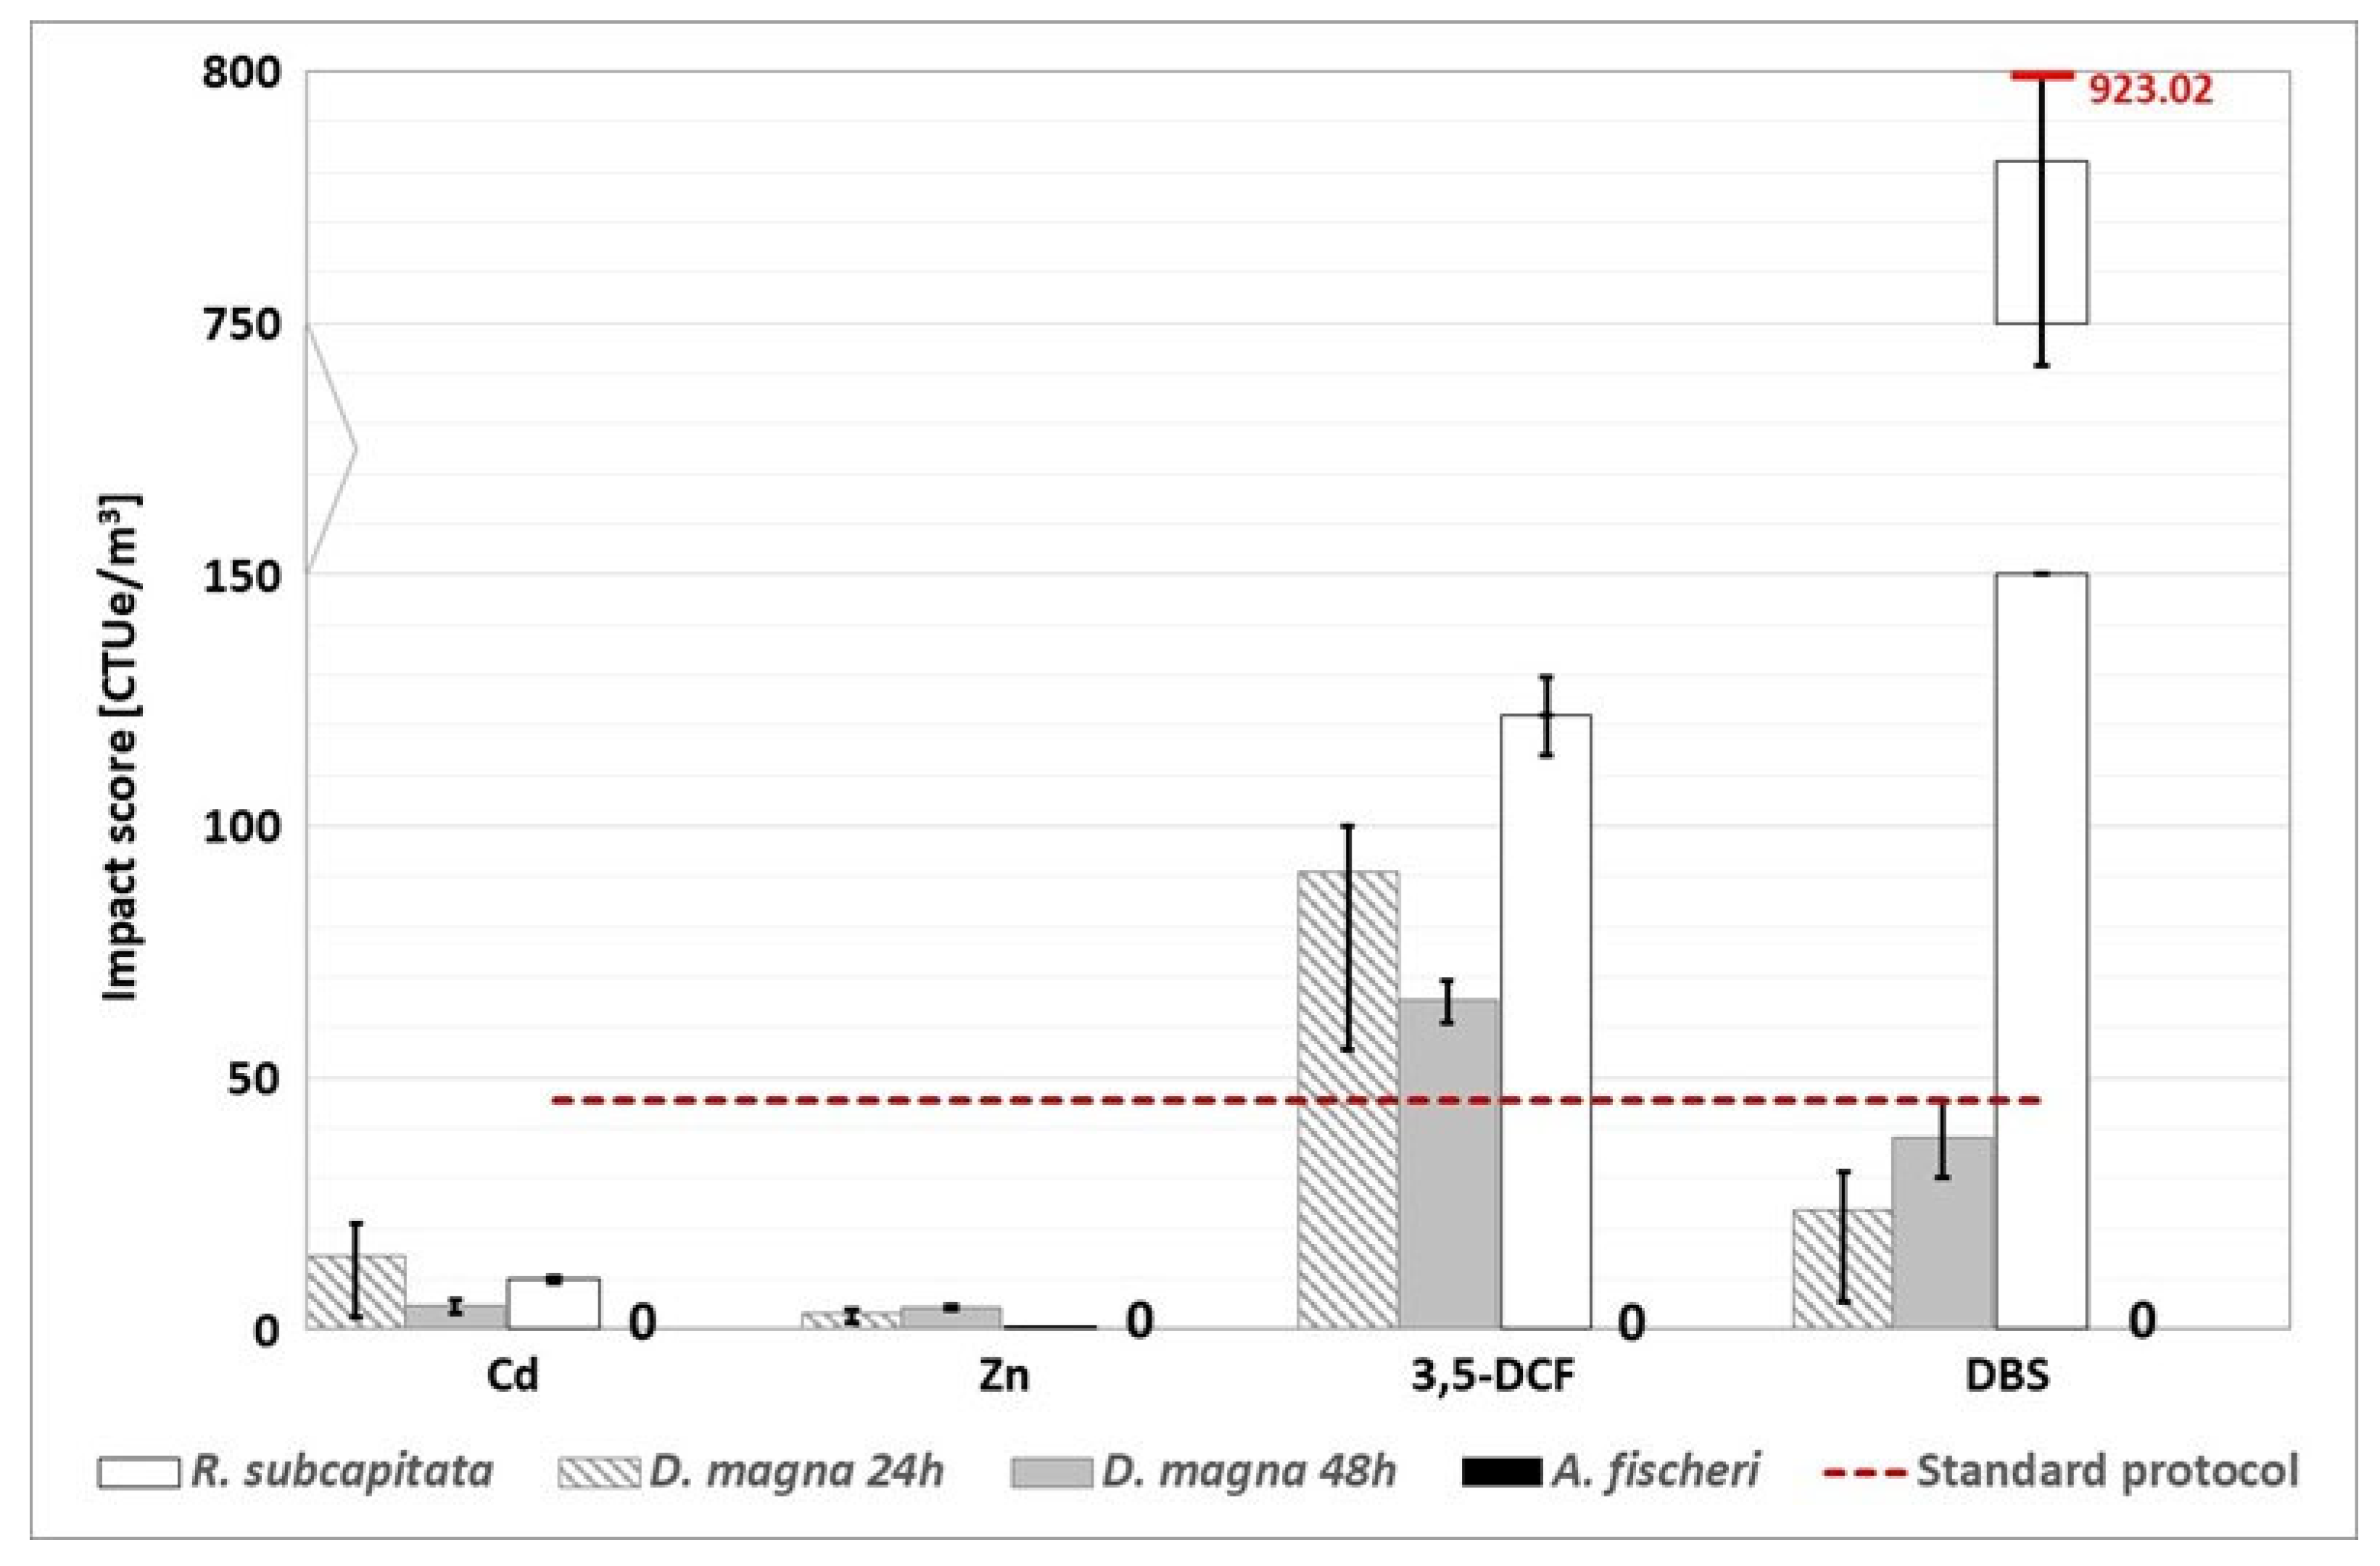
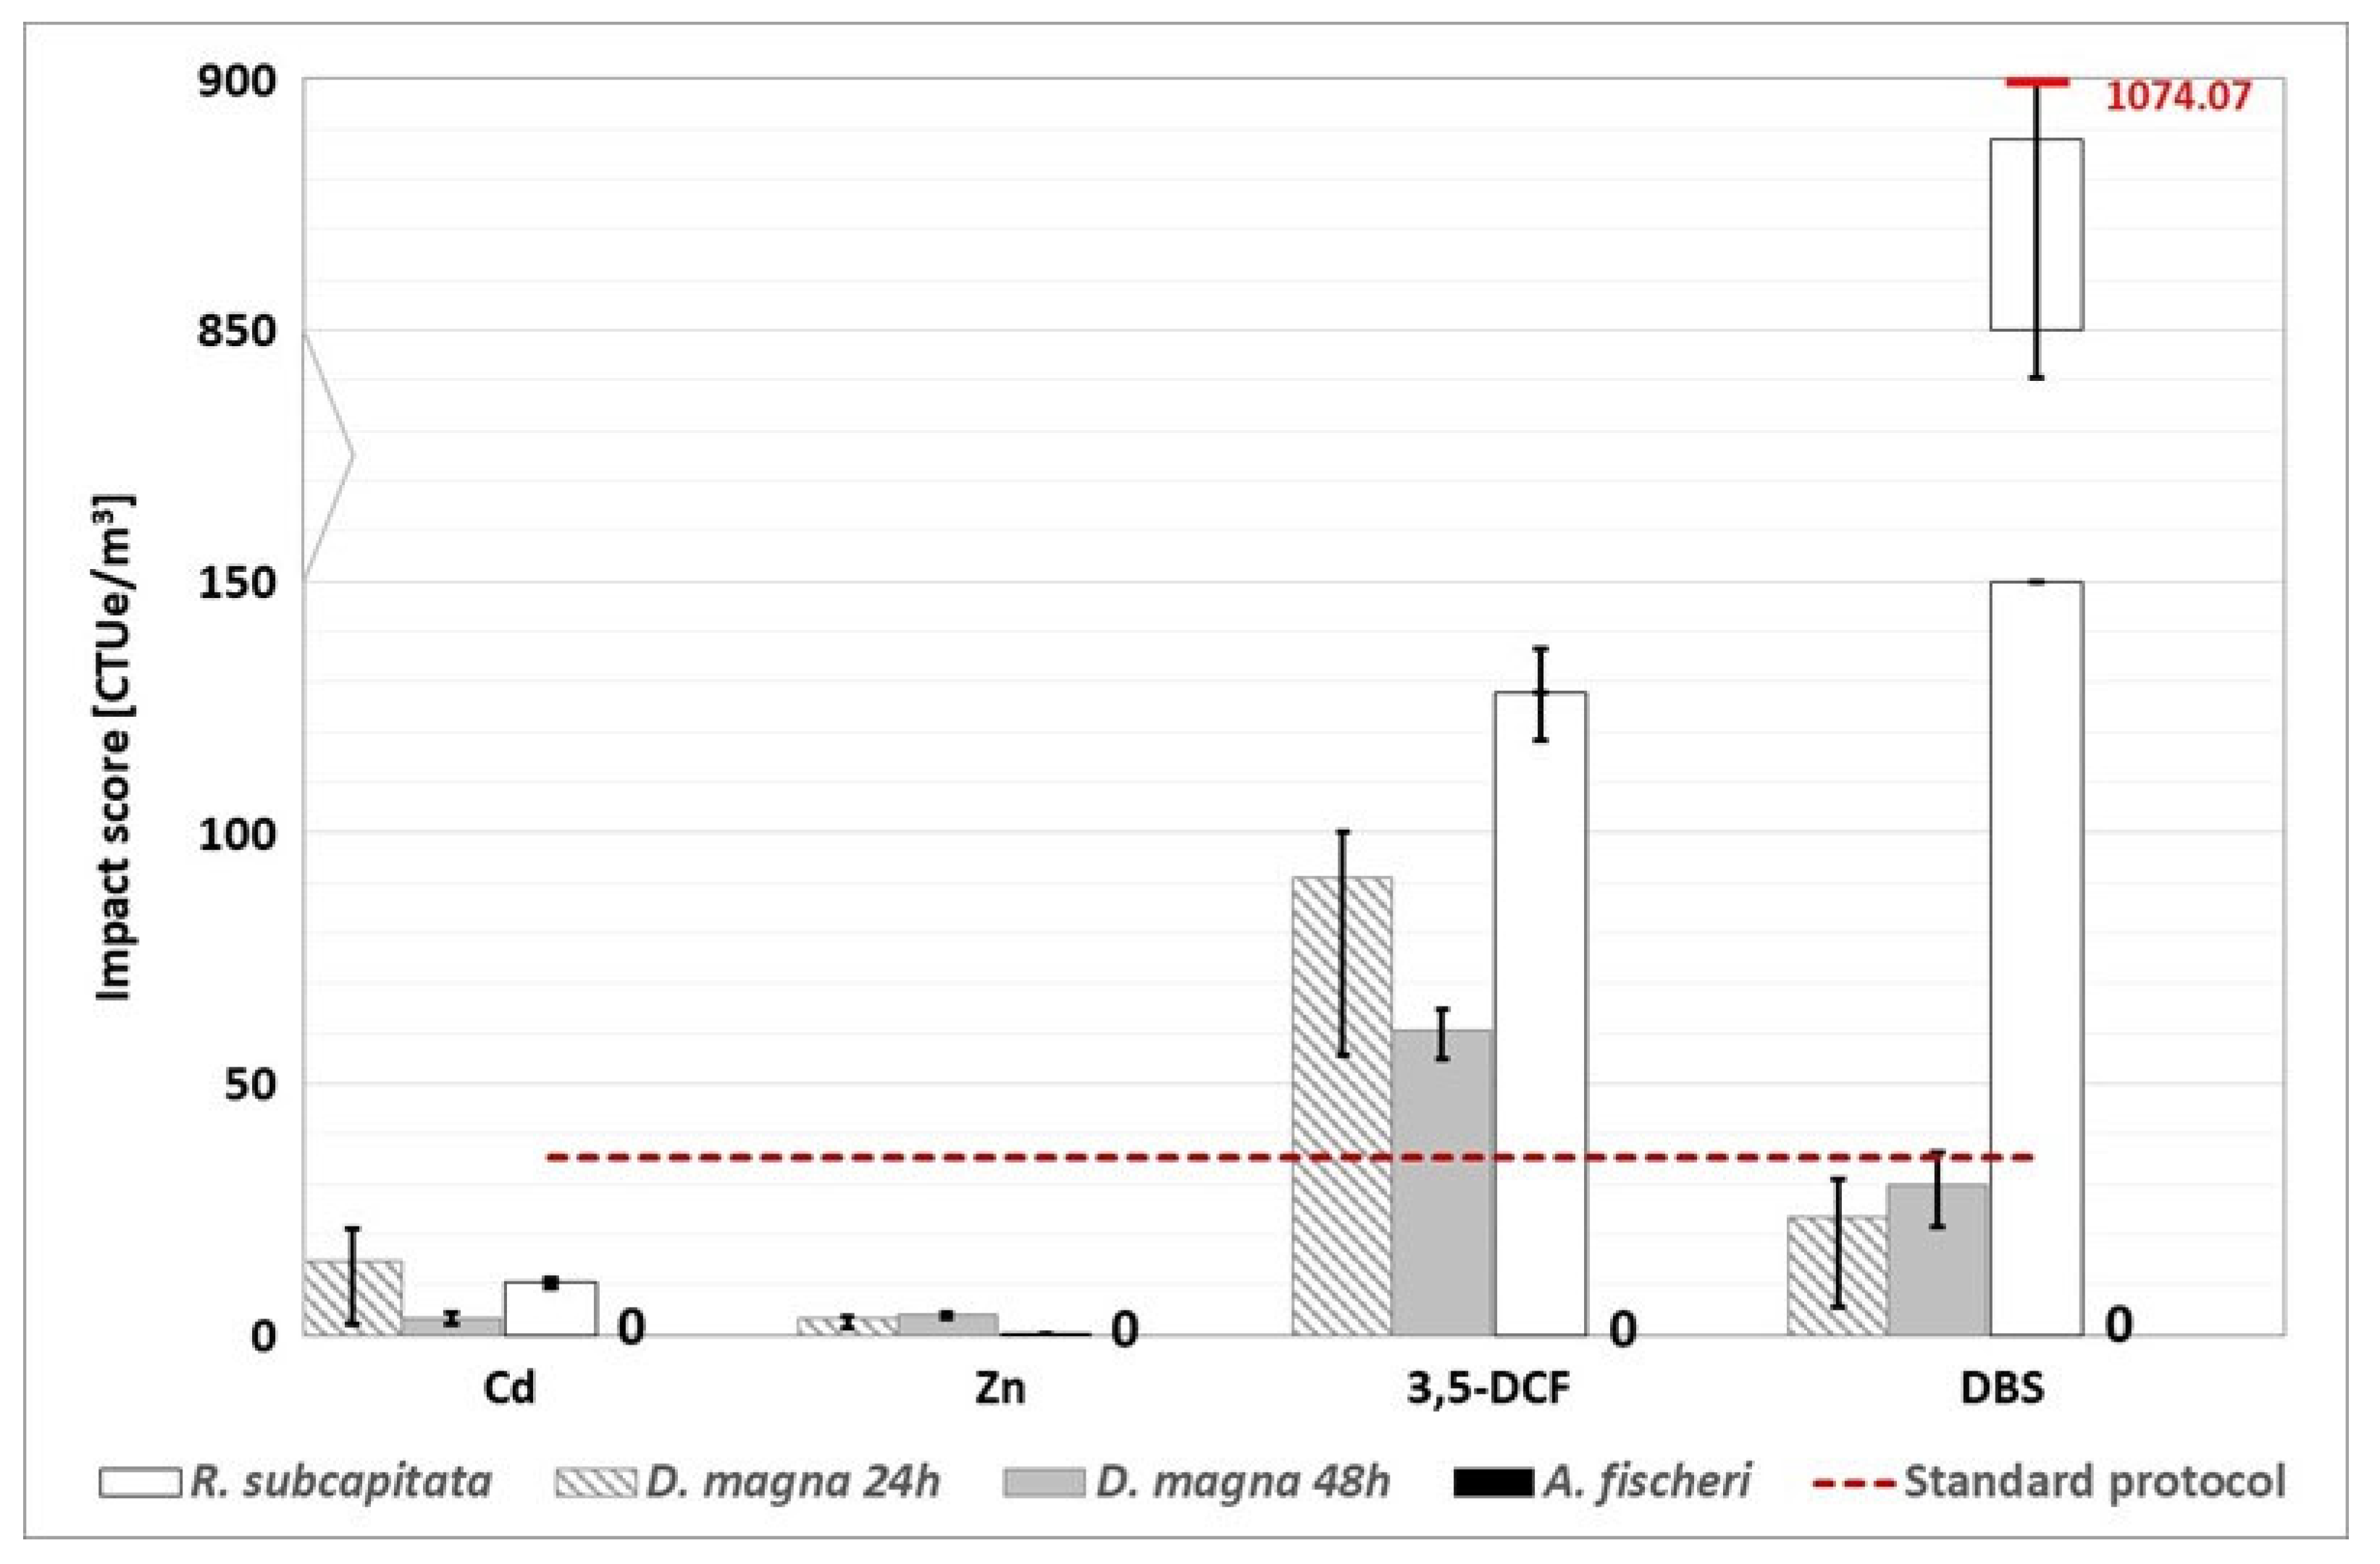
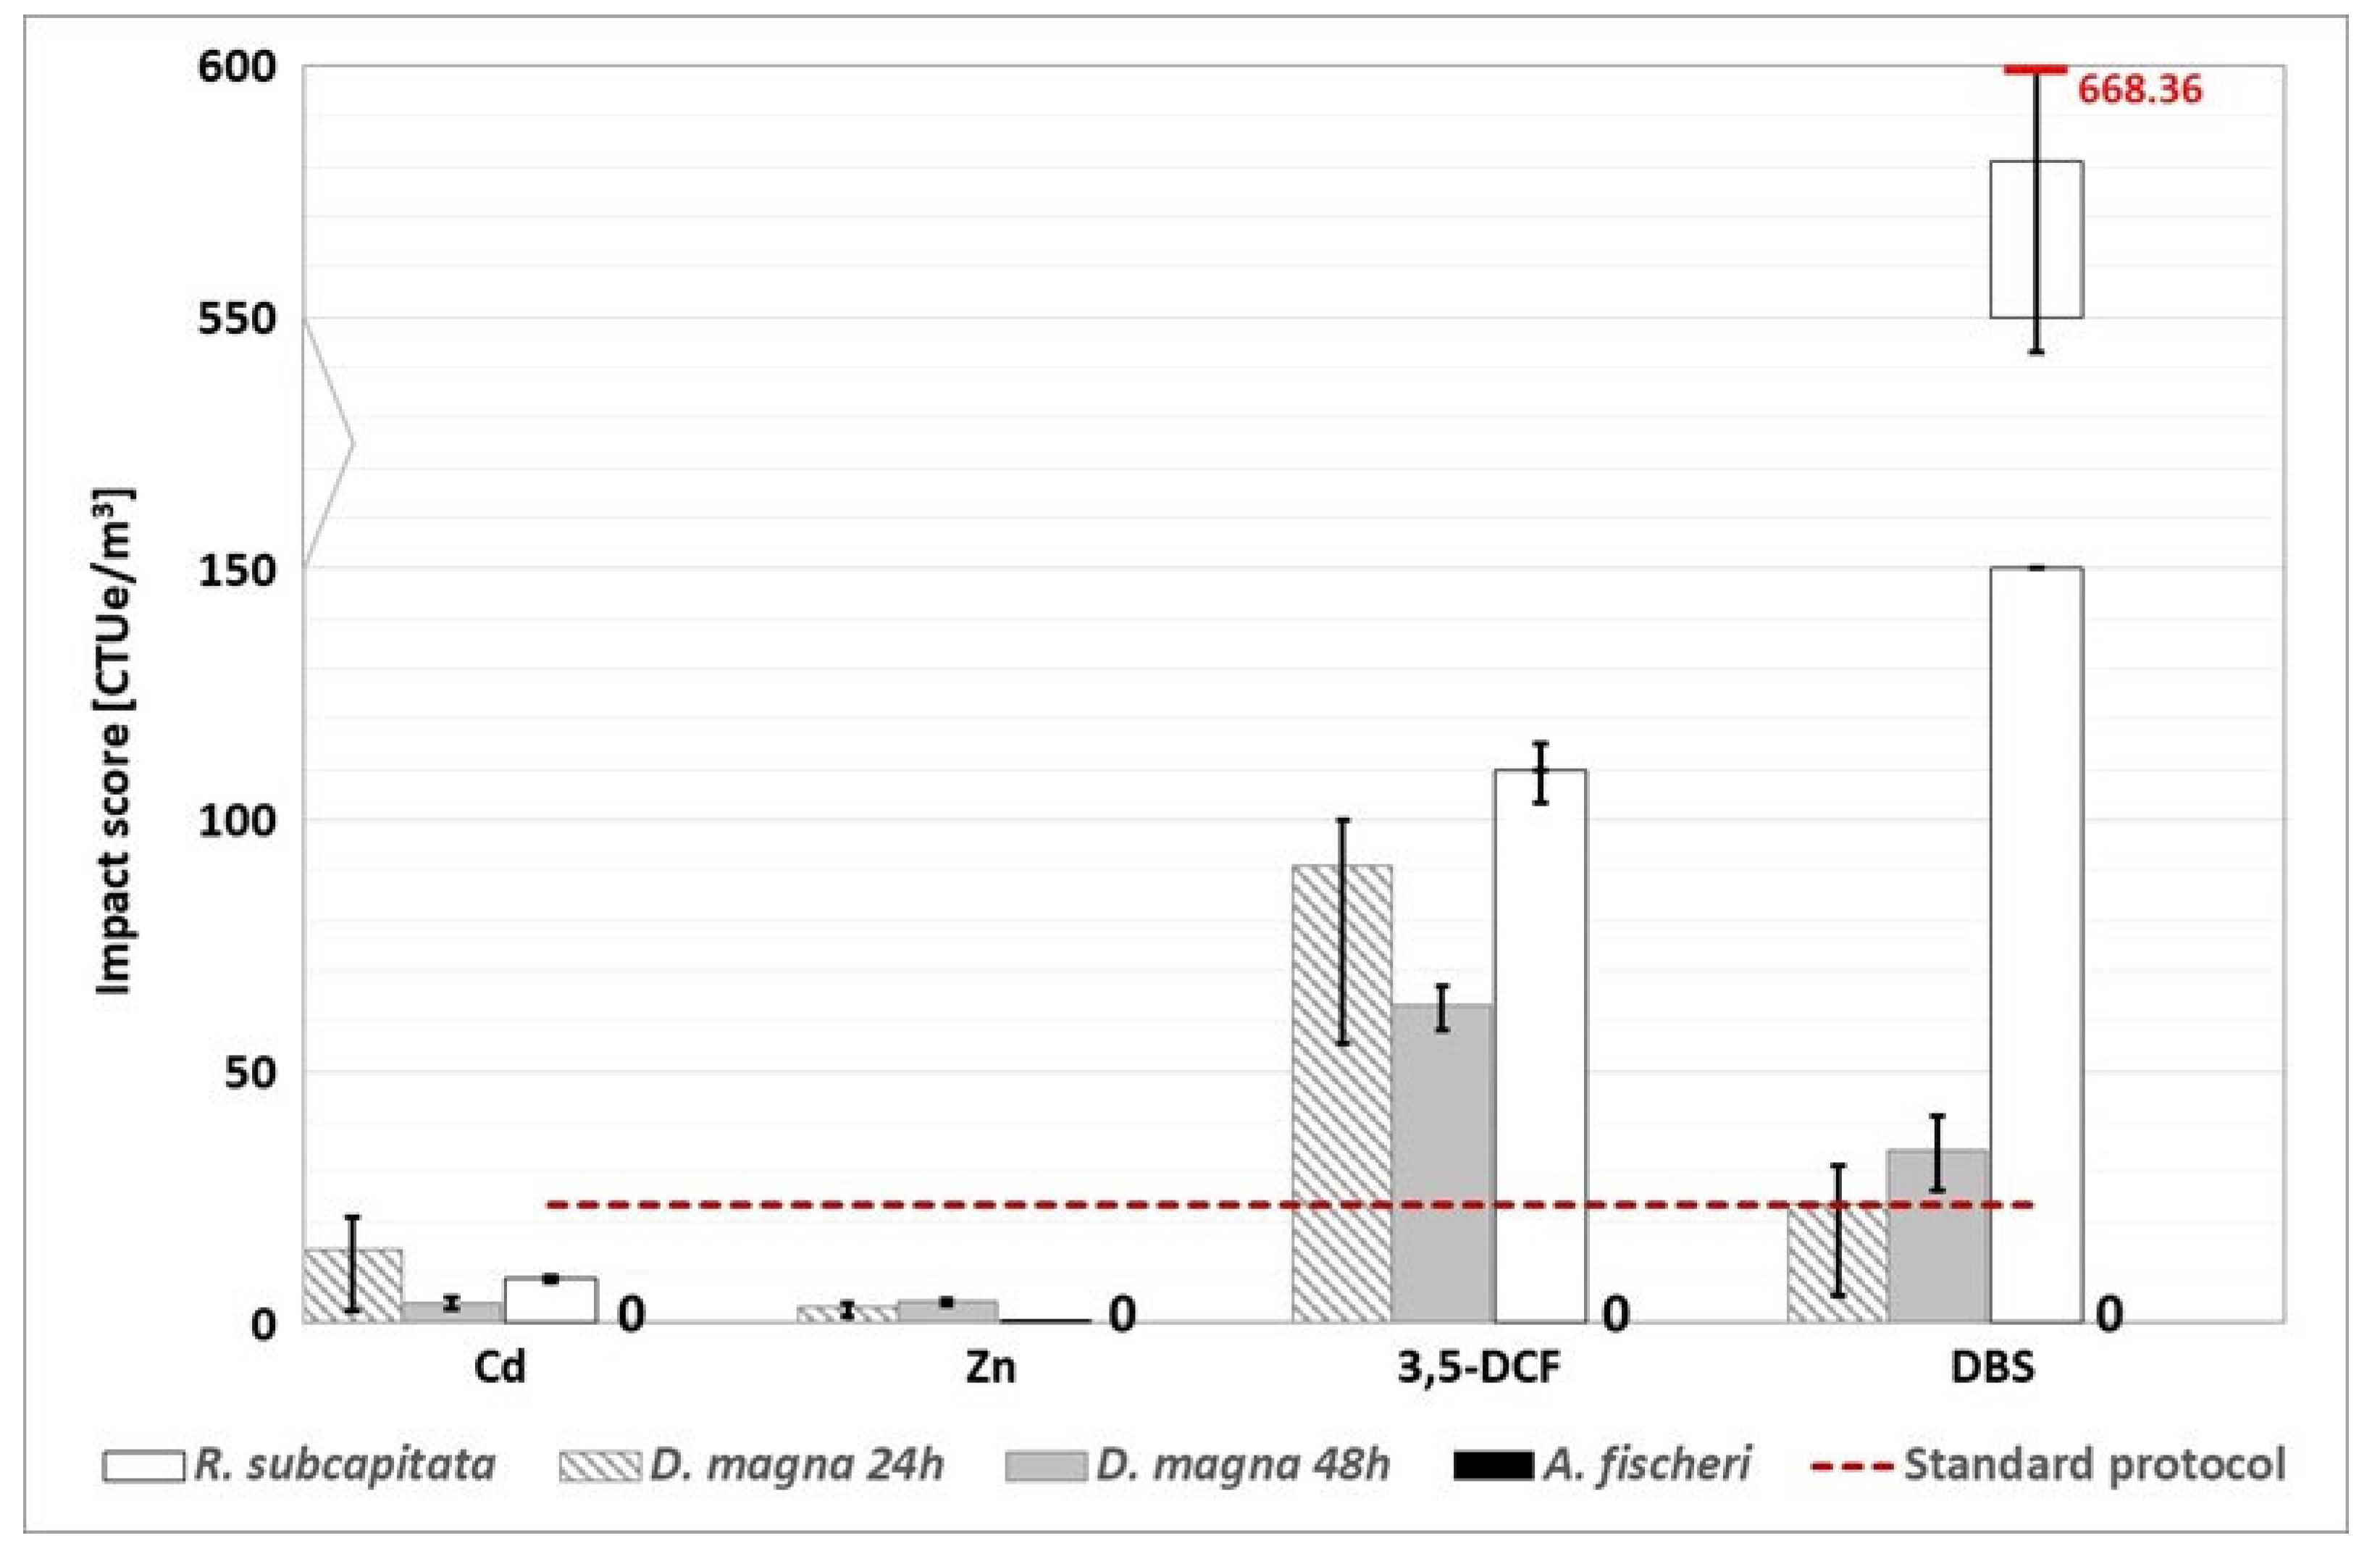
A thorough examination of the impact scores derived by the alternative approach reveals that estimations based on metals as reference compounds result in lower impact scores for all plants and tests, except for the result of the luminescent bacteria assay developed with cadmium as the reference compound (only for WWTP A). In contrast, the estimation based on organic reference substances resulted in a high impact score. Furthermore, a detailed examination of the graphs reveals that the impact score based on the DCF as a reference substance has much more consistent effects.
Because the corresponding CFs were generated from biological experiments with high metal sensitivity, the mismatch between the two types of reference compounds (metals and organics) could be explained. As a result, the use of CFs in organics is more feasible.
Furthermore, biological studies on organisms from different levels of the trophic web suggest that effluents may contain a mixture of pollutants that are particularly effective against certain organisms. In contrast to other plants' effluent, the discharged water from WWTP A is characterized by a mixture in which the synergistic action of the individual chemicals drives the luminescent bacteria response.
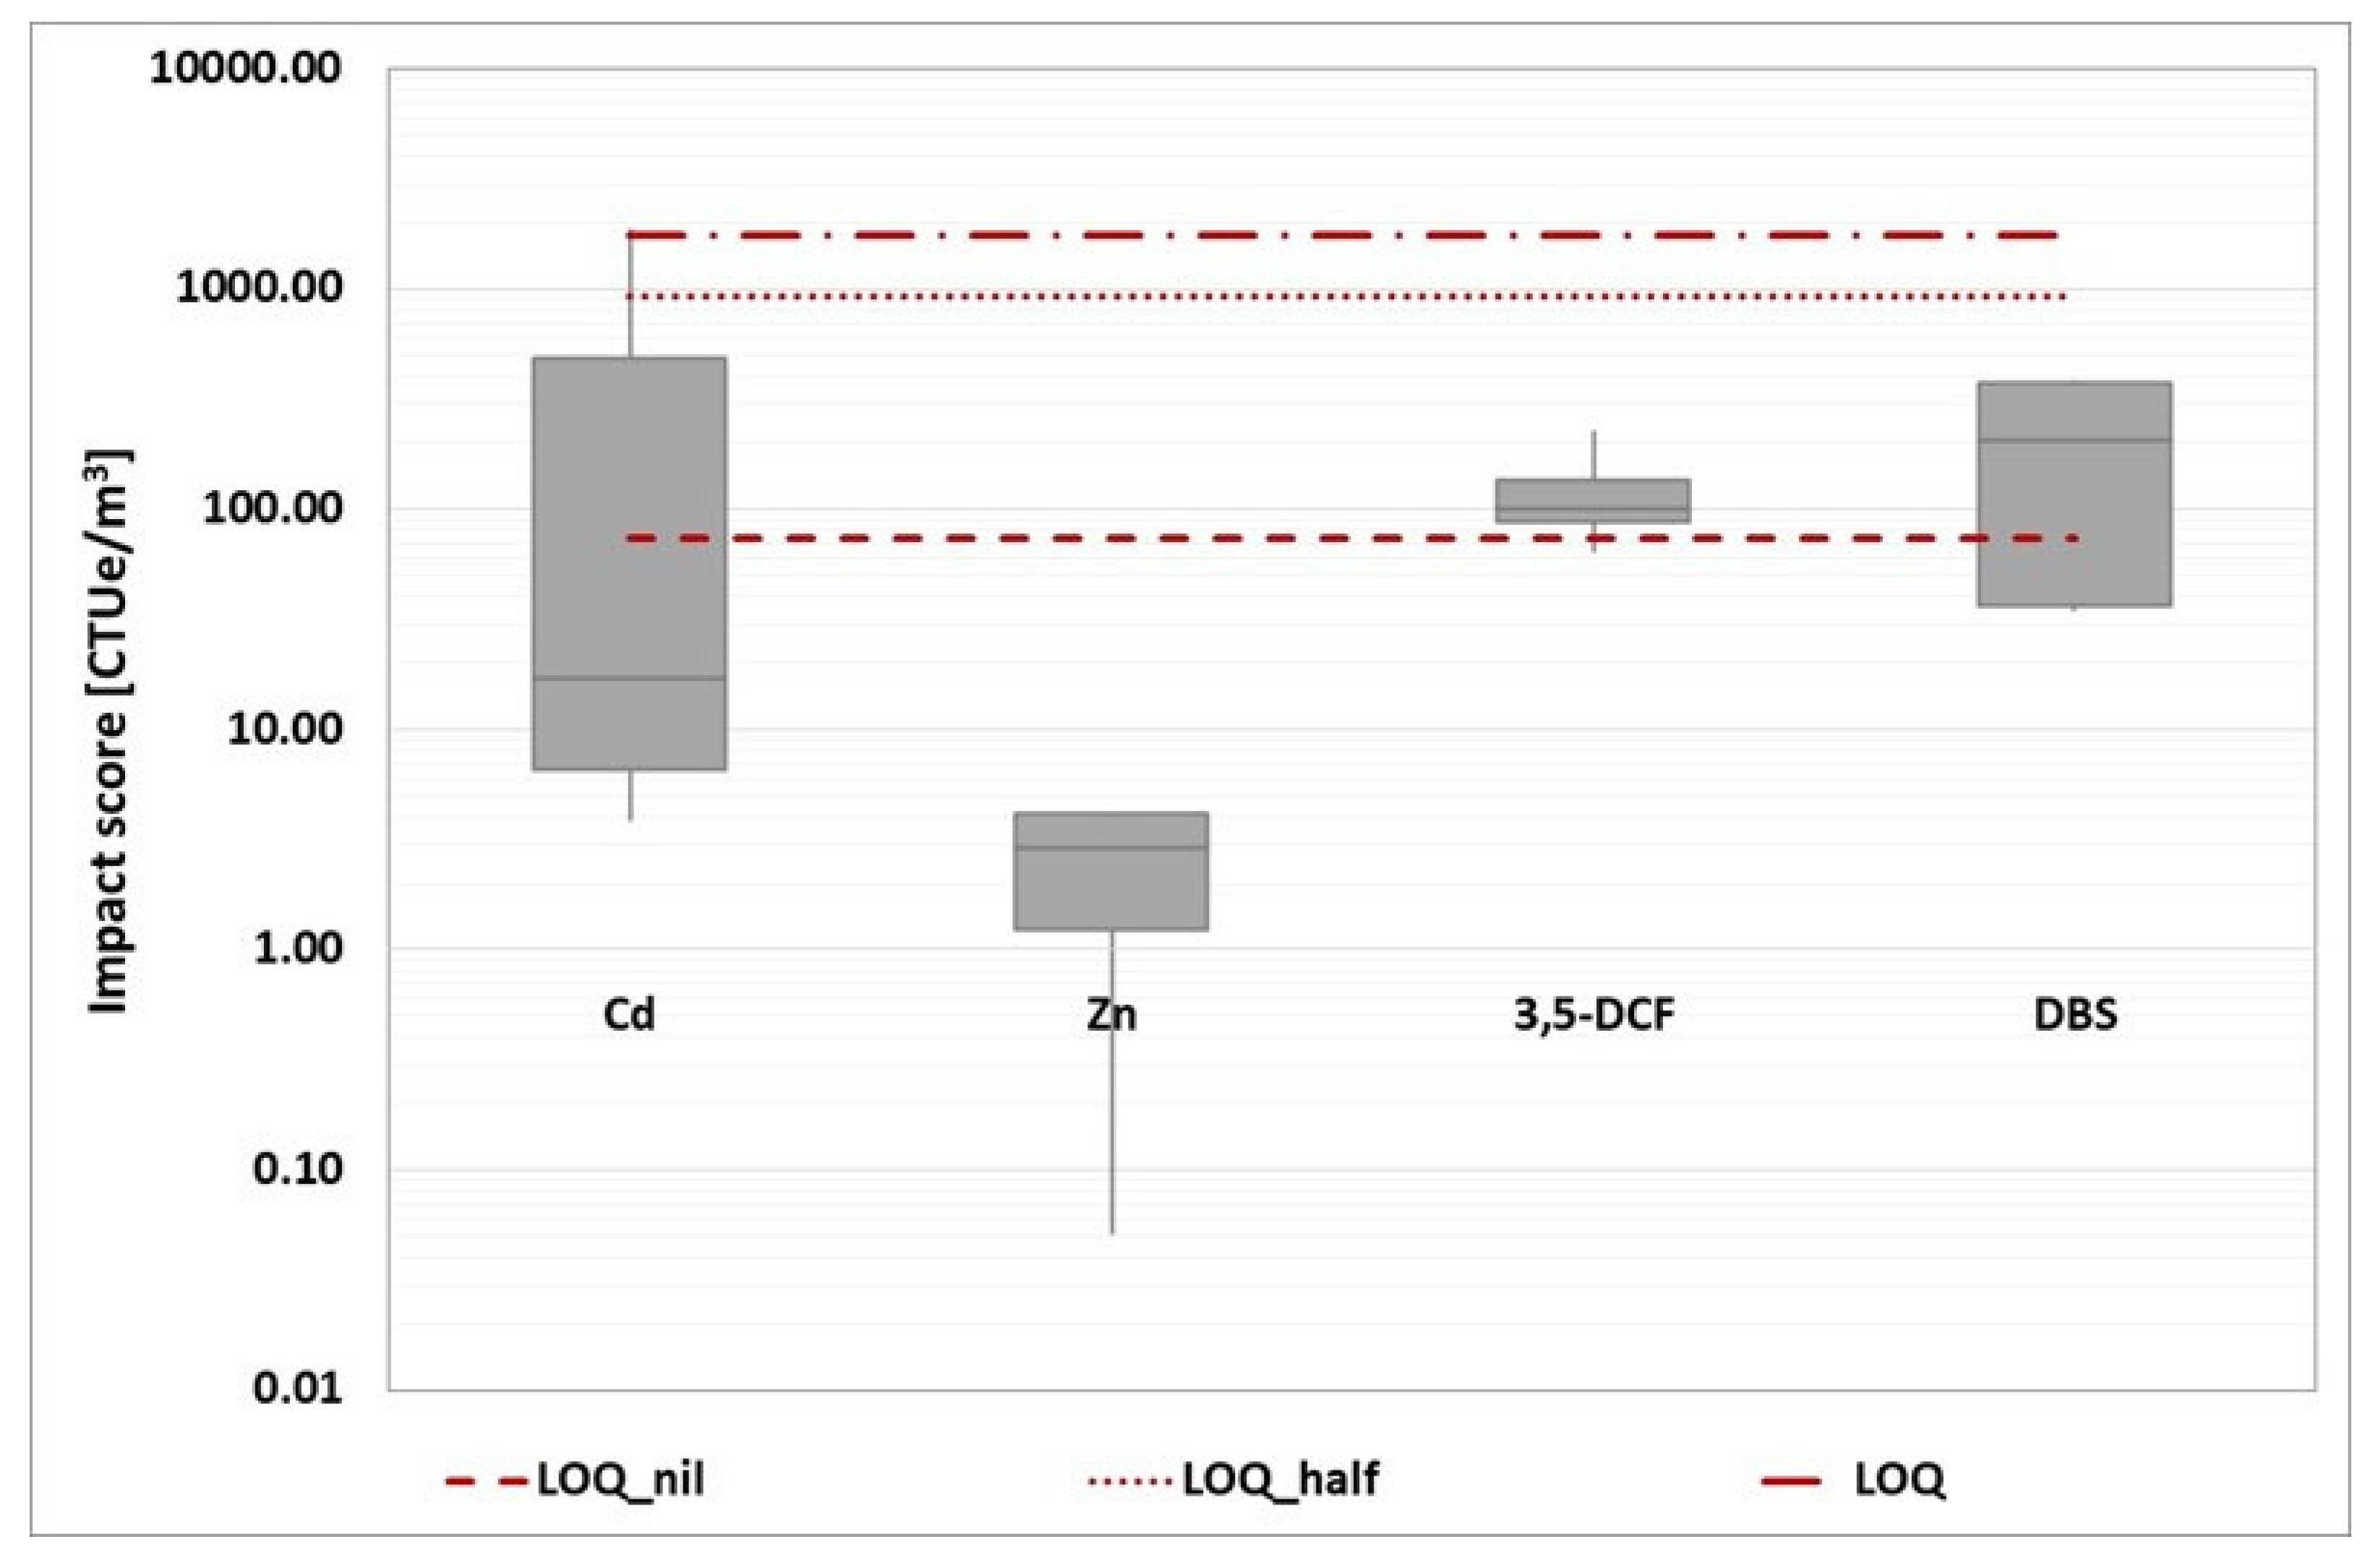
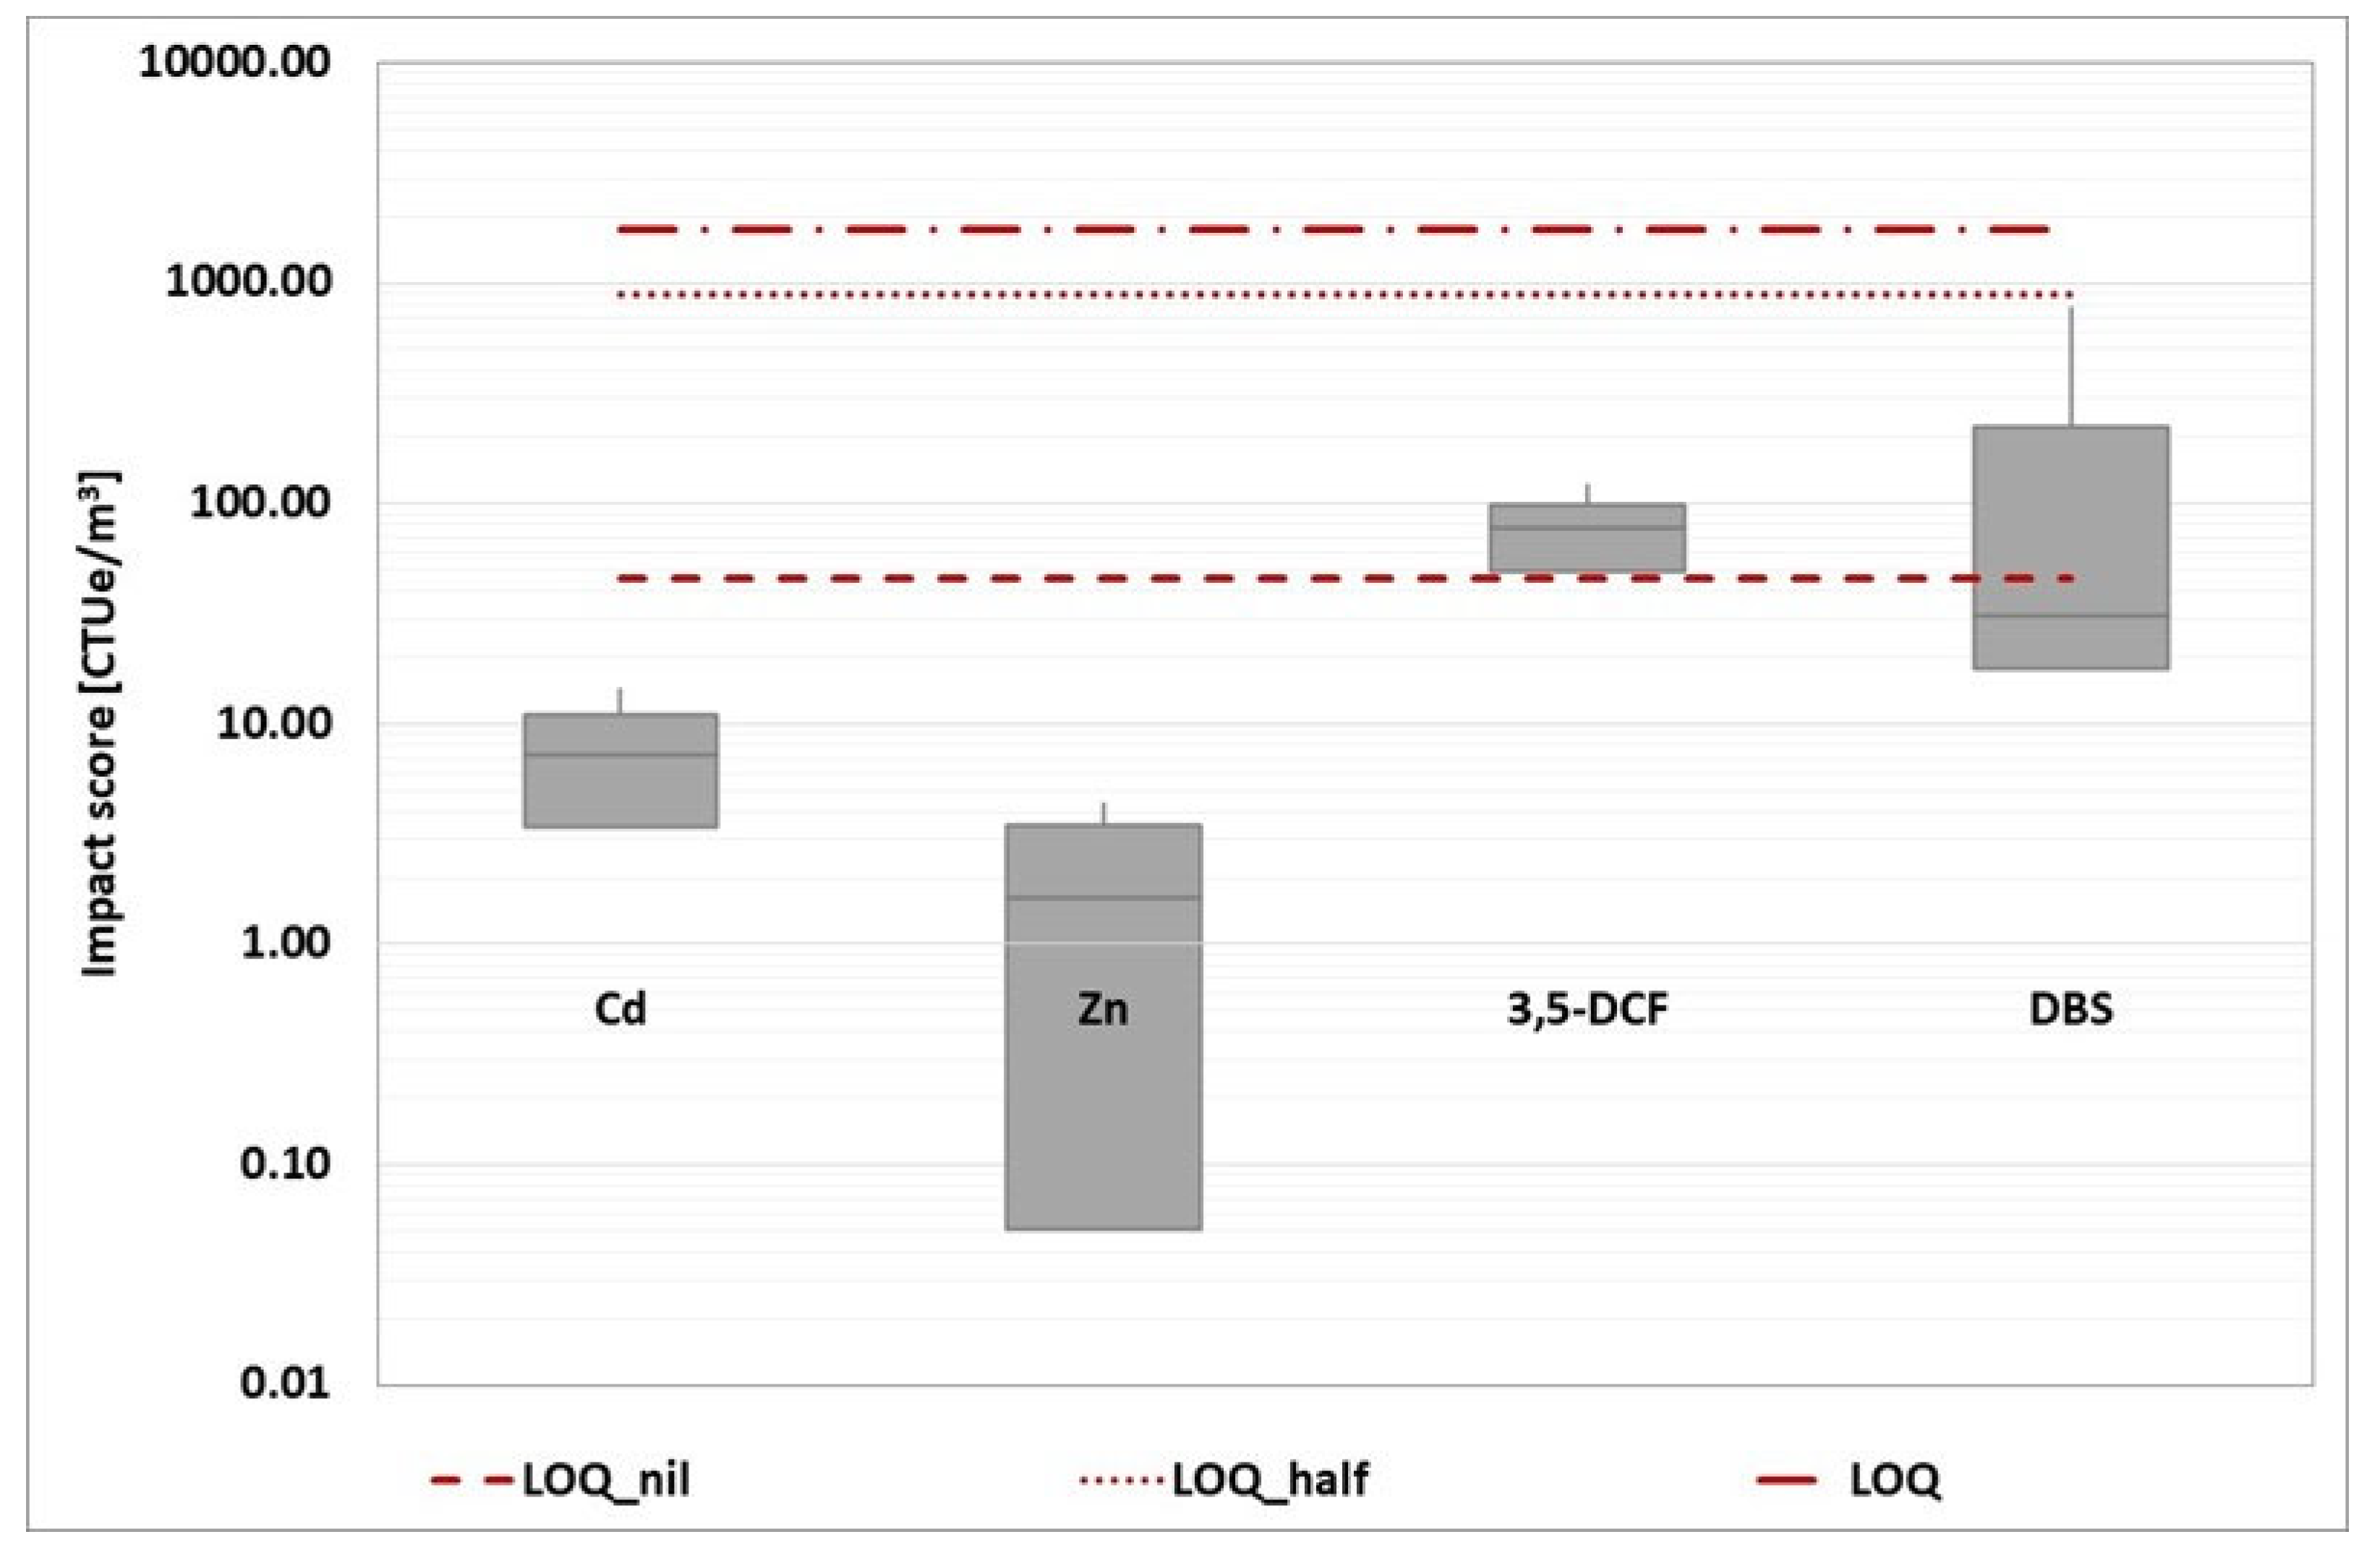
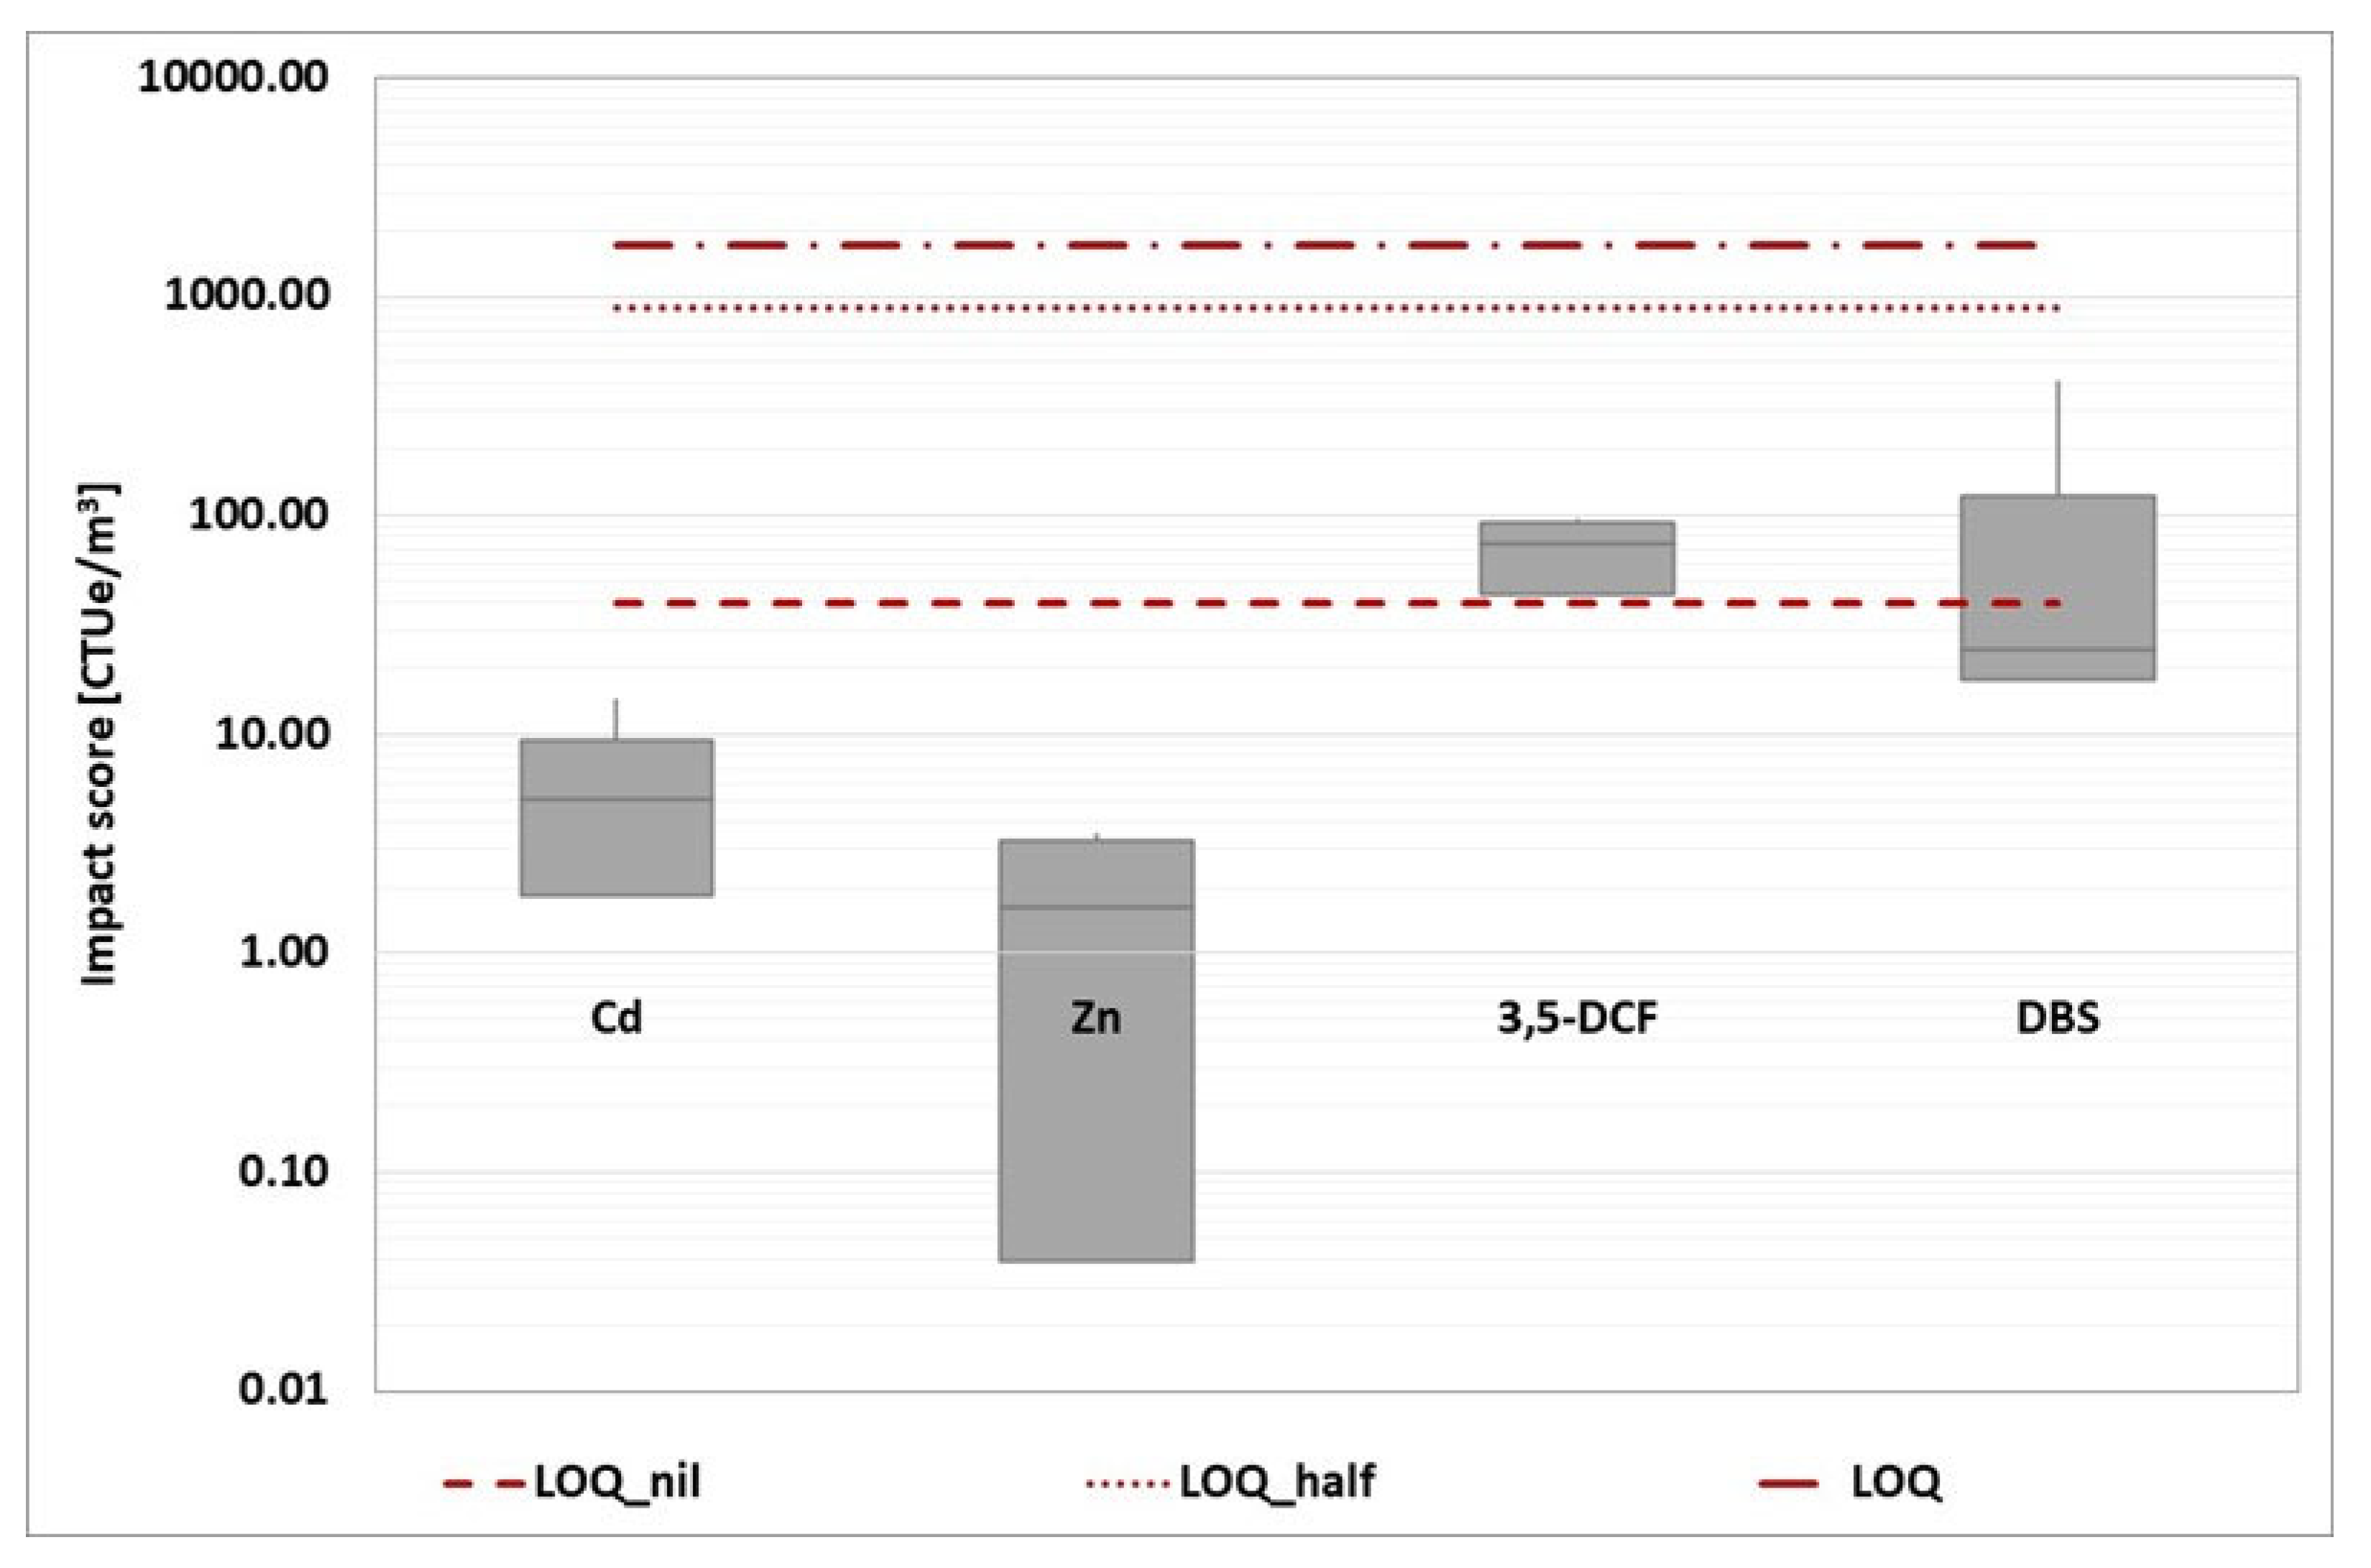
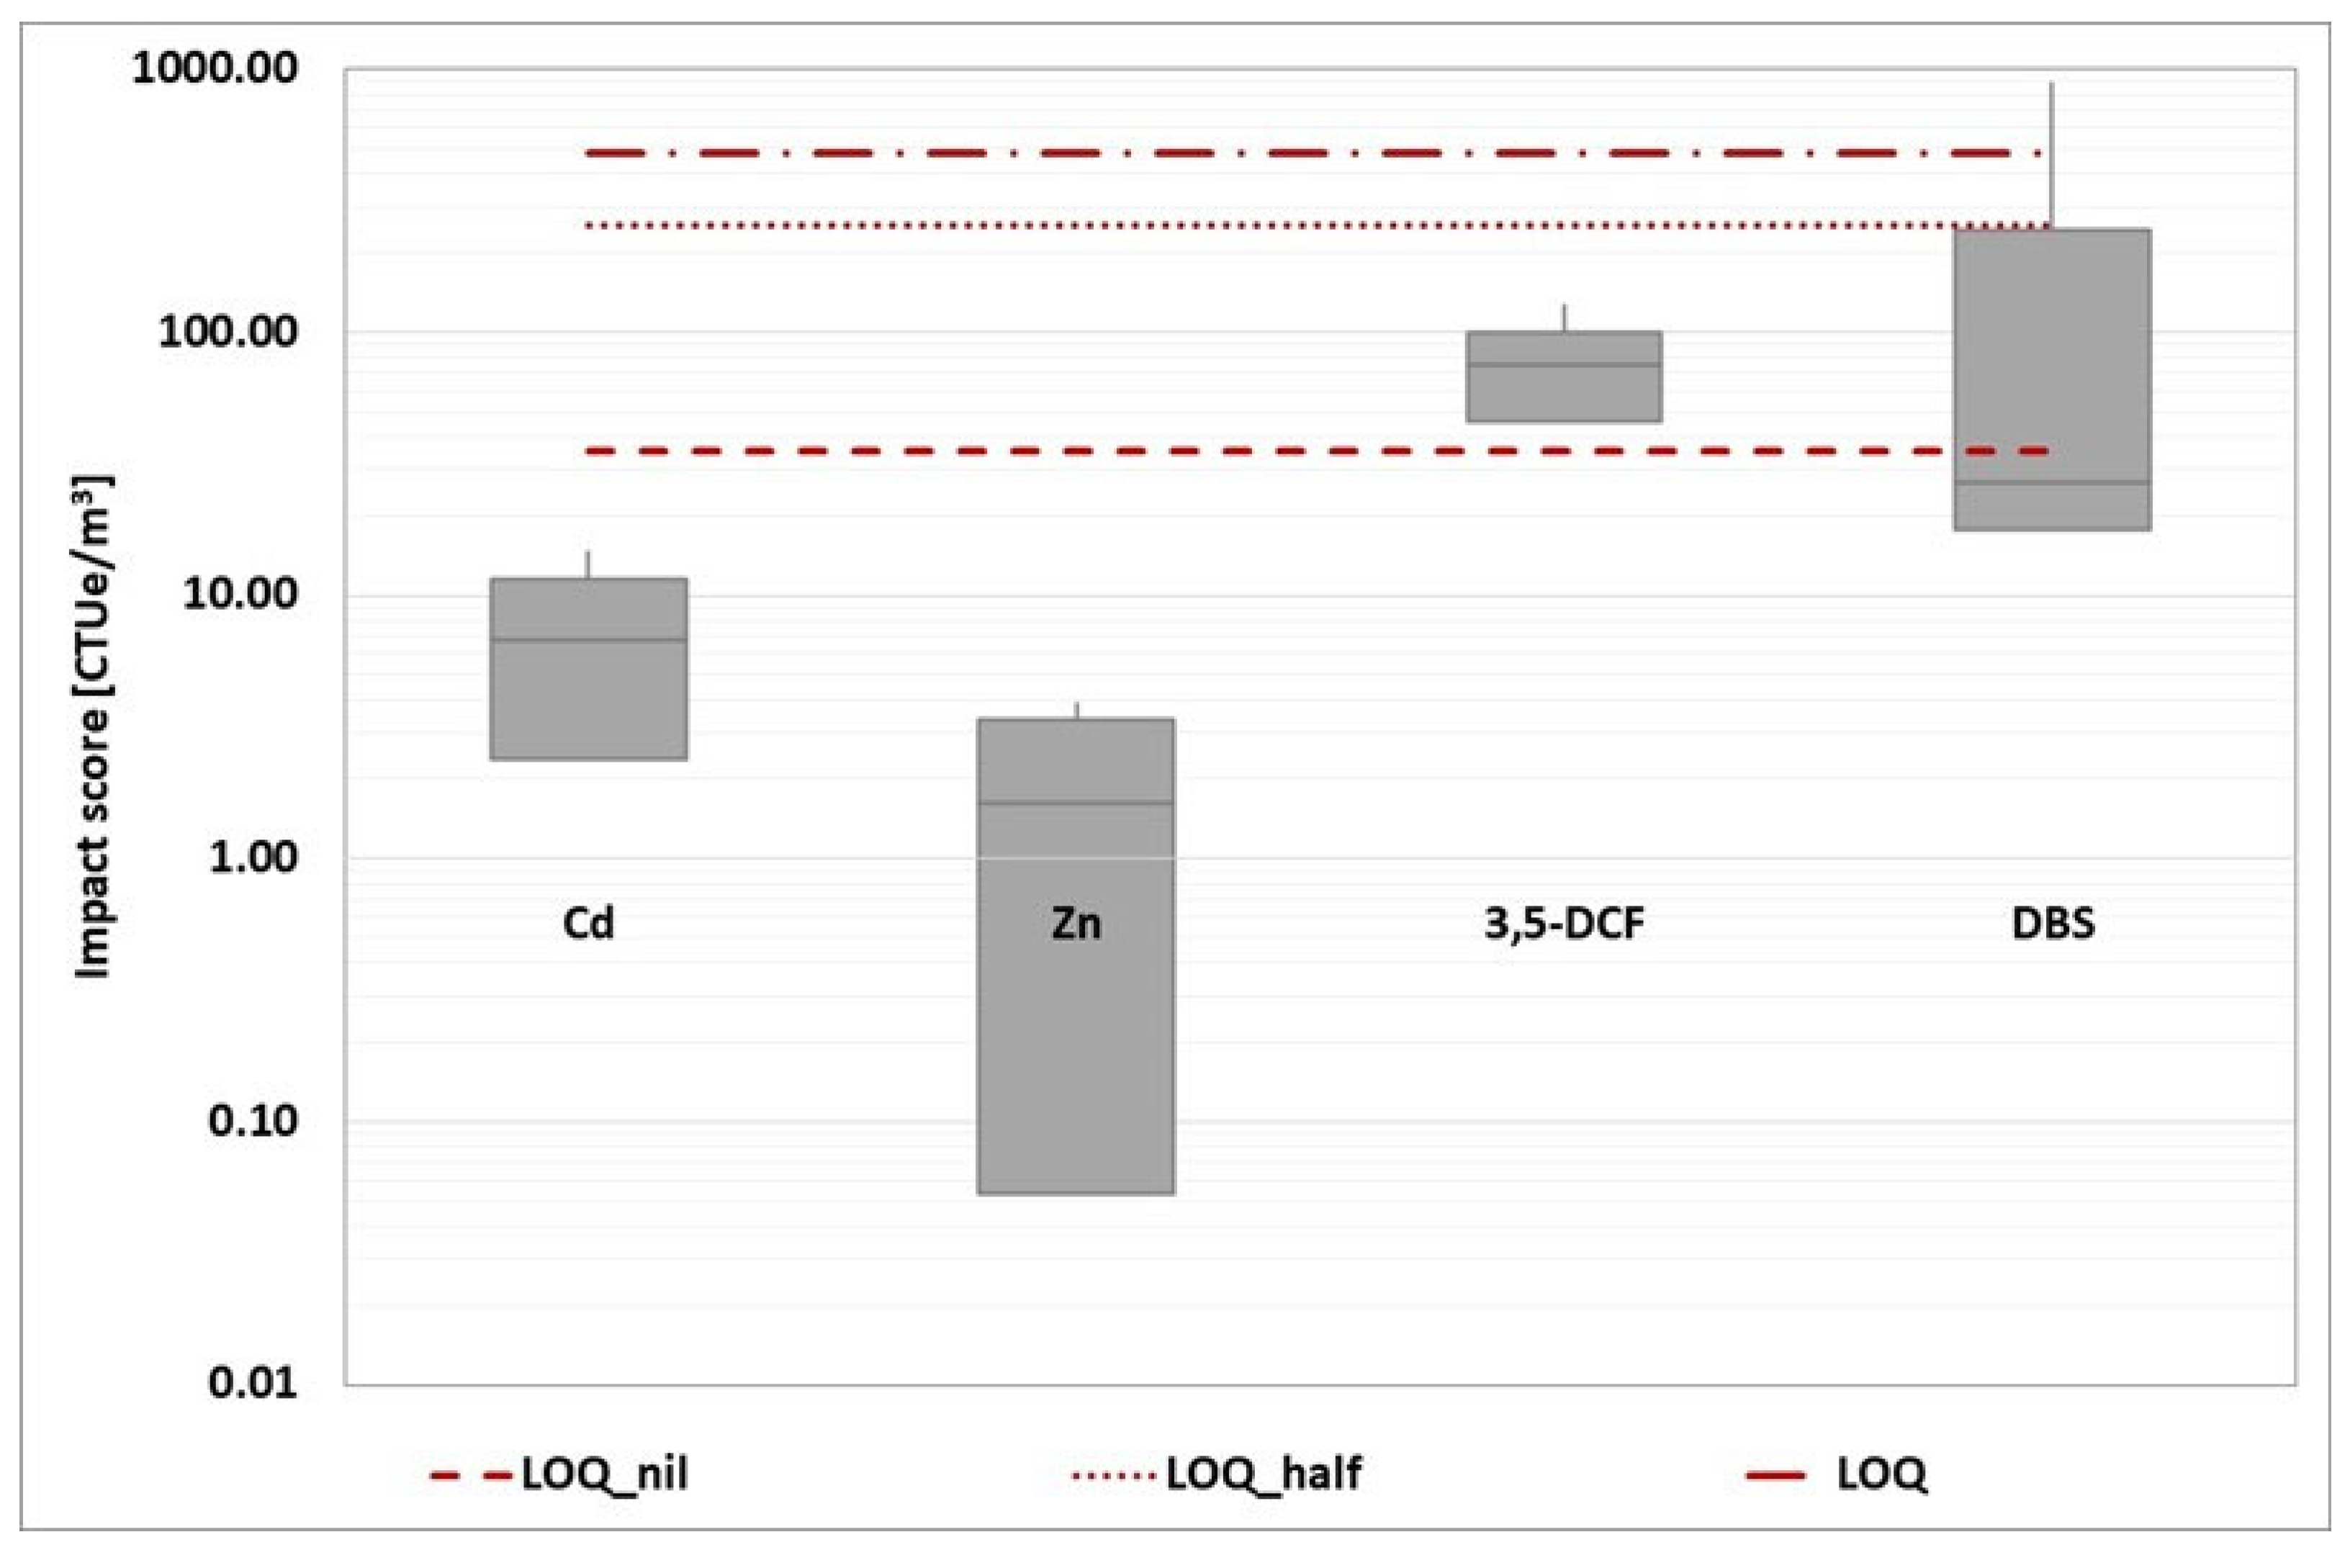
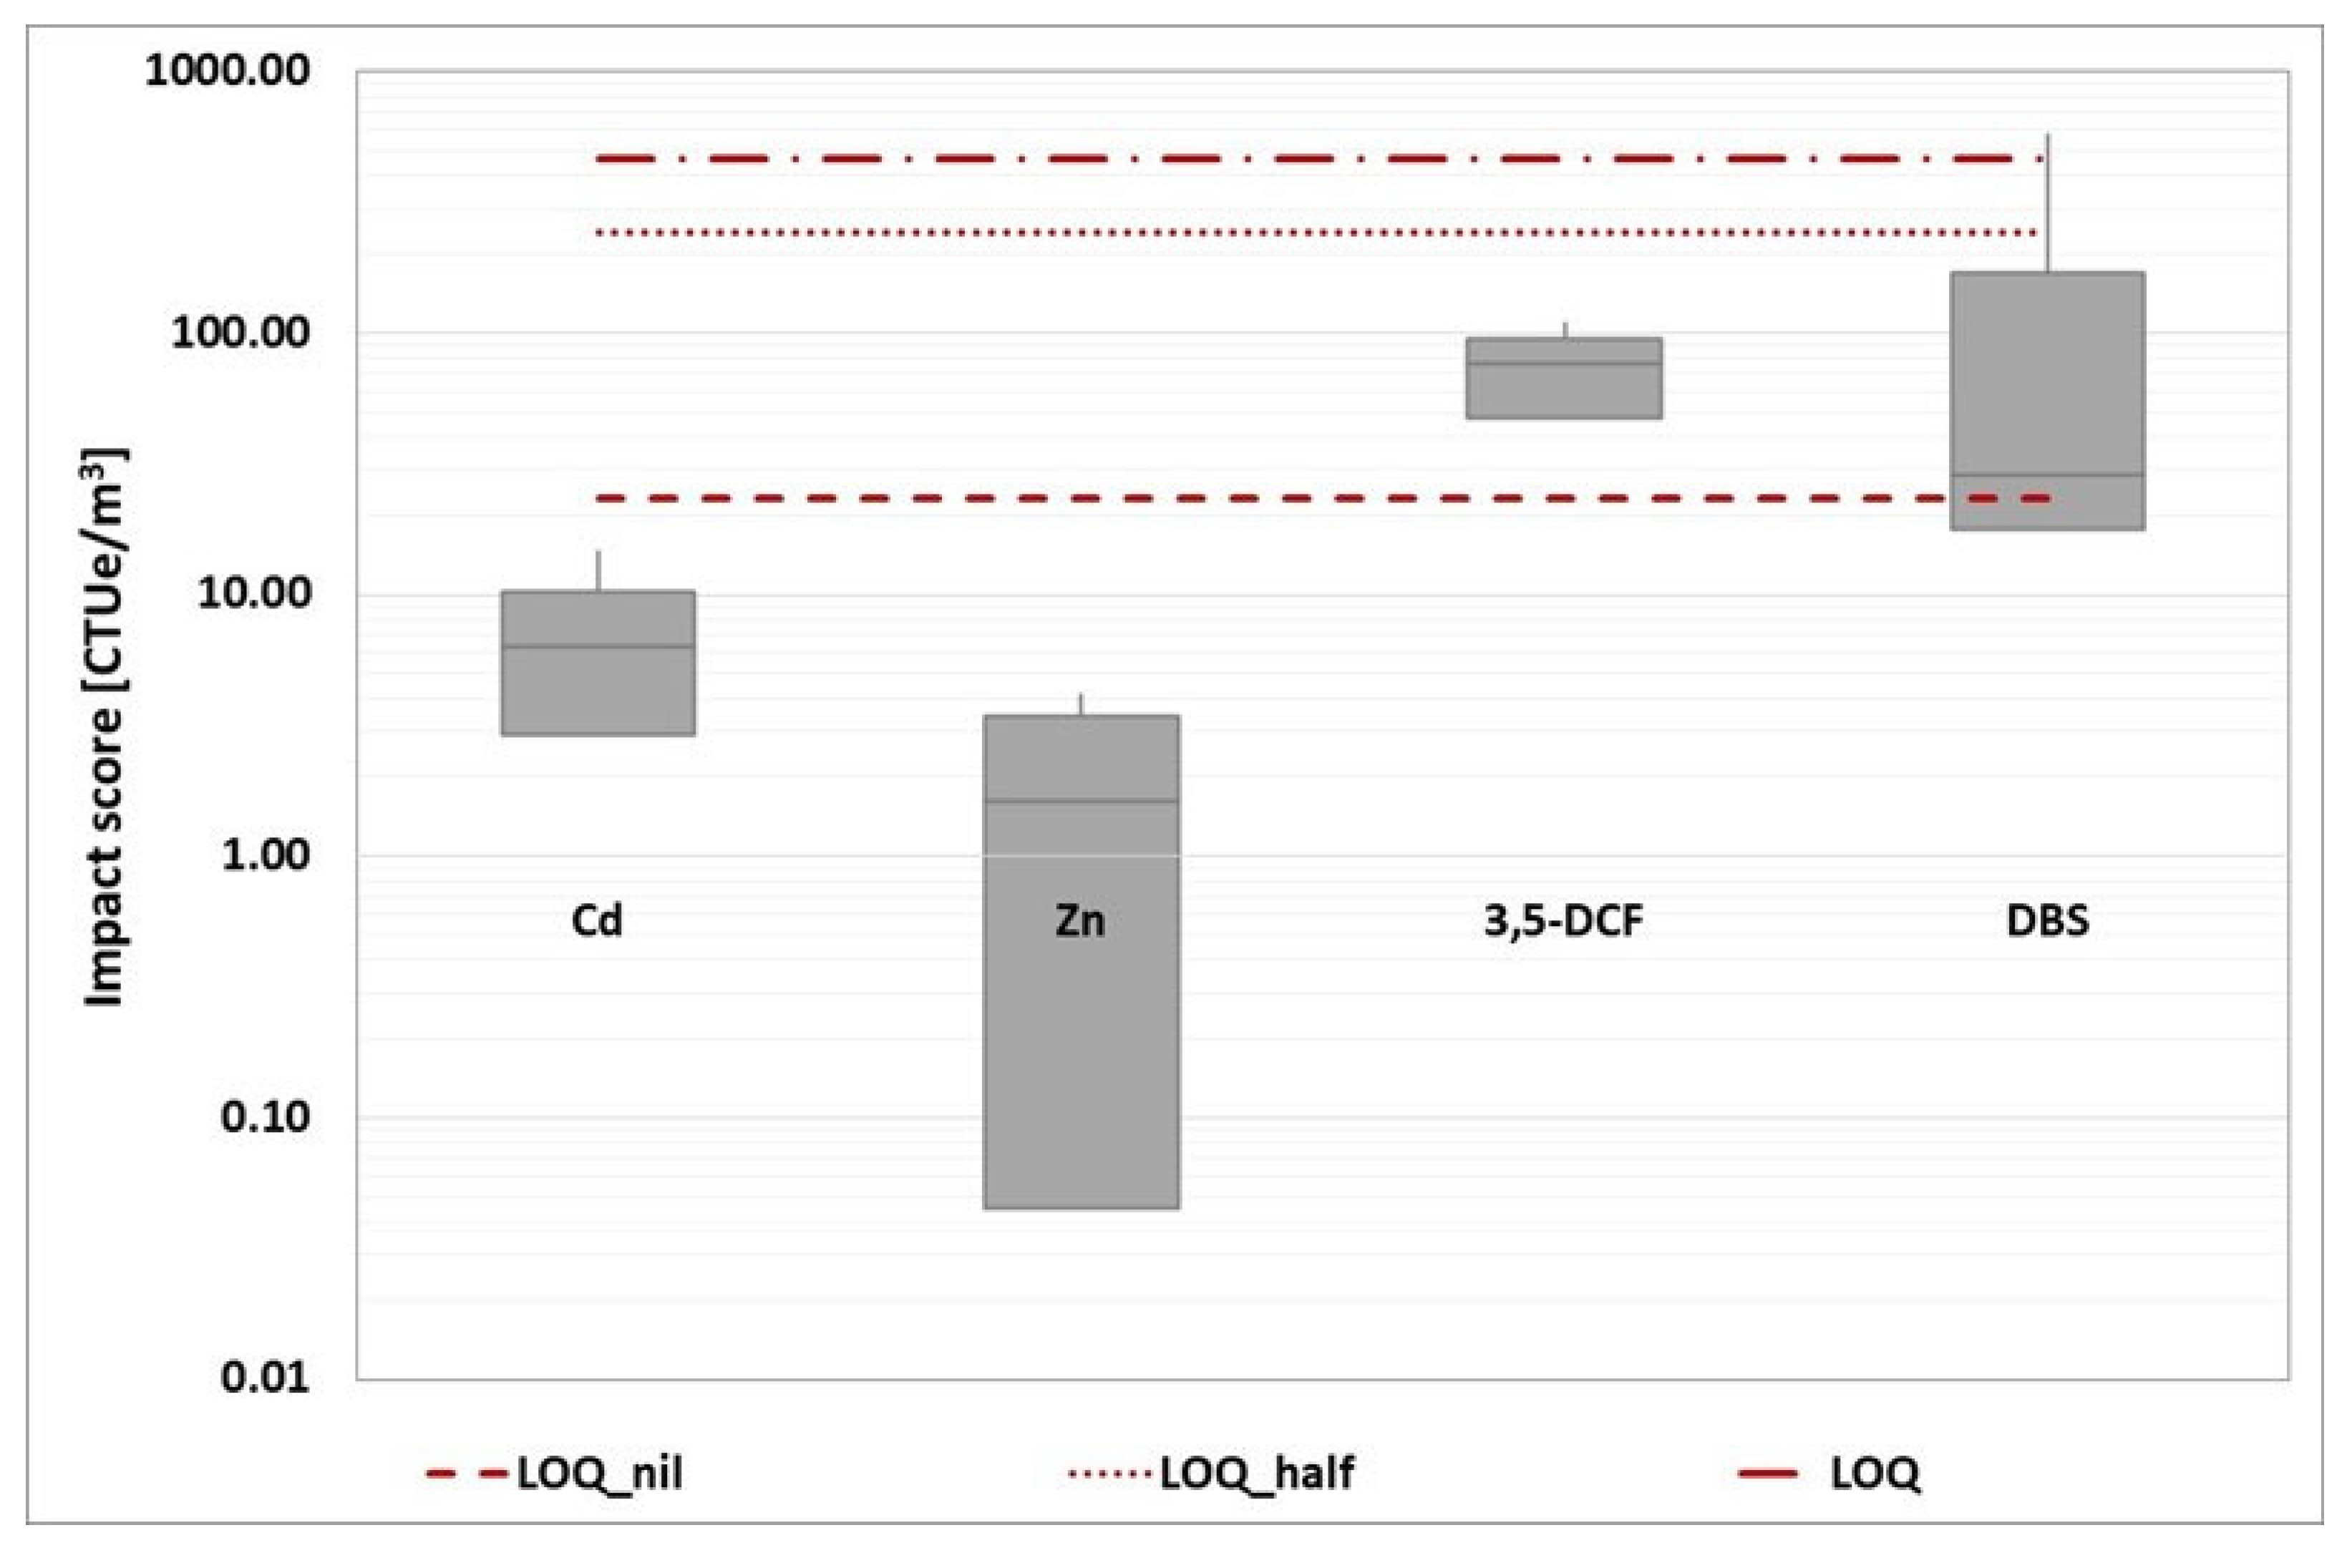
The impact score from the four baseline toxicity tests was then added together and represented in a box plot for each reference component. This overall representation has been developed for each wastewater treatment plant, as shown in the graphs (
Figure 12,
Figure 13,
Figure 14,
Figure 15 and
Figure 16).
Because the estimation of the impact score is affected by a specific number of criticalities, the evaluation of the unique impact score for each WWTP would be characterized by a low degree of robustness. Instead, a more reliable comparison of the various options can be made. Based on the box plot representation, a thorough analysis reveals that WWTP A is the worst of the three.
3.2.3. Human Toxicity Cancer: Outcomes
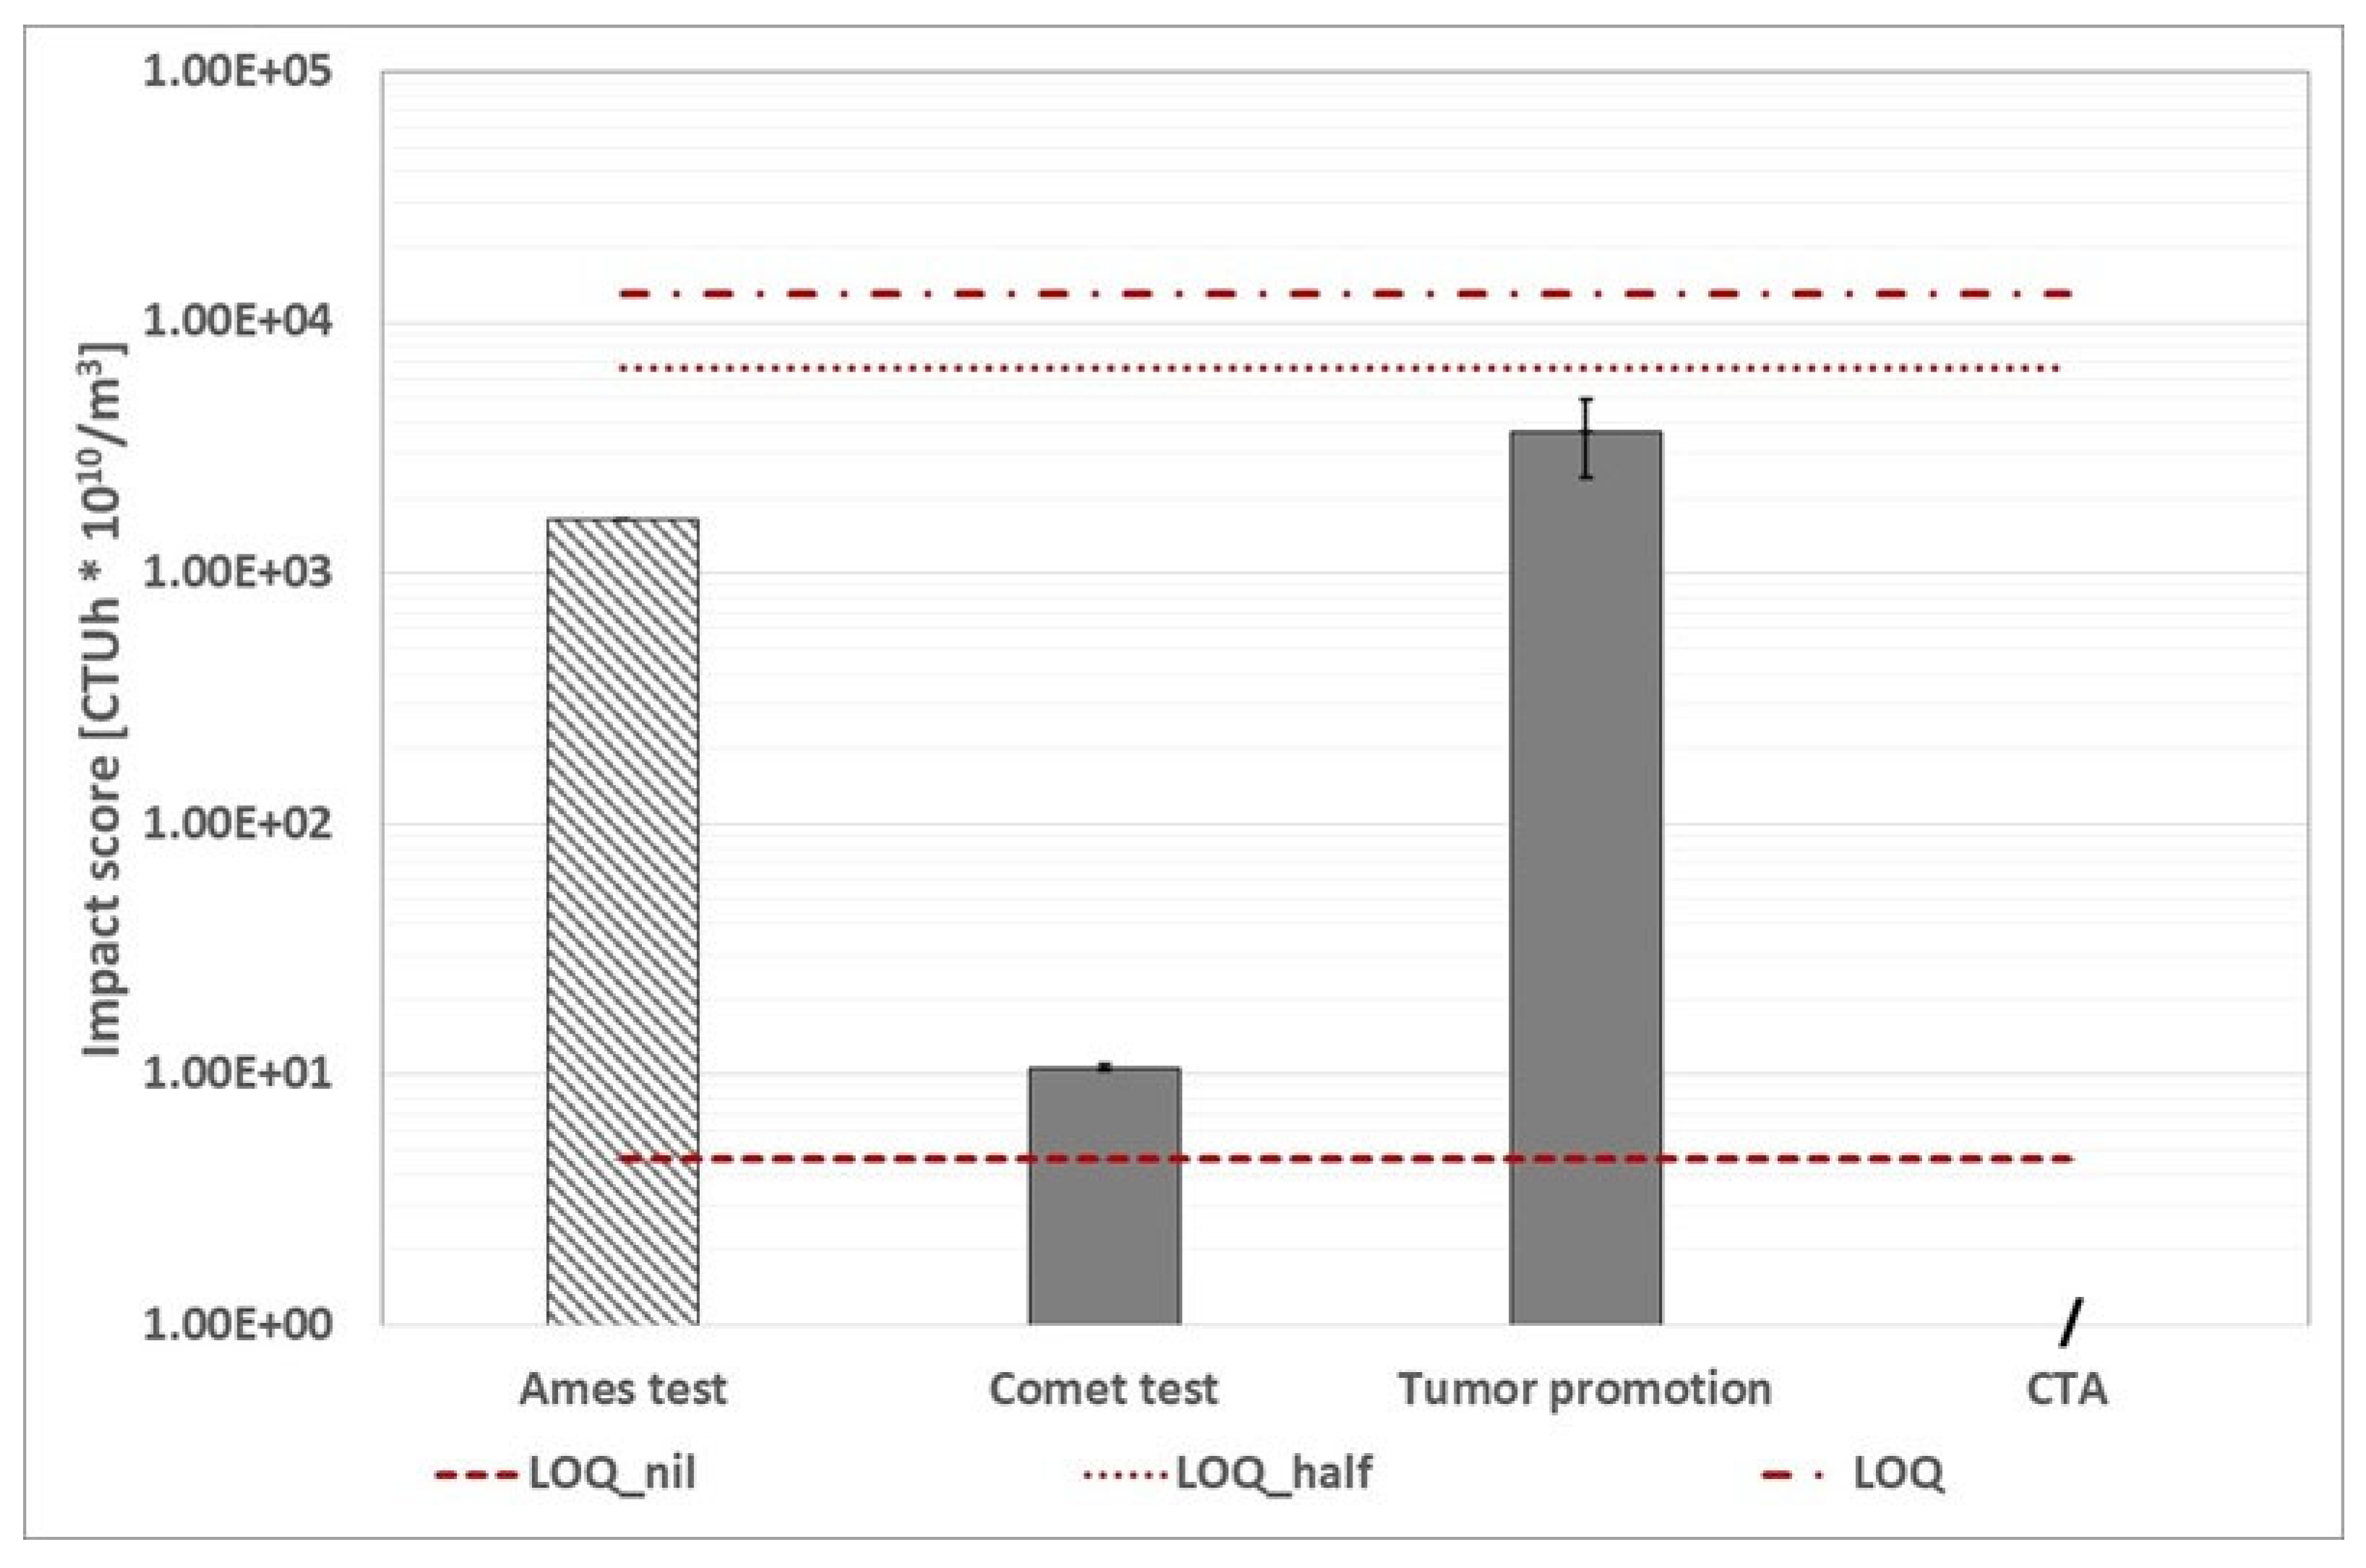
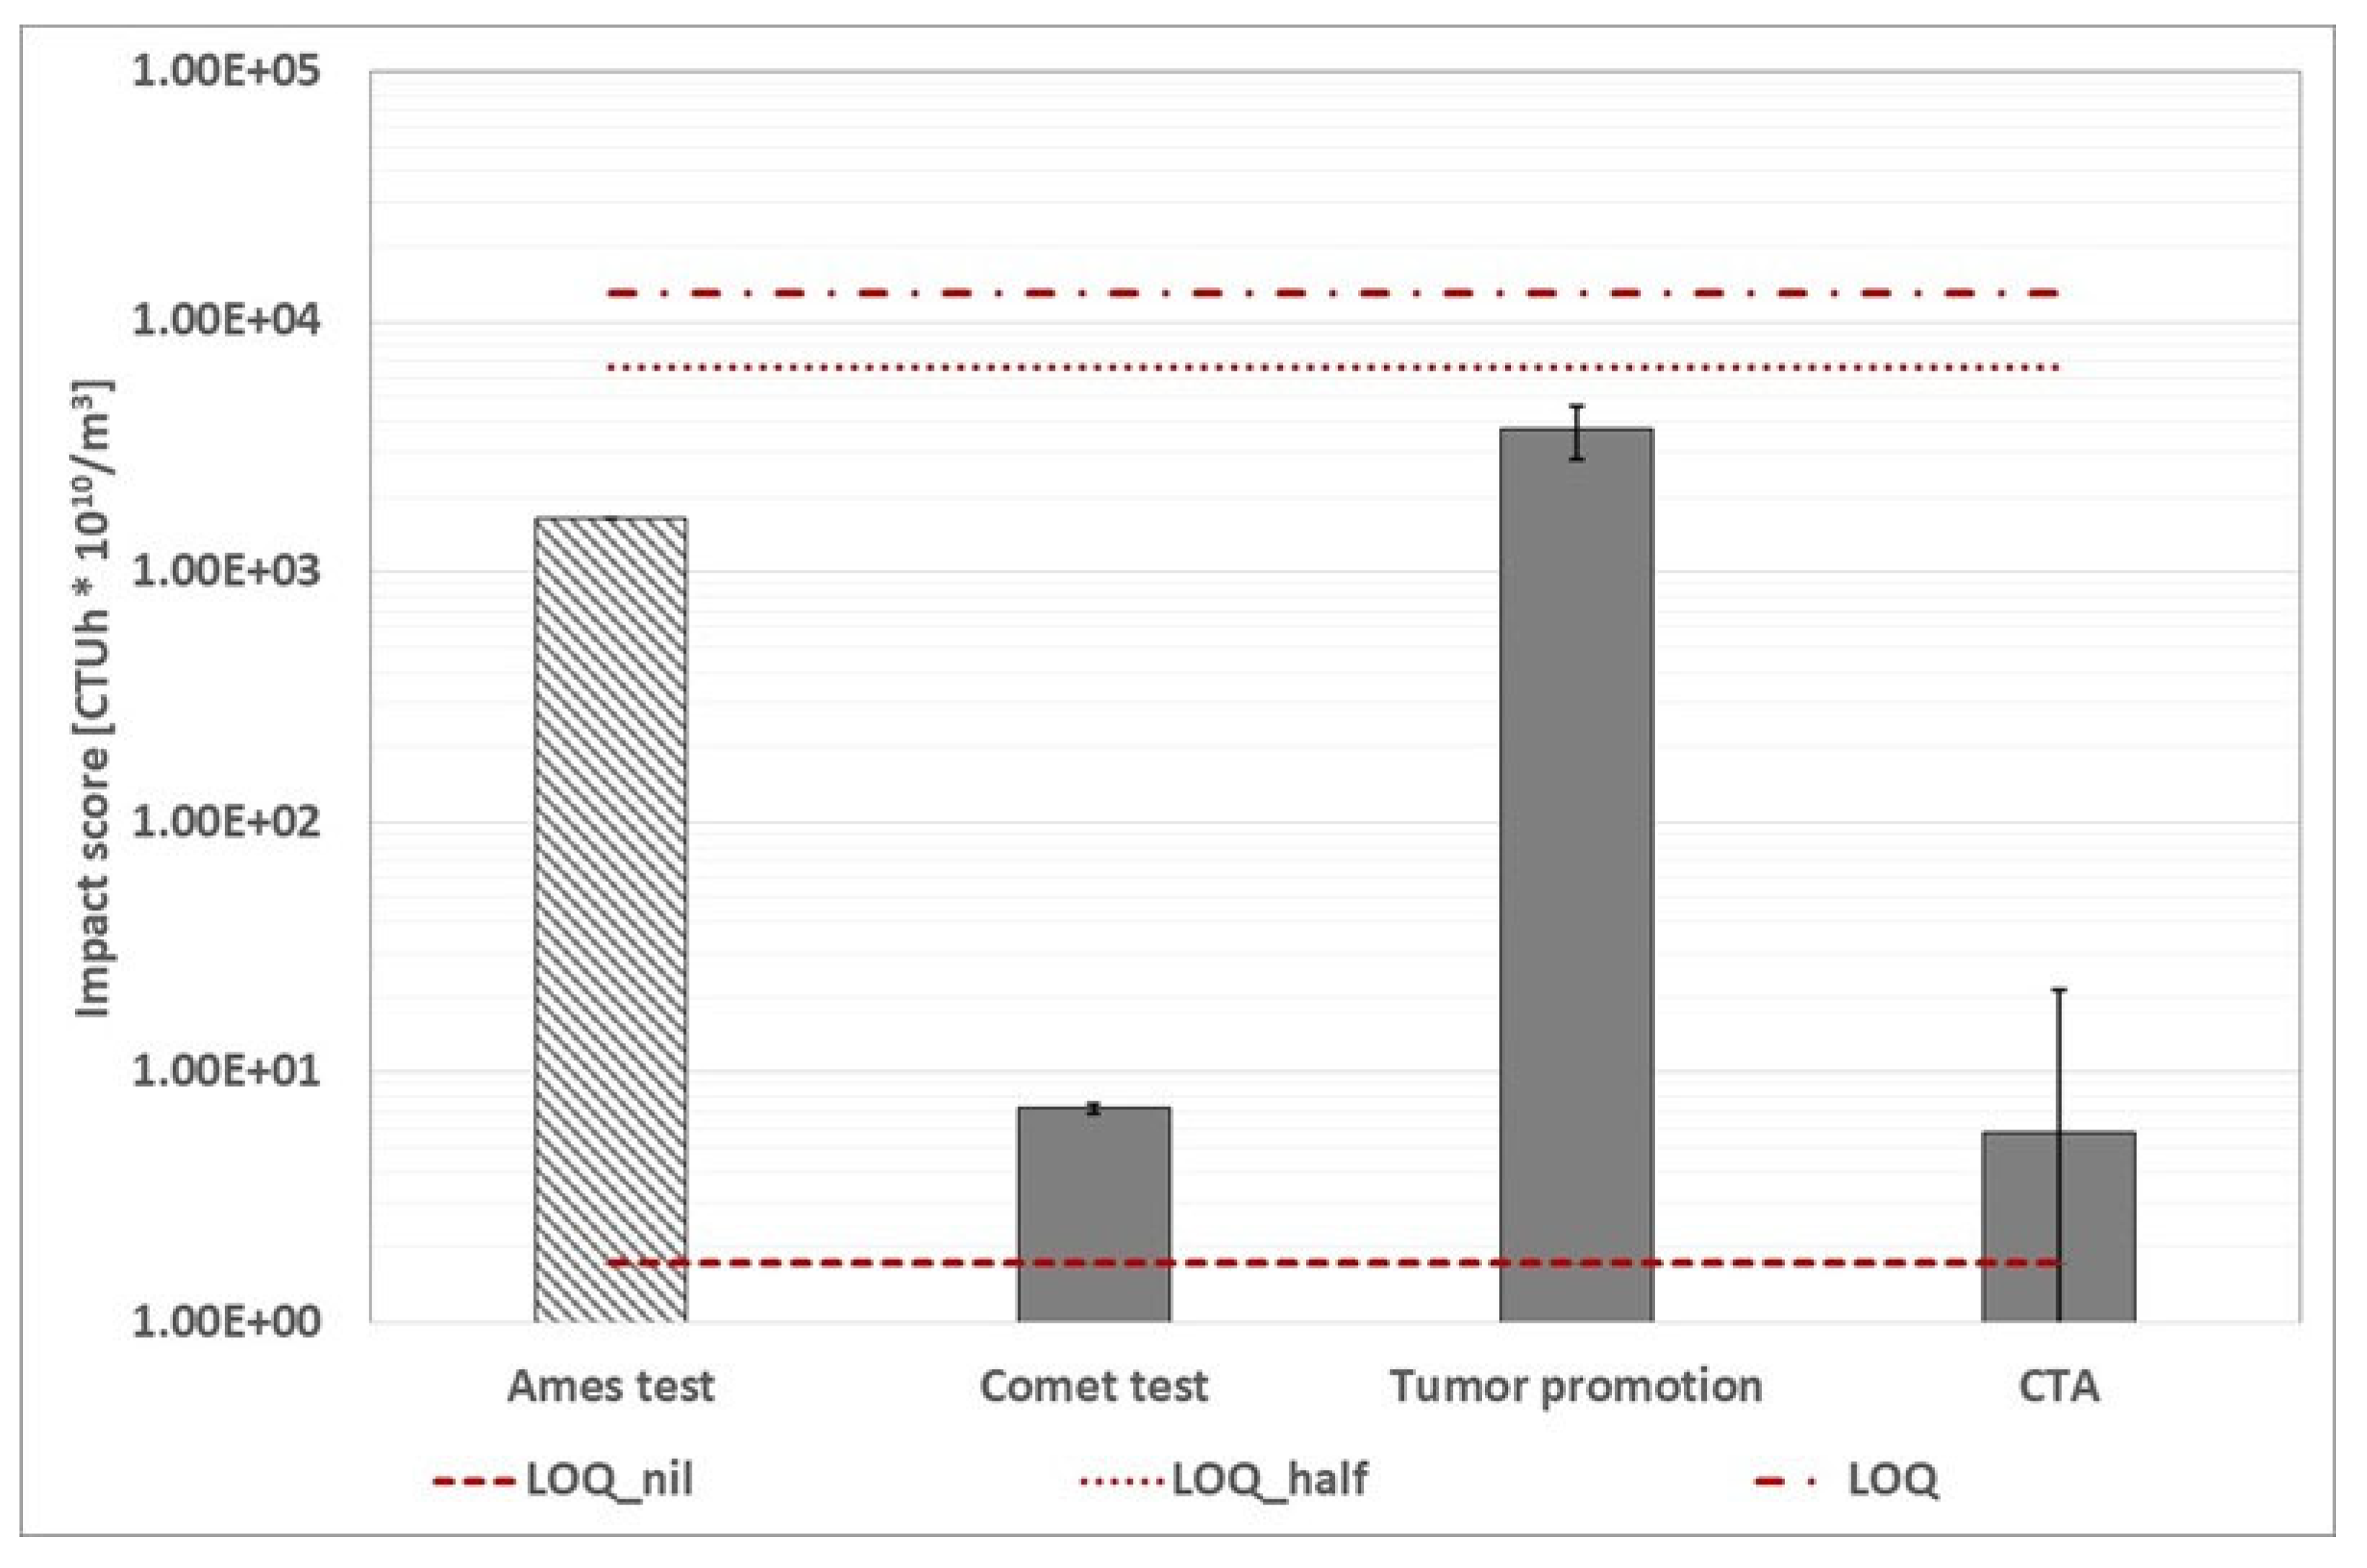
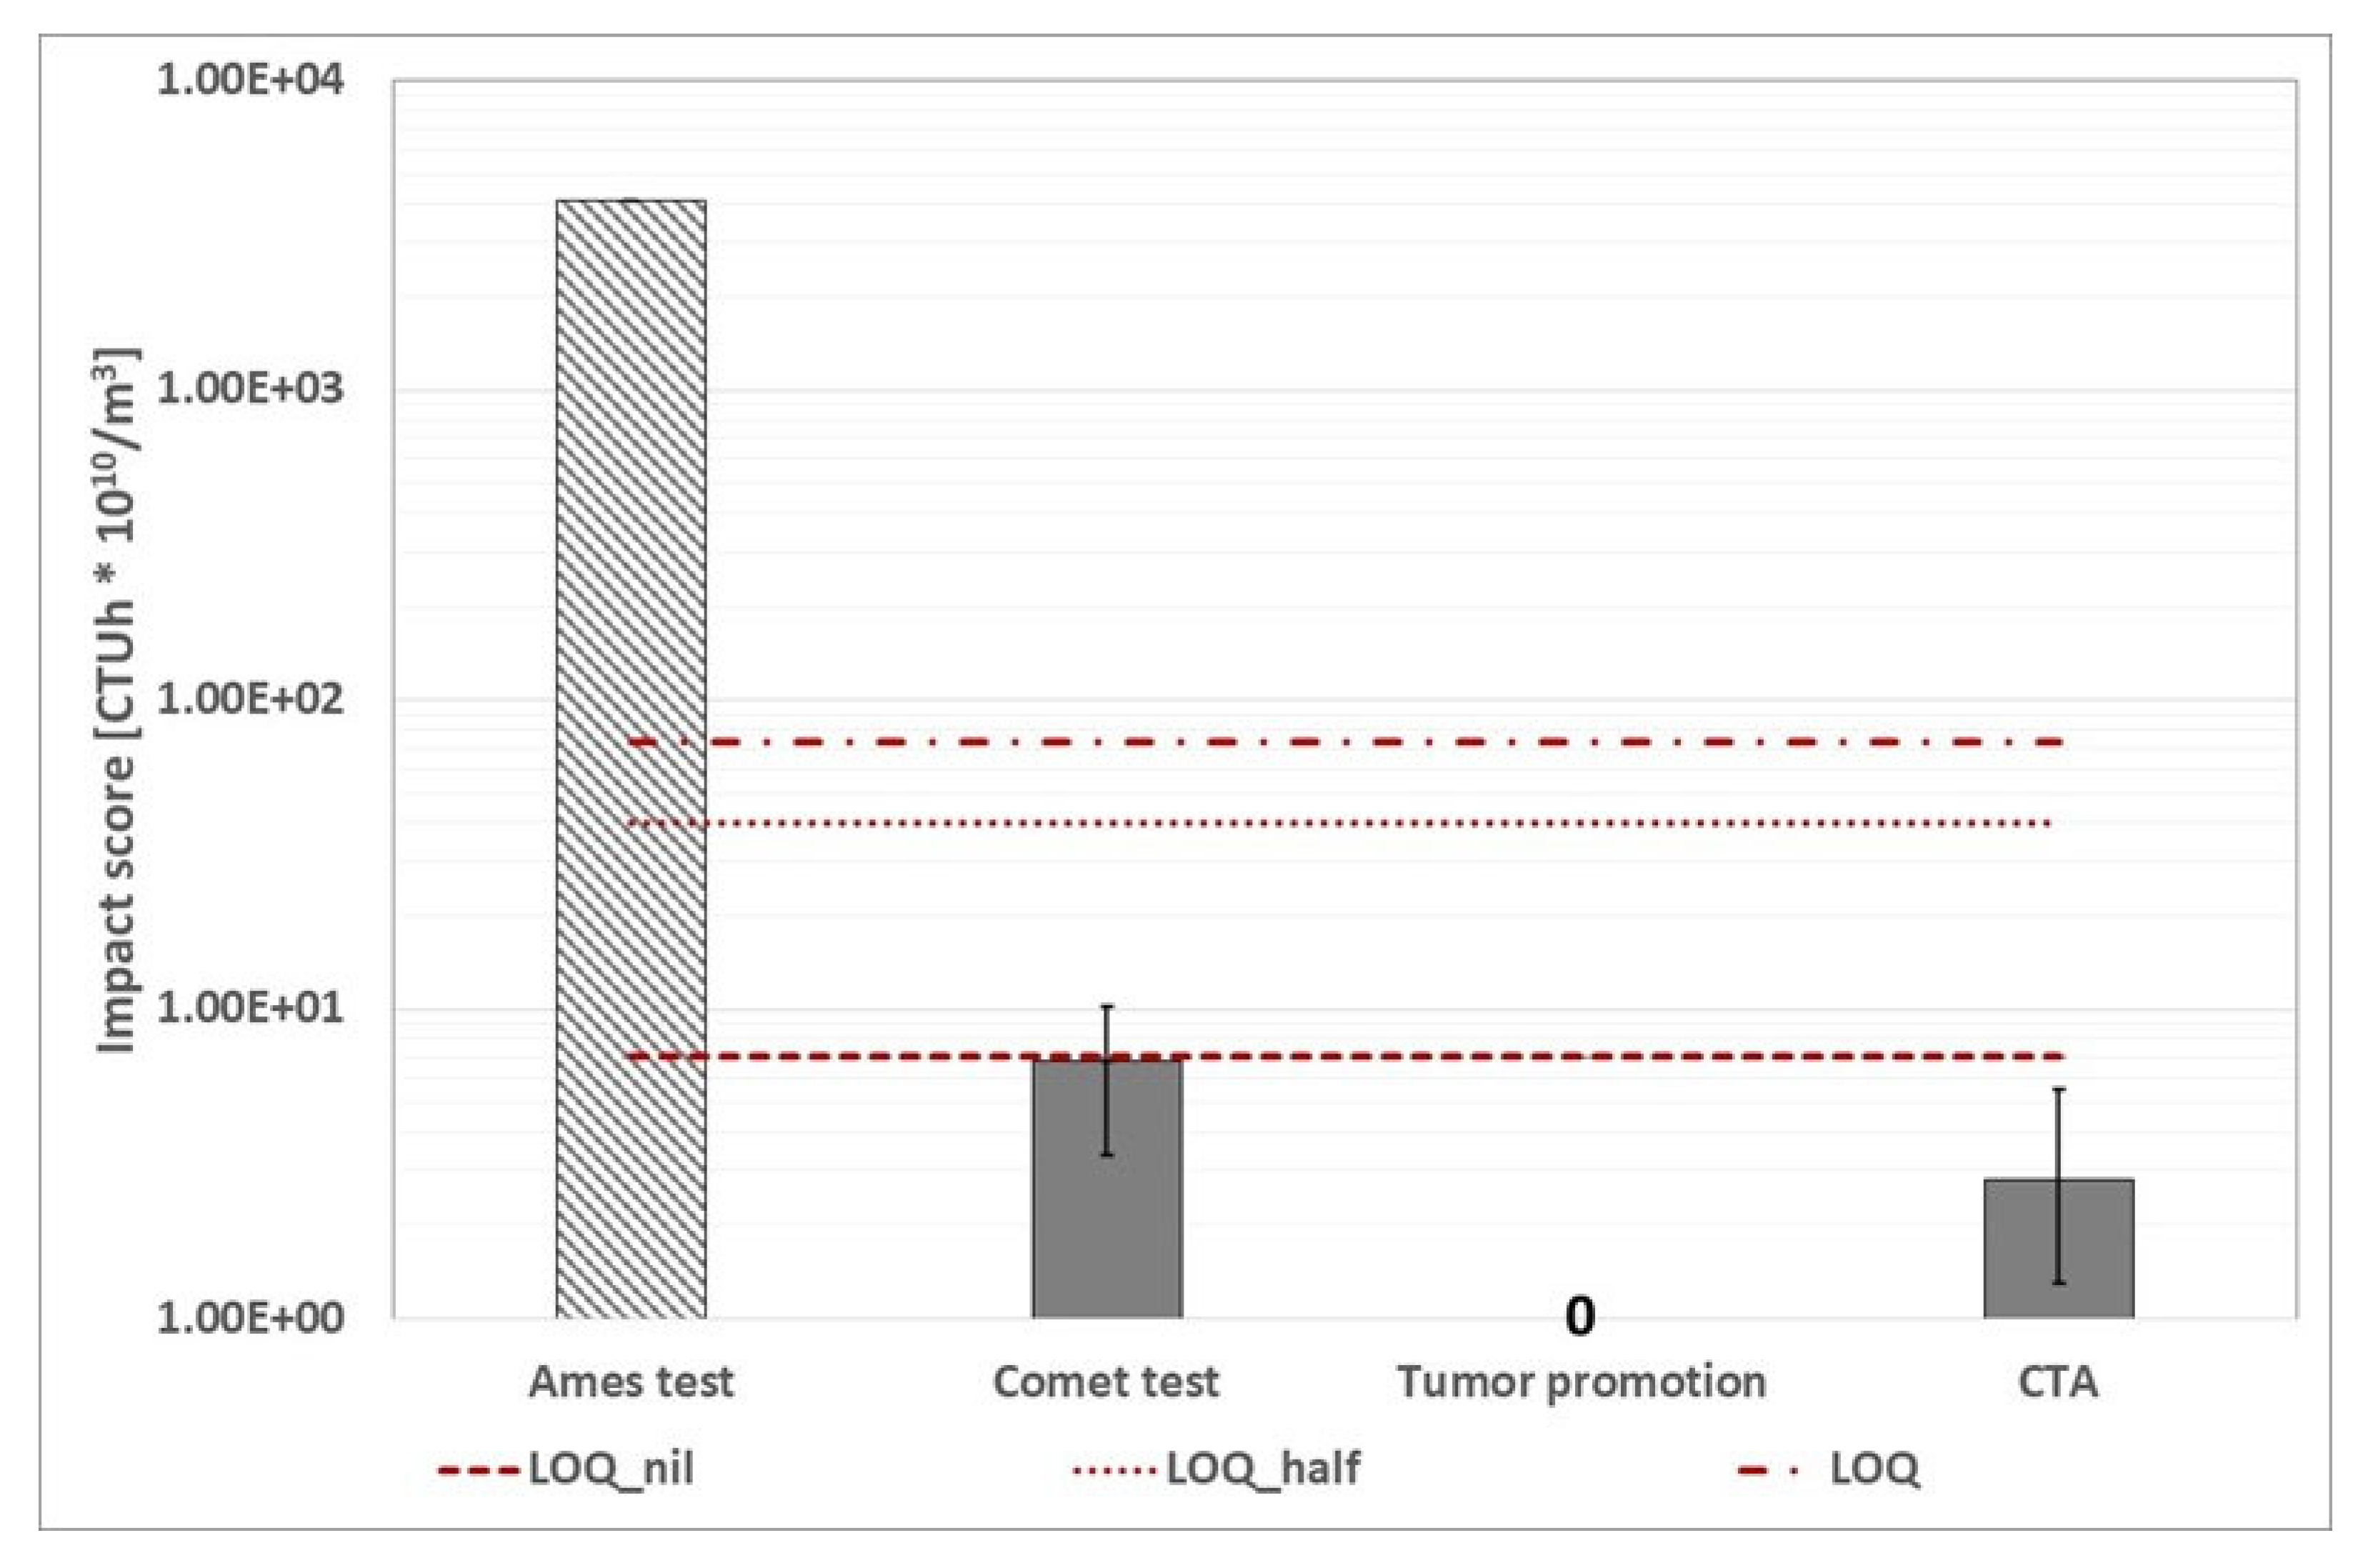
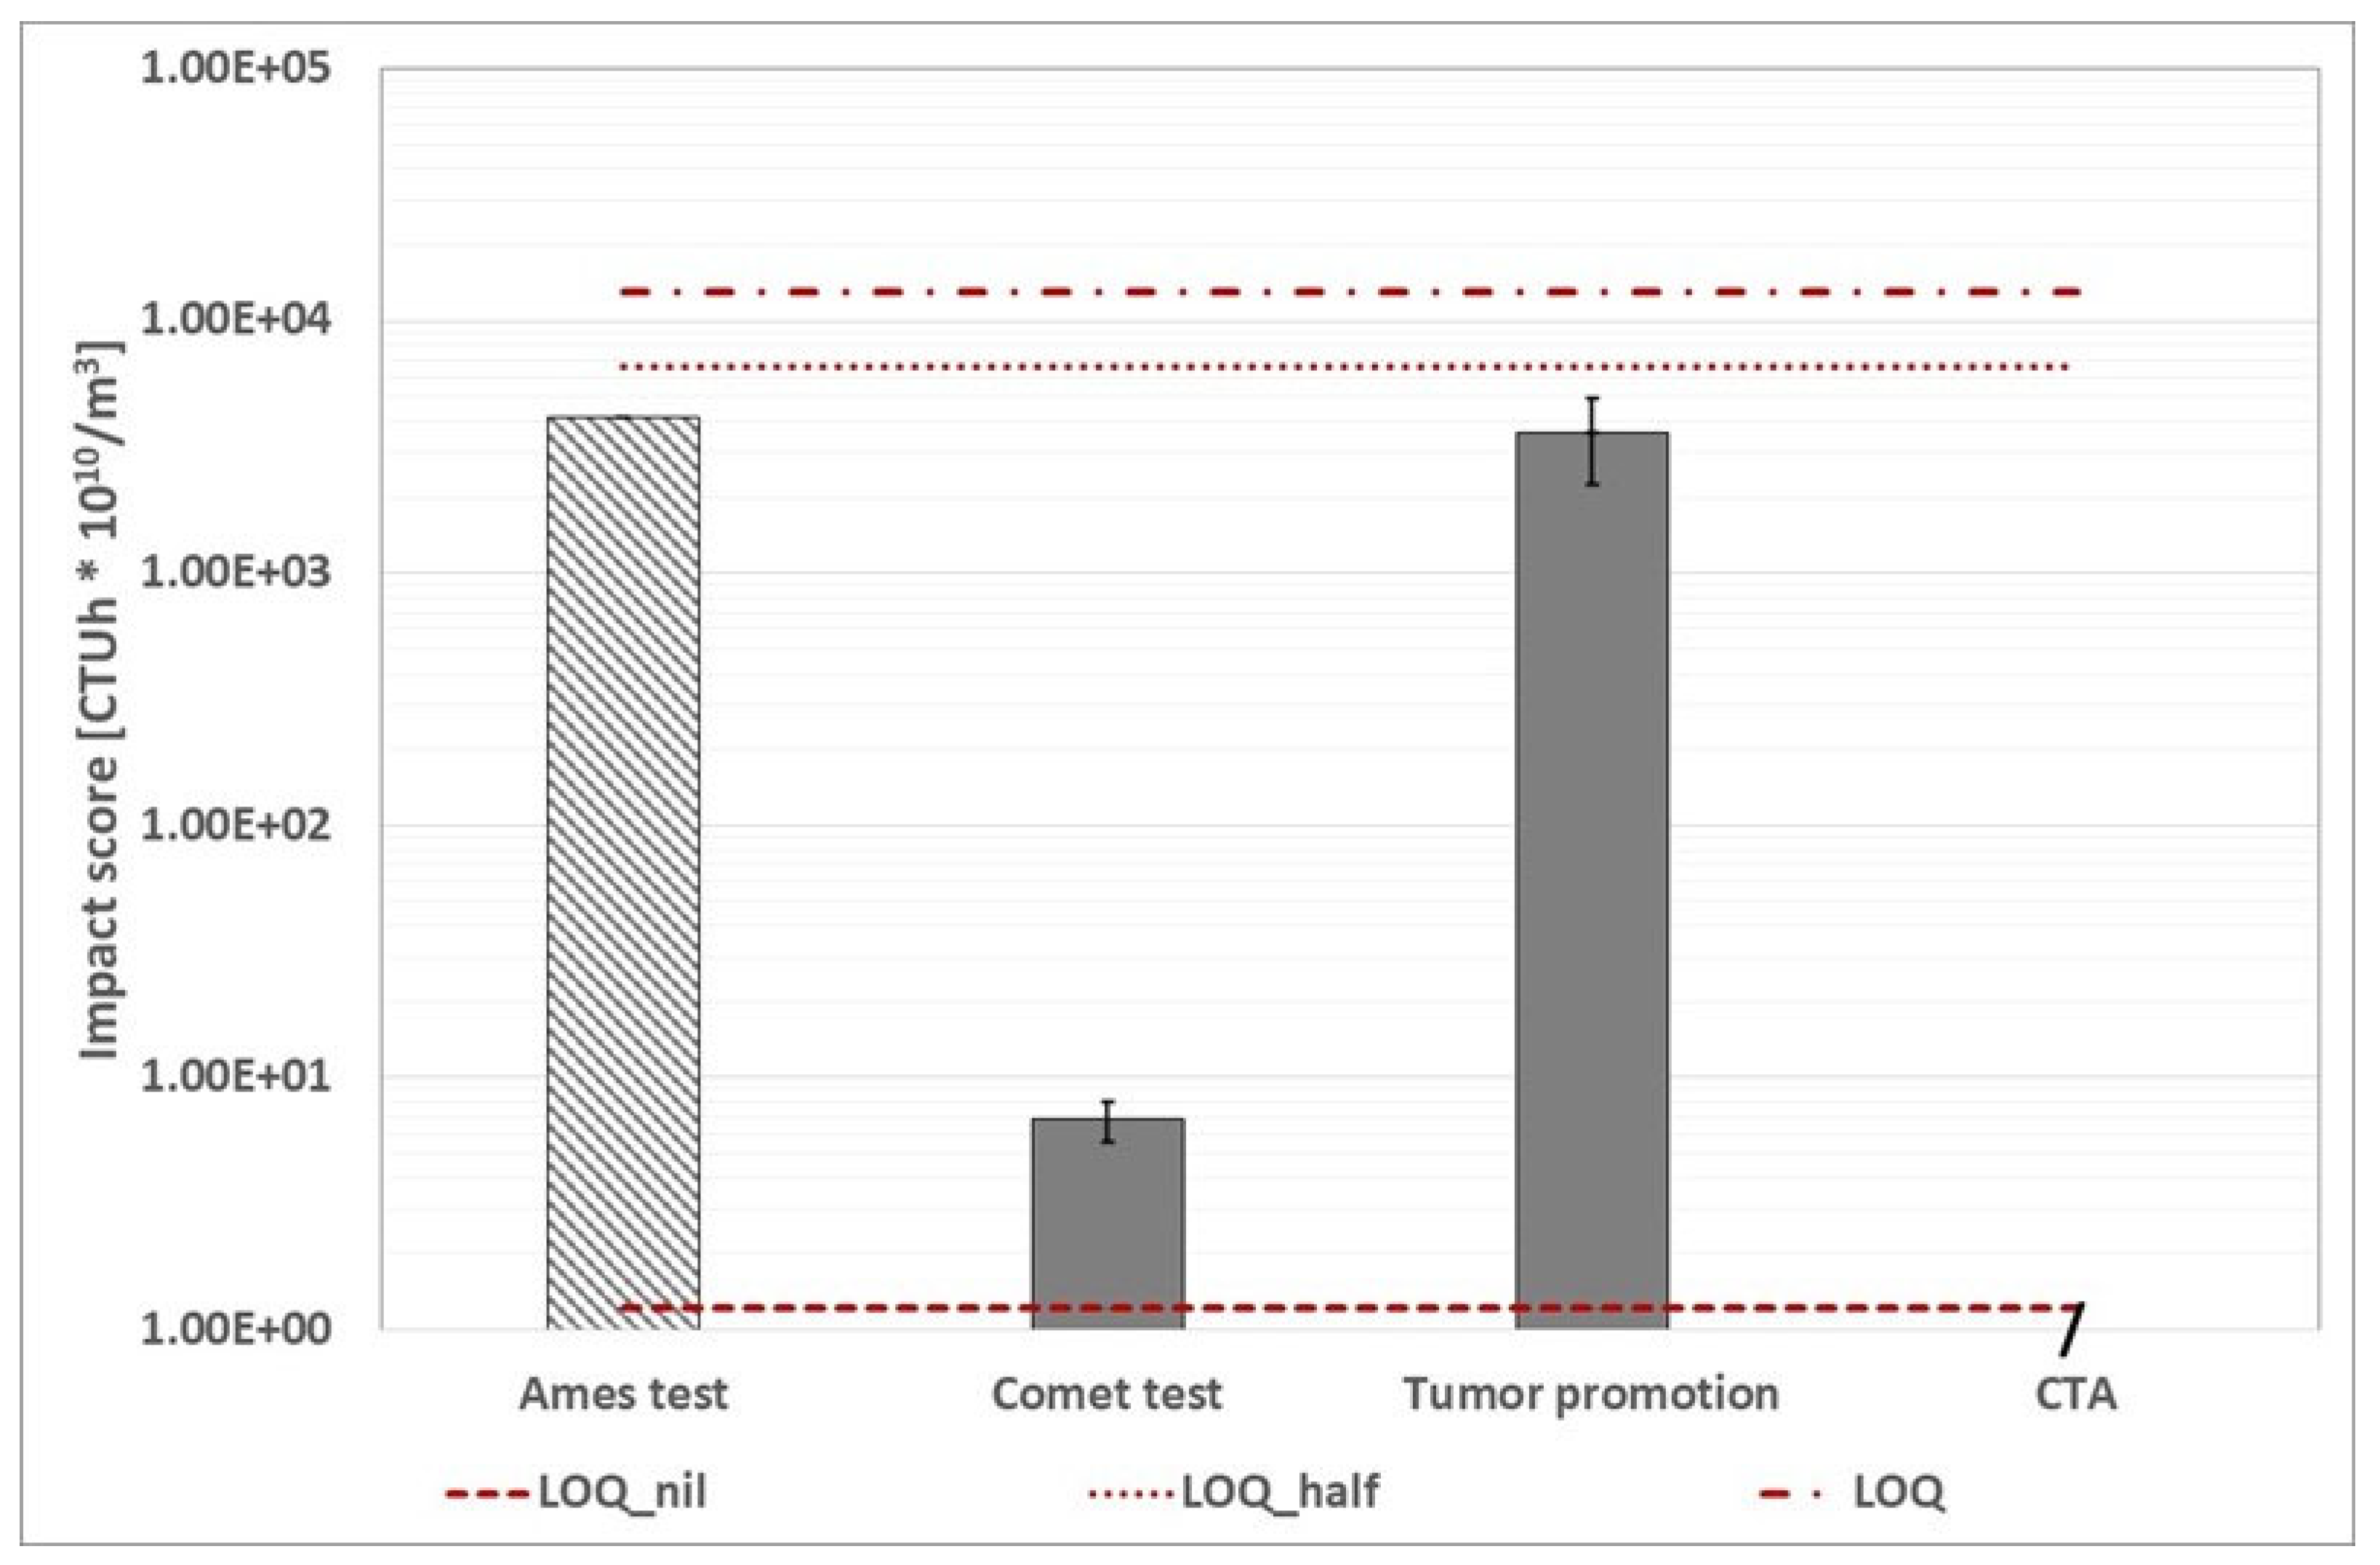
Based on the various bioassays performed, the innovative procedure developed four scenarios for each wastewater treatment plant in this impact category (see
Figure 17,
Figure 18,
Figure 19,
Figure 20 and
Figure 21). The summarizing representation is not possible in this case because only one substance was used as a reference chemical for each bioassay.
A thorough examination reveals that the environmental impact obtained by the Ames test is always greater than the impact score obtained by the comet test. This situation is consistent with expectations because the Ames test looks for point reverse mutations (frameshift mutations and base-pair substitutions, depending on the strain) with and without metabolic activation (S9), whereas the comet assay looks for damaged DNA in human leukocytes. Furthermore, a comparison of the other bioassays reveals that the tumor promotion test has a higher impact score than the CTA test footprint in all WWTPs (except the WWTP C where the trend is inverted since the impact associated with the tumour promotion is nil). The graphs show that the WWTPA and B (during both monitoring periods) have a larger environmental footprint than the WWTP C (in both treatment lines). A more detailed analysis reveals that the WTP A has a significant environmental footprint in comparison to the WWTP B, whereas the two treatment lines in the WWTP C have a similar impact score.
The criticalities that have emerged from the proposed elaboration, carried out on the basis of experimental data obtained on emissions considered as a whole, confirm the doubts and gaps that have yet to be filled that have already been highlighted by several authors. Building materials is one of the industries where the LCA technique causes challenges due to the presence of complex combinations. It is worth noting the observation of [
52] who point out that the toxicity of mixtures (in this case, emissions) is frequently underestimated and, on the other hand, that in most cases where the LCA calculation of a product or process is carried out, more emphasis is placed on environmental aspects in line with individual country policies, including, without a doubt, global warming. Any changes in the life cycle of the products and processes under consideration are thus primarily targeted at addressing the ever-increasing concentration of greenhouse gases. The same is true for the reduction of energy consumption. In this approach, ecotoxicological effects are regarded as a type of collateral or secondary impact [
53,
54]. In conclusion of a reasoned critical review on the toxicity of building materials, [
52] state that LCA protocols, which are the optimal tool for calculating the various impacts, should be improved in terms of toxic effect estimation, in order to at least consider the phenomena of bioaccumulation and the cocktail effect. Emphasis on the same critical issues is also placed by [
55], who propose the LCA on the Danish pork supply chain: not only is toxicity frequently overlooked, with most studies focusing on effects such as eutrophication and acidification, but exposure to multiple substances is often overlooked when it is taken into account. LCA methods should consider this and not be confined to the additive approach. The European Union, on the other hand, strongly encourages the use of tools such as OEF and PEF, in order to comply with the UN Life Cycle Initiative project "Linking the UN Sustainable Development Goals to Life Cycle Impact Pathway Frameworks," which recommends the use of LCA to monitor SDGs at the corporate level. Similarly, the adoption of the OEF/PEF, due to the fact that it includes the categories of human toxicity and freshwater ecotoxicity, goes in the direction of compliance with EU policies and strategies, such as the CSS (Chemicals Strategy for Sustainability, SDG, 15: Toxicity-free environments), the CEAP (Circular Economy Action Plan), the F2F (Farm to Fork), and the BS (Biodiversity Strategy) [
56]. Nonetheless, [
57] critically review a number of studies evaluating the impact of waste reutilisation in agriculture in terms of toxicity: in many cases, toxicity can only be estimated by considering trace pollutants or, at the very least, a very small portion of organic substances. This is due to the fact that models and inventories only (necessarily) consider a limited group of substances, excluding abiotic and biotic degradation by-products, toxins, and particulate matter. In fact, other authors have attempted a similar approach to ours, calculating the environmental risk associated with the use of digestate as a soil conditioner and considering it as a single matrix [
58]. They calculated the EF parameter (see Equation (2), paragraph 2.3) for terrestrial ecotoxicity, which will be used to calculate the CF value once the FF and XF values for exposure and fate in the ecosystem have been estimated.
Author Contributions
Conceptualization, G.B., M.M. and R.P..; Methodology, G.B., M.M. and R.P.; Formal Analysis, G.B., M.M.; Investigation, D.F., G.M., R.P., N.S., C.U. and I.Z.; Data Curation, all.; Writing – Original Draft Preparation, G.B., M.M. and R.P.; Writing – Review & Editing, G.B., M.M. and R.P.; Visualization, G.B.; Supervision, G.B.; Project Administration, G.B.; Funding Acquisition, G.B.
Figure 1.
The WWTP A process flow diagram.
Figure 1.
The WWTP A process flow diagram.
Figure 2.
The WWTP B process flow diagram.
Figure 2.
The WWTP B process flow diagram.
Figure 3.
The WWTP C CAS line process flow diagram.
Figure 3.
The WWTP C CAS line process flow diagram.
Figure 4.
The WWTP C MBR line process flow diagram.
Figure 4.
The WWTP C MBR line process flow diagram.
Figure 5.
Subsets of compounds analyzed and bioassays used in the life cycle inventory assessment.
Figure 5.
Subsets of compounds analyzed and bioassays used in the life cycle inventory assessment.
Figure 6.
WWTP A: environmental footprint, related to freshwater ecotoxicity, calculated with the alternative protocol (the red dotted line represents the conventional impact score calculated without considering the substances detected above the LOQ). The conventional impact score, calculated with half of the LOQ value and the LOQ value, are respectively 919.89 CTUe/m3 and 1766.16 CTUe/m3.
Figure 7.
WWTP B (grape harvest time): environmental footprint, related to freshwater ecotoxicity, calculated with the alternative protocol (the red dotted line represents the conventional impact score calculated without considering the substances detected above the LOQ). “0” indicates that the impact score correlated to the A. fischeri test is nil. The conventional impact score, calculated with half of the LOQ value and the LOQ value, are respectively 891.73 CTUe/m3 and 1738.06 CTUe/m3.
Figure 8.
WWTP B (routine time): environmental footprint, related to freshwater ecotoxicity, calculated with the alternative protocol (the red dotted line represents the conventional impact score calculated without considering the substances detected above the LOQ). “0” indicates that the impact score correlated to the A. fischeri test is nil. The conventional impact score, calculated with half of the LOQ value and the LOQ value, are respectively 886.29 CTUe/m3 and 1732.62 CTUe/m3.
Figure 9.
WWTP C (CAS line): environmental footprint, related to freshwater ecotoxicity, calculated with the alternative protocol (the red dotted line represents the conventional impact score calculated without considering the substances detected above the LOQ). “0” indicates that the impact score correlated to the A. fischeri test is nil. The conventional impact score, calculated with half of the LOQ value and the LOQ value, are respectively 255.75 CTUe/m3 and 476.25 CTUe/m3.
Figure 10.
WWTP C (MBR line): environmental footprint, related to freshwater ecotoxicity, calculated with the alternative protocol (the red dotted line represents the conventional impact score calculated without considering the substances detected above the LOQ). “0” indicates that the impact score correlated to the A. fischeri test is nil. The conventional impact score, calculated with half of the LOQ value and the LOQ value, are respectively 243.92 CTUe/m3 and 464.42 CTUe/m3.
Figure 11.
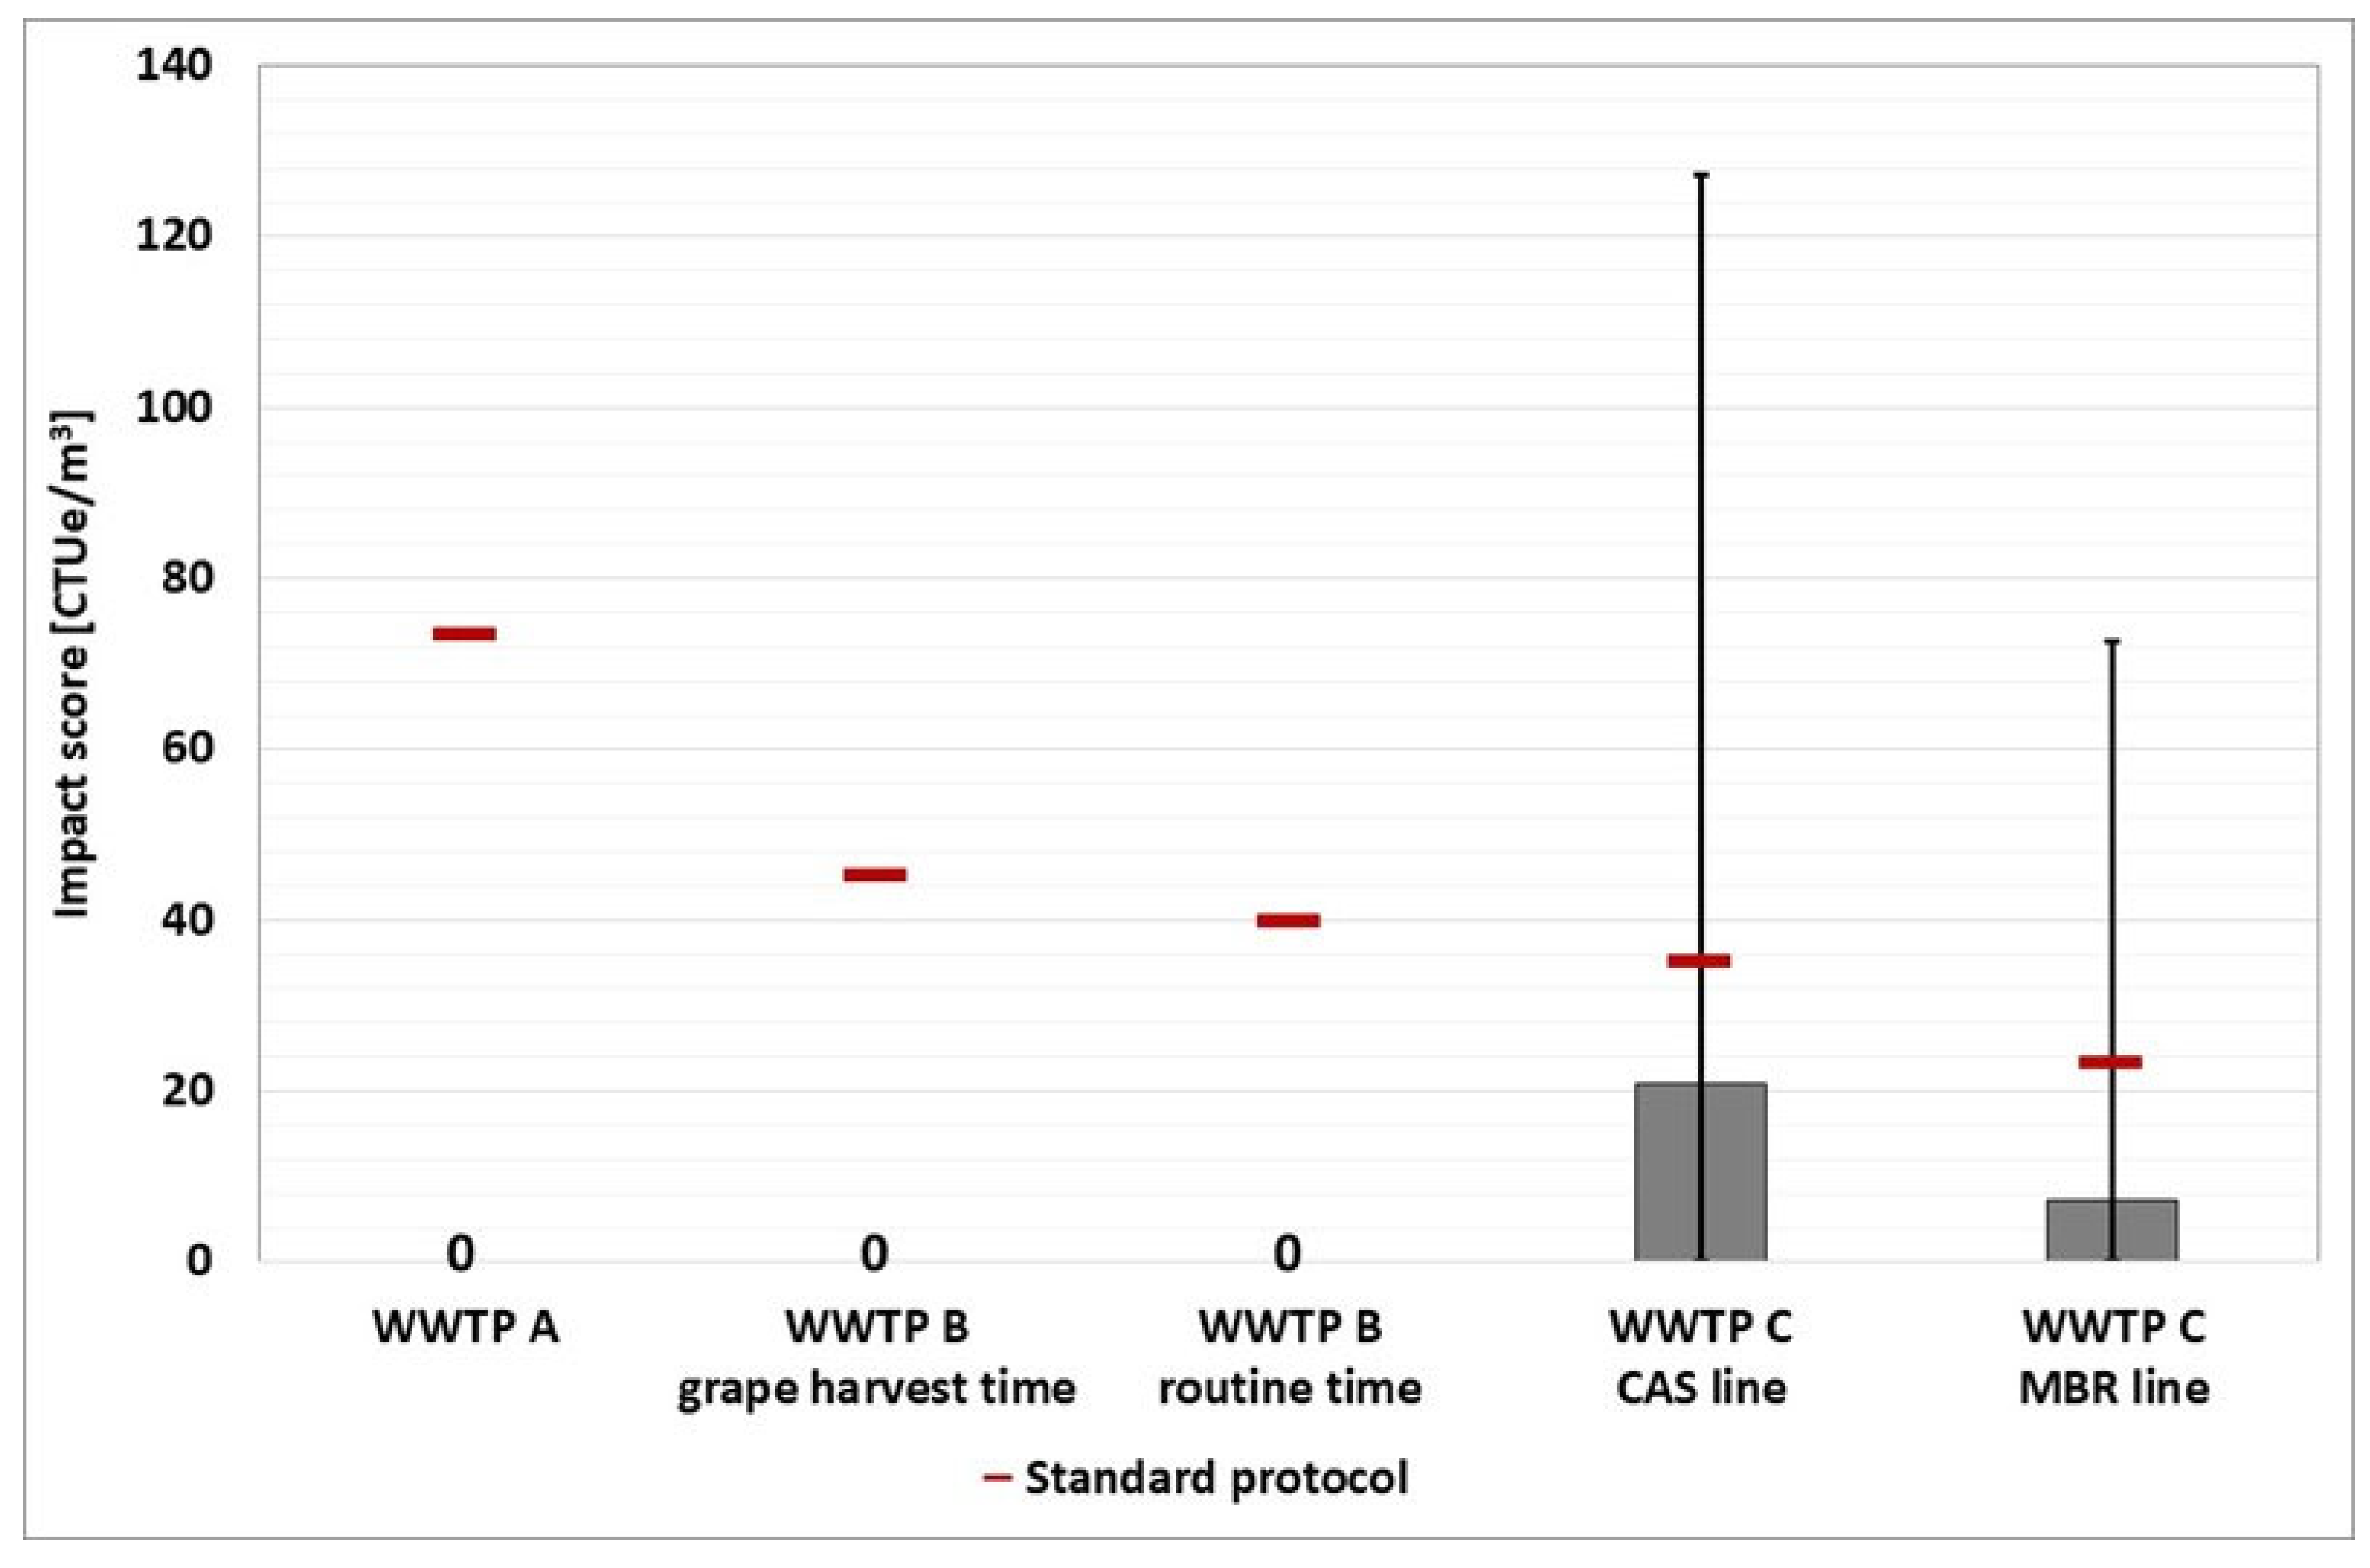
Environmental footprint, related to the freshwater ecotoxicity, calculated with the alterative protocol starting from the outcomes of the A. cepa test. “0” indicates that the impact score is nil. The red stroke represents the conventional impact score calculated without considering the substances detected above the LOQ.
Figure 12.
WWTP A: a box plot of the impact score obtained from the four baseline toxicity assays (D. magna 24 hours, D. magna 48 hours, R. subcapitata and A. fischeri). The three red dotted lines represent the conventional impact score calculated using the three ways mentioned above.
Figure 12.
WWTP A: a box plot of the impact score obtained from the four baseline toxicity assays (D. magna 24 hours, D. magna 48 hours, R. subcapitata and A. fischeri). The three red dotted lines represent the conventional impact score calculated using the three ways mentioned above.
Figure 13.
WWTP B (grape harvest time): box plot statement of the four-baseline toxicity assay impact score (D. magna 24 hours, D. magna 48 hours, R. subcapitata and A. fischeri). The three red dotted lines represent the conventional impact score calculated using the three ways described above.
Figure 13.
WWTP B (grape harvest time): box plot statement of the four-baseline toxicity assay impact score (D. magna 24 hours, D. magna 48 hours, R. subcapitata and A. fischeri). The three red dotted lines represent the conventional impact score calculated using the three ways described above.
Figure 14.
WWTP B (routine time): box plot statement of the four-baseline toxicity assay impact score (D. magna 24 hours, D. magna 48 hours, R. subcapitata and A. fischeri). The three red dotted lines represent the conventional impact score calculated using the three ways described above.
Figure 14.
WWTP B (routine time): box plot statement of the four-baseline toxicity assay impact score (D. magna 24 hours, D. magna 48 hours, R. subcapitata and A. fischeri). The three red dotted lines represent the conventional impact score calculated using the three ways described above.
Figure 15.
WWTP C (CAS line): box plot statement of the impact score obtained by the four-baseline toxicity assays (D. magna 24 hours, D. magna 48 hours, R. subcapitata and A. fischeri). The three red dotted lines represent the conventional impact score calculated in the three ways described above.
Figure 15.
WWTP C (CAS line): box plot statement of the impact score obtained by the four-baseline toxicity assays (D. magna 24 hours, D. magna 48 hours, R. subcapitata and A. fischeri). The three red dotted lines represent the conventional impact score calculated in the three ways described above.
Figure 16.
WWTP C (MBR line): box plot statement of the impact score obtained by the four-baseline toxicity assays (D. magna 24 hours, D. magna 48 hours, R. subcapitata and A. fischeri). The three red dotted lines represent the conventional impact score calculated using the three ways described above.
Figure 17.
WWTP A: calculated using the alternative protocol, the environmental footprint related to human toxicity cancer category (the three red dotted lines represent the conventional impact score calculated with the abovementioned three ways). The character "/" indicates that the assay was not performed. The Ames test histogram shows that the impact score is lower than the value displayed.
Figure 18.
WWTP B (grape harvest time): calculated environmental footprint using alternative protocol based on human toxicity cancer category (the three red dotted lines represent the conventional impact score calculated with the three ways abovementioned). The Ames test histogram shows that the impact score is lower than the value displayed.
Figure 19.
WWTP B (routine time): calculated with the alternative protocol, environmental footprint related to human toxicity cancer category (the three red dotted lines represent the conventional impact score calculated with the three ways abovementioned). The character "/" indicates that the assay was not carried out. The Ames test histogram indicates that the impact score is lower than the value shown.
Figure 20.
WWTP C (CAS line): calculated environmental footprint based on human toxicity cancer category using alternative protocol (the three red dotted lines represent the conventional impact score calculated with the three ways abovementioned). The value "0" indicates that the impact score is zero. The Ames test histogram indicates that the impact score is lower than the value shown.
Figure 21.
WWTP C (MBR line): environmental footprint calculated using the alternative protocol, based on human toxicity cancer category (the three red dotted lines represent the conventional impact score calculated with the abovementioned three ways). The value "0" indicates that the impact score is zero. The Ames test histogram indicates that the impact score is lower than the value shown.
Table 1.
Characterization factors for the freshwater ecotoxicity reference substances. The ILCD package represents old CFs, whereas the EF 3.0 package represents new CFs.
Table 1.
Characterization factors for the freshwater ecotoxicity reference substances. The ILCD package represents old CFs, whereas the EF 3.0 package represents new CFs.
| Reference substance |
ILCD |
EF 3.0 |
| Cadmium |
9710 |
229000 |
| Zinc |
38600 |
1330 |
| 3,5-dichlorophenol |
6910 |
50780 |
| Dodecyl benzene sulfonic acid |
3110 |
11963 |
| Maleic hydrazide |
182 |
2175.2 |
Table 2.
Characterization factors for human toxicity (non-cancer) reference substances. The ILCD package represents old CFs, whereas the EF 3.0 package represents new CFs.
Table 2.
Characterization factors for human toxicity (non-cancer) reference substances. The ILCD package represents old CFs, whereas the EF 3.0 package represents new CFs.
| Reference substance |
ILCD |
EF 3.0 |
| Methyl methanesulfonate (MMS) |
2.51E-06 |
2.51E-06 |
| Lindane |
3.35E-05 |
1.10E-04 |
| 3-methylcholanthrene (3MCA) |
4.82E-05 |
4.08E-05 |
Table 3.
Impact on freshwater ecotoxicity category: values of CTUe/m3 for the studied WWTPs.
Table 3.
Impact on freshwater ecotoxicity category: values of CTUe/m3 for the studied WWTPs.
| WWTP |
ILCDCTUe/m3
|
EF 3.0CTUe/m3
|
| A |
4.27 |
73.62 |
| B (routine time) |
0.63 |
39.96 |
| B (grape harvest time) |
0.63 |
45.40 |
| C (CAS) |
8.94 |
35.25 |
| C (MBR) |
6.96 |
23.42 |
Table 4.
Impact on freshwater ecotoxicity category: values of CTUh/m3 for the studied WWTPs.
Table 4.
Impact on freshwater ecotoxicity category: values of CTUh/m3 for the studied WWTPs.
| WWTP |
ILCDCTUh/m3
|
EF 3.0CTUh/m3
|
| A |
1.73E-09 |
4.62E-10 |
| B (routine time) |
6.71E-10 |
1.22E-10 |
| B (grape harvest time) |
8.63E-10 |
1.73E-10 |
| C (CAS) |
2.26E-09 |
7.02E-10 |
| C (MBR) |
2.45E-09 |
7.61E-10 |
Table 5.
Environmental footprint on freshwater ecotoxicity category (expressed as CTUe/m3) and human toxicity cancer category (expressed as CTUh/m3) calculated according to the standard approach detailed in Recommendation 2279/2021/EU.
Table 5.
Environmental footprint on freshwater ecotoxicity category (expressed as CTUe/m3) and human toxicity cancer category (expressed as CTUh/m3) calculated according to the standard approach detailed in Recommendation 2279/2021/EU.
| WWTP |
Standard approach |
| Freshwater ecotoxicity |
Human toxicity/cancer |
| Hyp. 1 |
Hyp. 2 |
Hyp. 3 |
Hyp. 1 |
Hyp. 2 |
Hyp. 3 |
| A |
73.62 |
919.89 |
1766.16 |
4.62E-10 |
6.56E-07 |
1.31E-06 |
| B (routine time) |
39.96 |
886.29 |
1732.62 |
1.22E-10 |
6.56E-07 |
1.31E-06 |
| B (grape harvest time) |
45.40 |
891.73 |
1738.06 |
1.73E-10 |
6.56E-07 |
1.31E-06 |
| C (CAS) |
35.25 |
255.75 |
476.25 |
7.02E-10 |
4.01E-09 |
7.32E-09 |
| C (MBR) |
23.42 |
243.92 |
464.42 |
7.61E-10 |
4.01E-09 |
7.32E-09 |
