1. Introduction
The prediction of various, including polymer, composite structures’ elastic properties under normal and heating temperatures is very actual in design of such structures, especially subjected to transient thermomechanical actions. Thermal expansivity (TE) and elasticity are the main properties characterizing the deformability of composite and the significant factors of polymers and FRPs’ thermal stresses developing in real structures during exploitation [
1,
2,
3,
4]. Thus, the adequate relation between thermal expansibility and elasticity of material provides the decision of many design tasks. The basic parameter of thermal expansivity is coefficient of TE (CTE), and the basic parameter of elasticity is the modulus of elasticity (MoE). Several researches demonstrated the approximation of relation between MoE and CTE for different materials, including metals, minerals, glasses, polymers and plastics. The most famous research of this is the study of R.E. Barker Jr [
5].
In Barker’s study common research of TE-MoE relation completed with following results [
5]:
The groups of absolutely different materials with approximated TE-MoE relation are determined, and glassed materials, including polymers and FRP, are in this number.
The approximated CTE (
)-MoE (
) relation under normal temperature is suggested with following formula
The theoretical energy model of TE-MoE relation is proposed. The theory is based on bonds’ harmonical/unharmonical vibrations frequencies determination. As the more directly related with the main sequence rule the following function with heat capacities (C) and temperature (T) factors is proposed
Analyzing these scientific results and taking into account properties of polymers and FRPs, the following developing questions appear:
What is the accuracy of approximated CTE-MoE relation for thermosetting polymers and FRPs’? Research data includes the wide variety of approximation.
Is the approximated CTE-MoE relation depending on temperature? The fact relation (1) between CTE and MoE is not depending on temperature, but the Barker’s theory model (2) has the temperature factor.
Could be the CTE-MoE relation model be realized on the base of physical properties of polymer supramolecular structure? The energy model is very difficult to application and practical prediction of composites’ elasticity or expansion.
Few studies concerned with relationship of thermal expansivity and elasticity of polymers and plastics. The most of them discover this problem in the research area of stress relaxation under thermal heating [
6,
7,
8,
9,
10].
Thermal expanding is usual for glassed polymers and characterized by CTE, but many researches points to the relationship between CTE and heating temperature. Experimental studies of the polymers’ CTE temperature dependence (including epoxy polymers) presented that the temperature expansion depends significantly not only on the temperature range [
11,
12,
13,
14,
15,
16,
17], but also on the rate of temperature change [
18]. It is also noted the presence of static stresses during cyclic tests (heating cooling), which leads to a hysteresis effect on the curve of the relationship between the deformations and temperature.
In most cases these phenomena described by the polymer molecules confirmation mechanisms concluded in 3D molecule replacement and distribution changing influencing changing of CTE [
19,
20,
21,
22]. So, the polymer molecules confirmation mechanism results in simultaneous CTE and MoE non-linear changing due to stress relaxation and expansivity compensation. According to the researches of elasticity of thermosetting polymers under heating the elasticity’s non-linear decreasing is a result of the following processes:
Polymer molecules thermo-expanding with their morphology and pack changes [
23,
24].
Inter-molecular bonds’ flexibility and torsion increasing under heating [
25,
26].
Thus, the relation between CTE and MoE can be realized as MoE function of CTE factor: MoE = f(CTE), where elasticity is a result of thermal expansion reason.
The authors’ previous researches [
27,
28] determined non-linear models of MoE and CTE of polymers and FRPs’ under heating. The models discover non-linearity as consequence of conglomerate character of two-phase supramolecular structures where interdomain (domain–phase 1) or inter-transition zone (ITZ–phase 2) determines thermal expansion compensation and stress relaxation during heating, so as these properties’ changing after prolonged heating and thermo-relaxation. Thermal expansion of polymer composites and hybrids is more complex due to influence of all components on summary expansion result.
It is important that non-linearity of MoE and CTE of polymers and FRPs under heating continues before achieving glass transition temperature (Tg). After Tg, polymers are losing their elasticity and CTE is getting linear temperature dependence. So, the Tg is the breaking point of thermosetting polymers and FRPs deformability’s models.
All this consideration led to the research aim to develop the model of relation between MoE and CTE of thermosetting polymers and PRPs on the base of supramolecular structures’ parameters. Accordingly, the following scientific tasks were formulated:
Experimental research of MoE and CTE of thermosetting polymers and FRPs under heating including Tg before and after thermo-relaxation to determine accuracy of approximated CTE-MoE relation.
Determination of the approximated CTE-MoE relations dependence on temperature and universality limits.
Realizing the supramolecular relaxation model as a function MoE = f(CTE) of CTE-MoE relation of thermosetting polymers and FRPs using previous experience in supramolecular modeling of composites elasticity and TE.
2. Materials and Methods
2.1. Materials
The materials used in this study were glassed polymers made of epoxy, phenolic, epoxy-phenolic resins and fiberglass plastics made of epoxy- and epoxy-phenolic resins and structural glass fabrics EZ-200 and T-23 (
Table 1). In study were used new samples of repeated from previous studies (1, 2) and non-repeated compositions for providing the simultaneous MoE and CTe testing of the same series’ samples.
Epoxy binder (EP) for fiberglass plastic was made based on epoxy resin KER 828 (South Korea), which is an analog of the Russian resin ED-20, isomethyltetrahydrophthalic anhydride (ISOMTHFA) was used as a hardener, 2,4,6-tris-(dimethylaminomethyl)-phenol, produced under the brand name Alkophen was used as a curing gas pedal. The weight ratio of the ES components is as follows: KER 828-52.5 %, IZOMTGFA-44.5 %, Alcophene-3 %. The components described below were used to make the binders:
Epoxy resin KER 828, with the following main characteristics: Epoxy Group Content (EGC) 5308 mmol/kg, Epoxide Equivalent Weight (EEW) 188.5 g/eq, viscosity at 25 °C 12.7 Pa.s, HCl 116 mg/kg, and total chlorine 1011 mg/kg. Manufacturer: KUMHO P&B Chemicals, Gwangju, South Korea.
Hardener for epoxy resin methyl tetrahydrophthalic anhydride with the following main characteristics: viscosity at 25 °C 63 Pa.s, anhydride content 42.4%, volatile fraction content 0.55%, and free acid 0.1%. Manufacturer: ASAMBLY Chemicals company Ltd., Nanjing, China.
Alkofen (epoxy resin curing accelerator) with the following main characteristics: viscosity at 25 °C 150 Pa.s, molecular formula C15H27N3O, molecular weight 265, and amine value 600 mg KOH/g. Manufacturer: Epital JSC, Moscow, Russian Federation.
The components were mixed in the above proportions at room temperature of about 25 °C. Mixing to a homogeneous consistency was carried out mechanically with an electric drill with a mixing attachment.
Composites were produced by glass fibre and mineral additive introducing.
Glass fabric T-23 is produced in accordance with Russian standard GOST 19170-2001 and has the following characteristics:
- -
thickness, 0.27 +0.01 / -0.02 mm;
- -
Surface density, 260 +25 / -25 g/m2;
- -
number of yarns per 1 cm of fabric on the basis 12 +/- 1;
- -
number of yarns per 1 cm of fabric on the weft 8 +/- 1;
- -
weave-plain;
- -
oiling agent-aminosilane.
Mineral additive is the dry fly ash (FA) from Refta electric station with square surface 4500 cm2/g, dominating oxides are SiO2 (>70%), Al2O3 (>12%), Na2O+K2O (>6%).
Samples of fiberglass plastic and composites were made in the form of plates of 15 x 15 cm. Cut sheets of glass fabric EZ-200 were calcined at 300 0C to remove the paraffin oiling agent im-mediately before impregnation with the binder. Glass fabric T-23 was not calcined. In total, the samples had 10 layers of glass fabric laid according to the scheme 0 / 90 (base/weft).
Glass-reinforced plastic and composite specimens were cured at 120 0C for 20 minutes in silicone molds while being loaded through Teflon-coated metal plates at a pressure of about 0.22 kPa. The cured specimens were then kept at 150 0C for 12 hours. After that, beam samples were cut from the plates in the direction of the main axes of orthotropy, which were considered in this work.
2.2. Methods
2.2.1. Long Heat Treatment (Thermal Aging)
After curing, some of the fiberglass samples were exposed to prolonged exposure at elevated temperatures, while the control series was stored under normal conditions. The long-term curing (hereinafter referred to simply as "curing") of the samples at elevated temperatures was performed according to the following program: 168 hours (one week) at 160 °C, 168 hours at 190 °C, 168 hours at 220 °C. After the heat treatment, the samples were cooled at a rate of about 1 °C per minute to 50 °C, removed from the laboratory oven, weighed, and then weighed and tested for three-point bending at temperatures from 25 to 180 °C.
2.2.2. Dilatometric Investigation
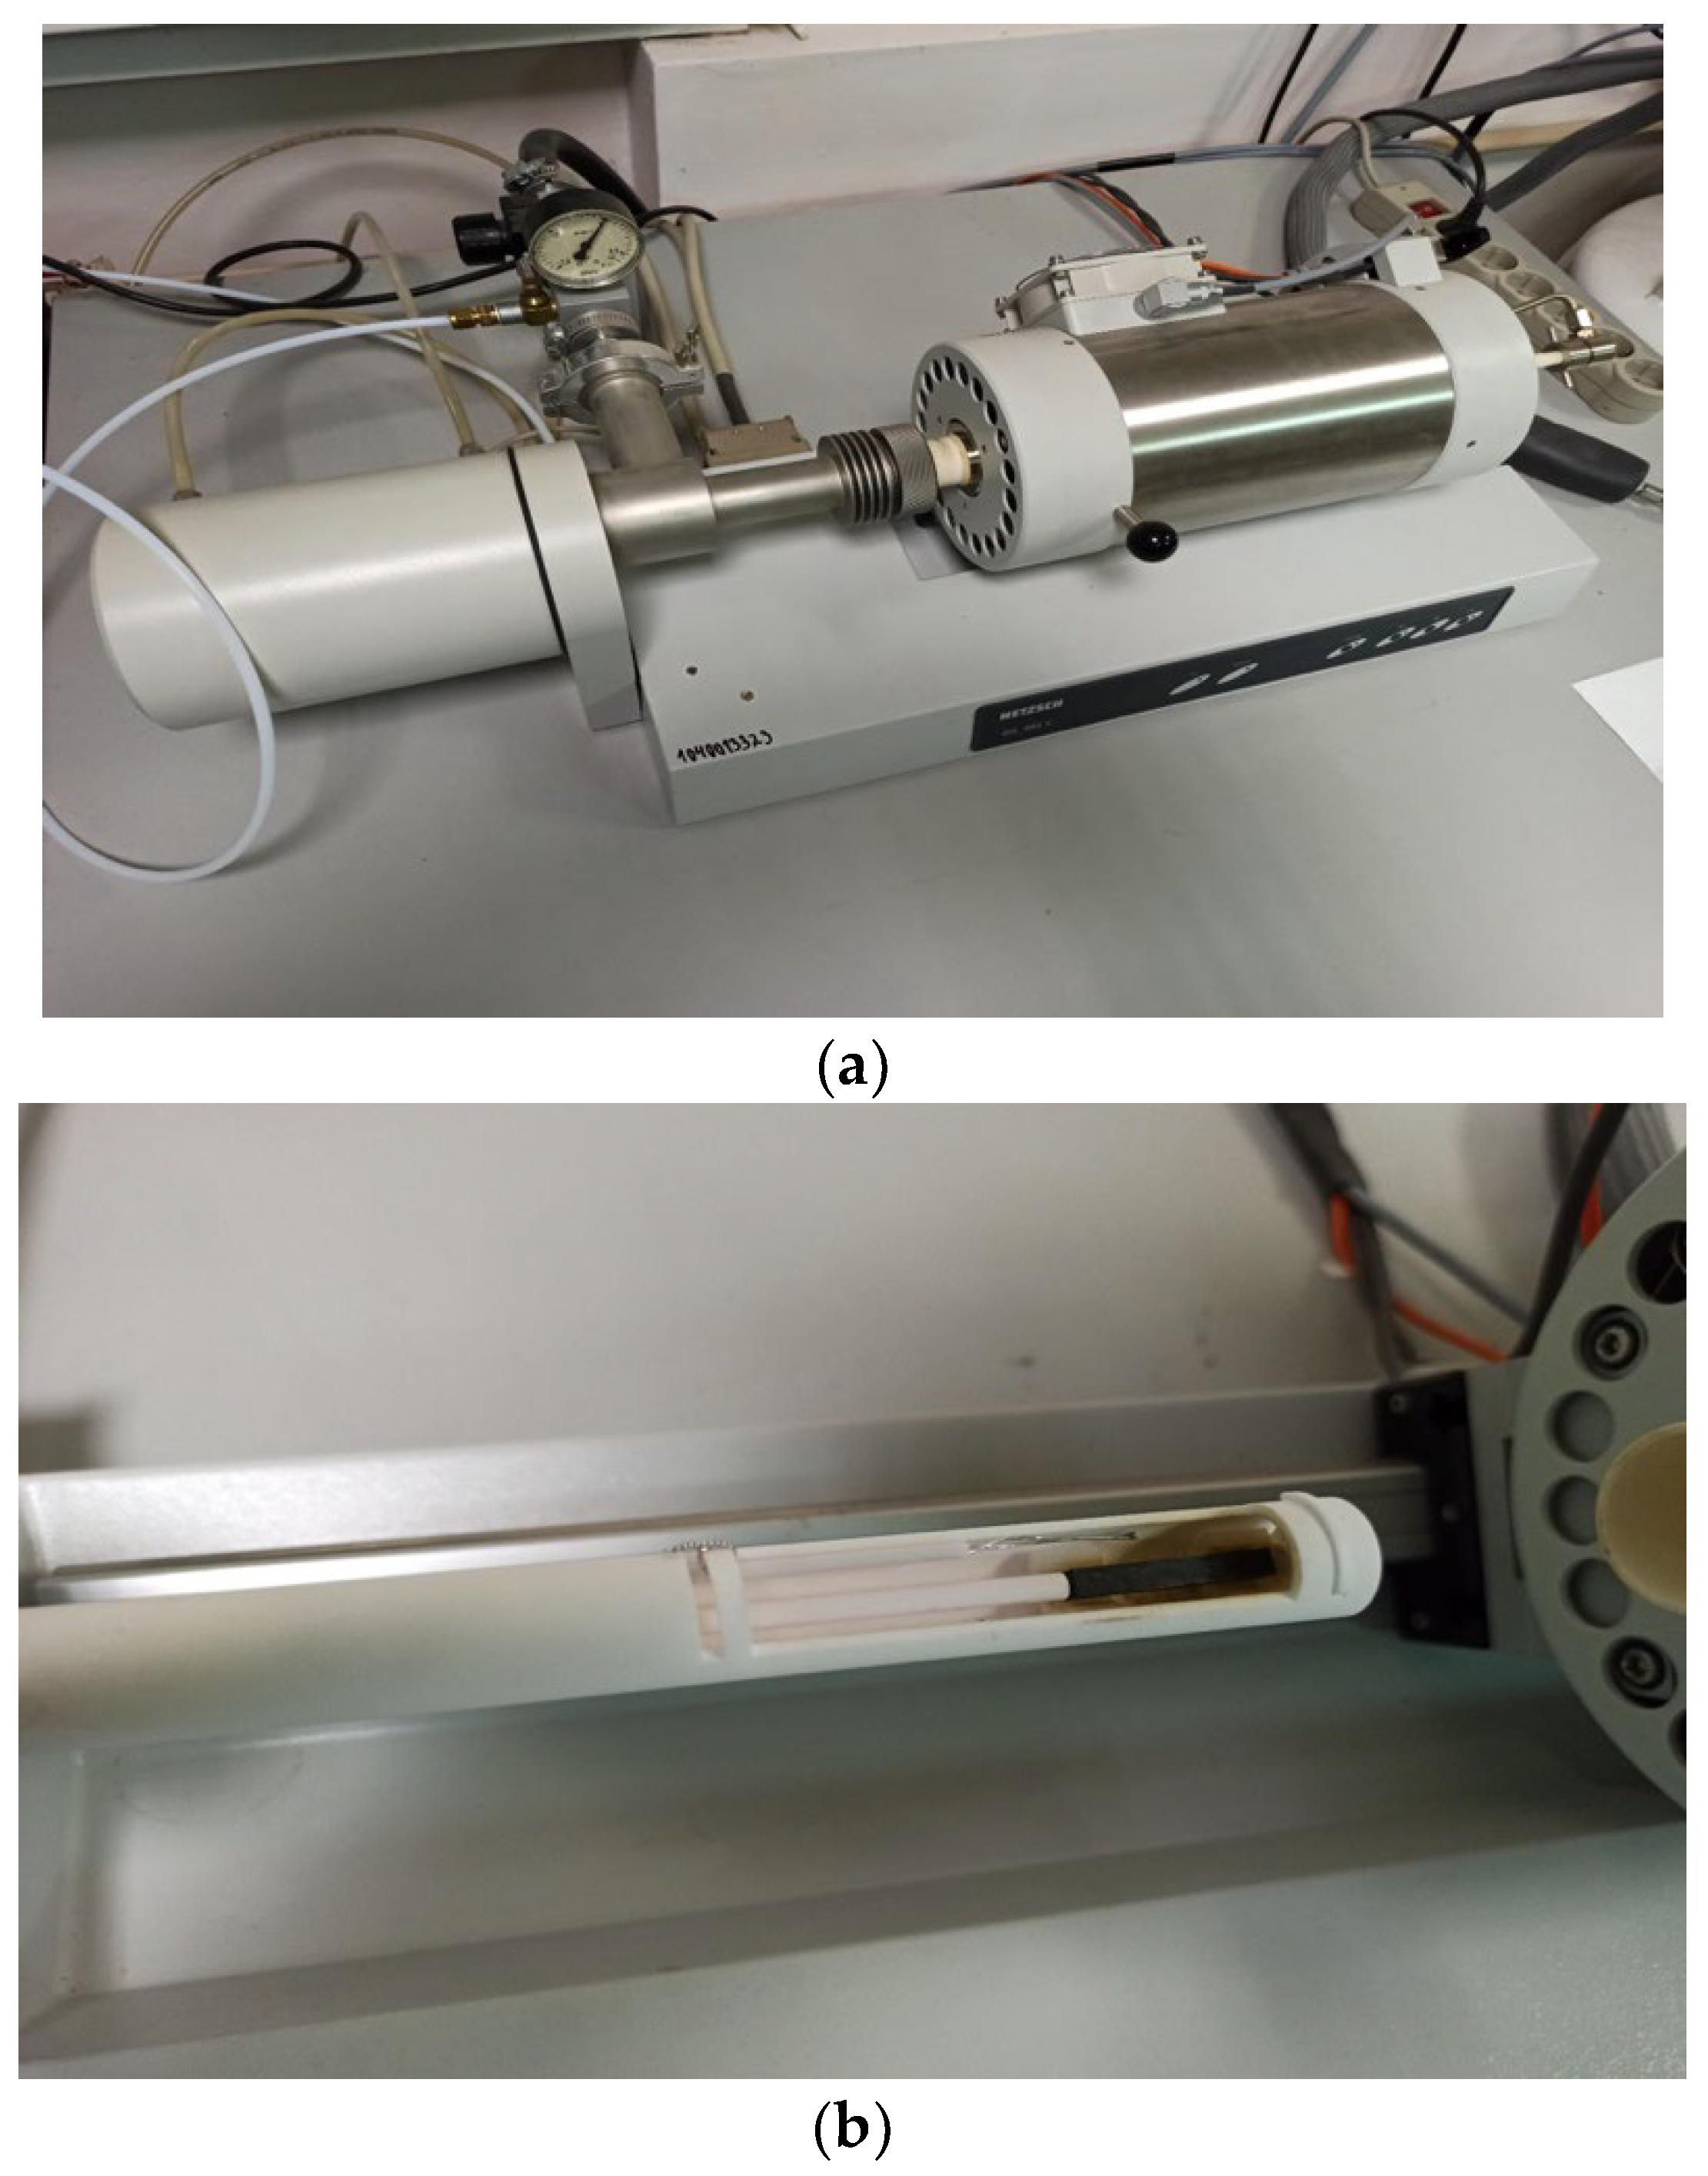
Dilatometric investigation of polymer and FRP samples were made with dilatometer Netzsch DIL 402 C (
Figure 1) for CTE of solid materials determination analogically to previous research [
28], but with absolutely new samples, that provided the elasticity and TE testing from the same series’ samples.
Netzsch DIL 402 C technical characteristics:
- -
Temperature range: 20–1500°C
- -
Colding and heating intensity: 0.01 °C /min – 50 K/min (5 К/min in experiment)
- -
Etalon: Al2O3
- -
Linear range: 500 mcm
- -
Sample length: max. 28 mm
- -
Sample diameter: max. 12 mm
- -
Expanding Δl accuracy: 0.125 nm
- -
Atmosphere: inertial dynamic argon with gas flowing controller
At
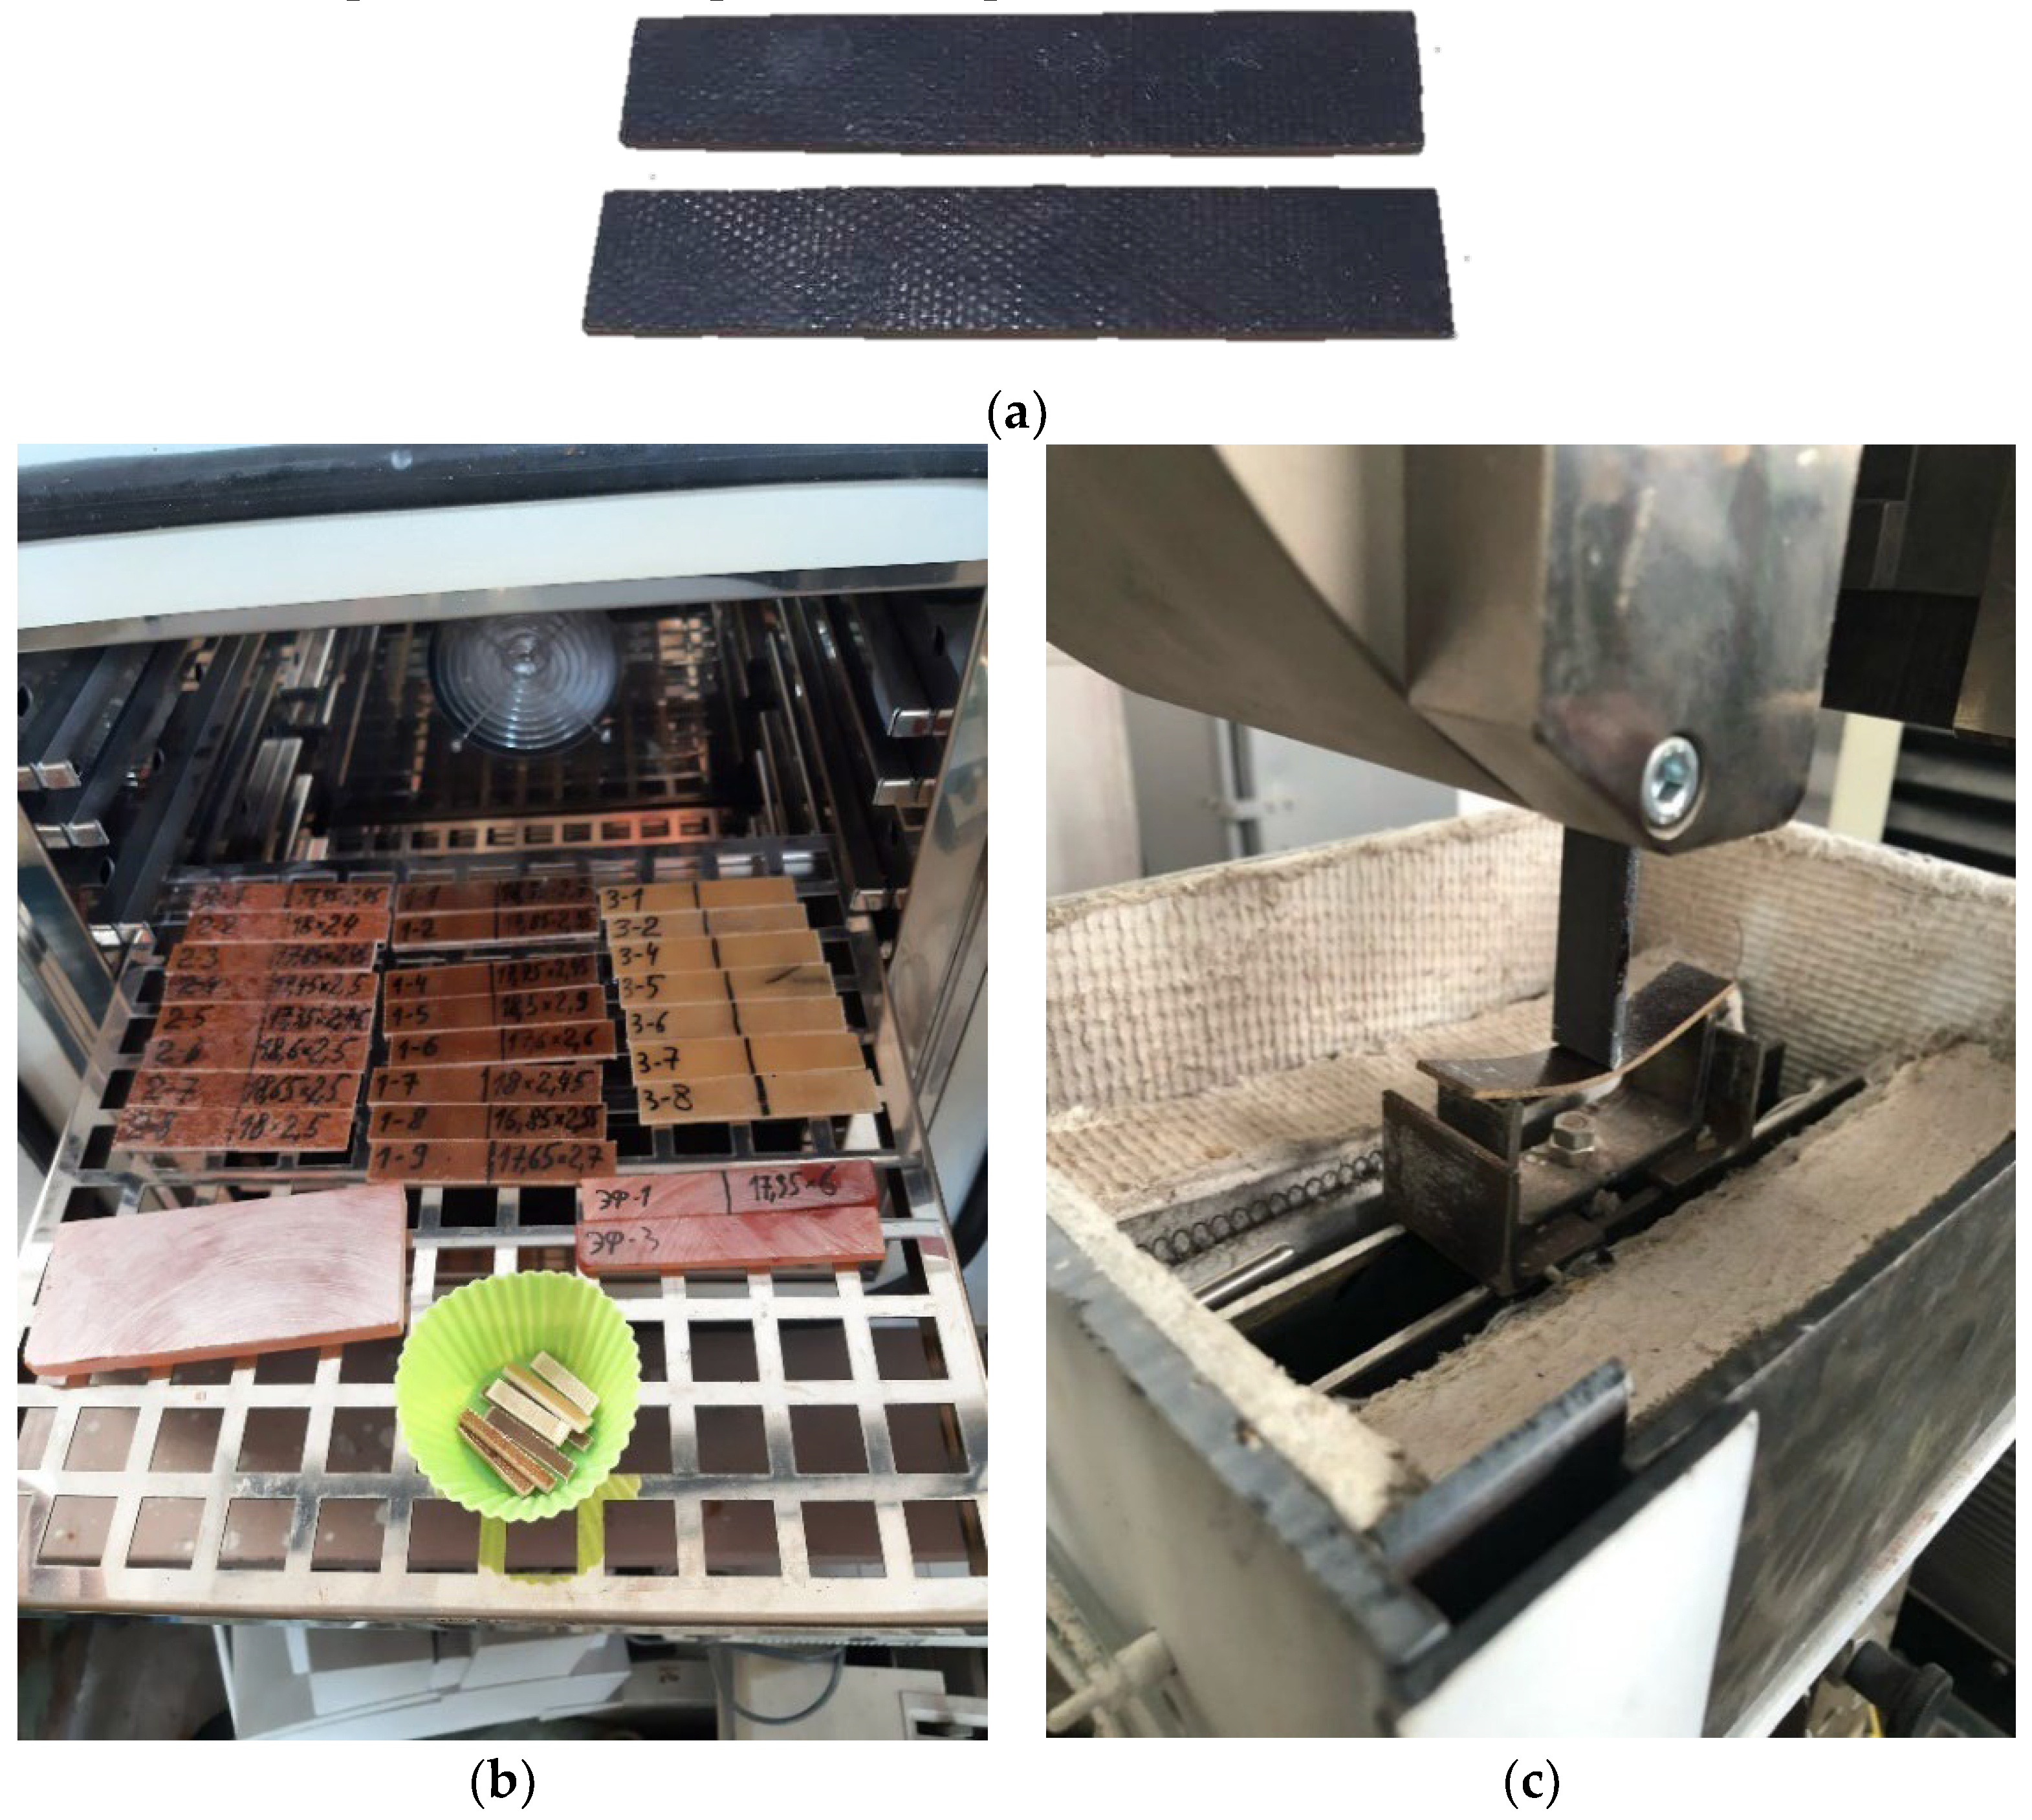
Figure 2 the samples’ installation in dilatometer’s camera is shown. After the installation, the heating and thermal deformations of samples were controlled resulting in “temperature-relative deformation” curves, presented in experimental part.
2.2.3. Investigation of Elasticity Modulus Under Heating
Polymer samples were tested for three-point bending on a Tinius Olsen h100ku test machine (Switzerland) in a specially made small-sized chamber that provides heating and maintains the temperature up to 300 °C. Three-point bending tests were carried out according to GOST R 56810-2015 [
18]. According to the passport data, the load measurement accuracy of the Tinius Olsen h100ku machine is ± 0,5% in the range from 0,2 to 100% of the allowable load of the installed force sensor (100 kN). The crosshead has a resolution of 0.001 mm with an accuracy of 0.01 mm. To eliminate the influence of machine stickiness, the displacement of the specimen center point under load was also controlled by a mechanical watch type indicator mounted under the specimen. The difference in displacement readings on the crosshead and the dial indicator did not exceed 2%. The specimens were tested at a span of 70 mm (
Figure 2).
3. Results
3.1. Experiment Results
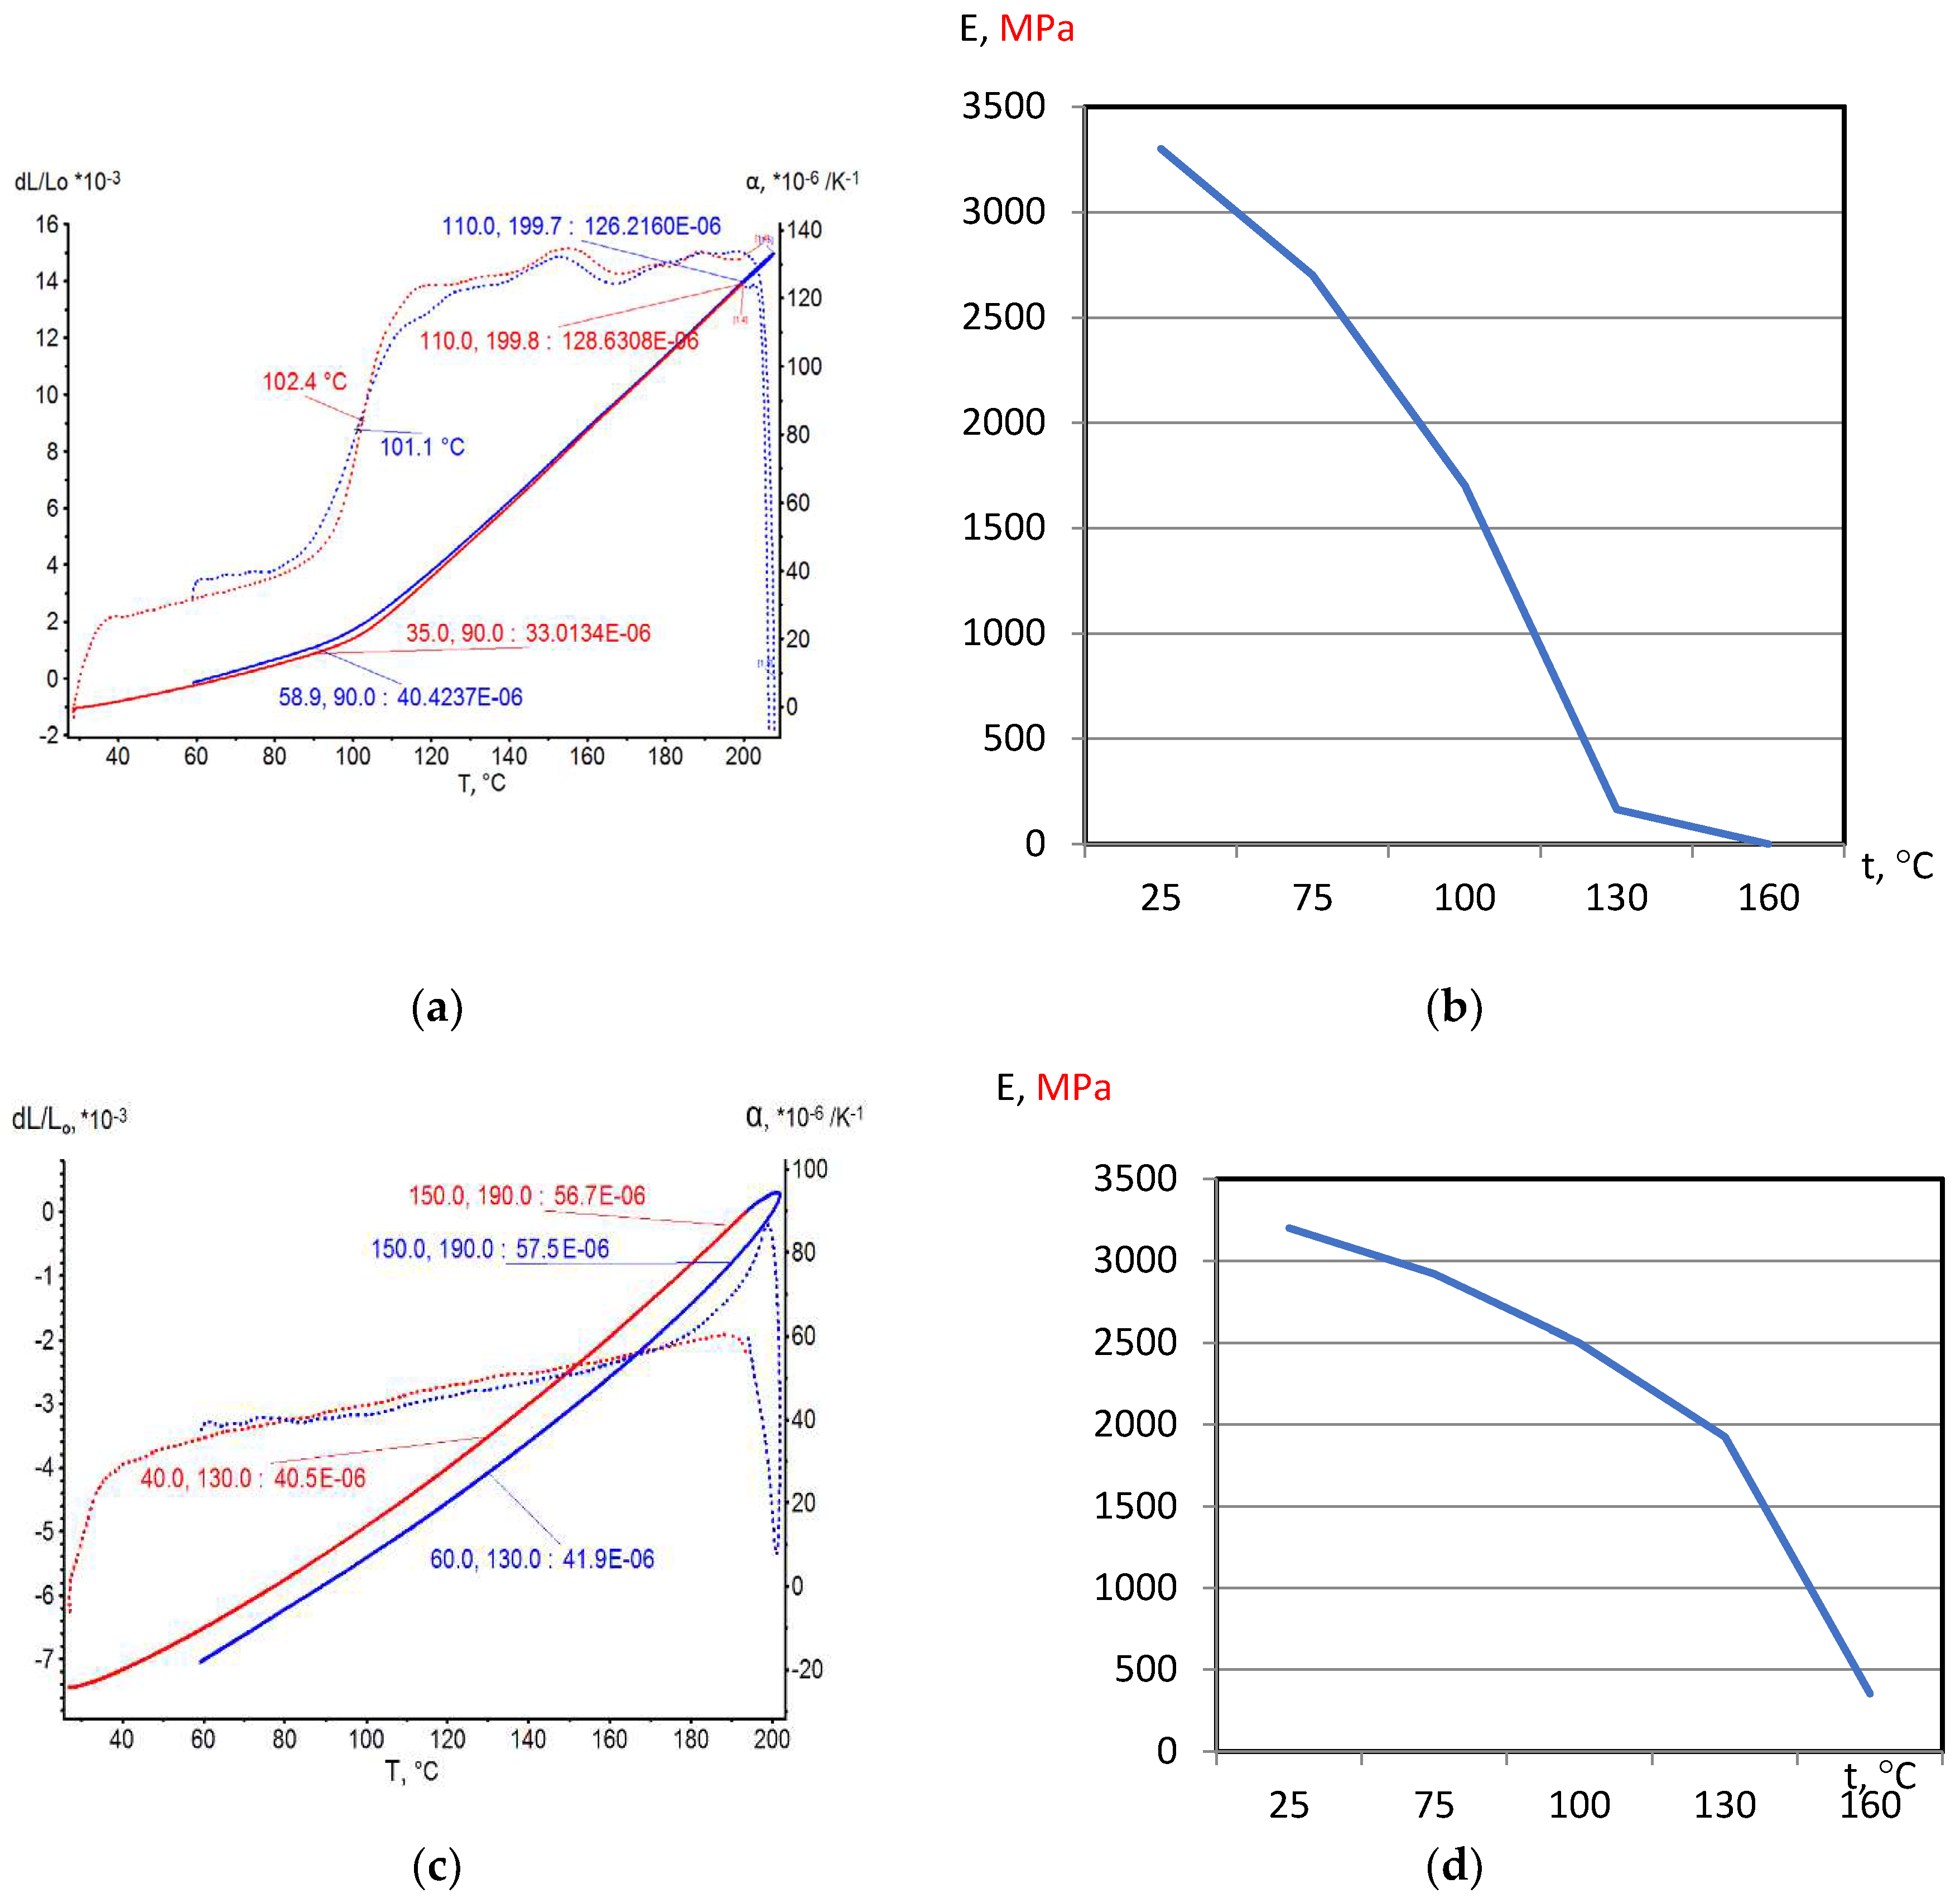
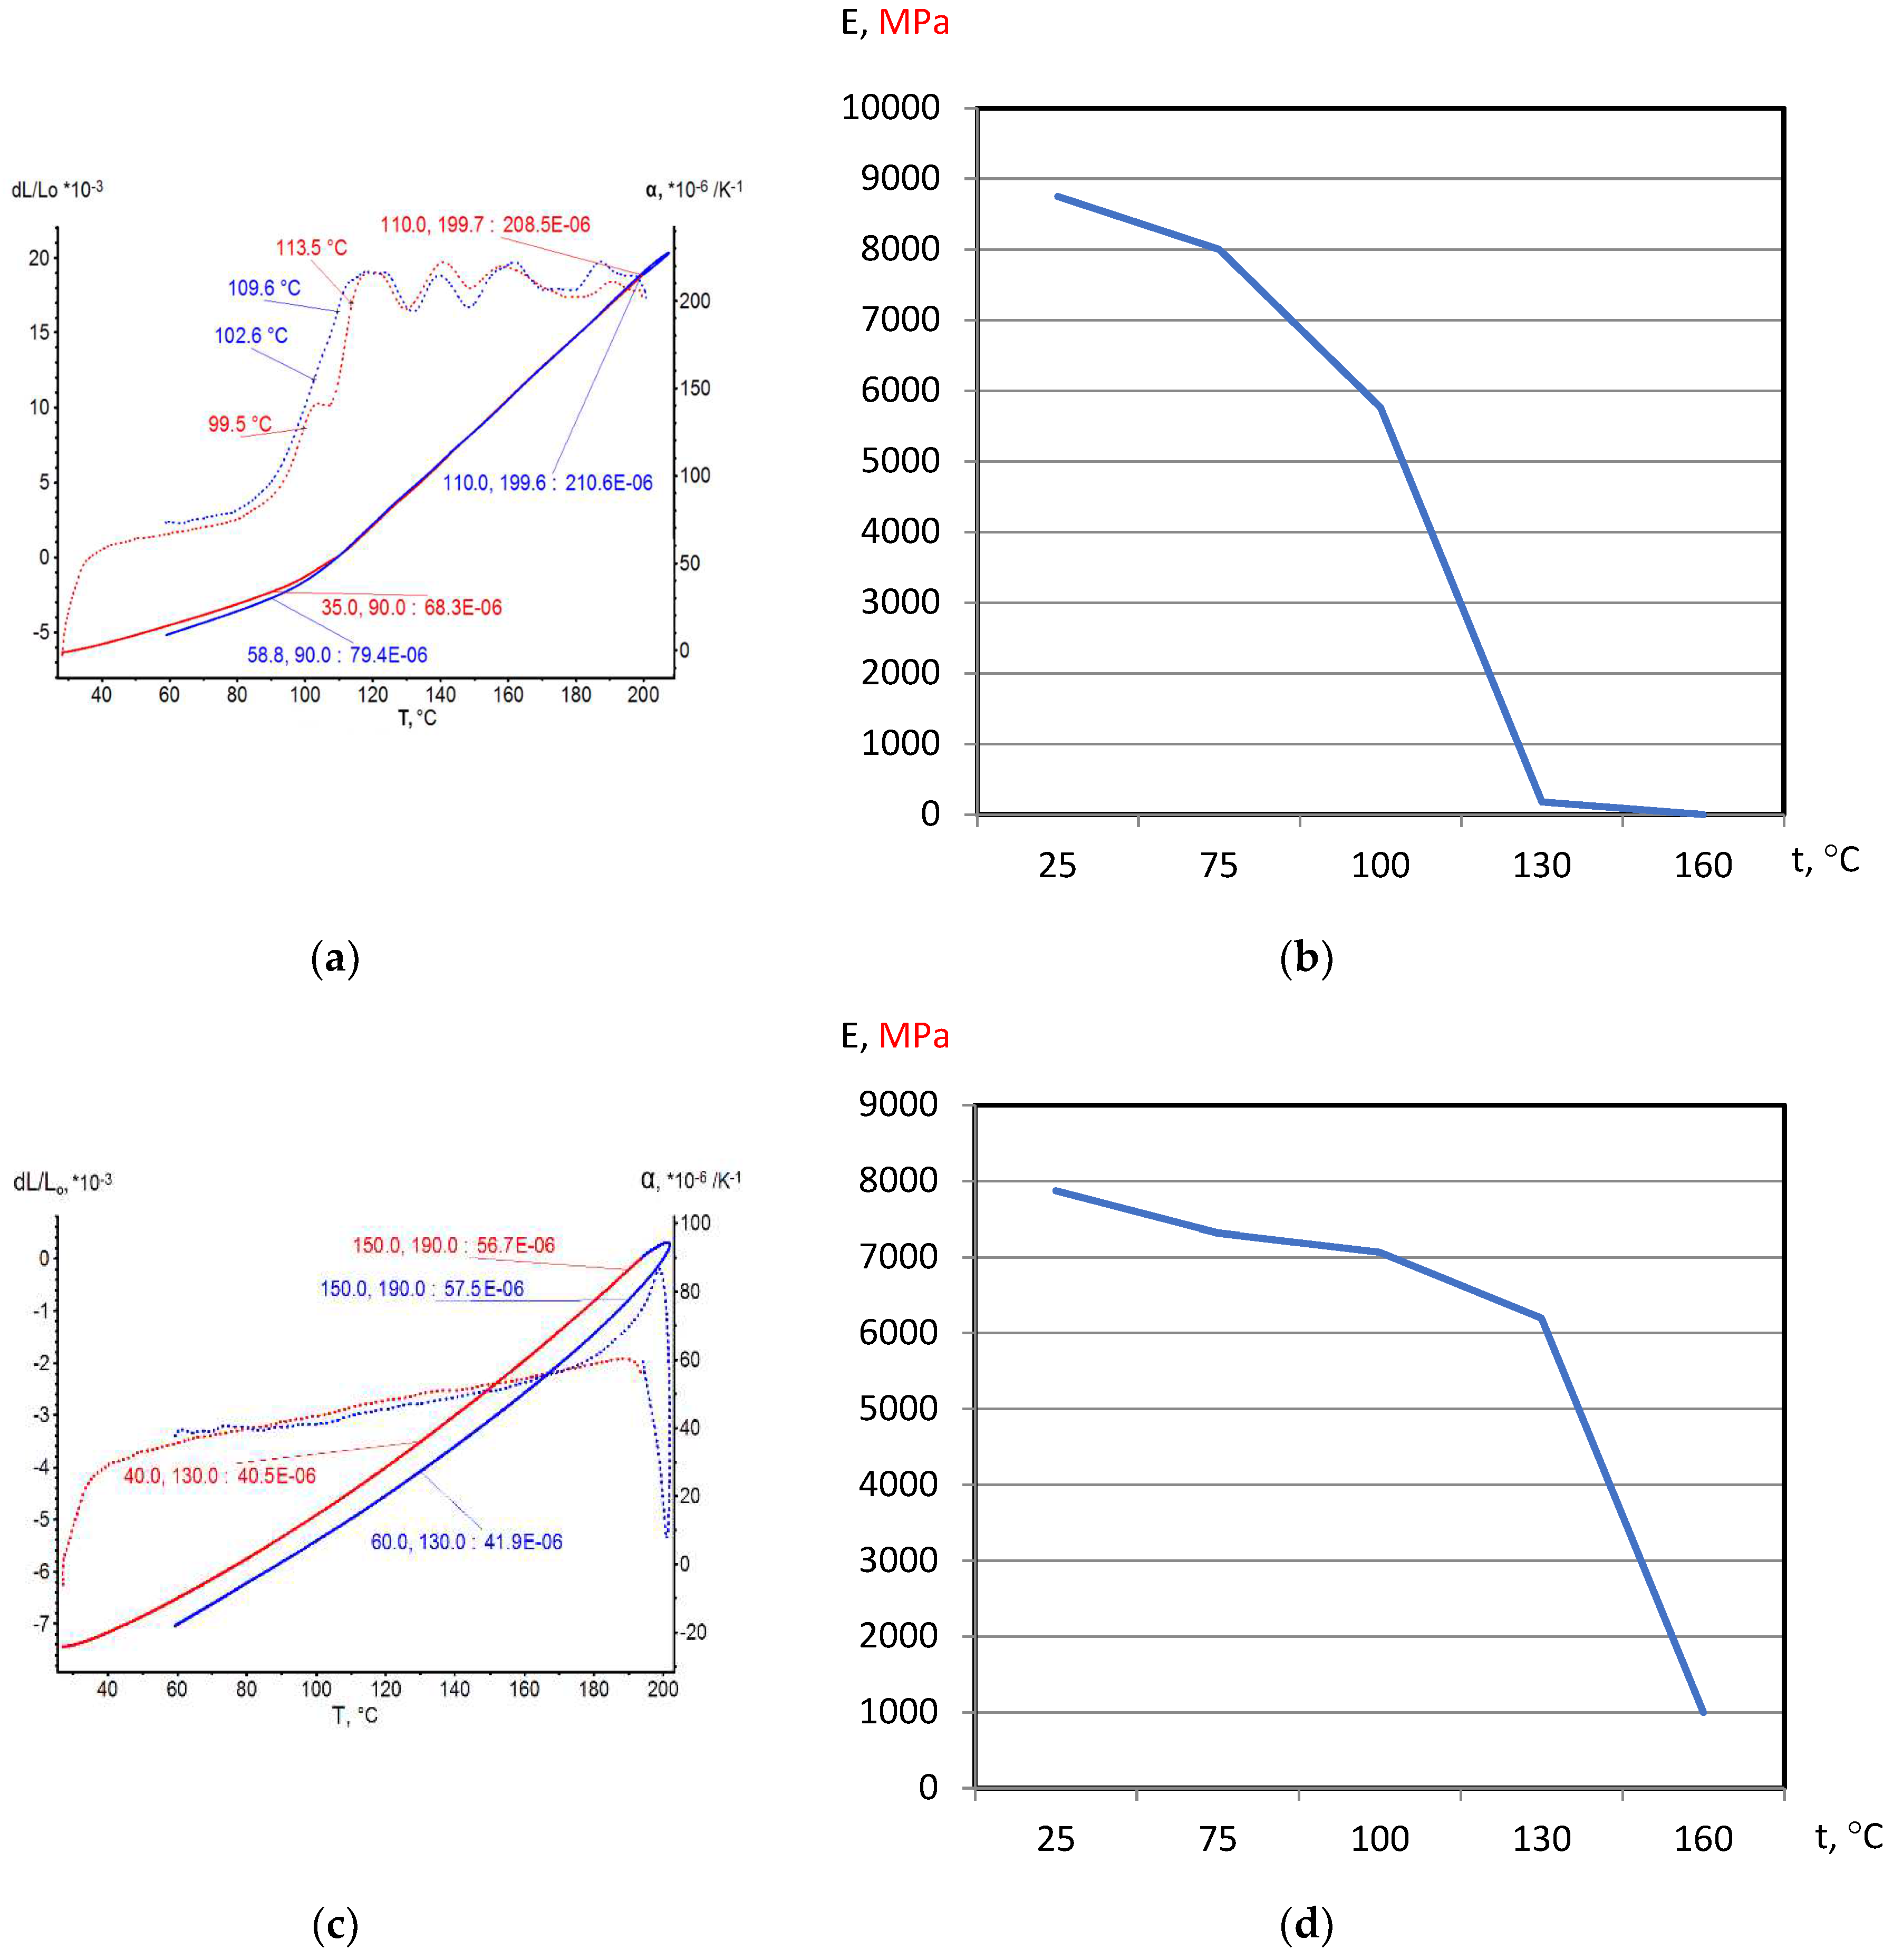
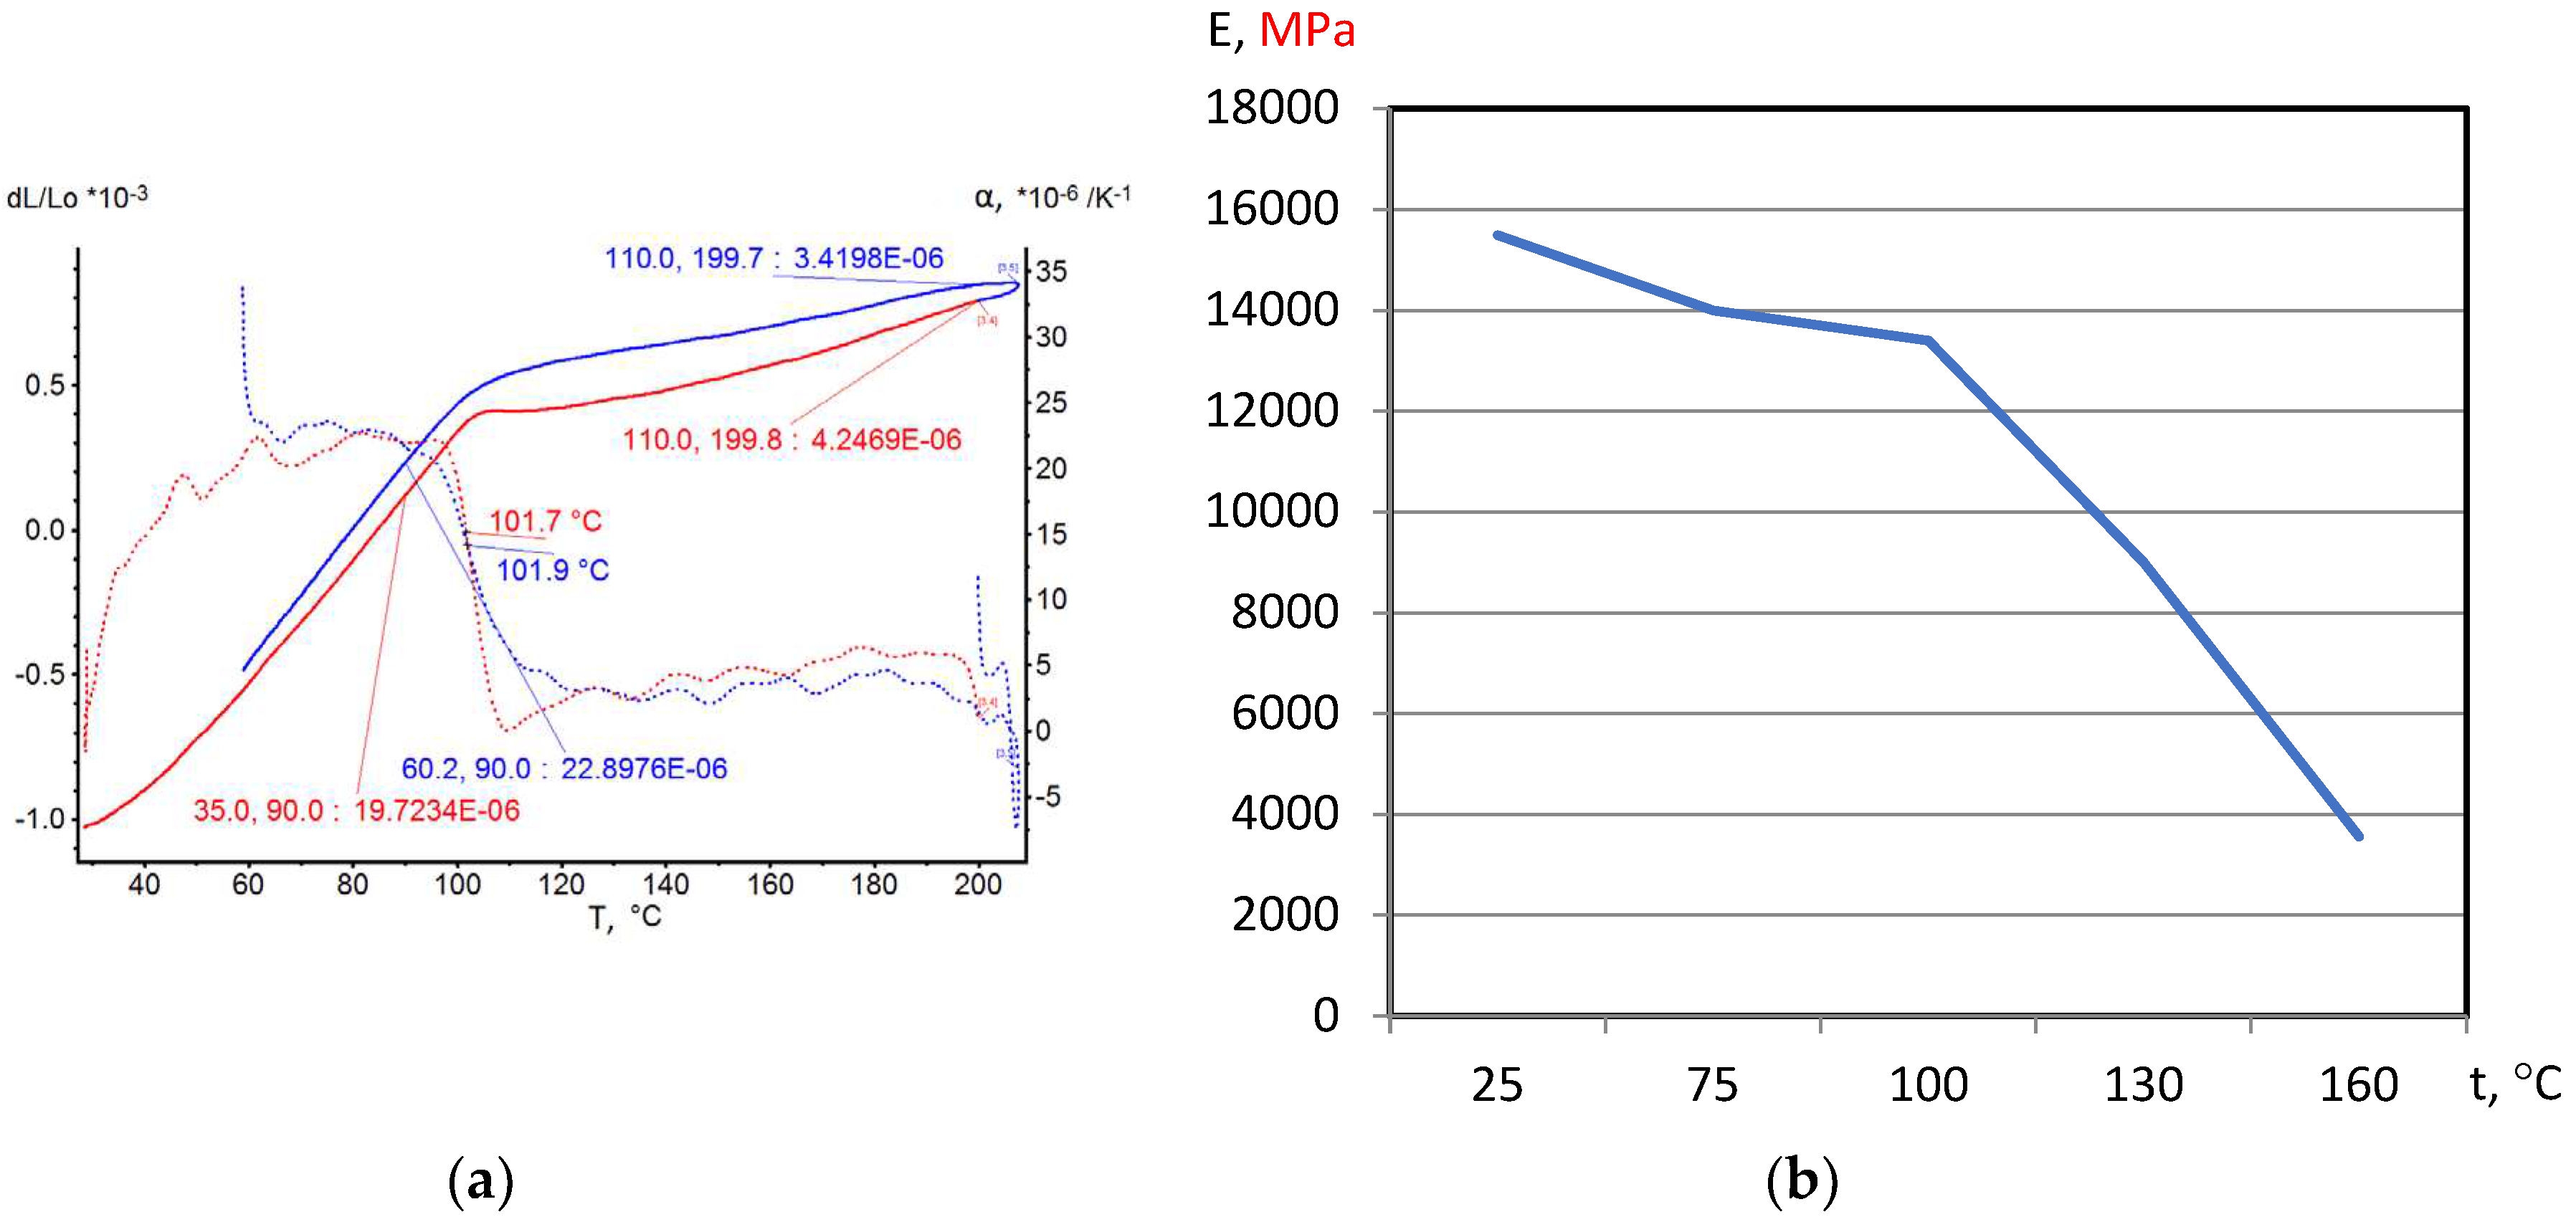
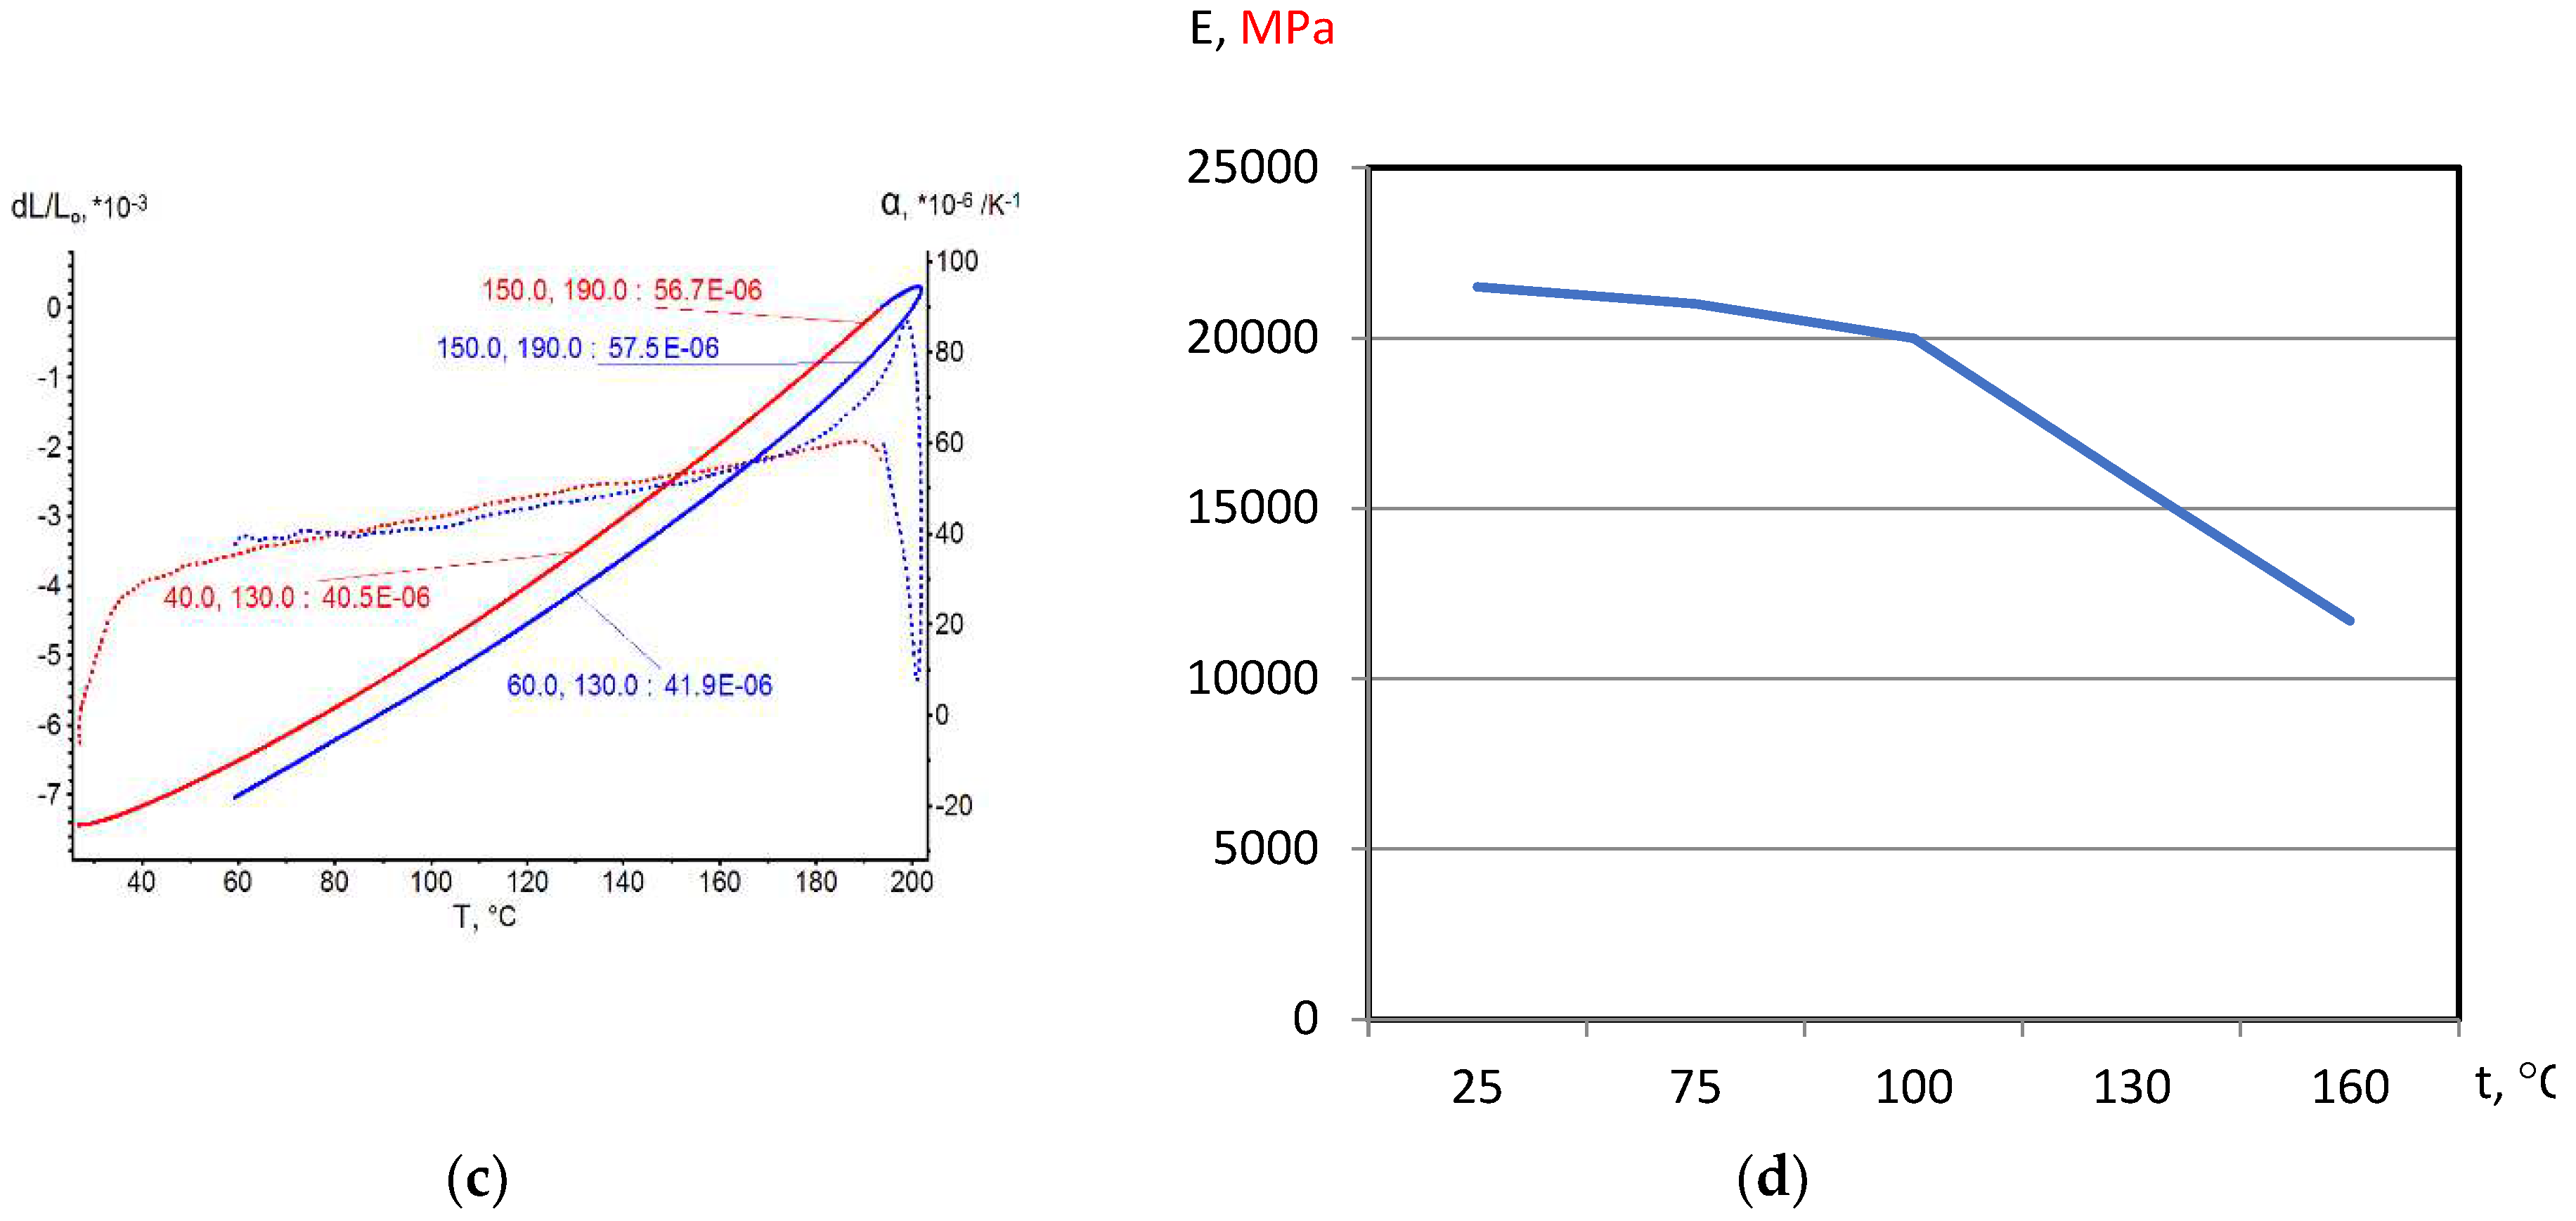
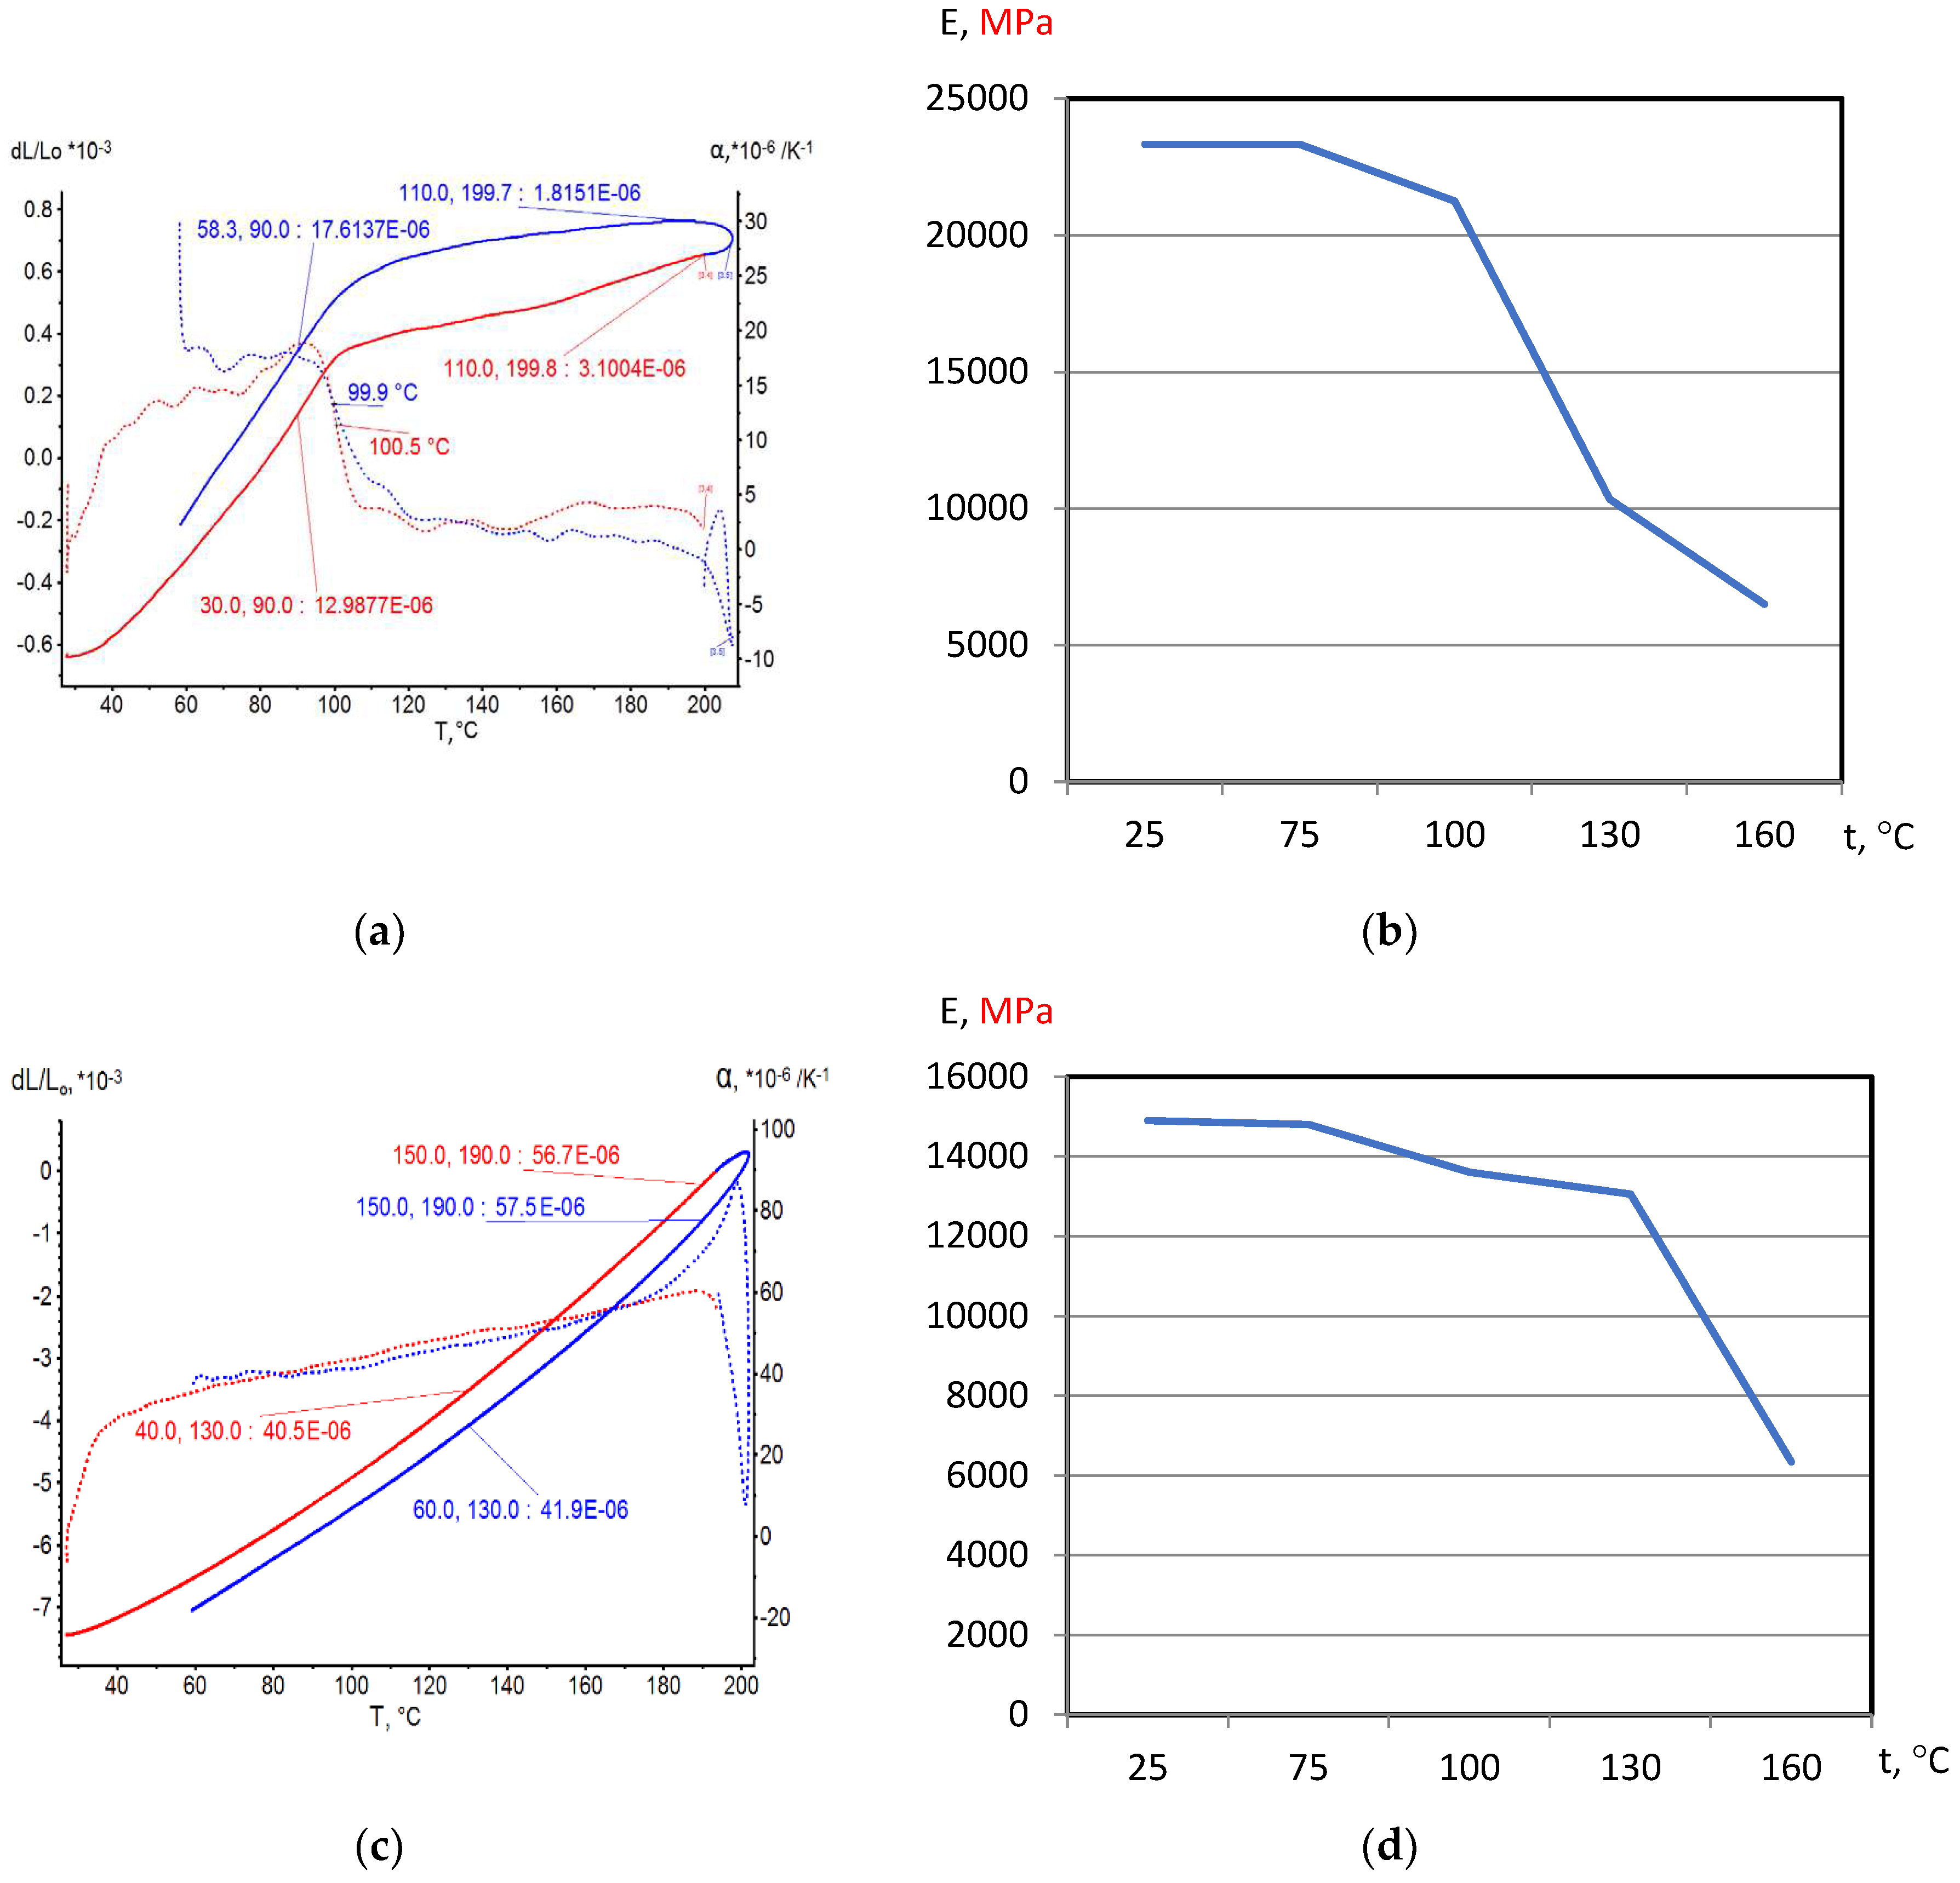
On the base of dilatometric and MoE under heating testing of the glassed thermosetting polymers, filled composites and FRP samples the thermal expanding and MoE curves depending on heating temperature (to 200
0С) were figured, and examples were presented at
Figure 3,
Figure 4,
Figure 5 and
Figure 6. Examples include the clear epoxy (EP), filled epoxy composite (EP+FA), FRP (EP+T23), and filled epoxy FRP variants (EP+T23+FA) before and after thermo-relaxation (TR). Testing of MoE and CTe included only new samples of one series for experiment clearance and modelling of MoE-CTe relation adequateness providing.
These results repeated and confirmed previous researches [
27,
28] and basic conclusions:
The polymers’ glassing temperature Tg can be determined using dilatation method by breaking point of thermal expansion (TE) where non-linear TE, with increasing CTE, becomes linear with constant CTE.
Under heating, after Tg, polymers and filled polymers loses their elasticity absolutely. Thermo-relaxed polymers, filled polymers and FRPs, after Tg, lose elasticity sharply but can keep it depending on conditions until relatively high temperatures (160…2000C).
Long heat treatment (thermo-relaxation TR) significantly changes all properties of polymers and polymer composites: Tg grows to 30…40%, TE decreases, temperature of coworking of components in composites and their elasticity keeps growing in several times.
TE curves have inversive character in relation with MoE under heating curves.
3.2. Supramolecular Relaxation Model of CTE-MoE Relation of Thermosetting Polymers and FRPs
Previous researches proved the prediction compensational TE model of thermosetting polymers as adequate [
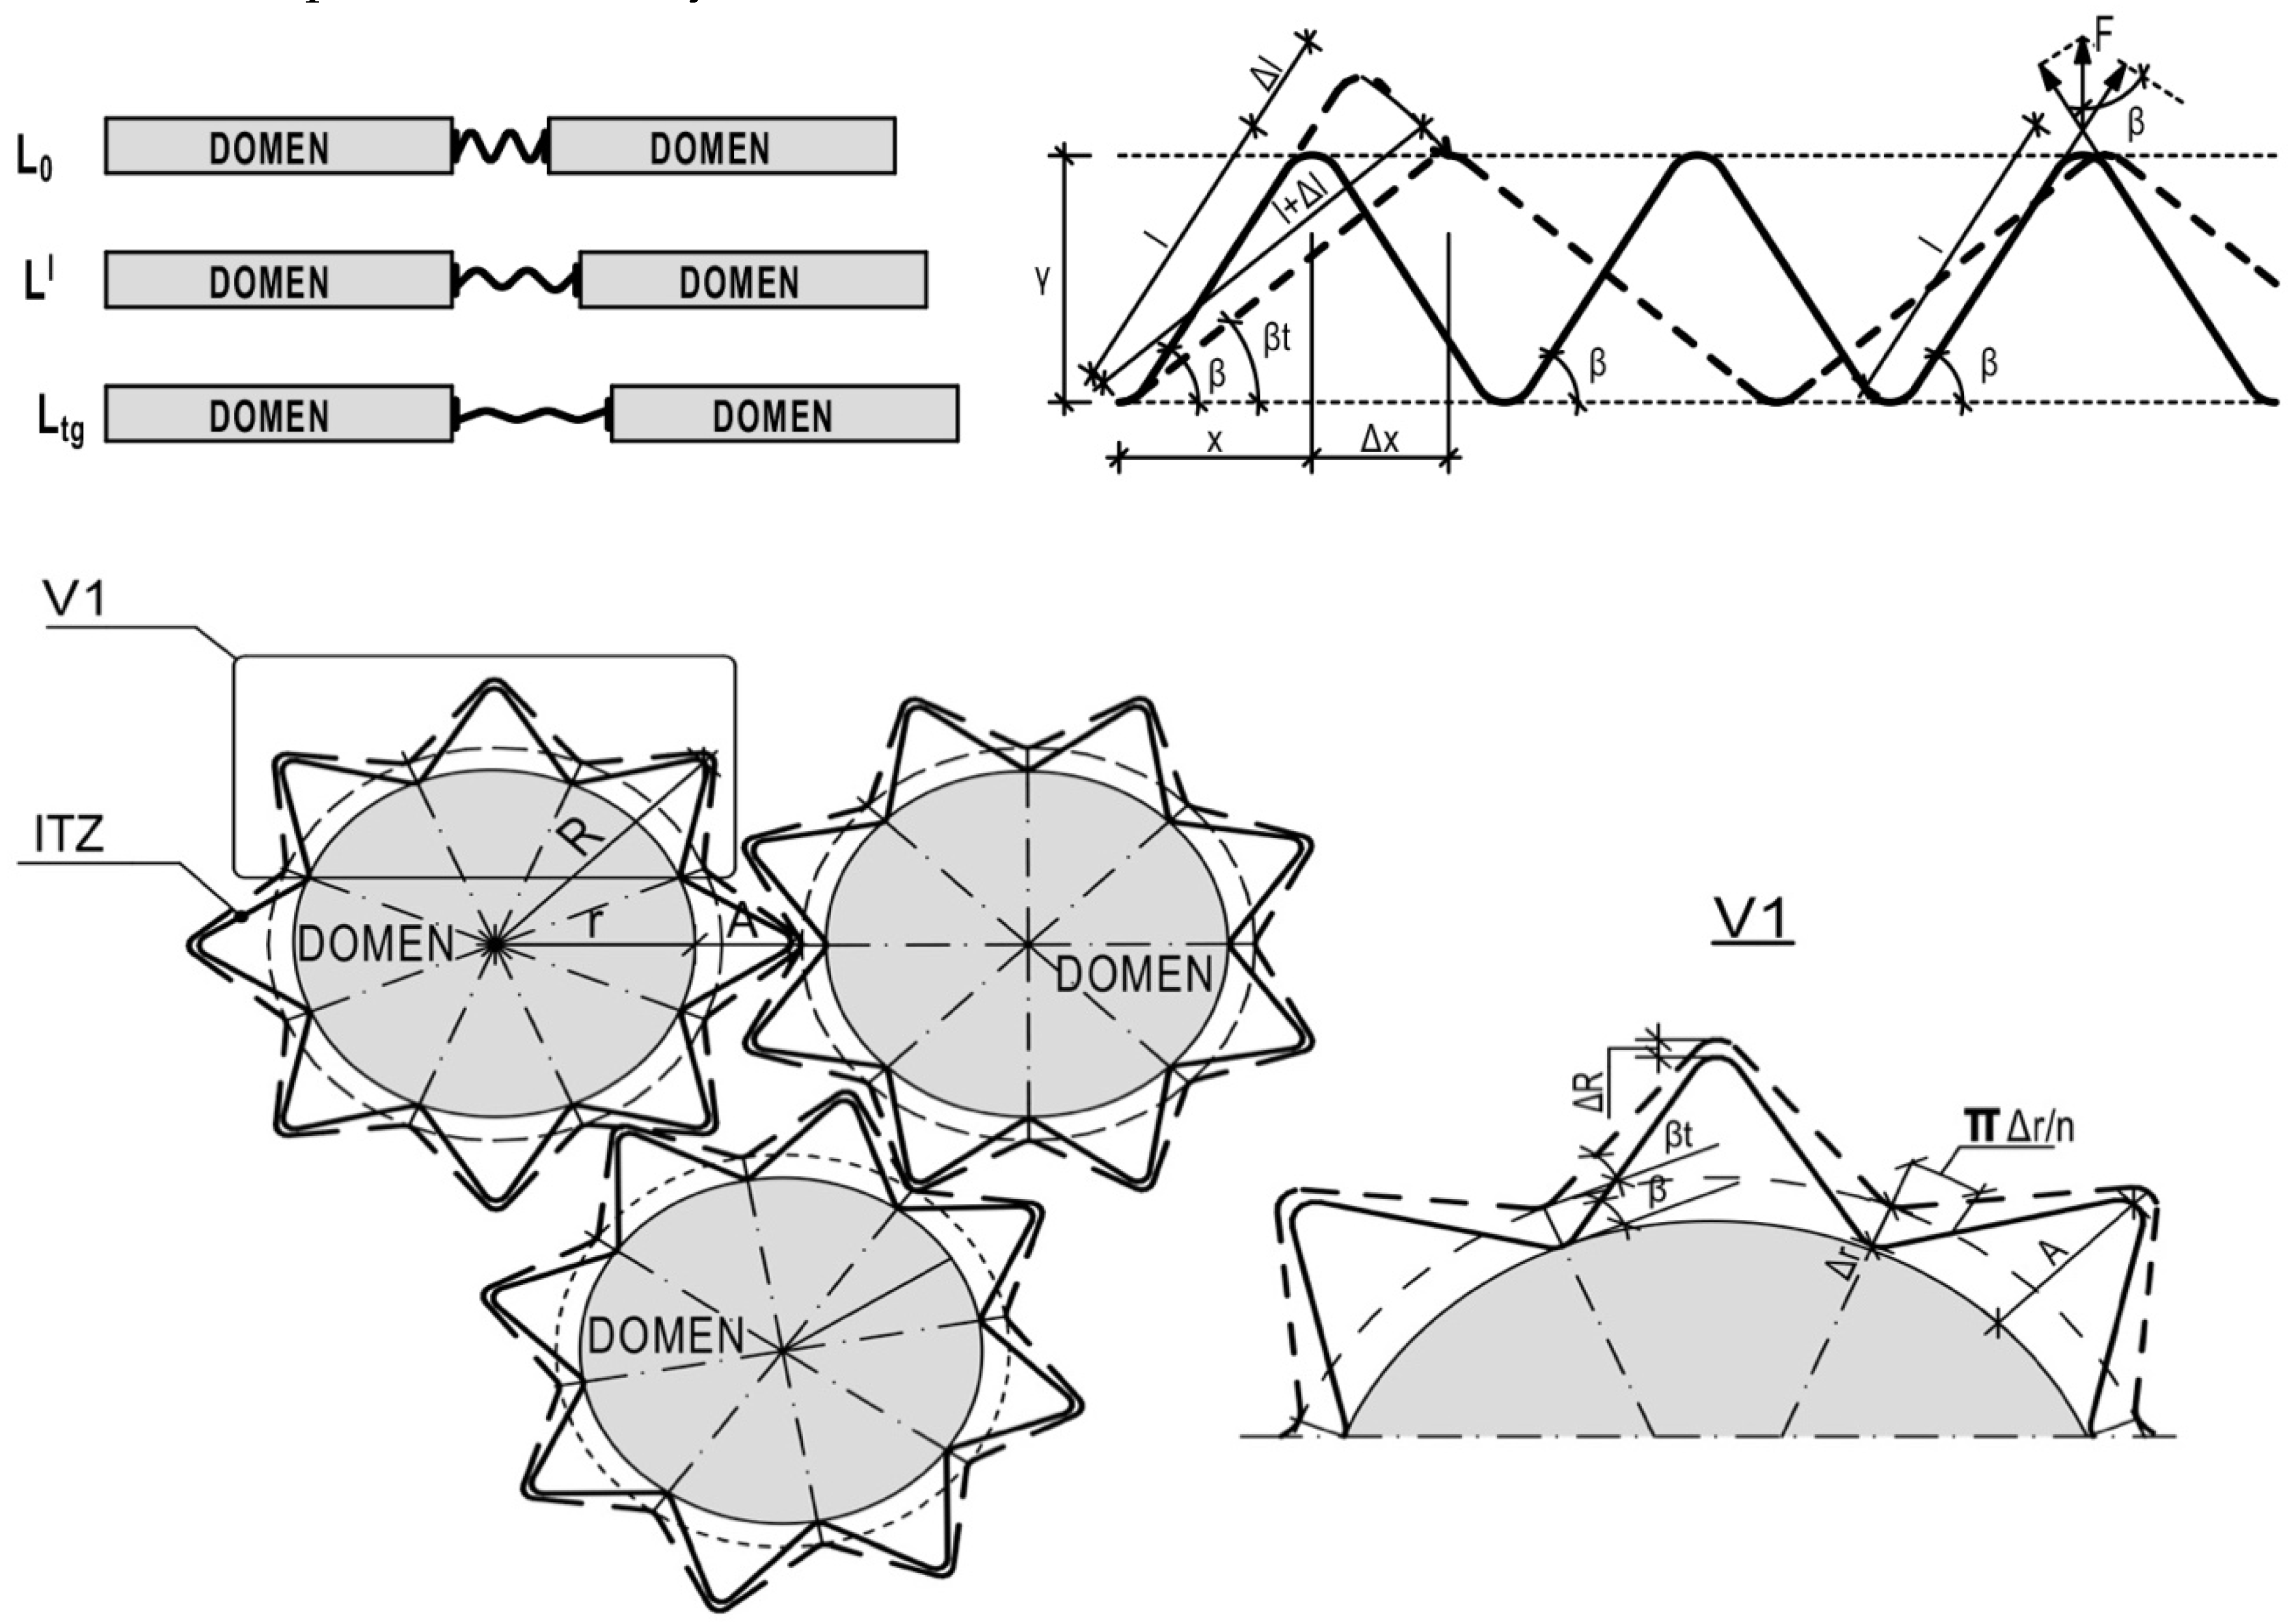
28]. The main specify of compensational model is that in two-phase structure rigid elements (domains) with linear TE divided by softer element (ITZ as polymer macromolecules’ spiral shell) with plasticity bonds and non-linear TE. The Tg is the extremum of TE non-linear function. Structure model is presented as a pack of spherulitic domains with spiral shell of ITZ (
Figure 7). All deformations of domains influence the according deformations of the shell. But domain’s expansion by the Y ace influence by the same ace shell’s compression and shell’s tensile by the X ace. The maximum expansibility is constant because of the spiral geometry: it’s maximum expansibility by Y with compressibility by X. It’s discovering the compensational mechanism of TE and TE non-linear increasing under heating. Using this specify the following hypothesis appeared: polymer’s spiral shell’s tensile by X lead to stress relaxation by Y due to growing of cross-section and redistribution of tensile forces in spiral branches by aces X and Y.
Structural model (
Figure 7) proposed in previous study [
28] was modified by tensile forces
in polymer molecules’ branch distribution by angle
.
Following author’s math model is developing from MoE under definite heating temperature function
is the stress in the spiral branch;
is the structure’s relative tensile strain/deformation under stress.
The following equations are author’s development.
Under tensile stress spiral’s relative tensile strain/deformation
is equal to the spiral’s branch’s relative deformation
is the length of spiral polymer molecule’s branch (Figure 8, top scheme);
is the expansion of spiral polymer molecule’s branch (Figure 8, top scheme);
is the angle of slope of spiral polymer molecule’s branch (Figure 8, top scheme);
and MoE under heating decreasing is related with tensile stress relaxation and redistribution in tensile and shift stresses: the more heating and X-tensile and Y-compression, the less Y-tensile and more X-shift stresses
Tensile stress under definite temperature is the relation between tensile force in spiral branch (
) and total square (
) of cross section under the temperature
is the angle of slope of spiral polymer molecule’s branch under heating (Figure 8, the bottom).
So, the MoE under temperature depends on MoE under normal temperature (
) by the following model:
Using the equation (12) from previous CTE modelling by compensational model [
28]
–CTE under definite temperature;
–CTE under glassing temperature Tg.
So, the constant of MoE-CTE relation is the basic normal temperature polymer ITZ shell’s MoE
For polymers under normal temperature 20
0C
That is the searching function MoE=f(CTE) and relaxation model of MoE-CTE relation. Further investigation was devoted to the approbation of Barker’s and author’s relaxation models.
3.3. Testing of relations’ MoE-CTE models
The TE and MoE data processing included determination of CTE (
) and MoE (
) values under the same character temperatures by
Figure 4,
Figure 5,
Figure 6 and
Figure 7. After that the calculations by Barker’s (1) and author’s relaxation (9) models were made. To value accuracy of models, the variation coefficient
for every composition was determined by
– average arithmetical;
is average square variation.
Table 2.
Results of calculation of MoE-CTE relation models’ parameters and accuracies.
Table 2.
Results of calculation of MoE-CTE relation models’ parameters and accuracies.
| Composition |
Parameter/Function |
T, 0C |
|
Average |
Cv, % |
| 20 |
75 |
100 |
130 |
160 |
|
| EP |
, MPa |
3300 |
2700 |
1700 |
164 |
0 |
- |
- |
- |
|
, K-1, 106
|
21,0 |
26,0 |
38,0 |
57,0 |
125,9 |
128,0 |
- |
- |
|
, MPa.K2
|
1455300 |
1825200 |
2454800 |
532836 |
0 |
- |
1911767 |
37 |
|
, MPa |
3948 |
3388 |
2418 |
167 |
0 |
- |
3251 |
34 |
| EP/TR |
, MPa |
3200 |
2920 |
2500 |
1924 |
354 |
- |
- |
- |
|
, K-1, 106
|
36,0 |
40,0 |
42,6 |
50,4 |
54,0 |
79,3 |
- |
- |
|
, MPa.K2
|
4147200 |
4672000 |
4536900 |
4887267 |
1032264 |
- |
4560841 |
12 |
|
, MPa |
5861 |
5892 |
5402 |
5279 |
360 |
- |
5608 |
10 |
| EP+FA |
, MPa |
|
8000 |
5760 |
180 |
0 |
- |
- |
- |
|
, K-1, 106
|
|
60,0 |
73,0 |
100,0 |
125,9 |
208,0 |
- |
- |
|
, MPa.K2
|
|
28800000 |
30695040 |
1800000 |
0 |
- |
28654597 |
10 |
|
, MPa |
|
11243 |
8875 |
347 |
0 |
- |
10671 |
21 |
| EP+FA/TR |
, MPa |
|
|
7070 |
6200 |
1000 |
- |
- |
- |
|
, K-1, 106
|
|
|
60,0 |
63,8 |
70,0 |
110,0 |
- |
- |
|
, MPa.K2
|
|
|
25452000 |
25236728 |
4900000 |
- |
22927212 |
22 |
|
, MPa |
|
|
15554 |
14762 |
1009 |
- |
14781 |
6 |
| EP+T23 |
, MPa |
|
|
|
9000 |
3560 |
- |
- |
- |
|
, K-1, 106
|
|
|
|
10,2 |
8,30 |
22,0 |
- |
- |
|
, MPa.K2
|
|
|
|
936360 |
245248 |
- |
1778917 |
22 |
|
, MPa |
|
|
|
16780 |
3562 |
- |
29143 |
8 |
| EP+T23/TR |
, MPa |
|
|
|
|
11700 |
- |
- |
- |
|
, K-1, 106
|
|
|
|
|
13,3 |
19,4 |
- |
- |
|
, MPa.K2
|
|
|
|
|
2069613 |
- |
2482331 |
38 |
|
, MPa |
|
|
|
|
11707 |
- |
48160 |
23 |
| EP+T23+FA |
, MPa |
|
|
|
|
|
- |
- |
- |
|
, K-1, 106
|
|
|
|
|
|
22,9 |
- |
- |
|
, MPa.K2
|
|
|
|
|
|
- |
6533283 |
11 |
|
, MPa |
|
|
|
|
|
- |
89097 |
17 |
| EP+T23+FA/TR |
, MPa |
14900 |
14800 |
13600 |
13050 |
6350 |
- |
- |
- |
|
, K-1, 106
|
5,5 |
5,8 |
6,9 |
8,0 |
7,0 |
11,6 |
- |
- |
|
, MPa.K2
|
450725 |
497872 |
647496 |
835200 |
311150 |
- |
607823 |
49 |
|
, MPa |
28334 |
29600 |
33566 |
42050 |
6353 |
- |
33388 |
32 |
Finally, the average was calculated for each model. In calculation of variation characteristics only parameters of compositions before Tg were included, because of rigid changing of dependences character after Tg.
The results of parameters and functions calculation are presented in
Table 2. On the base of these results made following conclusions.
MoE-CTE relation’s models of definite composition under heating can be considered as applicable and adequate under conditions. Every MoE-CTE relation’s model doesn’t have universality. Constant of model depends on composition type.
Reinforcing and thermo-relaxation of the polymers result in increasing of MoE under heating. The less is MoE under heating of unfilled polymer and extreme temperature of elasticity keeping is 1000C and 1300C after TR, the more are MoE under heating of filled polymers, and the most is MoE under heating of FRPs and filled FRPs with elasticity keeping under 1800C and more. And they have MoE-CTE relation’s model constant, but constants are different for each composition that points to significant differences in supramolecular structures of compositions.
The author’s model constant is growing accordingly with total tendency of MoE under heating. It is always more than fact MoE of composition and it can be suggested to present this constant as ideal MoE of composition under extreme density of its supramolecular structure.
The average
for different models and compositions are presented in
Table 3.
The average results lead to the conclusion that Barker’s model is adequate only for polymers and filled polymers, author’s relaxation model has most accuracy and applicable to polymers and composites overall.
4. Conclusions
The dilatometric and MoE tests under heating of thermosetting polymers, filled polymers and FRPs were made after normal thermosetting and prolonged thermo-relaxation. On the base of CTE and MoE parameters the supramolecular relaxation model of MoE-CTE relation was realized, and this author’s and Barker’s models were tested and compared.
The relaxation model has compensational mechanism, realized due to conglomerate two-phase structure of rigid domains and softer ITZ spiral shells with effect of thermal expansion compensation and tensile stress relaxation under heating. The math function MoE=f(CTE) is developed, constant of the relaxation model (9) is the basic MoE of polymer’s or polymer composite’s supramolecular structure in normal condition and maximum density of polymer molecules’ pack. Testing and calculation data (
Table 2) points that potential elasticity of polymers’ and polymer composites’ structure in 1,5…2 times more than real.
In the result of math analyze and calculation both models are not universal, even the thermo-relaxed polymers have other model constant than normally thermosetted, so as polymer composites. But both models are applicable for definite polymer or composition under heating, i.e., definite composition’s constant of model is not depending on temperature before Tg. The Barker’s model is applicable to homogeneous materials: to polymers in our case. The relaxation model has the same accuracy for polymers and polymer composites too, demonstrated wider range of application.
Finally, the relaxation model of MoE-CTE relation is done and may be applicated in operative values of thermal expansion by MoE parameters or vice versa for MoE prediction by parameters of thermal expansion in polymer composite structures design and thermal and thermo-mechanical stresses’ and deformations’ calculations.
Funding
The research was performed within the Ministry of Science and Higher Education of the Russian Federation state assignment FENU-2020-0019.
References
- Astashkin, V.M.; Mishnev, M.V. On the Development of the Manufacturing Technology of Fiberglass Cylindrical Shells of Gas Exhaust Trunks by Buildup Winding. Procedia Eng. 2016, 150, 1636–1642. [Google Scholar] [CrossRef]
- Bochicchio, V.A. FRP chimney liners for power plant flue gas desulfurization - A chimney supplier’s perspective. In Proceedings of the NACE - International Corrosion Conference Series, Houston, Texas, USA, 13–17 March 2011. [Google Scholar]
- Damatty, A.A.; Awad, A.S.; Vickery, B.J. Thermal analysis of FRP chimneys using consistent laminated shell element. Thin-Walled Struct. 2000, 37, 57–76. [Google Scholar] [CrossRef]
- García-Moreno, I.; Caminero M, Á.; Rodríguez, G.P.; López-Cela, J.J. Effect of thermal ageing on the impact and flexural damage behaviour of carbon fibre-reinforced epoxy laminates. Polymers 2019, 11, 80. [Google Scholar] [CrossRef] [PubMed]
- Barker, R.E., Jr. An Approximate Relation Between Elastic Moduli and Thermal Expansivities. J. Appl. Phys. 1963, 34, 107. [Google Scholar] [CrossRef]
- Lomakin, V.A.; Ogibalov, P.M.; Teters, G.A. Problems of the theory of deformation of polymeric materials. Polym. Mech. 1972, 8, 377–385. [Google Scholar] [CrossRef]
- Vashisth, A.; Ashraf, C.; Bakis, C.E.; van Duin, A.C.T. Effect of chemical structure on thermo-mechanical properties of epoxy polymers: Comparison of accelerated ReaxFF simulations and experiments. Polymer 2018, 158, 354–363. [Google Scholar] [CrossRef]
- Kuperman, A.M.; Turusov, R.A.; Gorenberg, A.Y. Study of elastic and strength properties of hybrid and gradient polymer composites. Compos. Mech. Comput. Appl. 2010, 1, 361–373. [Google Scholar] [CrossRef]
- Lobanov, D.S.; Slovikov, S.V. Mechanical Behavior of a Unidirectional Basalt-Fiber-Reinforced Plastic Under Thermomechanical Loadings. Mech. Compos. Mater. 2018, 54, 351–358. [Google Scholar] [CrossRef]
- Wong, C.P.; Bollampally, R.S. Thermal conductivity, elastic modulus, and coefficient of thermal expansion of polymer composites filled with ceramic particles for electronic packaging. J. Appl. Polym. Sci. 1999, 74, 3396–3403. [Google Scholar] [CrossRef]
- Davy, K.W.M.; Braden, M. Thermal expansion of glassy polymers. Biomaterials 1992, 13, 1043–1046. [Google Scholar] [CrossRef]
- Schwarz, G. Thermal expansion of polymers from 4.2 K to room temperature. Cryogenics 1988, 28, 248–254. [Google Scholar] [CrossRef]
- Foster, J.C.; Staiger, C.L.; Dugger, J.W.; Redline, E.M. Tuning Epoxy Thermomechanics via Thermal Isomerization: A Route to Negative Coefficient of Thermal Expansion Materials. ACS Macro. Lett. 2021, 10, 940–944. [Google Scholar] [CrossRef] [PubMed]
- Heinle, M.; Drummer, D. Temperature-dependent coefficient of thermal expansion (CTE) of injection molded, short-glass-fiber-reinforced polymers. Polym. Eng. Sci. 2015, 55, 2661–2668. [Google Scholar] [CrossRef]
- Vaggar, G.B.; Kamate, S.C.; Badyankal, P.V. Thermal properties characterization of glass fiber hybrid polymer composite materials. Int. J. Eng. Technol. 2018, 7, 455. [Google Scholar] [CrossRef]
- Baschek, G.; Hartwig, G. Parameters influencing the thermal expansion of polymers and fibre composites. Cryogenics 1998, 38, 99–103. [Google Scholar] [CrossRef]
- Ribeiro, M.C.S.; Reis, J.M.L.; Ferreira, A.J.M.; Marques, A.T. Thermal expansion of epoxy and polyester polymer mortars - Plain mortars and fibre-reinforced mortars. Polym. Test 2003, 22, 849–857. [Google Scholar] [CrossRef]
- Shardakov, I.N.; Trufanov, A.N. Identification of the temperature dependence of the thermal expansion coefficient of polymers. Polymers 2021, 13, 3035. [Google Scholar] [CrossRef] [PubMed]
- Sun, Q.; Jin, K.; Huang, Y.; Guo, J.; Rungrotmongkol, T.; Maitarad, P.; Wang, C. Influence of conformational change of chain unit on the intrinsic negative thermal expansion of polymers. Chin. Chem. Lett. 2020, 32, 1515–1518. [Google Scholar] [CrossRef]
- Abbasi, A.; Mondali, M. An analytical approach to determine coefficients of thermal expansion of CNT/polymer nanocomposites. Proc. Inst. Mech. Eng. C J. Mech. Eng. Sci. 2020, 234, 4268–4276. [Google Scholar] [CrossRef]
- Shen, X.; Viney, C.; Johnson, E.R.; Wang, C.; Lu, J.Q. Large negative thermal expansion of a polymer driven by a submolecular conformational change. Nat. Chem. 2013, 5, 1035–1041. [Google Scholar] [CrossRef]
- Rousseau, I.A.; Xie, T. Shape memory epoxy: Composition, structure, properties and shape memory performances. J. Mater. Chem. 2010, 20, 3431–3441. [Google Scholar] [CrossRef]
- Flory, P.J.; Erman, B. Theory of elasticity of polymer networks. 3. Macromolecules 1982, 15, 800–806. [Google Scholar] [CrossRef]
- Dill, K.A.; Bromberg, S.; Stigter, D. Polymer Elasticity & Collapse. In Molecular Driving Forces; Garland Science: New York, NY, USA, 2018; pp. 659–684. [Google Scholar] [CrossRef]
- Slutsker, A.I.; Sanphirova, T.P.; Yastrebinskii, A.A.; Kuksenko, V.S. Structure and reversible deformability of oriented crystallizing polymers. J. Polym. Sci. Part C Polym. Symp. 1967, 16, 4093–4101. [Google Scholar] [CrossRef]
- Chan, C.H.; Chia, C.H.; Thomas, S. Physical Chemistry of Macromolecules: Macro to Nanoscales; Apple Academic Press: Palm Bay, FL, USA, 2014. [Google Scholar]
- Mishnev, M.; Korolev, A.; Ekaterina, B.; Dmitrii, U. Effect of Long-Term Thermal Relaxation of Epoxy Binder on Thermoelasticity of Fiberglass Plastics: Multiscale Modeling and Experiments. Polymers 2022, 14, 1712. [Google Scholar] [CrossRef] [PubMed]
- Korolev, A.; Mishnev, M.; Ulrikh, D.V. Non-Linearity of Thermosetting Polymers and GRPs’ Thermal Expanding: Experimental Study and Modeling. Polymers 2022, 14, 4281. [Google Scholar] [CrossRef]
|
Disclaimer/Publisher’s Note: The statements, opinions and data contained in all publications are solely those of the individual author(s) and contributor(s) and not of MDPI and/or the editor(s). MDPI and/or the editor(s) disclaim responsibility for any injury to people or property resulting from any ideas, methods, instructions or products referred to in the content. |
© 2023 by the authors. Licensee MDPI, Basel, Switzerland. This article is an open access article distributed under the terms and conditions of the Creative Commons Attribution (CC BY) license (http://creativecommons.org/licenses/by/4.0/).
