1. Introduction
Presently, red, green and blue (RGB) are considered the primary colors based on biological makeup of the human eye, which contains three types of color receptors the cone cells. Color matching or mixing is adding colors together to match the target color. The three primary RGB colors (known as tri-stimulus values) are used to define other colors, e.g., if R and G are mixed in equal proportions it will produce yellow color. However, it is not possible to match all the colors in the spectrum by adding RGB primary colors; some colors require negative red light to match with the target color (reflected by the first Grassmann law). Also, there are different possibilities to mix colors for the same target color. e.g., the color generated by adding R to cyan is similar to the color created by adding G and B colors [
1,
2].
Color plays a vital part in day today human communication activities. For instance, color is used as a marketing tool, teaching method, passing messages and many other ways. Different tone and shards of color can influence human emotions and activities [
3,
4]: stopping vehicle at red traffic light, wearing a white gown at wedding while black for funeral. The influence of color on human is very individual and is dependent on cultural background [
5]. Color is linked to a psychological meaning in different ways, e.g., red symbolizes danger but in color psychology it is yellow and black. There is no single theory which defines psychological meaning of colors. When it comes to specific color judgments, person age, sex, culture, and any other factors may be involved [
5]. This study is motivated by creating color control software and hardware compatible with a magneto-encephalography (MEG) brain scanner and can be used to study judgements affected by illumination color. Such instrumentation solution is not trivial due to a low electromagnetic (EM) noise requirements for highly sensitive MEG measurements.
Color plays significant role in consumer decision making and judgment. As soon as it has been seen by eyes, color creates first excitement about the object. The lighting source is a very important factor in producing initial impression on consumer products. The natural color of the product is deviated by the lighting source [
6]. As a result of lighting source, products may give different color quality such as rich or dull visual effect on consumer. However, color judgement is very individual and subjective [
7]. It is very difficult to compare color quality with different lighting sources. Therefore, international commission on illumination (Commission International de éclairage – CIE) has introduced new color rendering index (CRI) for quantification of lighting sources, e.g., a temperature of source is widely used in lighting LED appliances defined as cold and warm white. The CRI index can be used to reveal the color of an object and to compare with natural light. Halogen and incandescent light sources have highest CRI. However recent research verified that light emitting diode (LED) based solid state lights were preferred than halogen and incandescent lights [
8]. Due to technological development in the solid state lighting, there are two more color rendition properties introduced, which are color fidelity index (CFI) and color saturation index (CSI). The CFI defines an ability which makes color more natural and CSI is the ability to make color distinguishable [
9]. In conventional lighting lamps CFI is optional and CSI properties are not available. In LED lighting, white light can be generated by combination of Red (R), Green (G), Blue (B) and Amber (A) LEDs. By changing the ratio of RGB-Amber LEDs, it can generate different type of white light. As result of that, it is easy to changed CSI and CFI [
6].
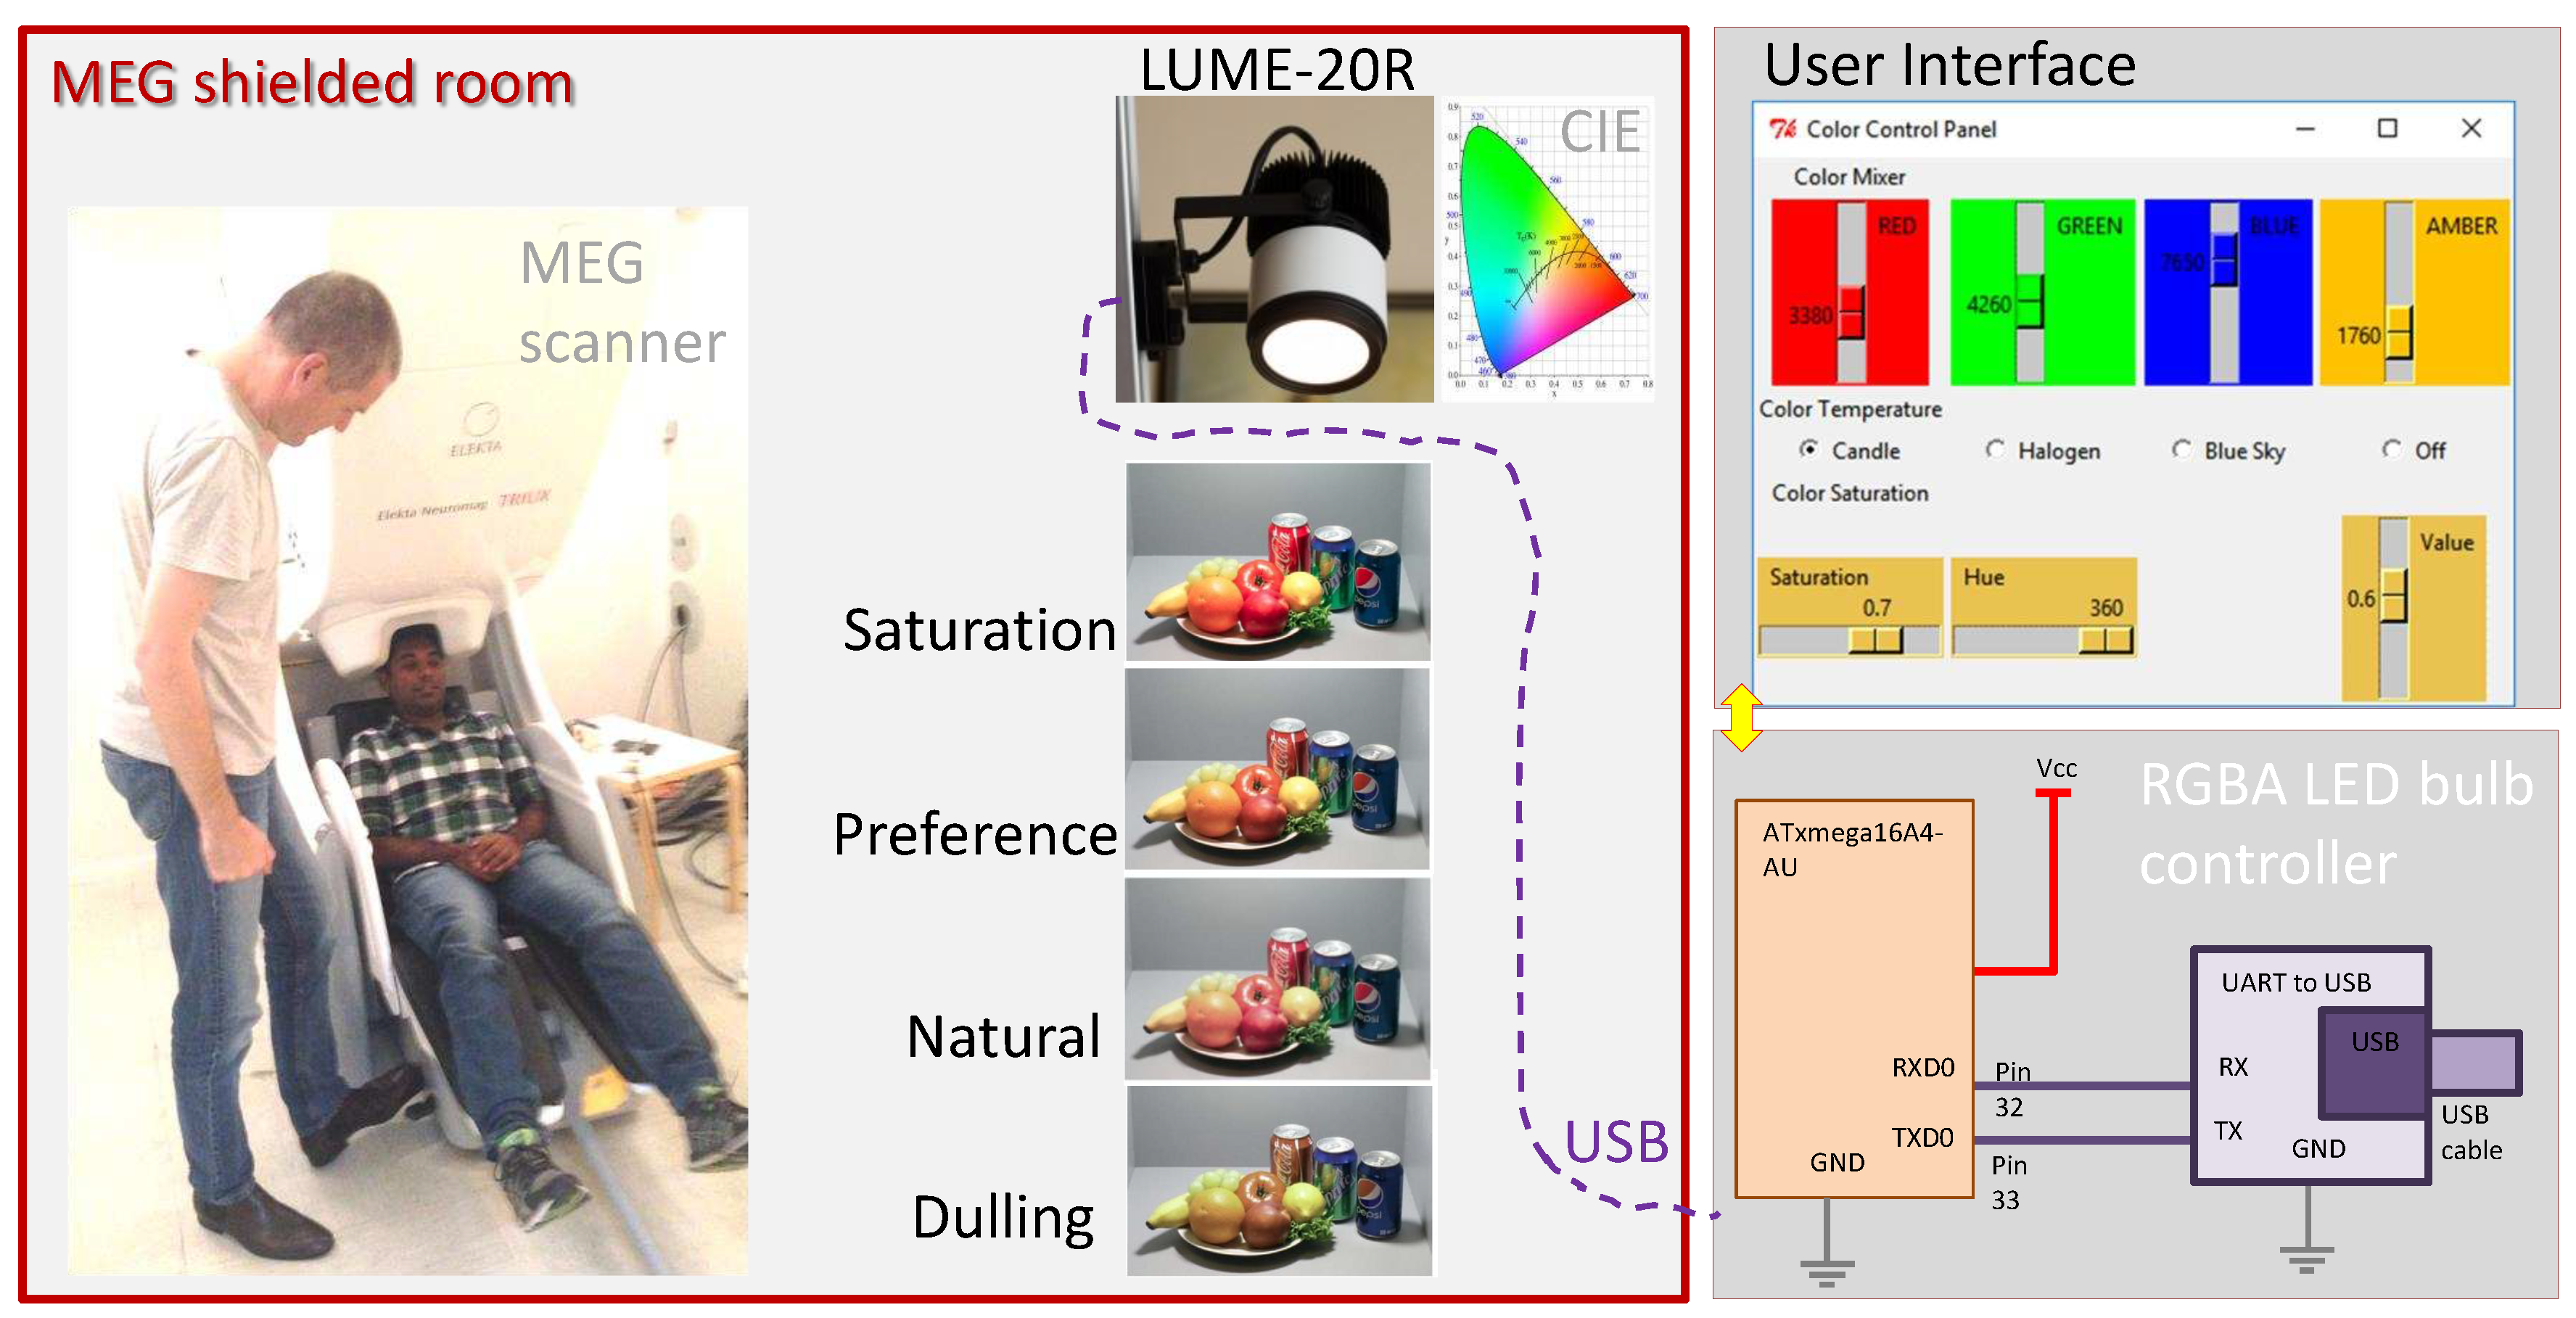
This project uses RGB-A controllable LED light bulb from Ledigma Ltd. to illuminate objects with different color combination and MEG brain scanner to monitor person’s brain activities. MEG brain scanner is mapping brain by capturing magnetic field produced by minute electrical currents in the brain [
10]. This MEG machine is located inside EM-shielded room to reduce interference from external EM sources.
2. Experimental
LUME-20R lamp has 20 LEDs grouped into four colored clusters with each cluster made of five LEDs. These four colored clusters are Red, Green, Blue and Amber. A four 10-bit pulse width modulation channels control the fluxes generated by each group of LEDs [
6]. The LUME-20R lamp uses LEDs from LUMILEDS LUXEON Rebel family with peak wavelength 452 nm (B), 523 nm (G) InGaN LEDs, InGaN-based phosphor converted amber LED at 589 nm, and direct-emission AlGaInP LED at 637 nm (R) [
6]. The lamp can be controlled by setting specific values of hue, saturation and brightness (or value) (HSV) presented as a color cone. Hue is the term which defines a dimension of color, with specific wavelength, brightness defines the lightness or darkness of the color and saturation defines the intensity of the color [
11]. The HSV is widely used in computer graphics and printing applications. Hue denotes the angular dimension starting from red at 0° and passing through green at 120°, blue at 240° and back to red at 360°. The brightness (or value) evolves along the axis of color cone with 0 representing black and white has the value of 1. The radial dimension of the cone is saturation, which gives a pure color at 1 (at the outside edge of the color cone) and
S = 0 the the center of cone (on its axis).
Aim of this project is to control LUME-20R LED (Ledigma Ltd., Vilnius, Lithuania) bulb from outside the EM shielded room. The main reason to select this bulb is that it has a capability to change lighting parameters quantitatively and qualitatively such as CSI and CFI. This LUME-20R LED bulb can be controlled only via Bluetooth. However, the Bluetooth communication is not applicable due to bulb is located inside EM shielded room. Therefore, it requires wired method to communicate and control bulb from outside shielded MEG room.
Figure 1 shows block diagram of the organization of the devices (see Suppl. and
Figure A1 for details).
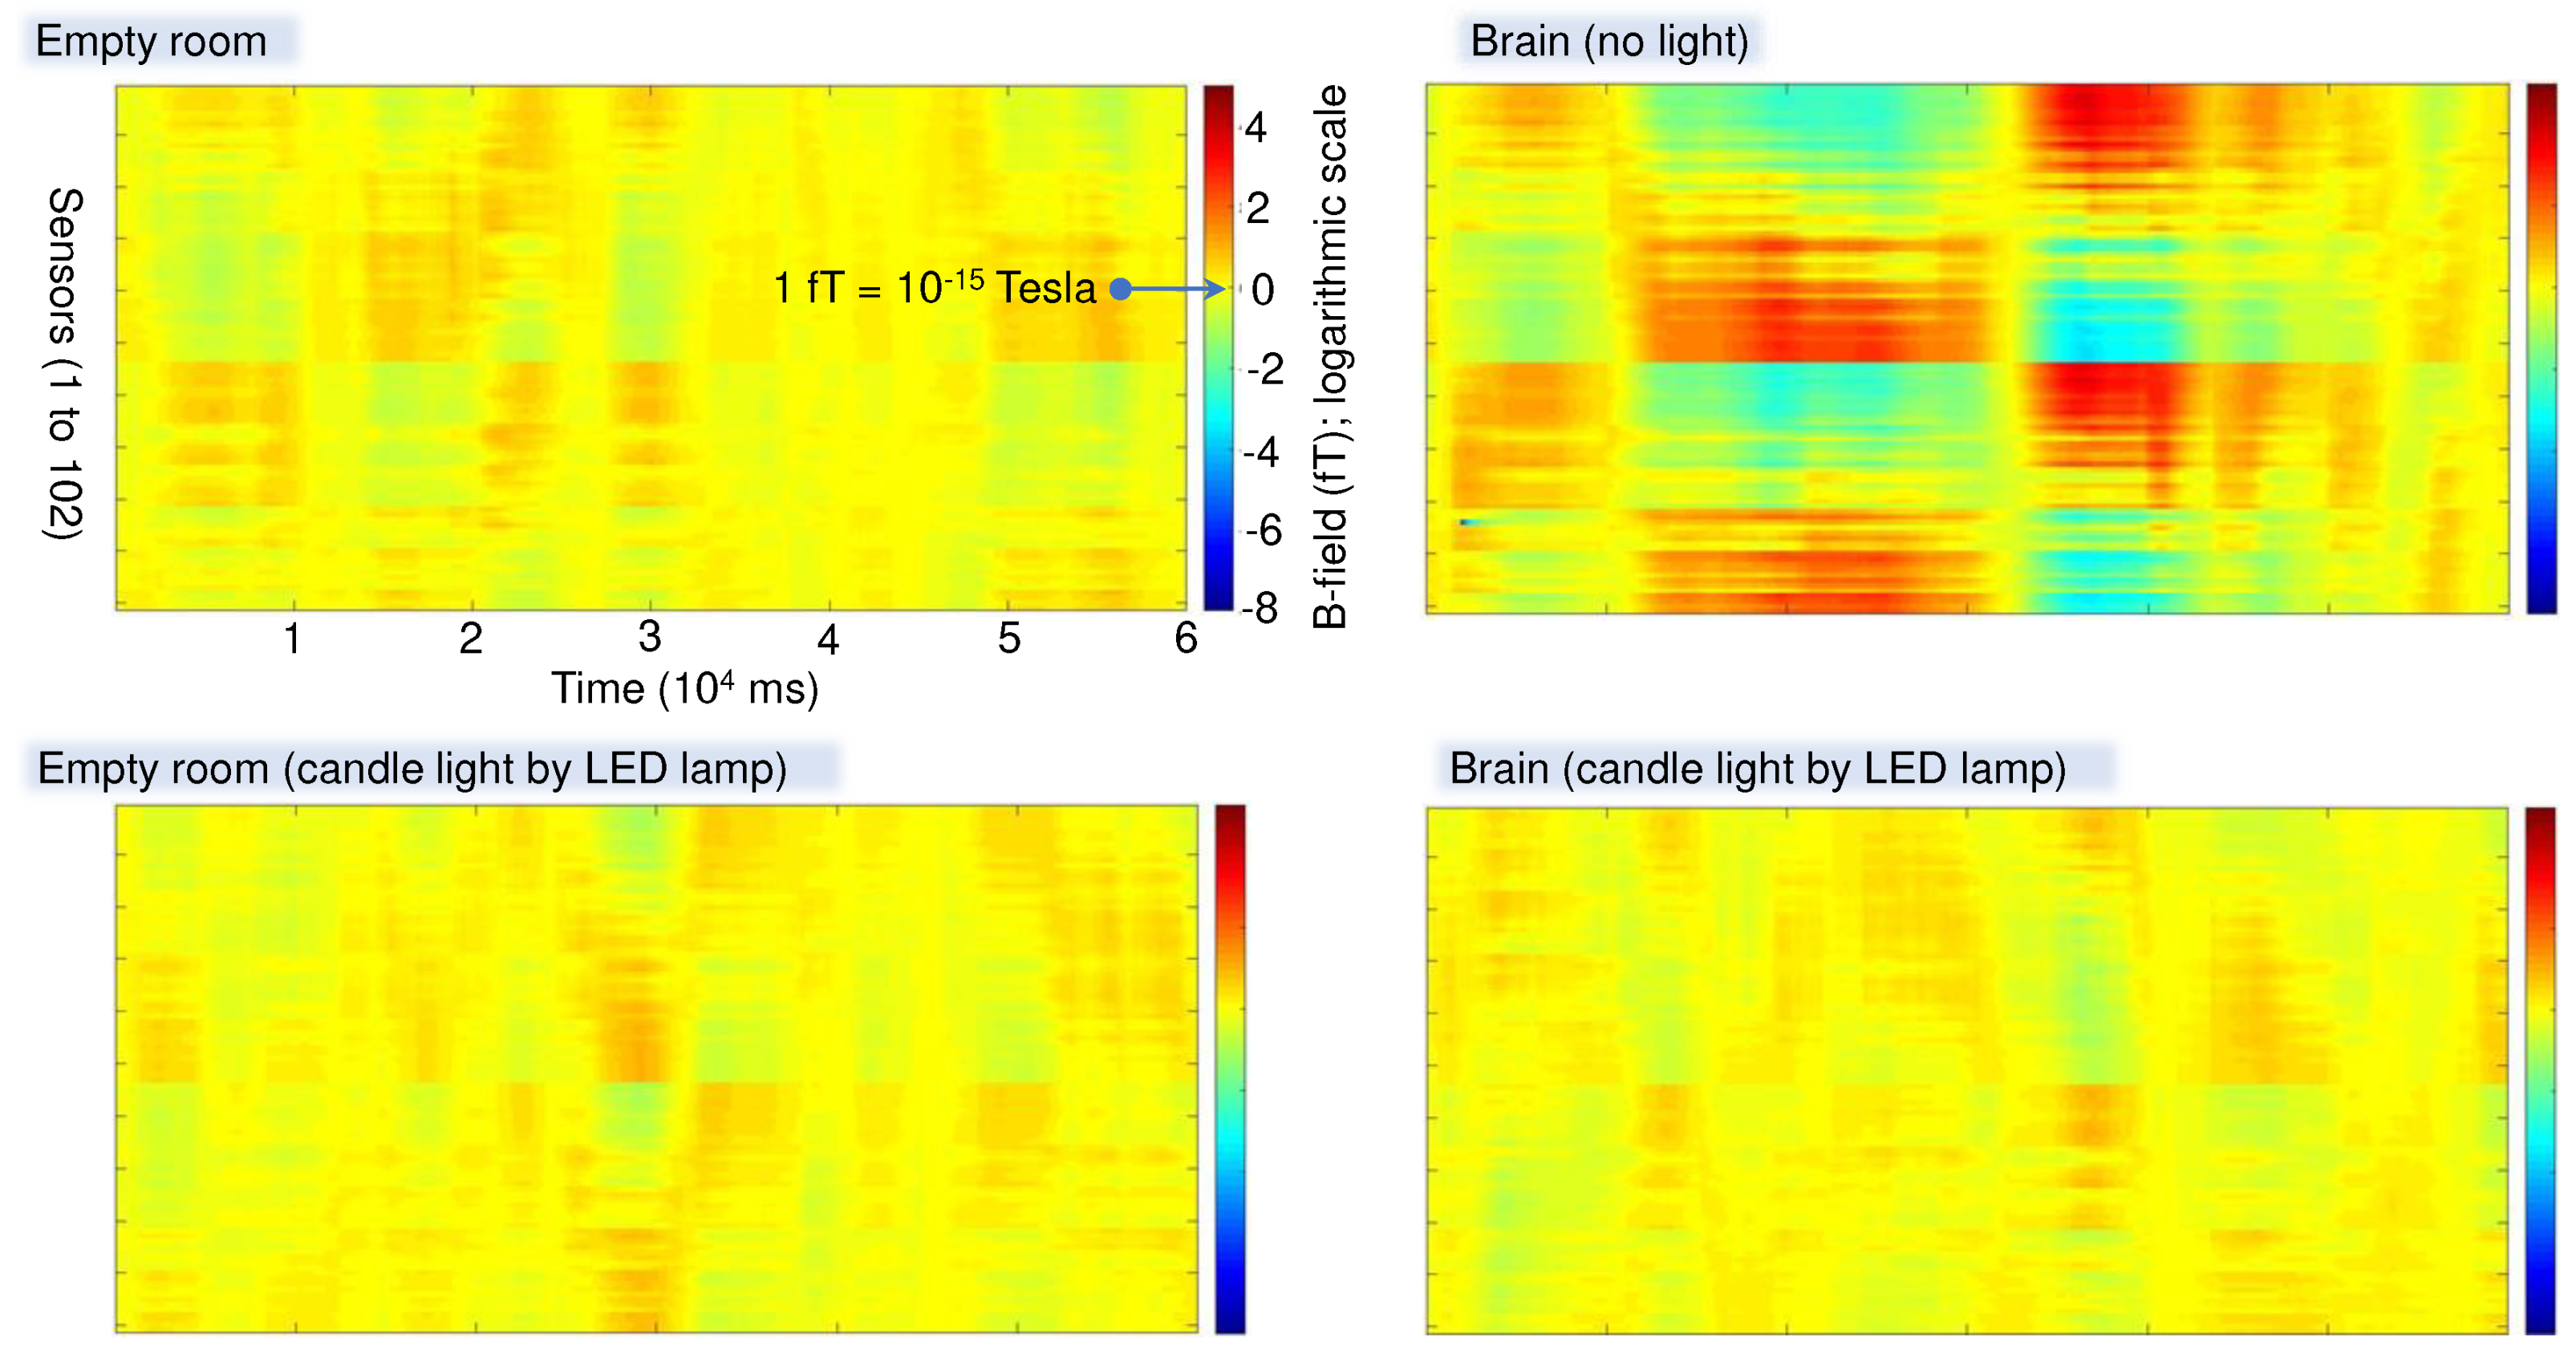
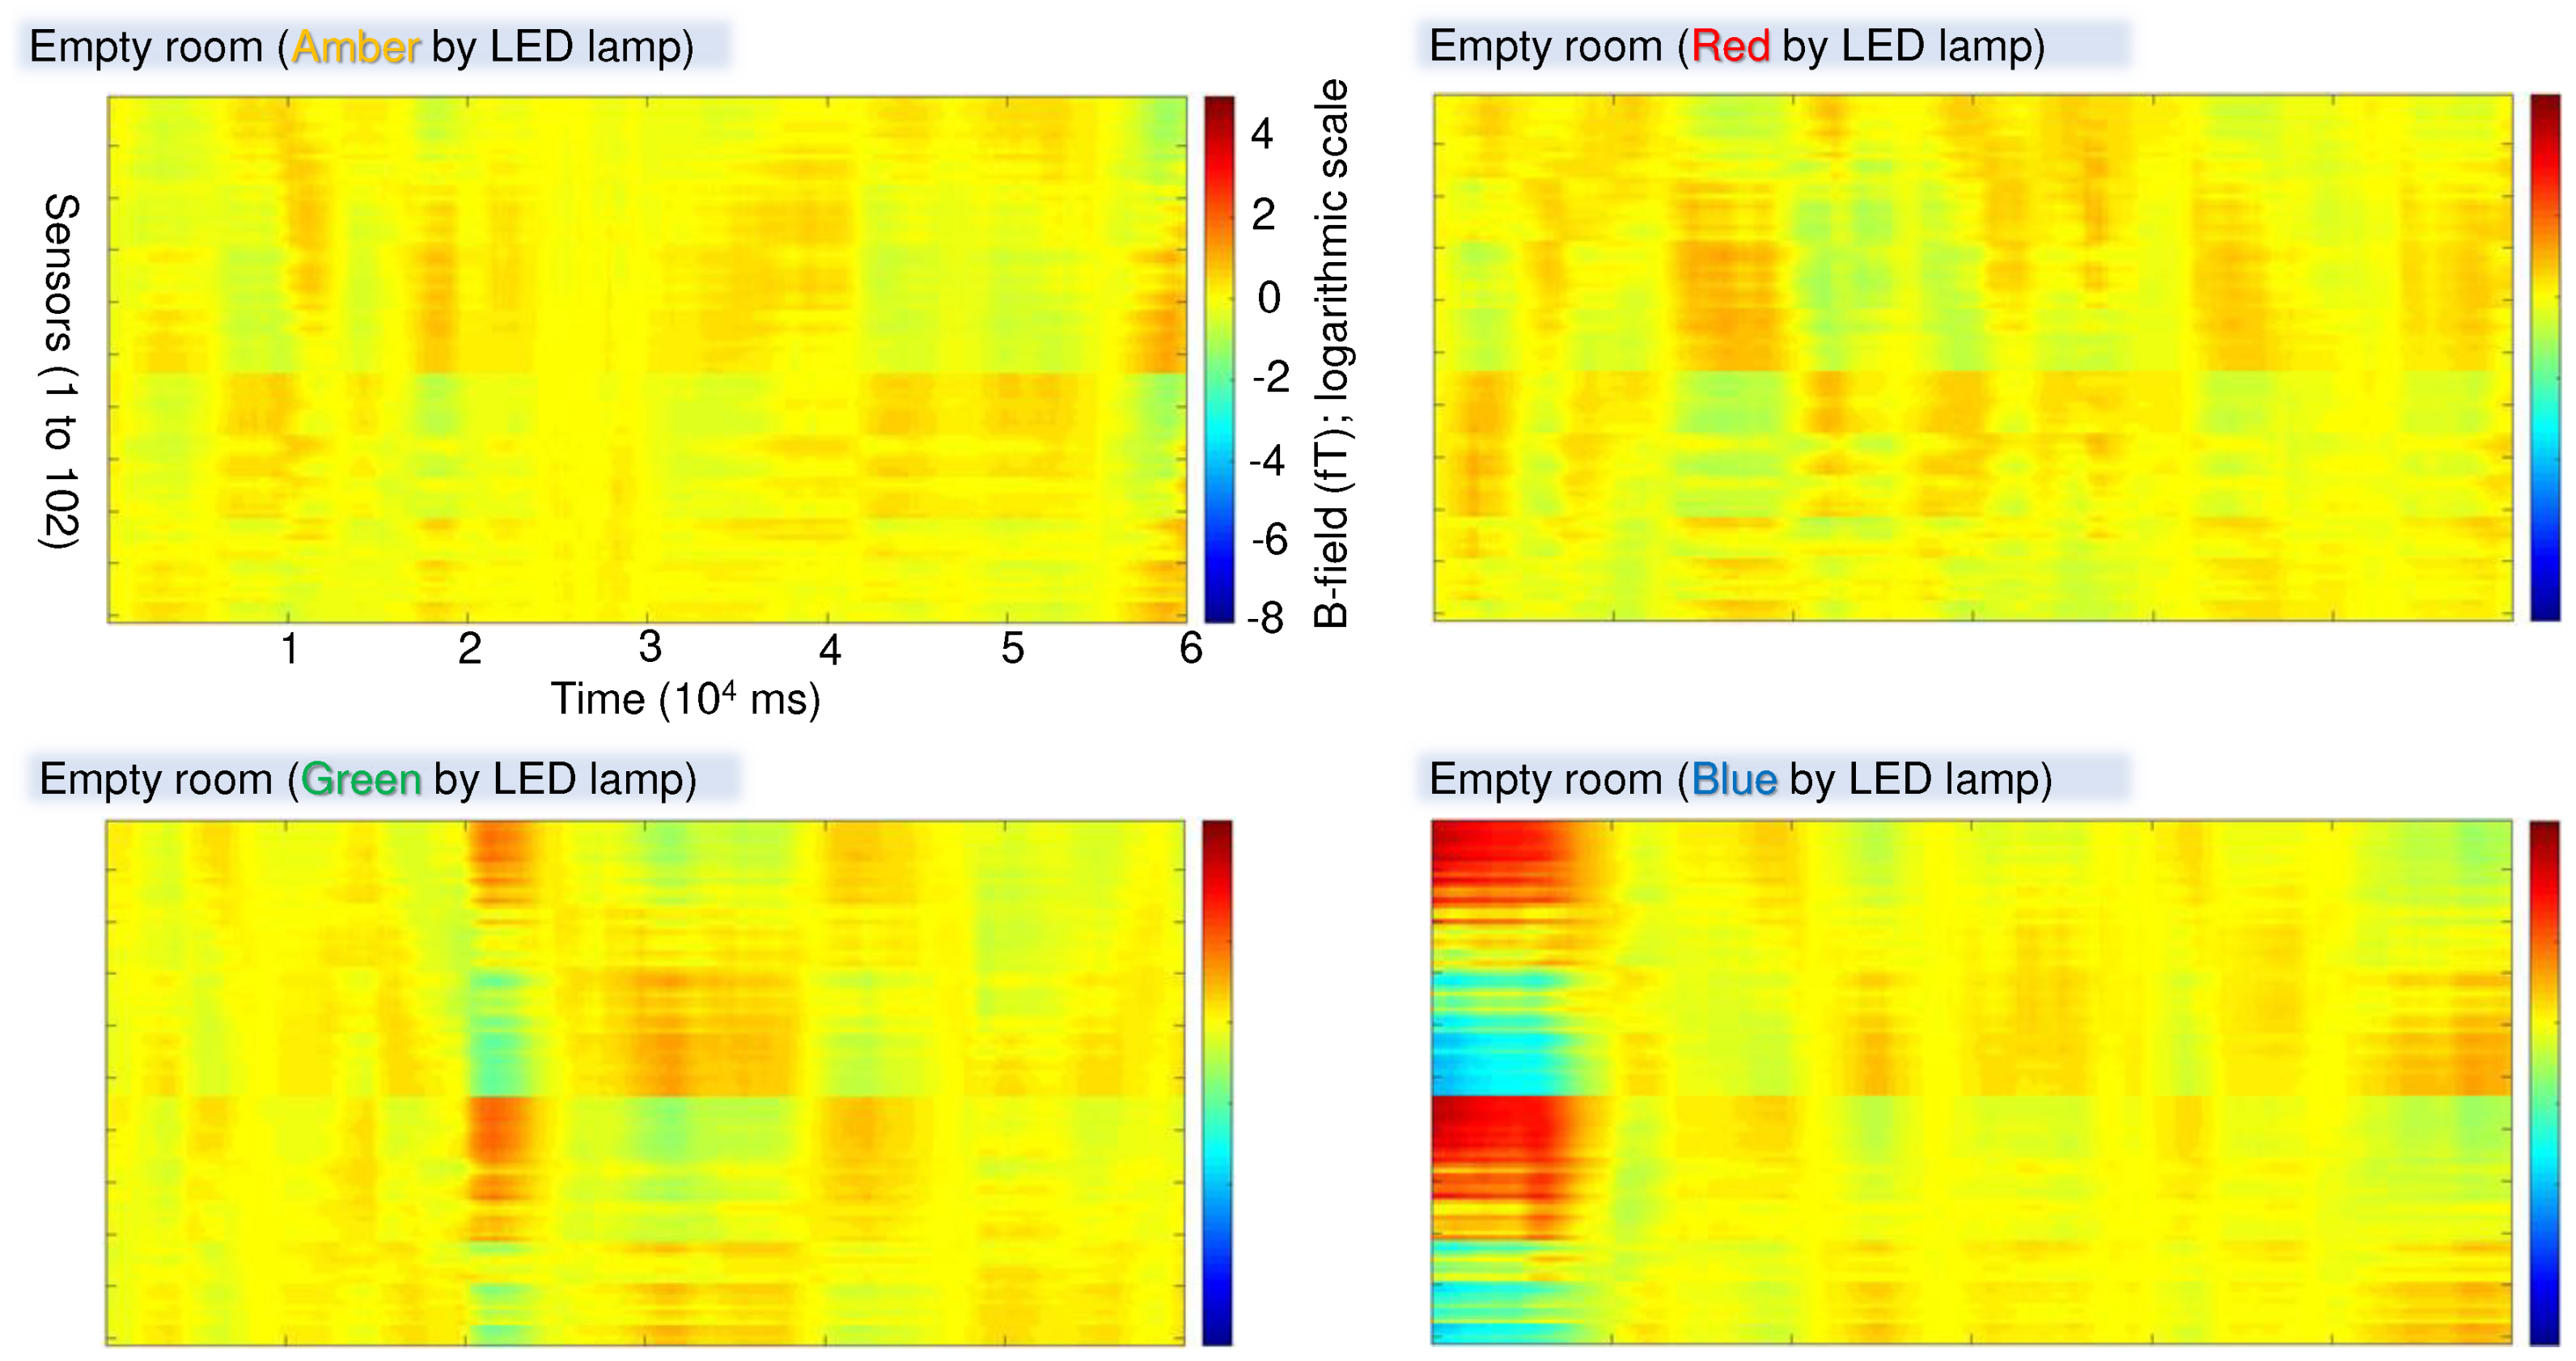
Protocol. The MEG scanner is very sensitive to magnetic field. Therefore, to verify the impact of the 4-color LED lamp (LUME-20R) and its control software on MEG scanner, initial test was conducted with the help of MEG expert team. At this stage, 8 different combinations of MEG scanner data were measured over a minute period. Those combinations were used to test the changed condition of MEG operation and the reference. The main test were the following combinations: (1) empty MEG scanner itself, (2) MEG scanner with a person inside (a normal operation), (3) MEG scanner, person inside with a candle light (4) MEG scanner with a candle light (5) MEG scanner with primary color lights at a time (RGB+Amber); 1500 K (candle light), 3500 K (Halogen) and 6500 K (daylight).
The person has to sit in the MEG scanner to measure brain magnetic field during session with different (in color) lighting conditions defined by the LED lamp.
3. Method and notations of color conversion
James Clerk Maxwell was the first to quantify color measurements and proposed RGB as primary colors forming an orthogonal coordinate system, which define a color triangle [
11]. The color triangle is obtained by cutting the RGB color space. Any color in the triangle can be determined by the color coefficients
of the RGB components. In this description, the brightness is ignored and coefficients
[
12].
To overcome negative RGB values required to define some colors and to describe brightness of the colors, the International Commission on Illumination (CIE) in 1931 introduced
and
Z imaginary primary colors. Here,
Y represents the luminance or brightness,
Z represents the blue stimulation (the S cone response in eye) and
X represents the linear combination of cone response curves chosen to be non-negative. According to this CIE XYZ model, the XZ plane has all the possible chromaticities while
Y presents its brightness [
1,
2]. The spectral power distribution (SPD) provides the visual profile of a light source and gives the radiant power emitted by the sources at each wavelength
or the range of wavelengths. The SPD describes the power per unit area
A per unit wavelength
of an illumination
, where
is the radiant flux [
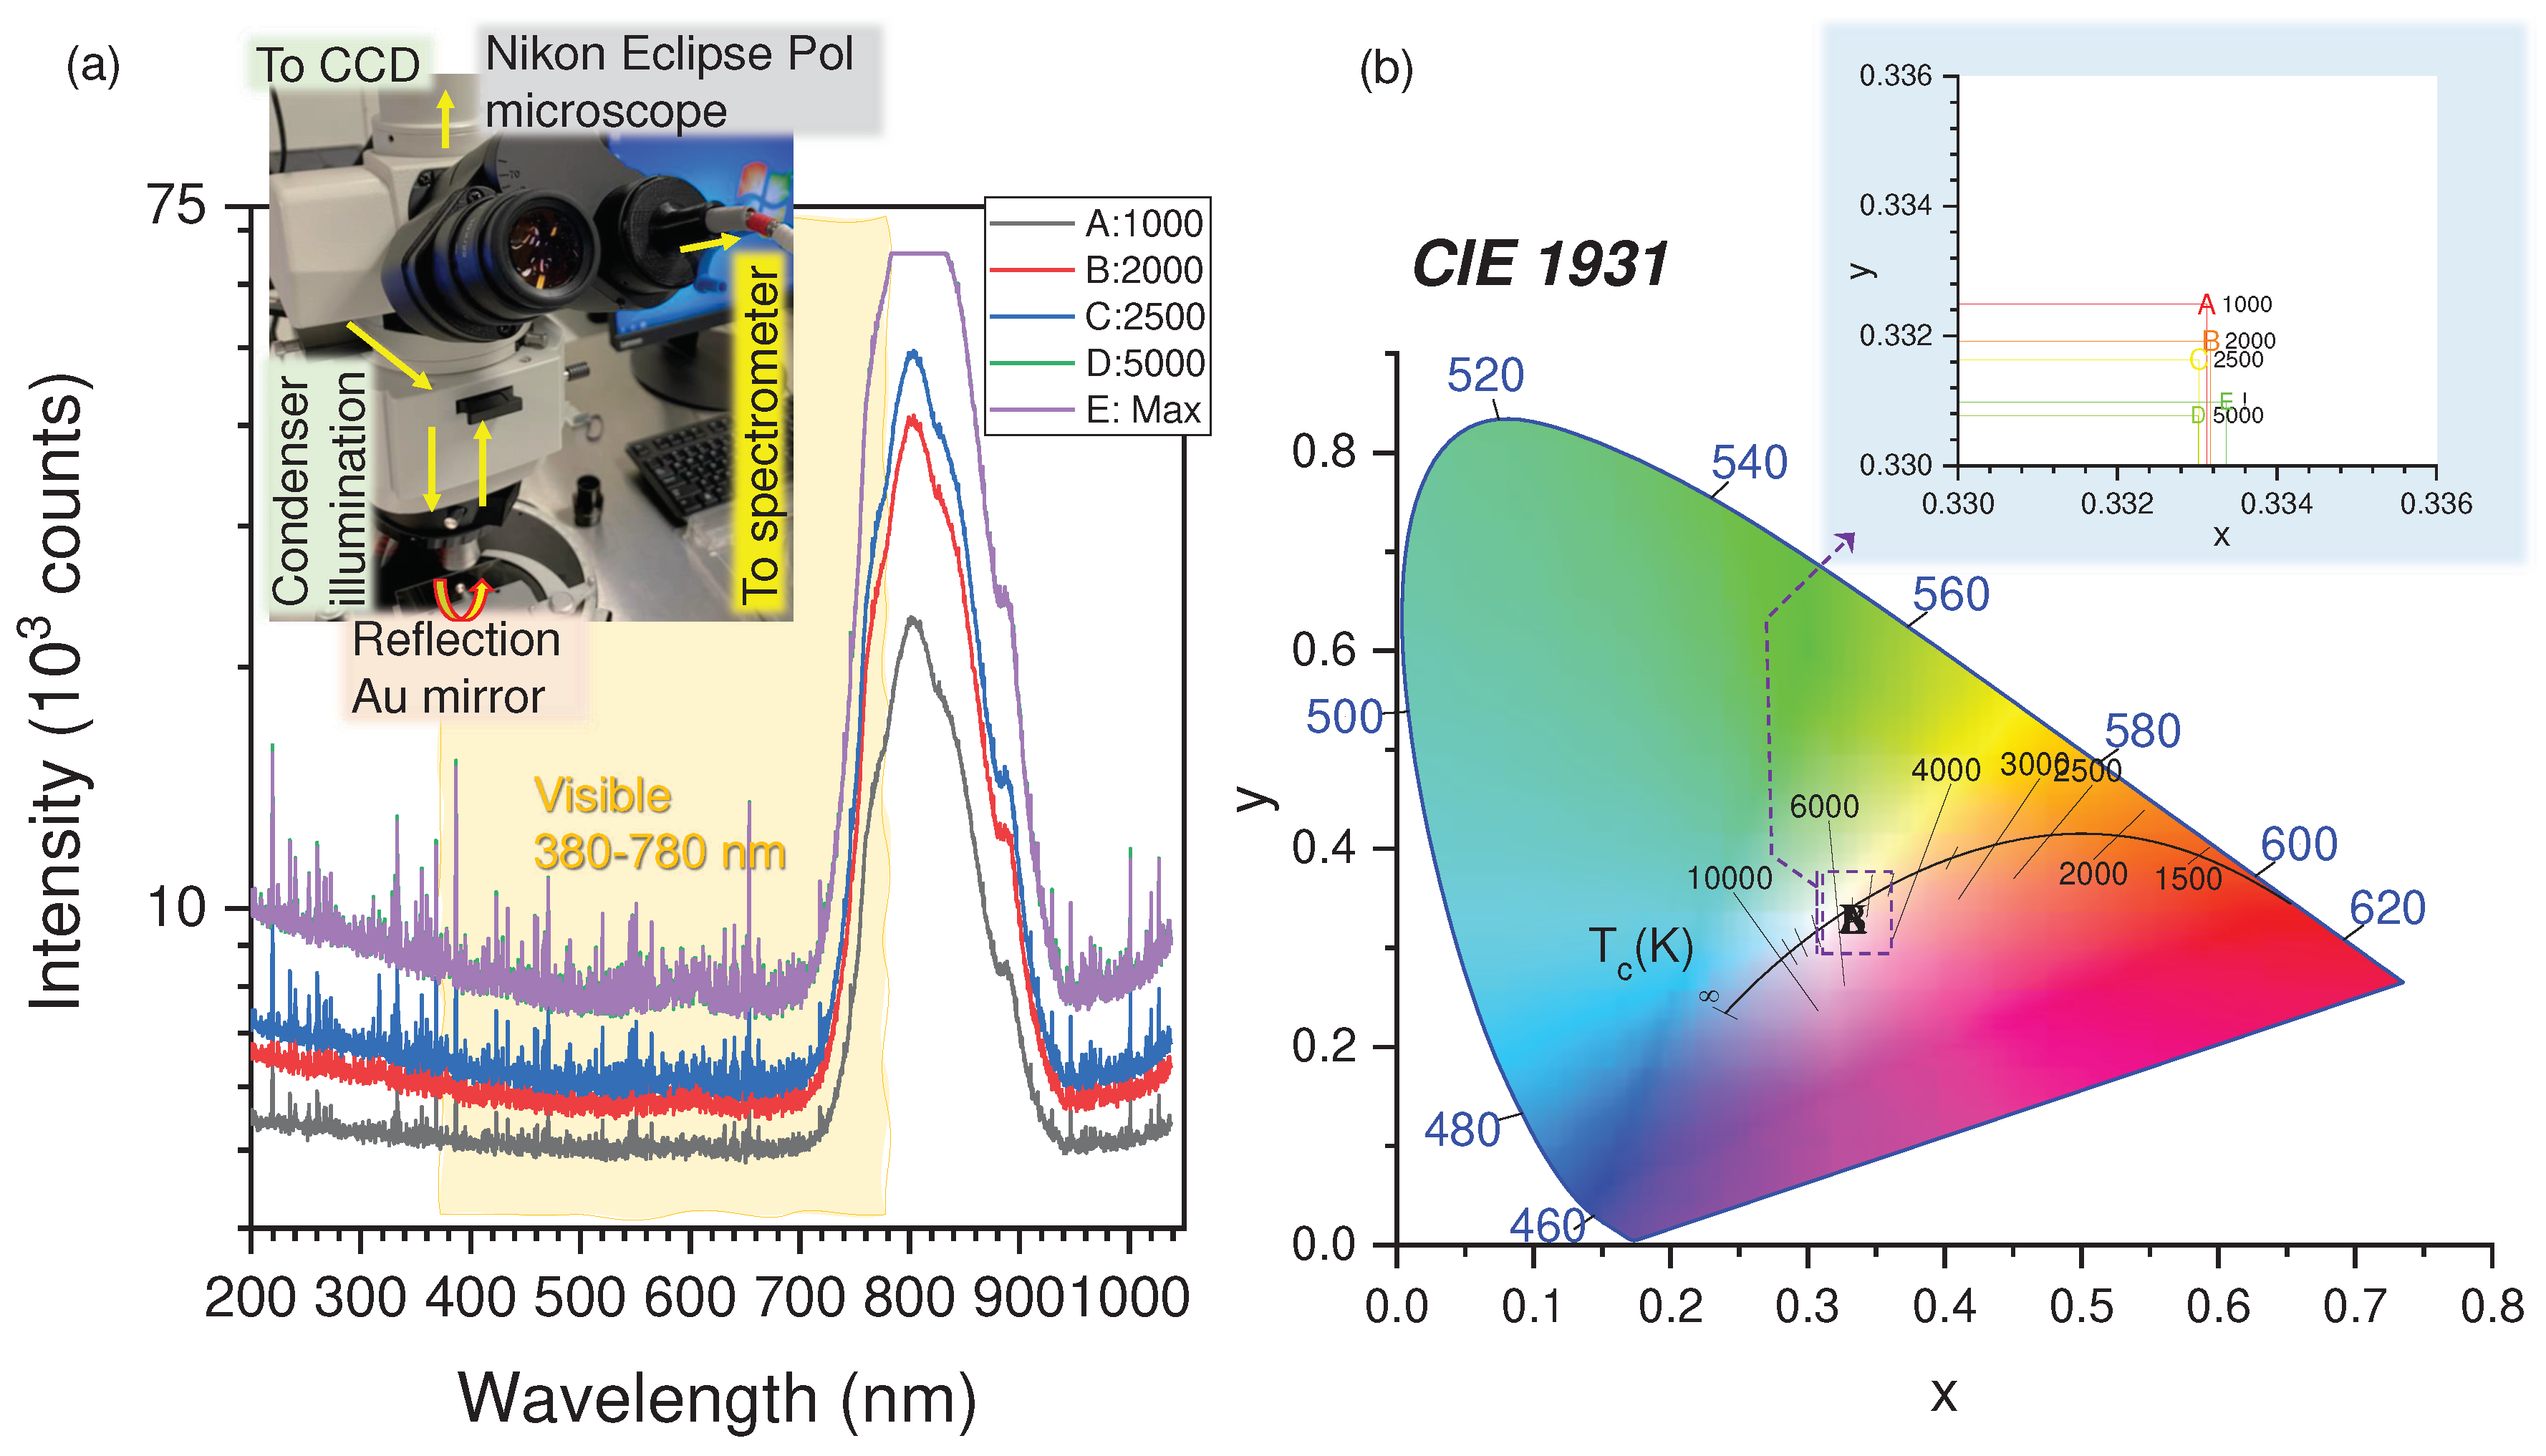
2]. The CIE color matching functions are defined for the visible spectral window 380-780 nm in such a way that
,
,
, where
are the CIE defined color matching functions. The CIE chromaticity diagram (inset in
Figure 1) is based on Maxwell’s color triangle, which is projected onto two dimensional xy-plane. As result all the colors can be represented with two coordinates
as
,
,
.
To identify color in practice, the CIE’s
presentation is widely adopted, where
x and
y are the coordinates of the chromaticity diagram of a given color and
Y is its luminance. Therefore,
tri-stimulus values can be calculated by
,
and
. Chromaticity xy-coordinates do not depend on the luminance (see, a practical example in the Supplement
Figure A2).
Grassmann proposed that color matching can be treated as algebraic equations, i.e., any given wavelength is naturally denoted by the linear combination of the given set of primary colors
. This given set of color can be represented as a linear sum of another primary set of colors
using matrix notation [
1,
2,
11]. Based this linear transformation theory, CIE specified the standard that can convert RGB color space to XYZ color space and vice versa:
Inverse of the Eqn.
1 is used to calculate R, G, B color space from X, Y, Z:
The presented nomenclature allows to transform color spaces between RBG, XYZ and chromaticity
(with
Y brightness). Those conversions were coded using readily available Python libraries [
13]. Adding Amber color with fixed intensity to the RGB LED spectrum was handled by the same Eqns.
1,
2 with the mixing rule defined below (Eqn.
3). For example, 1500 K (candle light) RGBA values are obtained by, first, calculating
coordinates correlated to 1500 K from CIE 1931 chromaticity diagram:
,
. Then
are derived by applying the
data from Eqn.
1 with setting
for the calculation. Those calculated
defined RGB colors by applying Eqn.
2. The correlated RGB values for 1500 K (candle light) is
. The RGBA values for 1500 K are obtained from the following consideration. The AGB triangle
,
and similarly for the RGB triangle
,
. The Amber, Red and Green colors are in a straight line therefore, Amber ratio can be considering as
assuming that Green color is constant (see, next paragraph and Eqns.
4 where
for 1500 K light is a weight parameter used in LUME-20R lamp). One arrives at
. This method was applied to obtain RGBA values for any correlated color temperature (CCT) values.
Color rendering was made by controlling intensity of separate RGB+Amber contributions via current defining the intensity (power) of the corresponding color LED. Unlike RGB LED lamps available in the market, blending RGB+Amber colors provides extra control of color fidelity, color saturation and dulling effects (
Figure 1). Color rendering was based on varying spectral power between the G and R regions of CIE 1931
chromaticity diagram at the wavelength from 530 nm to 620 nm. The white light falls on AGB and RGB triangle [
6]. Hence, the white light can be generated with the mixture of spectral powers
or
or a linear mixture of both by controlling R and A color ratio [
6]:
where
is the weight parameter
. The radiant flux is calculated by the following equations:
The rule above was used to set individual color intensity by the electrical current of the corresponding LED.
The software was developed using Python software language. Python is a high level language, which has object oriented capabilities and it supports other different style of coding too. Furthermore, it runs on any platform such as windows, Linux, Mac. It requires very small amount of memory because Python is a scripting language [
14]. In addition to that, Python language interpreter is free and many libraries are freely available. This project has used Python packages such as ColorPy, Colorsys and Tkinter. ColorPy is a free Python package which converts physical attributes of light to RGB color space by using standard color mixing formulas stated above [
13]. The Colorsys package gives bidirectional conversion color values such as hue, saturation, brightness HSV to RGB colors according to formulae presented in this section above. Hue
H has range of 0° to 360°, saturation
S is from 0 to 1 as well as brightness value
V; chroma
C is given by
.
5. Discussion
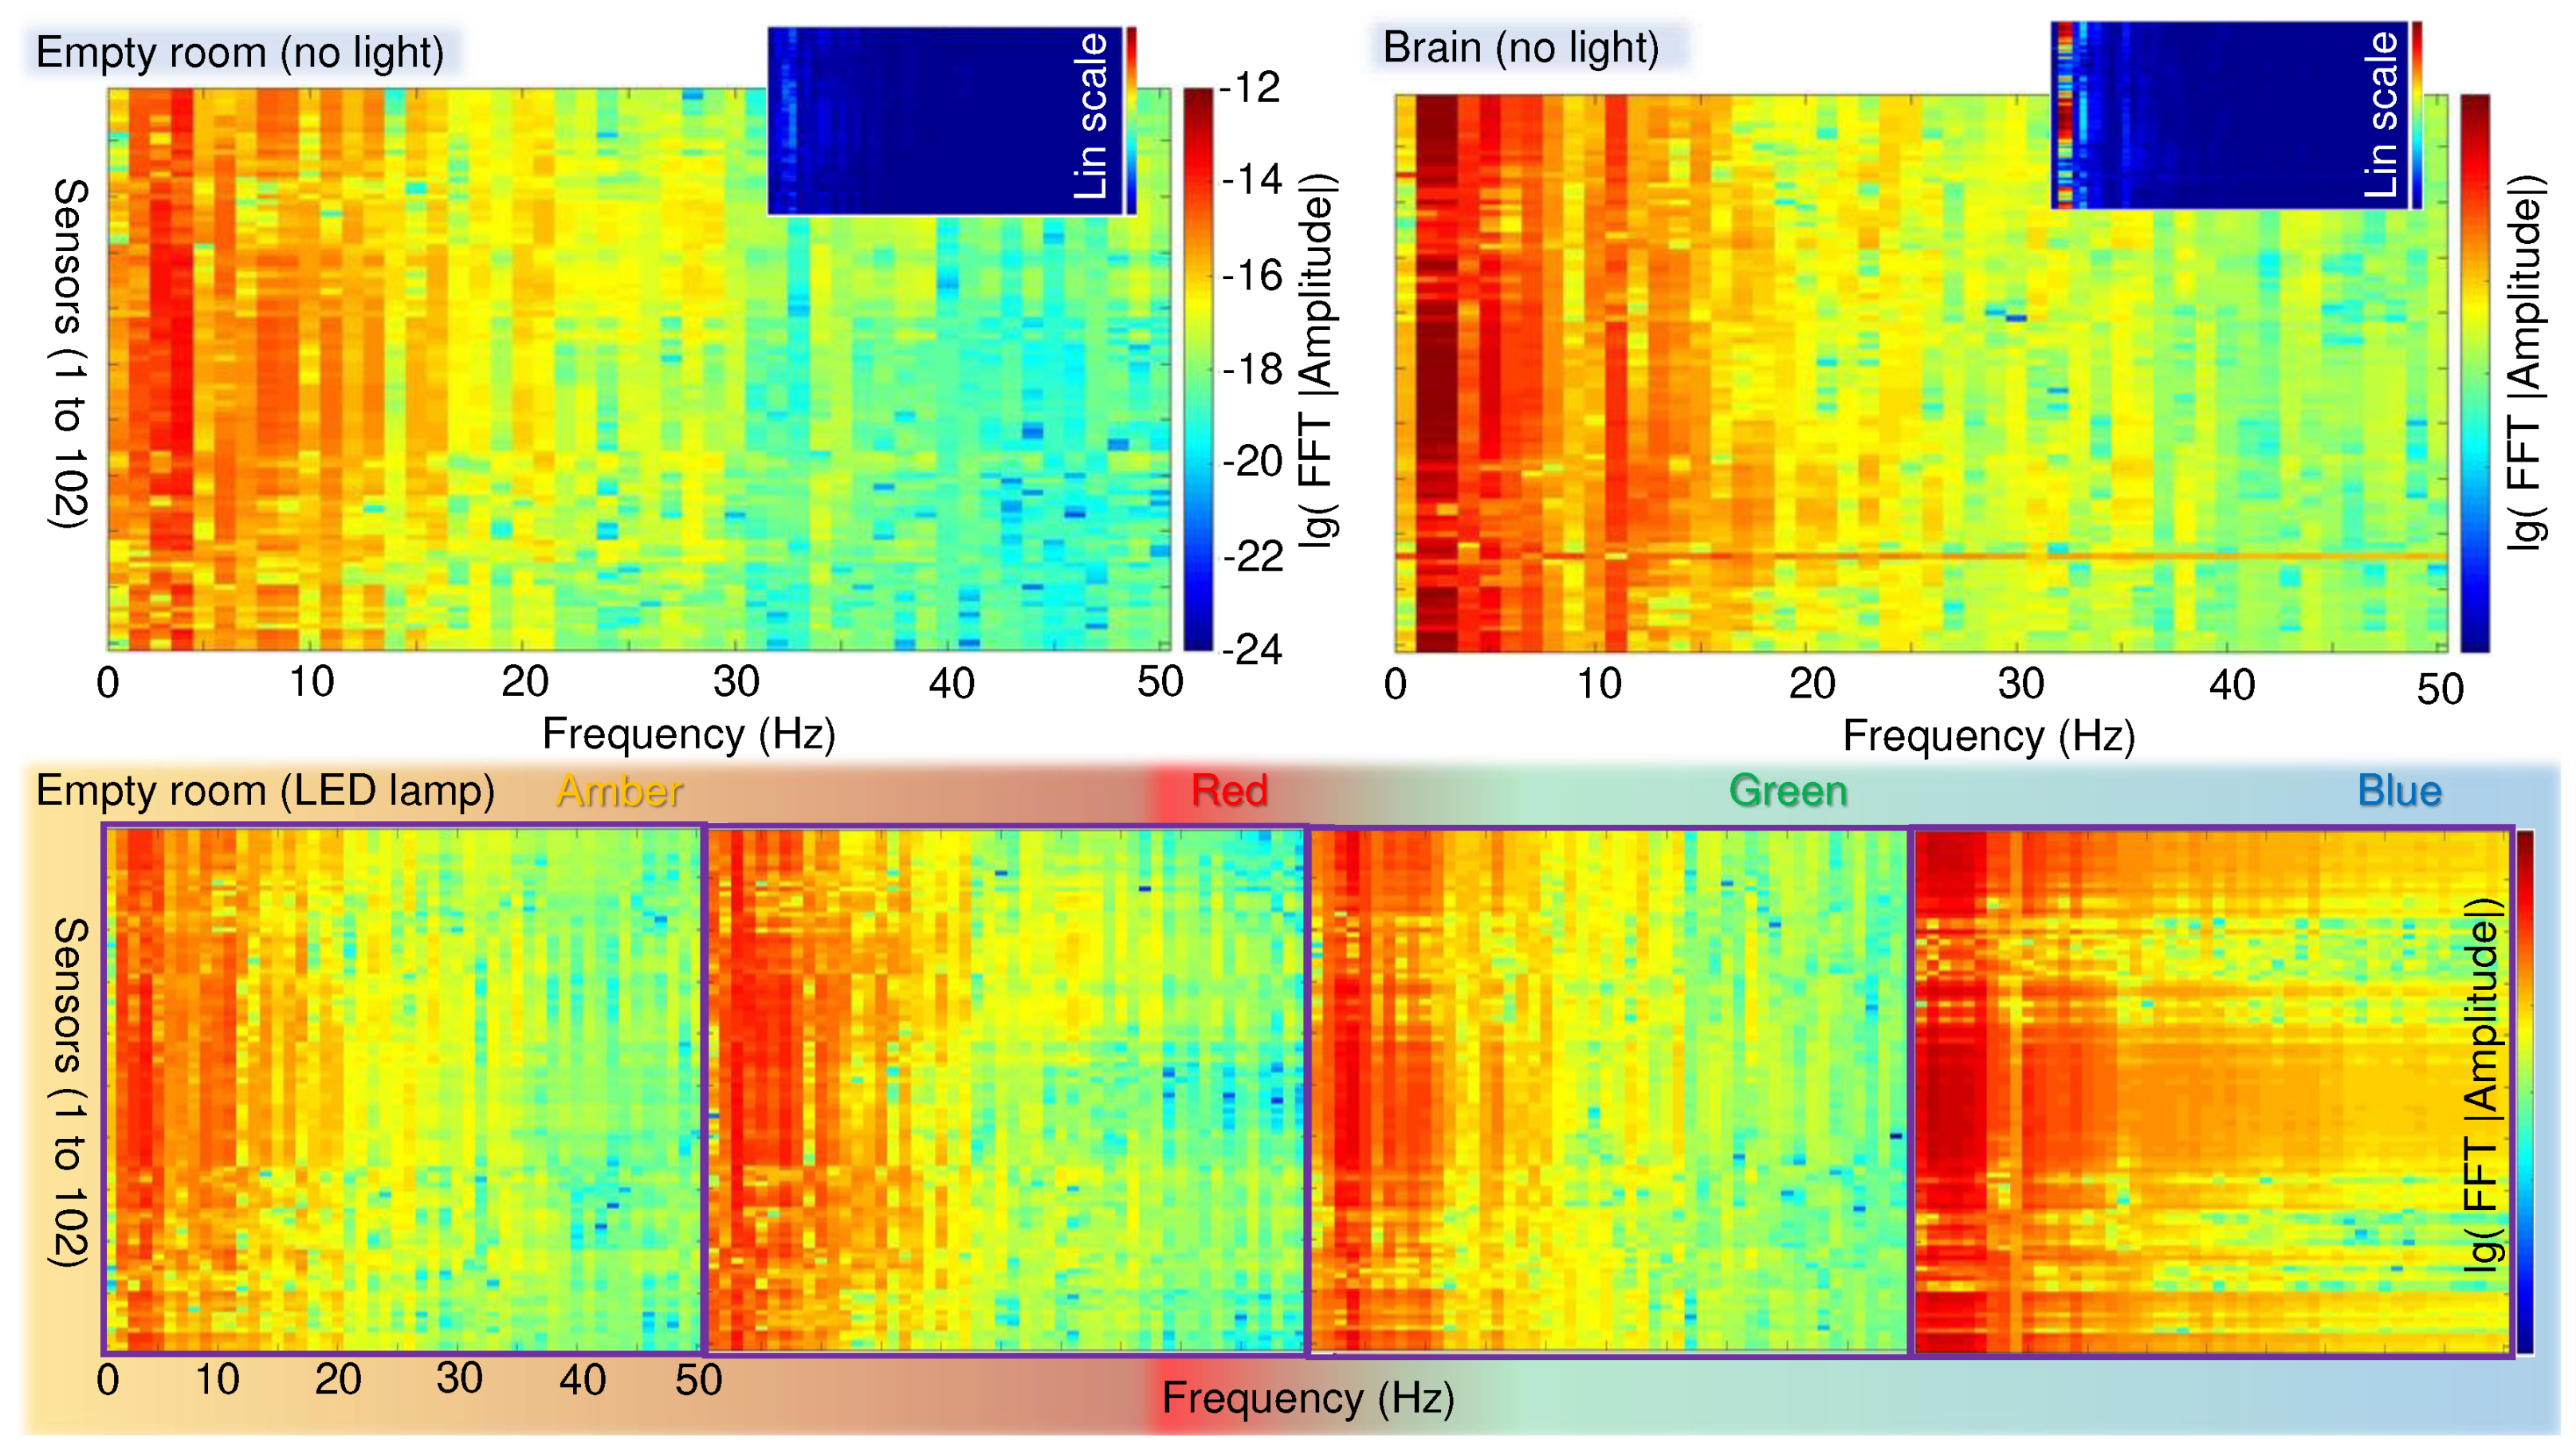
Based on experimental results (
Figure 4), we can conclude that the LED-lamp and the controller via USB connection can be used in conjunction of brain and color related research. Further improvements of USB wire shielding can be implemented to further reduce noise amplitude at low
Hz frequencies, usually referred to as a building/structure noise.
The color mixing by developed software and the LED-lamp can be calibrated by a colorimeter and measured in color temperature from tristimulus values (see
Figure A2(b)). The desired color is generated by regulating the intensity of the LEDs with four colors. Concurrently switching cluster of LEDs may cause electromagnetic interference (EMI). Hence, it is compulsory to measure EMI of the lamp and controller software together [
16]. The created software and hardware control tools can serve future research in wide range of applications from brain functions and psychological behavior relevant to learning of hyperactive kids, mood control of prisoners and in age care facilities, as well as a marketing tool and street lighting for the quality and safety of driving and walking [
3,
4,
5,
17,
18]. In terms of neuro-scientific questions, it is interesting to use the LED lamp to investigate colour constancy, which is the tendency to perceive surface colour of objects as relatively constant under changing illumination conditions [
18]. Previous studies have shown that warm or cool illumination can influence perception of colours. By use of brightening illusion, it is possible to shift the point at which observers switch between seeing the same dress as white/gold vs. blue/black. The challenge is in differentiating between signals associated with neuro-physiological responses to illumination vs. decision processes about illumination quality. Cognitive neuroscience researchers are using machine learning algorithms to decode patterns of EEG/MEG/fMRI data associated with different perceptions/tasks/decisions [
17,
19]. Computer graphics and data visualisation strategies [
20] could find more intuitive and informative presentations based on color rendering.
Similar kind of a controller and LED-lamps can serve other applications for greenhouse lighting system design. It has been scientifically proven, that harmful nitrate can be significantly reduced by 20% to 40% in lettuce by red LED illumination two days before harvesting [
21]. It was demonstrated that a "light box" with three RGB colors only were delivering viable conditions (similar production of biomass) to grow Christmas poinsettia (euphorbia pulcherrima; a popular pot-plant) and to develop color change of leaves to red by such artificial only lighting [
22].
6. Conclusions
This project successfully developed a controller for the LUME-20R lamp via USB from outside the electromagnetic shielded room. Based on test data, it shows that LUME-20R lamp and MEG scanner combination can be used in brain and color related research using MEG scanners.
The color controller software is capable to tune color saturation of an illuminated object; a voice control can be used to alter color of scene illumination during MEG scan. Furthermore, the software gives a comprehensive range of color combinations, such as all the colors in the spectrum, white light options and color hue, saturation and brightness.
It is proven that, the LUME-20R lamp and USB color controller software, are feasible to apply MEG scanner related research.

