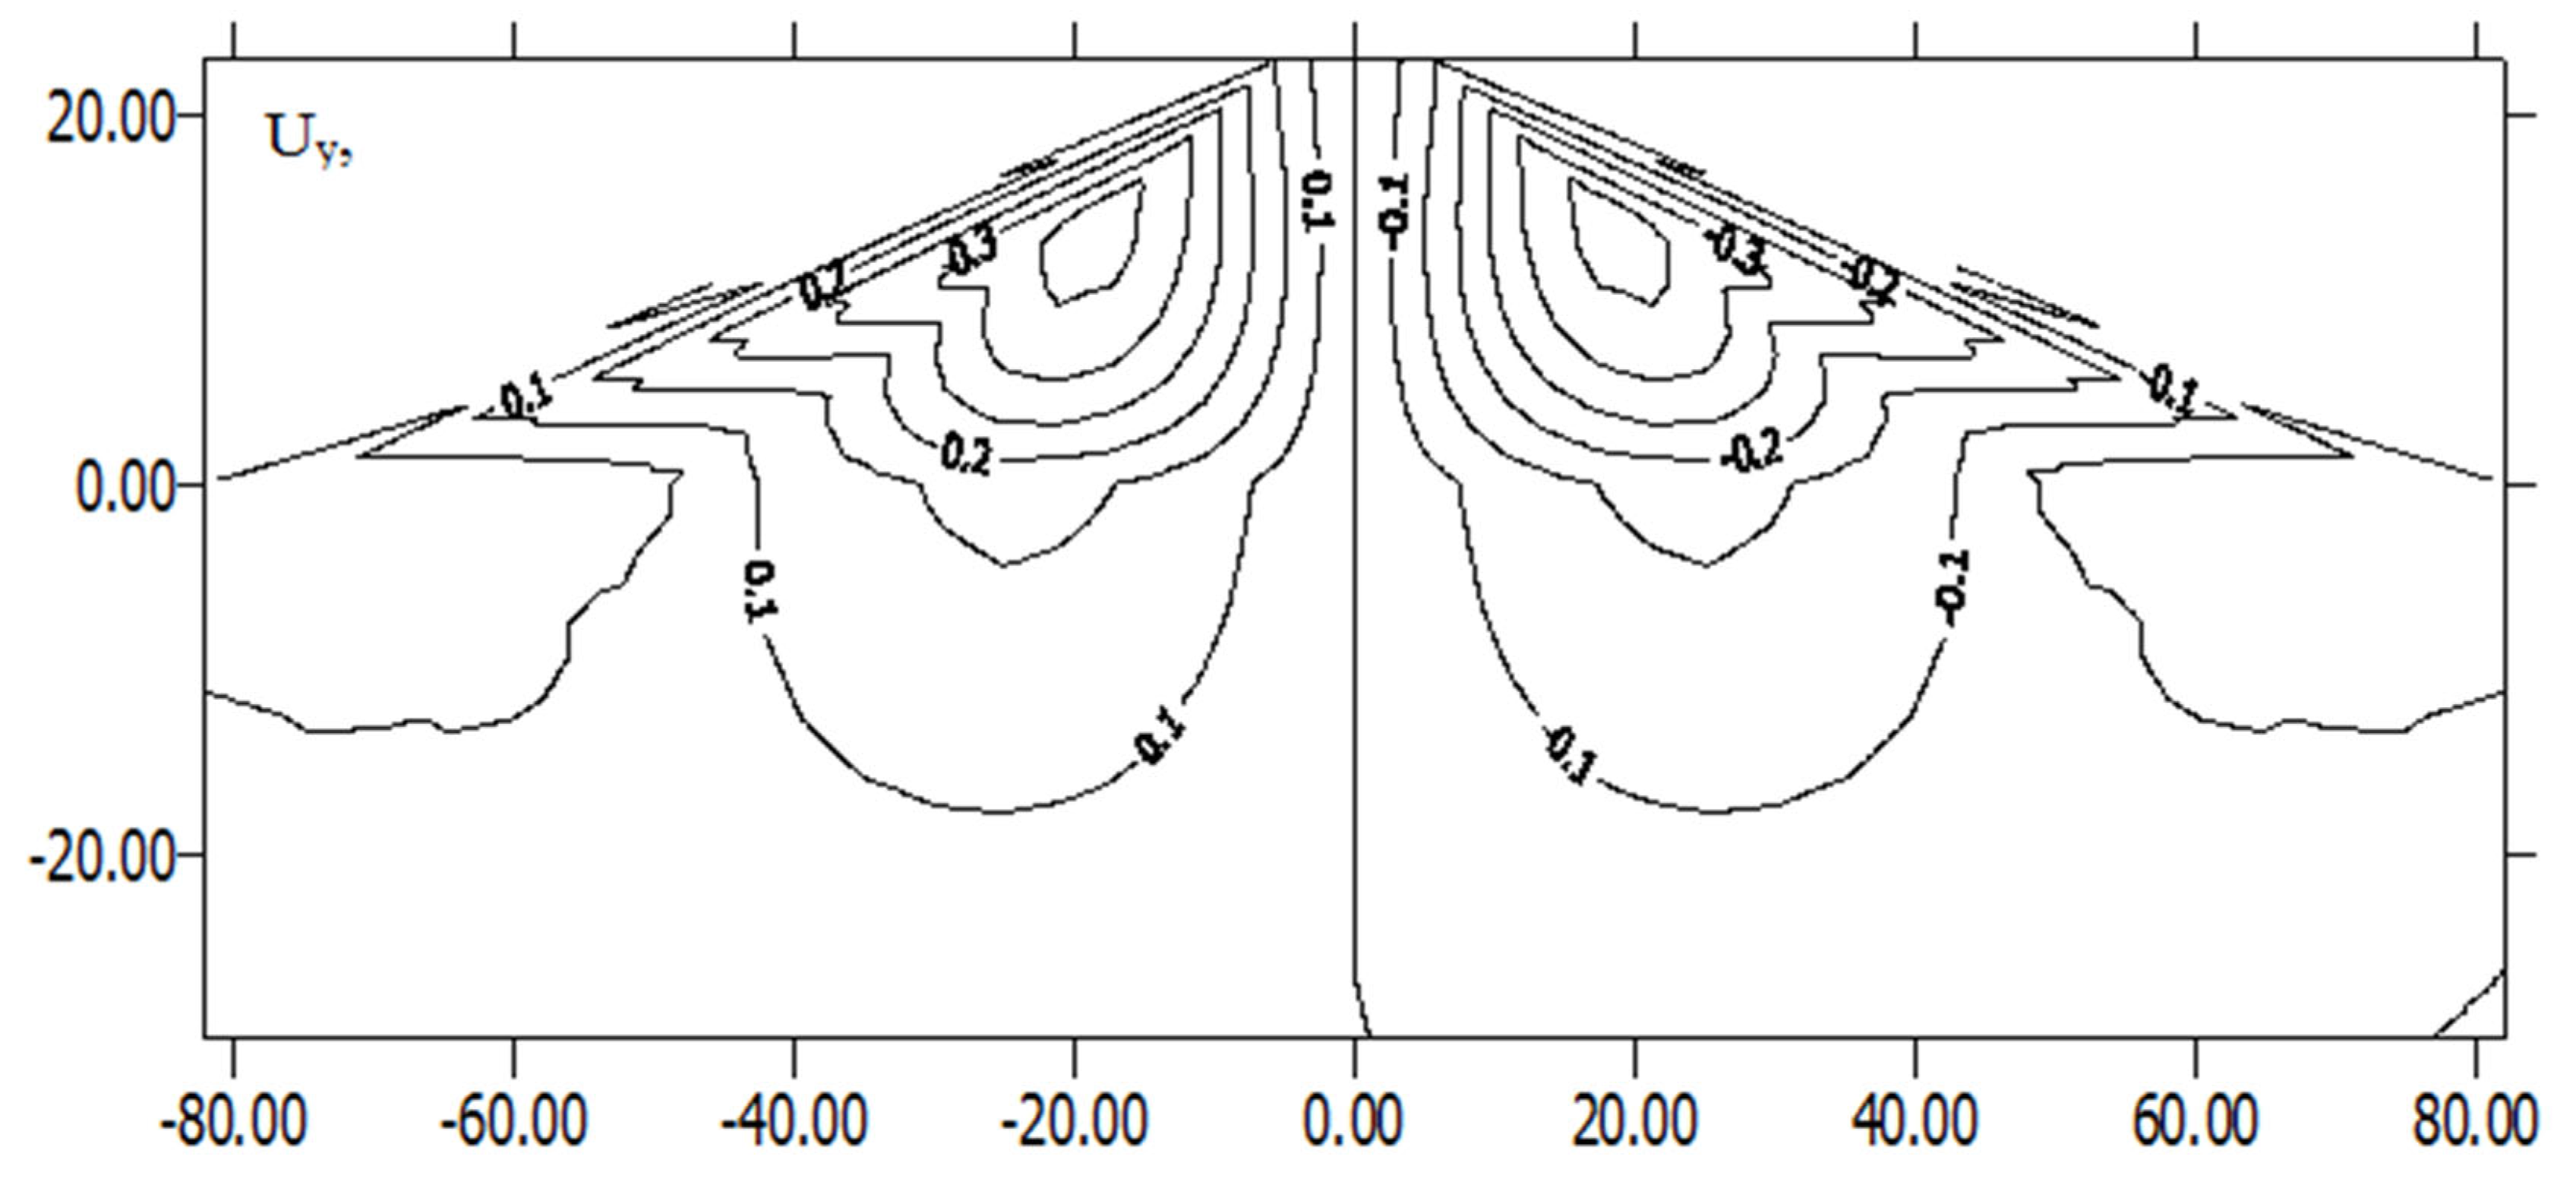
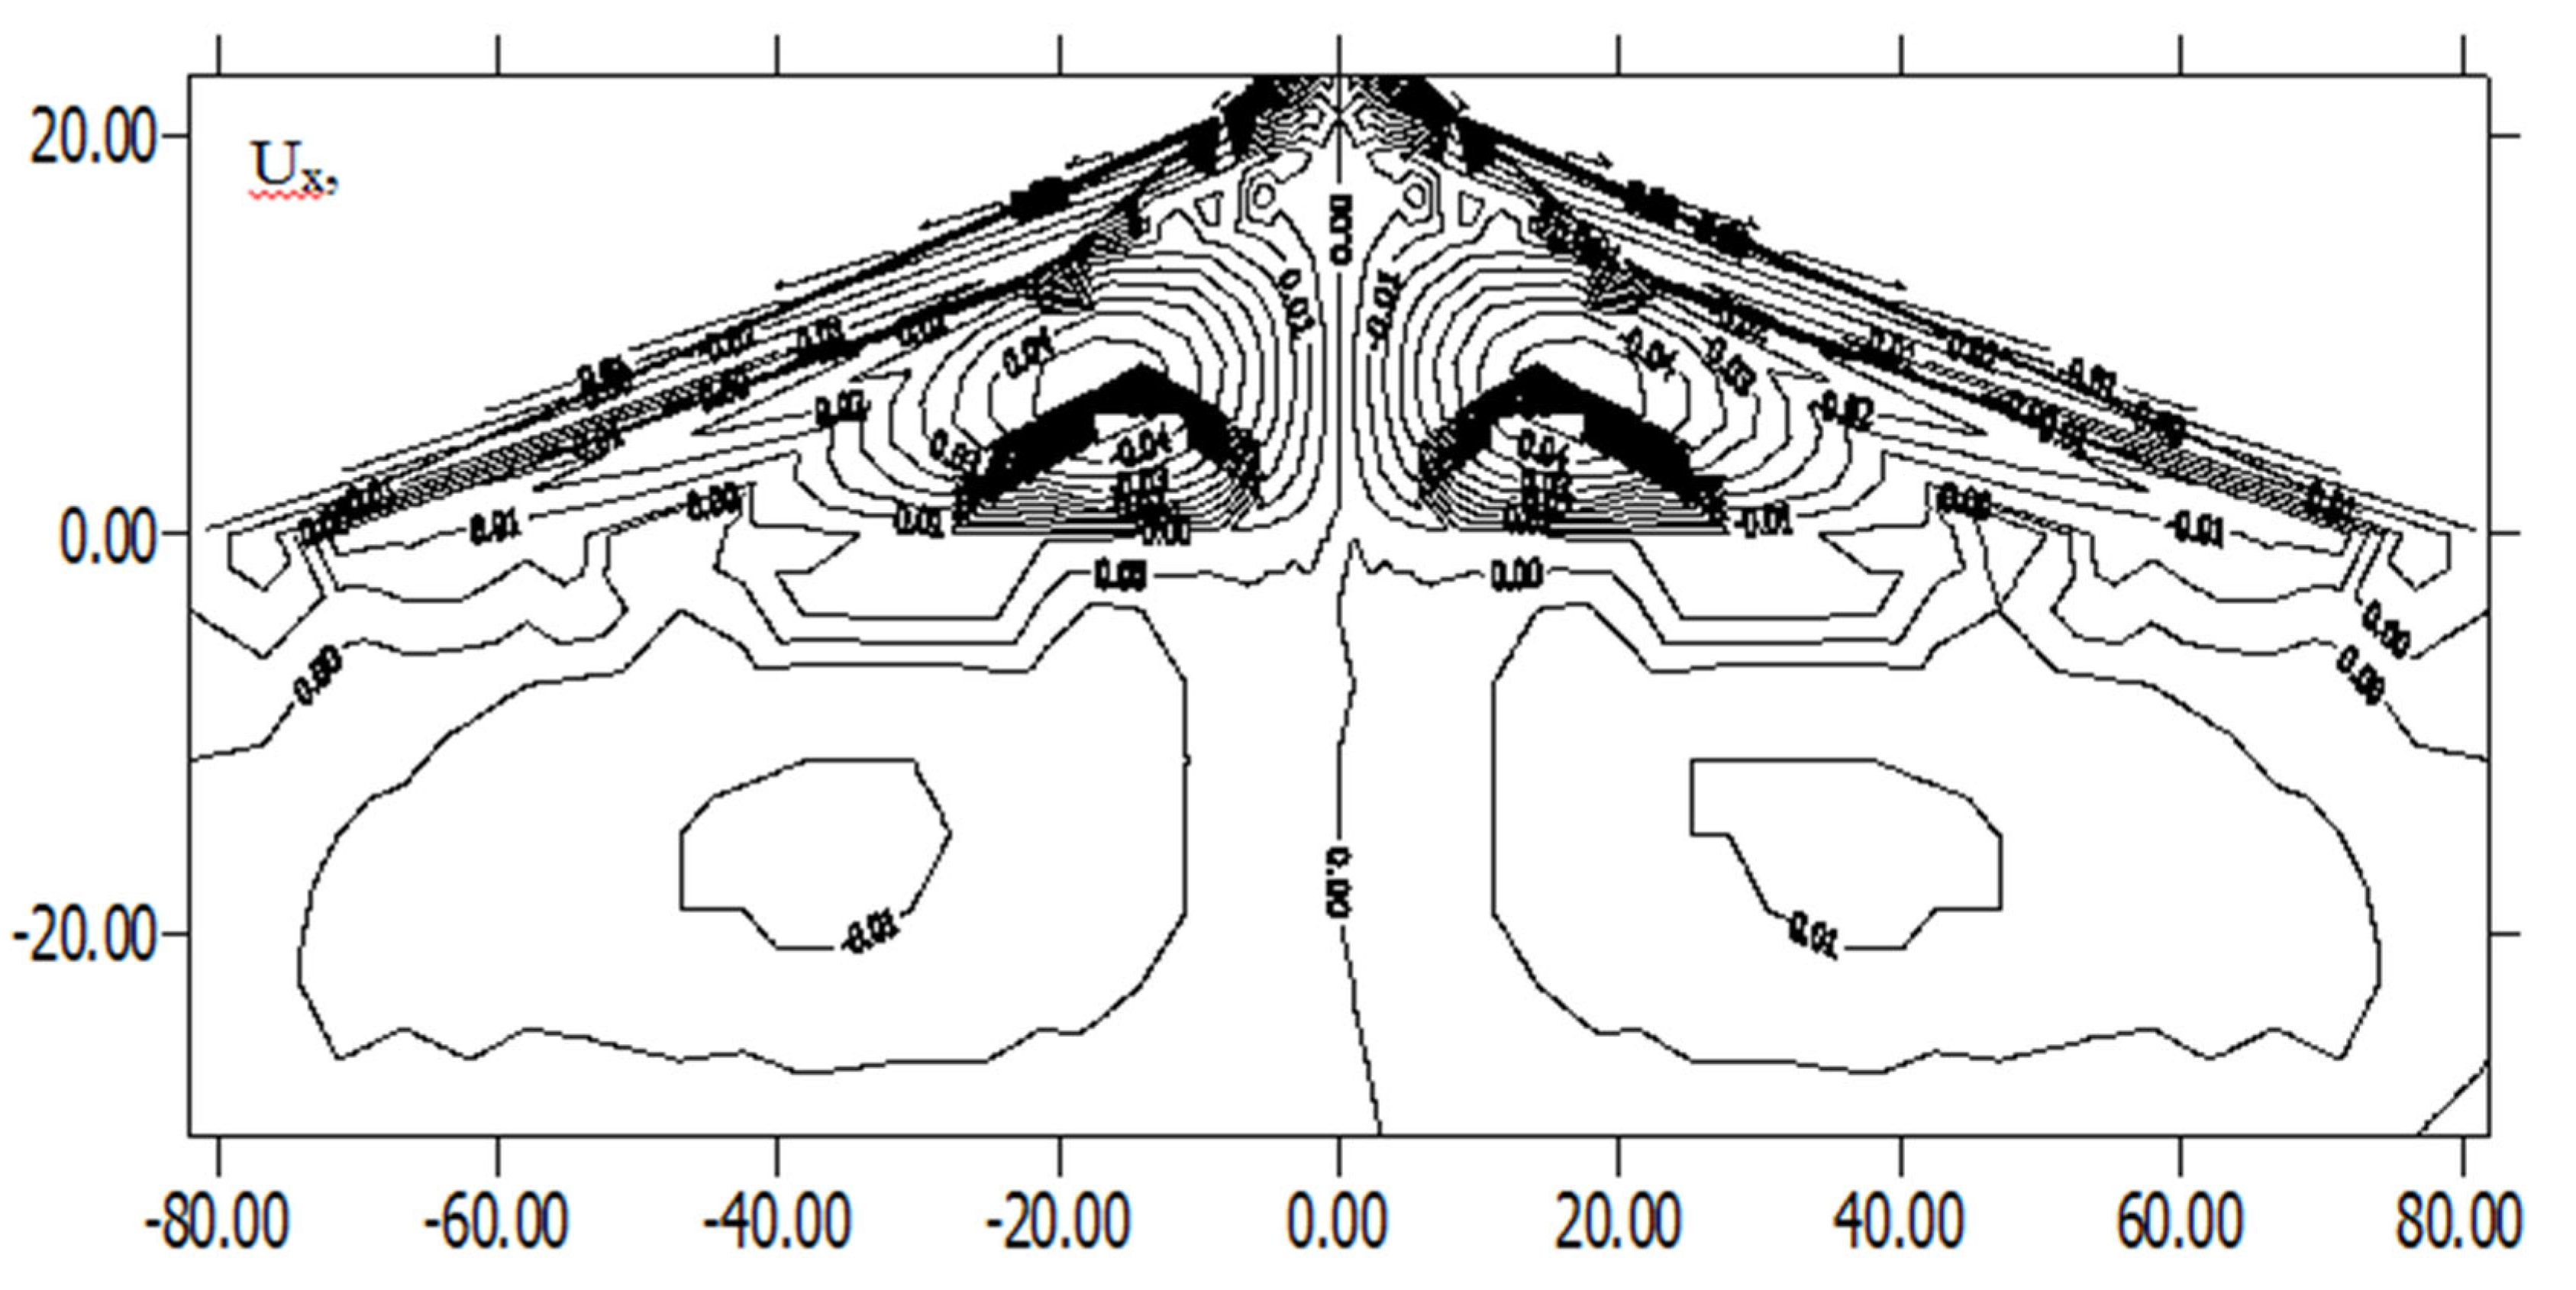
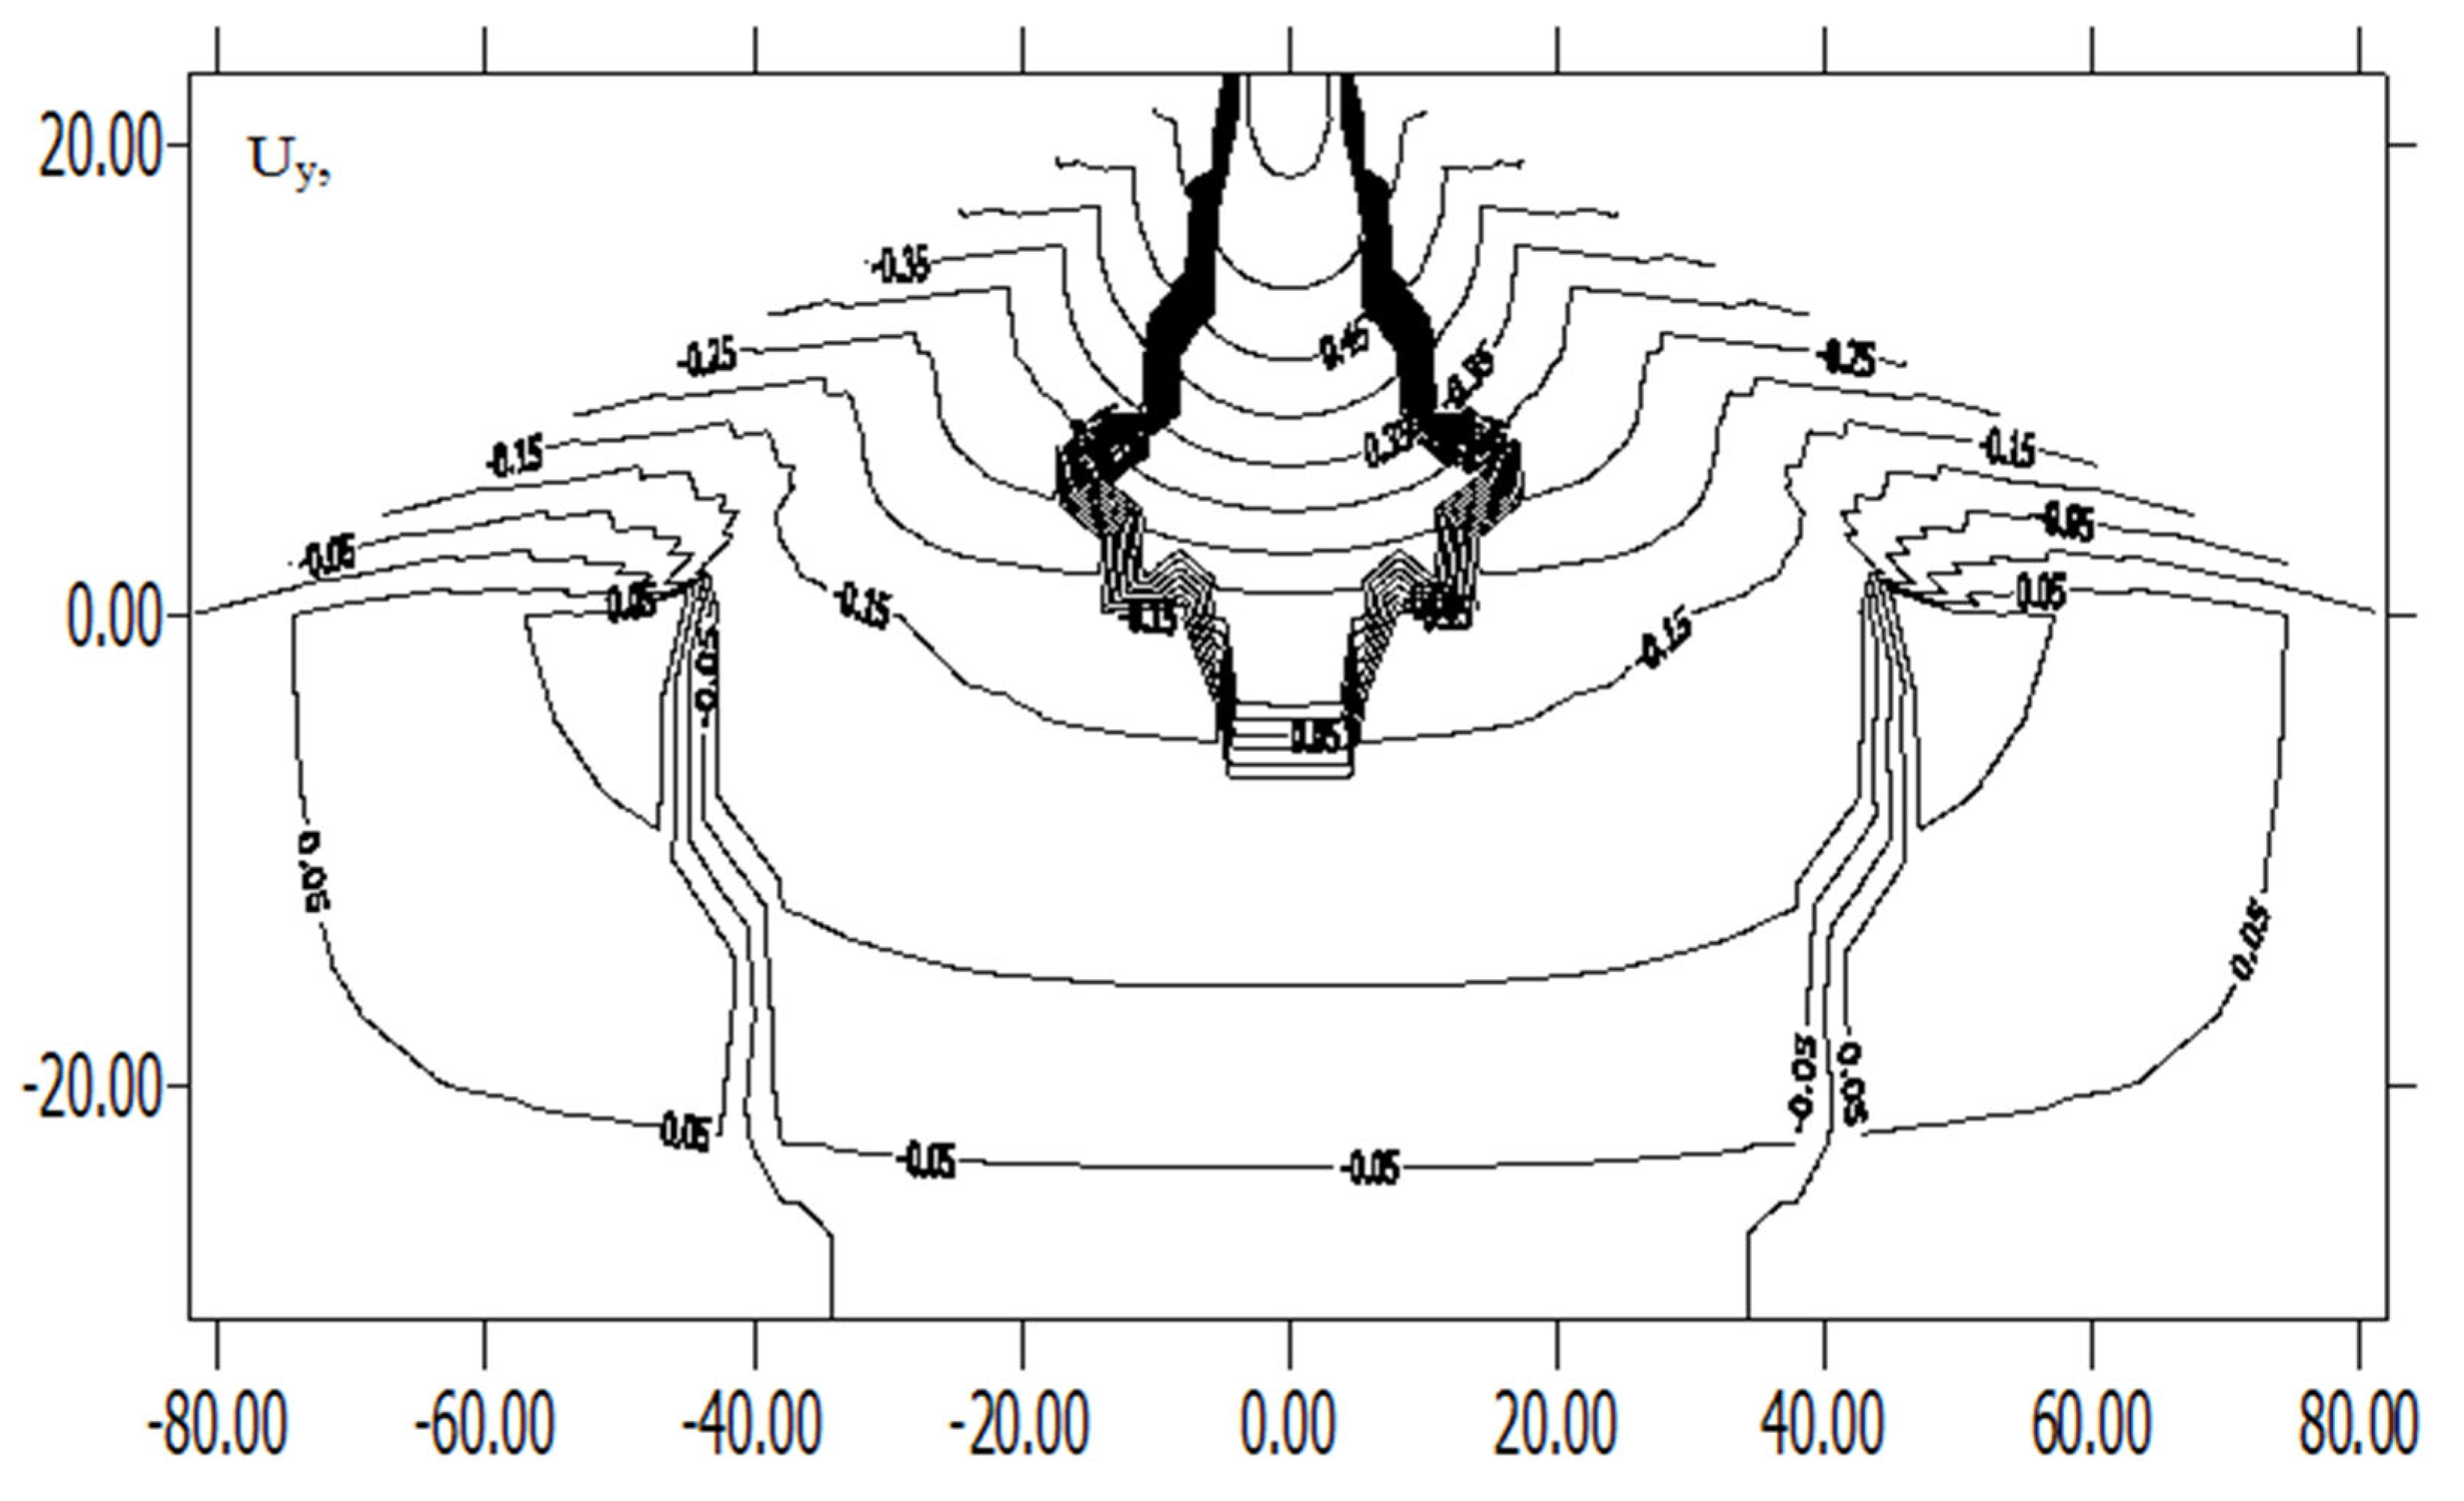
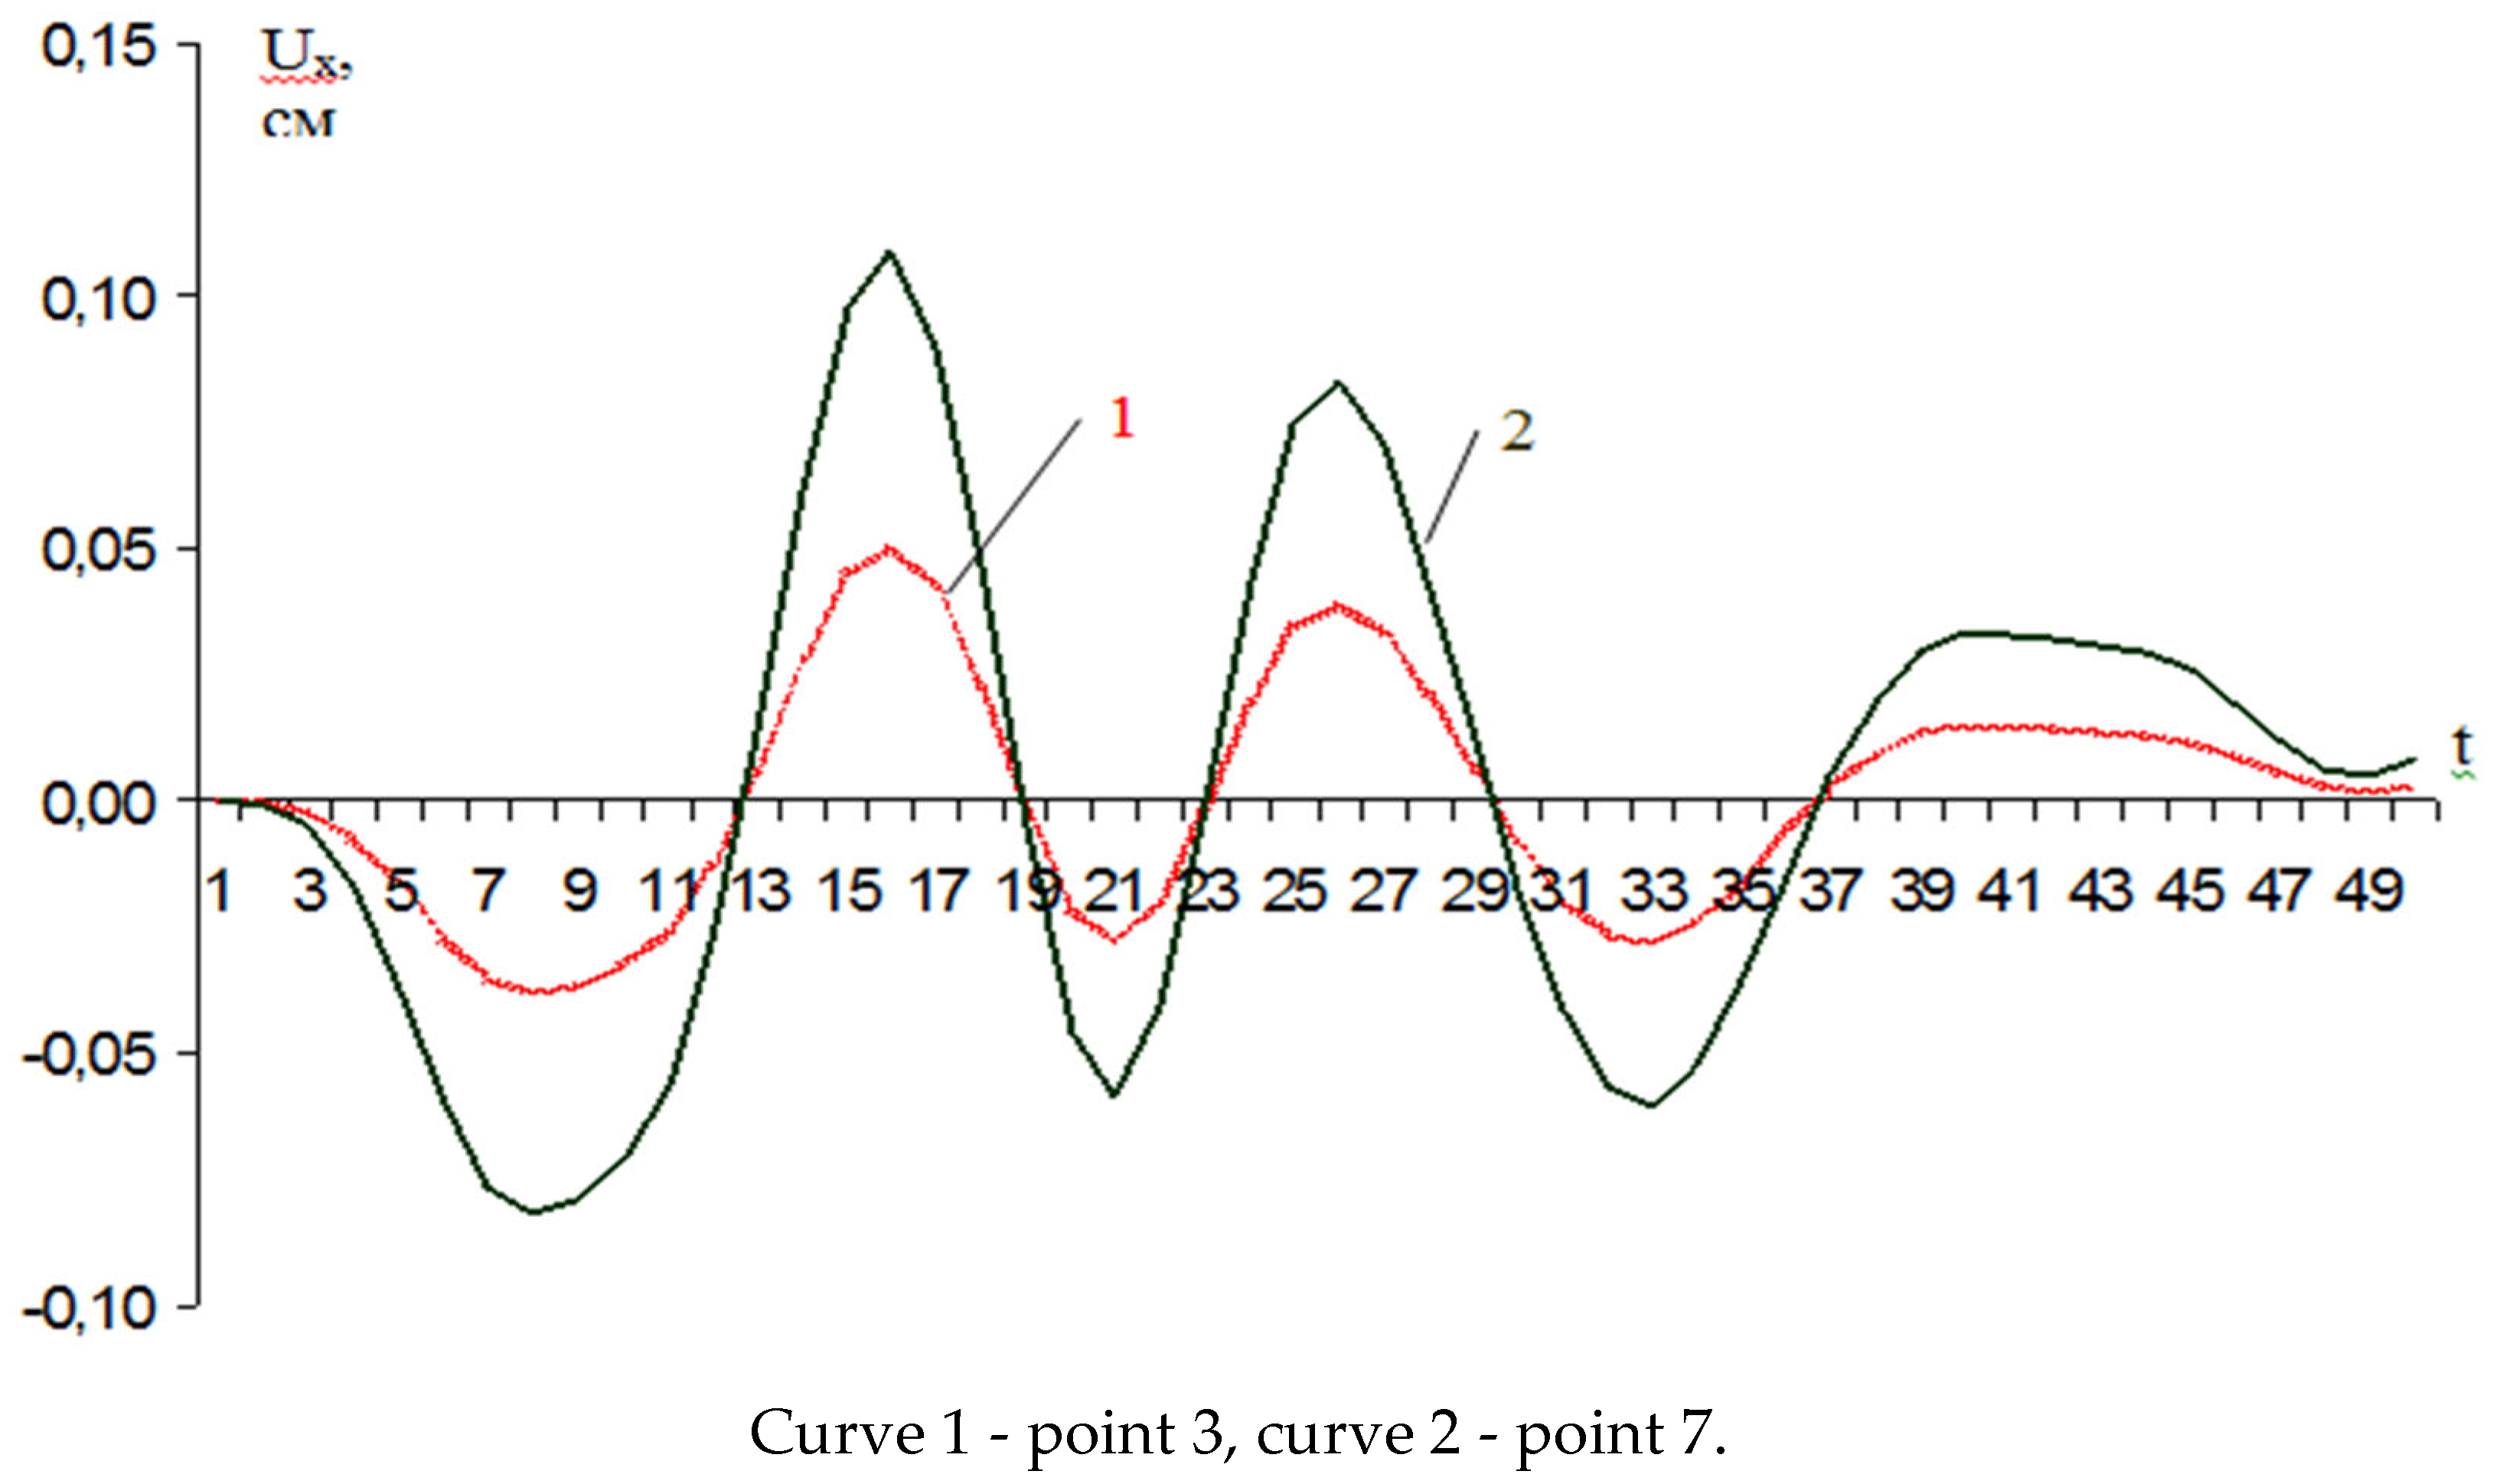
2. Problem Statement
It follows from the dispersion features of surface seismic waves that the phase velocity
c is a function of the frequency
ω. Velocity
c is the root of the dispersion equation:
Each given frequency can correspond to some finite numbers of roots
. In other words, the dependence
(or
), which is called the dispersion curve, is a multivalued function and consists of rows of branches [
12].
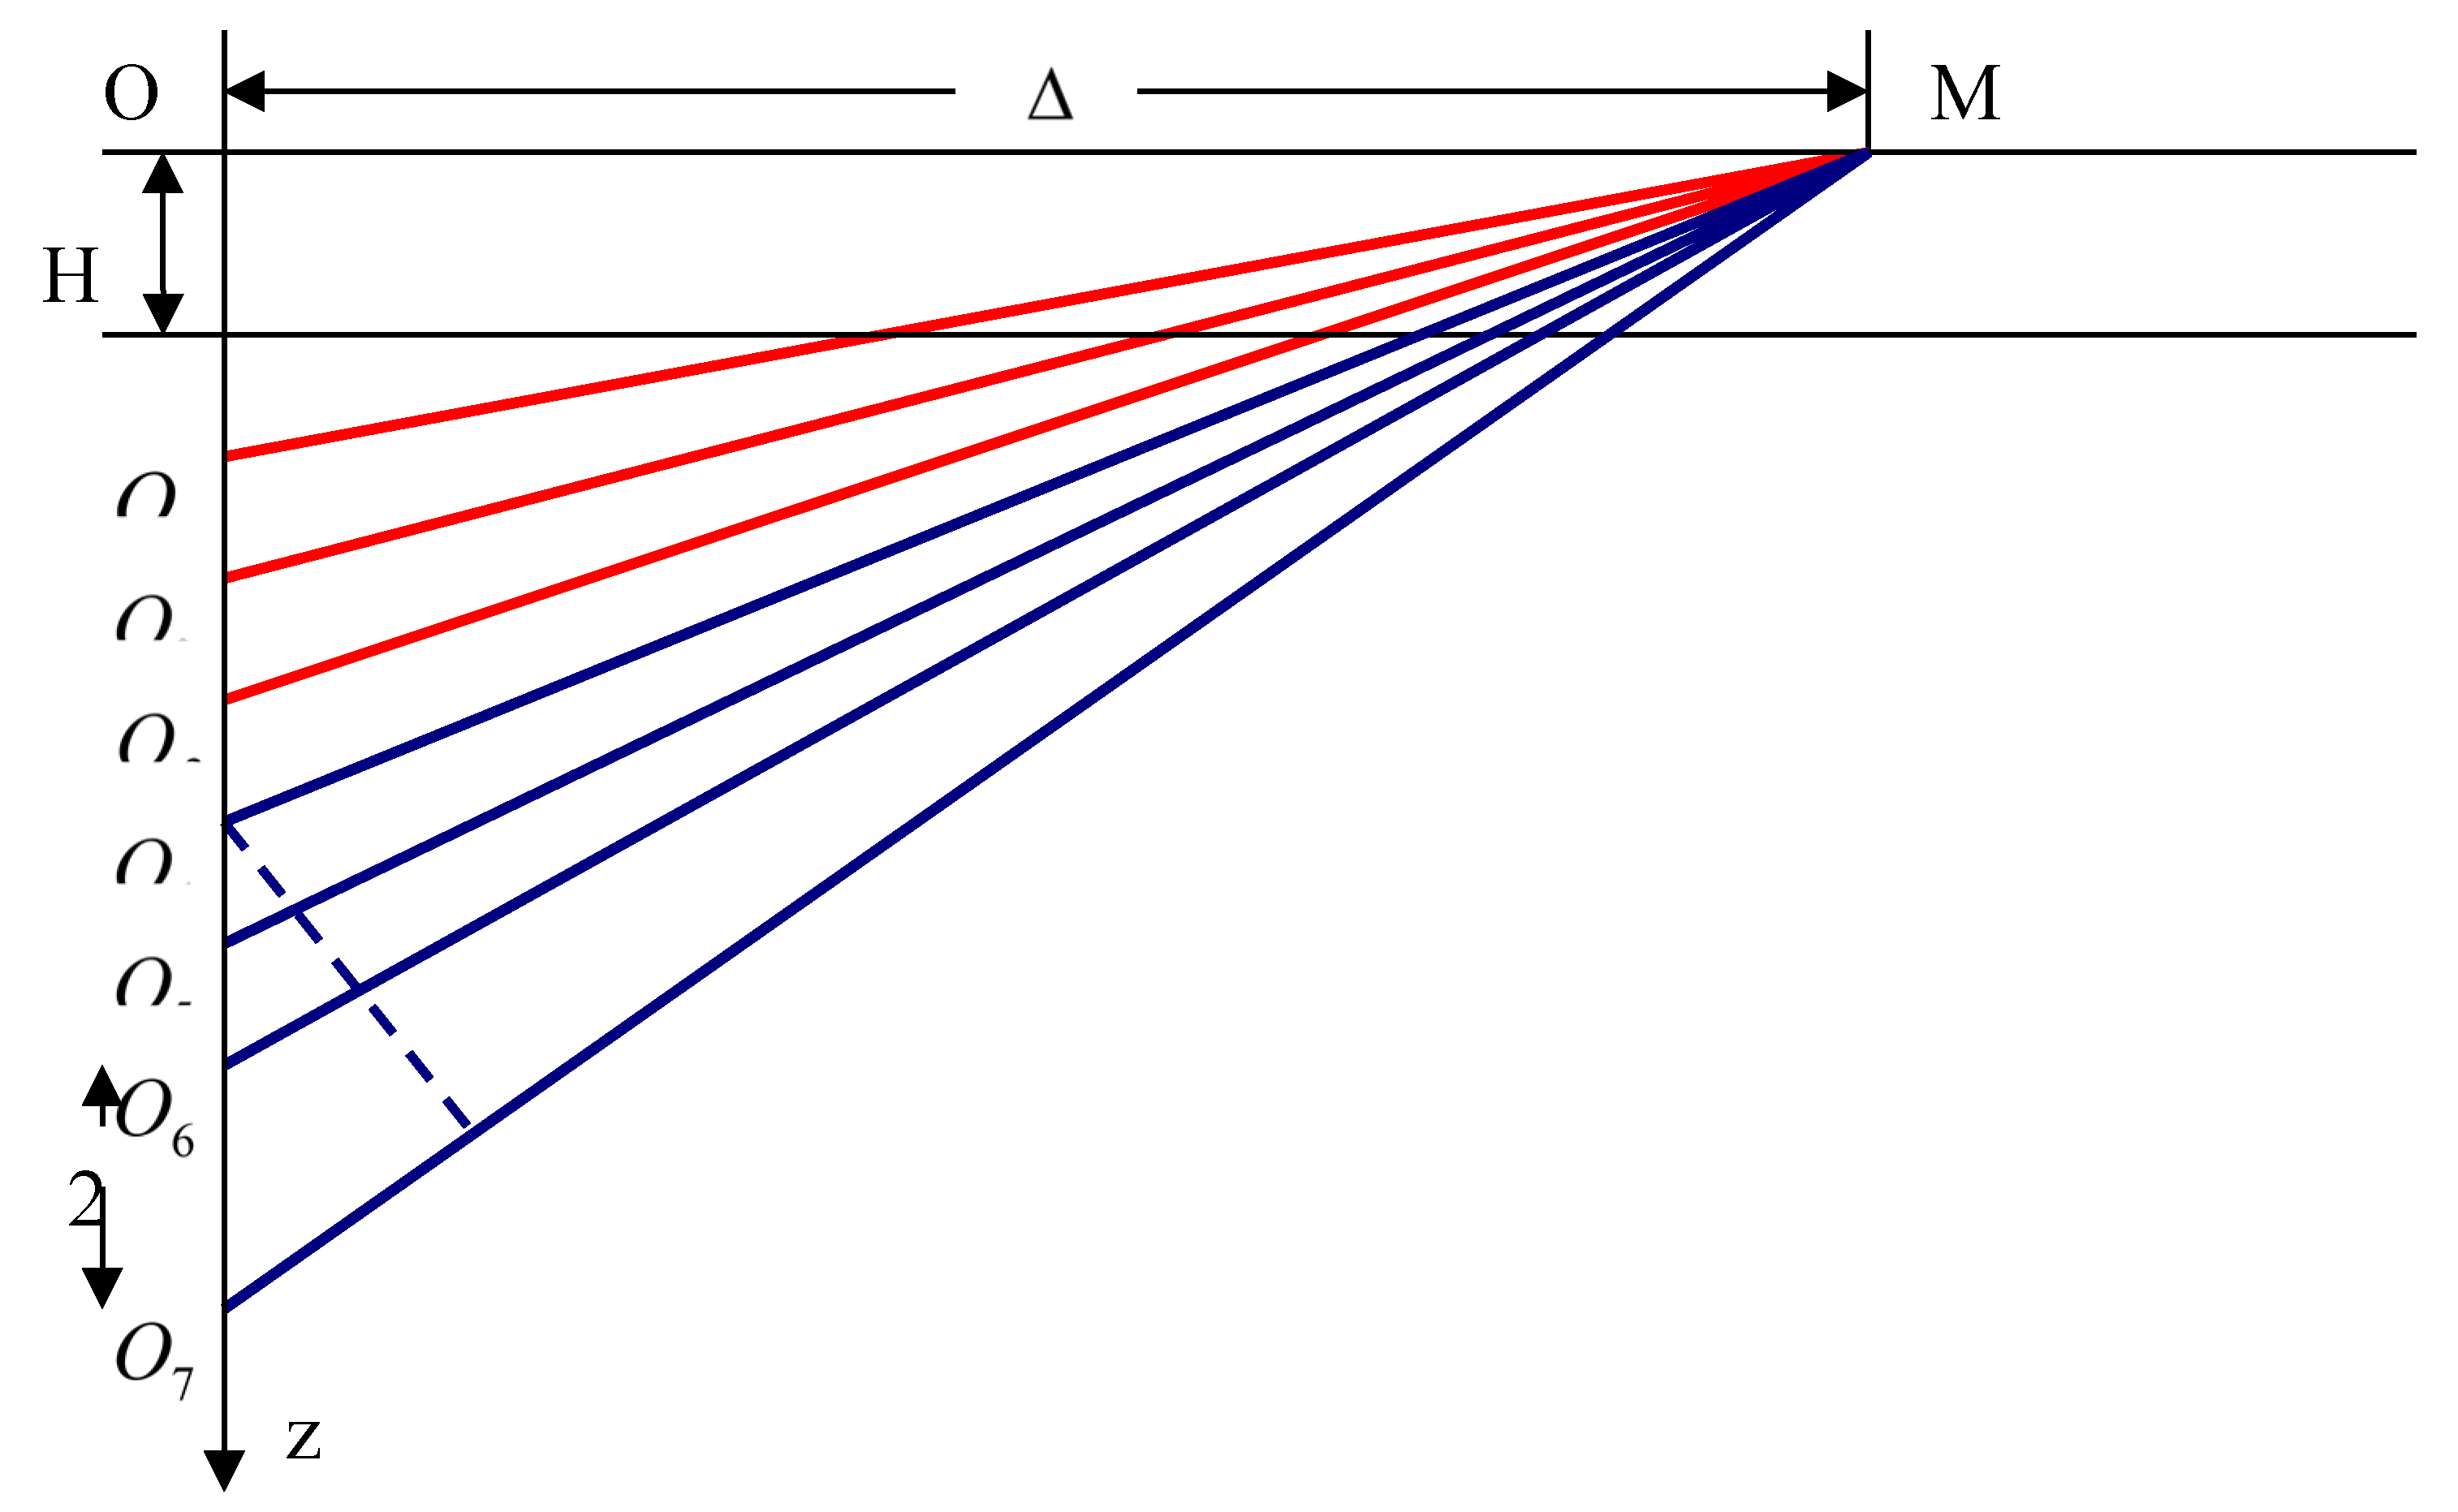
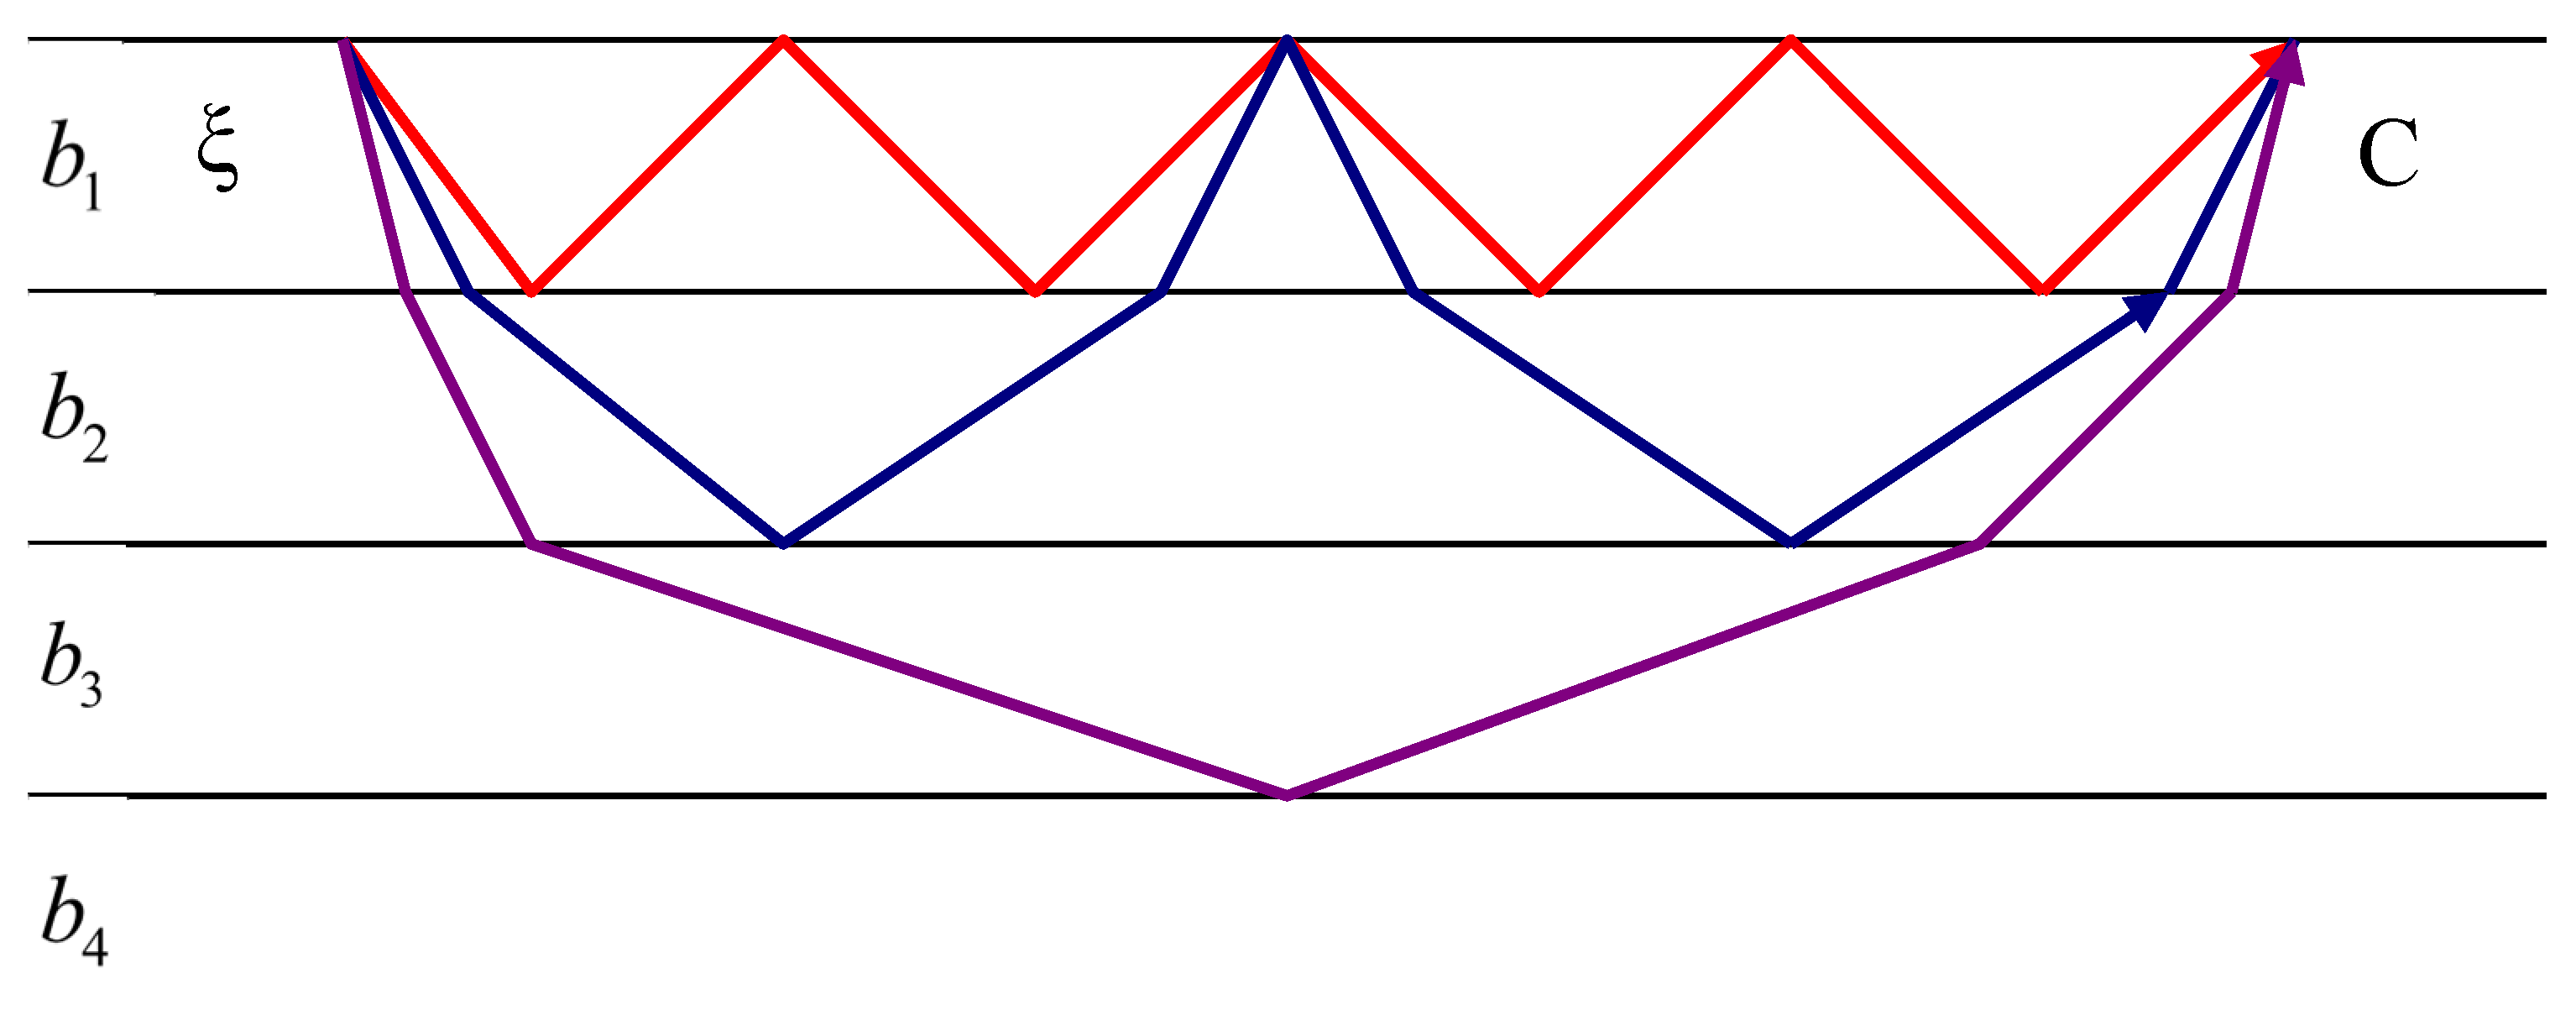
Surface seismic waves can be considered as sums of body waves experiencing different numbers of reflections from the layer boundaries (see
Figure 1). The waves reflected from the boundaries can, in turn, be considered as waves from imaginary sources located along the z axis (
Figure 2). If
, then the difference in the exit angles of rays coming from successive imaginary sources becomes very small, i.e. close beams become almost parallel.
In this case, waves from different imaginary sources are mutually amplified in certain directions, as in the case of a diffraction grating. In other words, there are such directions of propagation, characterized by angles of incidence, in which interference from nearby imaginary sources occurs in phase. Consequently, at large distances from the source (compared to the layer thickness), waves propagating with apparent velocities
[
1,
2,
3,
4,
5] will be observed. If the angle is larger than the critical one, then in the process of successive reflections inside the layer, the energy of such waves does not escape into the half-space, and the attenuation of such waves with distance is determined only by the geometric discrepancy [
13]. If the angle is less than the critical one, then with each reflection from the boundary of the half-space, part of the wave energy goes into the half-space, and these waves decay exponentially with distance from the source. They form the so-called “leaking” harmonics. The velocities
determined from the condition of in-phase superposition of waves reflected from the layer boundaries are exactly equal to those velocities that are obtained from the equation
(for Rayleigh waves formed by the interference of R and SV waves) or
(for Love waves formed by the interference of SH waves).
Figure 2.
Scheme of the formation of surface seismic waves by finding multiple reflected waves.
Figure 2.
Scheme of the formation of surface seismic waves by finding multiple reflected waves.
Unfortunately, it is not yet possible to analytically express from which values of
R /
H,
r /
λ a surface seismic wave can be considered formed (
λ - is the length of surface waves,
H - is the layer thickness,
r - is the epicentral distance). Some quantitative conclusions can be made based on the results of the work of S. Pekeris [
6], where theoretical seismograms for different
R /
H were calculated using exact formulas by numerical integration. It can be seen from them that the recording of the surface wave has a form close to that predicted by the theory at
. In other words, one can apparently assume that the surface seismic wave formed by wave interference in the layer is formed at distances
. In the case of a multilayer medium, the process of formation of surface seismic waves should occur sequentially: at distances
, waves are formed that are the result of interference in the upper layer of thickness
H1. Naturally, their dispersion will be determined only by the structure of the upper layer and the parameters of the underlying layer. At distances
, waves formed in the two upper layers, and so on. The amplitudes of surface seismic waves decrease with distance as
and, like velocity, depend on frequency. The expression for the amplitude of a non-stationary surface seismic wave includes a factor
representing the frequency response of the medium, and a factor depending on the group velocity
. These factors determine the apparent amplitude of the wave on the record at time
, but such a dependence of the wave amplitude on time and distance is valid only for such values of frequency (or, accordingly, time t) at which
is not too close to zero. In the Airy phase, the dependence of the amplitude on time and distance is different. The amplitude of the Airy phase decays with distance as
, the intensity of the oscillations is determined by the factor
, and the shape of the oscillation envelope is determined by the Airy function. Due to slower decay with distance, the Airy phase represents the most intense part of the oscillations in surface seismic waves. The mechanism of the Airy phase was studied in [
6,
7,
8,
9,
10,
11,
12]. Formulas for the frequency characteristics of surface waves in the case of a single-layer model of the earth’s crust were obtained in [
11,
13]. An important consequence of these works is that the period of oscillations, which corresponds to the minimum value of the group velocity, is in good agreement with the maximum of the frequency response, especially in the case when the earthquake source is located near the Earth’s surface. The distribution of displacements in Love waves was also studied in [
12], where it is proved that vibrations in the Airy phase region on seismograms are recorded with the maximum amplitude. In this phase, the magnitudes of the amplitudes are determined by the ratio of the stiffness of the media
, in particular, the larger this ratio, the greater the amplitude in the Airy phase at the same intensity of the earthquake. It has been established that oscillations corresponding to the Airy phase for sound waves are also characterized by large amplitudes [
6,
14]. In the works it is proved that the Airy phase is revealed by the modulated amplitude. At the moment of arrival of the Airy phase, the amplitude in the sound wave reaches a maximum and at subsequent moments of time begins to decrease, while the frequency remains constant.
In [
3], the dependence of the displacement amplitude on the frequency and harmonic number was also studied. It is shown that for a surface source the amplitudes of higher harmonics are less than the amplitudes of the fundamental tone; as the source depth increases, the amplitude of some higher harmonics is significantly greater than that of the others.
In [
15], for elementary sources such as the center of expansion, a vertical concentrated force, a fault model with a vertical rupture plane and horizontal displacement, expressions were obtained for displacements in Love and Rayleigh waves in the case of a multilayer elastic half-space.
In [
1], methods and programs for calculating the dispersion and intensity of Love waves for a vertically inhomogeneous ideal elastic half-space are described, where, using the usual method of separation of variables, non-stationary displacements in Love waves at large distances from the source are expressed in terms of eigenfunctions of the Sturm-Liouville operator. In this work, the dependence of the intensity on the frequency of oscillations, the depth of the source, and the number of harmonics is considered; attenuation of Love waves with depth; methods for constructing theoretical seismograms are indicated. In [
16], a scheme was proposed for studying surface seismic waves from an accurate source in the case of an n-layer elastic half-space.
In [
3], a general theory of surface waves excited by a seismic source in vertically and radially inhomogeneous media is given. The proposed methods are used to calculate the spectra and seismograms of surface waves, on the basis of which the calculated fields of these waves are analyzed.
The question of the influence of the duration of the action of the source on the formation of surface waves has been relatively little studied. This issue for a single-layer model of the Earth’s crust was studied in [
6]. It has been shown that surface wave displacements are very sensitive to the duration of the source.
In [
8], the amplitude spectra of the fundamental tone and the first overtone of Love waves were calculated for a two-layer model of the earth’s crust depending on the depth h and the duration of the source
r. With a fixed source, with an increase in the duration of the source, the maximum amplitudes fall on long periods.
3. Formation of Various Groups of Surface Seismic Waves
When determining the structure of the Earth’s lithosphere and upper mantle from surface seismic waves, after obtaining experimental data on the dispersion of phase and group velocities, an important step is the correct selection of a theoretical dispersion curve. At present, thanks to modern computers, it is not difficult to calculate theoretical dispersion curves for the corresponding specific models of the medium. More difficult is the optimal fitting of a theoretical dispersion curve that leads to a reliable interpretation of the experimental data.
Based on the theory [
17], it is proved that the values of the periods of the fundamental tones of the Rayleigh and Love waves, in contrast to the corresponding overtones, are not limited. However, the observed dispersion curves of the fundamental tone are of limited value. The limitation of the experimental dispersion data on the period for each harmonic of the Rayleigh and Love waves depends on a number of factors. Among them, the most significant are: the intensity of earthquakes, the depth of the source and its mechanism, the structure and absorption of the medium, the epicentral distance and the frequency response of seismographs.
Depending on the intensity and depth of the earthquake source, surface seismic waves can form in different layers of the Earth. When interpreting experimental data, it is first necessary to investigate which groups of surface seismic waves we are dealing with. In [
18,
19], various groups of surface seismic waves formed in different layers of the earth’s crust and upper mantle were discovered and experimentally studied on seismograms. Depending on the epicentral distance, a range of oscillation periods is given, which characterizes a separate group of surface seismic waves. A detailed study of these groups of waves sufficiently removes the above difficulty. However, these works do not study in sufficient detail the influence of the above factors on the formation of different groups of surface seismic waves. Such theoretical studies are very important for understanding the process of formation and propagation of surface waves in various layers of the earth’s crust and upper mantle. They, in turn, help experimenters to correctly interpret the observed materials and to select the appropriate theoretical dispersion curve for them. The methodology for such estimates is briefly described below and the range of variation of these factors necessary for the formation of various groups of surface seismic waves is given.
The method of theoretical calculations of kinematic and dynamic characteristics of Rayleigh and Love seismic surface waves is described in detail [
1,
3,
20,
21]. We present only the numerical results and their analysis.
Environment models. Let there be a system of elastic layers under the horizontal free surface z=0 lying on an elastic half-space. The interface between the layers is horizontal, and the contact between them is rigid. Each point of the medium is characterized by cylindrical coordinates r, ϕ, z. The z axis is directed vertically down. The layer thickness Hj occupies the area Zj ≤ Z ≤ Zj+1 (j - is the layer index, j=1,2,……,n, Z=0). The elastic parameters of the medium are given in
Table 1, where the following designations are introduced: МI – one-layer model (the second layer of the medium is considered as a half-space (H
2=∞), М2 – is the two-layer model (H
3=∞), М3 – is the three-layer model (H
4=∞), M4 is a four-layer model (H
5=∞), M12 is a single-layer model, which is obtained from model M2 by averaging the elastic parameters of the first and second layers. Similarly, single-layer models M13 and M14 are obtained from models M3 and M4.
Dispersion. In [
18,
19], the classification by groups of surface seismic waves was made on the basis of the layered structure of the earth’s crust and upper mantle. We will support such a classification. Surface seismic waves formed only in the first layer - the first group; if they are formed in the first and second layers taken together, - the second group, etc.
With regard to the theoretical studies of these groups of waves, the following can be preliminarily noted. If the elastic parameters of the j+1th layer are close to the elastic parameters of the
j-th layer and the thickness H
j+1 is comparatively less than the thickness H
j+2, then the corresponding j+1 group of surface seismic waves is difficult to distinguish; and if in the medium
, then in this case the dispersion equation of surface waves for the n-layer model of the medium turns into the dispersion equation for the j-layer model of the medium [
10,
21]. The fundamental tone of the Rayleigh waves is more sensitive to the structures of the medium than the corresponding tone of the Love waves; the difference in dispersion between the models for the Rayleigh waves is greater than for the Love waves. The dispersion curves for models M1, M2, M3, M4 practically coincide for periods T<8 sec; the averaged single-layer models M12, M13, M14 differ markedly in dispersion from the models M2, M3, M4 for periods T<40 sec, T<80 sec and T<100 sec.
If the filtering properties of seismographs are not taken into account, the range of observed periods is most affected by the epicentral distance, the intensity of the oscillation sources, and its depth. Let us consider the influence of these factors separately.
Epicentral distance. Surface seismic waves begin to form when the bulk wave falls at the critical angle
at the interface between the layers; when (beam incidence angle
) total internal reflection occurs, the energy is concentrated in the upper layers of the medium and does not pass into the underlying medium. The epicentral distance
at
for models M1, M12, M13, M14, when the source depth
can be calculated by the expression:
But a surface wave can be considered formed when all the conditions for the asymptotic representation of the displacement spectrum in surface waves are satisfied. These conditions are expressed as follows [
10]:
From (2), those epicentral distances were estimated (with an accuracy of the displacement amplitude up to ), beyond which () the surface wave can be considered formed. It turned out that for oscillations with a period to the left of the group velocity minimum, where there is an anomalous dispersion, this distance is always less than or equal to the distance , which corresponds to oscillations with periods to the right of the group velocity minimum, where the dispersion is normal. This is explained by the fact that for short wavelengths, conditions (2) depending on are met at shorter epicentral distances than for long waves , λ - is the wavelength. The difference between the distances and is the greater, the greater the ratio , and and , and for Love waves it is always greater than for Rayleigh waves.
Condition (2) for each layer in the M4 medium model is satisfied at different epicentral distances, and if the source intensity is favorable, body waves propagating in the M4 medium, depending on the spectral composition of the source, will form different groups of surface seismic waves.
Table 2 shows the values of
,
,
determined by formulas (1) and (2) for the fundamental tone of the Rayleigh and Love waves.
Intensity. As is known, Rayleigh and Love surface waves can be represented as a sum of individual harmonics, and the amplitude spectrum of an individual harmonic of these waves at large epicentral distances can be written as follows [
2,
3,
21]:
where
- is the wave index (
);
- is the harmonic number (
),
- is the registry components index (
);
- is the multiplier depending on the adjustable bias component [
3,
21];
- is the equipment frequency response;
- is the characterizes the attenuation of the wave with distance r and the absorption of the medium;
- is the a function characterizing the radiation spectrum of the source for each harmonic [
3,
21];
- is the source directivity function [
21].
- depends on the mechanism and duration of the source;
- for a given model of the medium depends on the mechanism of the source and on its depth.
The function
for a model of a medium that is radially inhomogeneous, almost ideally elastic, was studied in detail in [
3,
20]. In [
21], for different models of the Earth’s crust, the formation and propagation of Rayleigh and Love waves were studied depending on the depth and long-term action of the oscillation source. For models of a medium, when the elastic parameters in it increase abruptly, the spectra in the Rayleigh and Love waves split into two parts [
2,
21]. Oscillations with higher frequency spectra, for which the phase velocity
(where
for the fundamental tone of the Rayleigh wave, in other cases
), propagate mainly above the
boundary and weakly depend on the properties of the underlying medium. Surface seismic waves with lower frequency spectra (
and
) penetrate under the boundary
and their properties are determined mainly by the structure of the underlying medium. The penetration depth
and the limiting frequency
of each harmonic of surface waves can be estimated from the dispersion curve of the phase velocity and the velocity section of the medium [
3].
In the depth interval
, the intensity of surface waves, depending on the harmonic number, is characterized by several zeros (nodes) [
3,
17,
21]. For
, for all harmonics, the intensity decreases with increasing Z, according to an exponential law.
Let the source be located at different depths of the medium within
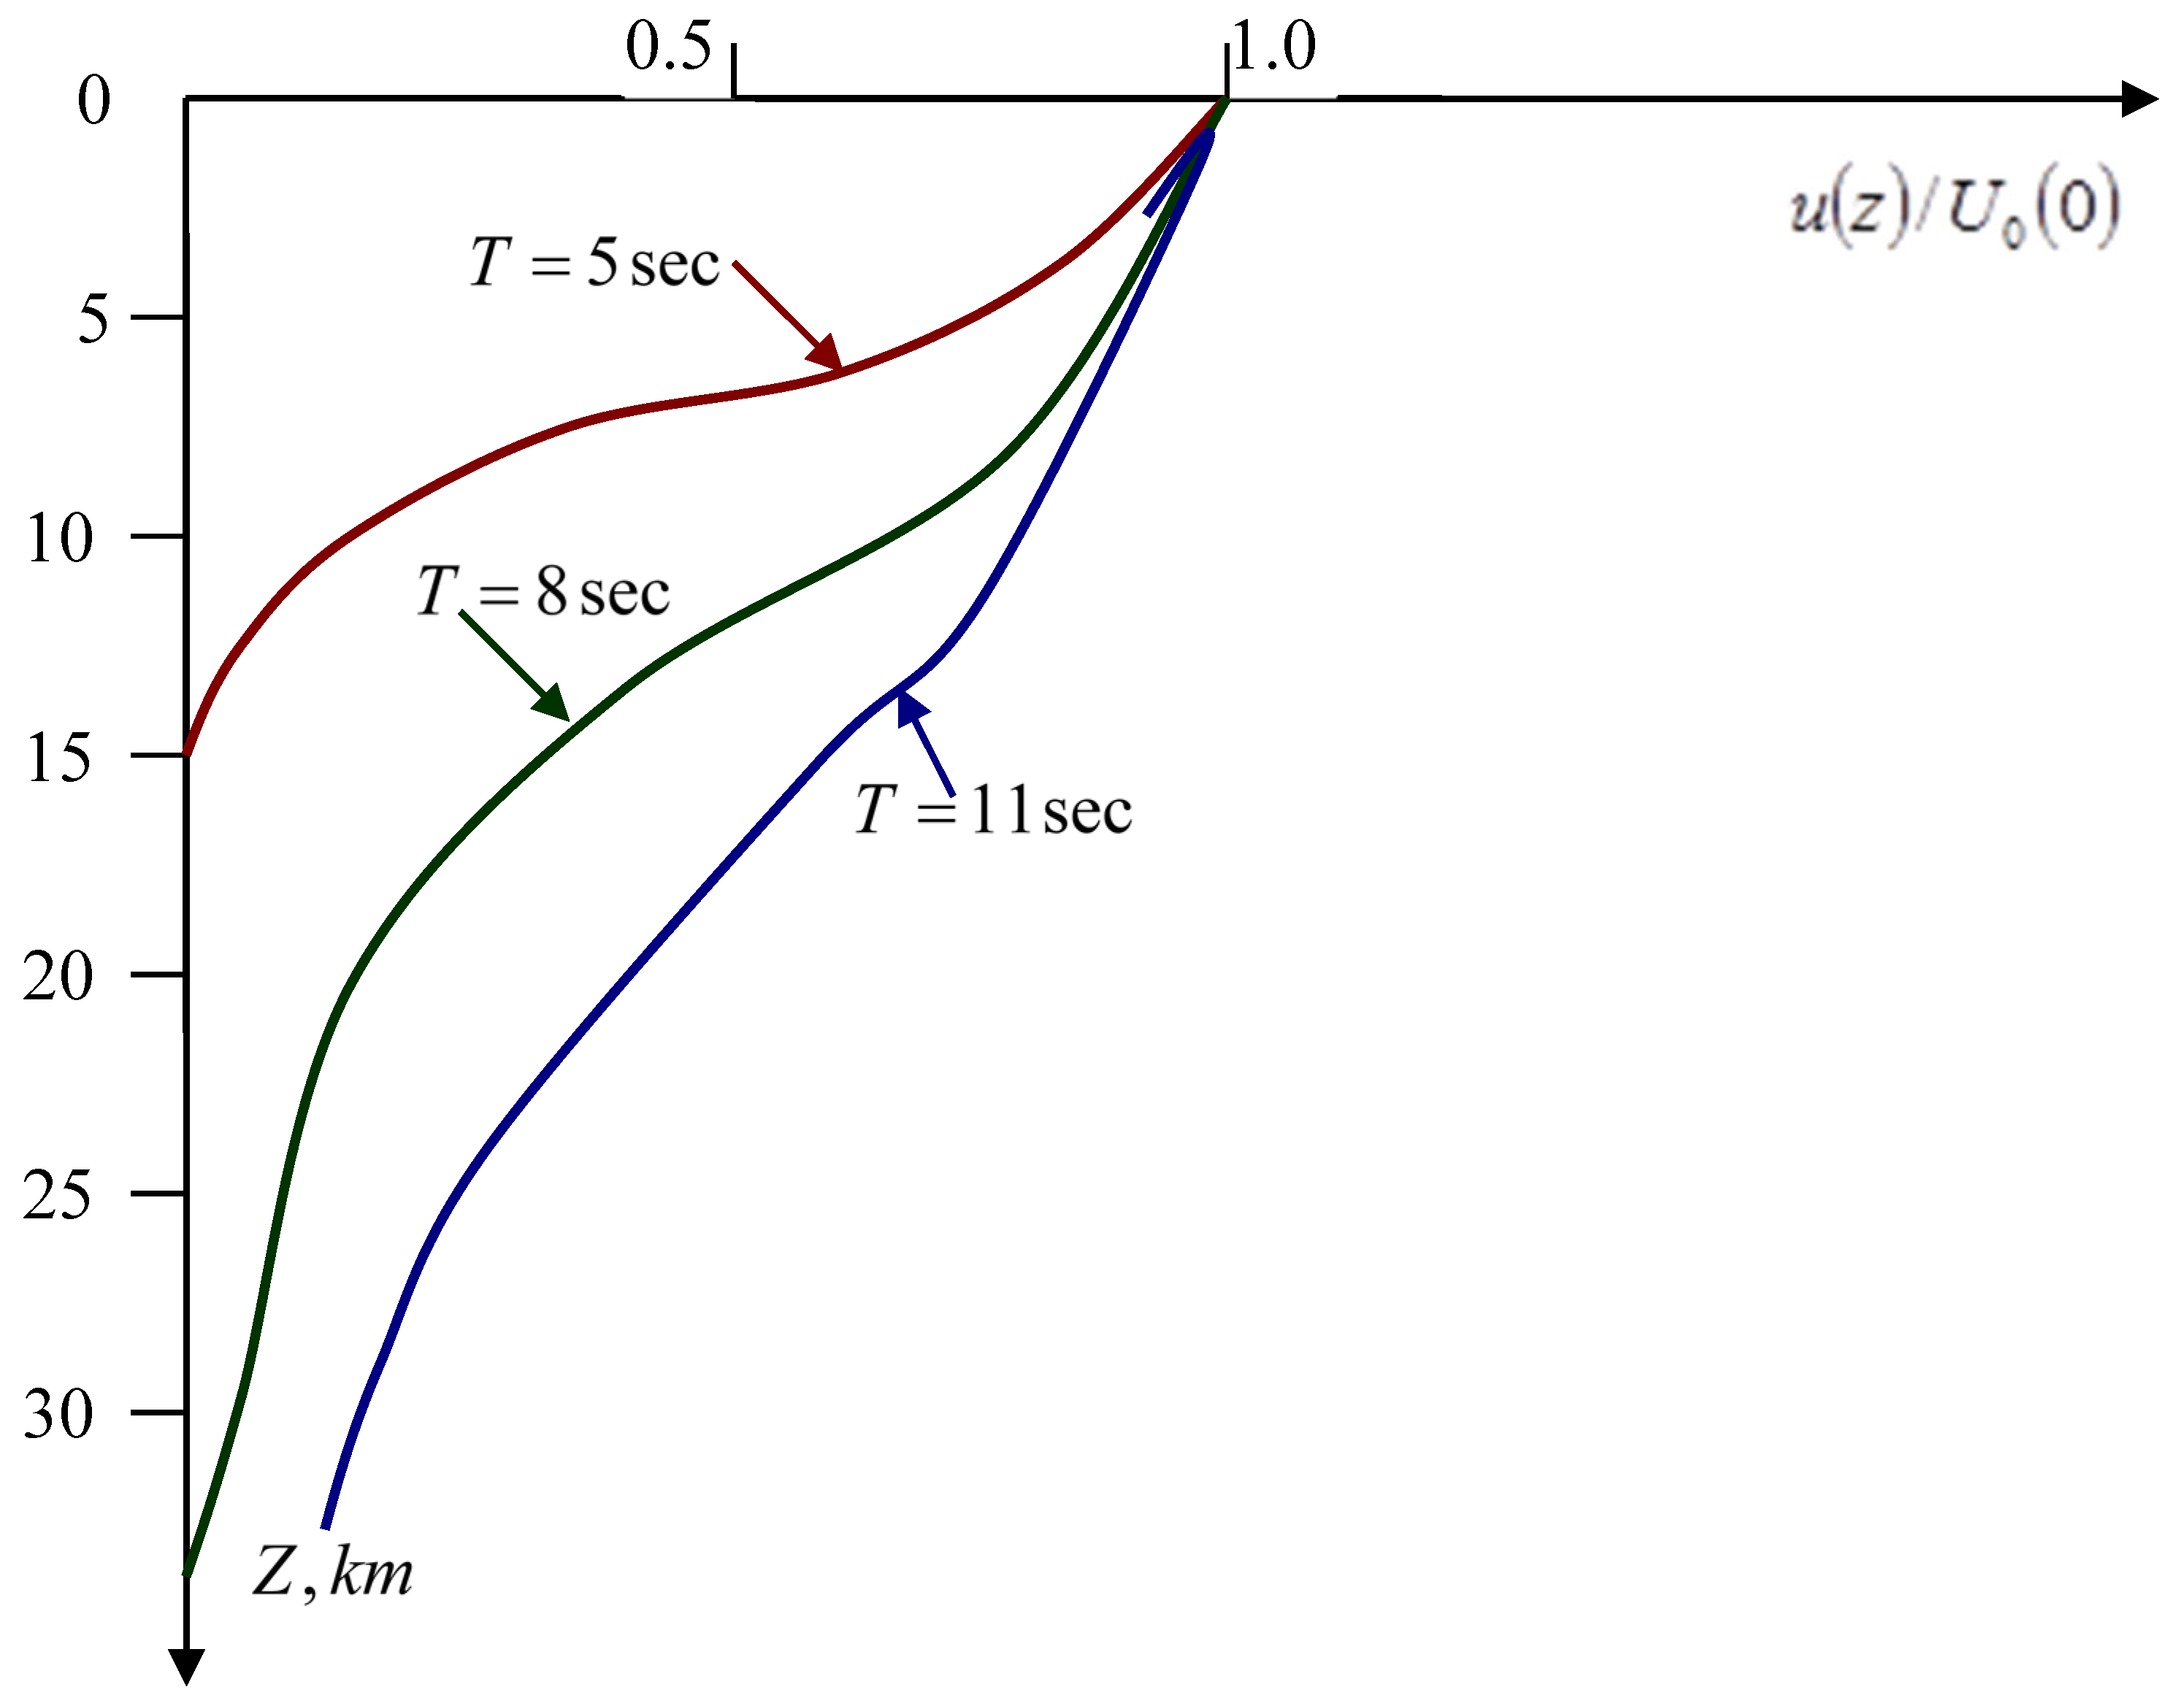
km and its time function be described by a quadratic law. The change in the intensity of the fundamental tone of Love waves with depth for three periods (T=5, 8, 11 sec) is shown in
Figure 3. The energy of oscillations in the Airy phase is almost entirely concentrated in the first layer.
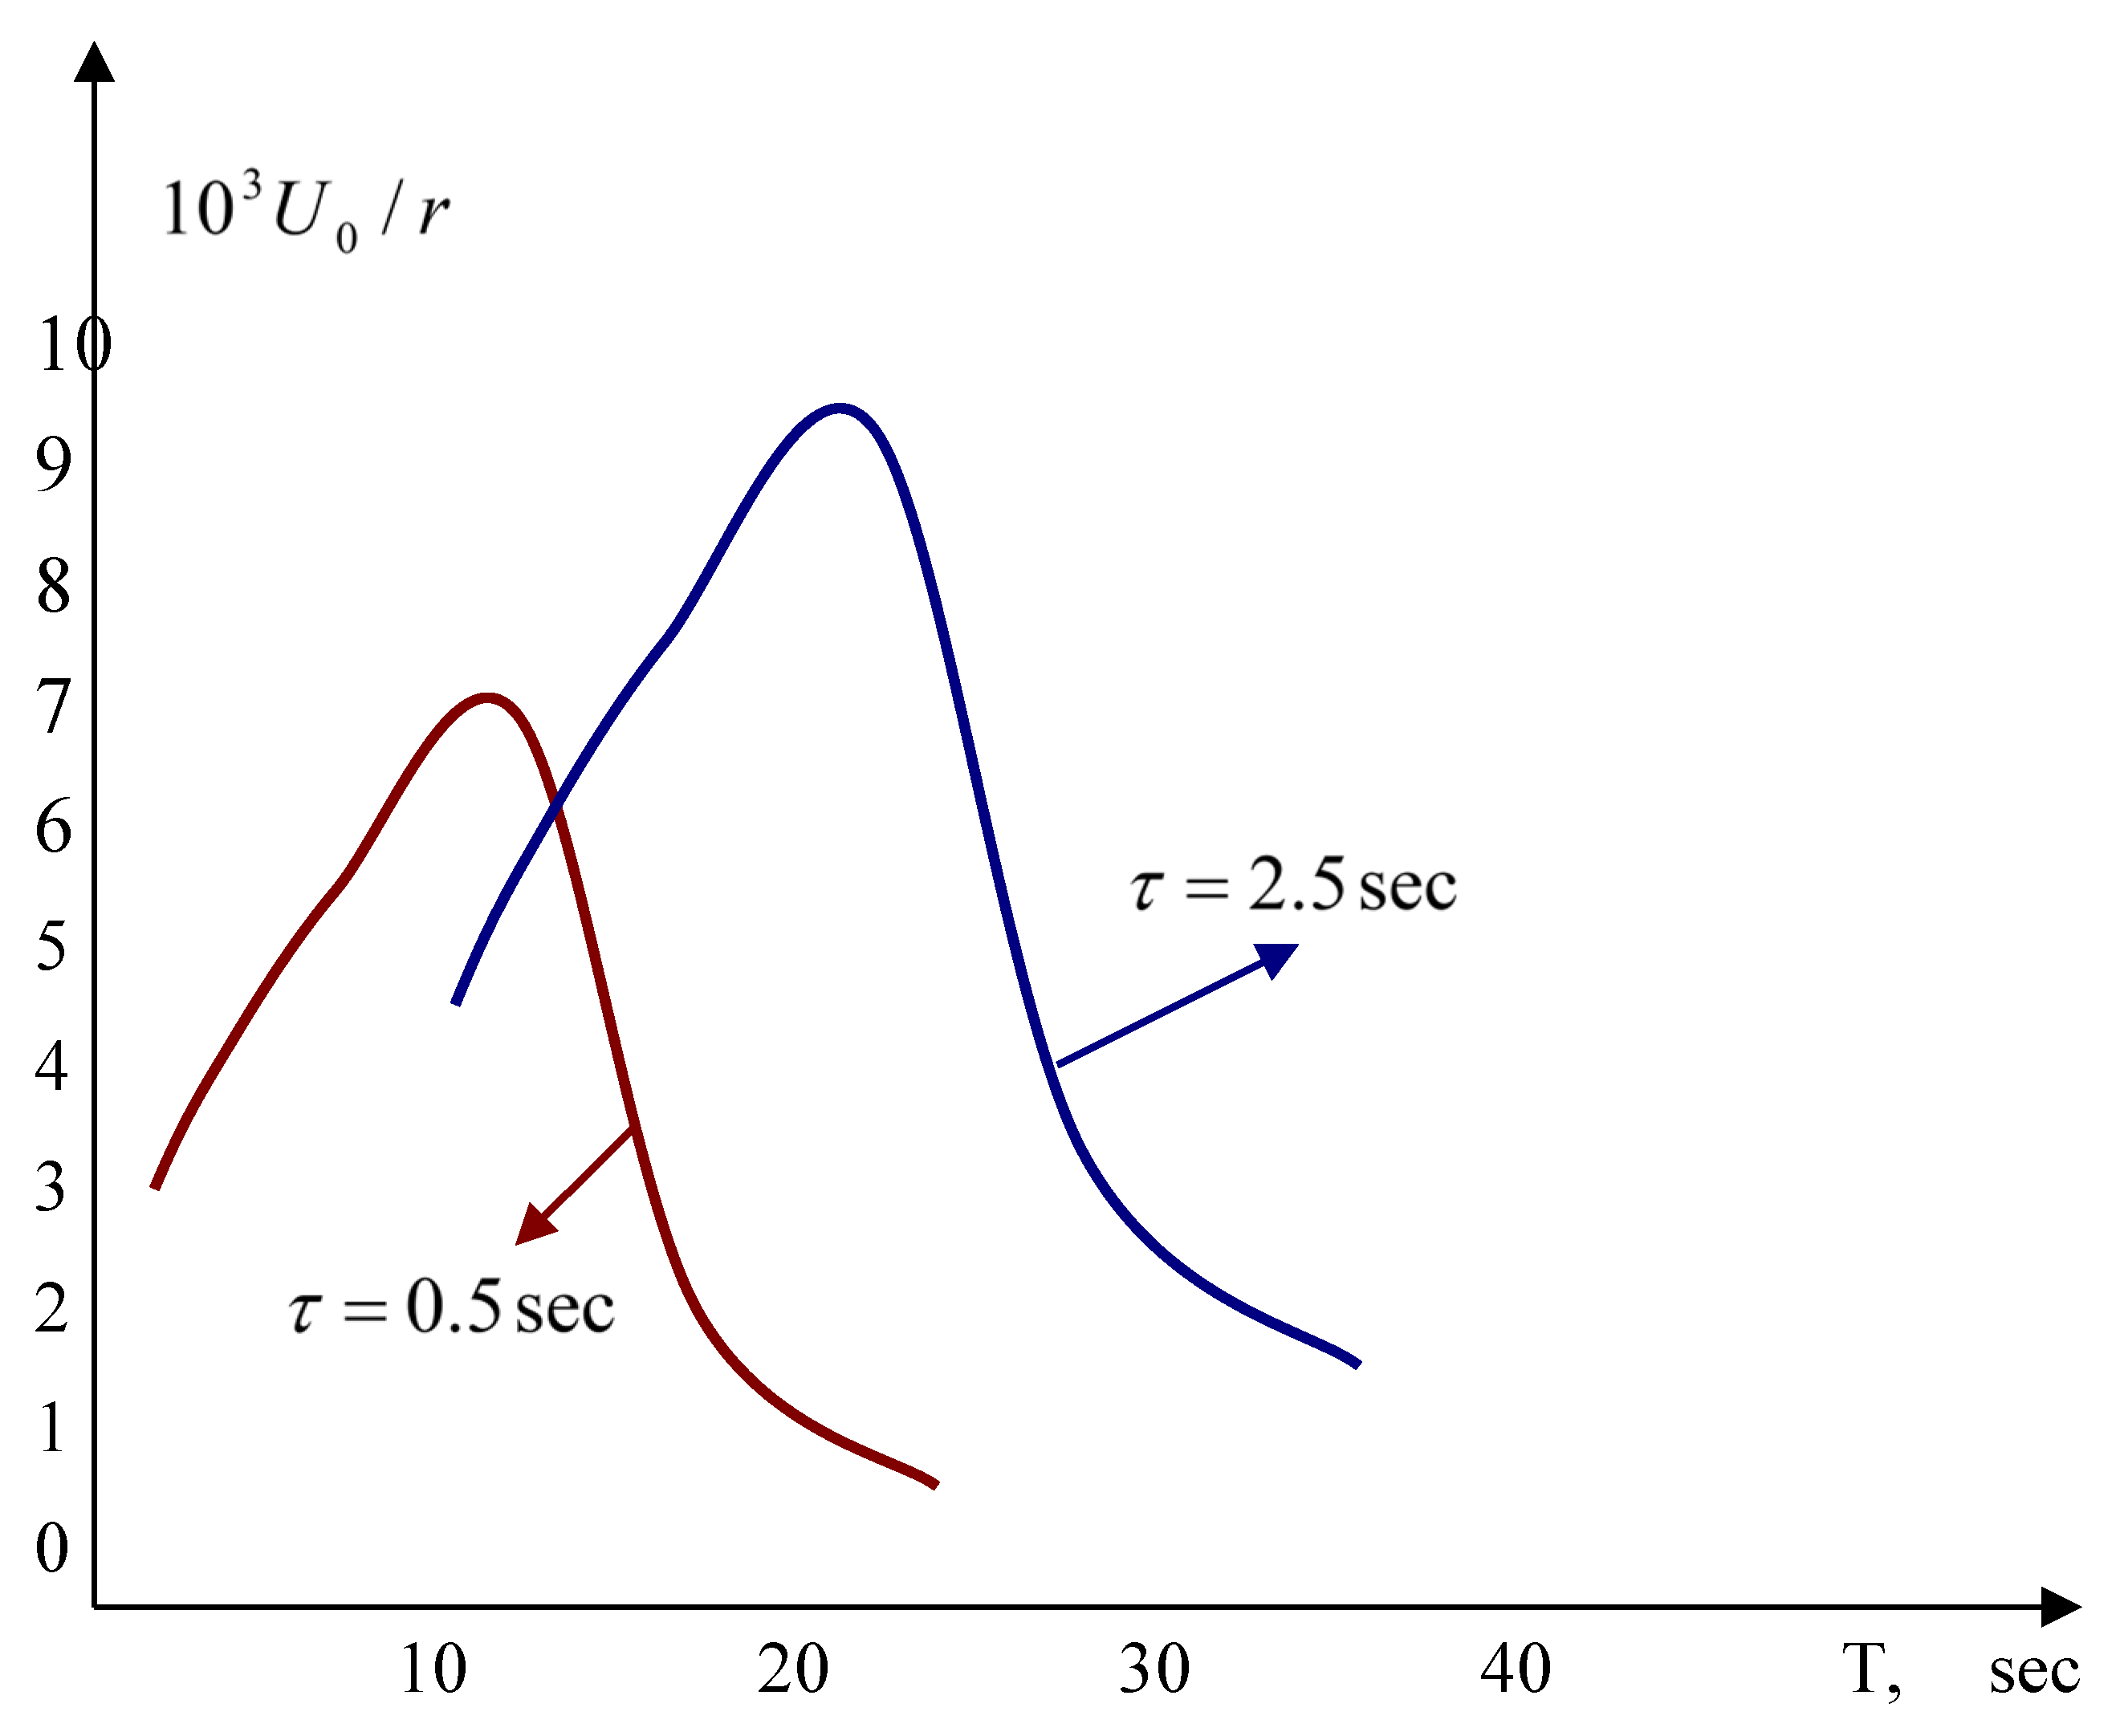
Figure 4 shows the theoretical amplitude spectra (in arbitrary units) of the fundamental tone of Love waves (for a two-layer medium model, source depth h=5 km, source type dipole with a moment, non-absorbing medium) for two cases of source duration (τ=0.5 sec, τ=2.5 sec). Curve τ=0.5 sec approximately corresponds to earthquakes with magnitude
, and curve τ=2.5 sec with magnitude
.
Figure 3 shows that at τ=0.5 sec the Love wave is dominated by oscillations with higher frequencies than at τ=2.5 sec. The same happens with weak earthquakes, when
, surface seismic waves contain low-period oscillations (T=1-15 sec), due to which all oscillations in these waves are concentrated in the first sedimentary layer. Surface waves at τ=2.5 sec contain longer-period oscillations (T=5-30 sec) and penetrate under the boundary Z
2, their properties are determined mainly by the first and second layers lying on the half-space (second group). Similarly, the formation of other groups of waves occurs.
When there is an internal waveguide in the medium model, then the above groups of surface seismic waves cannot be completely observed on the free surface, since almost all low-period oscillations corresponding to them are concentrated in the waveguide. An exception is the fundamental tone of the Rayleigh waves at the surface source [
3]. But the wave patterns of the Rayleigh waves in the model with and without an internal waveguide are quite different from each other. So the absence or incomplete existence of any group of surface seismic waves may mean that there is an internal waveguide in the medium.
Figure 3.
Change in the intensity of the fundamental tone of the Love waves with depth Z.
Figure 3.
Change in the intensity of the fundamental tone of the Love waves with depth Z.
Figure 4.
Amplitude curves of the fundamental tone of Love waves for the M2 model.
Figure 4.
Amplitude curves of the fundamental tone of Love waves for the M2 model.
As the source depth increases, the high-frequency components in the spectra decay faster than the low-frequency ones. The maximum of the amplitude spectrum shifts towards low frequencies. But this feature for different harmonics occurs at different frequencies. For small values of the parameters
τ, higher harmonics become more intense. Therefore, at a certain value of the parameters
τ and
h, the higher harmonics are more intense than the lower ones. On the other hand, for a fixed frequency, the penetration depth increases with the number of harmonics. Therefore, with a multilayer model of the medium, it may turn out that low harmonics will be formed in a smaller number of layers than higher harmonics. This is confirmed by an experimental study [
21]. It turns out that low harmonics will be formed in a smaller number of layers than higher harmonics. This is confirmed by an experimental study [
18]. harmonics will be formed in a smaller number of layers than higher harmonics. This is confirmed by an experimental study [
19]. The source mechanism also affects the spectral composition of surface waves. Special calculations for this purpose have not been carried out, but some data and results of [
20] indicate that surface seismic waves at different azimuths from the source (due to the non-uniformity of the radiation pattern) can be formed in layers of the earth’s crust with different thicknesses, containing an unequal number layers.
Thus, we can conclude that, depending on the depth and spectral composition of the source, conditions are created in a multilayer medium for the formation of various groups of surface seismic waves.
Each complex oscillation can be represented as the sum of an infinite number of harmonics:
where
- is the harmonic number,
-th harmonic,
- is the complex wave,
- is the displacement component index. In the case of a vertically inhomogeneous half-space in a cylindrical coordinate system
,
and
.
According to the well-known Fourier transform formula:
Since the spectrum is
at
, where
- is the boundary frequency of the spectrum of the
k-th harmonic and obviously:
In general,
is a complex quantity:
where the modulus of the function is called the amplitude spectrum, or the frequency spectrum is called the spectrum of the function .
Following the results of [
3], the amplitude spectrum of the k-th harmonic of the vertical component of the Rayleigh wave displacement from a point source at a depth h at a point with coordinates (γ, ϕ) has the form
:
- is the absorption coefficient,
- is the wave number,
- is the epicentral distance,
- is the source time spectrum:
- is the determines the dependence of the amplitude spectrum on the mechanism, source depth, and mutual azimuthal location of the source. Figuratively speaking, - is the frequency response of the medium for the k-th harmonic at a given depth h, source model, and azimuth ϕ.
In a particular case, when considering a point source of the double pair type (two mutually perpendicular dipoles with equal moments of different signs), equivalent to the source of a tectonic earthquake, for
we have:
where
,
,
The angles δ and β determine the directions of the forces, and α and γ - the position of the discontinuity plane, or, the same thing, the pairs of angles (δ, β), (α, γ) symmetric with respect to permutations are the parameters of the dipoles.
α is the angle of the horizontal reaction of the dipole axis with the polar axis (azimuth of the dip of the discontinuity plane); γ is the angle of the dipole axis with the vertical (angle of incidence of the discontinuity plane); δ is the angle of the horizontal projection of the force with the polar axis (azimuth of the displacement vector); β is the angle of the force vector with the vertical (angle of movement with the vertical). Between the angles α, β, γ, δ there is a connection .
The functions
,
are normalized Eigen functions of the corresponding boundary value problem when solving the equation of motion in vertically inhomogeneous media [
3]; displacement spectral amplitudes are proportional to these functions for the following types of actions:
- is the with a vertical force
,
- is the with a horizontal force
.
- is the under the action of a vertical dipole without a moment,
- is the under the action of a horizontal dipole with a moment, with a horizontal discontinuity plane
,
,
where ϕ is the azimuth from the epicenter to the station.
Thus, to calculate the theoretical spectra of Rayleigh surface waves, first of all, it is necessary to calculate the eigenvalues and Eigen functions of the boundary value problem solved in [
3], as well as the quantities and functions associated with them for a given model. After that, the task itself is solved, i.e. the amplitude and phase spectra of the Rayleigh wave are determined for a given source model and the position of the recording device. The calculations were carried out according to the program described in [
21], in which the initial data were:
Environment Settings
The environment is divided into n layers. The longitudinal and transverse wave’s velocities, as well as the density, are linear functions of depth within the layer and can tolerate a discontinuity at its boundaries. The medium below the layers is a homogeneous space.
The calculation is made for harmonics with successively increasing numbers . The main tone has the number k=0.
The program calculates phase and group velocities, spectral amplitudes of the vertical displacement of the free surface , under the influence of horizontal and vertical forces concentrated at the depth , their depth derivatives , and the ratio of the displacement components on the free surface.
Now let’s proceed directly to the calculation of the amplitude spectra of Rayleigh waves for a given source model, directivity and position of the recording device.
The input data of the program described in [
17] are the values of the wave numbers and periods of the Rayleigh wave, which were obtained using the program [
16], as well as the moduli of the source radiation function
and the absorption coefficient
. Two more programs described in [
3] were used to calculate the last two quantities. In particular, the definitions of the radiation function of the source - a double dipole for Rayleigh waves were made according to formula (8). At given angles α, β, γ, δ, ϕ (ϕ - azimuth from the epicenter to the station), wave numbers, spectral displacement amplitudes and their depth derivatives
,
for one value of
- source depth - the modulus and argument of the radiation function
are calculated.
To determine the absorption using the program “Calculation of Rayleigh wave absorption”, arrays of velocities of longitudinal and transverse waves (velocity section of the medium), derivatives of the phase velocity with respect to the parameters of the section, group velocities, periods and wave numbers [26], as well as the values of the quality factors in the layers , ( they are used to calculate the absorption coefficient and the values for given distances).
The time function of the source for calculations had the following form:
Such a function describes a transient process in the source, lasting τ sec, with a smooth start of discontinuity and a smooth stop (the function dF/dt is everywhere continuous). Duration τ was taken equal to 3, 5 sec.
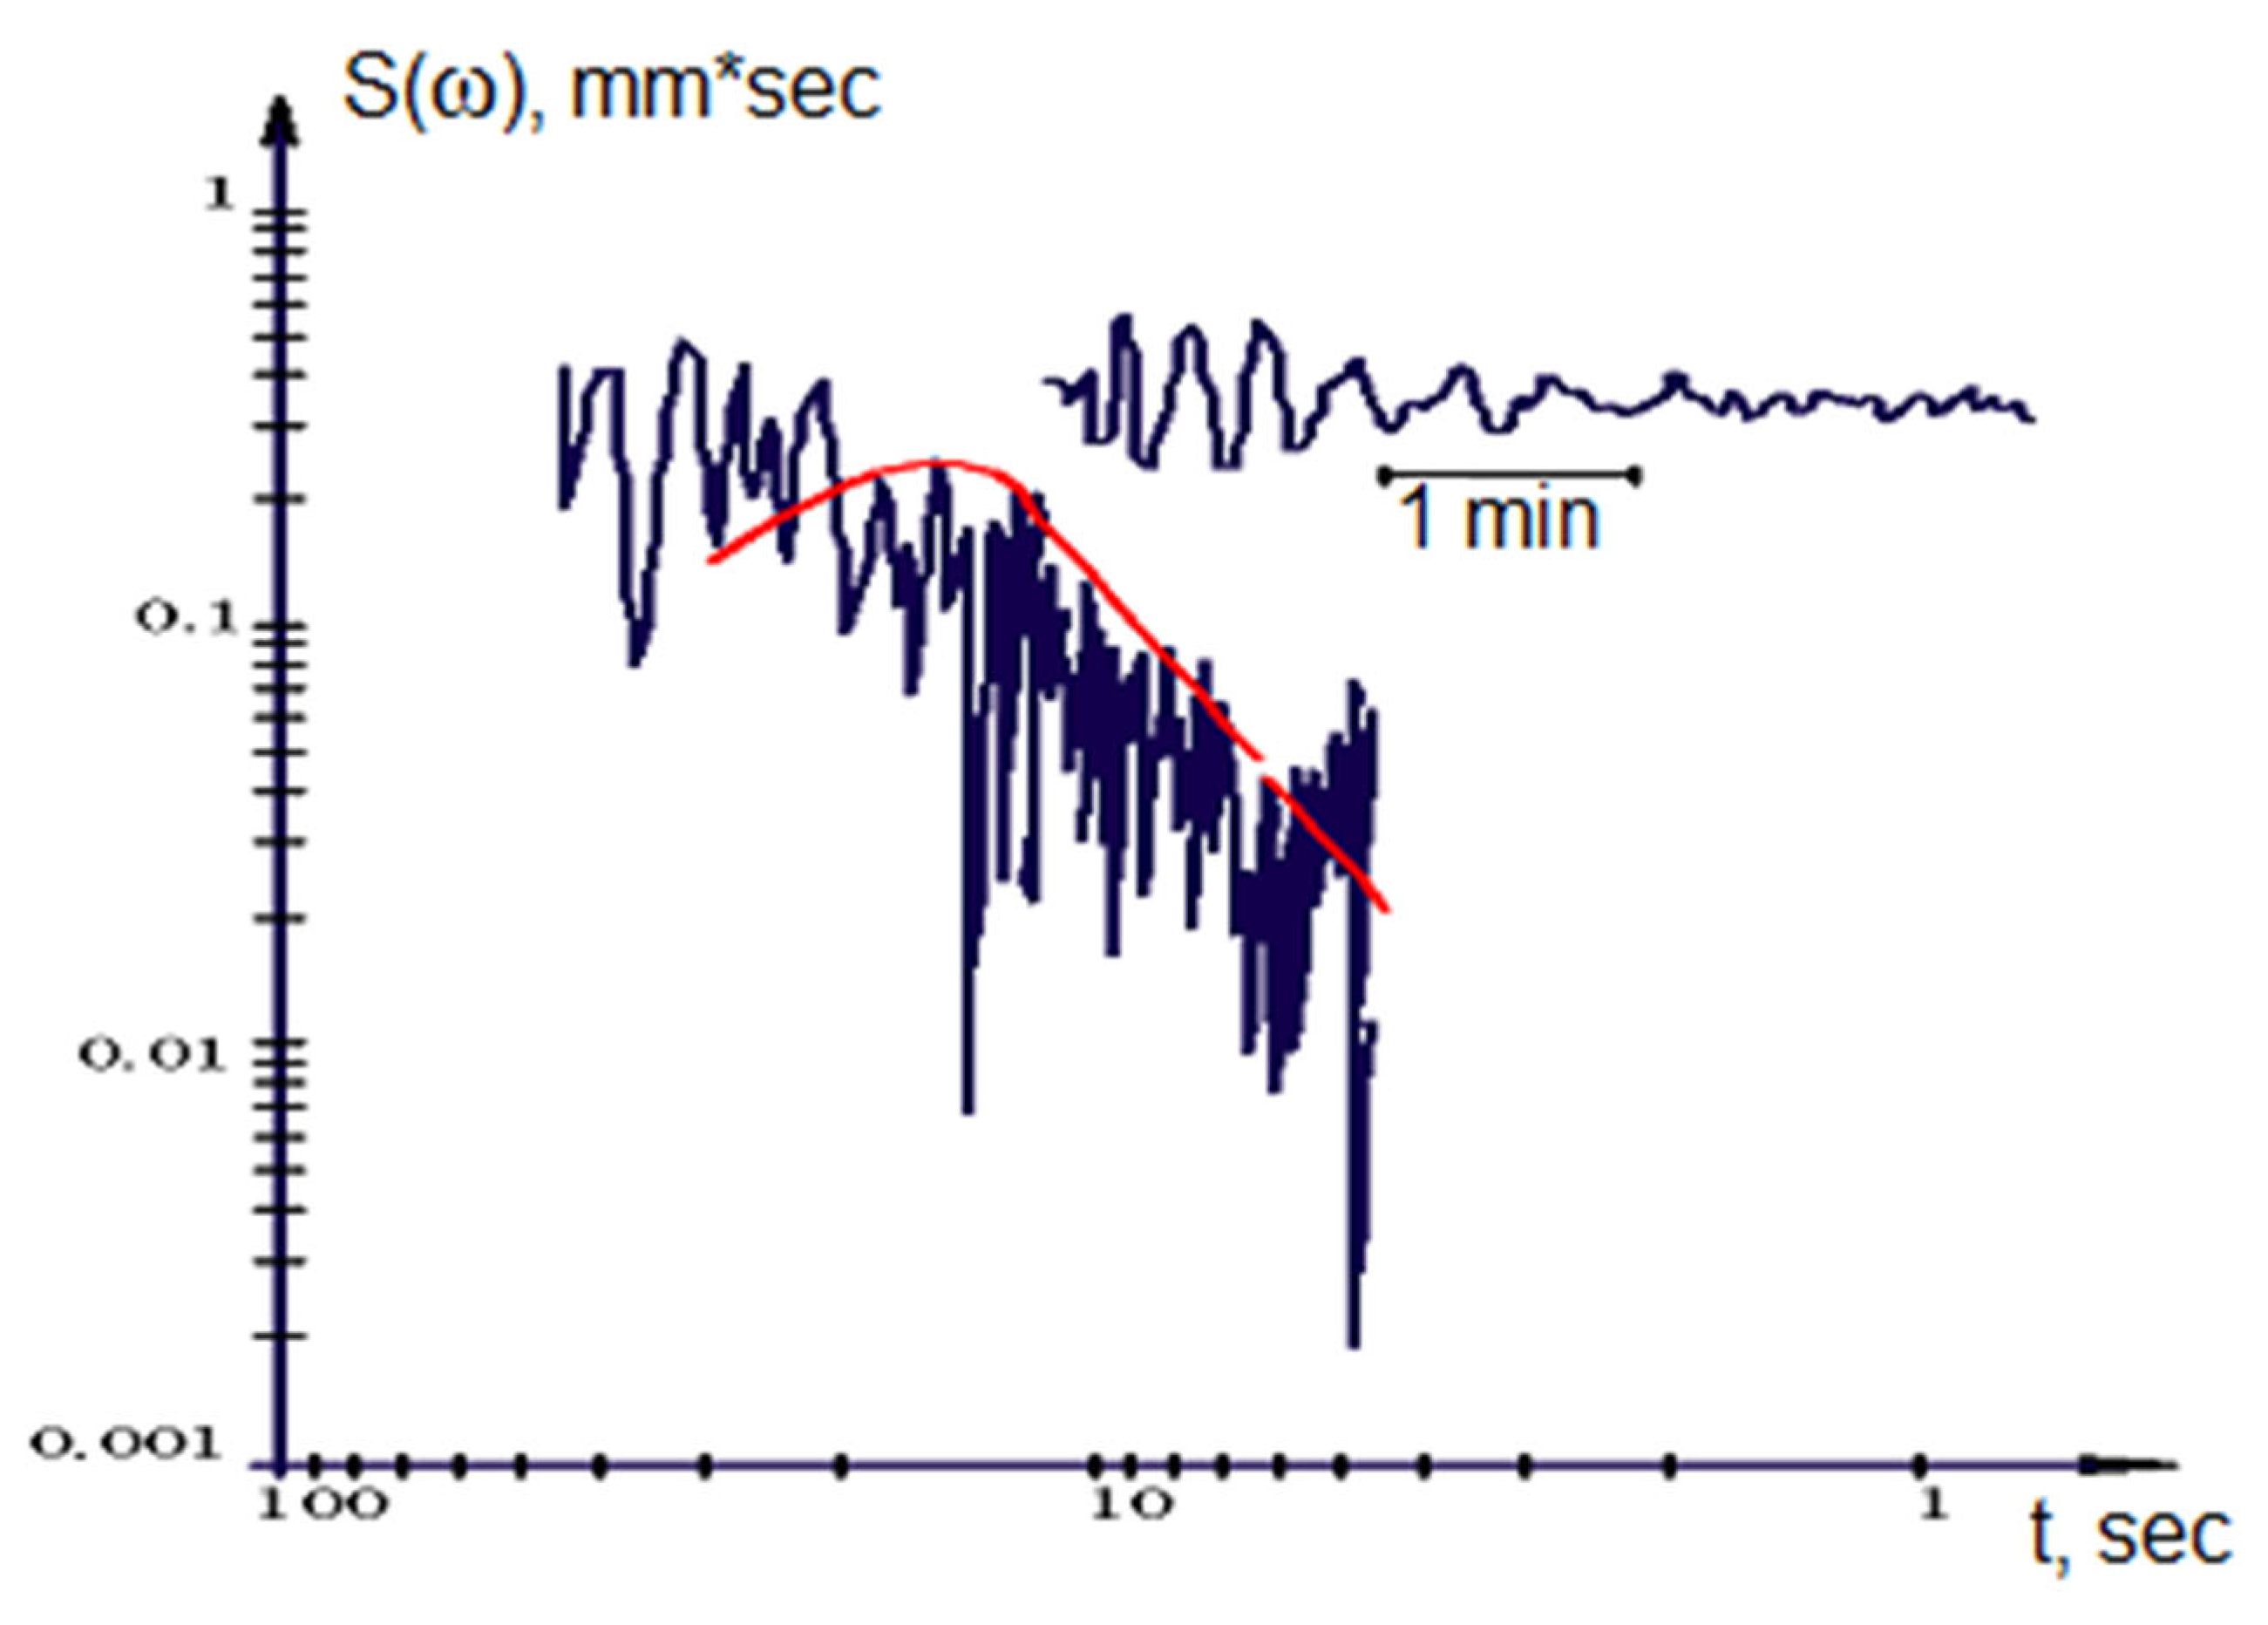
Figure 5,
Figure 6,
Figure 7,
Figure 8,
Figure 9 and
Figure 10 below show graphs of theoretical amplitude spectra for earthquakes recorded in Central Asia in different years (calculations were made from T=10 sec and above).
Calculation models. To compare the observed and theoretical data, it is necessary to proceed from some models of the medium and the source of oscillations. As follows from the experimental seismological data, in most cases the main movement in the source of a tectonic earthquake is sliding along the fault plane. Therefore, a double pair of forces without a moment was taken as the source model, which is the force equivalent of a shear dislocation. The choice of a real environment model is more complex and ambiguous. The investigated paths along which surface waves propagate are characterized by a complex structure. In particular, on the Central Asia-Caucasus route, several zones can be distinguished, which differ sharply from each other in terms of the level of occurrence of the Mohorovichich boundary. These are the orogenic region of the Tien Shan-Pamir, the Turan platform, the Caspian Sea and the Caucasus.
The resulting model was selected within the framework of the chosen parametrization by sequentially changing the velocities of longitudinal and transverse waves, as well as the thicknesses of the layers. The results of works [
19,
20,
21] were taken as initial ones.
Table 3 and
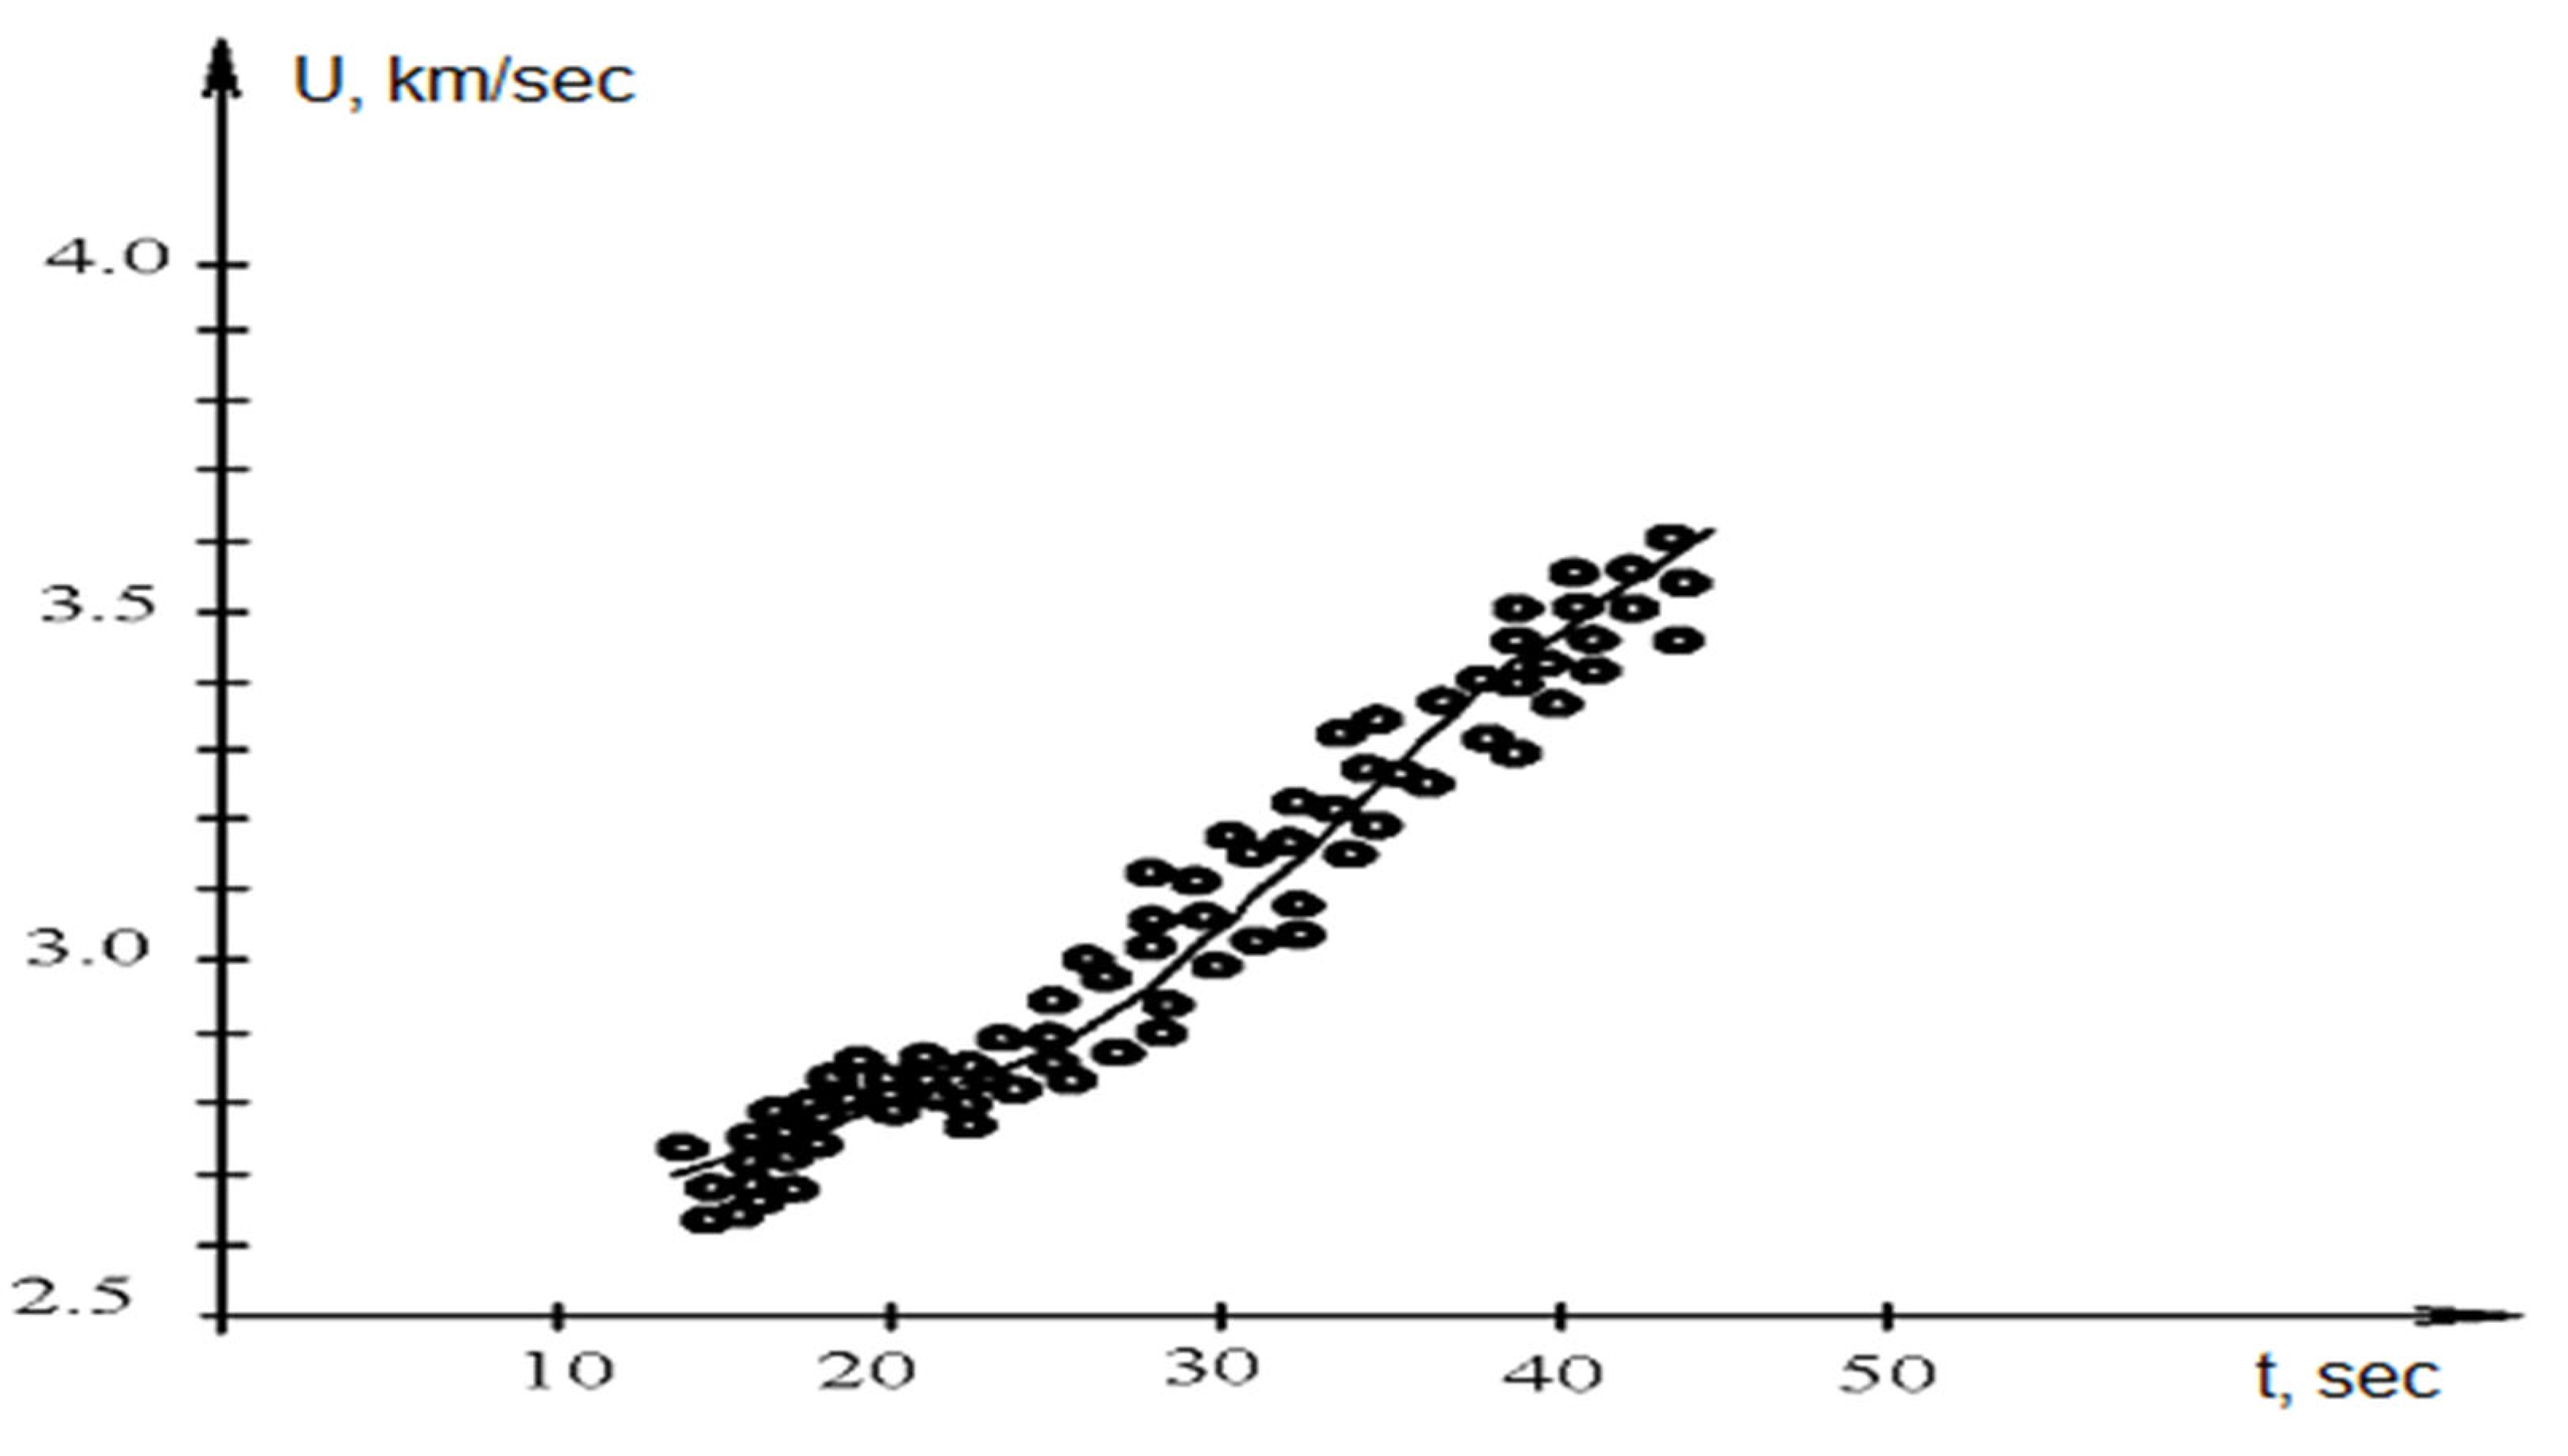
Figure 5 show a section of the found model of the Earth and the theoretical dispersion curve of the group velocity of the fundamental harmonic of the Rayleigh wave corresponding to this model. Good agreement between the observed and theoretical variance allows us to accept this model as a reference one.
Figure 5.
Recording section and the corresponding spectrum of the vertical component of the Rayleigh wave recorded by the Stepanavan station. The solid line is the calculated spectrum.
Figure 5.
Recording section and the corresponding spectrum of the vertical component of the Rayleigh wave recorded by the Stepanavan station. The solid line is the calculated spectrum.
Figure 6.
Rayleigh wave group velocity dispersion for Central Asia-Caucasus paths.
Figure 6.
Rayleigh wave group velocity dispersion for Central Asia-Caucasus paths.
In the flat Earth model used, there are four main layers with a total thickness of 45 km located above the upper mantle: sedimentary 3 km thick, granite 12 km thick, intermediate 10 km thick, and basalt 20 km thick.
The values of quality factors
,
, given in
Table 3, are related by the ratio
for all layers of the crystalline crust and mantle, which corresponds to the absence of elastic losses during volumetric compression of rocks. For the sedimentary layer,
is taken.
It should be especially noted that the found model of the earth’s crust on the path of Central Asia - the Caucasus is averaged. The study of the structure of the earth’s crust on the routes Central Asia - the Caucasus as a whole was carried out in [
19]. The selection of theoretical models of the earth’s crust was carried out on the basis of a comparison of experimental and theoretical data on the dispersion of the group and phase velocities of Rayleigh and Love surface waves. The obtained theoretical models of the earth’s crust consist of two layers with a total thickness of 43-45 km, located above the upper mantle, which is in good agreement with the total thickness of the earth’s crust model obtained by us.
4. Calculation and Analysis of the Seismic Stress State of the “Subgrade—Base” System
The dynamic loads acting on the subgrade are of a different nature, but the impact from earthquakes is of greatest interest. The importance of the problem of seismic resistance of the subgrade is determined by the catastrophic consequences of strong earthquakes acting on it. Designing an economical, durable and reliable subgrade that can withstand inertial forces during intense earthquakes requires engineering and the use of scientific achievements in the field of the theory of seismic resistance of transport structures for various purposes.
Therefore, it is advisable to demonstrate the main provisions of the accepted theories and calculation methods, considering the seismic resistance of the “subgrade - base” system, taking into account the heterogeneity and heterogeneity of its constituent soil layers under the influence of strong earthquakes.
It should be expected that seismic vibrations of the ground of the embankment will cause significant damage to the subgrade in particular and in the whole railway track.
The actual data of destructive earthquakes again confirm that earthquakes of medium intensity cause significantly greater stresses and displacements than loads accepted by the norms. In reality, the subgrade, calculated according to the norms, will be overstressed, and the parameters of the actual reaction can only be determined using the above methodology.
Important initial information for the study and practical implementation of the issues of seismic resistance of the “subgrade - base” system is, of course, kinematic data on the earthquake itself. Strong seismic movements that cause sufficiently intense ground vibrations have parameters that are too large to be recorded using typical instruments used in seismology. Therefore, the three ground motion components recorded by the accelerograph represent a complete description of the intensity of an earthquake that affects the subgrade at the same site. The most important recording parameters of each component, from the point of view of the design calculation, are: amplitude, frequency content and duration.
The amplitude is usually characterized by the peak value of the acceleration or, sometimes, by the number of peaks that exceed a certain level. Ground motion velocity can be a more indicative measure of intensity than acceleration, but velocity records are usually not available unless additional calculations are made. The frequency composition can be roughly represented by the number of zero line crossings per second on the accelerogram, and the duration by the time interval between the first and last peaks that exceed a given level. Obviously, the last quantitative characteristics together give an approximate description of the process of ground vibrations and do not reflect their potential danger to the subgrade.
An important point in the calculation of the seismic resistance of the subgrade is the choice of the characteristics of the input seismic action, for which it should be calculated. Seismic loads are special of all types of external loads that must be considered in design, since a large earthquake usually causes greater stresses and movements in critical sections of the subgrade than all other loads combined.
One of the most effective ways to determine ground motion is to use the accelerogram of a past earthquake. Obviously, the calculation for a given accelerogram will be a more reasonable and most effective method for studying the seismic stress state of the “subgrade - base” system.
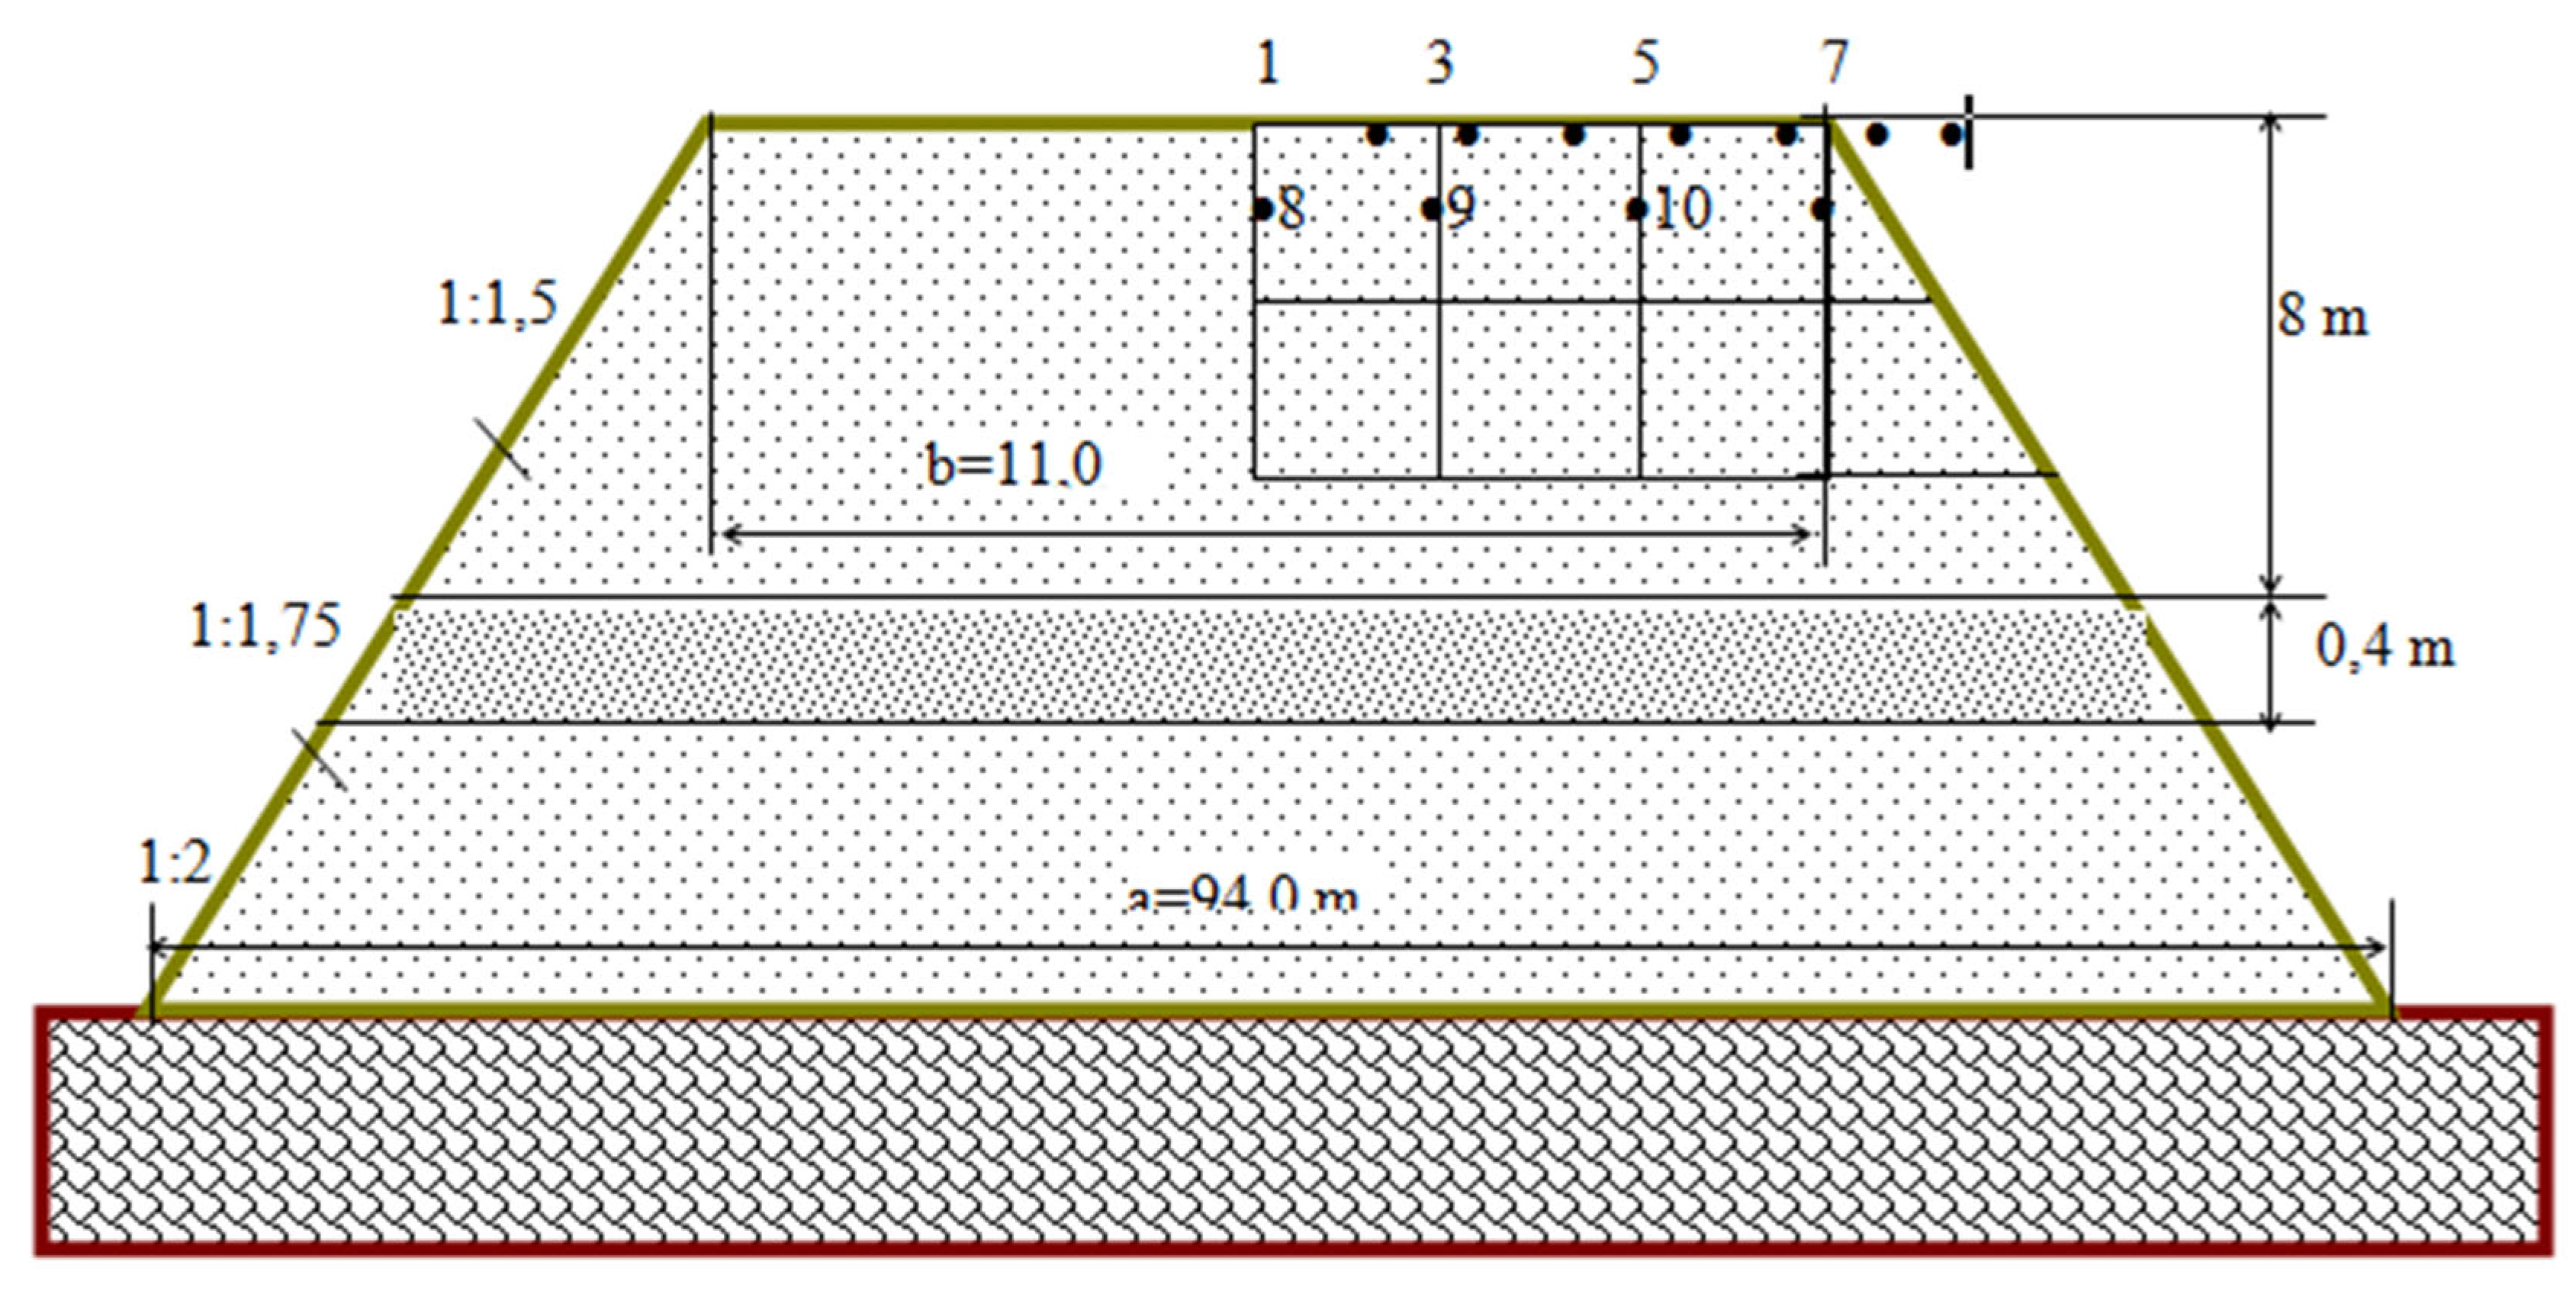
The object of calculation of dynamic analysis is the cross section of the subgrade in the form of a trapezoid with the slope of the sides in the ratios: k
1=1:2; k
2=1:1.75; k
3=1:1.5 and heights h
1=11.0 m, h
2=6.0 m, h
3=6.0 m, shown in Figure 26. Total height of subgrade H=h
1+h
2+h
3=23.0 m. The elastic and density parameters of the subgrade and foundation are shown in
Table 5. The main area of the subgrade has a width of b = 11.0 m. The size of the lower base of the embankment at the assumed heights and slopes of the sides is а=b+2(k
1*h
1+ k
2*h
2+ k
3*h
3) = 94.0 m.
Figure 7.
Calculation scheme.
Figure 7.
Calculation scheme.
The base of the computational domain is assumed to be rigid, i.e. in the horizontal and vertical directions, the displacements are zero. The computational domain is divided into 212 isoparametric quadrangular quadratic elements with a total number of nodes of 711. Within each element, the material is homogeneous.
Table 5.
Elastic and density parameters of subgrade and foundation.
Table 5.
Elastic and density parameters of subgrade and foundation.
| Elastic and density parameters |
|---|
Earth bed:
Е=50 MPa, ν=0.27, G=19,69 MPa, γ=2,0 T/m3.
Base:
Е=60 MPa, ν=0.3, G=23.1 MPa, γ=2,38 T/m3. |
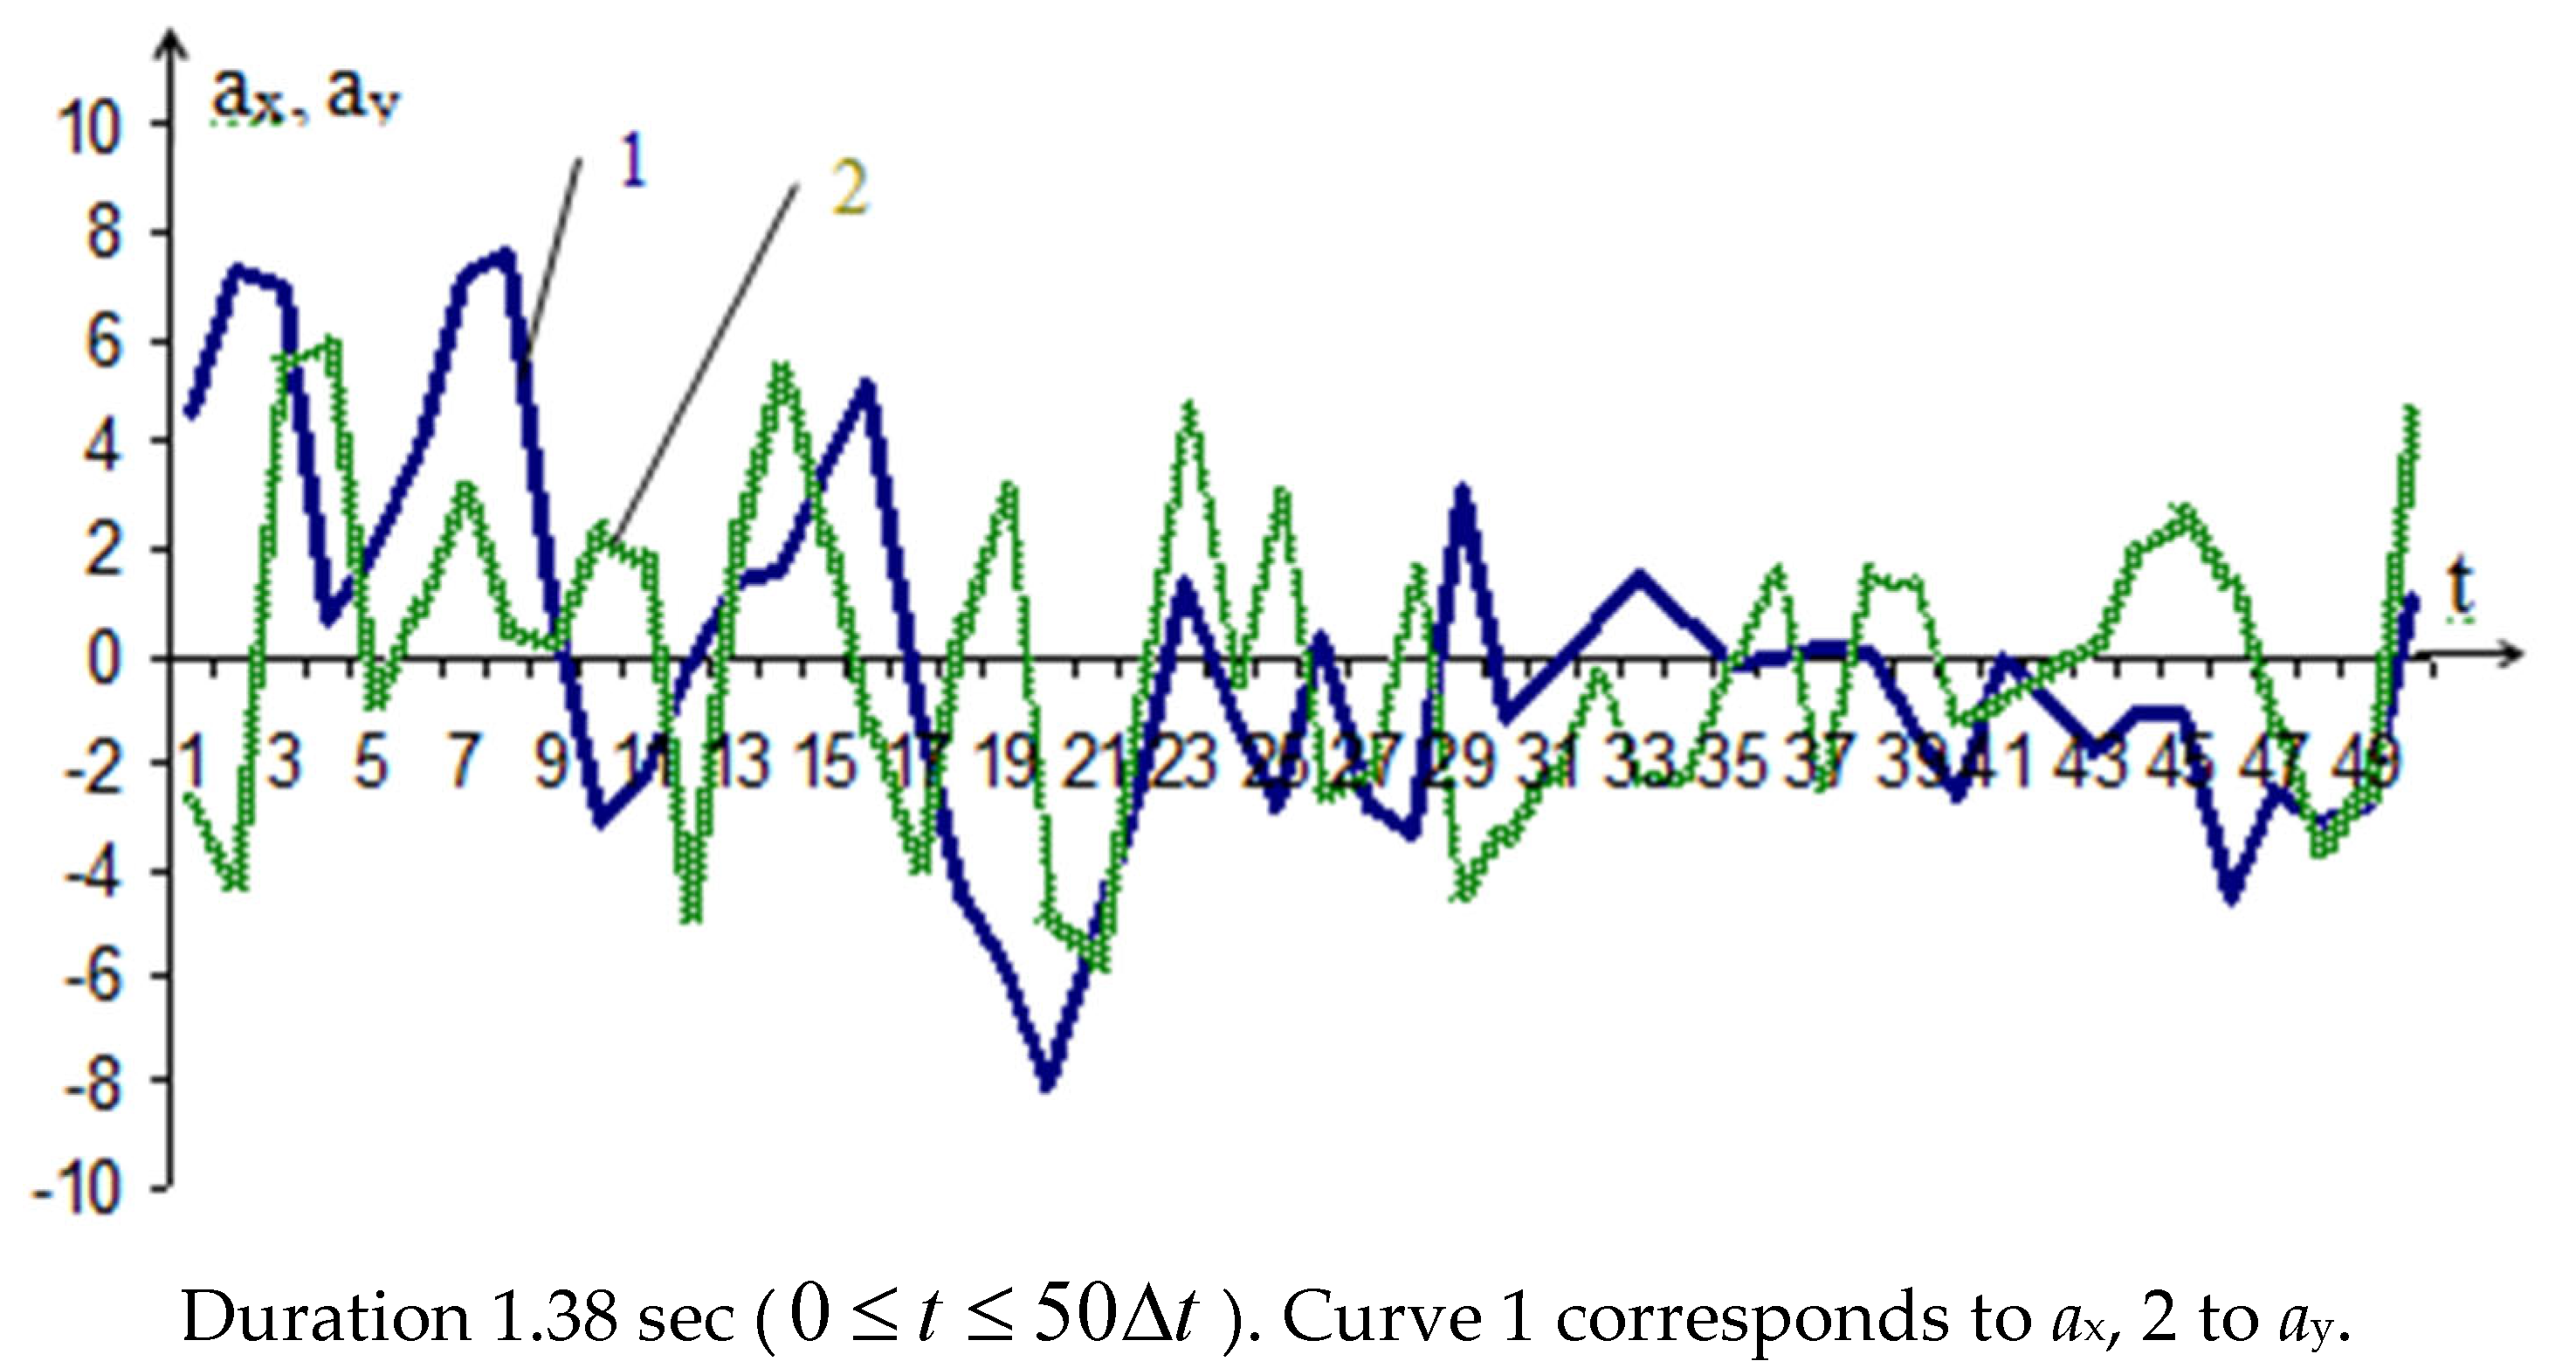
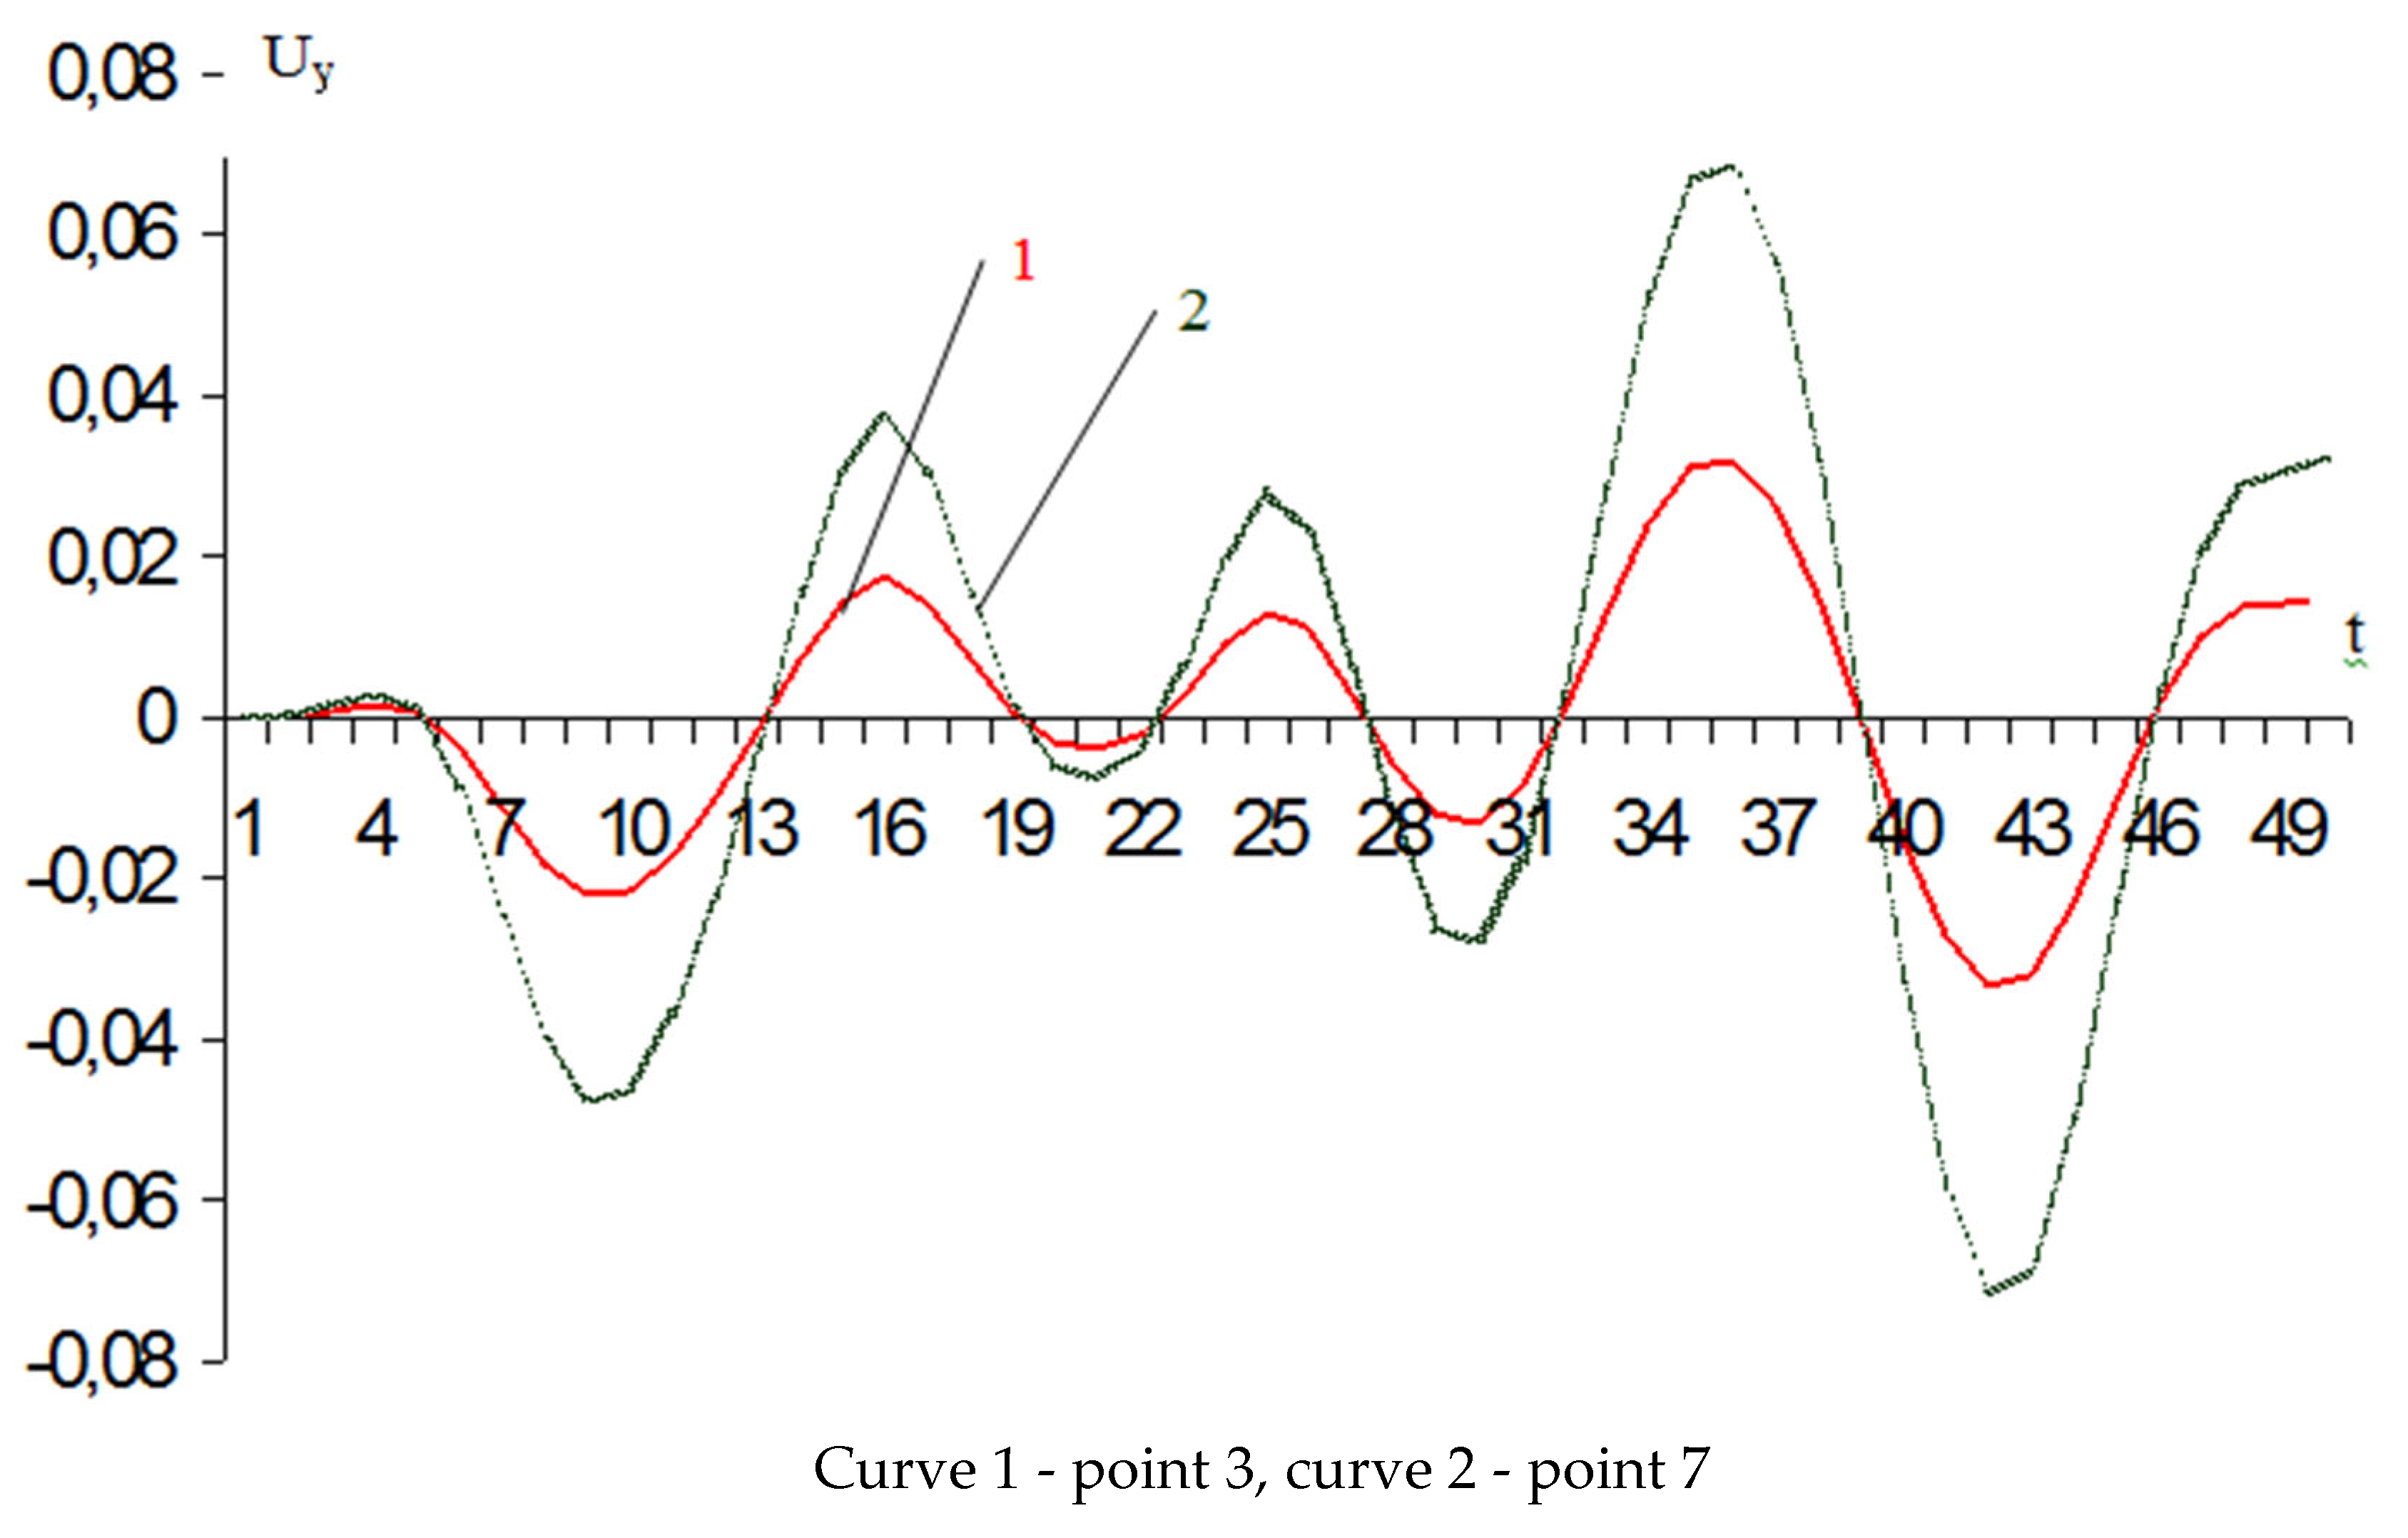
As external force factors of seismic motion, a real accelerogram of a 9-point Gazli earthquake with a duration of 1.38 sec was used. For direct calculation, the most intense part of the horizontal (ax) and vertical (ay) components of the accelerograms was taken (see
Figure 8). It is tabulated with a constant time step of 0.023 sec. The adopted specific time step does not lose the maxima of the given values of accelerations and their abrupt fluctuation.
Figure 8.
Diagram of changes over time of the horizontal (ax) and vertical (ay) components of the accelerograms.
Figure 8.
Diagram of changes over time of the horizontal (ax) and vertical (ay) components of the accelerograms.
