Submitted:
18 January 2023
Posted:
19 January 2023
You are already at the latest version
Abstract
Keywords:
1. Introduction
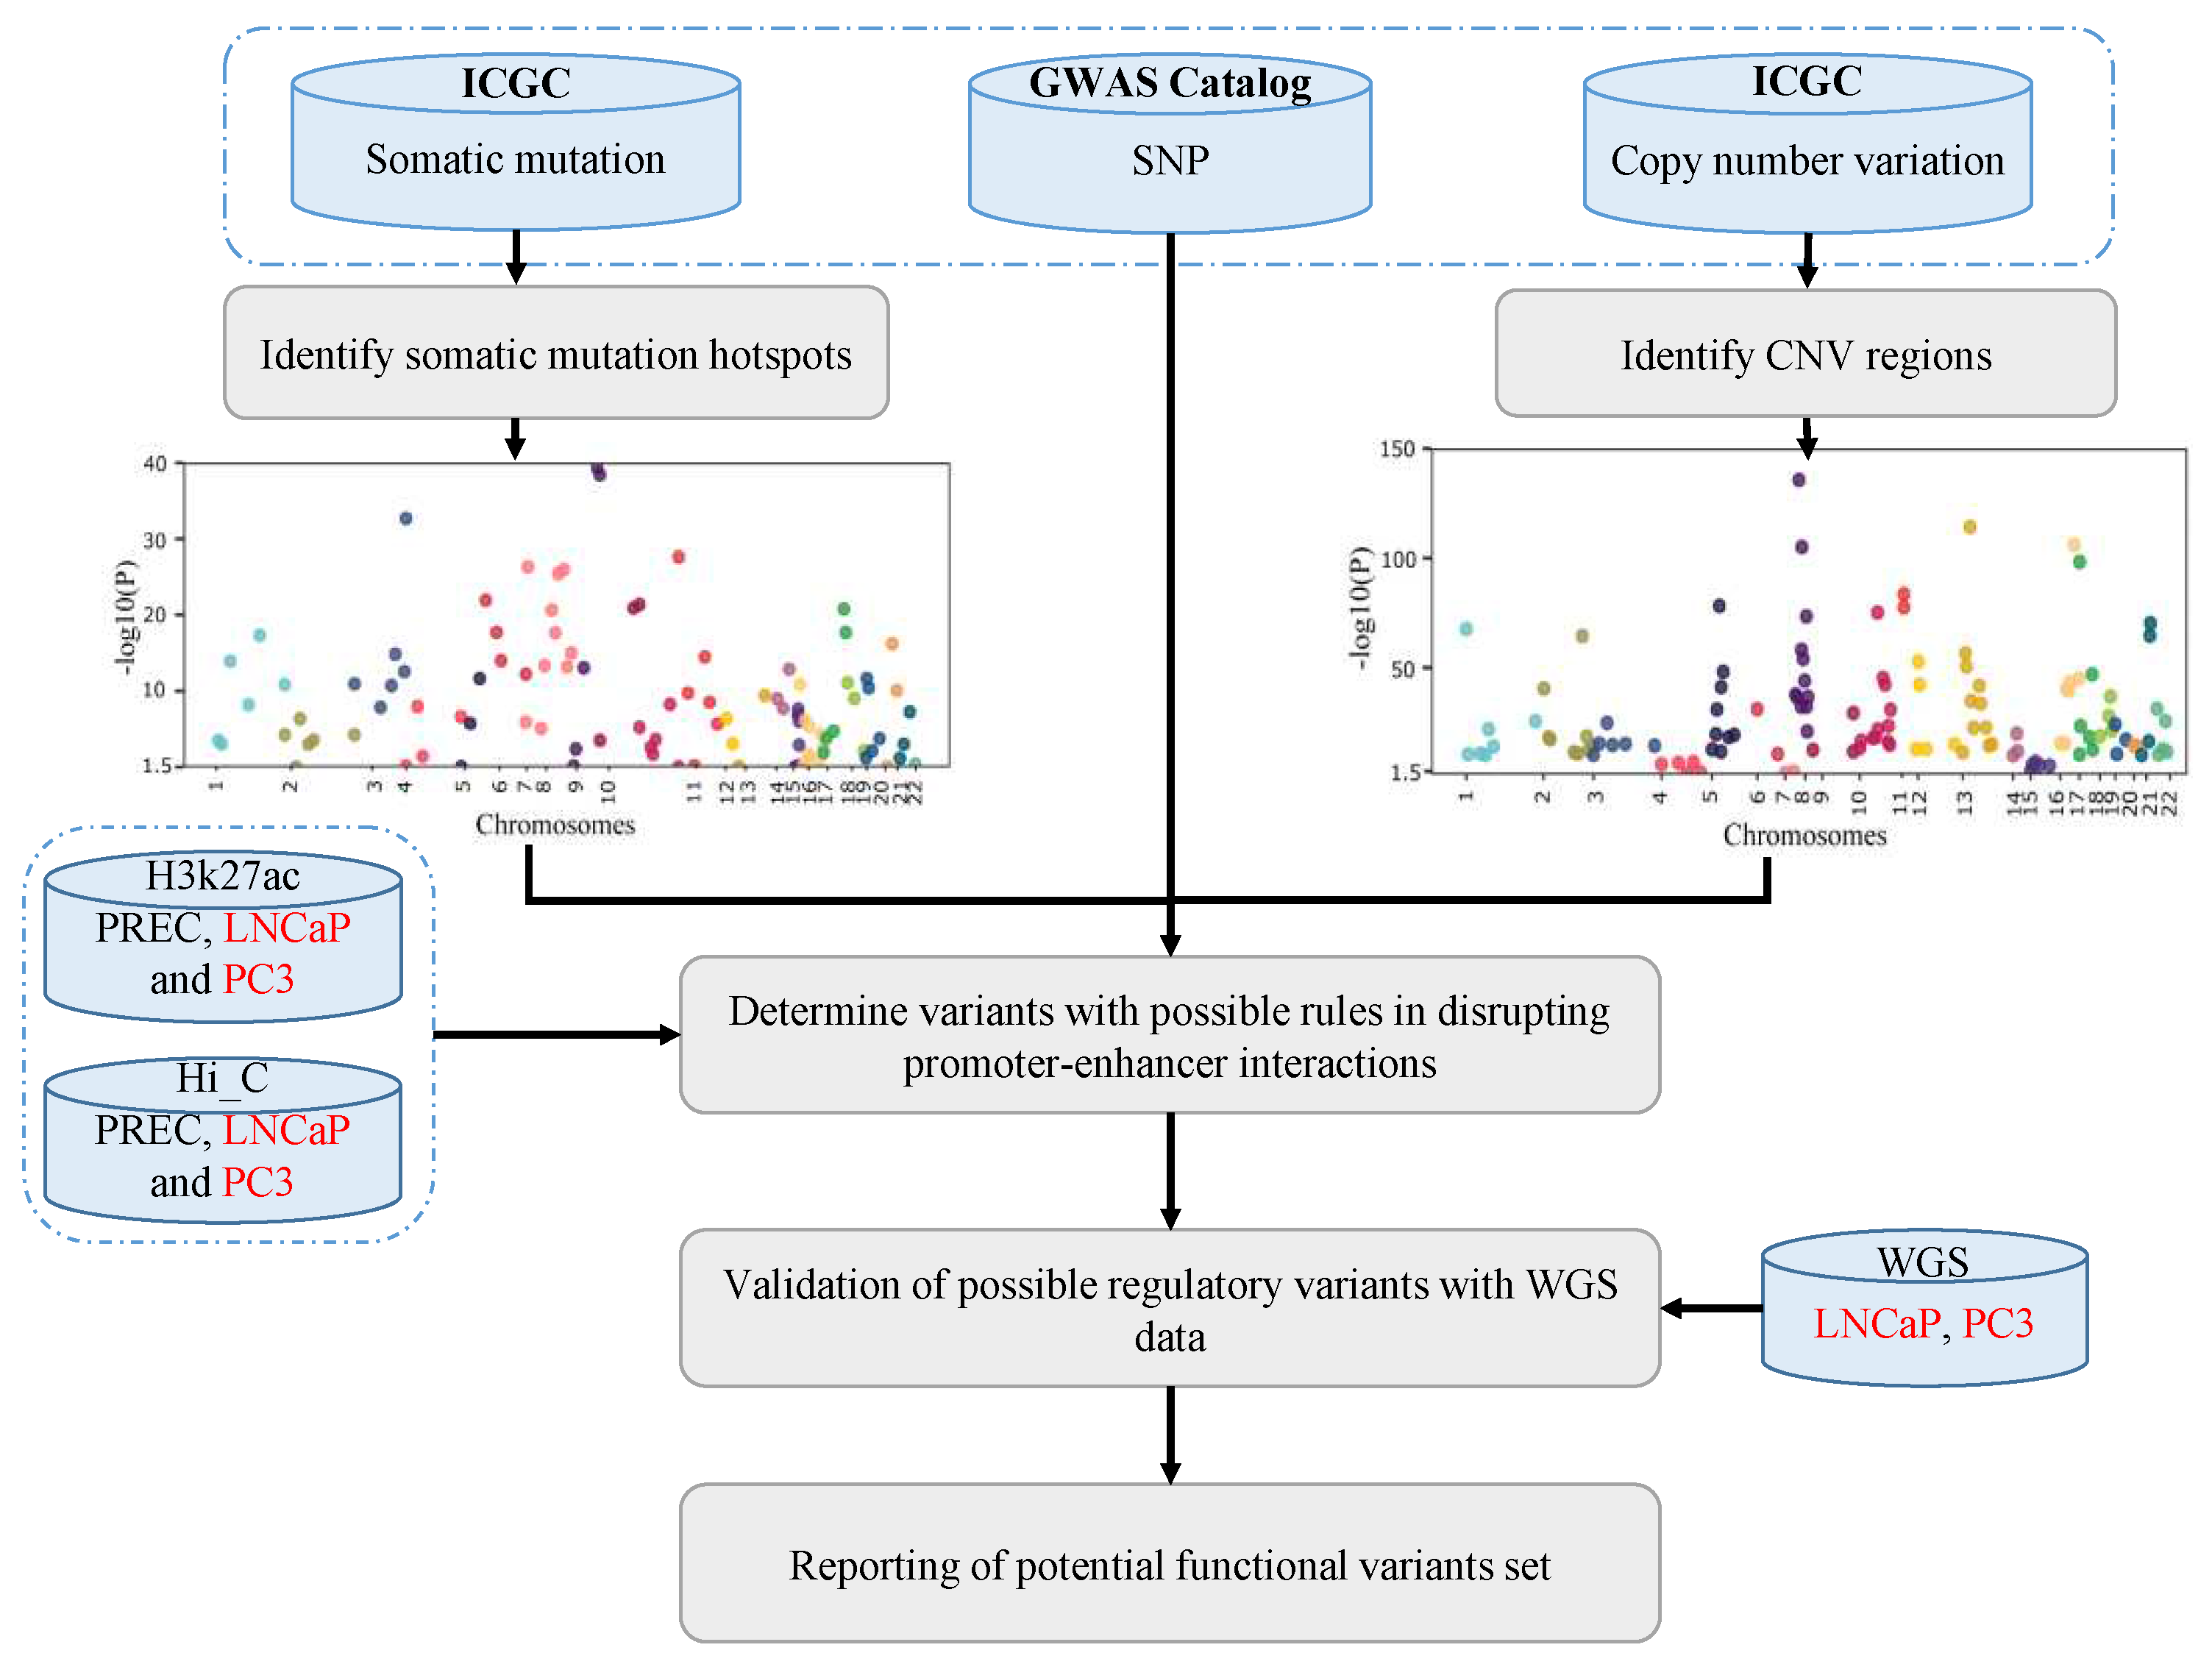
- This is the first study that comprehensively considers GWAS SNPs, somatic point mutations and CNVs, while the previous methods only considered somatic mutations and GWAS SNPs to identify functional cancer-associated variants.
- In comparison to other studies [2] which mainly considered genomic variants in protein-coding genes, in this study, we performed the analysis on both coding and non-coding regions.
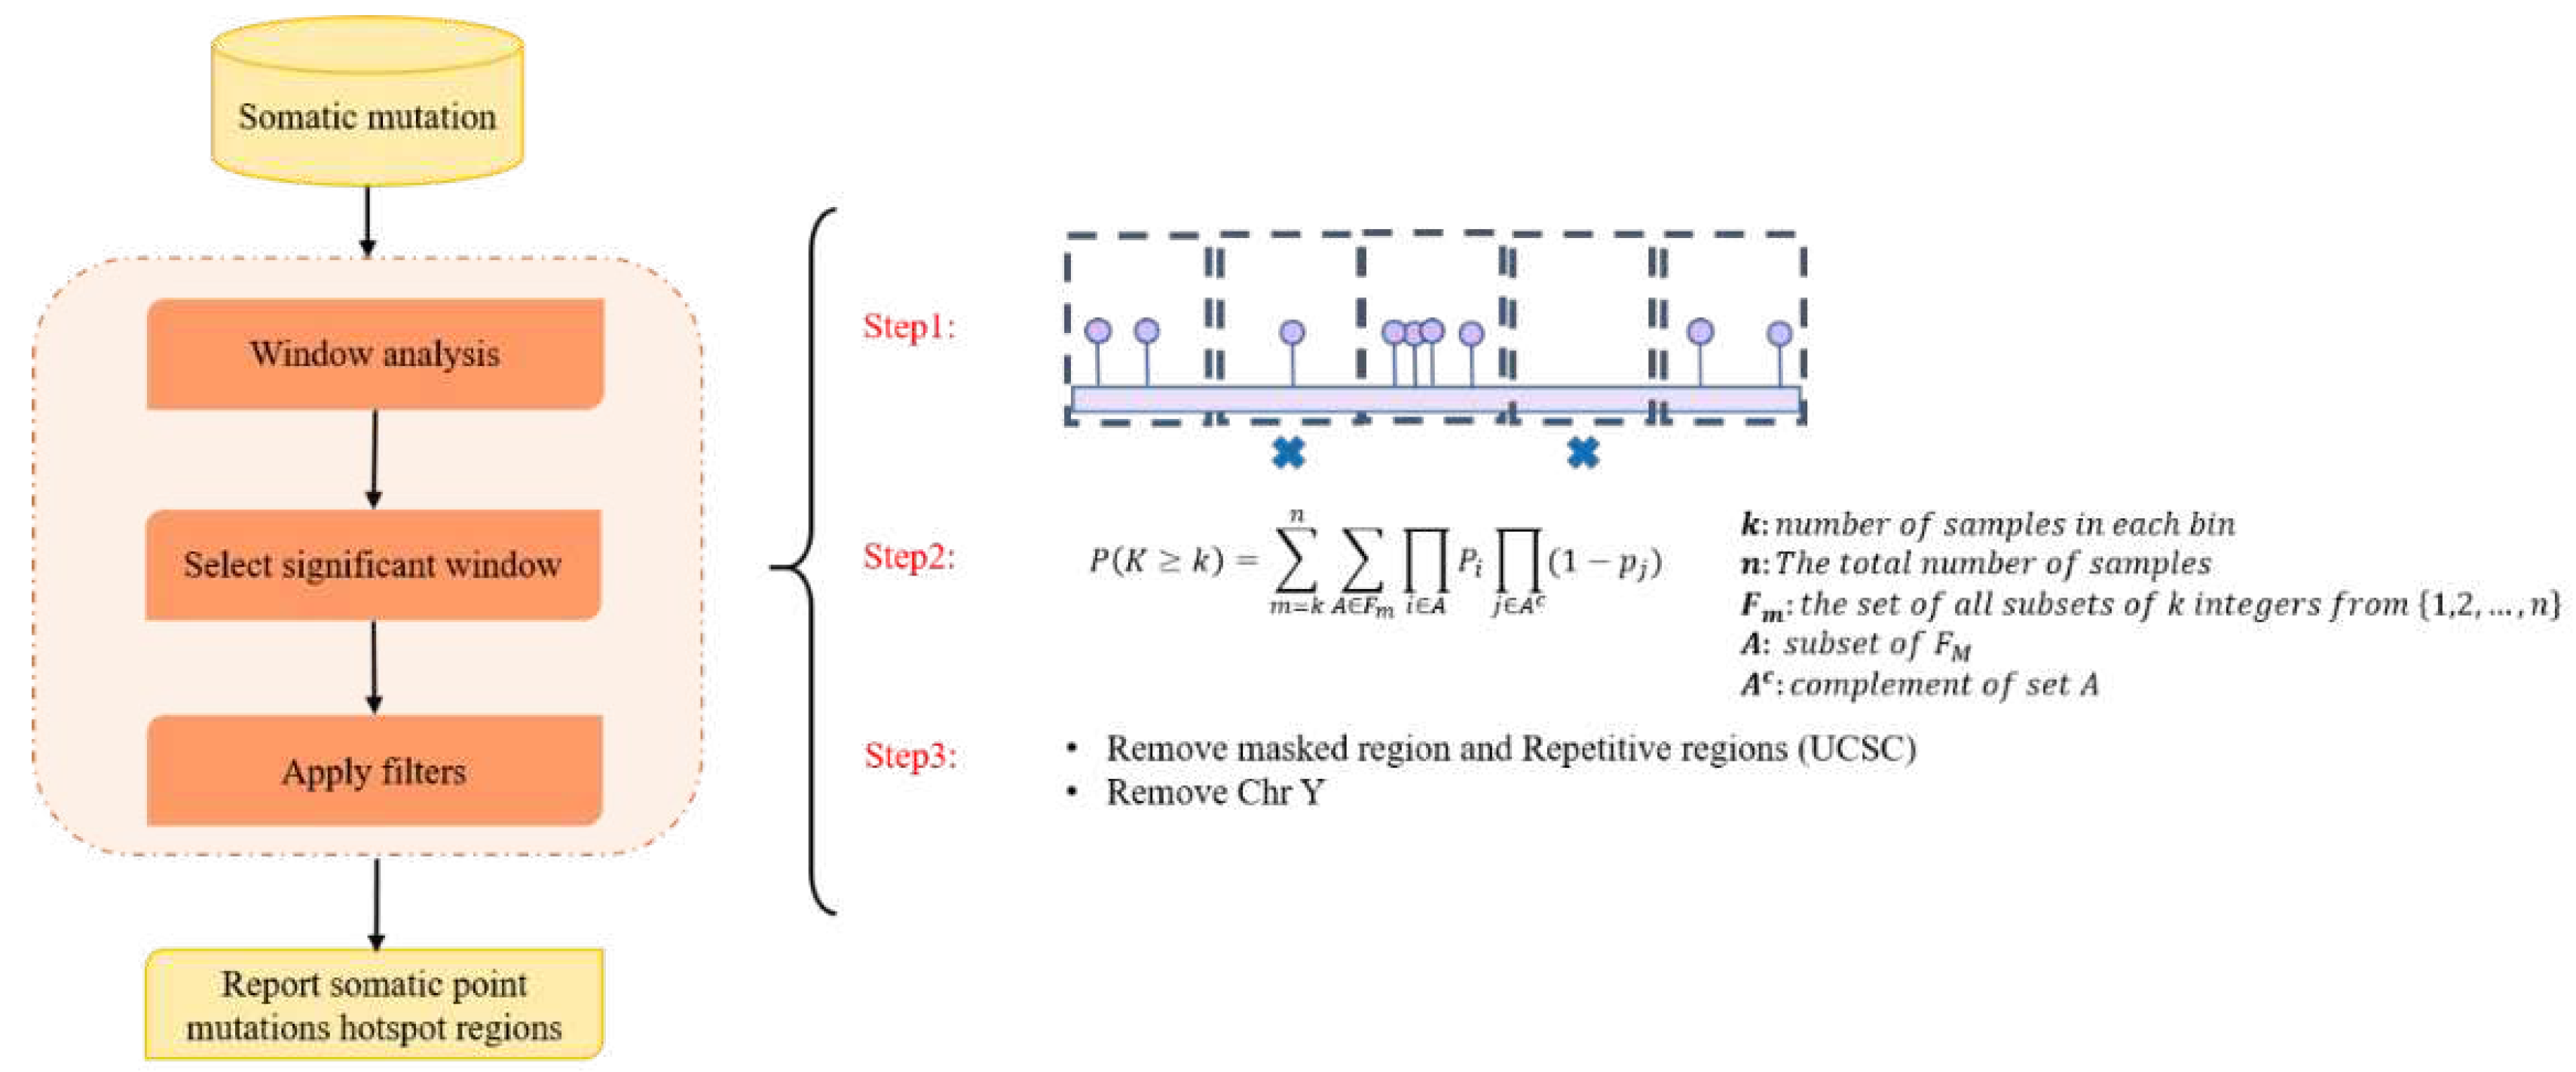
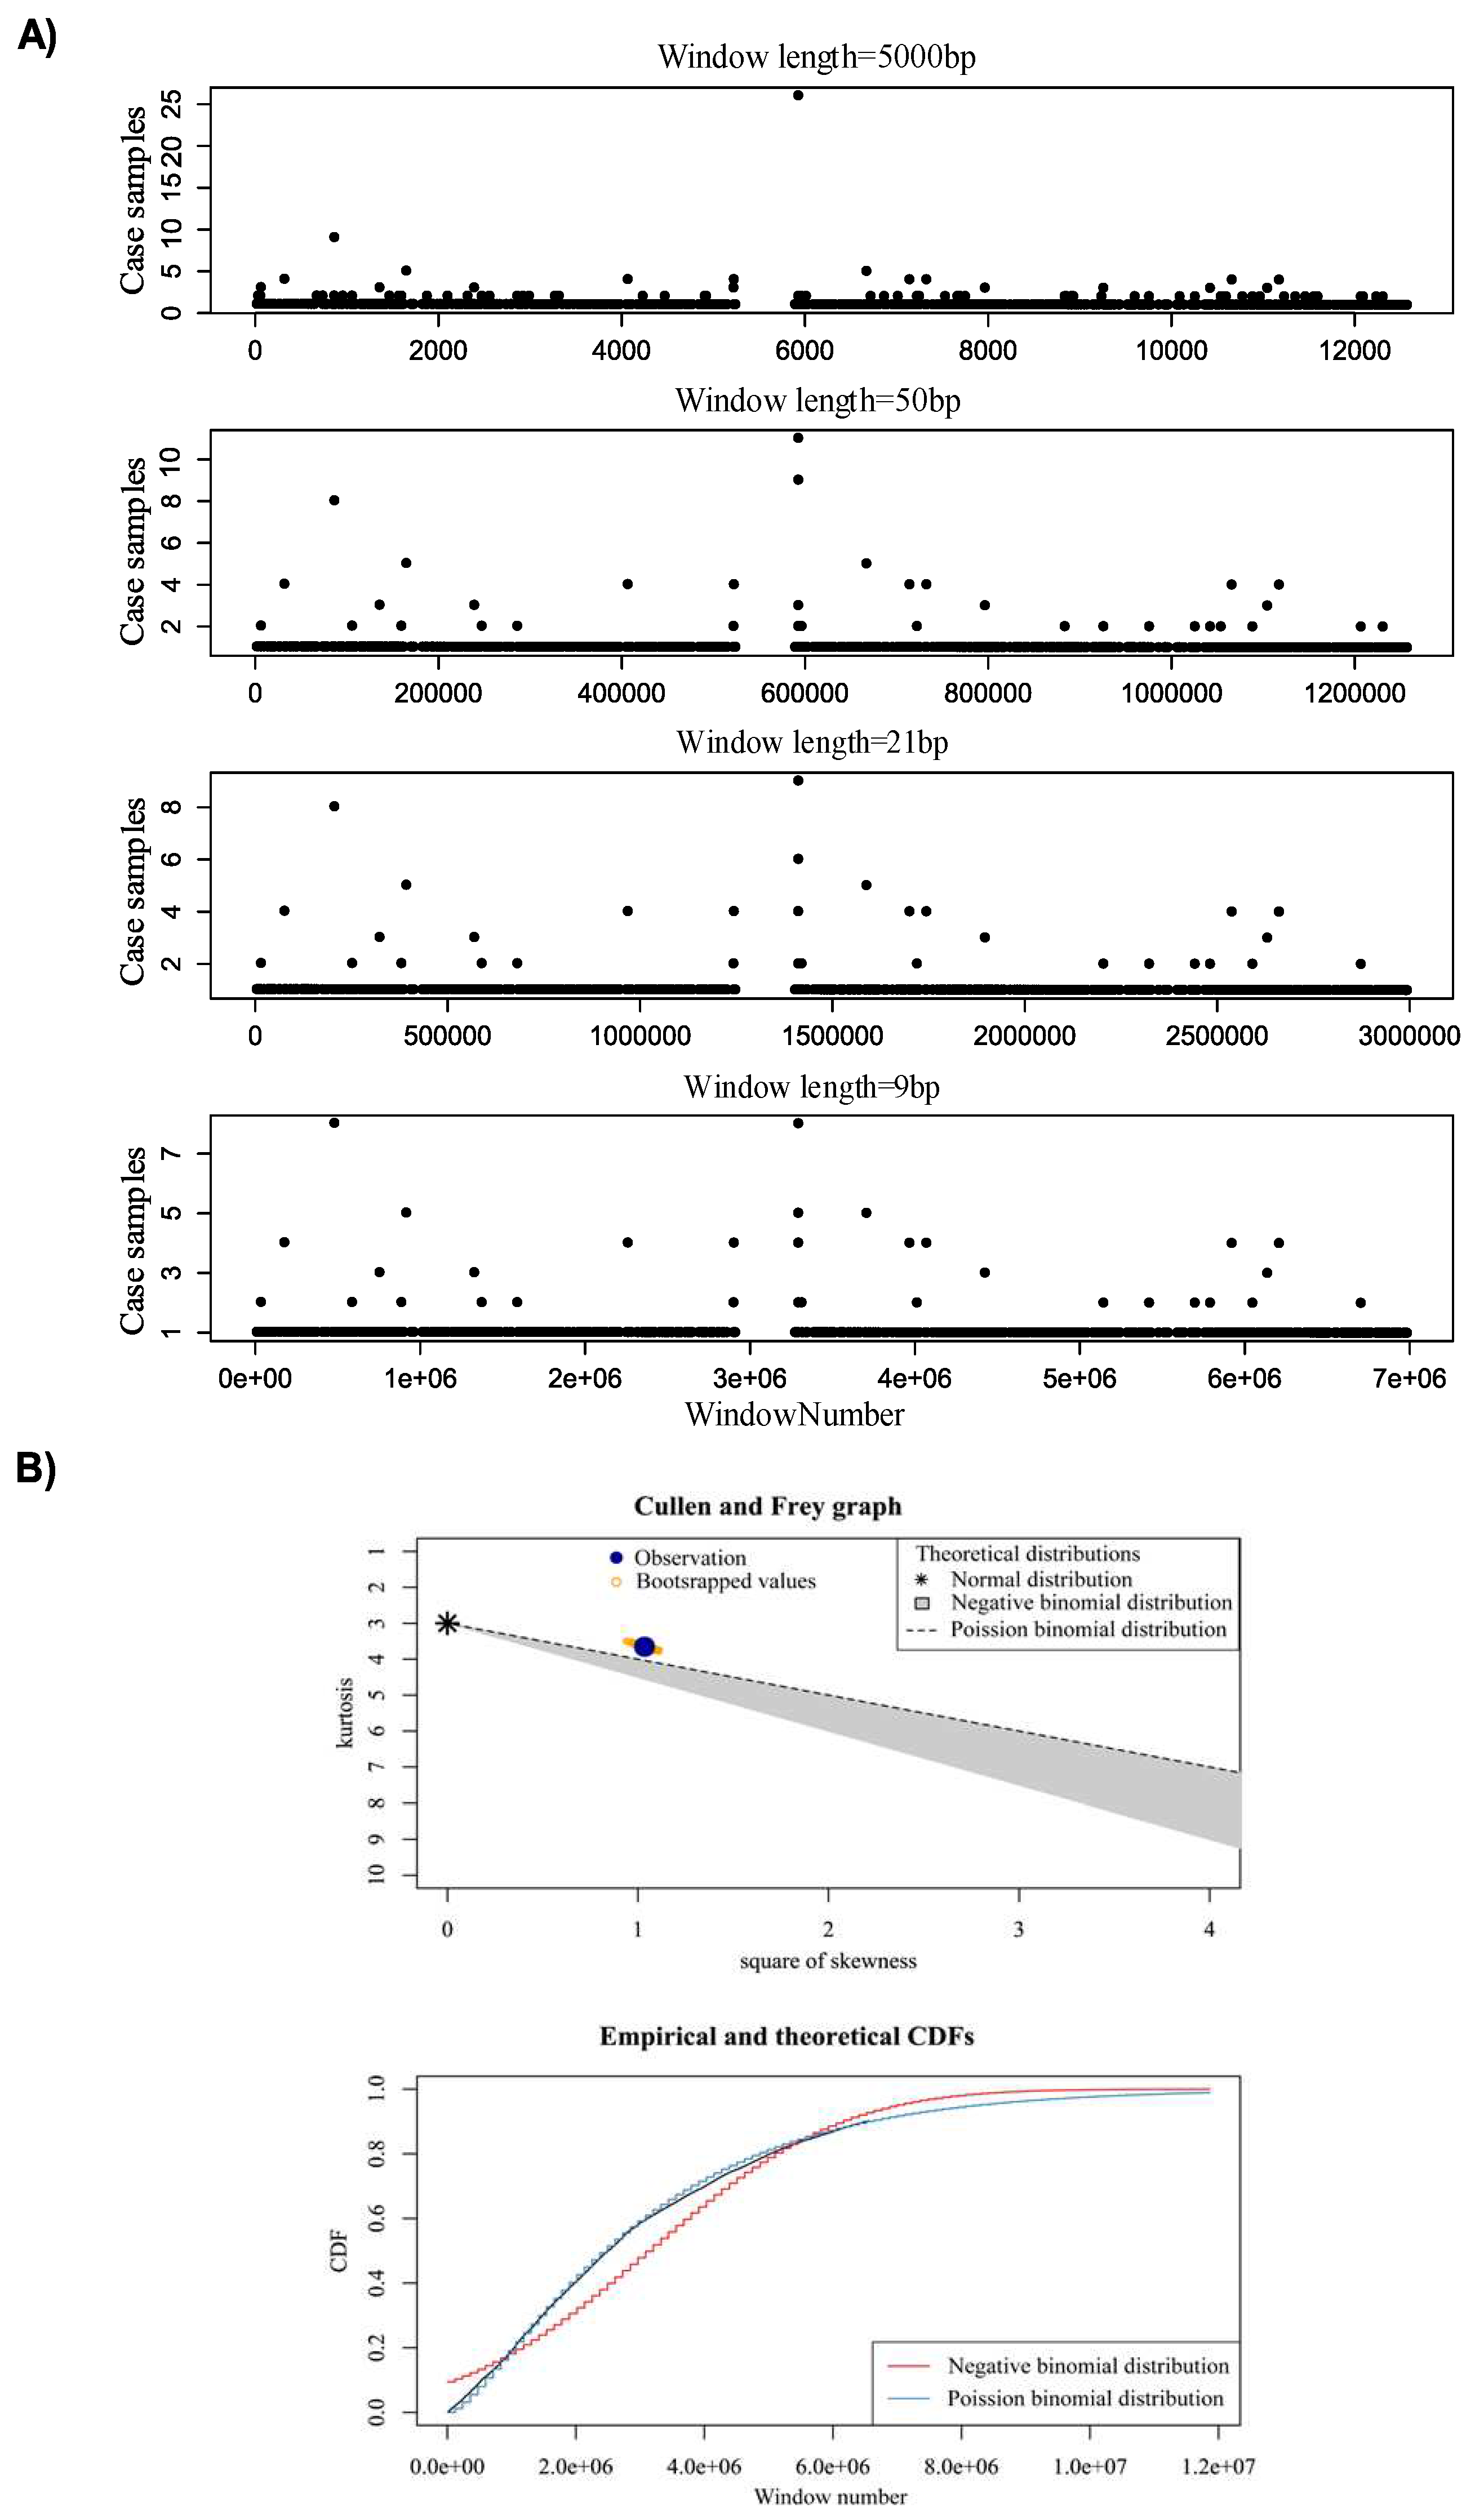
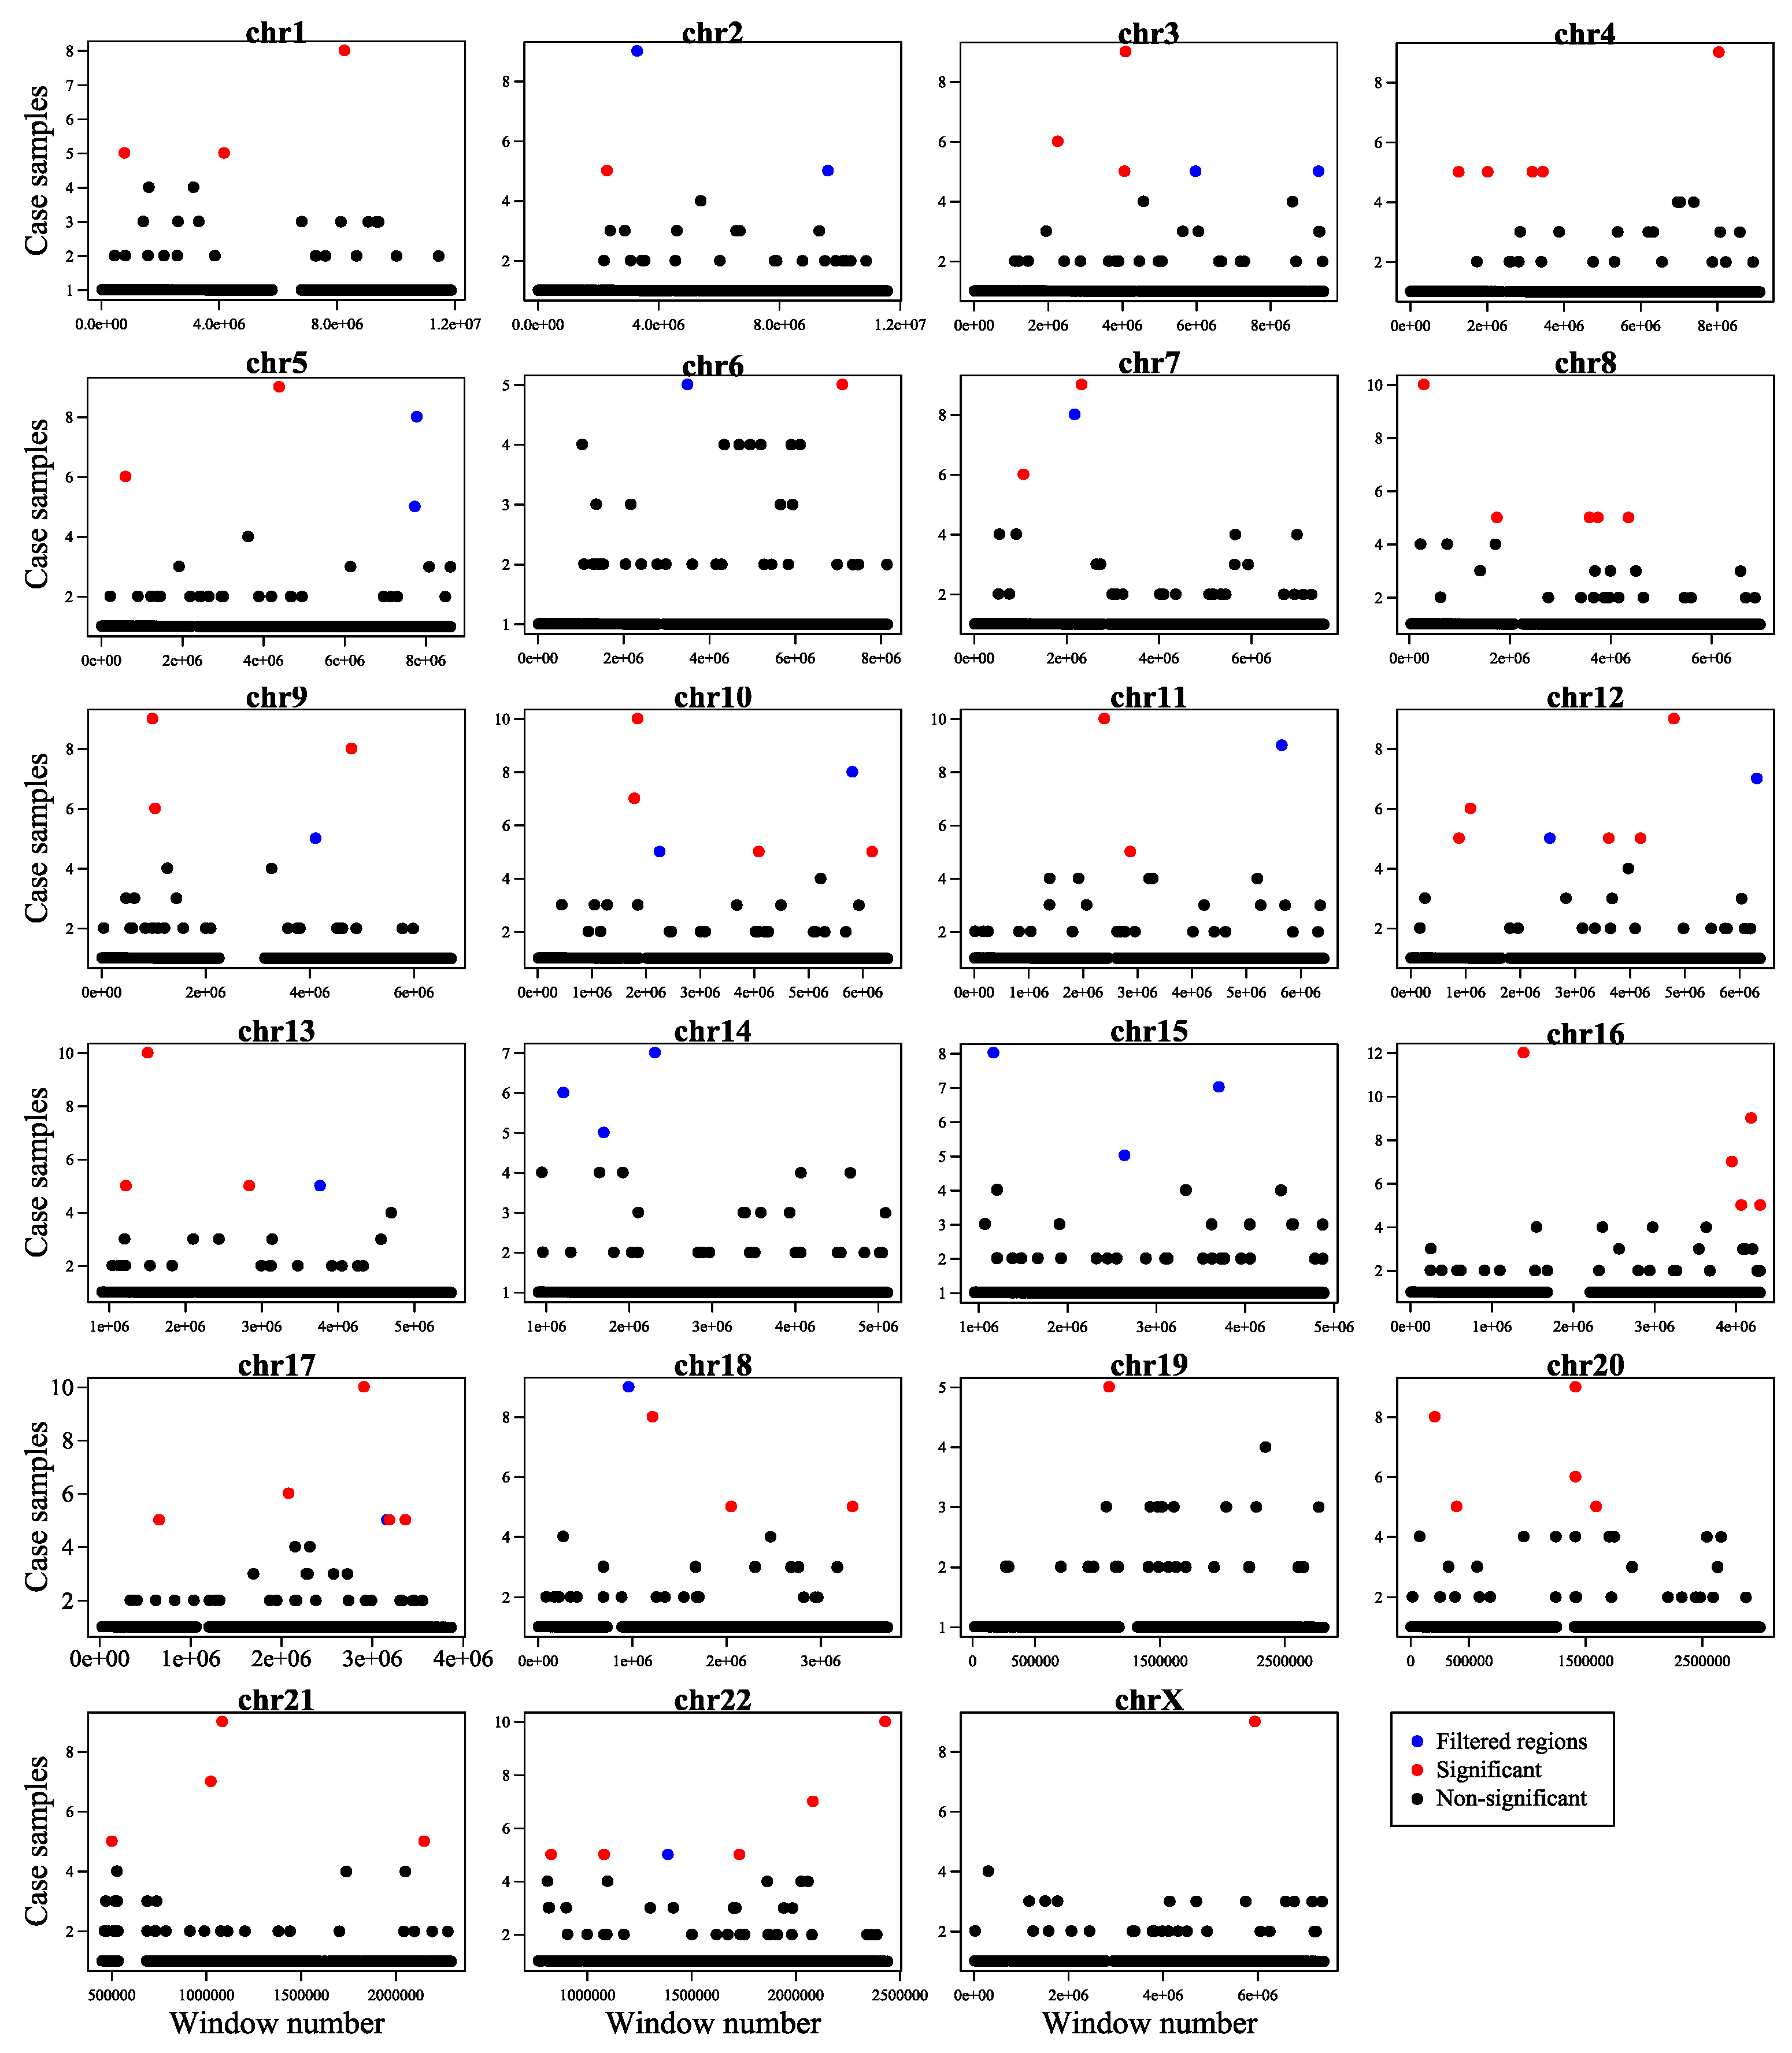
- We used an innovative strategy to identify hotspot somatic point mutation regions, which can also be used in the further studies for identifying hotspot regions in cancer. The proposed method is built upon window analysis for detection of hotspot somatic mutation regions, which is an effective strategy for identification of hotspot regions, whereas other methods such as FunSeq2 [2] and iCAGES [10] were not to report highly mutable regions.
2. Results
2.1. Making a comprehensive map of prostate cancer associated genomic variants
2.2. Linking PC-associated genomic variants to coding and non-coding genes
2.3. Identify variants with likely regulatory function
3. Conclusion
4. Materials and Methods
- a.
- Mapping of fastq reads of prostate cell lines to reference genome
- b.
- Variant calling
5. Conclusions
6. Patents
Supplementary Materials
Author Contributions
Funding
Institutional Review Board Statement
Informed Consent Statement
Data Availability Statement
Acknowledgments
Conflicts of Interest
References
- Bray, F.; Ferlay, J.; Soerjomataram, I.; Siegel, R.; Torre, L.; Jemal, A. Erratum: Global cancer statistics 2018: GLOBOCAN estimates of incidence and mortality worldwide for 36 cancers in 185 countries. CA Cancer J Clin 2020, 70, 313. [Google Scholar]
- Shihab, H.A.; Gough, J.; Cooper, D.N.; Day, I.N.; Gaunt, T.R. Predicting the functional consequences of cancer-associated amino acid substitutions. Bioinformatics 2013, 29, 1504–1510. [Google Scholar] [CrossRef]
- Rojano, E.; Seoane, P.; Ranea, J.A.; Perkins, J.R. Regulatory variants: From detection to predicting impact. Brief. Bioinform. 2019, 20, 1639–1654. [Google Scholar] [CrossRef]
- Fu, Y.; Liu, Z.; Lou, S.; Bedford, J.; Mu, X.J.; Yip, K.Y.; Khurana, E.; Gerstein, M. FunSeq2: A framework for prioritizing noncoding regulatory variants in cancer. Genome Biol. 2014, 15, 1–15. [Google Scholar] [CrossRef]
- Yip, K.Y.; Cheng, C.; Bhardwaj, N.; Brown, J.B.; Leng, J.; Kundaje, A.; Rozowsky, J.; Birney, E.; Bickel, P.; Snyder, M. Classification of human genomic regions based on experimentally determined binding sites of more than 100 transcription-related factors. Genome Biol. 2012, 13, 1–22. [Google Scholar] [CrossRef]
- Boyle, A.P.; Hong, E.L.; Hariharan, M.; Cheng, Y.; Schaub, M.A.; Kasowski, M.; Karczewski, K.J.; Park, J.; Hitz, B.C.; Weng, S. Annotation of functional variation in personal genomes using RegulomeDB. Genome Res. 2012, 22, 1790–1797. [Google Scholar] [CrossRef]
- Chen, H.; Yu, H.; Wang, J.; Zhang, Z.; Gao, Z.; Chen, Z.; Lu, Y.; Liu, W.; Jiang, D.; Zheng, S.L. Systematic enrichment analysis of potentially functional regions for 103 prostate cancer risk-associated loci. Prostate 2015, 75, 1264–1276. [Google Scholar] [CrossRef] [PubMed]
- Zhang, P.; Tillmans, L.S.; Thibodeau, S.N.; Wang, L. Single-nucleotide polymorphisms sequencing identifies candidate functional variants at prostate cancer risk loci. Genes 2019, 10, 547. [Google Scholar] [CrossRef] [PubMed]
- Zhou, J.; Troyanskaya, O.G. Predicting effects of noncoding variants with deep learning–based sequence model. Nat. Methods 2015, 12, 931–934. [Google Scholar] [CrossRef] [PubMed]
- Dong, C.; Guo, Y.; Yang, H.; He, Z.; Liu, X.; Wang, K. iCAGES: Integrated CAncer GEnome Score for comprehensively prioritizing driver genes in personal cancer genomes. Genome Med. 2016, 8, 1–22. [Google Scholar] [CrossRef] [PubMed]
- Dong, S.; Boyle, A.P. Predicting functional variants in enhancer and promoter elements using RegulomeDB. Hum. Mutat. 2019, 40, 1292–1298. [Google Scholar] [CrossRef]
- Parhami, P.; Fateh, M.; Rezvani, M. A comparison of deep neural network models for cluster cancer patients through somatic point mutations. J. Ambient Intell. Humaniz. Comput. 2023, 14, 10883–10898. [Google Scholar] [CrossRef]
- Dashti, H.; Dehzangi, I.; Bayati, M.; Breen, J.; Beheshti, A.; Lovell, N. Integrative analysis of mutated genes and mutational processes reveals novel mutational biomarkers in colorectal cancer. BMC Bioinform. 2022, 23, 1–24. [Google Scholar] [CrossRef]
- Heidari, R.; Akbariqomi, M.; Asgari, Y.; Ebrahimi, D. A systematic review of long non-coding RNAs with a potential role in Breast Cancer. Mutat. Res. Rev. Mutat. Res. 2021, 787, 108375. [Google Scholar] [CrossRef]
- Ghareyazi, A.; Mohseni, A.; Dashti, H.; Beheshti, A.; Dehzangi, A.; Rabiee, H.R. Whole-genome analysis of de novo somatic point mutations reveals novel mutational biomarkers in pancreatic cancer. Cancers 2021, 13, 4376. [Google Scholar] [CrossRef] [PubMed]
- Bayati, M.; Rabiee, H.R.; Mehrbod, M.; Vafaee, F.; Ebrahimi, D.; Forrest, A.R. CANCERSIGN: A user-friendly and robust tool for identification and classification of mutational signatures and patterns in cancer genomes. Sci. Rep. 2020, 10, 1–11. [Google Scholar]
- Seim, I.; Jeffery, P.L.; Thomas, P.B.; Nelson, C.C.; Chopin, L.K. Whole-genome sequence of the metastatic PC3 and LNCaP human prostate cancer cell lines. G3 Genes Genomes Genet. 2017, 7, 1731–1741. [Google Scholar] [CrossRef] [PubMed]
- Woo, H.G.; Park, E.S.; Cheon, J.H.; Kim, J.H.; Lee, J.S.; Park, B.J.; Kim, W.; Park, S.C.; Chung, Y.J.; Kim, B.G.; et al. Gene expression–based recurrence prediction of hepatitis b virus–related human hepatocellular carcinoma. Clin. Cancer Res. 2008, 14, 2056–2064. [Google Scholar] [CrossRef]
- Harley, J.B.; Chen, X.; Pujato, M.; Miller, D.; Maddox, A.; Forney, C.; Magnusen, A.F.; Lynch, A.; Chetal, K.; Yukawa, M. Transcription factors operate across disease loci, with EBNA2 implicated in autoimmunity. Nat. Genet. 2018, 50, 699–707. [Google Scholar] [CrossRef] [PubMed]
- Chen, T.; Wang, Z.; Zhou, W.; Chong, Z.; Meric-Bernstam, F.; Mills, G.B.; Chen, K. Hotspot mutations delineating diverse mutational signatures and biological utilities across cancer types. BMC Genom. 2016, 17, 249–262. [Google Scholar] [CrossRef] [PubMed]
- Nesta, A.V.; Tafur, D.; Beck, C.R. Hotspots of human mutation. Trends Genet. 2021, 37, 717–729. [Google Scholar] [CrossRef]
- Zhang, J.; Baran, J.; Cros, A.; Guberman, J.M.; Haider, S.; Hsu, J.; Liang, Y.; Rivkin, E.; Wang, J.; Whitty, B. International Cancer Genome Consortium Data Portal—A one-stop shop for cancer genomics data. Database 2011, 2011, bar026. [Google Scholar] [CrossRef] [PubMed]
- Consortium, G.P. A global reference for human genetic variation. Nature 2015, 526, 68. [Google Scholar] [CrossRef] [PubMed]
- Labani, M.; Afrasiabi, A.; Beheshti, A.; Lovell, N.H.; Alinejad-Rokny, H. PeakCNV: A multi-feature ranking algorithm-based tool for genome-wide copy number variation-association study. Comput. Struct. Biotechnol. J. 2022, 20, 4975–4983. [Google Scholar] [CrossRef] [PubMed]
- Servant, N.; Varoquaux, N.; Lajoie, B.R.; Viara, E.; Chen, C.-J.; Vert, J.-P.; Heard, E.; Dekker, J.; Barillot, E. HiC-Pro: An optimized and flexible pipeline for Hi-C data processing. Genome Biol. 2015, 16, 1–11. [Google Scholar] [CrossRef]
- Alinejad-Rokny, H.; Ghavami Modegh, R.; Rabiee, H.R.; Ramezani Sarbandi, E.; Rezaie, N.; Tam, K.T.; Forrest, A.R. MaxHiC: A robust background correction model to identify biologically relevant chromatin interactions in Hi-C and capture Hi-C experiments. PLOS Comput. Biol. 2022, 18, e1010241. [Google Scholar] [CrossRef]
- Khakmardan, S.; Rezvani, M.; Pouyan, A.A.; Fateh, M.; Alinejad-Rokny, H. MHiC, an integrated user-friendly tool for the identification and visualization of significant interactions in Hi-C data. BMC Genom. 2020, 21, 1–10. [Google Scholar] [CrossRef]
- Bicak, M.; Wang, X.; Gao, X.; Xu, X.; Väänänen, R.-M.; Taimen, P.; Lilja, H.; Pettersson, K.; Klein, R.J. Prostate cancer risk SNP rs10993994 is a trans-eQTL for SNHG11 mediated through MSMB. Hum. Mol. Genet. 2020, 29, 1581–1591. [Google Scholar] [CrossRef]
- Misawa, A.; Takayama, K.i.; Inoue, S. Long non-coding RNAs and prostate cancer. Cancer Sci. 2017, 108, 2107–2114. [Google Scholar] [CrossRef]
- Leite, K.R.; Franco, M.F.; Srougi, M.; Nesrallah, L.J.; Nesrallah, A.; Bevilacqua, R.G.; Darini, E.; Carvalho, C.M.; Meirelles, M.I.; Santana, I. Abnormal expression of MDM2 in prostate carcinoma. Mod. Pathol. 2001, 14, 428–436. [Google Scholar] [CrossRef]
- Mertz, K.D.; Pathria, G.; Wagner, C.; Saarikangas, J.; Sboner, A.; Romanov, J.; Gschaider, M.; Lenz, F.; Neumann, F.; Schreiner, W. MTSS1 is a metastasis driver in a subset of human melanomas. Nat. Commun. 2014, 5, 1–11. [Google Scholar] [CrossRef]
- Braune, K.; Volkmer, I.; Staege, M.S. Characterization of alstrom syndrome 1 (ALMS1) transcript variants in hodgkin lymphoma cells. PLoS ONE 2017, 12, e0170694. [Google Scholar] [CrossRef] [PubMed]
- Ge, S.X.; Jung, D.; Yao, R. ShinyGO: A graphical gene-set enrichment tool for animals and plants. Bioinformatics 2020, 36, 2628–2629. [Google Scholar] [CrossRef] [PubMed]
- Łastowska, M.; Viprey, V.; Santibanez-Koref, M.; Wappler, I.; Peters, H.; Cullinane, C.; Roberts, P.; Hall, A.G.; Tweddle, D.A.; Pearson, A.D.J.; et al. Identification of candidate genes involved in neuroblastoma progression by combining genomic and expression microarrays with survival data. Oncogene 2007, 26, 7432–7444. [Google Scholar] [CrossRef]
- Szklarczyk, D.; Gable, A.L.; Nastou, K.C.; Lyon, D.; Kirsch, R.; Pyysalo, S.; Doncheva, N.T.; Legeay, M.; Fang, T.; Bork, P.; et al. The STRING database in 2021: Customizable protein–protein networks, and functional characterization of user-uploaded gene/measurement sets. Nucleic Acids Res. 2021, 49, D605–D612. [Google Scholar] [CrossRef]
- Van’t Veer, L.J.; Dai, H.; Van De Vijver, M.J.; He, Y.D.; Hart, A.A.; Mao, M.; Peterse, H.L.; Van Der Kooy, K.; Marton, M.J.; Witteveen, A.T. Gene expression profiling predicts clinical outcome of breast cancer. nature 2002, 415, 530–536. [Google Scholar] [CrossRef] [PubMed]
- Arbuthnot, P.; Kew, M. Hepatitis B virus and hepatocellular carcinoma. Int. J. Exp. Pathol. 2001, 82, 77–100. [Google Scholar] [CrossRef]
- Szklarczyk, D.; Franceschini, A.; Wyder, S.; Forslund, K.; Heller, D.; Huerta-Cepas, J.; Simonovic, M.; Roth, A.; Santos, A.; Tsafou, K.P. STRING v10: Protein–protein interaction networks, integrated over the tree of life. Nucleic Acids Res. 2015, 43, D447–D452. [Google Scholar] [CrossRef]
- George, C.L. Analyzing ZNF16: An Understudied Gene. The University of Texas at El Paso, 2020. [Google Scholar]
- Balajee, A.S. Human recql4 as a novel molecular target for cancer therapy. Cytogenet. Genome Res. 2021, 161, 305–327. [Google Scholar] [CrossRef]
- Su, Y.; Meador, J.A.; Calaf, G.M.; De-Santis, L.P.; Zhao, Y.; Bohr, V.A.; Balajee, A.S. Human RecQL4 helicase plays critical roles in prostate carcinogenesis. Cancer Res. 2010, 70, 9207–9217. [Google Scholar] [CrossRef]
- Nasab, R.Z.; Ghamsari, M.R.E.; Argha, A.; Macphillamy, C.; Beheshti, A.; Alizadehsani, R.; Lovell, N.H.; Lotfollahi, M.; Alinejad-Rokny, H. Deep Learning in Spatially Resolved Transcriptomics: A Comprehensive Technical View. arXiv 2022, arXiv:2210.04453. [Google Scholar]
- Razzak, I.; Naz, S.; Alinejad-Rokny, H.; Nguyen, T.N.; Khalifa, F. A Cascaded Mutliresolution Ensemble Deep Learning Framework for Large Scale Alzheimer’s Disease Detection using Brain MRIs. IEEE/ACM Trans. Comput. Biol. Bioinform. 2022, 2022, 1–9. [Google Scholar] [CrossRef] [PubMed]
- Argha, A.; Celler, B.G.; Alinejad-Rokny, H.; Lovell, N.H. Blood Pressure Estimation From Korotkoff Sound Signals Using an End-to-End Deep-Learning-Based Algorithm. IEEE Trans. Instrum. Meas. 2022, 71, 1–10. [Google Scholar] [CrossRef]
- Consortium, I.C.G. International network of cancer genome projects. Nature 2010, 464, 993. [Google Scholar]
- Karolchik, D.; Baertsch, R.; Diekhans, M.; Furey, T.S.; Hinrichs, A.; Lu, Y.; Roskin, K.M.; Schwartz, M.; Sugnet, C.W.; Thomas, D.J. The UCSC genome browser database. Nucleic Acids Res. 2003, 31, 51–54. [Google Scholar] [CrossRef] [PubMed]
- Alinejad-Rokny, H.; Heng, J.I.; Forrest, A.R. Brain-enriched coding and long non-coding RNA genes are overrepresented in recurrent neurodevelopmental disorder CNVs. Cell Rep. 2020, 33, 108307. [Google Scholar] [CrossRef]
- Lizio, M.; Harshbarger, J.; Shimoji, H.; Severin, J.; Kasukawa, T.; Sahin, S.; Abugessaisa, I.; Fukuda, S.; Hori, F.; Ishikawa-Kato, S. Gateways to the FANTOM5 promoter level mammalian expression atlas. Genome Biol. 2015, 16, 1–14. [Google Scholar] [CrossRef] [PubMed]
- Yates, A.D.; Achuthan, P.; Akanni, W.; Allen, J.; Allen, J.; Alvarez-Jarreta, J.; Amode, M.R.; Armean, I.M.; Azov, A.G.; Bennett, R. Ensembl 2020. Nucleic Acids Res. 2020, 48, D682–D688. [Google Scholar] [CrossRef]
- Consortium, E.P. An integrated encyclopedia of DNA elements in the human genome. Nature 2012, 489, 57. [Google Scholar] [CrossRef]
- Quinlan, A.R.; Hall, I.M. BEDTools: A flexible suite of utilities for comparing genomic features. Bioinformatics 2010, 26, 841–842. [Google Scholar] [CrossRef]
- Labani, M.; Beheshti, A.; Lovell, N.H.; Alinejad-Rokny, H.; Afrasiabi, A. KARAJ: An Efficient Adaptive Multi-Processor Tool to Streamline Genomic and Transcriptomic Sequence Data Acquisition. Int. J. Mol. Sci. 2022, 23, 14418. [Google Scholar] [CrossRef]
- Taberlay, P.C.; Achinger-Kawecka, J.; Lun, A.T.; Buske, F.A.; Sabir, K.; Gould, C.M.; Zotenko, E.; Bert, S.A.; Giles, K.A.; Bauer, D.C. Three-dimensional disorganization of the cancer genome occurs coincident with long-range genetic and epigenetic alterations. Genome Res. 2016, 26, 719–731. [Google Scholar] [CrossRef] [PubMed]
- Servant, N.; Varoquaux, N.; Lajoie, B.R.; Viara, E.; Chen, C.-J.; Vert, J.-P.; Heard, E.; Dekker, J.; Barillot, E. HiC-Pro: An optimized and flexible pipeline for Hi-C data processing. Genome Biol. 2015, 16, 259. [Google Scholar] [CrossRef] [PubMed]
- Druliner, B.R.; Vera, D.; Johnson, R.; Ruan, X.; Apone, L.M.; Dimalanta, E.T.; Stewart, F.J.; Boardman, L.; Dennis, J.H. Comprehensive nucleosome mapping of the human genome in cancer progression. Oncotarget 2016, 7, 13429. [Google Scholar] [CrossRef]
- Langmead, B.; Trapnell, C.; Pop, M.; Salzberg, S.L. Ultrafast and memory-efficient alignment of short DNA sequences to the human genome. Genome Biol. 2009, 10, 1–10. [Google Scholar] [CrossRef] [PubMed]
- Feng, J.; Liu, T.; Qin, B.; Zhang, Y.; Liu, X.S. Identifying ChIP-seq enrichment using MACS. Nat. Protoc. 2012, 7, 1728–1740. [Google Scholar] [CrossRef]
- Rajaei, P.; Jahanian, K.H.; Beheshti, A.; Band, S.S.; Dehzangi, A.; Alinejad-Rokny, H. VIRMOTIF: A user-friendly tool for viral sequence analysis. Genes 2021, 12, 186. [Google Scholar] [CrossRef] [PubMed]
- Pho, K.H.; Akbarzadeh, H.; Parvin, H.; Nejatian, S.; Alinejad-Rokny, H. A multi-level consensus function clustering ensemble. Soft Comput. 2021, 25, 13147–13165. [Google Scholar] [CrossRef]
- Mahmoudi, M.R.; Akbarzadeh, H.; Parvin, H.; Nejatian, S.; Rezaie, V.; Alinejad-Rokny, H. Consensus function based on cluster-wise two level clustering. Artif. Intell. Rev. 2021, 54, 639–665. [Google Scholar] [CrossRef]
- Hosseinpoor, M.; Parvin, H.; Nejatian, S.; Rezaie, V.; Bagherifard, K.; Dehzangi, A.; Beheshti, A.; Alinejad-Rokny, H. Proposing a novel community detection approach to identify cointeracting genomic regions. Math. Biosci. Eng. 2020, 17, 2193–2217. [Google Scholar] [CrossRef]
- Bahrani, P.; Minaei-Bidgoli, B.; Parvin, H.; Mirzarezaee, M.; Keshavarz, A.; Alinejad-Rokny, H. User and item profile expansion for dealing with cold start problem. J. Intell. Fuzzy Syst. 2020, 38, 4471–4483. [Google Scholar] [CrossRef]
- Alinejad-Rokny, H. Proposing on Optimized Homolographic Motif Mining Strategy Based on Parallel Computing for Complex Biological Networks. J. Med. Imaging Health Inform. 2016, 6, 416–424. [Google Scholar] [CrossRef]
- Alinejad-Rokny, H.; Pourshaban, H.; Orimi, A.G.; Baboli, M.M. Network motifs detection strategies and using for bioinformatic networks. J. Bionanoscience 2014, 8, 353–359. [Google Scholar] [CrossRef]
- Ahmadinia, M.; Alinejad-Rokny, H.; Ahangarikiasari, H. Data aggregation in wireless sensor networks based on environmental similarity: A learning automata approach. J. Netw. 2014, 9, 2567. [Google Scholar] [CrossRef]
- Parvin, H.; Alinejad-Rokny, H.; Minaei-Bidgoli, B.; Parvin, S. A new classifier ensemble methodology based on subspace learning. J. Exp. Theor. Artif. Intell. 2013, 25, 227–250. [Google Scholar] [CrossRef]
- Parvin, H.; Alinejad-Rokny, H.; Parvin, S. A classifier ensemble of binary classifier ensembles. Int. J. Learn. Manag. Syst. 2013, 1, 37–47. [Google Scholar] [CrossRef] [PubMed]
- Javanmard, R.; JeddiSaravi, K.; Alinejad-Rokny, H. Proposed a new method for rules extraction using artificial neural network and artificial immune system in cancer diagnosis. J. Bionanoscience 2013, 7, 665–672. [Google Scholar] [CrossRef]
- Parvin, H.; Alinejad-Rokny, H.; Seyedaghaee, N.; Parvin, S. A heuristic scalable classifier ensemble of binary classifier ensembles. J. Bioinform. Intell. Control 2012, 1, 163–170. [Google Scholar] [CrossRef]
- Hasanzadeh, E.; Poyan, M.; Alinejad-Rokny, H. Text clustering on latent semantic indexing with particle swarm optimization (PSO) algorithm. Int. J. Phys. Sci. 2012, 7, 16–120. [Google Scholar] [CrossRef]
- Esmaeili, L.; Minaei-Bidgoli, B.; Alinejad-Rokny, H.; Nasiri, M. Hybrid recommender system for joining virtual communities. Res. J. Appl. Sci. Eng. Technol. 2012, 4, 500–509. [Google Scholar]
- Parvin, H.; Alinejad, H.; Minaei-Bidgoli, B. Using Clustering for Generating Diversity in Classifier Ensemble. JDCTA 2011, 3, 51–57. [Google Scholar] [CrossRef]
- Parvin, H.; Alinejad-Rokny, H.; Asadi, M. An ensemble based approach for feature selection. J. Appl. Sci. Res. 2011, 9, 33–43. [Google Scholar]
- Alinejad-Rokny, H.; Pedram, M.M.; Shirgahi, H. Discovered motifs with using parallel Mprefixspan method. Sci. Res. Essays 2011, 6, 4220–4226. [Google Scholar]
- Alinejad-Rokny, H.; Sadroddiny, E.; Scaria, V. Machine learning and data mining techniques for medical complex data analysis. Neurocomputing 2018, 276, 10–1016. [Google Scholar] [CrossRef]
- Niu, H.; Khozouie, N.; Parvin, H.; Alinejad-Rokny, H.; Beheshti, A.; Mahmoudi, M.R. An ensemble of locally reliable cluster solutions. Appl. Sci. 2020, 10, 1891. [Google Scholar] [CrossRef]
- Niu, H.; Xu, W.; Akbarzadeh, H.; Parvin, H.; Beheshti, A.; Alinejad-Rokny, H. Deep feature learnt by conventional deep neural network. Comput. Electr. Eng. 2020, 84, 106656. [Google Scholar] [CrossRef]
- Parvin, H.; MirnabiBaboli, M.; Alinejad-Rokny, H. Proposing a classifier ensemble framework based on classifier selection and decision tree. Eng. Appl. Artif. Intell. 2015, 34–42. [Google Scholar] [CrossRef]
- Parvin, H.; Alinejad-Rokny, H.; Minaei-Bidgoli, B. Detection of cancer patients using an innovative method for learning at imbalanced datasets. In Proceedings of the International Conference on Rough Sets and Knowledge Technology; pp. 376–381.
- Andrew, S. A quality control tool for high throughput sequence data. Fast QC 2010, 390, 391. [Google Scholar]
- Bolger, A.M.; Lohse, M.; Usadel, B. Trimmomatic: A flexible trimmer for Illumina sequence data. Bioinformatics 2014, 30, 2114–2120. [Google Scholar] [CrossRef]
- Li, H. Aligning sequence reads, clone sequences and assembly contigs with BWA-MEM. arXiv 2013, arXiv:1303.3997. [Google Scholar]
- Li, H.; Handsaker, B.; Wysoker, A.; Fennell, T.; Ruan, J.; Homer, N.; Marth, G.; Abecasis, G.; Durbin, R. The sequence alignment/map format and SAMtools. Bioinformatics 2009, 25, 2078–2079. [Google Scholar] [CrossRef] [PubMed]
- Li, H.; Handsaker, B.; Wysoker, A.; Fennell, T.; Ruan, J.; Homer, N.; Marth, G.; Abecasis, G.; Durbin, R. 1000 Genome Project Data Processing Subgroup. 2009. The sequence alignment/map format and samtools. Bioinformatics 2009, 25, 2078–2079. [Google Scholar] [CrossRef] [PubMed]
- Boeva, V.; Popova, T.; Bleakley, K.; Chiche, P.; Cappo, J.; Schleiermacher, G.; Janoueix-Lerosey, I.; Delattre, O.; Barillot, E. Control-FREEC: A tool for assessing copy number and allelic content using next-generation sequencing data. Bioinformatics 2012, 28, 423–425. [Google Scholar] [CrossRef]
- Zhou, X.; Lowdon, R.F.; Li, D.; Lawson, H.A.; Madden, P.A.; Costello, J.F.; Wang, T. Exploring long-range genome interactions using the WashU Epigenome Browser. Nat. Methods 2013, 10, 375–376. [Google Scholar] [CrossRef]
- Kanehisa, M.; Goto, S. KEGG: Kyoto encyclopedia of genes and genomes. Nucleic Acids Res. 2000, 28, 27–30. [Google Scholar] [CrossRef] [PubMed]
- Liberzon, A.; Birger, C.; Thorvaldsdóttir, H.; Ghandi, M.; Mesirov, J.P.; Tamayo, P. The molecular signatures database hallmark gene set collection. Cell Syst. 2015, 1, 417–425. [Google Scholar] [CrossRef]
- Araki, H.; Knapp, C.; Tsai, P.; Print, C. GeneSetDB: A comprehensive meta-database, statistical and visualisation framework for gene set analysis. FEBS Open Bio 2012, 2, 76–82. [Google Scholar] [CrossRef]
- Fabregat, A.; Jupe, S.; Matthews, L.; Sidiropoulos, K.; Gillespie, M.; Garapati, P.; Haw, R.; Jassal, B.; Korninger, F.; May, B. The reactome pathway knowledgebase. Nucleic Acids Res. 2018, 46, D649–D655. [Google Scholar] [CrossRef]
- Szklarczyk, D.; Morris, J.H.; Cook, H.; Kuhn, M.; Wyder, S.; Simonovic, M.; Santos, A.; Doncheva, N.T.; Roth, A.; Bork, P. The STRING database in 2017: Quality-controlled protein–protein association networks, made broadly accessible. Nucleic Acids Res. 2016, gkw937. [Google Scholar] [CrossRef]

Disclaimer/Publisher’s Note: The statements, opinions and data contained in all publications are solely those of the individual author(s) and contributor(s) and not of MDPI and/or the editor(s). MDPI and/or the editor(s) disclaim responsibility for any injury to people or property resulting from any ideas, methods, instructions or products referred to in the content. |
© 2023 by the authors. Licensee MDPI, Basel, Switzerland. This article is an open access article distributed under the terms and conditions of the Creative Commons Attribution (CC BY) license (http://creativecommons.org/licenses/by/4.0/).


