1. Introduction
Active yaw control (AYC) is a wind farm control strategy that has recently attracted wide interest in the wind energy community. When wind farm operators apply AYC, they intentionally yaw upwind turbines to steer their wakes away from downwind turbines. While the yawed turbines reduce their power outputs, with a proper AYC strategy, the wind farm can yield more power and endure less structural fatigue because wake interference between wind turbines is mitigated.
Several experimental [
1,
2,
3,
4,
5,
6] and computational [
7,
8,
9,
10,
11,
12] studies have been conducted to investigate the effectiveness of AYC for wind farm power optimisation. Recently, there has been growing interest among wind energy researchers in jointly considering fatigue reduction and power optimisation when applying AYC. Kragh and Hansen [
13] first pointed out the potential of AYC for reducing load variations on wind turbine blades caused by vertical wind shear. Zalkind and Pao [
14] later investigated the fatigue loads of a stand-alone wind turbine at different yaw angles. They found that for a clockwise-rotating (when viewed from the front) wind turbine in vertically sheared wind, positive yaw strategies (counter-clockwise yaw when viewed from the top) decrease the damage equivalent load (DEL) of the out-of-plane (OOP) blade bending moment, while negative yaw strategies increase it. Using large-eddy simulation (LES), Fleming et al. [
15] studied a two-turbine case subjected to AYC in the full-wake condition, and they reported that applying proper positive yaw strategies can increase power outputs and reduce turbine fatigue. Damiani et al. [
16] measured the component loads acting on a utility-scale turbine under yaw conditions and also confirmed the dichotomy of positive yaw and negative yaw in wind turbine loads.
With the studies mentioned above confirming the potential of AYC for achieving power gain and fatigue reduction, wind energy researchers have conducted several optimisation studies that applied AYC to wind farms. Gebraad et al. [
17] optimised the annual power production of a hypothetical wind farm with AYC using a parametric wake model. Dijk et al. [
18] further incorporated a simplified load model into the wake model used in [
17] and performed a multi-objective optimisation of the power production and fatigue loads of a hypothetical wind farm subjected to AYC. Using a reduced-order flow solver, Kanev et al. [
19] applied AYC to real-world wind farms to optimise the lifetime power production and fatigue loading. Reyes et al. [
20] developed a computationally cheap look-up table approach to optimise fatigue loads in wind farms and validated it with wind tunnel and full-scale field tests. Lin and Porté-Agel [
21] used LES to investigate Pareto-optimal AYC strategies for an array of three miniature wind turbines to maximise power production and minimise fatigue loads. They found that Pareto-optimal yaw strategies with gradually decreasing yaw angles from upwind to downwind turbines.
As shown in the literature, AYC can potentially increase the power outputs and mitigate the fatigue loads of a wind farm with proper yaw strategies. However, a poorly chosen yaw strategy can also significantly increase wind turbine fatigue loads while only achieving marginal power gains. Therefore, the main objective of this study is to understand how the application of different AYC strategies affects the power production and fatigue loading for a wind farm under various inflow configurations.
The rest of the paper is structured as follows: in
Section 2, we discuss the two-way coupled aeroelastic LES frameworks used in this study and the methodology for evaluating power production and fatigue loads; in
Section 3, we present the results of the simulations using different configurations; in
Section 4, we present a theoretical analysis on the differences in flapwise blade fatigue in the turbines under positive and negative yaw strategies; in
Section 5, we present the conclusions drawn from these findings and discuss possible extensions of this study.
2. Methodology
2.1. Governing equations
This study uses the GPU-accelerated version of the in-house WiRE-LES code [
12,
22,
23,
24], which solves the spatially-filtered, incompressible Navier-Stokes equations:
where the subscript
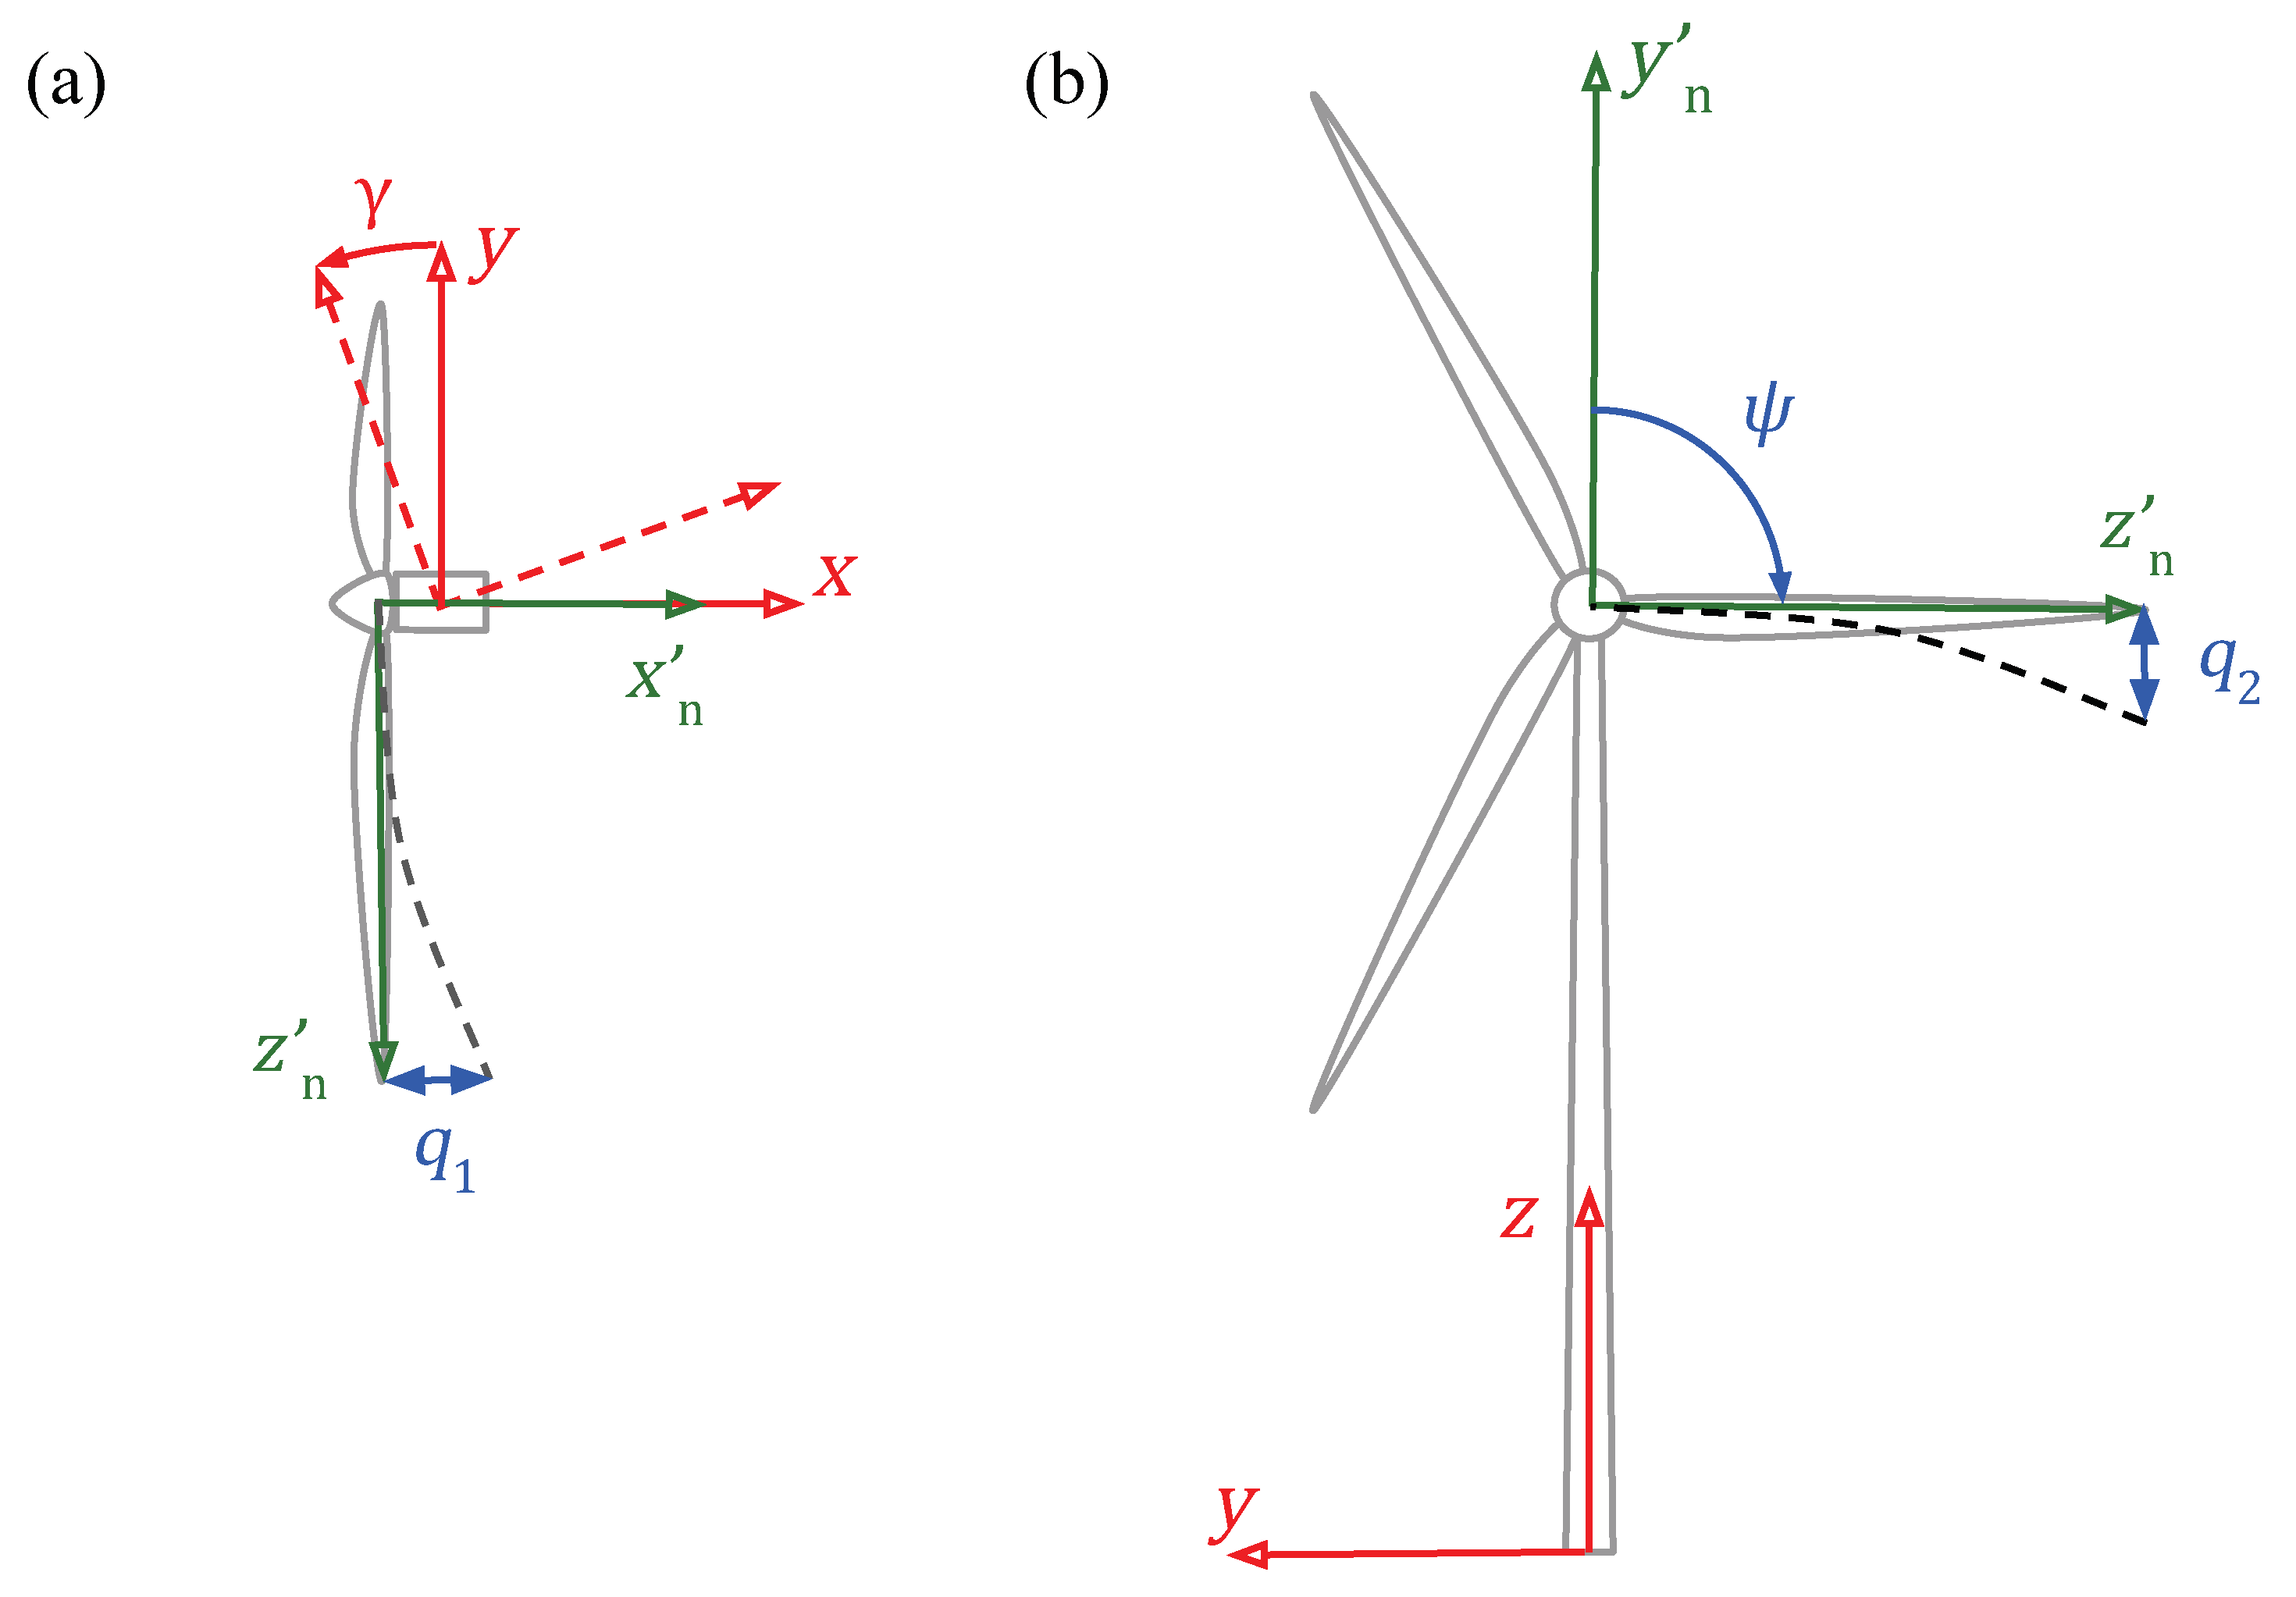
i represents the streamwise (
), spanwise (
) and vertical (
) directions of the ground-fixed coordinate system
x -
y -
z Figure 1), respectively,
is the spatially filtered flow velocity,
is the modified kinematic pressure,
is the pressure gradient imposed to the flow,
is the kinematic sub-grid scale stress, and
represents the forces exerted by the wind turbine blades, the nacelle, and the tower on the flow.
To incorporate aeroelasticity in the simulation, we treat the rotating wind turbine blades as 1D Euler-Bernoulli beams governed by the dynamic Euler-Bernoulli equations [
25]:
where the subscript
k specifies the flapwise (
) and edgewise (
) directions of the blade-following coordinate system
-
-
for the
nth blade (
Figure 1),
r is the distance between the blade element and the hub centre,
is the blade deformation,
is the blade bending moment,
is the component of gravitational acceleration in the
kth direction,
is the blade mass per unit length,
is the aerodynamic load exerted by the flow on the blade,
is the stiffness matrix of the blade section, and
is the rotational speed of the rotor.
2.2. Simulation setup
In the WiRE-LES code, the filtered Navier-Stokes equations are solved numerically using the pseudo-spectral method in the horizontal directions (
x and
y) and the second-order finite-difference scheme in the vertical direction
z. Time integration is done using the second-order Adam-Bashforth method. The sub-grid scale stress term is parametrised by the modulated gradient model [
26]. The body forces induced by the wind-turbine blades are parametrised by the elastic actuator line model (EALM) proposed by Meng et al. [
25]. The EALM simultaneously resolves the aerodynamic forces on turbine blade elements as the classical ALM [
27] and solves the discretised Euler-Bernoulli beam equations using the finite-difference time-domain method to obtain blade deformations. The deformations are then used to update the ALM calculation in the next time step. The two-way coupling procedure in the EALM is summarised in
Figure 2.
In this study, the simulation domain (
= 4096 m × 2048 m × 1024 m), shown in
Figure 3, is discretised into a
grid uniformly in each direction. A wind-turbine array consisting of three NREL 5 MW reference wind turbines [
28], with a 7D distance between each turbine, is placed in the simulation domain. The wind turbines are not tilted. The first two wind turbines are subjected to yaw control, while the last turbine is not yawed. In the vertical direction (
z) of the domain, a slip-wall boundary condition is applied to the top, and a non-penetration wall boundary condition with specified stresses according to the logarithmic law of the wall is applied to the bottom. Periodic boundary conditions are applied to the lateral boundaries in the horizontal directions. The inflow is generated by a precursor simulation without the wind turbine array and is then imposed at the inlet section of the simulation domain with wind turbines. A buffer section is added in front of the inflow section to transform the flow from the outlet to the inlet of the simulation domain through a smooth weighting function. The mean streamwise hub-height inflow velocity
m/s, and the streamwise hub-height inflow turbulence
%.
2.3. Fatigue evaluation
In this study, wind turbine fatigue damage is quantified by the damage equivalent loads (DELs) of blade-root bending moments (flapwise and edgewise). The procedures for computing DELs are listed as follows [
29]:
Extract time series of blade-root bending moments from the LES coupled with the EALM.
Apply the rainflow cycle-counting algorithm and extract the histograms of load-cycle means and load-cycle ranges .
Use Goodman’s rule to correct the effect of mean loads on fatigue damages and obtain the corrected cycle range
for the
kth bin of the histogram:
where
is the maximum bending moment of the time series,
is a safety factor, and its value is chosen as 1.5 [
30].
Use the Palmgren-Miner rule, which assumes linear accumulation of fatigue damages, to compute DELs:
where
is the total bin number of the histogram extracted from the rainflow cycle-counting,
is the cycle count of the
kth bin of the histogram,
is the reference cycle number, and
m is a material parameter which takes the value of 10 for composite materials.
3. Simulation Results
In this section, we present the simulation results of different AYC strategies in full-wake and partial-wake configurations. The AYC decision space is spanned by the yaw angles of the first two turbines in the array (WT 1 and WT 2):
, and the yaw angle of the last turbine is fixed to
. A time window of 800 s is chosen to extract the mean velocity fields, mean power outputs and fatigue loads based on the recommendations of IEC standards [
30].
3.1. Velocity deficits
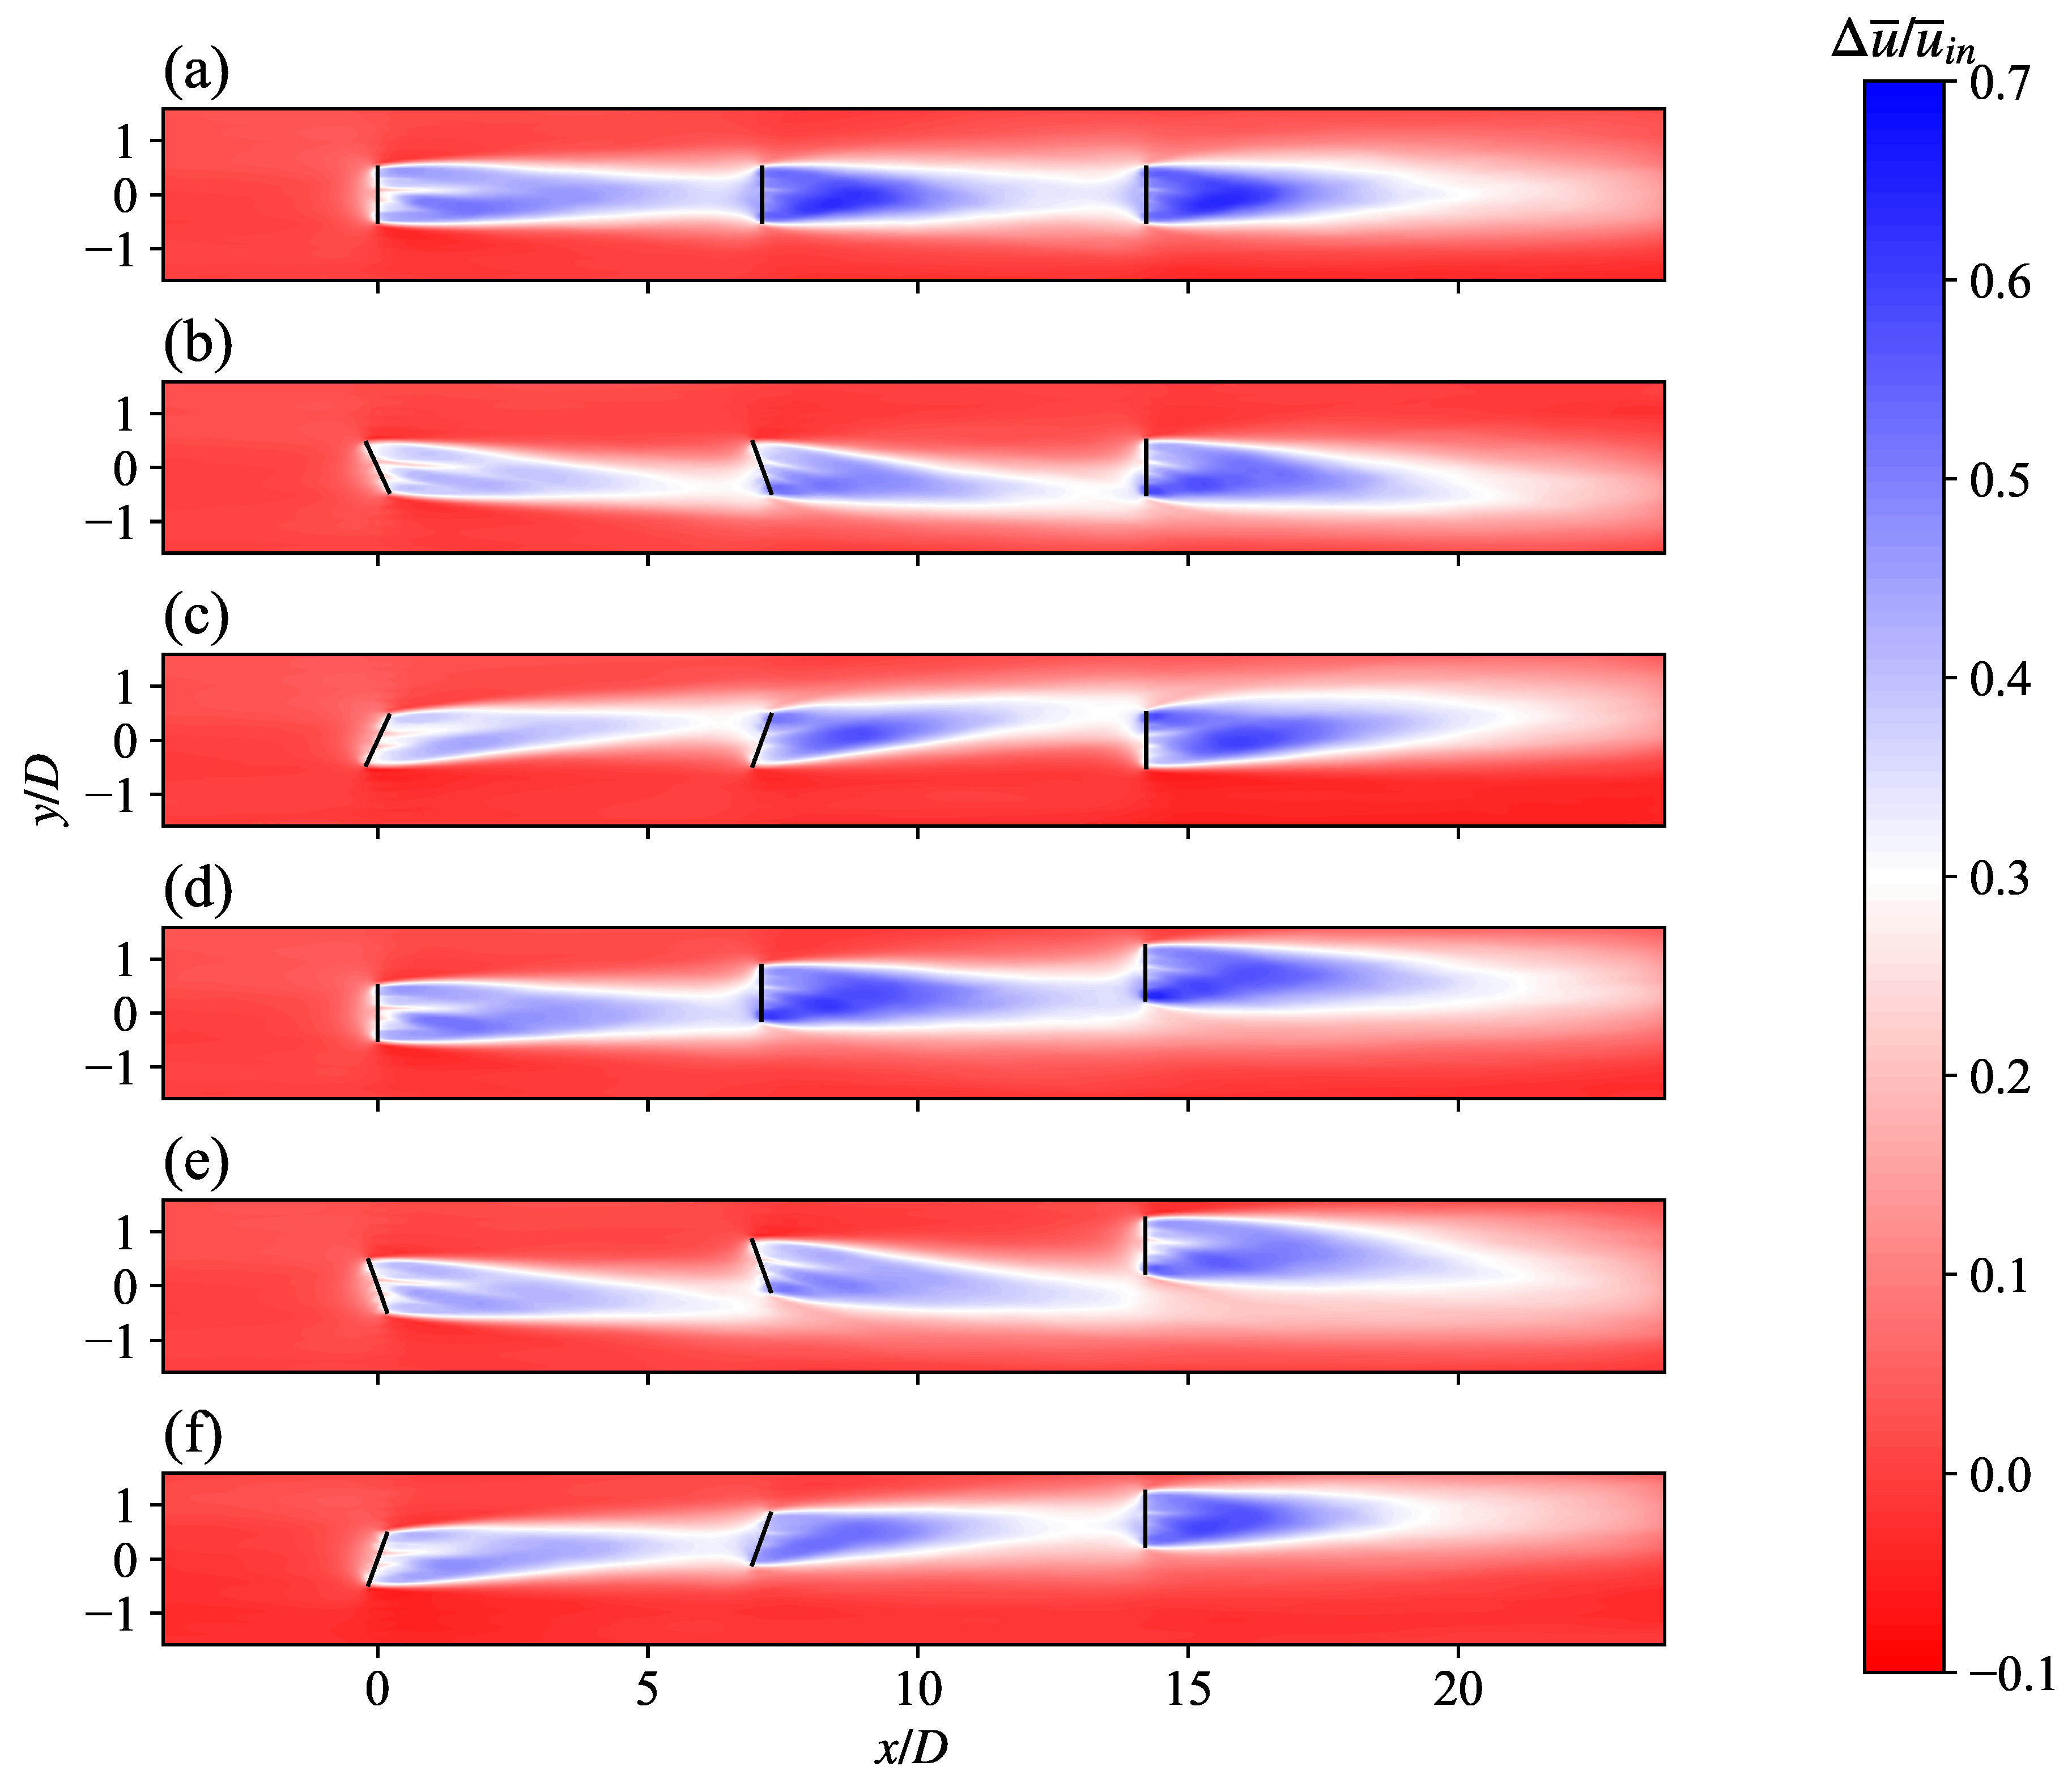
Figure 4 shows the contours of normalised mean streamwise velocity deficits
of six representative cases (
Table 1) in the horizontal
x -
y plane at the hub height. The wind turbine array is in full-wake configuration
in Cases (a-c) and partial-wake configuration
in Cases (d-f).
When the turbine array is in full-wake configuration
(
Figure 4a -
Figure 4c), we observe that applying positive and negative yaw strategies deflects the wakes of upwind turbines away from downwind turbines. However, when the array is in partial-wake configuration
(
Figure 4d -
Figure 4f), the positive yaw strategy is clearly more favourable due to the spanwise offset of the turbines: in
Figure 4e, wake interference is largely avoided by applying positive yaw, whereas in
Figure 4f, the application of negative yaw aggravates the interference of the wakes. We also observe the phenomenon of secondary wake deflection in the results, i.e., the additional deflection in the wake of a non-yawed turbine exposed to the wake of the yawed upwind turbine. For example, as shown in
Figure 4b and
Figure 4c, although WT 3 itself is not yawed, the wake of WT 3 is still deflected when the turbine is exposed to the wake of the yawed upwind turbine. The secondary wake deflection is caused by the non-zero cross-flow in the wake of the yawed upwind turbine [
31,
32].
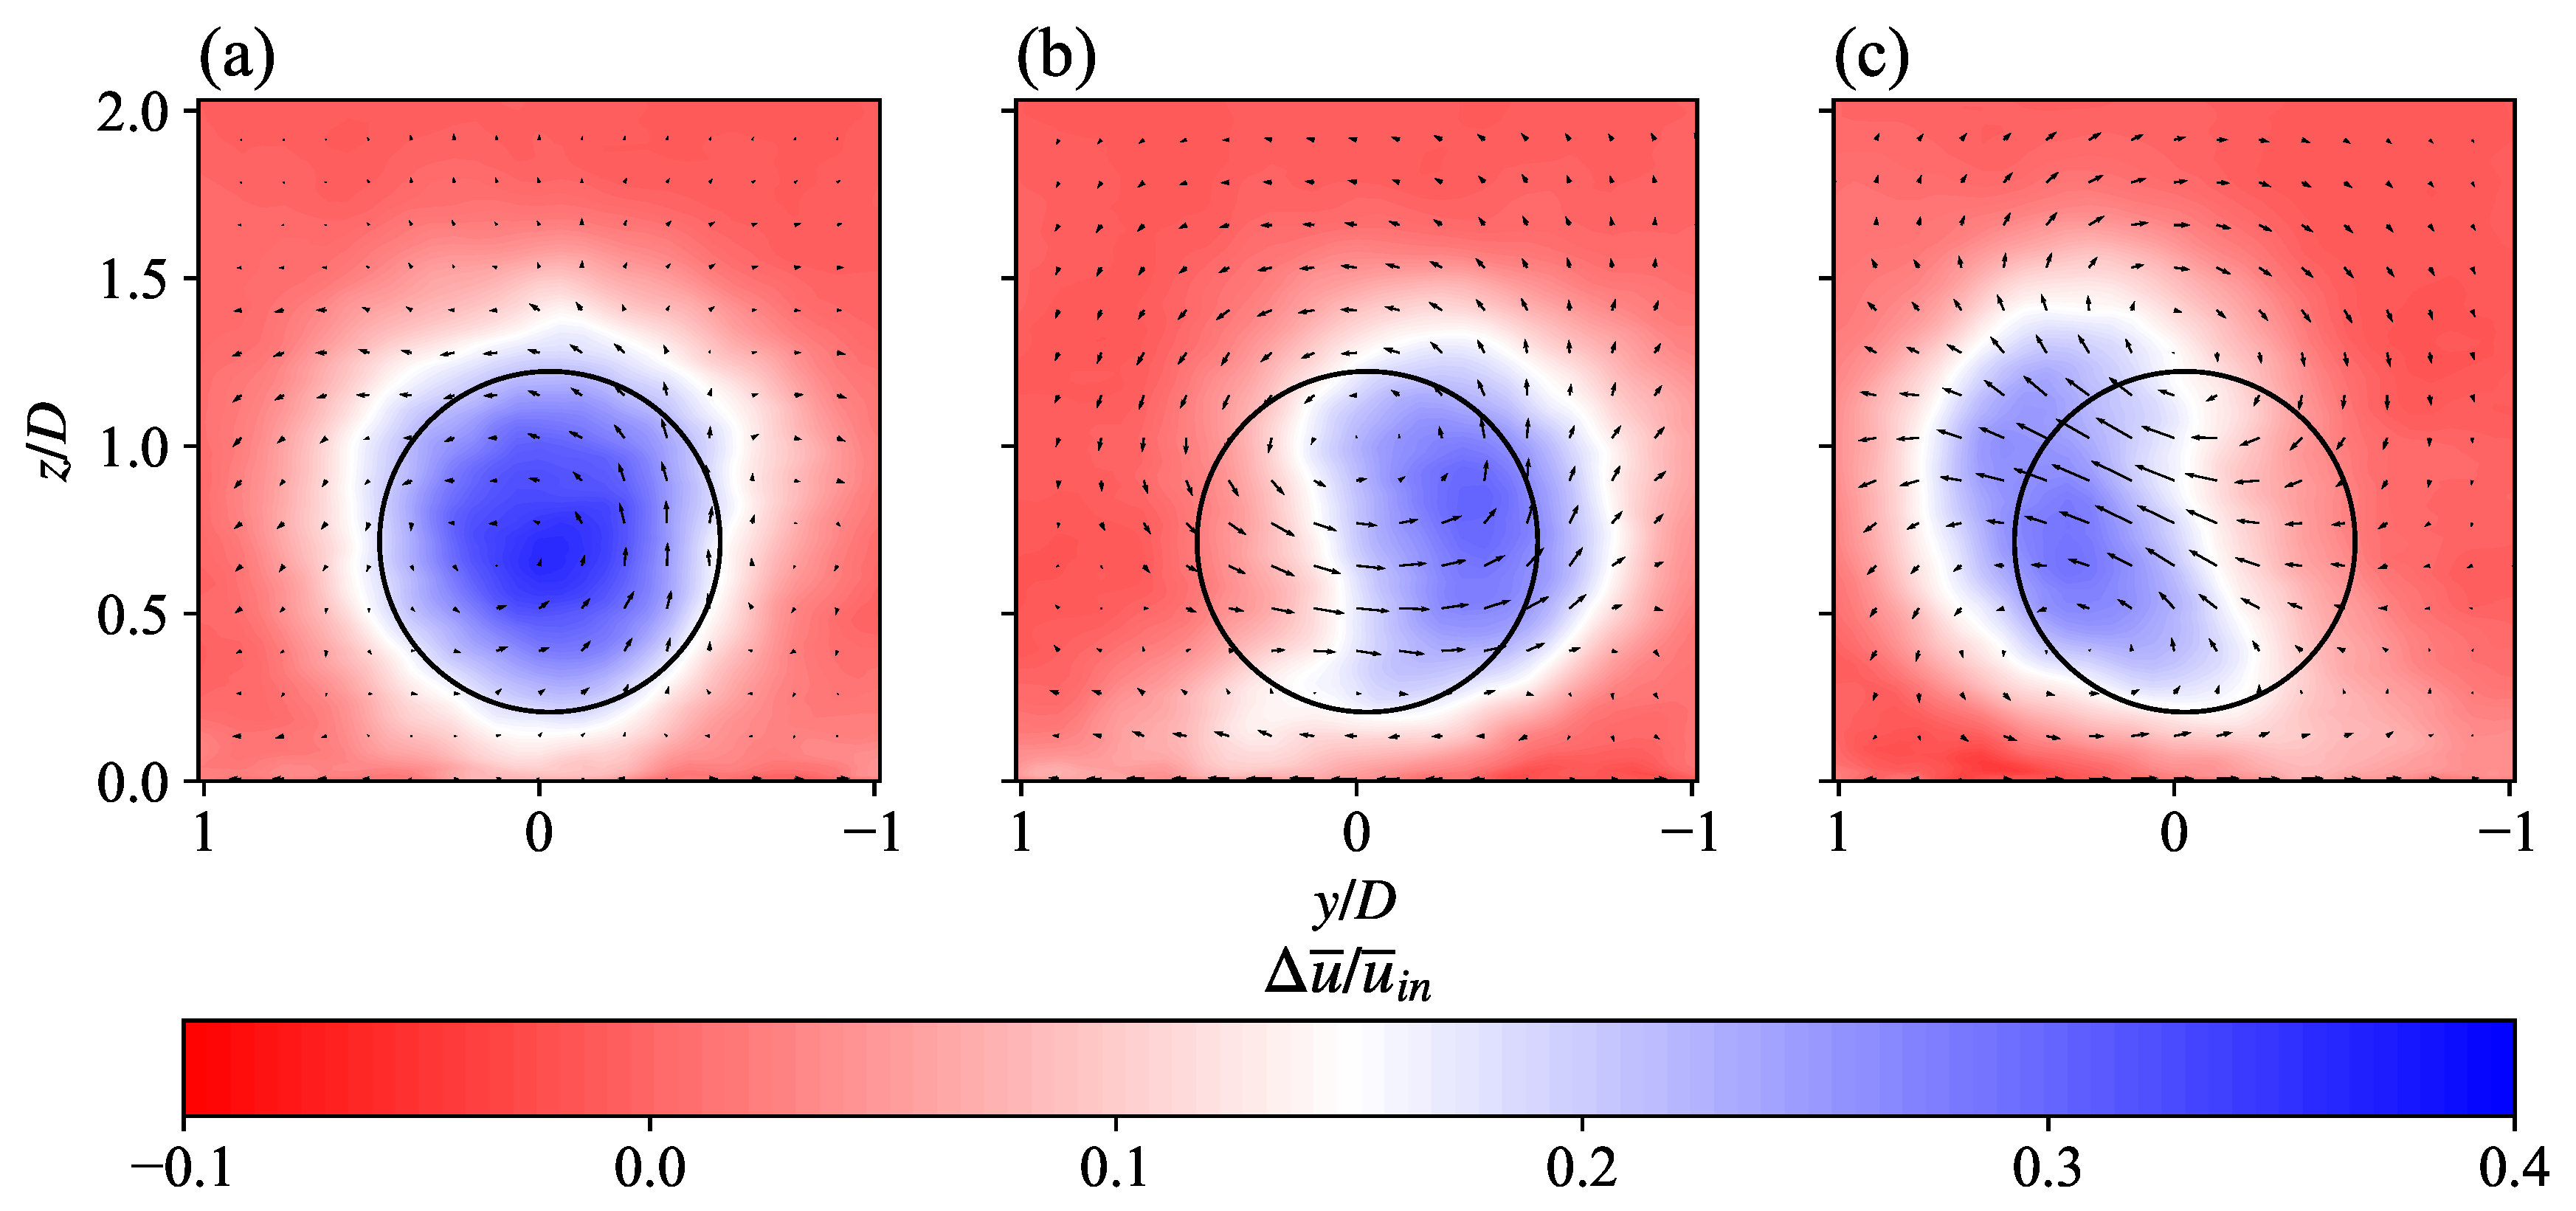
To further compare the wake structure of non-yawed and yawed turbines, in
Figure 5 we show the contours of normalised mean streamwise velocity deficits
in the vertical
y -
z cross-section plane 6D downwind of WT 1. The velocity deficit contours are overlapped with the vector fields of in-plane velocity components (
and
). In the non-yawed case (
Figure 5a), the velocity deficit region is largely circular; in the yawed cases (
Figure 5b and
Figure 5c), a distinctive asymmetric kidney-shaped (curled) velocity deficit region is found in the wakes behind yawed turbines, which is associated with the formation of a counter-rotating vortex pair (CVP) [
31,
32,
33]. The CVP is induced by the cross-flow in the wake, which creates a skewed inflow for downwind turbines and leads to additional wake deflection behind those turbines.
Furthermore, as shown in
Figure 5, the wake structure of the positively yawed turbine (
Figure 5b) differs from its negatively yawed counterpart (
Figure 5c). On the vertical
y -
z cross-section plane, the upper half of the velocity deficit region behind the positively yawed turbine is deflected further away from the domain centre-line (
) than its counterpart behind the negatively yawed turbine. The lower half of the wake region, on the other hand, is closer to the centre line (
) behind the positively yawed turbine than that of the negatively yawed one. The cross-flow in the wake of the positively yawed turbine is largely horizontal, whereas the direction of the cross-flow behind the negatively yawed turbine is around
upwards. Zong and Porté-Agel [
32] observed a similar dichotomy of the wake structure of a positively and negatively yawed turbine in the wind tunnel experiments carried out in their study, and they explained it by the different vorticity evolution behind a positively yawed and negatively yawed turbine, which affects the deformation of the velocity deficit region.
3.2. Power production
The power production of wind farms subjected to AYC is an important metric for evaluating different AYC strategies.
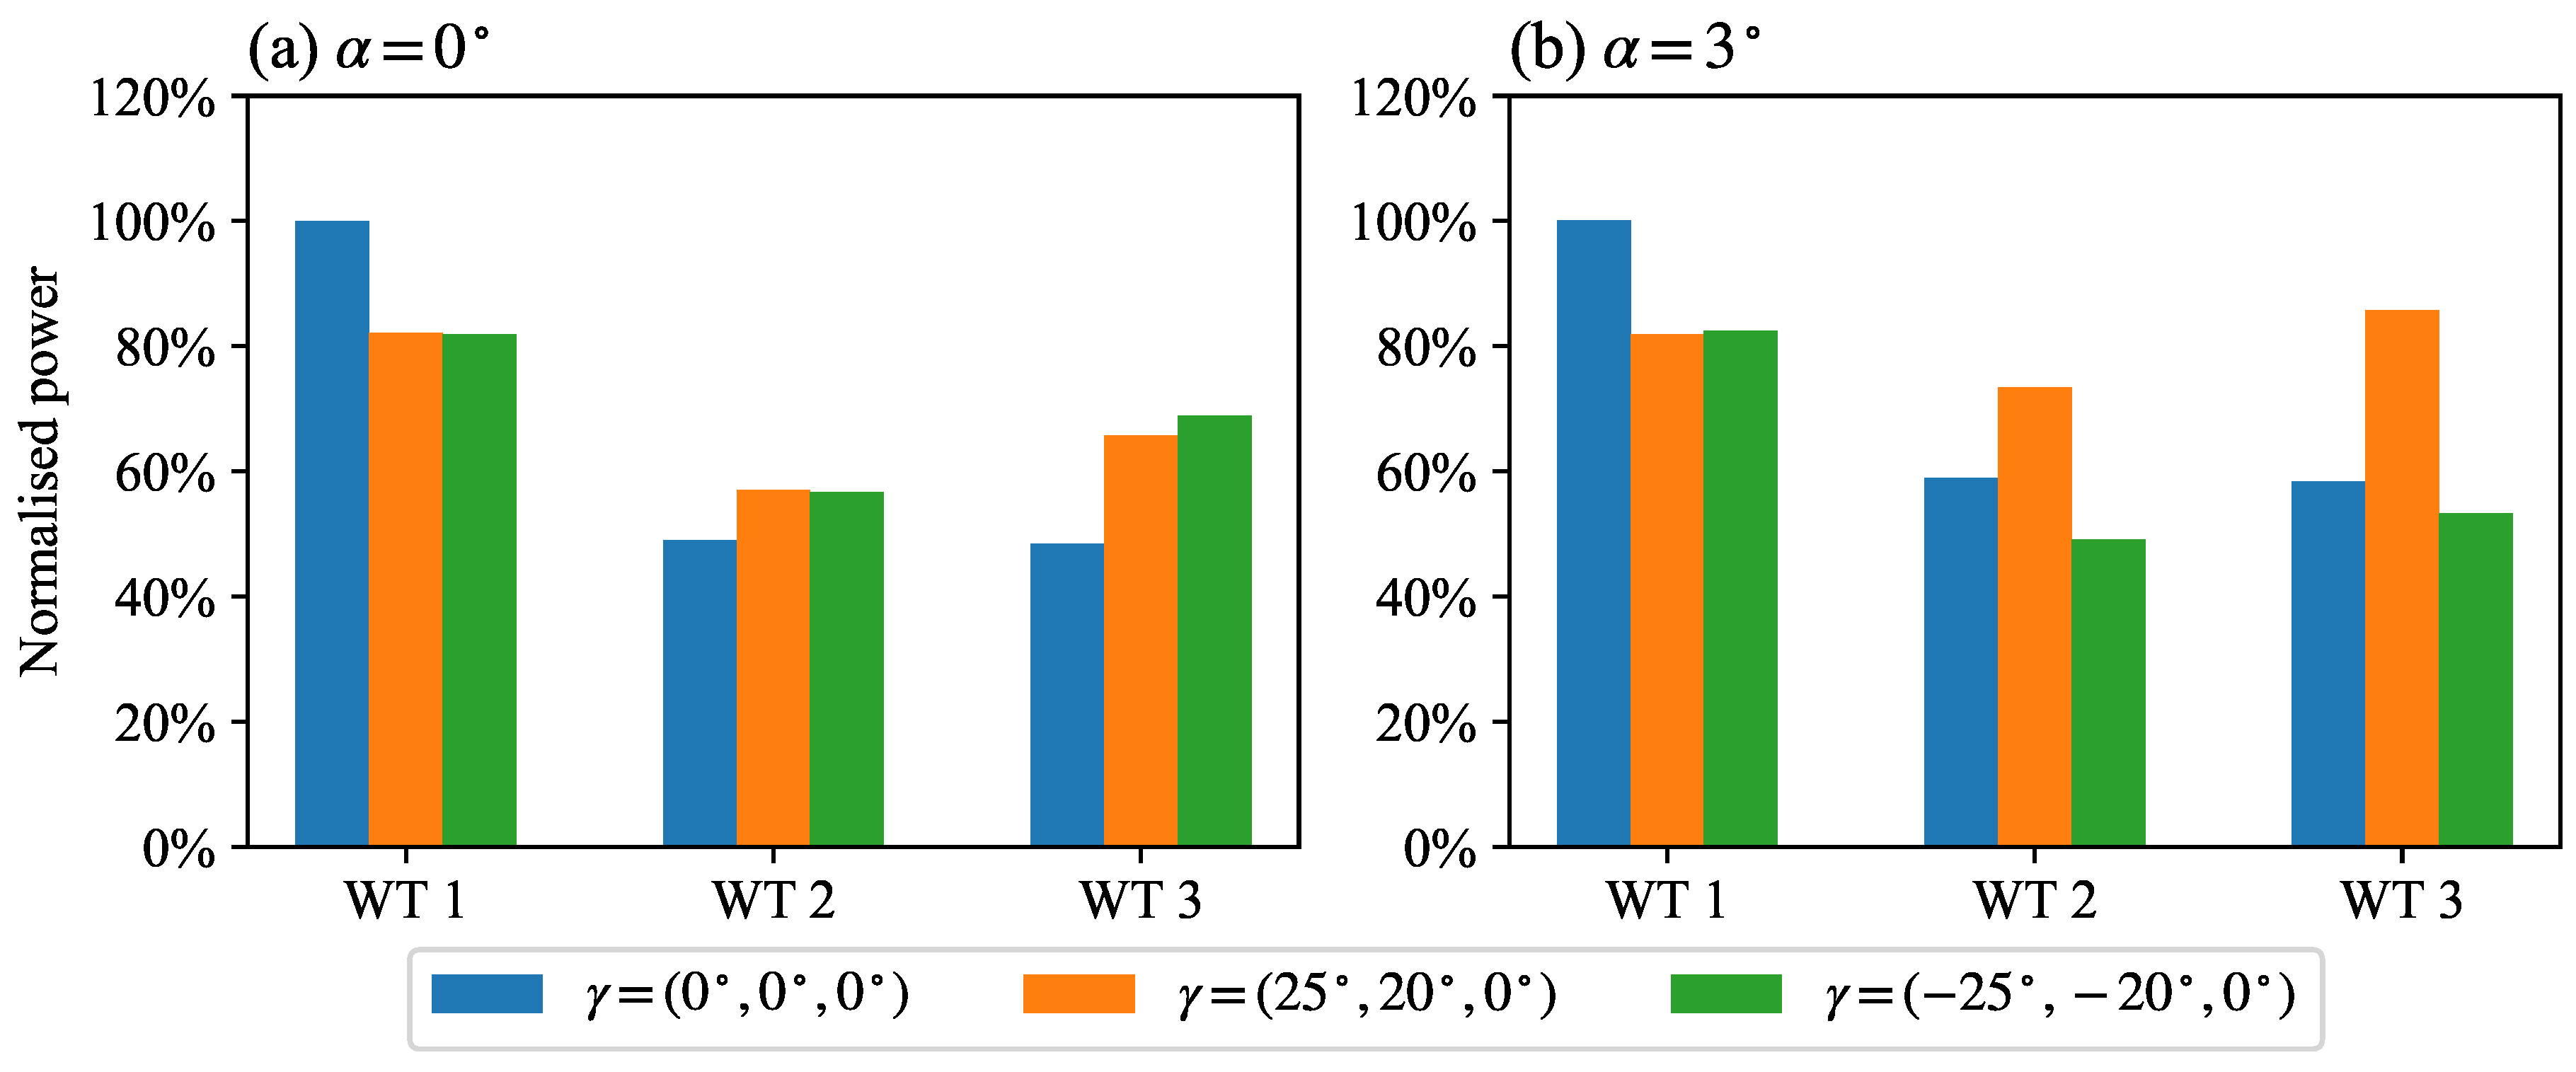
Figure 6 shows the normalised power outputs of the six representative cases specified in
Table 1. In the full-wake configuration (
Figure 6a), the positive and negative yaw strategies yield very similar power outputs for WTs 1 and 2; for WT 3, the negative yaw strategy yields 5.7% more power than the positive one due to the fact that negative yaw induces larger wake deflection than positive yaw [
32]. In partial-wake configuration
(
Figure 6b), applying positive yaw achieves power gains in the downwind turbines, while negative yaw redirects the wakes back to downwind turbines, as shown in
Figure 5f, and leads to power losses for all three turbines.
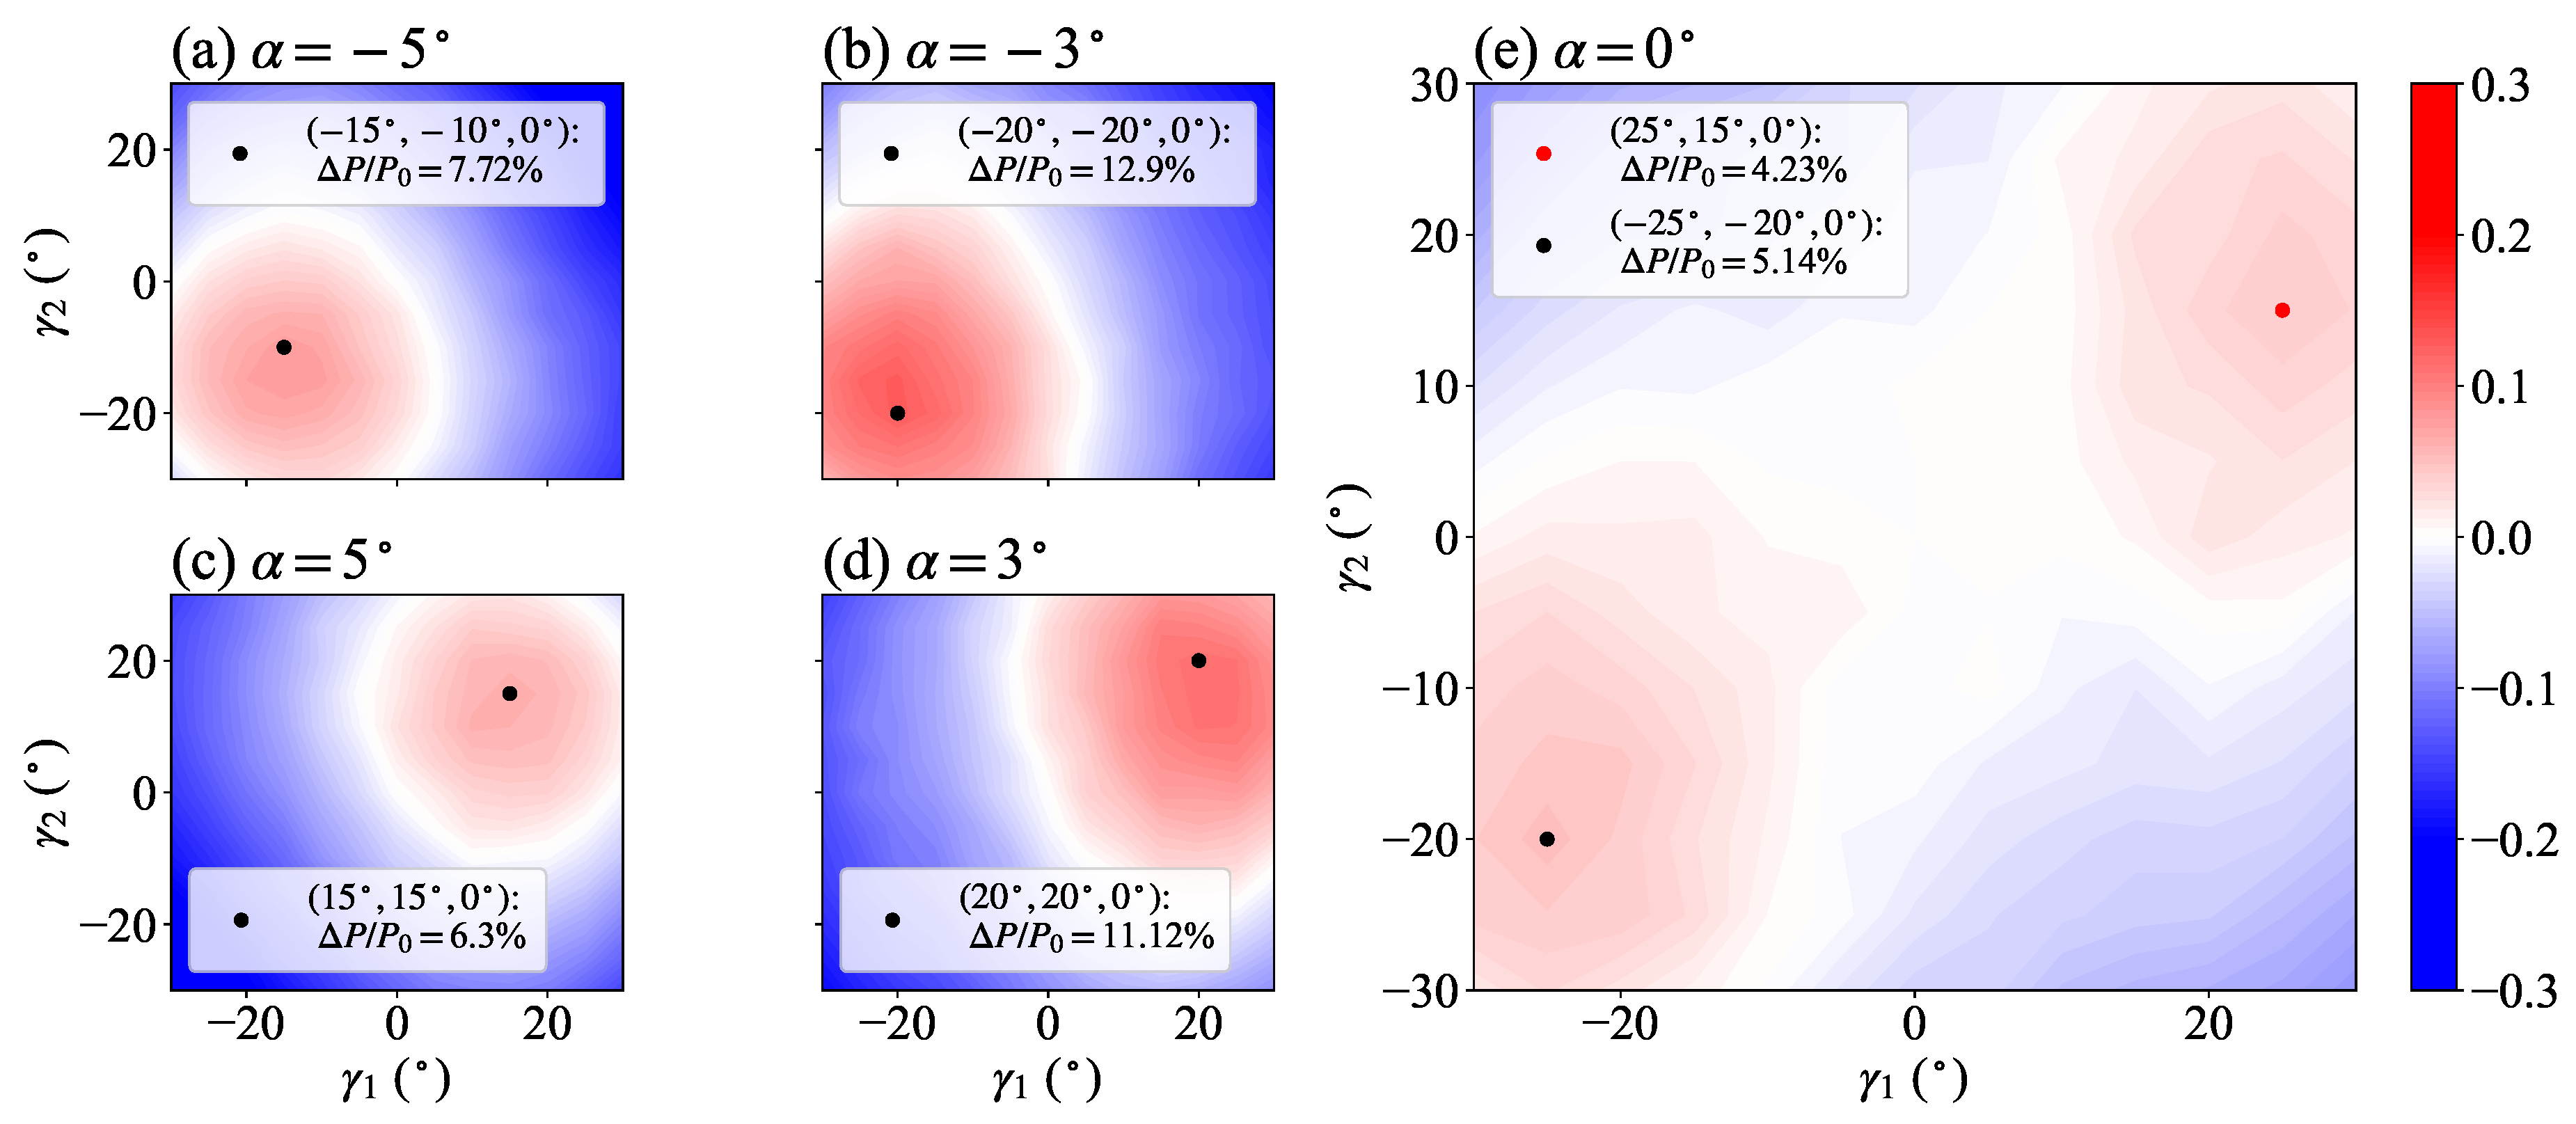
Figure 7 shows the contours of the normalised total power gains in the AYC decision space
with different inflow angles
. The normalisation is done using the total power of the non-yawed baseline case
. The most noticeable difference between full-wake (
) and partial-wake (
) configurations is that there are two local optima in the decision space of the full-wake configuration, while only one optimum for partial-wake configurations. Consistent with the experimental results of Zong and Porté-Agel [
5], the local power optimum corresponding to negative yaw (+5.14%) is larger than the one corresponding to positive yaw (+4.23%). Furthermore, in the partial-wake configurations under consideration (
), smaller yaw angles are needed to alleviate the wake interference in the turbine array due to the spanwise offset of the wind turbines, and the power gains achieved by applying the optimal AYC are larger than the one in the full-wake configuration. The optimal power gains in the configurations with
are also smaller than their counterparts with
. This observation can be explained by the fact that the turbines in the non-yawed baseline cases become less exposed to the wake flows with the increasing magnitude of the inflow angle; hence, the room for power improvement with AYC is reduced.
3.3. Blade fatigue loading
Besides power production, fatigue loading is another critical metric to consider when applying AYC to a wind farm.
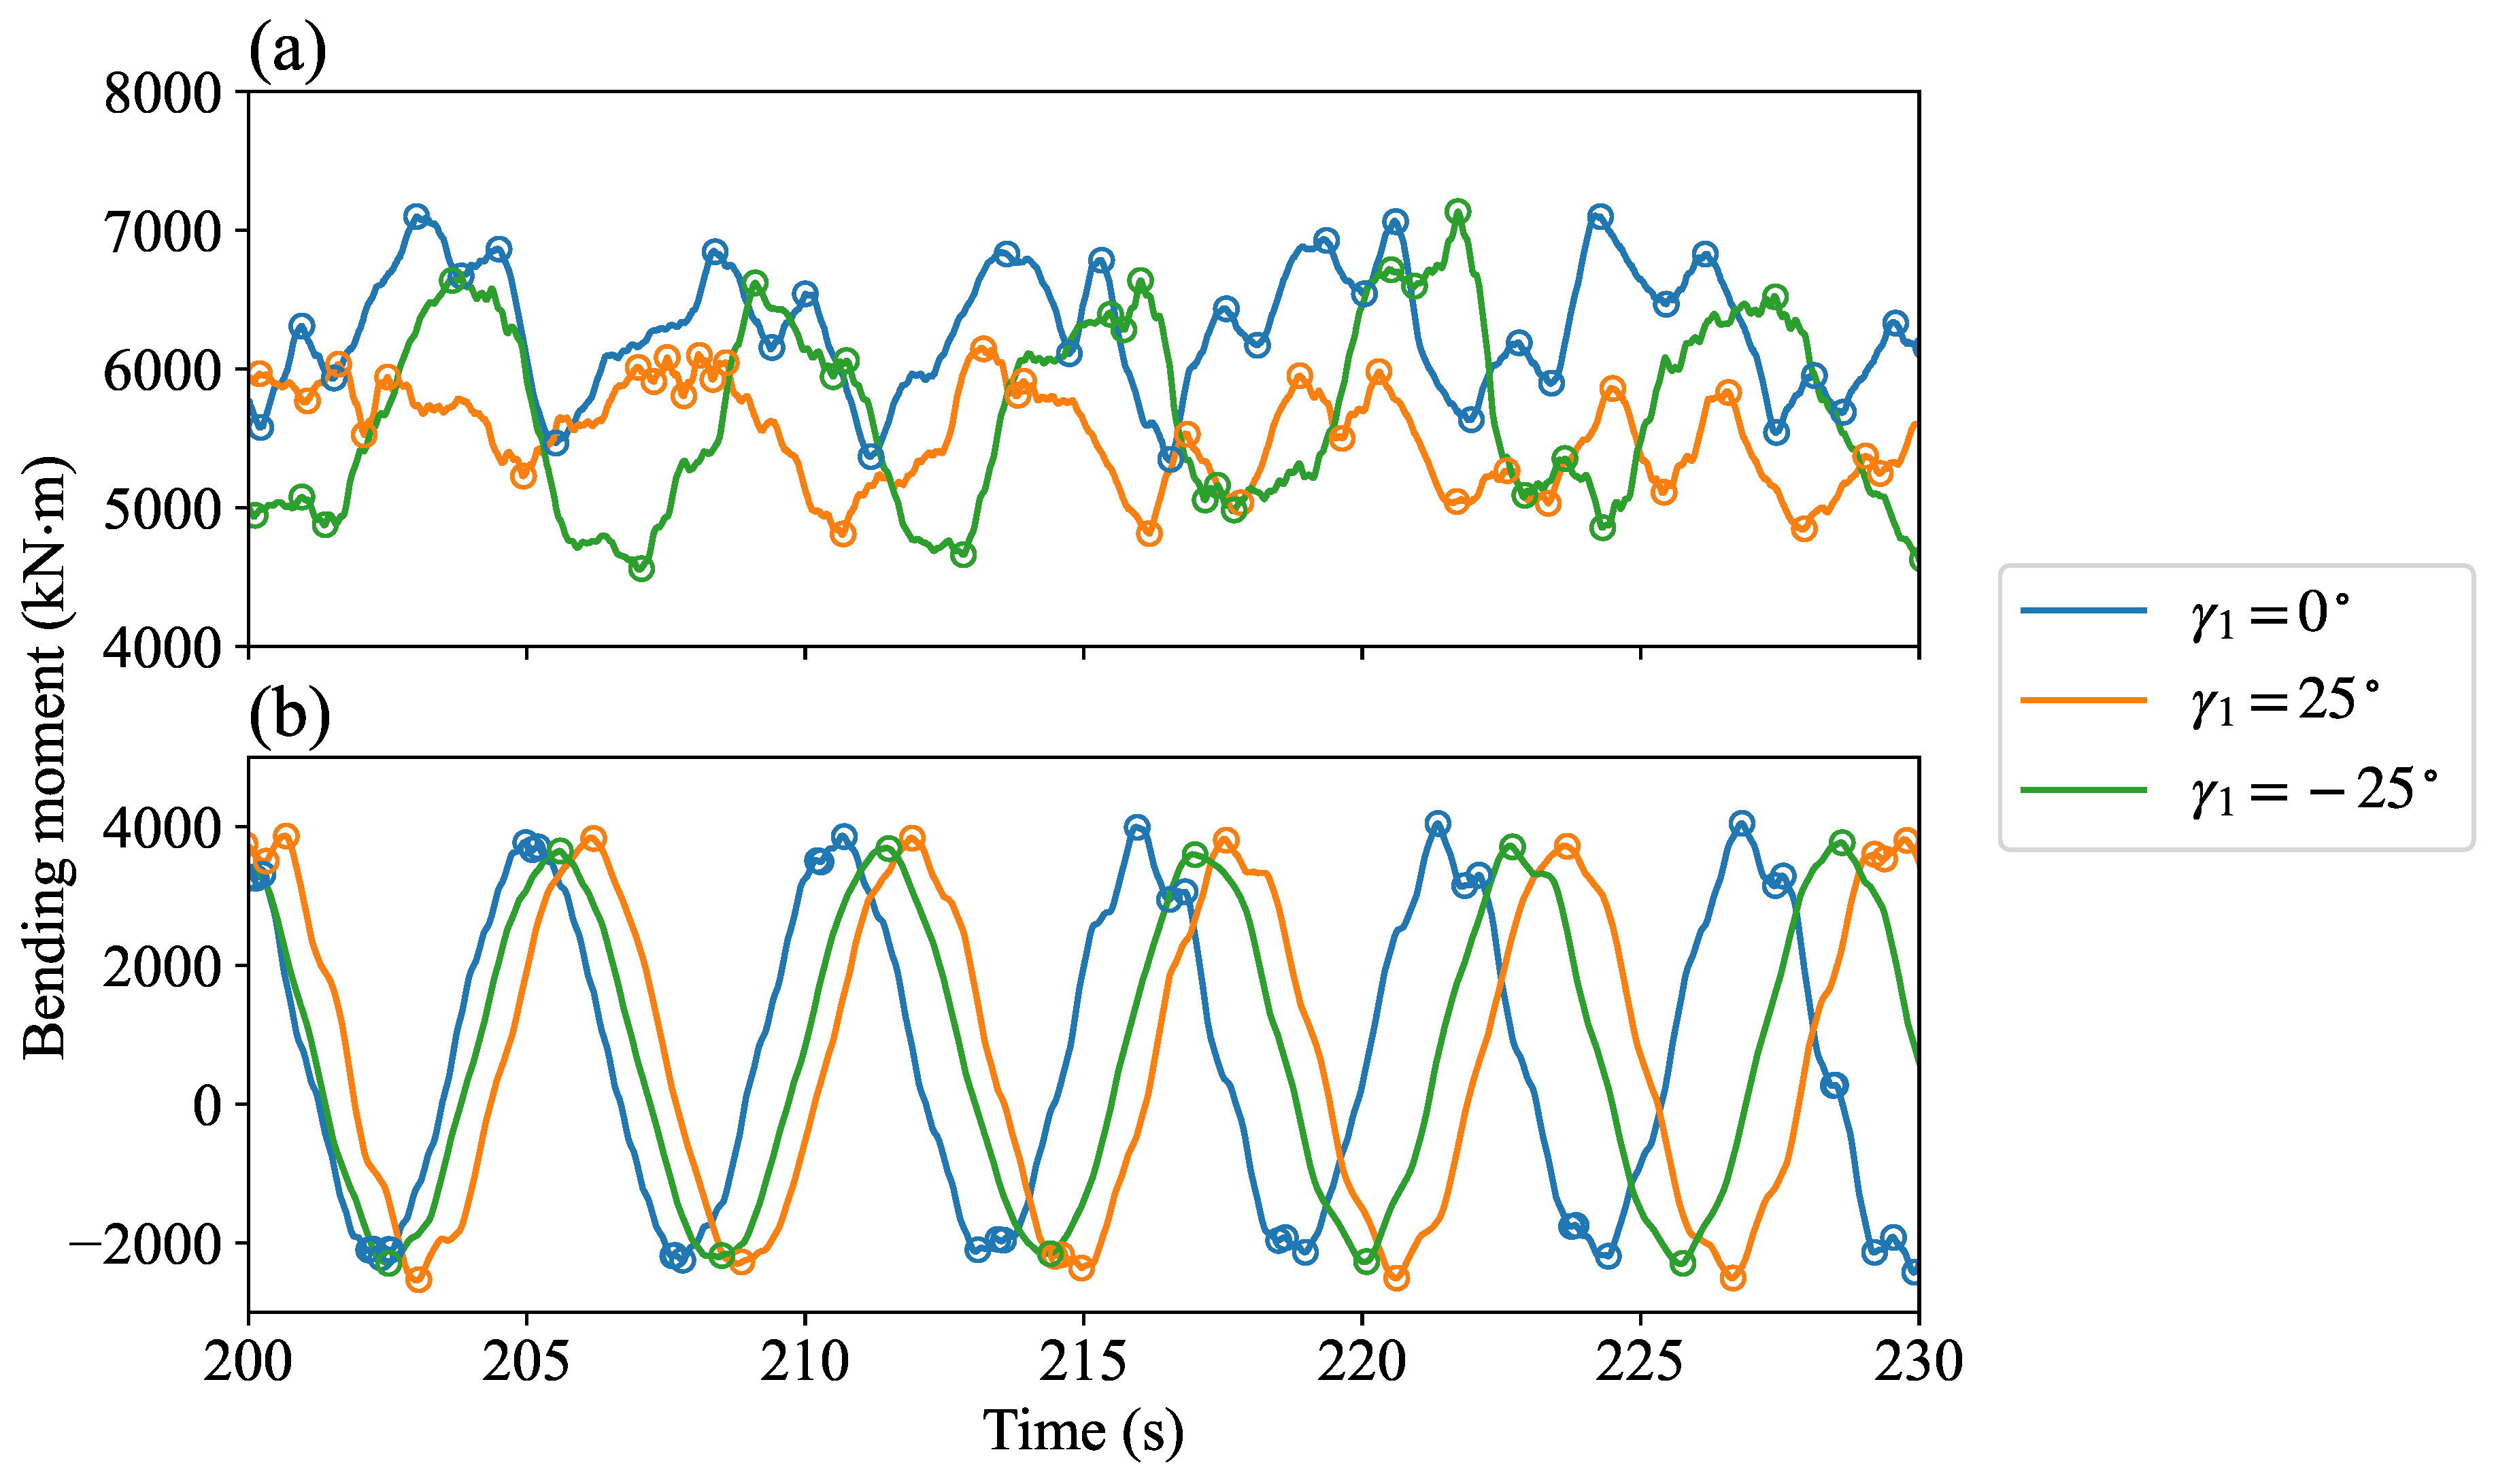
Figure 8 shows the time-series segments of the flapwise bending moment (FBM) (
Figure 8a) and the edgewise bending moment (EBM) (
Figure 8b) at the blade root of WT 1. We find that, when the turbine is yawed, whether positively or negatively, the means of the FBM are decreased. However, a positively yawed turbine has a larger FBM variation than the non-yawed baseline, while a negatively yawed turbine has a smaller variation. As for the EBM, the differences between yawed and non-yawed turbines are less significant than the FBM because the variation in the EBM is dominated by the cyclic gravity load acting on rotating blades; thus, it is less sensitive to changes in the aerodynamic loads caused by AYC.
Using the transient blade loads extracted from the simulations, we further evaluate blade fatigue with the methodology discussed in
Section 2.3.
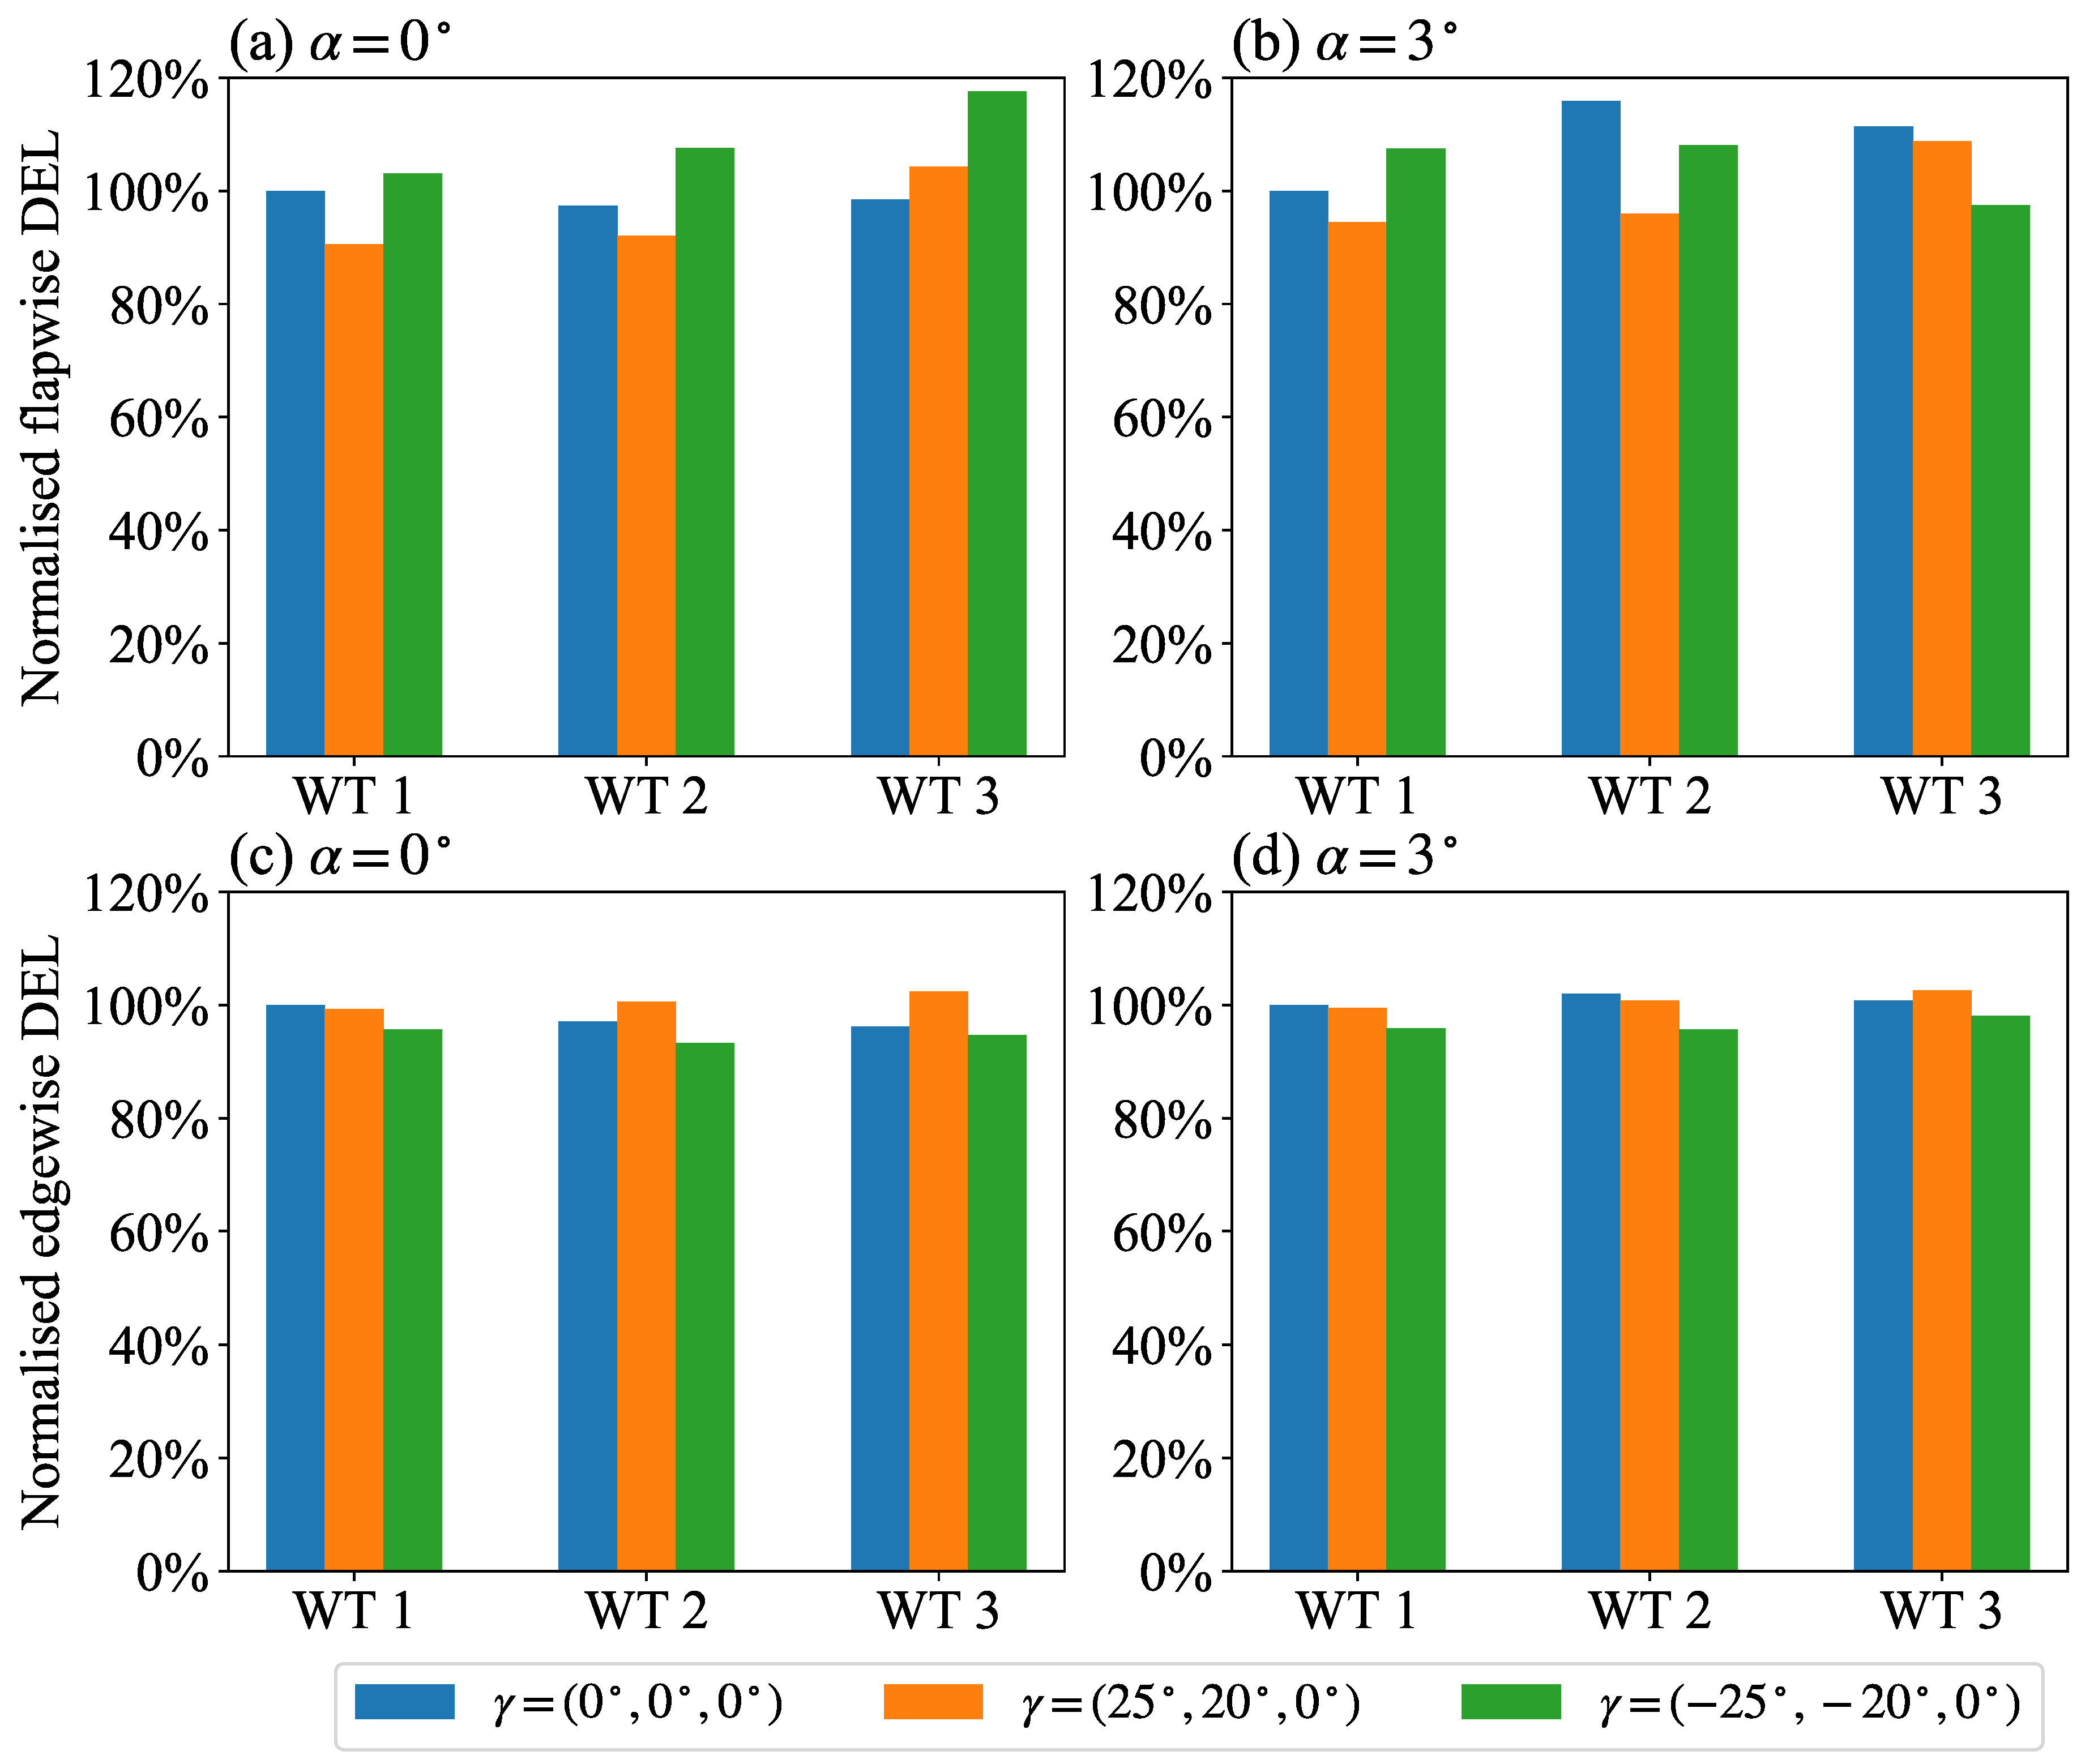
Figure 9 shows the flapwise and edgewise DELs for the wind turbine array at different AYC configurations. In full-wake configuration
, we observe that:
In the flapwise direction (
Figure 9a), the positive yaw case has larger DELs in WTs 1 and 2 and a slightly lower DEL in WT 3 compared to the non-yawed baseline. On the other hand, the negative yaw case has larger DELs in all three turbines.
In the edgewise direction (
Figure 9b), applying positive yaw slightly decreases the DEL in WT 1 while increasing it in WTs 2 and 3. The negative yaw strategy slightly decreases the DELs in all three turbines.
In partial-wake configuration , we observe that:
In the flapwise direction (
Figure 9c), the DELs of WTs 2 and 3 are larger than those of WT 1 in the non-yawed baseline. This is because downwind turbines are partially exposed to the wakes of upwind turbines in this configuration, which creates significant load variations on the blades. When the positive yaw strategy is adopted, as noted in the wake contour (
Figure 4e), wake interference is largely avoided, and turbine fatigue loads are alleviated. Applying negative yaw in this configuration redirects the wakes to the downwind turbines (
Figure 4f), alleviating partial wake overlapping. As a result, we observe decreases in the DELs of WT 2 and WT 3.
In the edgewise direction (
Figure 9d), applying positive yaw slightly decreases the DEL in WTs 1 and 2 while increasing it in WT 3. The negative yaw strategy slightly decreases the DELs in all three turbines. Similar to the full-wake configuration, the edgewise DELs are less sensitive to changes in yaw angles than the FBM.
To further reveal the relation between blade fatigue in the turbine array and AYC, we define the summation of the DEL of each turbine as the total DEL of the turbine array and compute the normalised total DEL variation
. The normalisation is done using the total DEL of the non-yawed baseline case
.
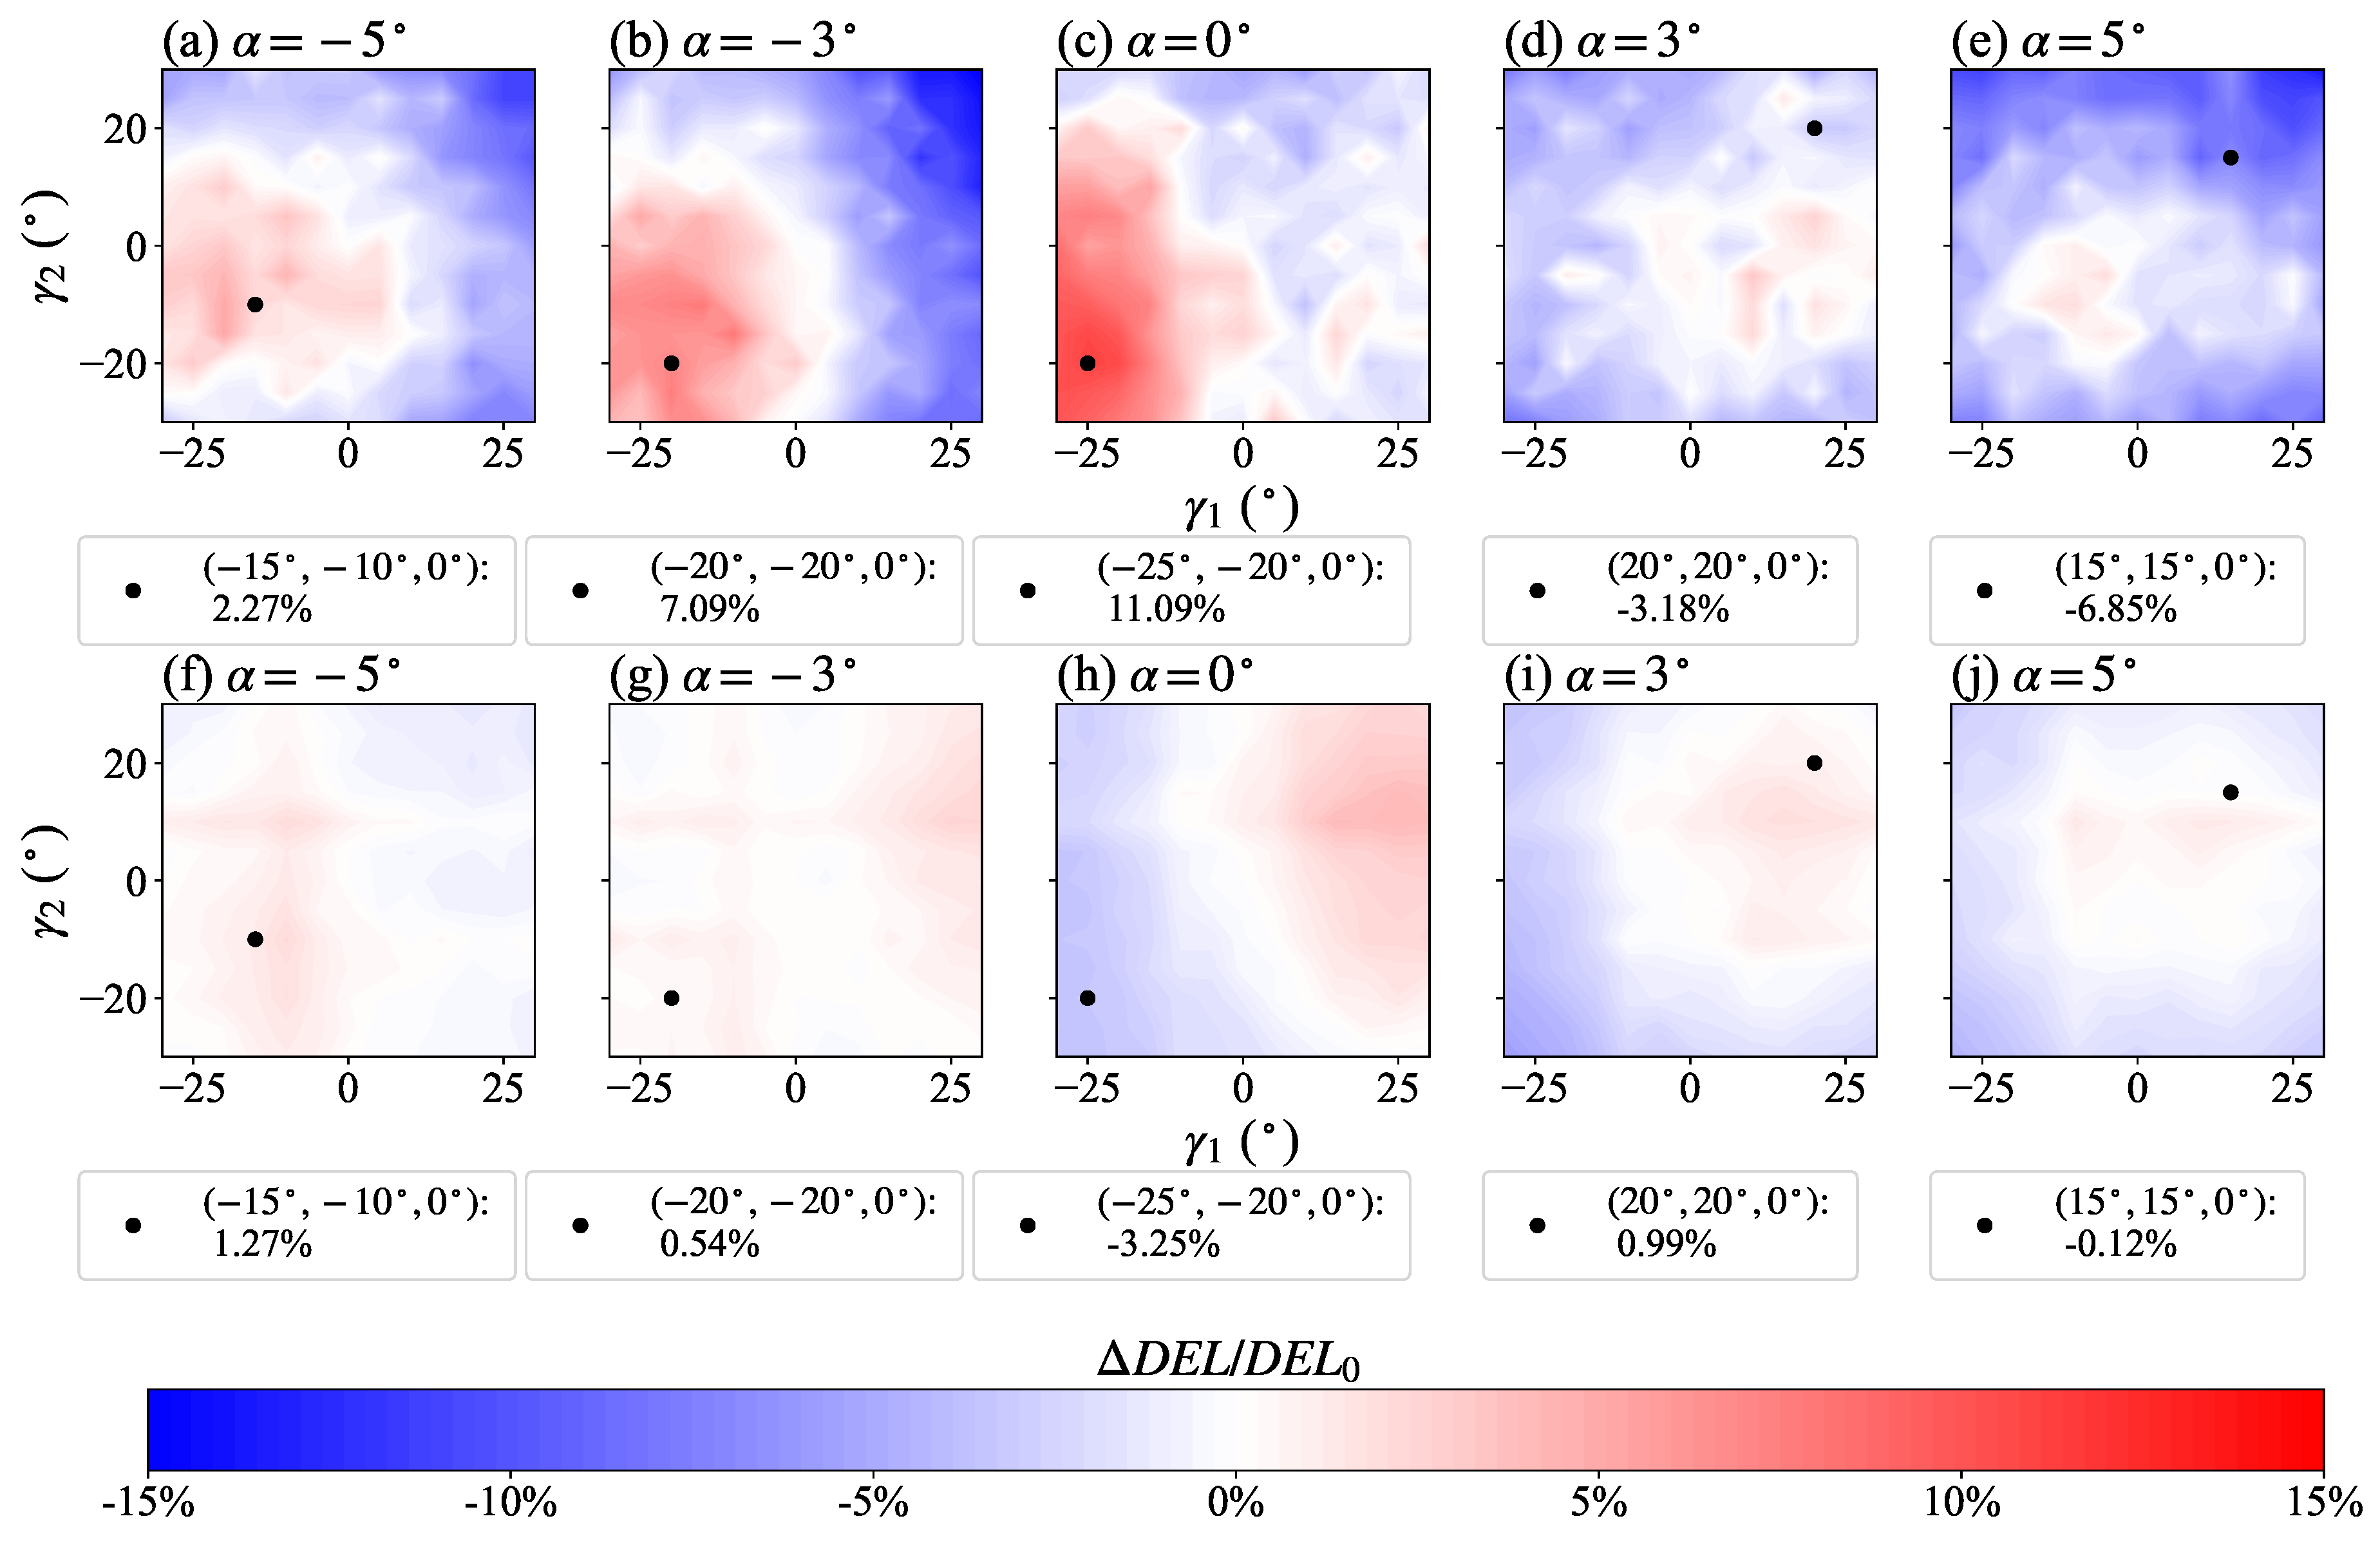
Figure 10 shows the contours of
in the flapwise (
Figure 10a to
Figure 10e) and edgewise directions (
Figure 10f to
Figure 10j) in the decision space
for different inflow angles. Consistent with our observations in
Figure 8 and
Figure 9, we find that the changes in the flapwise DELs are more significant than in the edgewise DELs. Furthermore, in contrast to the power gain contours (
Figure 7), we observe an asymmetry in the DEL variation contour: the AYC strategies with opposite signs for yaw and inflow angles produce similar power outputs but very different DELs. For example (
Table 2), the two AYC strategies
,
and
,
in the decision space
yield similar power gains (12.9% vs 11.12%). However, the negative strategy increases the flapwise DEL
and edgewise DEL
from the non-yaw benchmark, while the positive strategy
decrease the flapwise DEL
but increases the edgewise DEL
.
4. Theoretical analysis on flapwise blade fatigue in positive and negative yaw strategies
Figure 9 and
Figure 10 have shown that applying positive or negative yaw strategies leads to significantly different flapwise fatigue loading not only in the yawed turbines but also in the non-yawed turbines exposed to the wakes of yawed upwind turbines. In this section, we present a theoretical analysis of the causes of these differences.
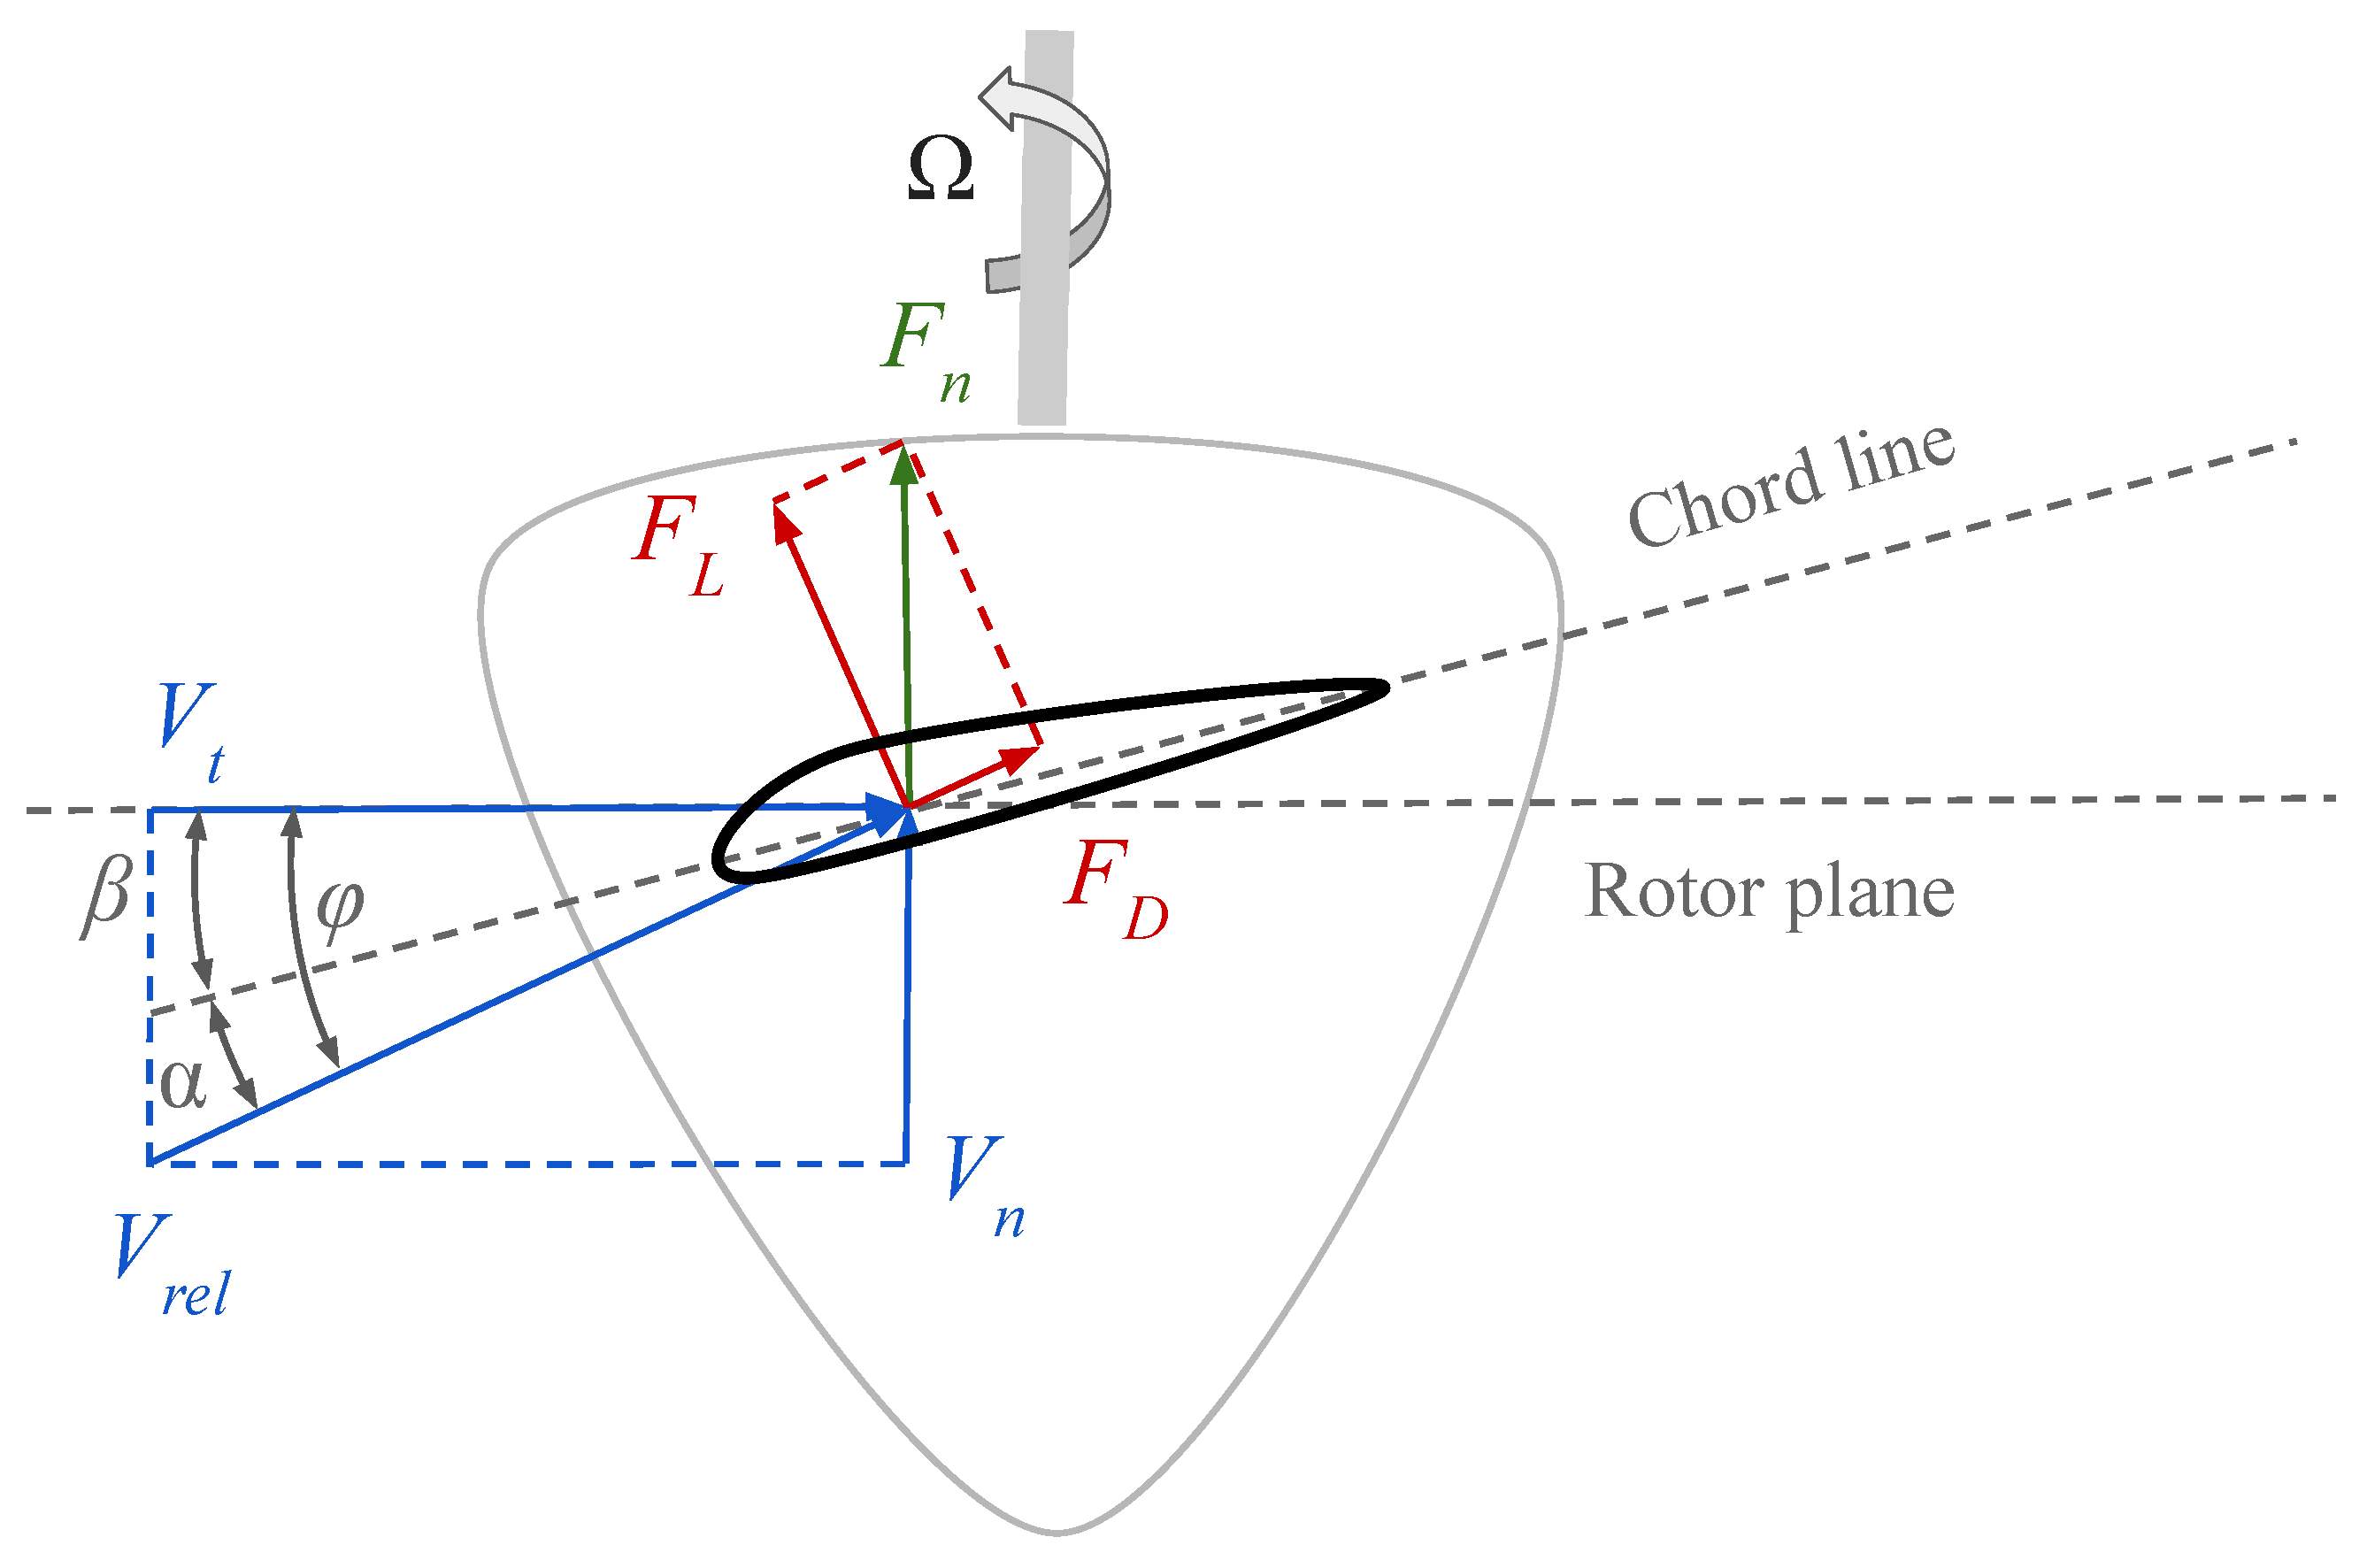
Flapwise blade fatigue is induced by the variations of the force normal to the rotor disk
(
Figure 11) acting on wind turbine blades. The force variation can be attributed to inflow turbulence and blade rotation. For a front-row turbine, it experiences the same level of inflow turbulence when it is positively or negatively yawed with the same yaw magnitude. Therefore, the difference in flapwise fatigue is mostly caused by the different blade-force variations per rotation, which can be analysed by the blade element momentum (BEM) theory. Computing the aerodynamic forces acting on the rotating wind turbine blades based on the BEM theory requires an iterative process. However, we can simplify this process into closed-form expressions with reasonable approximations and directly analyse the variation of aerodynamic loads.
According to the velocity and force triangles in the BEM theory shown in
Figure 11, the normal force
acting on a blade element per unit length can be expressed as:
where
c is the chord length,
is the air density,
is the magnitude of the resultant local relative velocity of the rotating blade with respect to the flow,
and
are the magnitudes of
, respectively, and
is the angle between resultant relative velocity and the rotation plane.
We approximate
by substituting Eqs.
8 -
10 into Eq.
7 and apply small-angle approximations to the trigonometric functions of
:
The approximations of the trigonometric functions can be justified by the fact that the FBM at the blade root is dominated by the flapwise loads acting on the sections near the blade tip. In those sections, the flow angle
, angle of attack (AoA)
, and blade twist angle
are small.
According to classical thin airfoil theory [
34] and the fact that the twist angle
is small, the lift coefficient
of an airfoil in small AoAs can be approximated by:
Substituting Eqs.
12 and
13 into Eq.
11, we have:
Considering the fact that
at small AoAs, we neglect the contribution of
and further simplify Eq.
14 to:
We find that
is approximately proportional to the product of
and
:
Therefore, to study the variation of the normal force
, we can focus on the variation of
. Since the tangential induction is very weak in the blade sections close to the tip, we neglect the contribution of tangential induction and derive
and
of a yawed turbine according to the BEM theory [
35]:
where
is the freestream inflow velocity to the turbine,
is the turbine yaw angle,
is the turbine rotation speed,
r is the distance of the blade element to the hub,
is the phase angle of the rotating blade,
is the wake skewing angle, and
a is the axial induction factor of the turbine. Glauert [
36] proposed that the axial induction factor
a can be approximated by:
where
is the induction factor of the turbine in non-yawed condition,
R is the radius of the turbine, and
f is the wake expansion function. Øye [
37] proposed the following polynomial fit for
f:
Coleman [
38] proposed that
can be approximated by:
As an example, we consider the
variations in a front-row turbine with
at the blade location
in a uniform inflow and a vertically sheared inflow. The non-yawed induction factor is assumed to be azimuthally unchanged and take the theoretical optimal value predicted by the BEM theory:
Figure 12 shows the freestream inflow velocity
to the blade section
at different heights
z and different blade phase angles
. We can see that
varies with
in the vertically sheared flow while staying constant in the uniform inflow. When the turbine rotates in the vertically sheared inflow, the azimuthal distributions of the local relative velocity on blade sections in the positively and negatively yawed turbine are different.
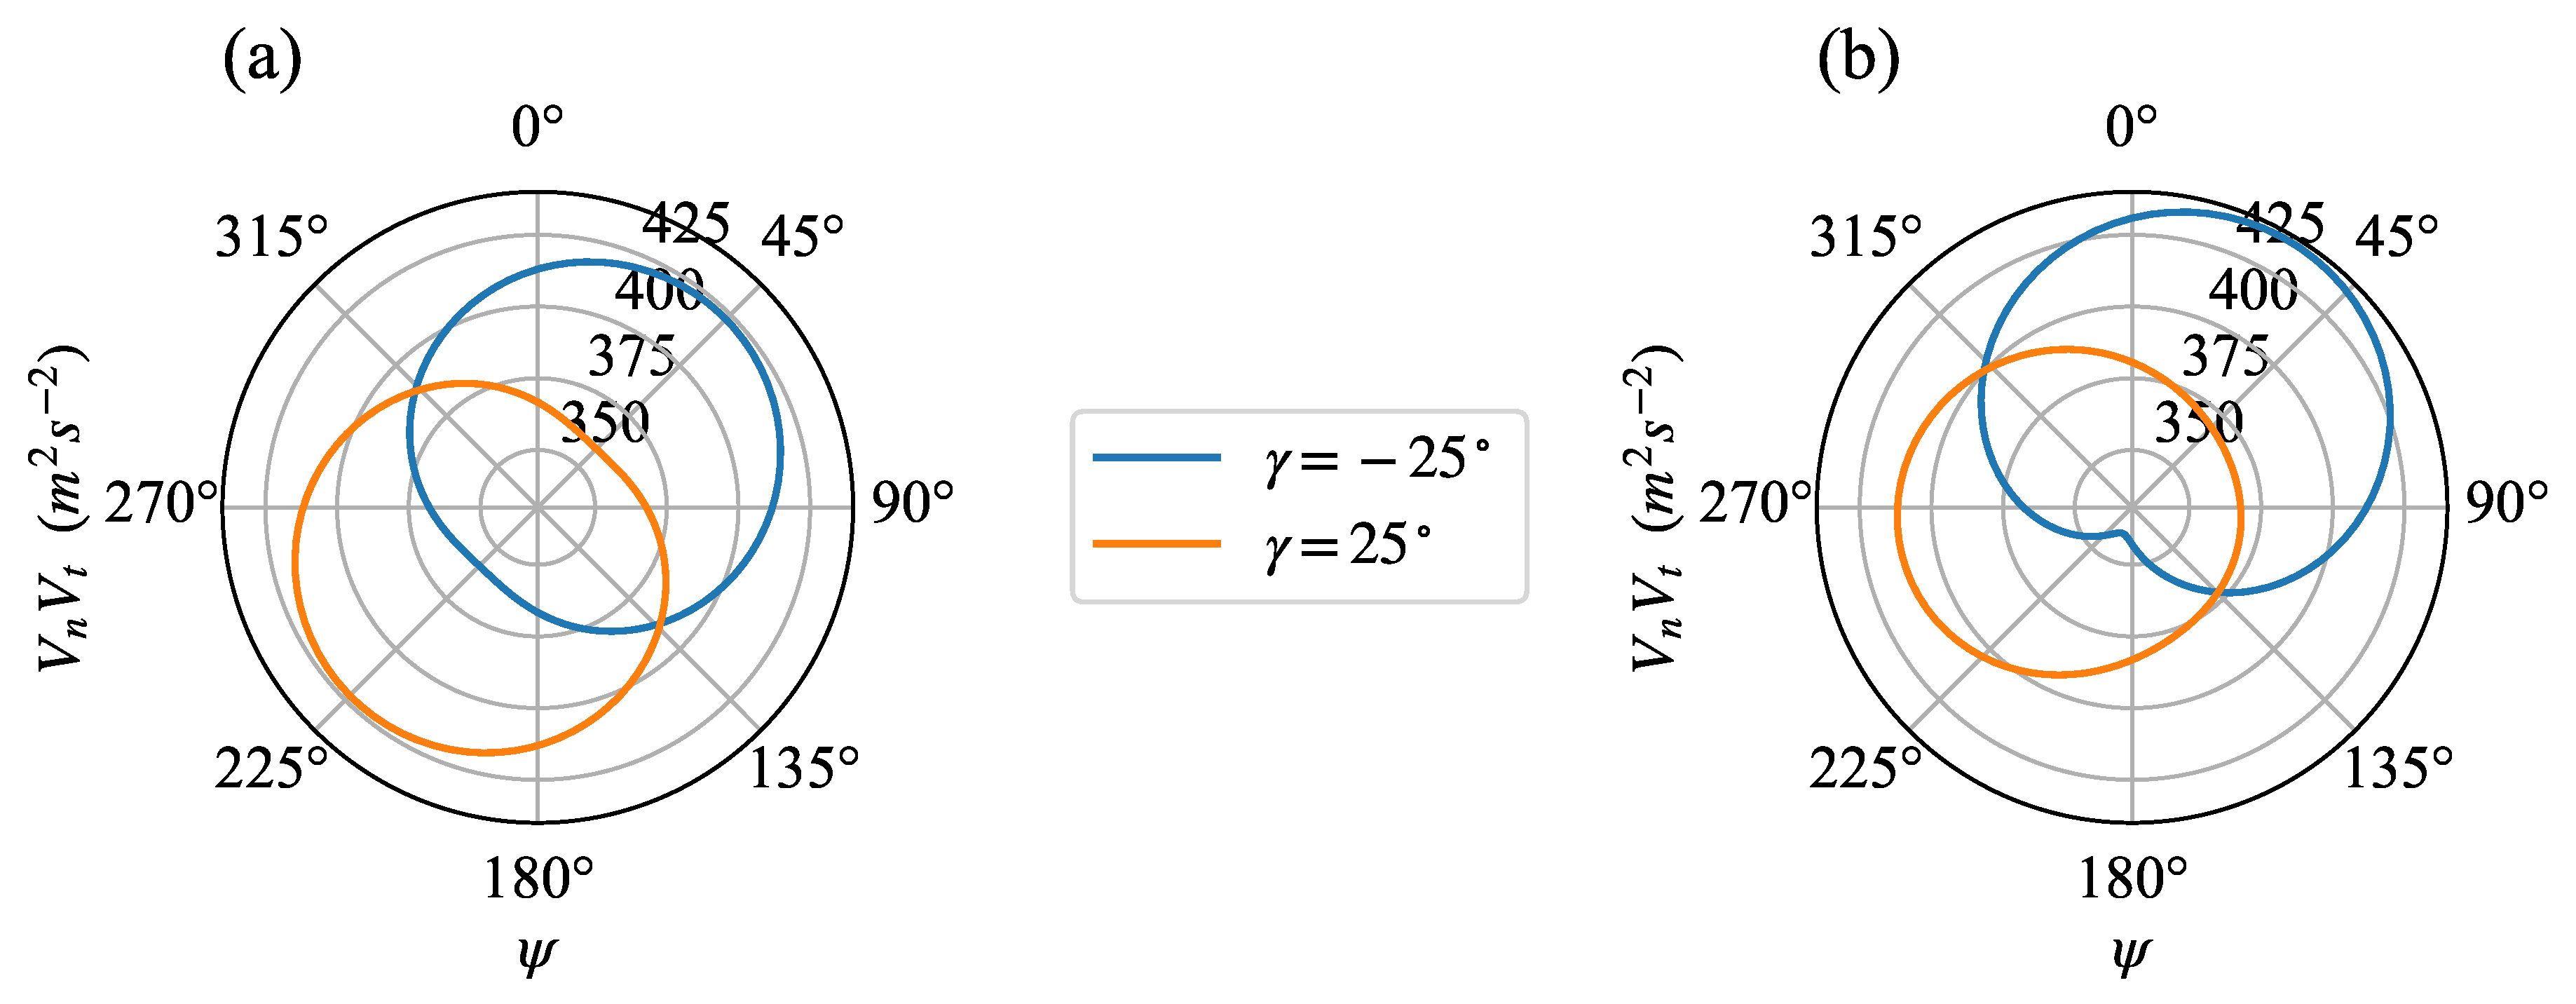
Figure 13 shows the variation of
computed from Eq.
17 and
18 with respect to
in the two different inflows shown in
Figure 13. We find that the magnitudes of the variation for the positive and negative yaw angles are the same in the uniform inflow. However, in the vertically sheared inflow, the negative yaw angle leads to a larger variation of
than the positive yaw angle. As a result, according to Eq. 16, the negatively yawed turbine endures larger variation of the normal thrust force per rotation and, consequently, greater flapwise blade fatigue than the positively yawed one.
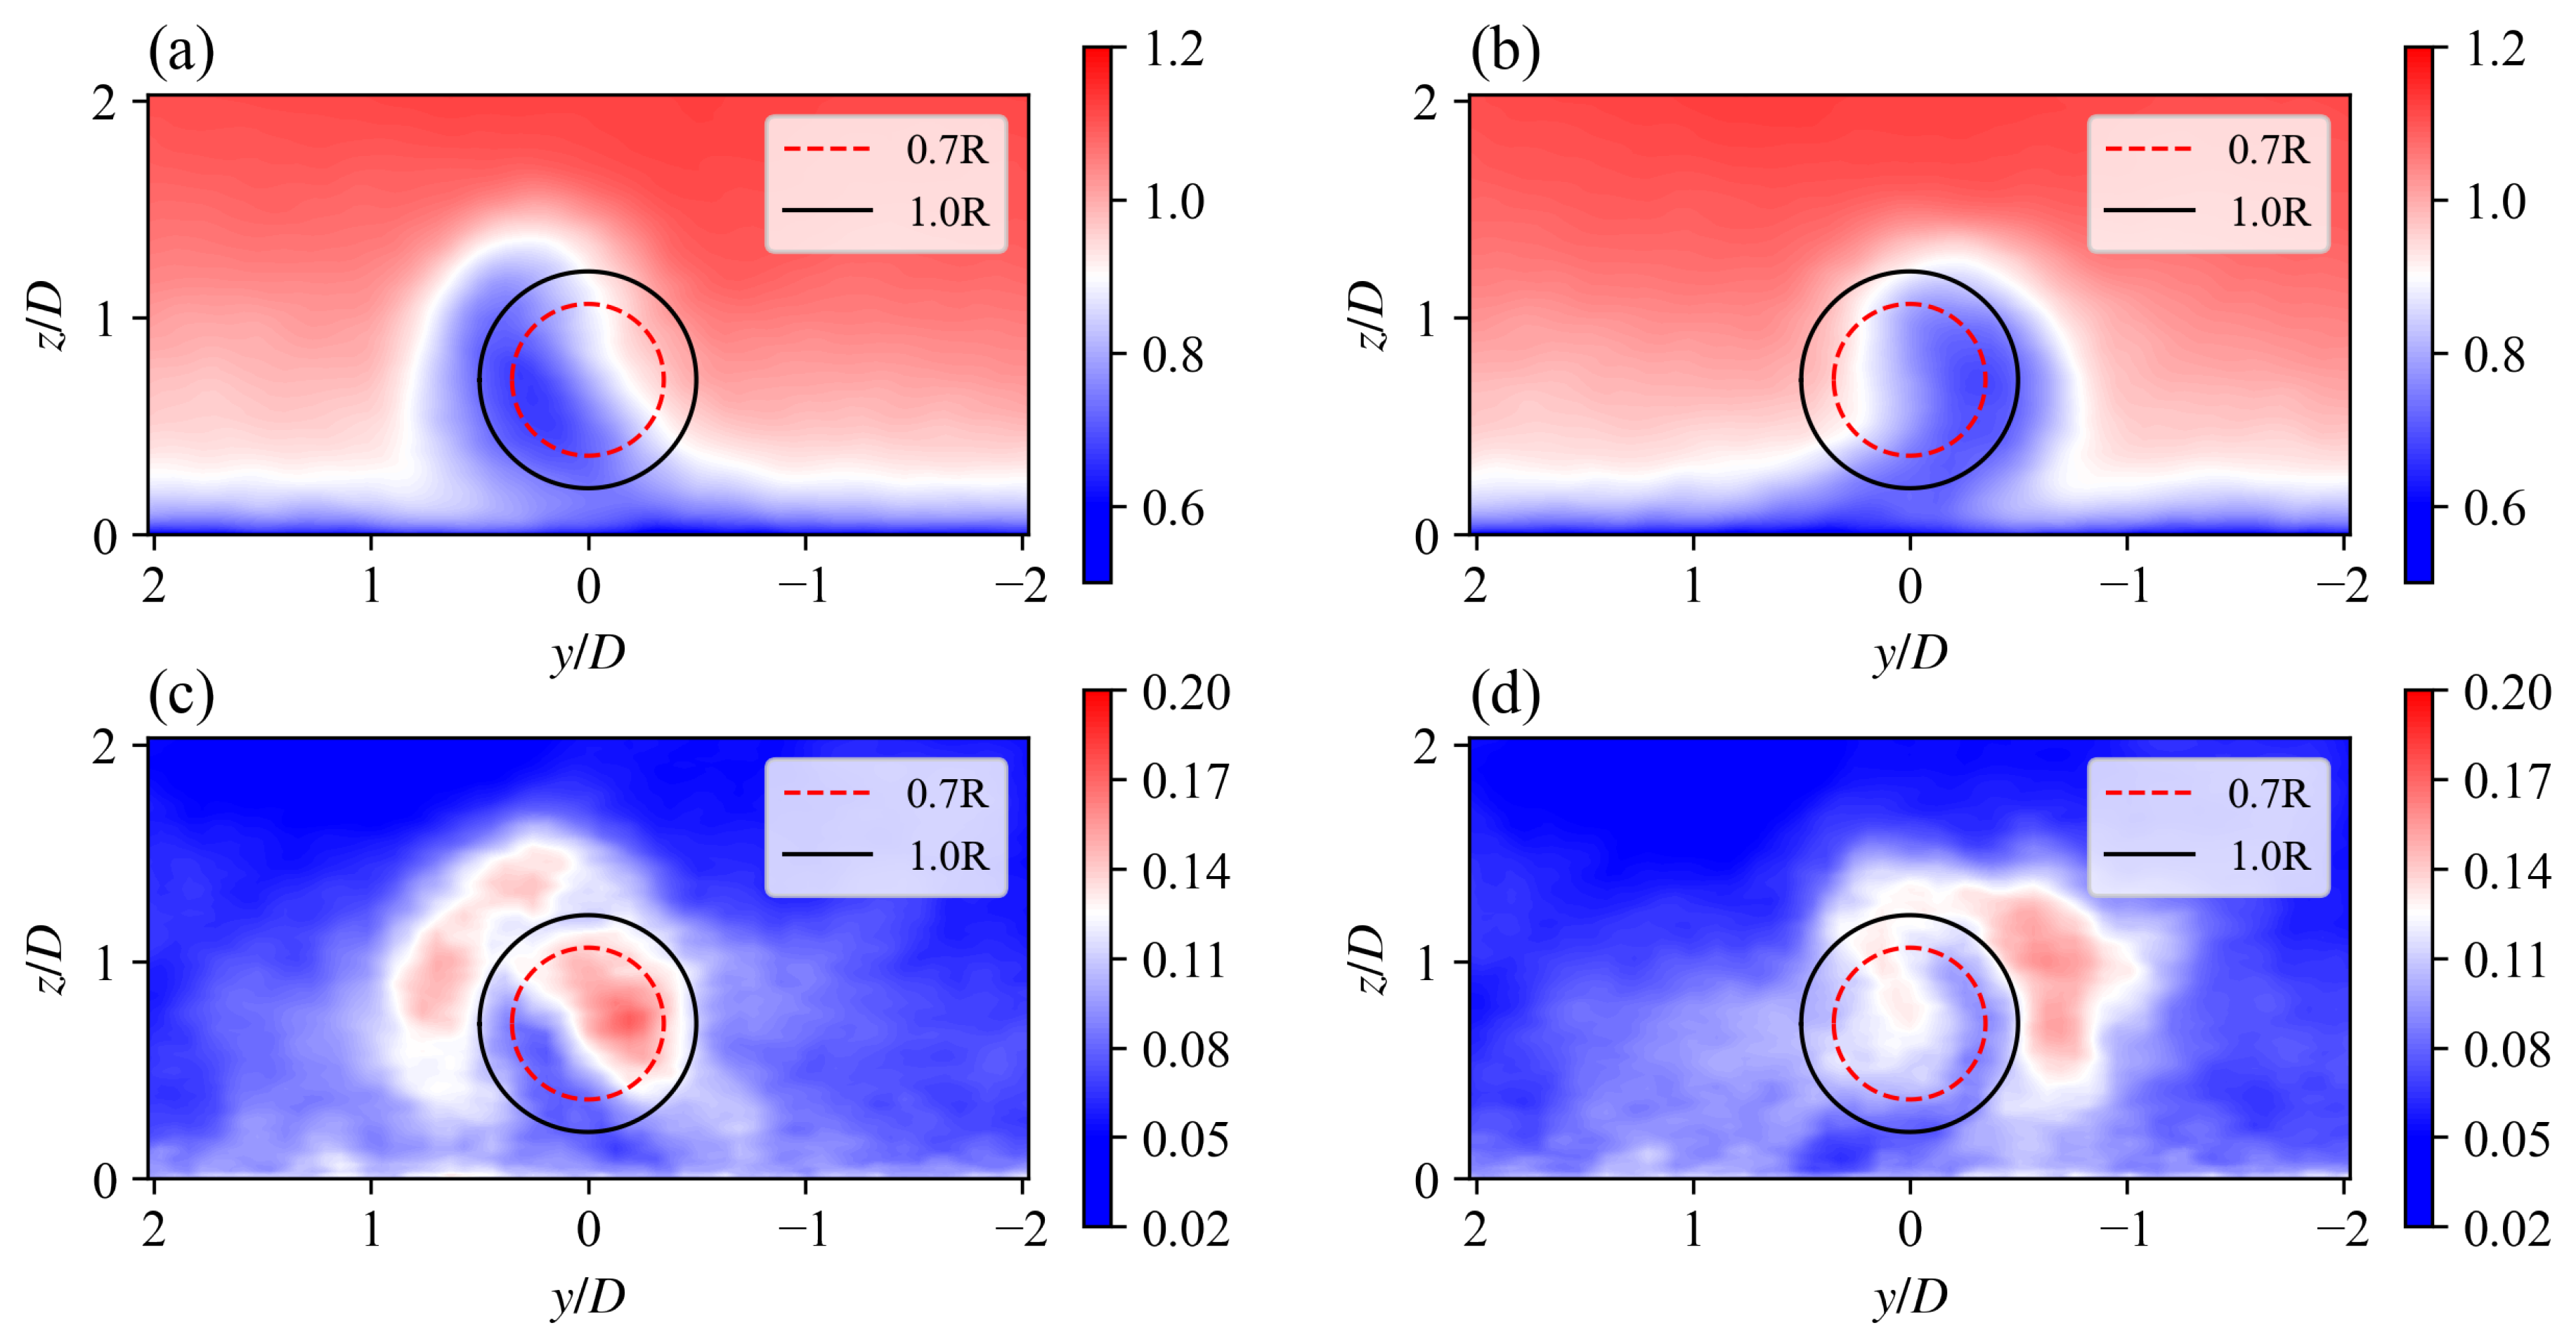
Furthermore, applying positive or negative yaw to the upwind turbine also affects the flapwise blade fatigue in its downwind turbine, even if the downwind turbine is not yawed, due to the different wake structures between the positively and negatively yawed turbine. For example, for a non-yawed turbine installed 7D downstream of WT 1 without spanwise offset, the front-view contours of its inflow statistics (normalised mean velocity and turbulence intensity) 1D in front of the downwind turbine are shown in
Figure 14. The spanwise deflection of the wake of the negatively yawed WT 1 is larger than that of the positively yawed WT 1. As a result, the azimuthal variation of the streamwise inflow velocity for the downwind turbine in the wake of the negatively yawed WT 1 is larger than that in the wake of the negatively yawed WT 1. The turbine in the wake of the negatively yawed WT 1 is also exposed to a higher level of streamwise turbulence than that in the wake of the positively yawed WT 1. Therefore, in this configuration, the downwind turbine would endure higher flapwise blade fatigue if it is in the wake of a negatively yawed turbine than that of a positively yawed turbine. The simulation results confirm that the flapwise DEL of the non-yawed WT 2 in the AYC case
,
is 7.7% higher than its counterpart in the AYC case
,
.
5. Discussion and conclusions
In this study, we investigate the power production and blade fatigue of a three-turbine array in full-wake and partial-wake configurations using a two-way coupled aeroelastic-LES framework. The simulations are carried out at discrete decision points of the AYC decision space spanned by the yaw angles of the first two turbines: . We extract the time series of the power and the blade bending moments from the simulations and compute the mean power outputs and the blade fatigue loads of the turbine array.
In full-wake configuration , we observe two local power optima in the explored AYC decision space : one in the positive quadrant () and another one in the negative quadrant (). The optimal yaw strategy with positive yaw angles yields slightly less power than that with negative yaw angles. We also find that the locally power-optimal positive yaw strategy endures less flapwise blade fatigue and more edgewise blade fatigue than its counterpart with negative yaw angles.
In partial-wake configurations and , there is only one power optimum in the explored decision space. Due to the spanwise offset of the turbines, applying optimal AYC achieves larger optimal power gains than that in the full-wake configuration. When the magnitude of increases from to , the optimal power gains start to decrease, as the non-yawed baseline in this configuration is less affected by wake interference. As for the blade fatigue, when the inflow angle is positive, applying the power-optimal yaw strategy in the positive quadrant of the AYC decision space achieves power gains while reducing the flapwise blade fatigue. In contrast, when the inflow angle is negative, the power-optimal strategies with negative inflow angles lead to higher flapwise blade fatigue than the baseline case. Compared with the flapwise fatigue, the variations of the edgewise fatigue loading to different AYC strategies are less significant in the partial-wake configurations under consideration.
Furthermore, through a BEM-based analysis, we reveal that, for the front-row turbine, the aformentioned differences in the flapwise blade fatigue between the positively and negatively yawed turbine are caused by the different azimuthal variations of the local relative velocity on blade sections, which result from the combined effects of vertical wind shear and blade rotation. For the downwind turbine exposed to the wake of the yawed turbine, the differences in the flapwise blade fatigue are caused by the different wake deficit and turbulence distributions in the wake of the positively and negatively yawed turbine. These findings highlight that, in the wake modelling of wind turbines subjected to AYC, it is necessary to consider the inflow inhomogeneity and blade rotation, as well as the differences between the wake structures of positively and negatively yawed turbines, particularly when fatigue evaluation is needed from the model.
Author Contributions
Conceptualization, Mou Lin and Fernando Porté-Agel; Data curation, Mou Lin and Fernando Porté-Agel; Formal analysis, Mou Lin and Fernando Porté-Agel; Funding acquisition, Fernando Porté-Agel; Investigation, Mou Lin and Fernando Porté-Agel; Methodology, Mou Lin and Fernando Porté-Agel; Project administration, Fernando Porté-Agel; Resources, Fernando Porté-Agel; Software, Mou Lin; Supervision, Fernando Porté-Agel; Validation, Mou Lin and Fernando Porté-Agel; Visualization, Mou Lin; Writing—original draft, Mou Lin; Writing—review & editing, Mou Lin and Fernando Porté-Agel.
Funding
This research was funded by the Swiss Federal Office of Energy (Grant SI/501337-01) and the Swiss National Science Foundation (Grants 200021_172538). In addition, this project was carried out within the frame of the Swiss Centre for Competence in Energy Research on the Future Swiss Electrical Infrastructure (SCCER-FURIES) with the financial support of the Swiss Innovation Agency (Innosuisse - SCCER program, contract number: 1155002544).
Data Availability Statement
The dataset is available upon request.
Acknowledgments
The authors would like to thank Álex Socías Villanueva for his contribution in the code development.
Conflicts of Interest
The authors declare no conflict of interest.
Abbreviations
The following abbreviations are used in this manuscript:
| ABL |
Atmospheric boundary layer |
| ALM |
Actuator line model |
| AoA |
Angle of attack |
| AYC |
Active yaw control |
| BEM |
Blade element momemtum |
| CVP |
Counter-rotating vortex pair |
| DEL |
Damage equivalent load |
| EALM |
Elastic actuator line model |
| EBM |
Edgewise bending moment |
| FBM |
Flapwise bending moment |
| LES |
Large-eddy simulation |
| WT |
Wind turbine |
References
- Grant, I.; Parkin, P.; Wang, X. Optical vortex tracking studies of a horizontal axis wind turbine in yaw using laser-sheet, flow visualisation. Exp. Fluids 1997, 23(6), 513. [Google Scholar] [CrossRef]
- Medici, D.; Alfredsson, P. Measurements on a wind turbine wake: 3D effects and bluff body vortex shedding. Wind Energy 2006, 9, 219–236. [Google Scholar] [CrossRef]
- Howland, M.F.; Bossuyt, J.; Martínez-Tossas, L.A.; Meyers, J.; Meneveau, C. Wake structure in actuator disk models of wind turbines in yaw under uniform inflow conditions. J. Renew. Sustain Ener. 2016, 8, 043301. [Google Scholar] [CrossRef]
- Bastankhah, M.; Porté-Agel, F. Wind farm power optimization via yaw angle control: A wind tunnel study. J. of Renew. Sustain. Ener. 2019, 11, 023301. [Google Scholar] [CrossRef]
- Zong, H.; Porté-Agel, F. A momentum-conserving wake superposition method for wind farm power prediction. Renew. Energ. 2021, 170, 1228. [Google Scholar] [CrossRef]
- Campagnolo, F.; Castellani, F.; Natili, F.; Astolfi, D.; Mühle, F. Wind Tunnel Testing of Yaw by Individual Pitch Control Applied to Wake Steering. Front. Energy Res. 2022, 10. [Google Scholar] [CrossRef]
- Jiménez, A.; Crespo, A.; Migoya, E. Application of a LES technique to characterize the wake deflection of a wind turbine in yaw. Wind Energy 2010, 13, 559–572. [Google Scholar] [CrossRef]
- Fleming, P.A.; Gebraad, P.M.; Lee, S.; van Wingerden, J.W.; Johnson, K.; Churchfield, M.; Michalakes, J.; Spalart, P.; Moriarty, P. Evaluating techniques for redirecting turbine wakes using SOWFA. Renew. Energ. 2014, 70, 211–218. [Google Scholar] [CrossRef]
- Munters, W.; Meyers, J. Dynamic strategies for yaw and induction control of wind farms based on large-eddy simulation and optimization. Energies 2018, 11(1), 177. [Google Scholar] [CrossRef]
- Fleming, P.; Annoni, J.; Churchfield, M.; Martinez-Tossas, L.A.; Gruchalla, K.; Lawson, M.; Moriarty, P. A simulation study demonstrating the importance of large-scale trailing vortices in wake steering. Wind Energy Sci. 2018, 3, 243–255. [Google Scholar] [CrossRef]
- Archer, C.L.; Vasel-Be-Hagh, A. Wake steering via yaw control in multi-turbine wind farms: Recommendations based on large-eddy simulation. Sustain. Energy Tech. and Assess. 2019, 33, 34. [Google Scholar] [CrossRef]
- Lin, M.; Porté-Agel, F. Large-eddy simulation of yawed wind-turbine wakes: comparisons with wind tunnel measurements and analytical wake models. Energies 2019, 12, 4574. [Google Scholar] [CrossRef]
- Kragh, K.A.; Hansen, M.H. Load alleviation of wind turbines by yaw misalignment. Wind Energy 2014, 17, 971–982. [Google Scholar] [CrossRef]
- Zalkind, D.S.; Pao, L.Y. The fatigue loading effects of yaw control for wind plants. 2016 American Control Conference (ACC). IEEE, 2016, pp. 537–542.
- Fleming, P.; Gebraad, P.M.; Lee, S.; van Wingerden, J.W.; Johnson, K.; Churchfield, M.; Michalakes, J.; Spalart, P.; Moriarty, P. Simulation comparison of wake mitigation control strategies for a two-turbine case. Wind Energy 2015, 18, 2135–2143. [Google Scholar] [CrossRef]
- Damiani, R.; Dana, S.; Annoni, J.; Fleming, P.; Roadman, J.; van Dam, J.; Dykes, K. Assessment of wind turbine component loads under yaw-offset conditions. Wind Energy Sci. 2018, 3, 173–189. [Google Scholar] [CrossRef]
- Gebraad, P.; Thomas, J.J.; Ning, A.; Fleming, P.; Dykes, K. Maximization of the annual energy production of wind power plants by optimization of layout and yaw-based wake control. Wind Energy 2017, 20, 97–107. [Google Scholar] [CrossRef]
- van Dijk, M.T.; van Wingerden, J.; Ashuri, T.; Li, Y. Wind farm multi-objective wake redirection for optimizing power production and loads. Energy 2017, 121, 561–569. [Google Scholar] [CrossRef]
- Kanev, S.; Savenije, F.; Engels, W. Active wake control: An approach to optimize the lifetime operation of wind farms. Wind Energy 2018, 21, 488–501. [Google Scholar] [CrossRef]
- Reyes, H.M.; Kanev, S.; Doekemeijer, B.; van Wingerden, J.W. Validation of a lookup-table approach to modeling turbine fatigue loads in wind farms under active wake control. Wind Energy Science 2019, 4, 549–561. [Google Scholar] [CrossRef]
- Lin, M.; Porté-Agel, F. Power maximization and fatigue-load mitigation in a wind-turbine array by active yaw control: an LES study. Journal of Physics: Conference Series. IOP Publishing, 2020, Vol. 1618, p. 042036. [CrossRef]
- Wu, Y.T.; Porté-Agel, F. Large-eddy simulation of wind-turbine wakes: evaluation of turbine parametrisations. Bound-lay. Meteorol. 2011, 138, 345. [Google Scholar] [CrossRef]
- Porté-Agel, F.; Wu, Y.T.; Lu, H.; Conzemius, R.J. Large-eddy simulation of atmospheric boundary layer flow through wind turbines and wind farms. J. Wind Eng. Ind. Aerod. 2011, 99, 154–168. [Google Scholar] [CrossRef]
- Abkar, M.; Porté-Agel, F. Influence of atmospheric stability on wind-turbine wakes: A large-eddy simulation study. Phys. Fluids 2015, 27, 035104. [Google Scholar] [CrossRef]
- Meng, H.; Lien, F.S.; Li, L. Elastic actuator line modelling for wake-induced fatigue analysis of horizontal axis wind turbine blade. Renewable energy 2018, 116, 423–437. [Google Scholar] [CrossRef]
- Lu, H.; Porté-Agel, F. A modulated gradient model for large-eddy simulation: Application to a neutral atmospheric boundary layer. Phys. Fluids 2010, 22, 015109. [Google Scholar] [CrossRef]
- Sørensen, J.N.; Shen, W.Z. Numerical modeling of wind turbine wakes. J. Fluids Eng. 2002, 124, 393–399. [Google Scholar] [CrossRef]
- Jonkman, J.; Butterfield, S.; Musial, W.; Scott, G. Definition of a 5-MW reference wind turbine for offshore system development. Technical report, National Renewable Energy Lab.(NREL), Golden, CO (United States), 2009. [CrossRef]
- Freebury, G.; Musial, W. Determining equivalent damage loading for full-scale wind turbine blade fatigue tests. 2000 ASME wind energy symposium, 2000, p. 50.
- IEC 61400-1:2019, Wind energy generation systems - Part 1: Design requirements, 3. ed.; International Electrotechnical Commission, 2019.
- Bastankhah, M.; Porté-Agel, F. Experimental and theoretical study of wind-turbine wakes in yawed conditions. J. Fluid Mech. 2016, 806, 506–541. [Google Scholar] [CrossRef]
- Zong, H.; Porté-Agel, F. A point vortex transportation model for yawed wind turbine wakes. J. Fluid Mech. 2020, 890, A8. [Google Scholar] [CrossRef]
- Shapiro, C.R.; Gayme, D.F.; Meneveau, C. Modelling yawed wind turbine wakes: a lifting line approach. J. Fluid Mech. 2018, 841, R1. [Google Scholar] [CrossRef]
- Anderson, J. Fundamentals of Aerodynamics; McGraw Hill, 2011.
- Burton, T.; Jenkins, N.; Sharpe, D.; Bossanyi, E. Wind Energy Handbook; John Wiley & Sons, 2011.
- Glauert, H. The theory of the autogyro. The Aeronautical Journal 1927, 31, 483–508. [Google Scholar] [CrossRef]
- Øys, S. Induced velocity for rotors in yaw. Proceedings of the 6th IEA Symposium on the Aerodynamics of Wind Turbines. ECN, Petten, Neitherland, 1992.
- Coleman, R.P.; Feingold, A.M.; Stempin, C.W. Evaluation of the induced-velocity field of an idealized helicoptor rotor. Technical report, National Aeronautics and Space Administration Hampton Va Langley Research Center, 1945.
Figure 1.
The ground-fixed coordinate system x - y - z for solving the filtered Navier-Stokes equations and the blade-following coordinate system - - for solving the Euler-Bernoulli beam equations for the nth blade: (a) top view; (b) front view. is the phase angle of the blade. is the yaw angle of the turbine. The positive directions of and follow the right-hand rule.
Figure 2.
The coupling procedure between the flow solver and the structural solver in the EALM. The arrows in the flowchart represent the variable passing between different modules of the solver.
Figure 2.
The coupling procedure between the flow solver and the structural solver in the EALM. The arrows in the flowchart represent the variable passing between different modules of the solver.
Figure 3.
Schematic plots (not to scale) of (a) the simulation domain; (b) NREL 5MW reference wind turbine.
Figure 3.
Schematic plots (not to scale) of (a) the simulation domain; (b) NREL 5MW reference wind turbine.
Figure 4.
Top-view x - y cross-section contours of normalised streamwise mean velocity deficits at the hub height. Full-wake configuration (): (a) ; (b) ; (c) . Partial-wake configuration (): (d) ; (e) ; (f) .
Figure 4.
Top-view x - y cross-section contours of normalised streamwise mean velocity deficits at the hub height. Full-wake configuration (): (a) ; (b) ; (c) . Partial-wake configuration (): (d) ; (e) ; (f) .
Figure 5.
Front-view y - z cross-section contours of normalised streamwise velocity deficits at the location 6D downwind of WT 1, overlapped with vector fields of in-plane velocity components: (a) ; (b) ; (c) .
Figure 5.
Front-view y - z cross-section contours of normalised streamwise velocity deficits at the location 6D downwind of WT 1, overlapped with vector fields of in-plane velocity components: (a) ; (b) ; (c) .
Figure 6.
Normalised power outputs of different AYC configurations, normalised by the power of WT 1 in zero yaw (a) in full-wake configuration (b) in partial-wake configuration .
Figure 6.
Normalised power outputs of different AYC configurations, normalised by the power of WT 1 in zero yaw (a) in full-wake configuration (b) in partial-wake configuration .
Figure 7.
Normalised power gain contours in the AYC decision space for different inflow angles. Black dots show the AYC configurations with the largest power gains.
Figure 7.
Normalised power gain contours in the AYC decision space for different inflow angles. Black dots show the AYC configurations with the largest power gains.
Figure 8.
Time series segments of blade-root bending moments of WT 1: (a) flapwise bending moment; (b) edgewise bending moment. Empty cycles show the load reversal points extracted by the rainflow counting algorithm.
Figure 8.
Time series segments of blade-root bending moments of WT 1: (a) flapwise bending moment; (b) edgewise bending moment. Empty cycles show the load reversal points extracted by the rainflow counting algorithm.
Figure 9.
Normalised DELs of blade-root blending moments in different AYC configurations and inflow angles, normalised by the DELs of WT 1 in zero yaw condition: (a)-(b) flapwise bending moment; (c)-(d) edgewise bending moment.
Figure 9.
Normalised DELs of blade-root blending moments in different AYC configurations and inflow angles, normalised by the DELs of WT 1 in zero yaw condition: (a)-(b) flapwise bending moment; (c)-(d) edgewise bending moment.
Figure 10.
Normalised DEL variation contours in the AYC decision space for different inflow angles for (a)-(e) flapwise bending moment; (f)-(j) edgewise bending moment. Black dots show the power-optimal AYC configurations and their corresponding DEL variations.
Figure 10.
Normalised DEL variation contours in the AYC decision space for different inflow angles for (a)-(e) flapwise bending moment; (f)-(j) edgewise bending moment. Black dots show the power-optimal AYC configurations and their corresponding DEL variations.
Figure 11.
Schematic plot of the velocity and force triangles on a rotating wind turbine blade based on the BEM theory.
Figure 11.
Schematic plot of the velocity and force triangles on a rotating wind turbine blade based on the BEM theory.
Figure 12.
Freestream inflow velocity to the turbine blade section : (a) at different vertical heights; (b) at different blade phase angles.
Figure 12.
Freestream inflow velocity to the turbine blade section : (a) at different vertical heights; (b) at different blade phase angles.
Figure 13.
Azimuthal variations of at with respect to the blade phase angle predicted by the BEM theory in (a) a uniform inflow m/s; (b) a vertically sheared inflow , in which m/s, , and m.
Figure 13.
Azimuthal variations of at with respect to the blade phase angle predicted by the BEM theory in (a) a uniform inflow m/s; (b) a vertically sheared inflow , in which m/s, , and m.
Figure 14.
Front-view y - z cross-section contours of normalised streamwise mean velocity and turbulence intensity at the location 6D downwind of WT 1: (a) , ; (b) , ; (c) , ; (d) , . Black and red circles represent the trajectories of the blade sections and of the rotating blade, respectively.
Figure 14.
Front-view y - z cross-section contours of normalised streamwise mean velocity and turbulence intensity at the location 6D downwind of WT 1: (a) , ; (b) , ; (c) , ; (d) , . Black and red circles represent the trajectories of the blade sections and of the rotating blade, respectively.
Table 1.
Configurations of six representative cases in full-wake and partial-wake configurations.
Table 1.
Configurations of six representative cases in full-wake and partial-wake configurations.
| Case |
Yaw angle () |
Inflow angle () |
| (a) |
|
|
| (b) |
|
|
| (c) |
|
|
| (d) |
|
|
| (e) |
|
|
| (f) |
|
|
Table 2.
Power gains and DEL variations for the configurations with opposite yaw and inflow angles.
Table 2.
Power gains and DEL variations for the configurations with opposite yaw and inflow angles.
| Yaw angles () |
Inflow angle () |
|
|
|
|
|
12.9 % |
7.09% |
0.54% |
|
|
11.12% |
-3.18% |
0.99% |
|
Disclaimer/Publisher’s Note: The statements, opinions and data contained in all publications are solely those of the individual author(s) and contributor(s) and not of MDPI and/or the editor(s). MDPI and/or the editor(s) disclaim responsibility for any injury to people or property resulting from any ideas, methods, instructions or products referred to in the content. |
© 2023 by the authors. Licensee MDPI, Basel, Switzerland. This article is an open access article distributed under the terms and conditions of the Creative Commons Attribution (CC BY) license (http://creativecommons.org/licenses/by/4.0/).
