1. Introduction
The main advantage of submarine outfalls compared to other alternatives for final sewage disposal is their low cost, making them a very common option in coastal cities [
1,
2]. The discharge of wastewater through submarine outfalls generates pollution in the marine environment, resulting in greater scientific interest [3-6]. Due to the momentum and difference in densities between the seawater and wastewater discharge, the plume rises to the surface and is diluted by entrains surrounding seawater, this process is known as near-field dilution or initial dilution [
7]. The buoyant plume reduces its density as ascending trough the seawater [
8]. Discharge conditions, diffuser lengths, ocean currents, and stratification have a marked influence on near-field dilution [
8,
9]. When stratification occurs, the plume can become trapped below the surface of the water since its density equals seawater. [
7]. Submarine outfall is built to achieve the maximum dilution possible to generate lesser effects on marine ecosystems. The impacts on marine ecosystems can be significantly reduced if a submarine outfall with a high initial dilution is used for wastewater discharge [
10,
11].
To study the effects of submarine outfalls and its dilution process, two regions have been established—near and far field. Near-field is dominated by the conditions of the wastewater discharge through the diffusers of the submarine outfall, while far-field is hydrodynamics marine-dominated. Several authors have considered a third zone due a transitional field between both [
12]. Using laboratory experiments, near-field dilution process has been extensively studied [13-15]. Early investigations were based exclusively on the difference in densities, considering the discharge as a buoyant jet that decreases in density as it ascends in the seawater colum [
16]. From the study carried out by Chin [
17] other processes such as the inclusion of wave effects have been considered [18-25].
Waves can affect the dilution of the effluent discharge of submarine outfalls [
23,
24]. During stratification events where a well-developed thermocline is achieved, the buoyant plume remains immersed. However, as waves pass, the buoyant plume could reach the surface [
23]. Such a phenomenon has been studied by several researchers [
19,
23,
25]. Detailed information about these developments and findings, as well as other researchers, can be consulted in [
23,
24]. There is a need to increase the knowledge of the effects of waves in the dilution of the discharge of submarine outfalls, a lack of knowledge about the effects of wave periods and wave heights of the buoyant jet plume has been reported by Xu [
26]. Research performed by several authors has confirmed that it is necessary to take into consideration the effects of surface waves on the dilution of wastewater discharge into sea environments [23,26-30].
A complete discussion of the dilution process under marine wave based on review of the literature was carried out by Anghan [
11], recommending increasing the computational efforts in the new studies to determine the effects of waves on the dilution of buoyant jets.
The aim of the present study was the modeling of the near-field dilution of the pollutant generated by the untreated wastewater discharge of the Santa Marta´s submarine outfall considering coastal waves. The formulations of Chin [
29] and Hwung [
25] validates by Niu [
24] were incorporated into this analysis to determine the effect of the waves on the dilution of the discharge of wastewater from Santa Marta´s submarine outfall, and the results are presented in this paper.
1.1. Effects of External Waves
The rate of dilution of jet discharge affected by wave motion is a function of the parameters controlling the buoyancy and propagation of surface waves. Some of the variables characterizing the kinematic and dynamic behavior of a buoyant jet are: Flow momentum,
; buoyancy,
(effective gravity,
); volumetric flow,
; discharge depth, H. Out of these,
corresponds to the initial difference of density between the discharge and receiving flow, while
represents the initial density of the effluent. The group of parameters describing the motion of surface waves consists of: Depth in the water column, h; wave width α; period, T; gravity, g. Moreover, there are two additional variables that spatially relate the buoyant plume with surface waves: Discharge angle with respect to the horizontal plane (
) and discharge angle with respect to the wave propagation direction (
). With these control parameters, the dilution S of a buoyant jet immersed in a non-stratified environment is described by Equation (1) [
29]:
According to Chin [
19], predominant mechanisms with an influence on the effluent dilution of submarine outfalls can be easily characterized through the dimensional formulation of variables in terms of length scale. Fischer et al. [
29] introduced length scale concepts, referenced by the following equations:
where:
is the length scale from which buoyancy is dominated by the discharge flow;
is the length scale to measure the distance required so that the jet momentum can be affected by waves;
is the length scale of the discharge; A is the cross-section area of diffuser nozzles;
is the horizontal velocity of the wave. For small wave widths,
is defined by Equation (5).
where
and
are the angular frequency and wave number, respectively.
From laboratory experiments, Chin [
19] established a final equation that relates the effect of dilution (S) given the presence of surface waves (Equation 6 ):
where
is an empirical coefficient. Chin [
19] assigned it a value of 6.15 for
values between 0.03 and 0.15, while Hwung et al. [
25] gave a value of 4.21 when flow follows the direction of wave motion, a value of 4.16 for the direction contrary to the wave motion, and a value of 5.55 for orthogonal discharges. Hwang et al. [
31] suggested values in the range of 1.4–8.66, while Chyan et al. [
3], by studying the discharge with angles of inclination between 0 and 180 degrees with respect to the horizontal plane and in the presence of waves, found values between 2.9 and 14.5 when
showed a variation between 0.01 and 0.03 [
24].
Niu [
24] introduced a new formulation validated with the experimental data of Chin [
19] and Hwung et al. [
31]. In this new expression, effects in deep waters (when H/
> 9.03) are differentiated from shallow water, and the densimetric Froude number (
) is included. In the case of deep waters, the expression is shown in Equation (7).
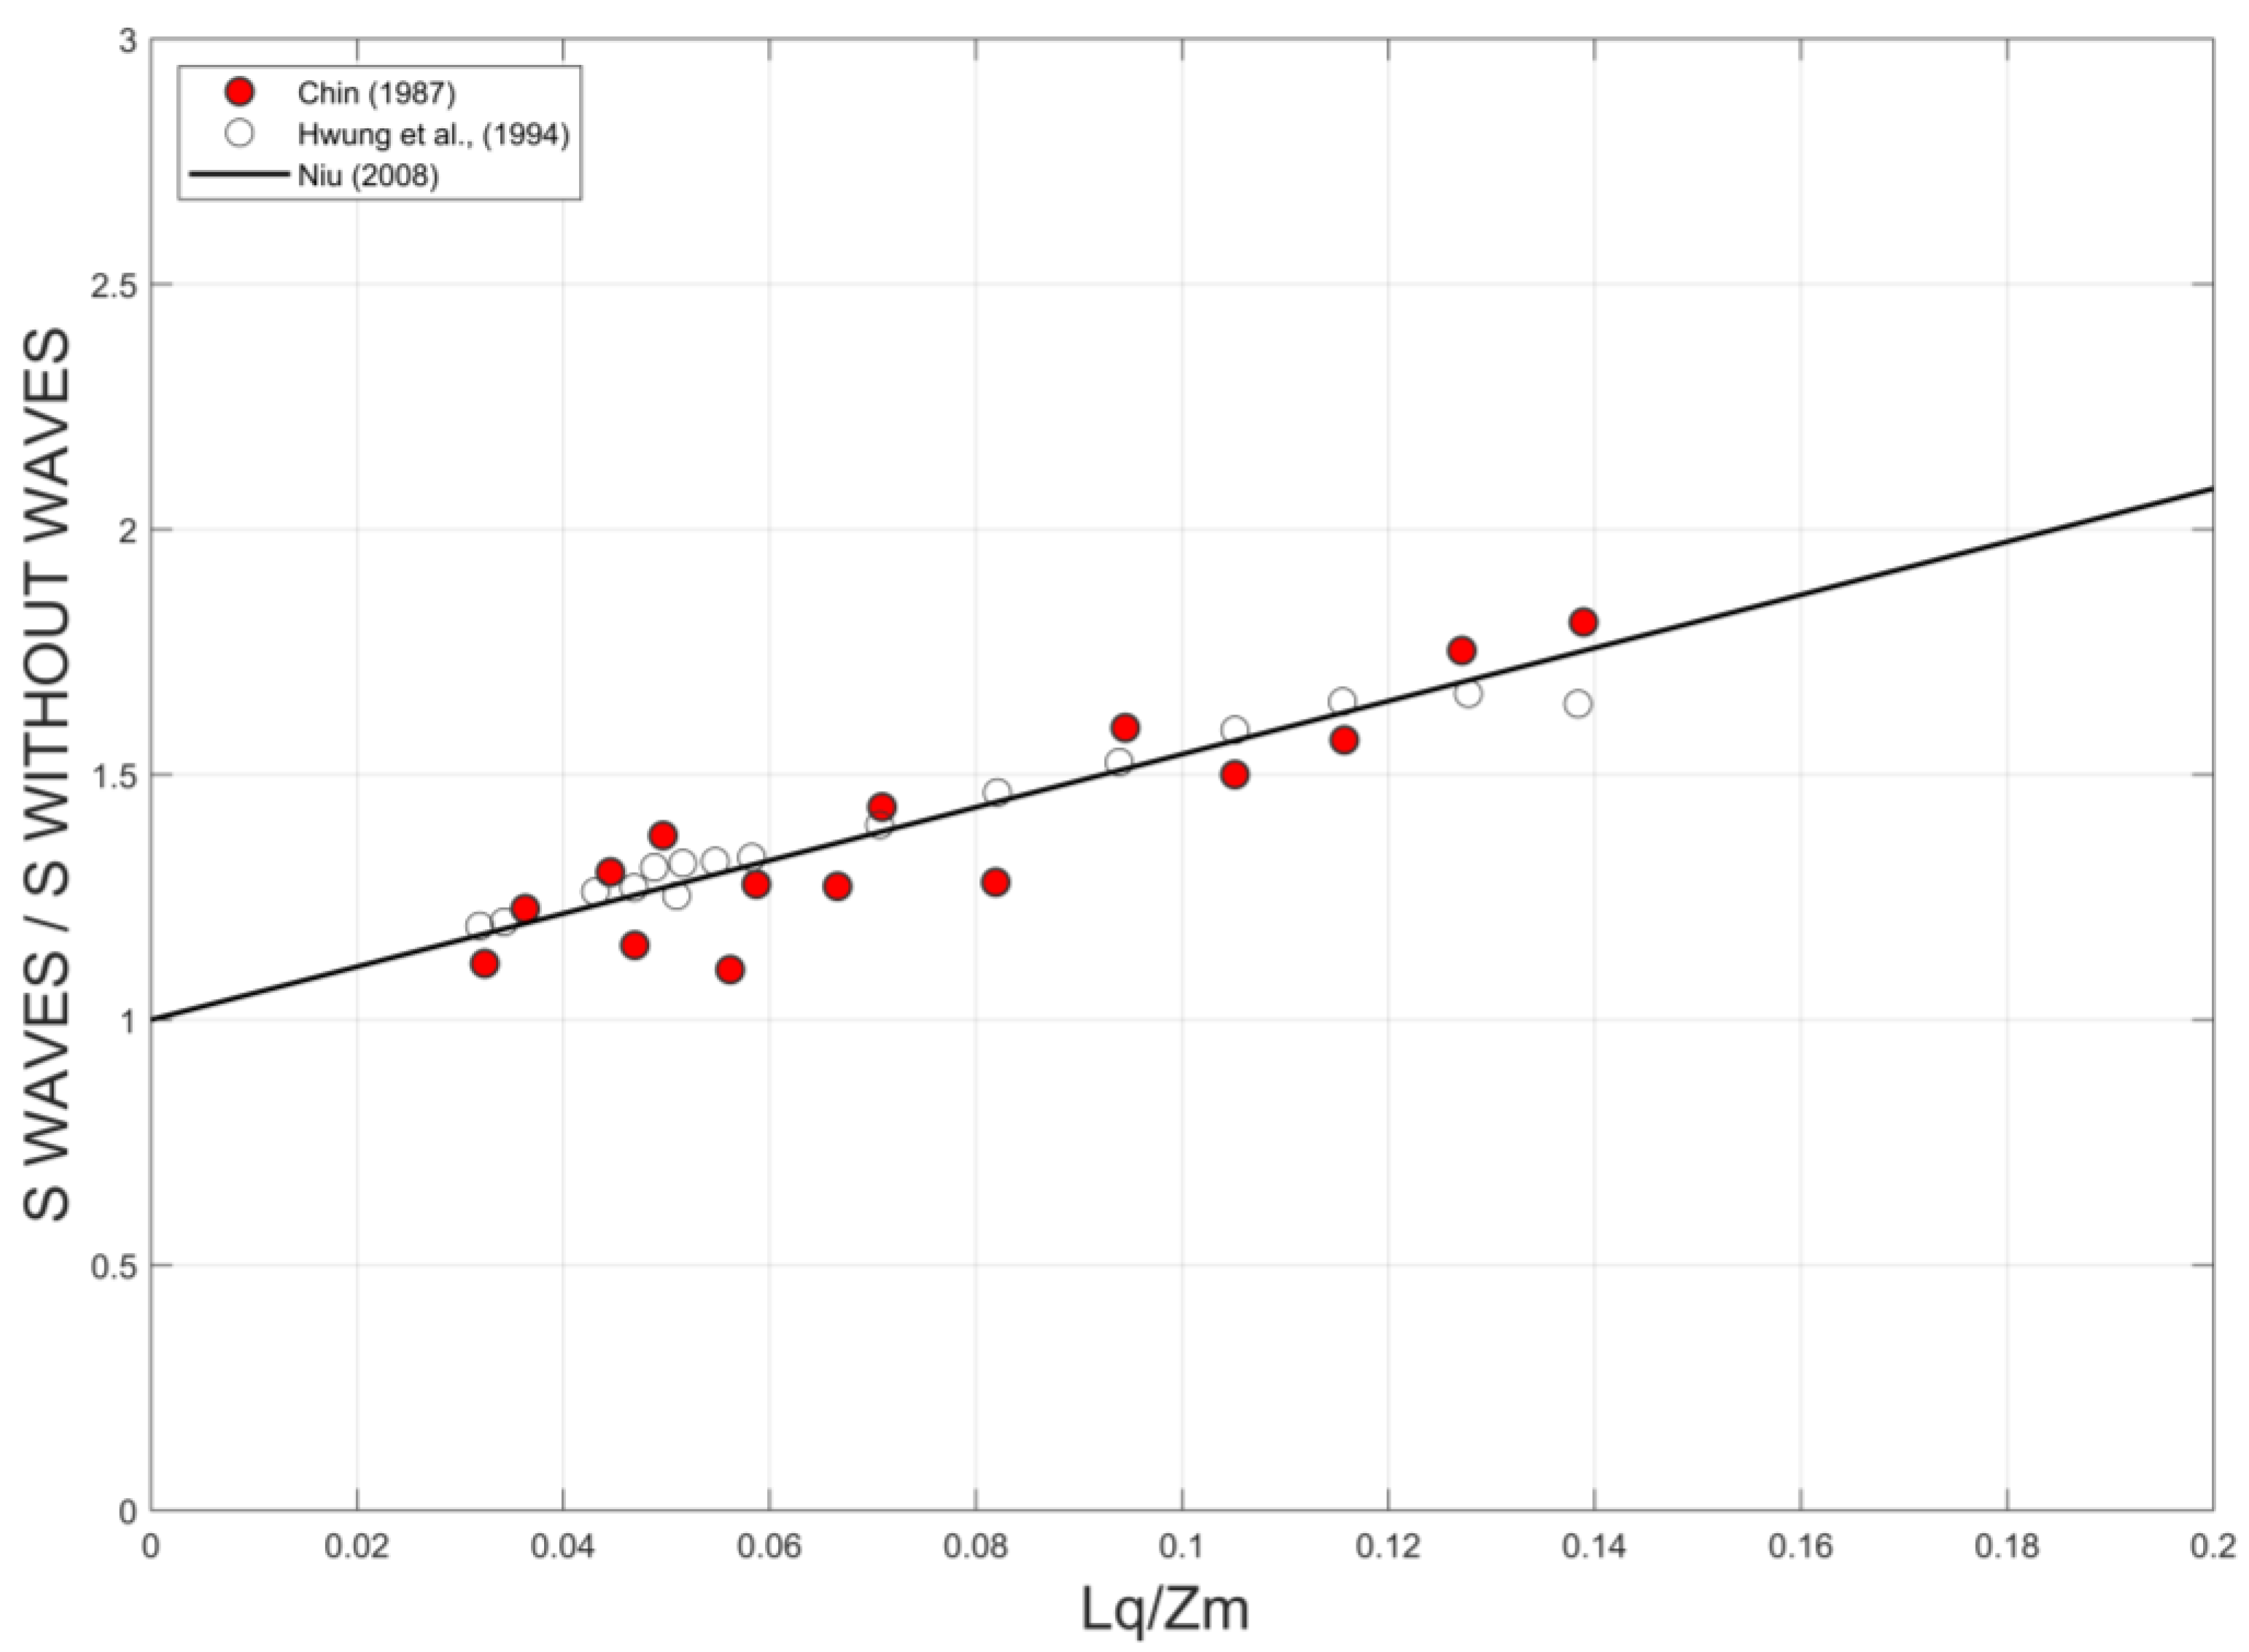
Figure 1 shows the degree of agreement between the results of the equation proposed by Niu [
24] (Equation (7)) and the experimental results of Chin [
19] and Hwung et al. [
31].
2. Materials and Methods
2.1. Study Area.
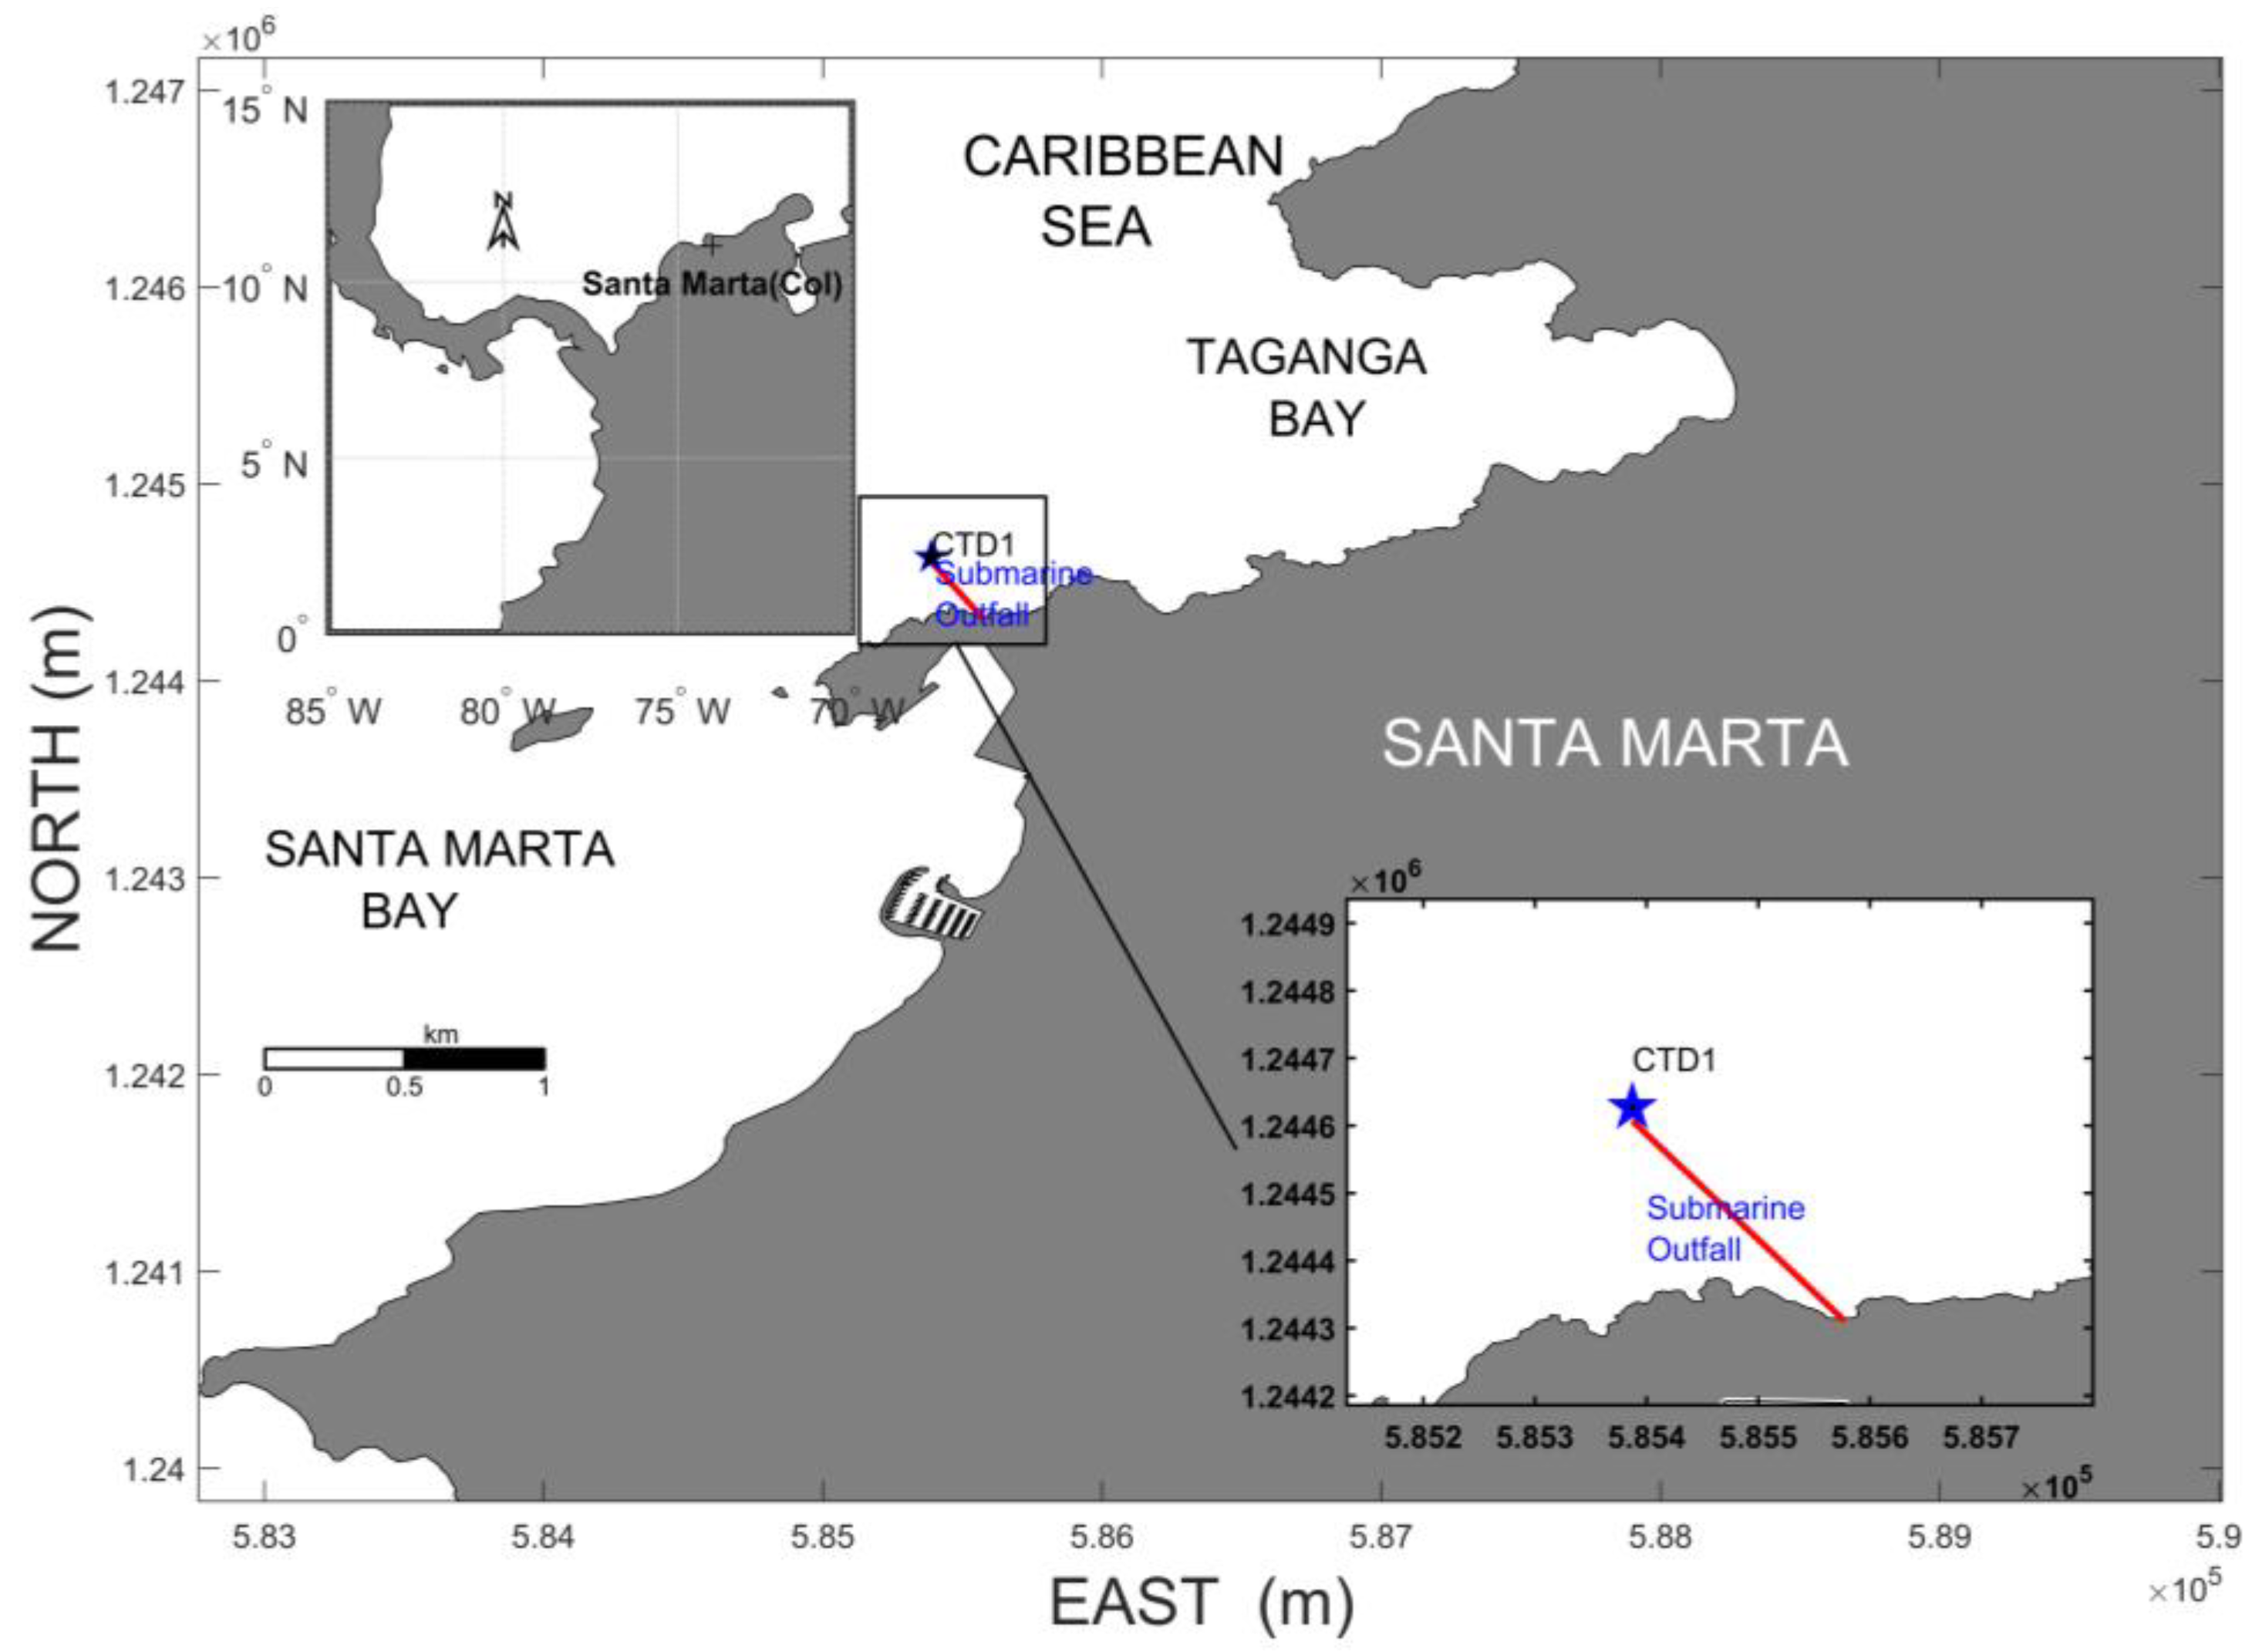
Santa Marta´s submarine outfall is located at the coordinates 11.23 north latitude, –74.22 east longitude in the Caribbean Sea (
Figure 2). This wastewater disposal system consists of a pipeline with a 1 -meter diameter and a 442 m longitude, with 32 diffusers (8 inches diameter) located at regular intervals throughout the last 100 meters. Through this system, an average of 1 m
3/s wastewater is discharged. Santa Marta is in the Intertropical Convergence Zone (ITCZ), for this reason its weather is strongly influenced by the north trade winds [
33,
34]. In the dry period (December–April), local upwelling phenomenon occurs, the water temperatures decrease until 20 °C and increases the salinity up to 38 UPS [
35]. From May to November upwelling disappears, the water temperature increases up to 29°C, and salinity has values near to 34 UPS [
35]. Seasonal upwelling changes the physicochemical variables in the water column, according to Arroyave et al. [
34].
2.2. Near Field Dilution Model
The PLUME3 model formulated by Tate [
23] was used; its source code was rewritten in MATLAB (2020a MathWorks, USA) and coupled to a 3D hydrodynamic model for accepting sea current fields, temperature, and salinity in the water column. The use of this model allows to determine the trajectory, thickness, level of entrapment, and dilution of the plume caused by the wastewater discharge of Santa Marta submarine outfall. The PLUME3 model has been calibrate and validated for several conditions, including field and laboratory experimentation by Tate [
23], and recently it has been used in other studies, with a new updated version under the name of PLOOM3 [
36]. The results of the PLUME3 model show the trajectory, extension, and the shape of the plume, as well as its level of entrapment or its arrival at the surface, it solves the equations for the mass and momentum conservation in a Lagrangian scheme including conservation of the buoyancy to estimate the initial dilution [36-38]. Two versions of the PLUME3 model were rewritten in MATLAB to consider dilution with and without wave.
2.3. Hydrodynamic Model
The RMA10 model, which Predicts density, temperature, and velocity fields for various depths of the water column has been used, it solves the Reynolds form of the equation of state, together with the equations of conservation of mass and advection-diffusion using the finite-elements method [39-42]. Bottom friction, Coriolis effects, and wind-induced stress on water surface have also been included in the model. Details of the calibration and validation process of the RMA model can be consulted in García et al, [40-42]. With previous work carried out by Garcia et al. [39-42], the model was considered calibrate in order to determinate the variable needs to find the initial dilution on the near field of Santa Marta submarine outfall.
To validate RMA10 model for a long period, measurements of temperature and salinity at different depths were carried out on the proximity of the diffusers of Santa Marta´s submarine outfall. The measurement station is shown in
Figure 2 (CTD1). Twelve measurements campaigns from January to December were carried out, one in the middle of each month. A SonTek CastAway-CTD was used to measurements of temperature (Accuracy 0.05°C) and salinity (Accuracy 0.1 PSU). The model results were compared to the temperature and salinity profiles at the exact horas of the measurement in order to determinate the model exactitude, and were assessed with normalized mean absolute error (NMAE) as defined by Equation (8) [
16,
43]:
where
is the simulated variable,
is the observed variable,
is the average observed value, and n is the number of observations. A value of zero indicates a perfect agreement between the predicted and measured data when the NMAE is evaluated [
16,
43].
Equations (9) and (10) were used for determining the height of waves (
) and time (
) as a function of wind velocity (
), depth of water column (
), Fecth (
), and gravity acceleration (
) [
44].
wind fields on the water surface, used for simulating wave height and period, were generated using the NCEP/NCAR reanalysis from
http://www.cdc.noaa.gov/cdc/data. Since wind fields from NCEP/NCAR underestimate the intensity of winds, following the experience of other researchers [
45], these intensities were increased by one factor according to García et al. [
40].
For analyzing the behavior of the submarine outfall discharge, quantifying the wave effect, a year period (2021) was simulated. Two runs were performed; the first one for a scenario without waves and the second for one that included surface waves. Wave effects were quantified according to Niu [
24].
3. Results
3.1. Validation RMA10 Hydrodinamic Model
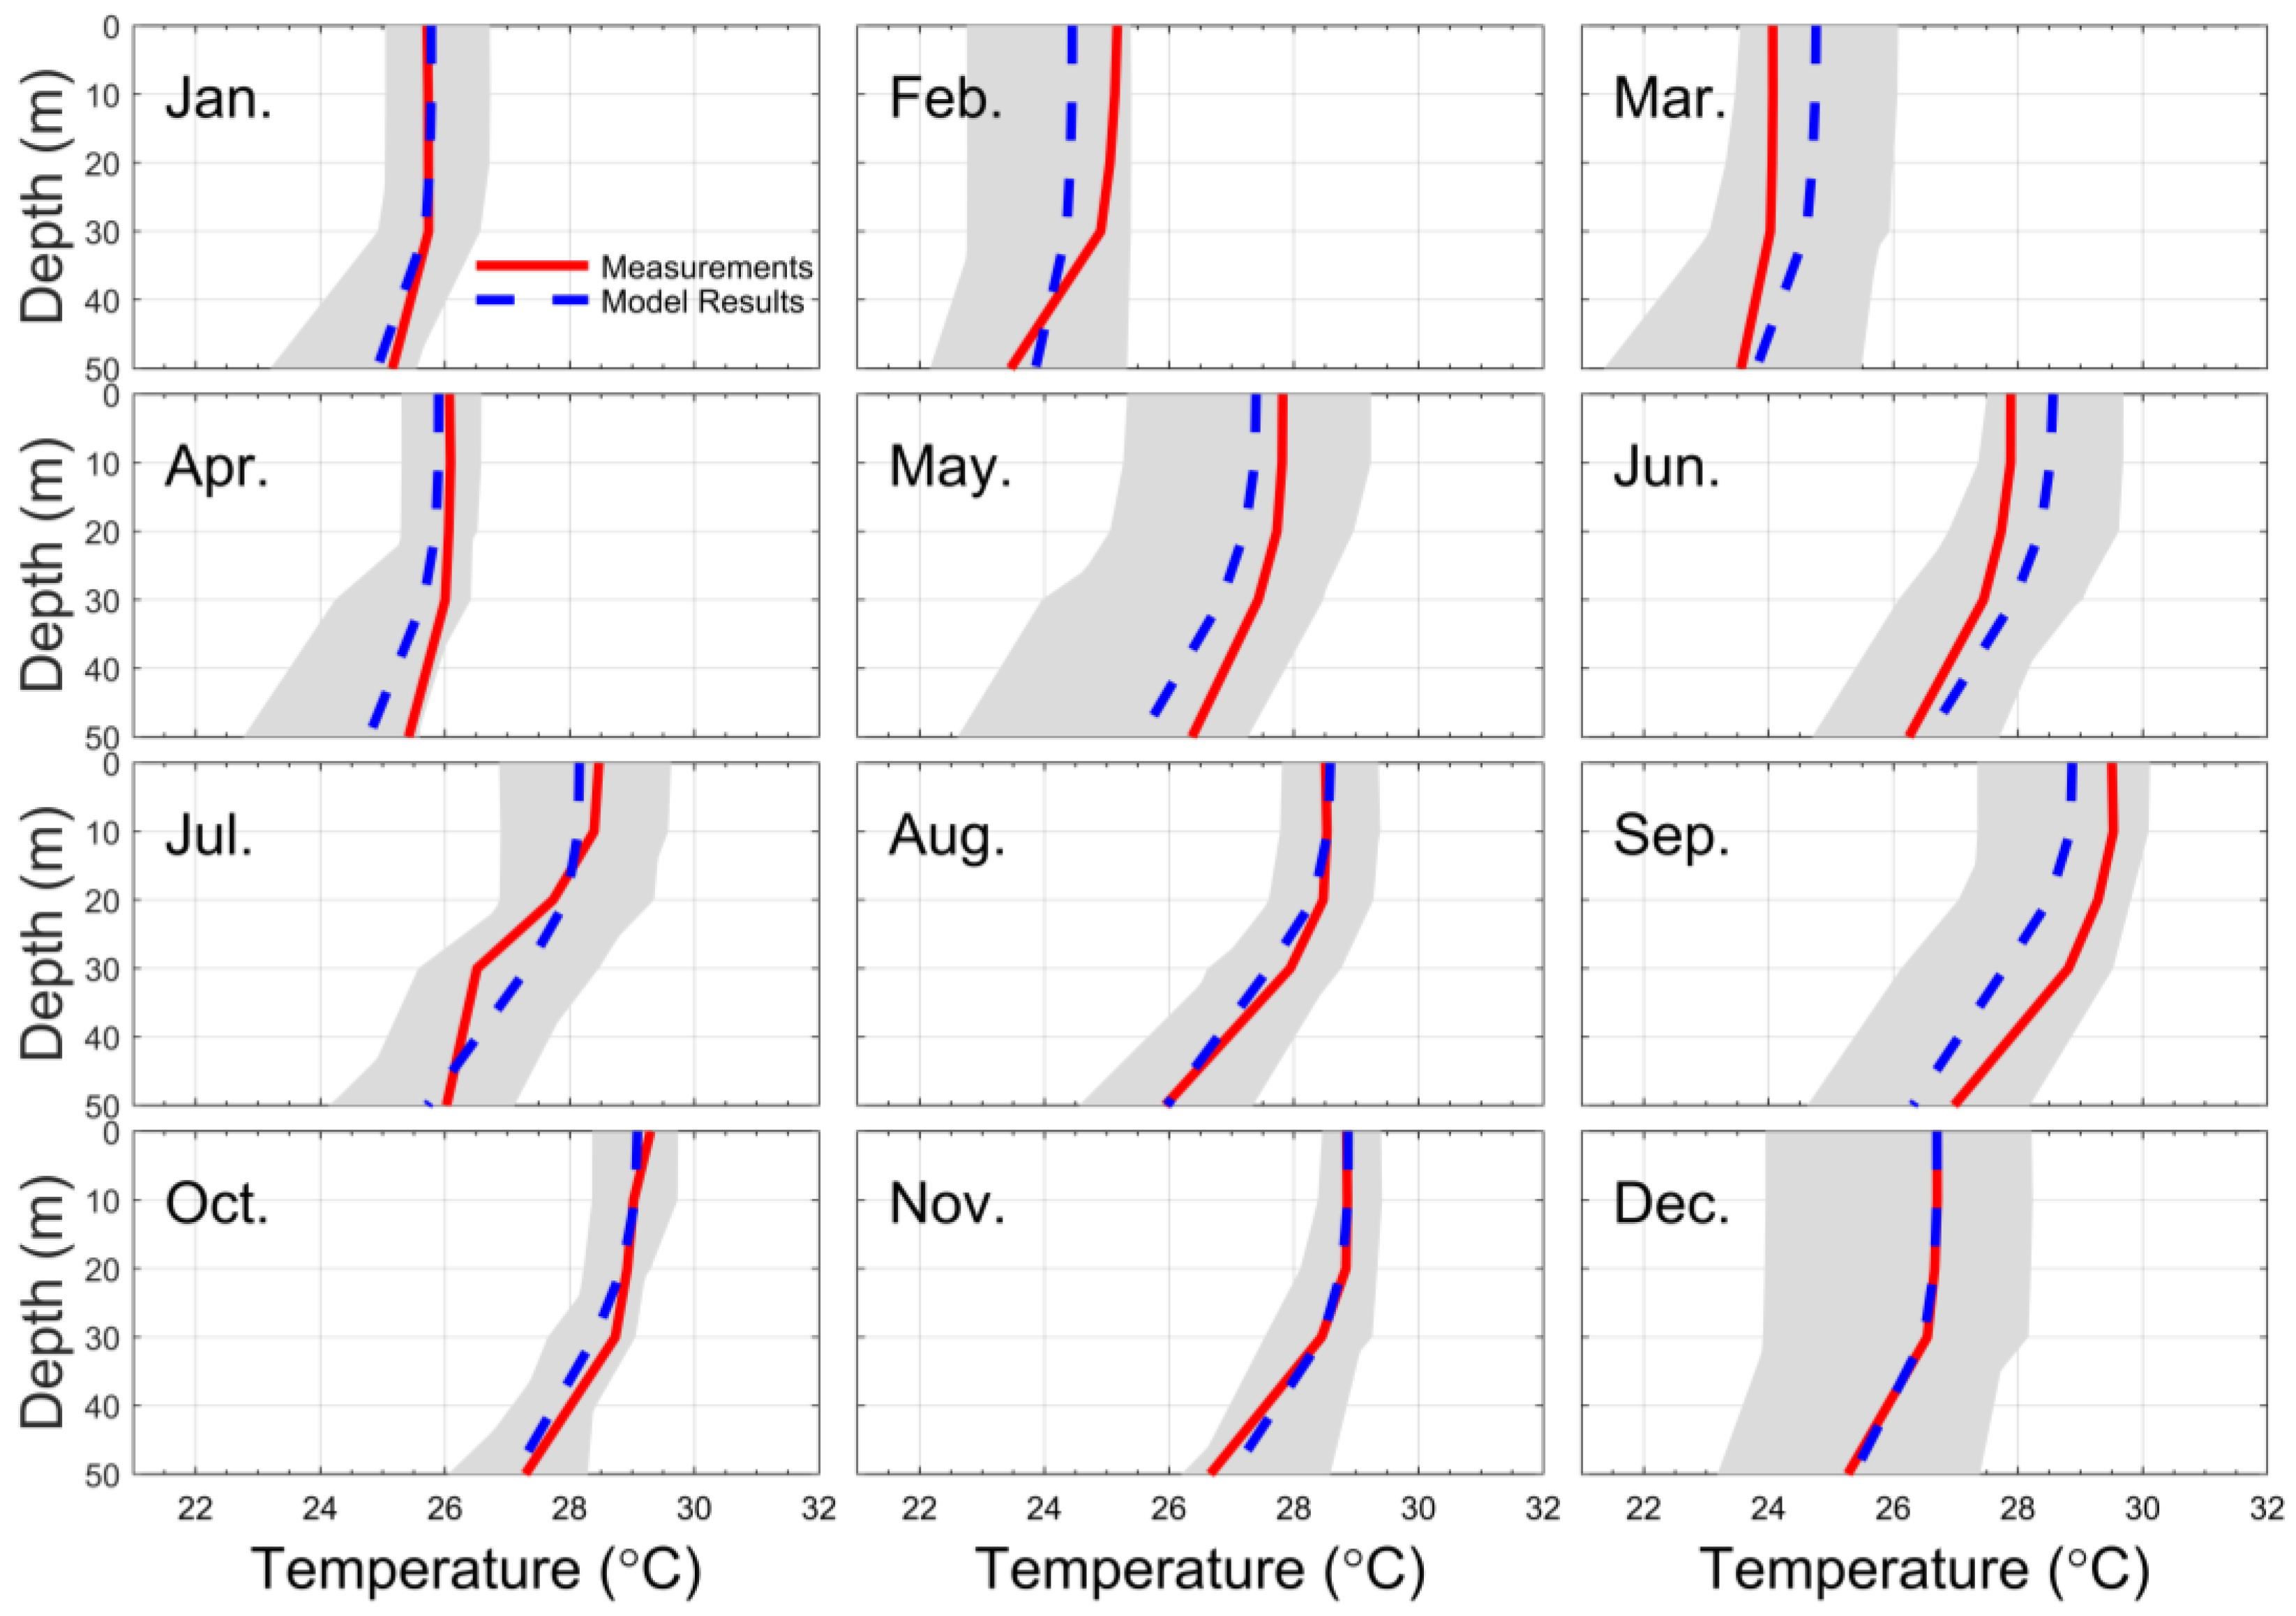
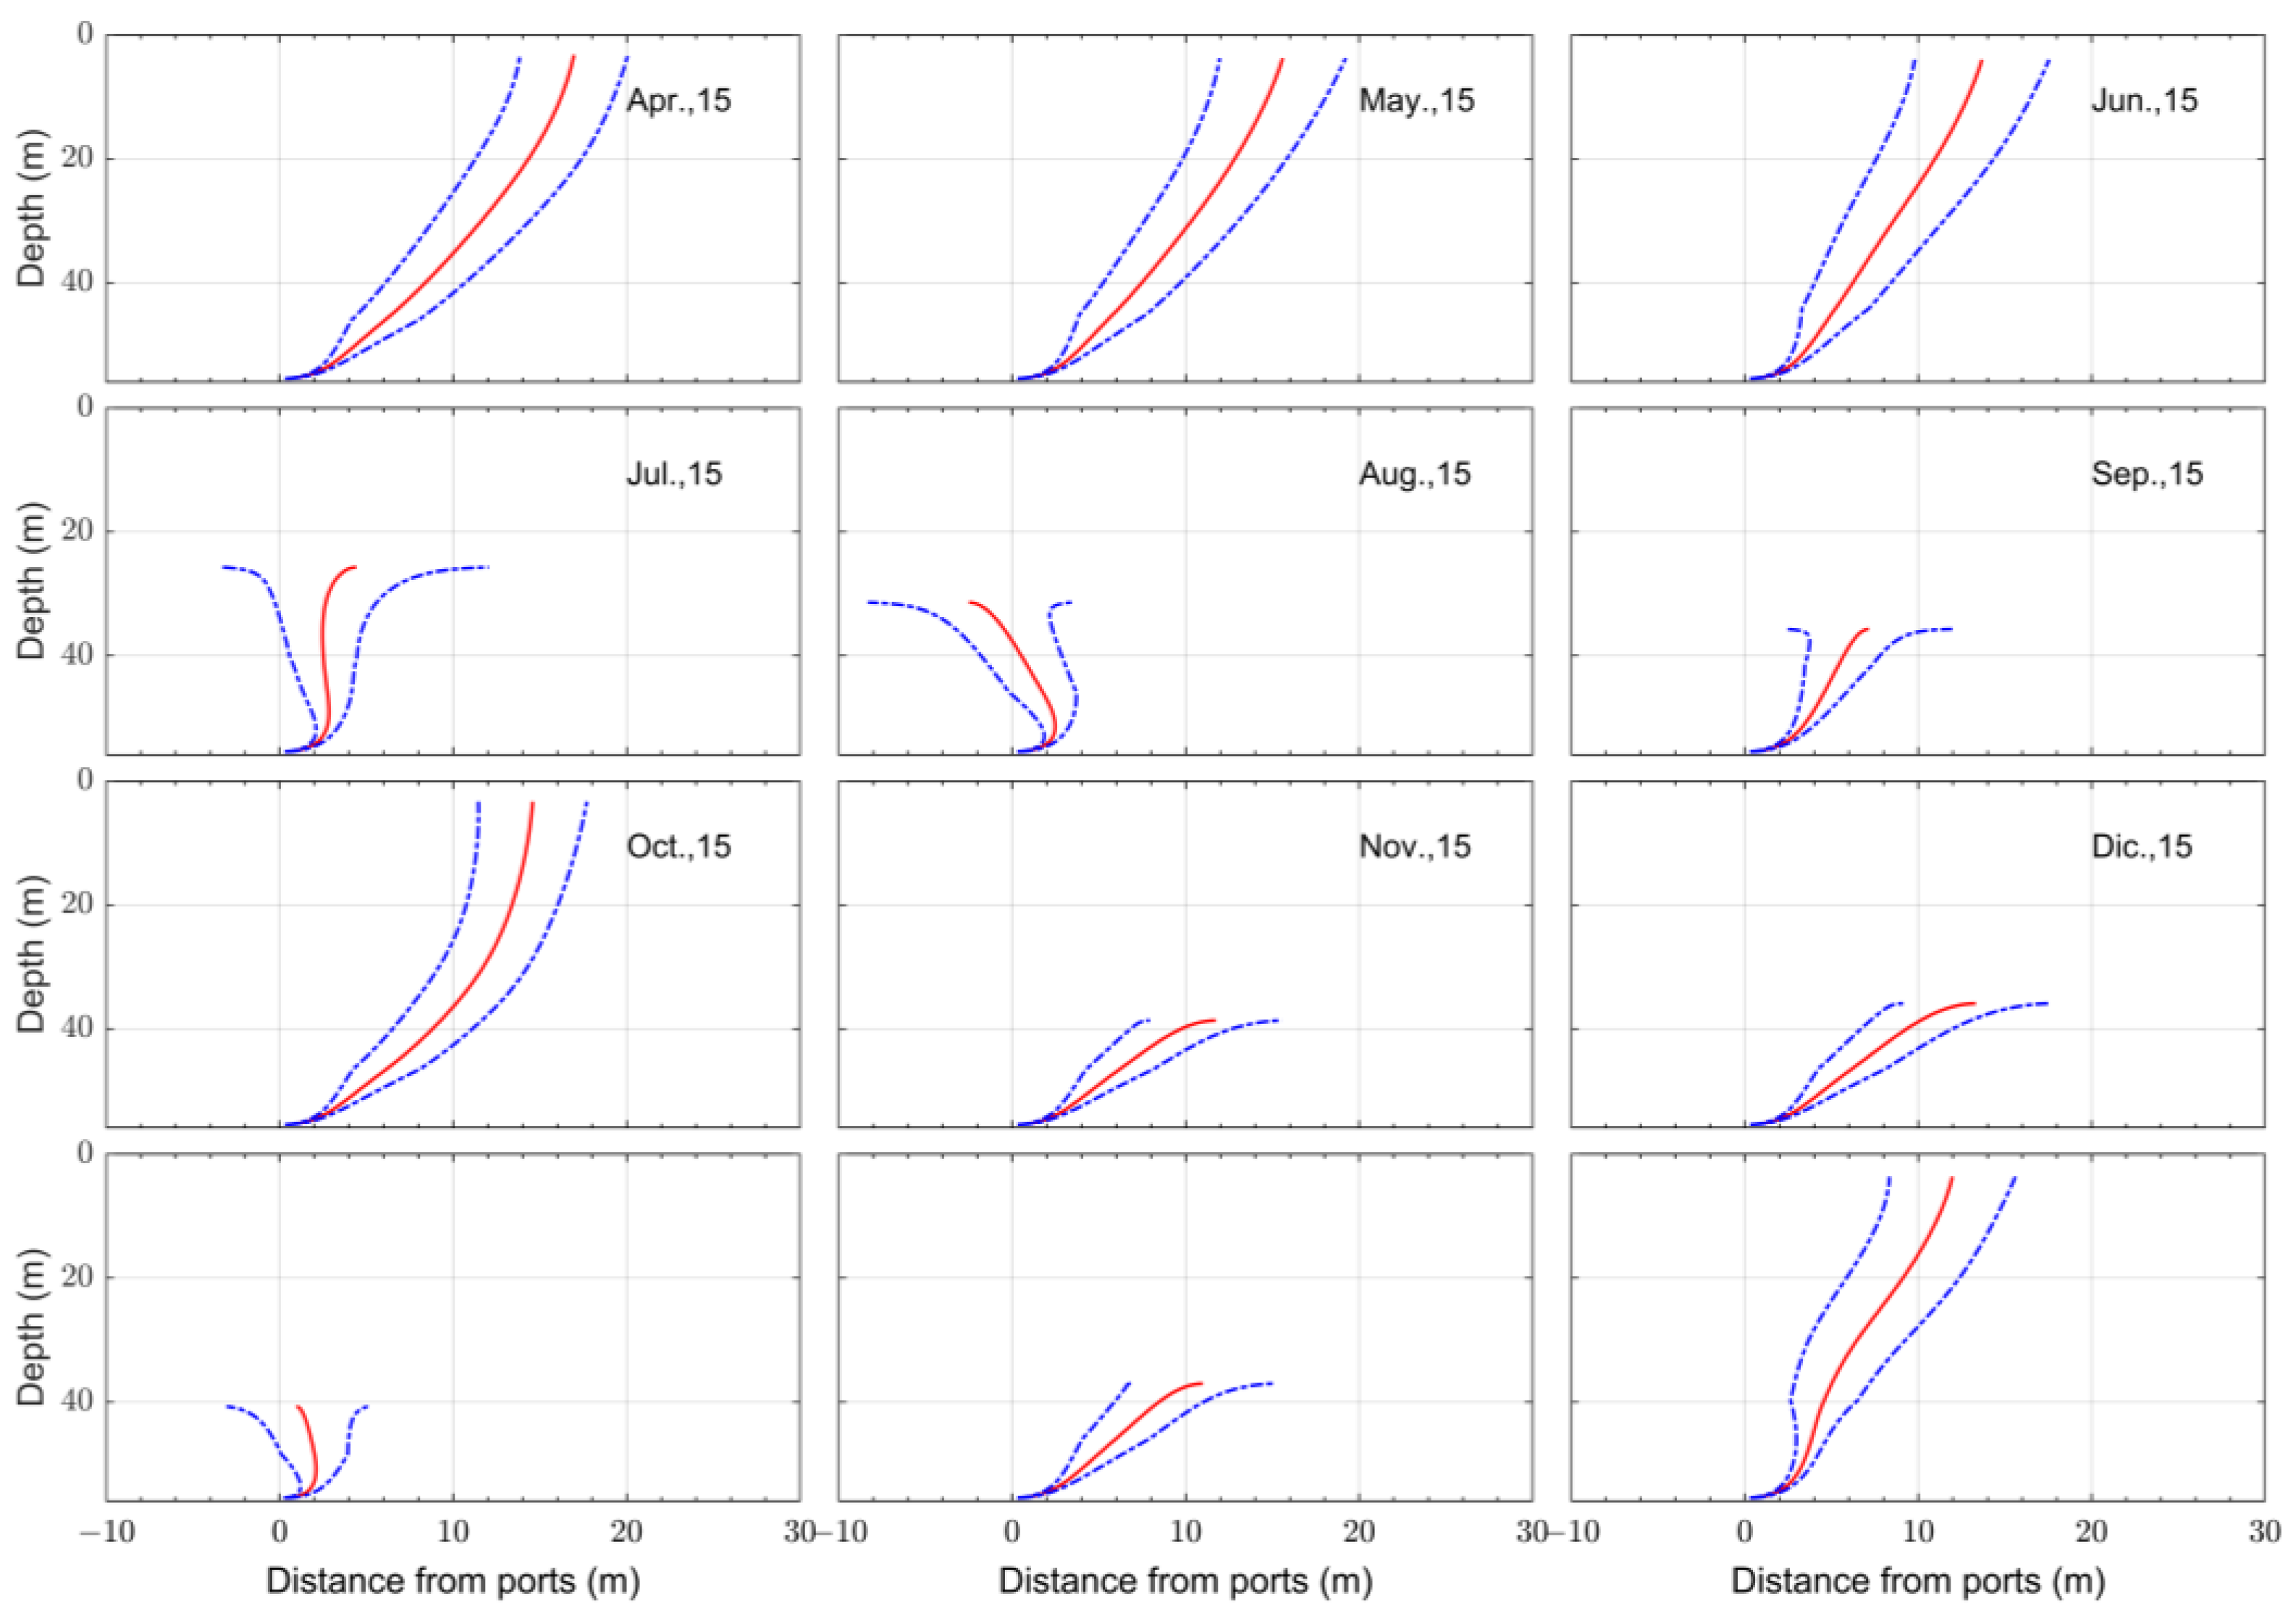
The temperature profiles simulated by the RMA10 model showed a good approximation with the data of the temperature measurements with CDT. A graphic comparison of both profiles, both the simulated and measured ones, are shown in
Figure 3 for each month of the year, which made it possible to determine that the model captures the temperature conditions to an acceptable degree at the point where the diffusers are located. The dashed blue line corresponds to the model result on the exact date and time of the temperature measurement made with the CTD, while the remaining data from the model results are shaded for the corresponding month. The temperature varies between 23 and 28 °C according to the results of the model.
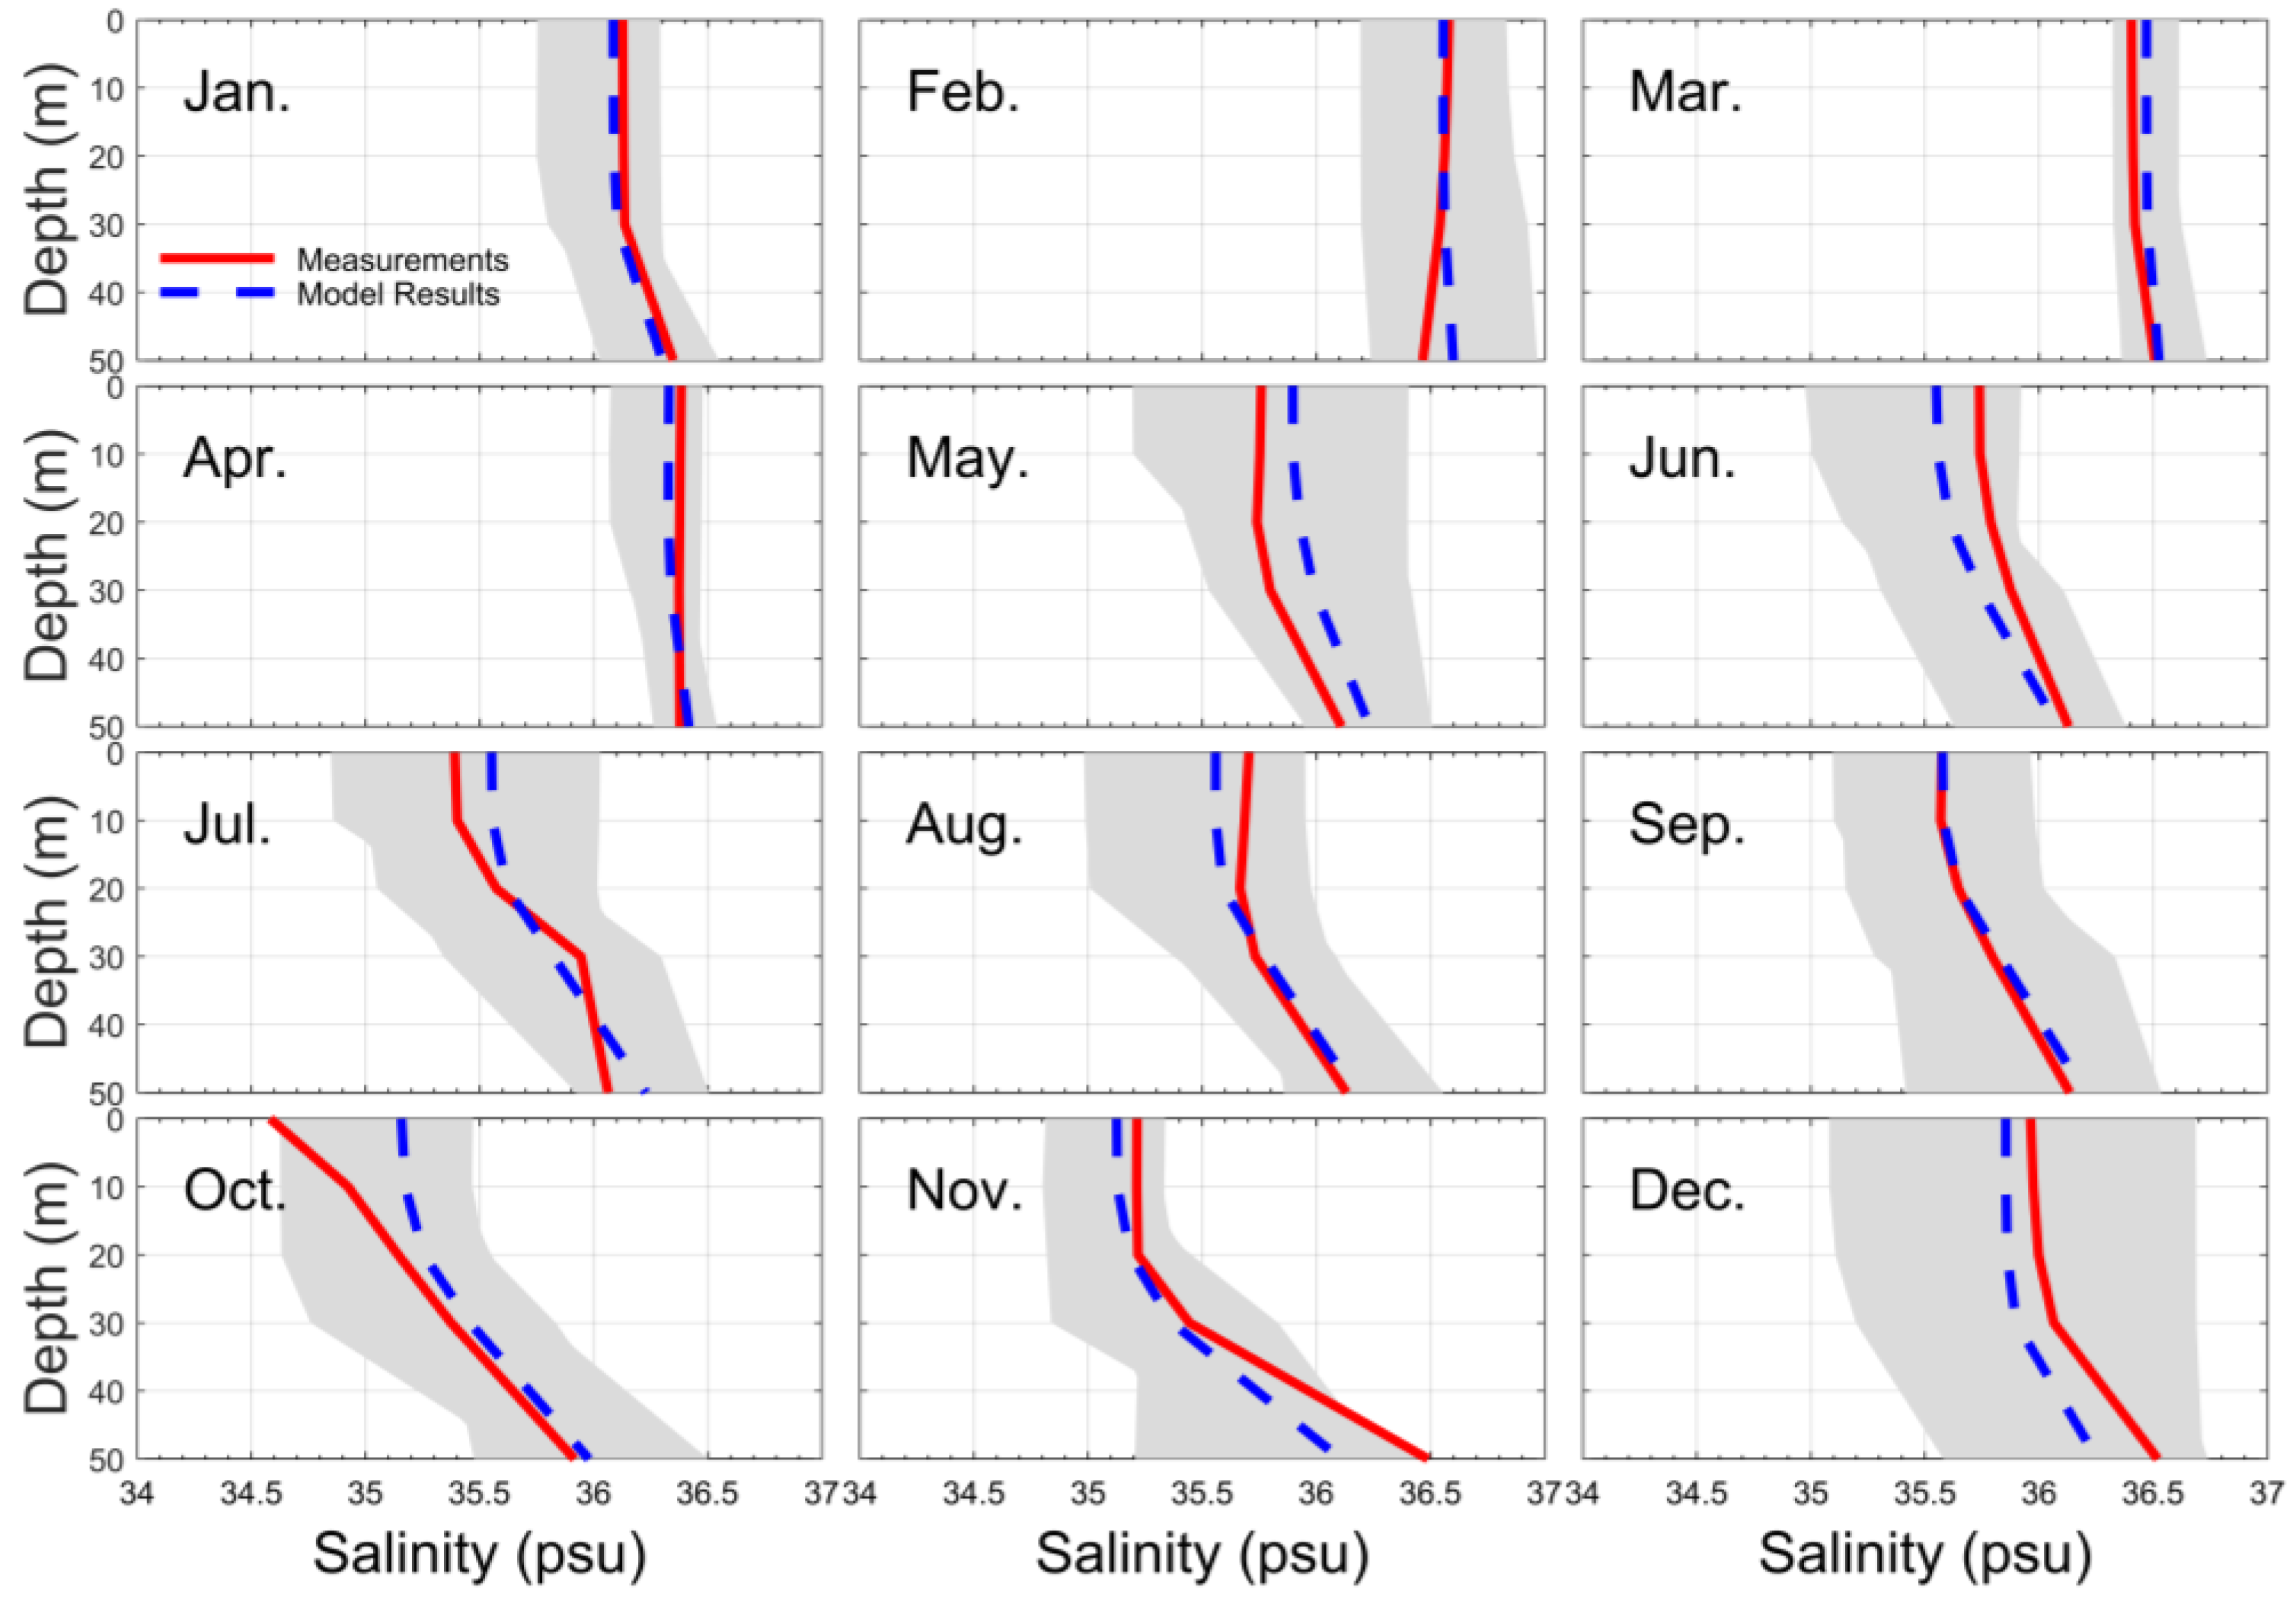
The density values were in the range of 35.07–36.74 UPS according to the RMA10 model results. The comparison between these data and the results of the monthly measurement campaigns shows a good agreement for the profiles in water column (
Figure 4). Consequently, the model results can be used to predict thermohaline conditions in Santa Marta Bay. Correct validation of the model for temperature and salinity is confirmed by NMAE due to values very close to zero found in its application when evaluating the error between the model results and the field measurements.
Table 1 shows the NMAE estimation, comparing the results of the RMA10 model and field measurements.
3.1. Wave Effects on the Initial Dilution of Santa Marta´s Submarine Outfall
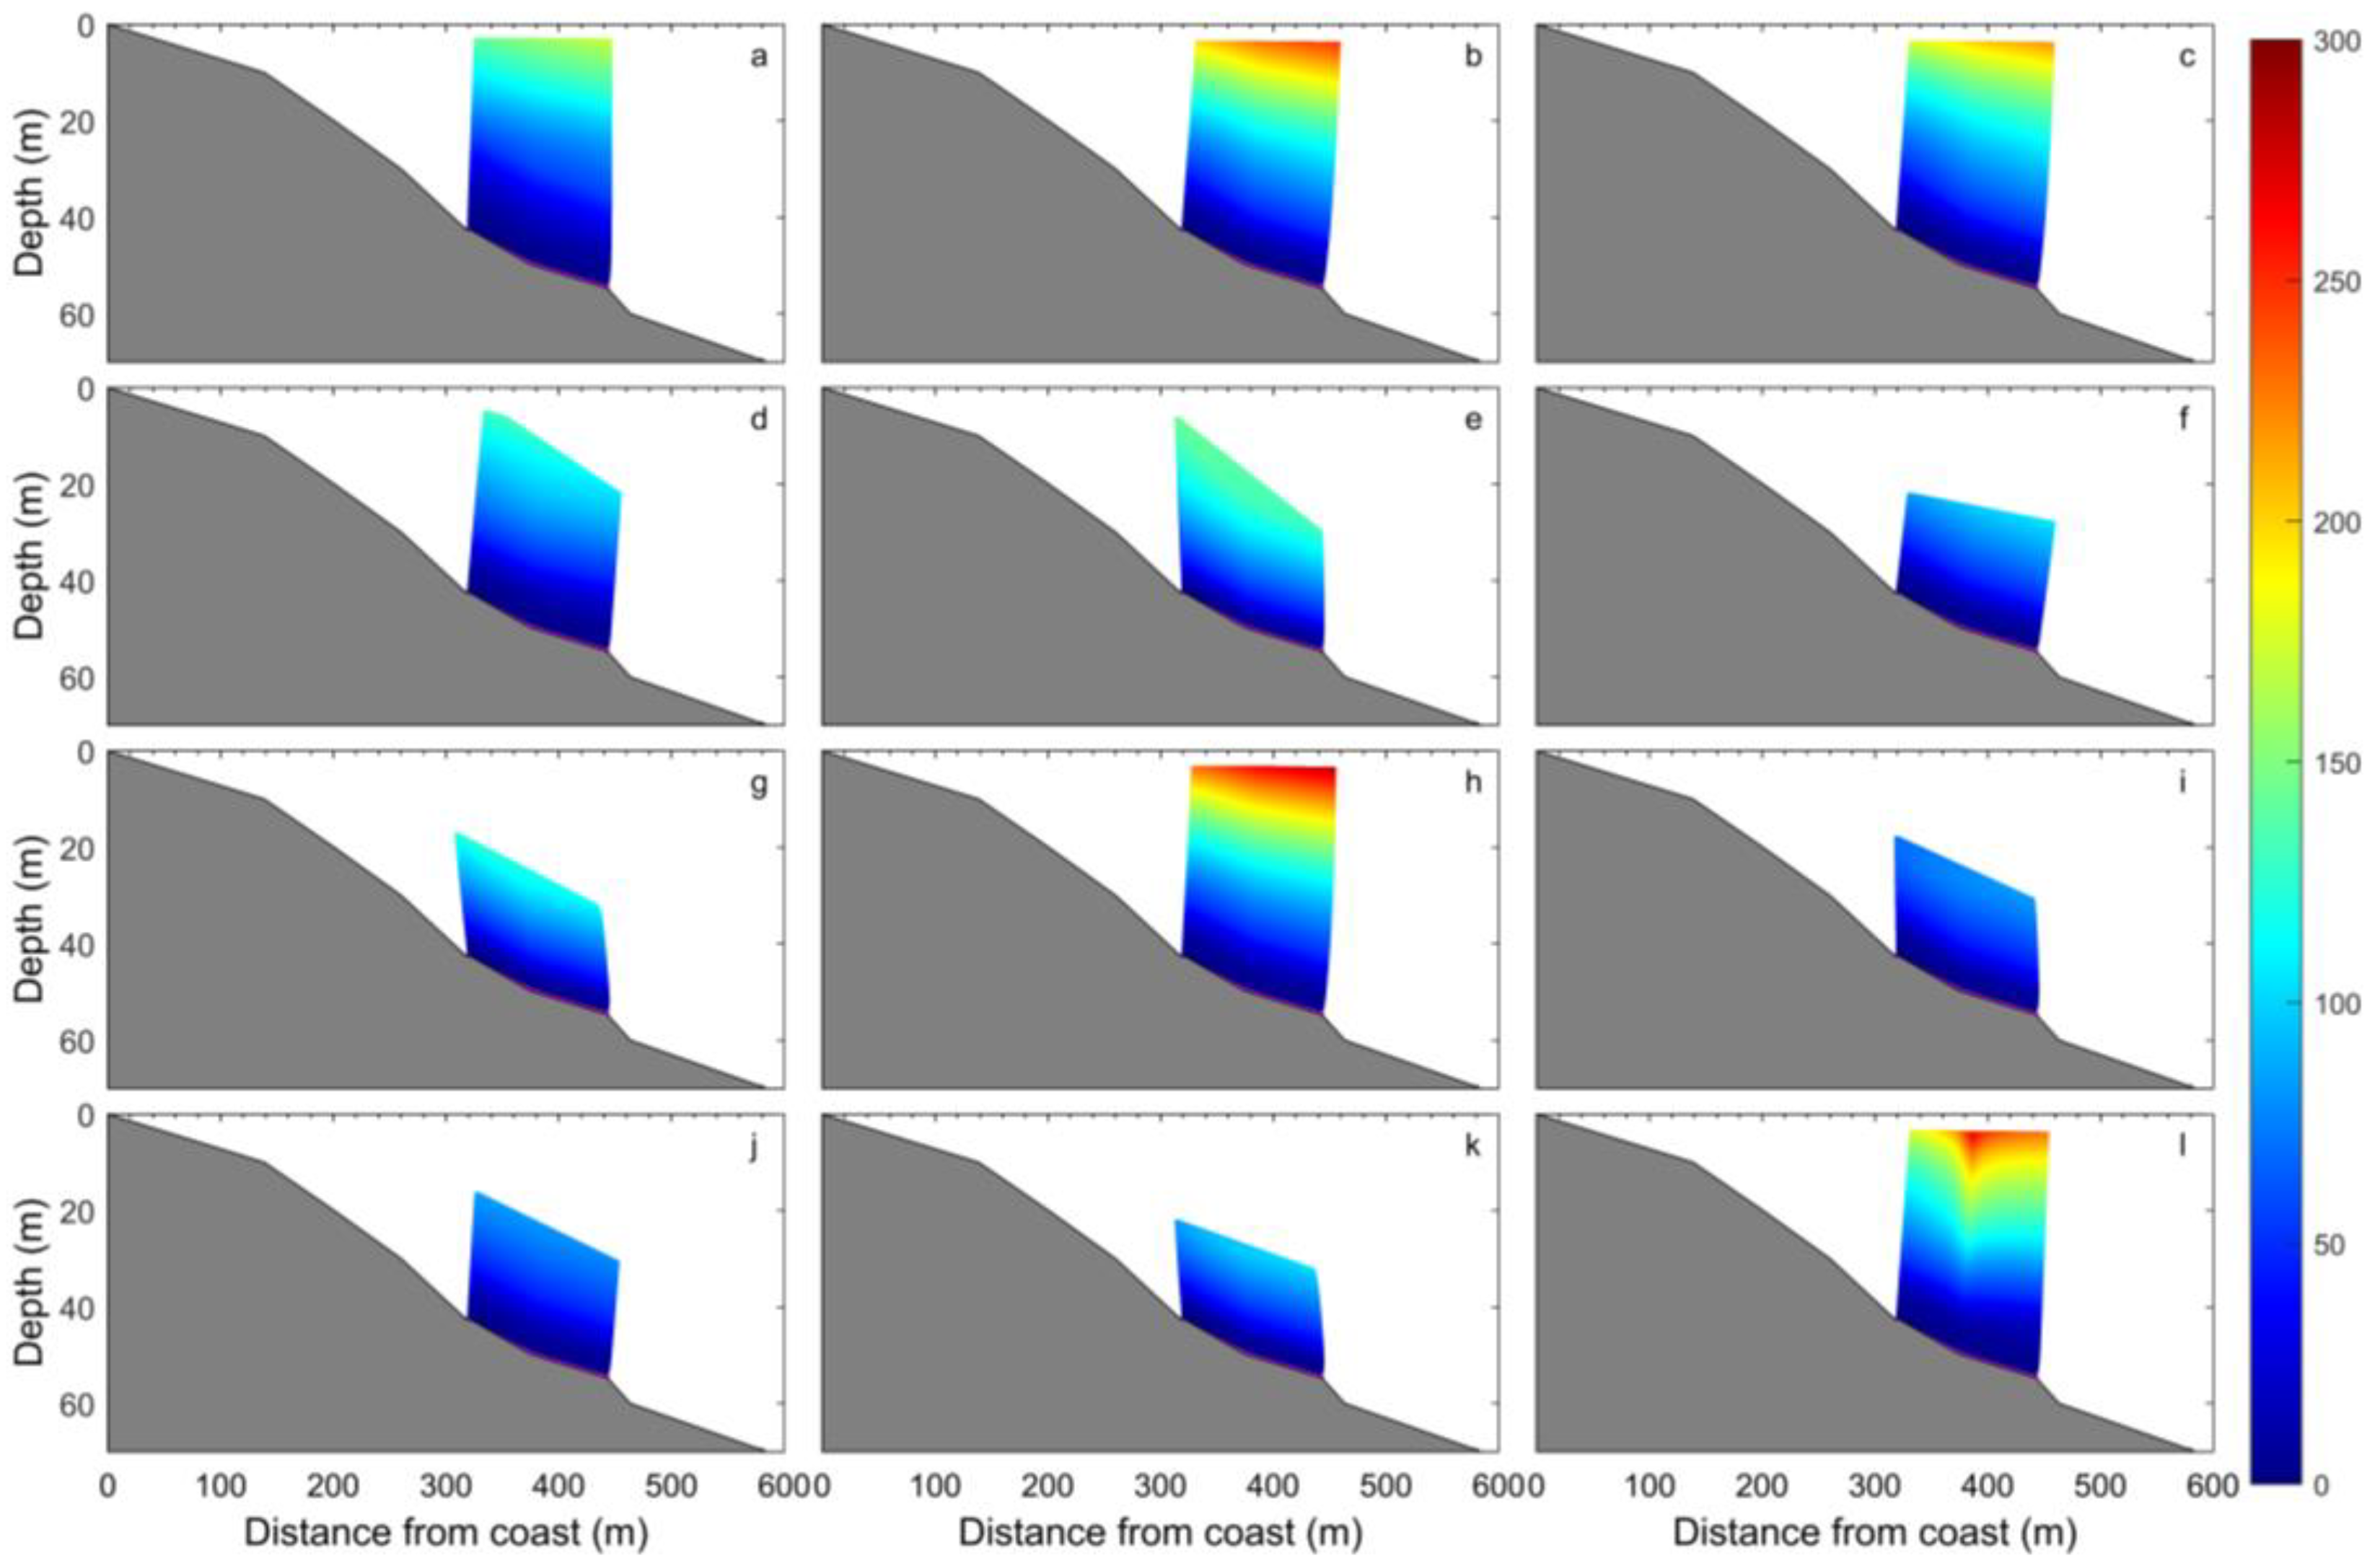
The initial dilution model results (PLUME3·) showed the extension, elevation and dilution as the plume rises from the diffusers of the submarine outfall to surface or trapping depth. The discharge of the last diffuser is shown in
Figure 5, illustrating one day of each month of the year at 12 GMT.
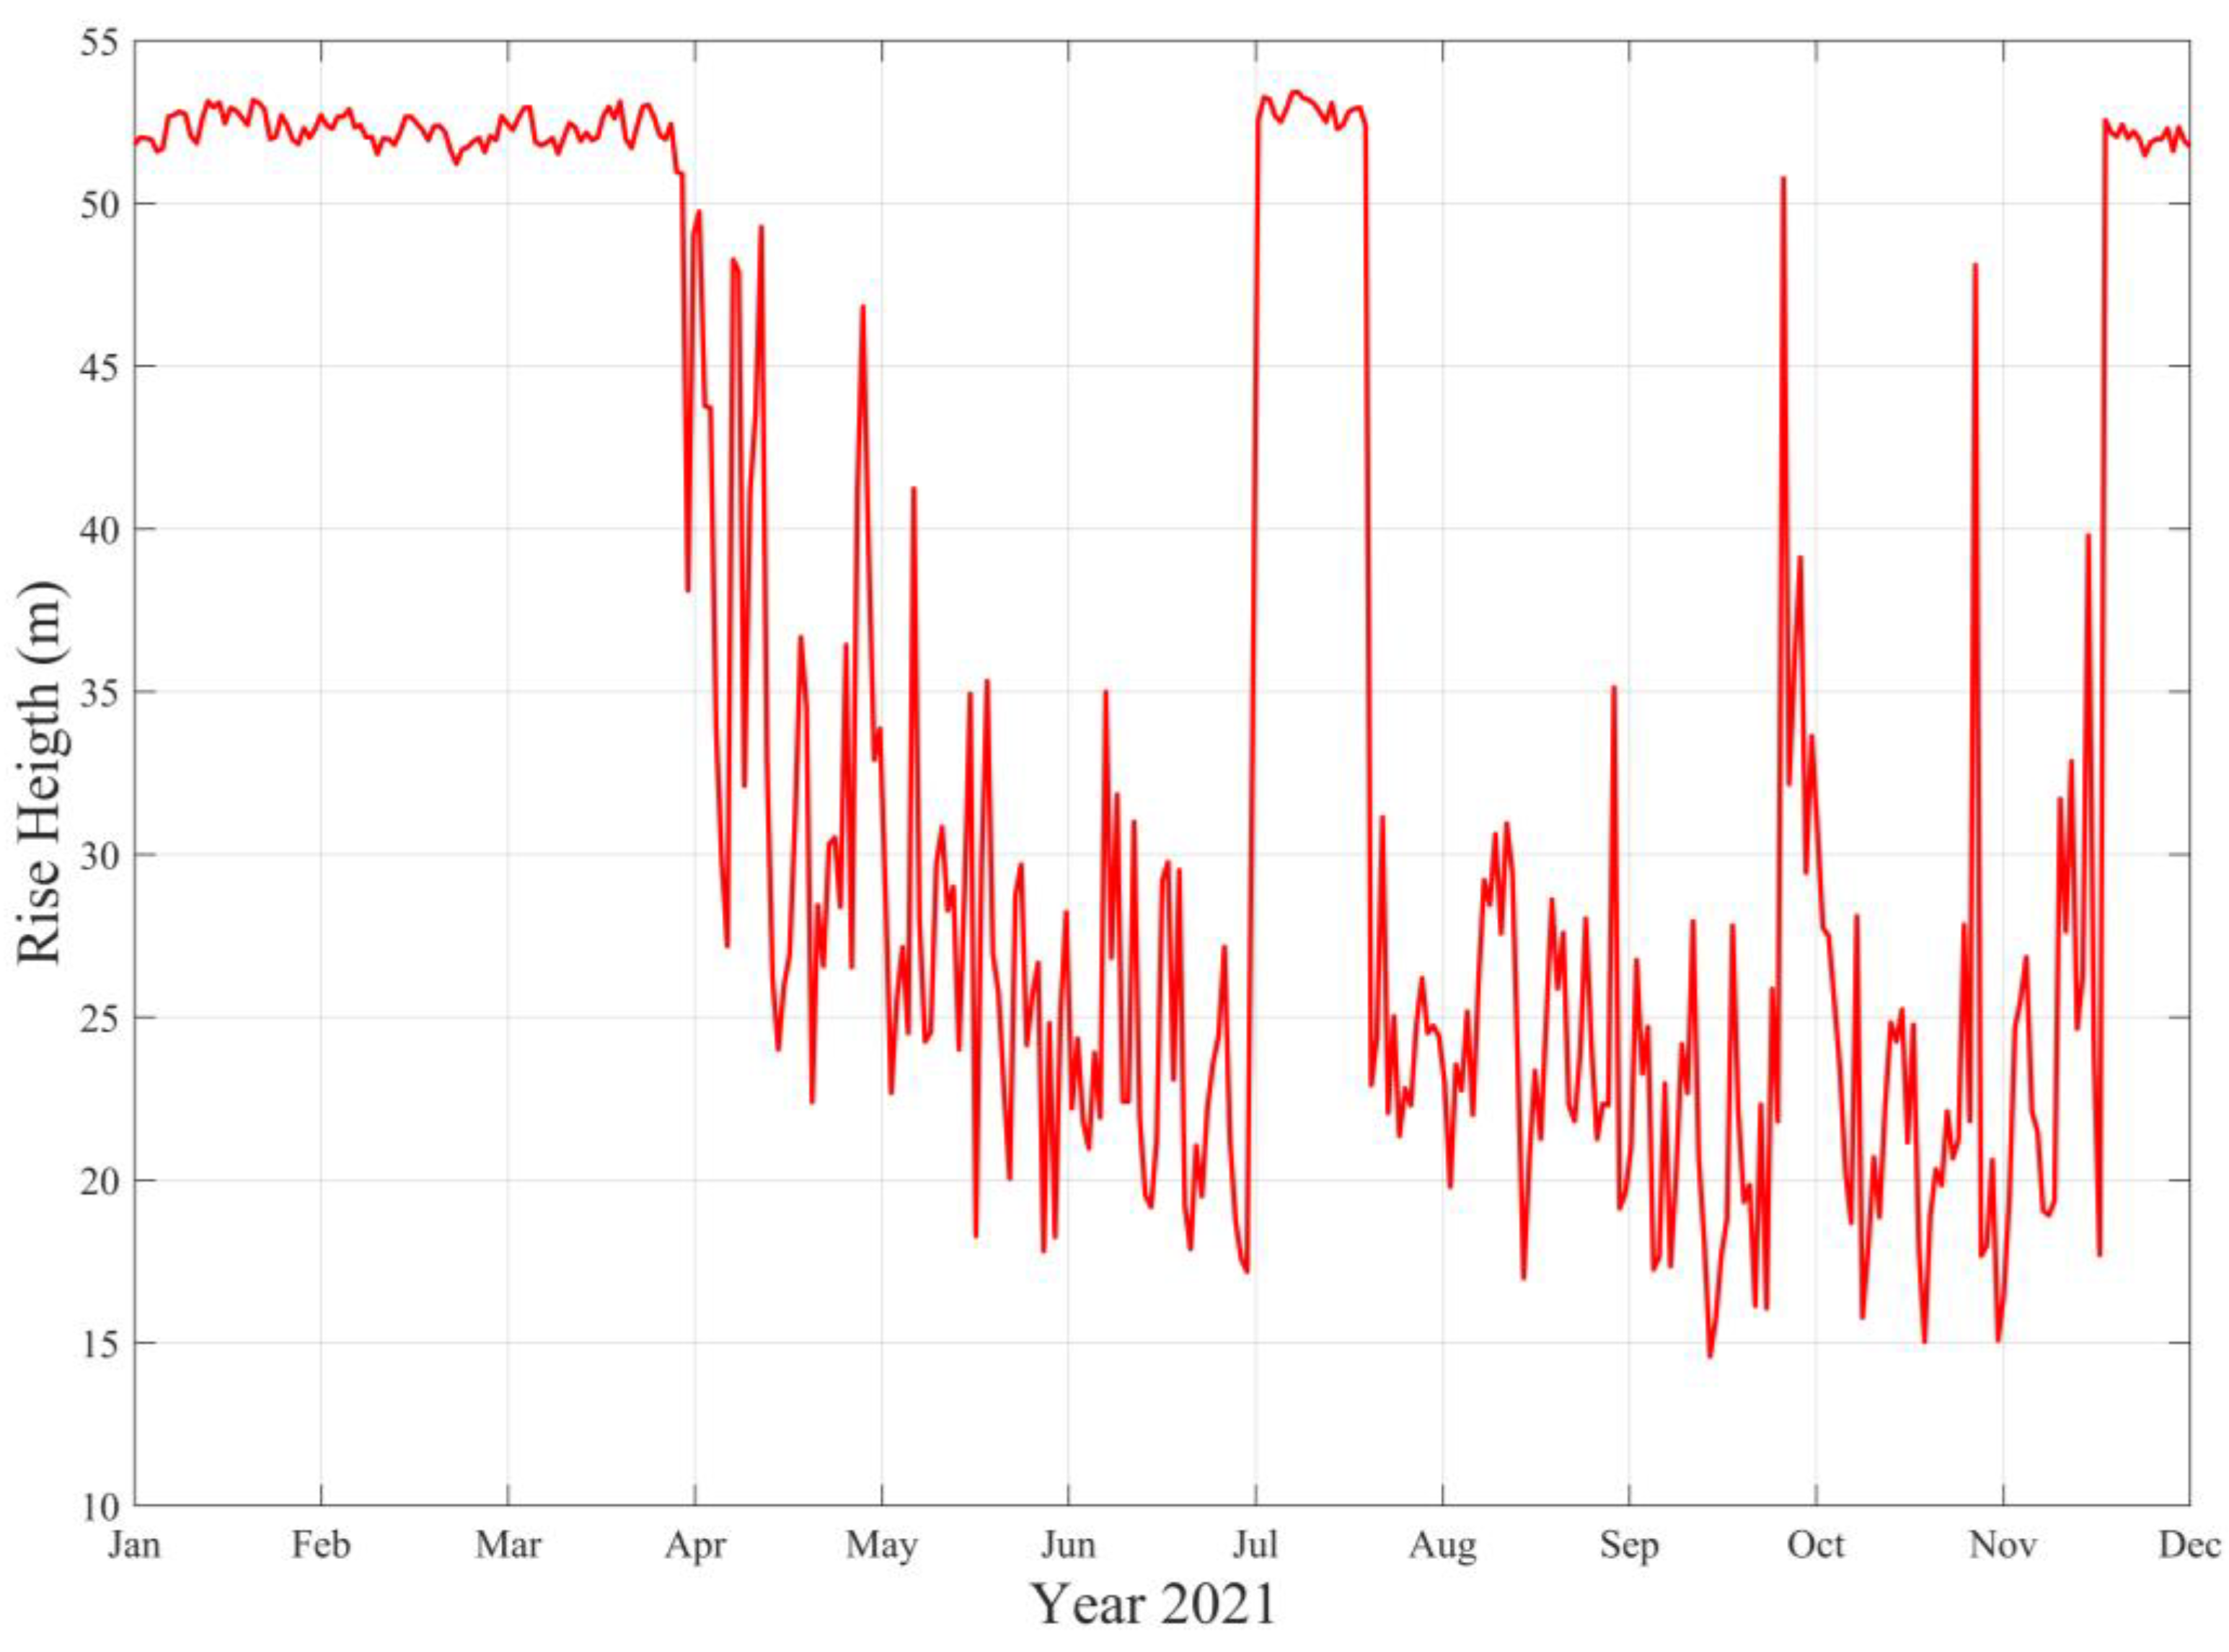
Figure 6 shows the elevation of the plume formed by the 32 diffusers of the submarine outfall, marking the total extension of the near-field, color scale shows the dilution achieved by the plume as ascending trough the seawater. A merge process between the plumes diffusers was considered. Between December and March, as in July, the plumes reached the surface. The remaining months (April–June, August–November), the plume was trapped at the middle depth of the water column. The height reached by plume of the Santa Marta´s submarine outfall for each day of the year is shown in
Figure 7.
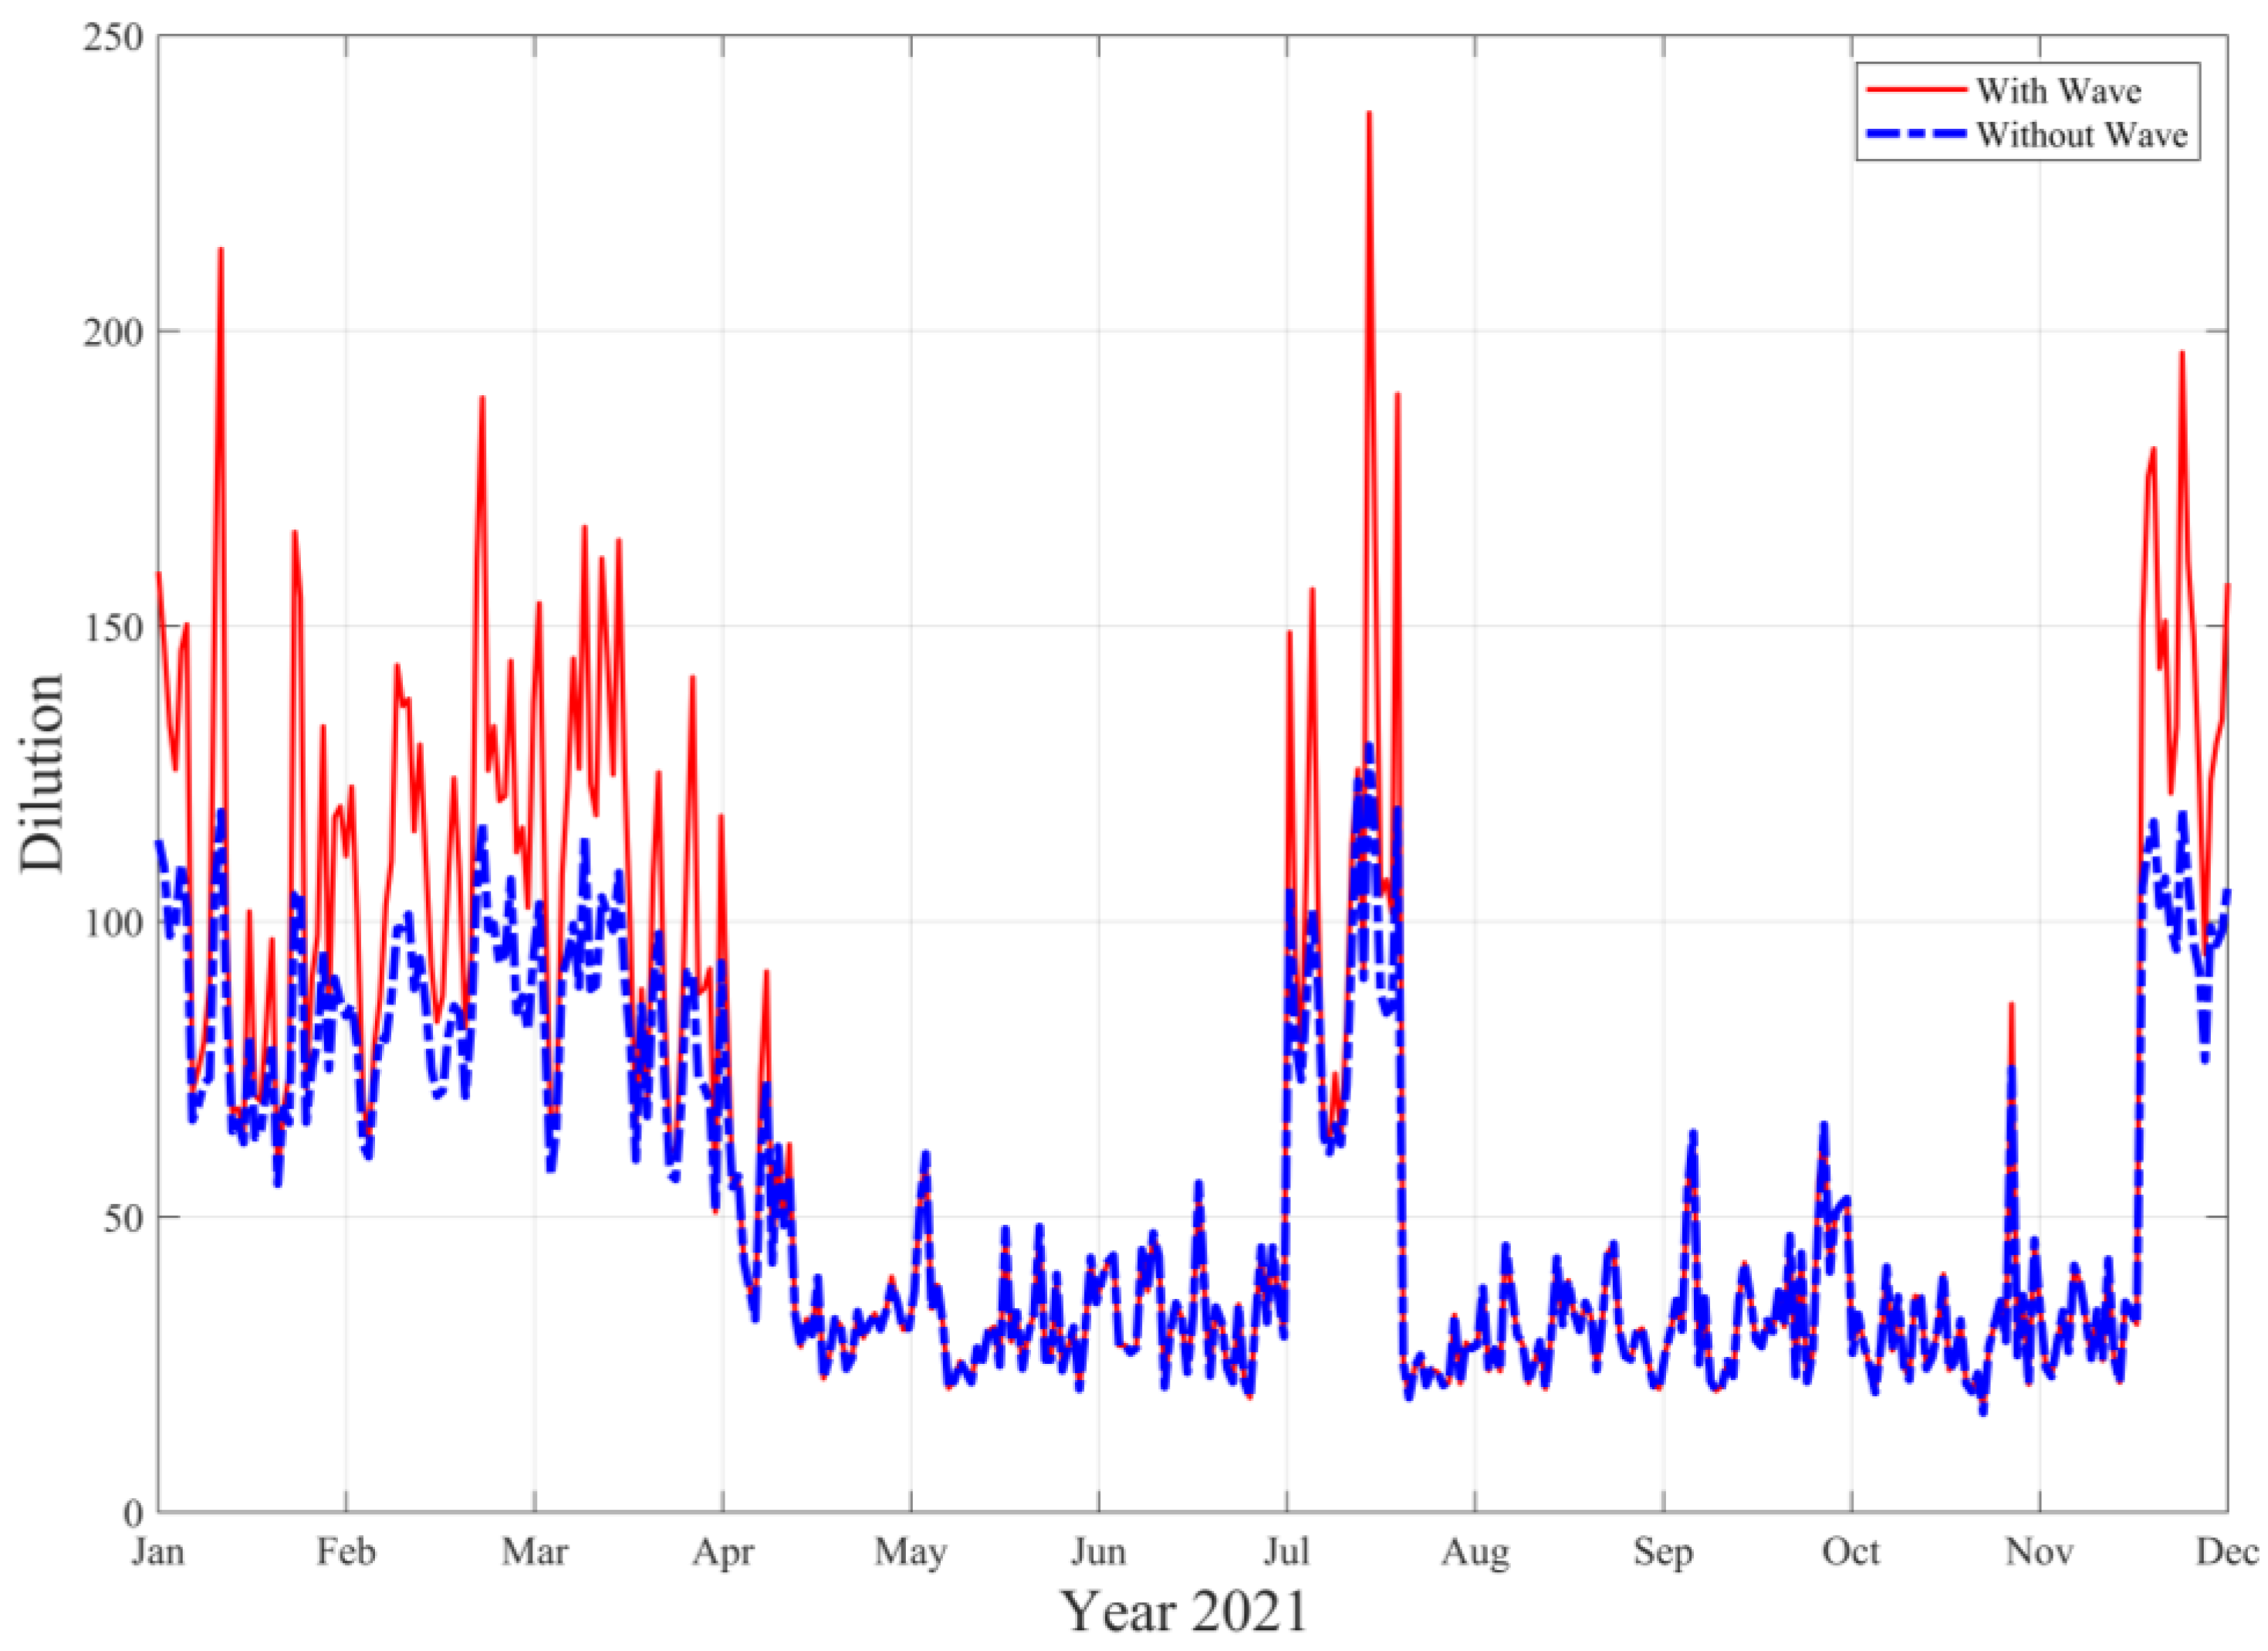
The initial dilution achieved in the near-field of Santa Marta´s submarine outfall reached values of 130. When the plume remained trapped at the middle depth of the water column, the lowest values were obtained, while when it reached the surface, the maximum values were reached. The effects of surface waves on the dilution of the wastewater discharge from Santa Marta´s submarine outfall are shown in
Figure 8. The waves increased the initial near-field dilution of the Santa Marta´s submarine outfall when the plume of the wastewater reached the surface (December–March, June) with the
factor reaching 1.9. The dilution achieved by the initial moment of discharge of wastewater through the diffusers of the submarine outfall increased by 90%.
4. Discussion
In this study, the effects of waves on the dilution of the plume were included, according to Tate [
23] and Niu [
24]. To simulate the behavior of the initial dilution in the discharge of Santa Marta´s submarine outfall, the near-field model PLUME3 coupled with the RMA10 3D hydrodynamic model was used. The RMA10 model provided the temperature, salinity, and velocity conditions to allow the near-field model to predict the extent, elevation, trajectory, and shape of the buoyant plume generated by the discharge from the submarine outfall diffusers. Temperature and salinity profiles are important to quantify the density stratification in the water column, which affects the plume submergence depth [
46]. The density of the water column was calculated using the salinity and temperature data. These parameters were supplied from the results of the RMA10 hydrodynamic model runs. The calibration of the RMA10 3D hydrodynamic model was previously reported by García et al. [40-42], for which they were considered calibrated to simulate the hydrodynamic conditions in the bay of Santa Marta.
An additional validation process was developed to determine the reliability of the model results over long periods of time. Field measurements with CTD to obtain the temperature and salinity profiles were developed, with 12 campaigns, one for each month of the year in 2021, at the point where the discharge of the submarine outfall is located. The results of the model presented a good approximation of the conditions measured in the field, so the model was considered validated and sufficiently reliable to simulate the thermohaline conditions of the bay of Santa Marta.
The coastal zone of Santa Marta presents the upwelling phenomenon in two periods of the year, a major from December to March and minor from July. The results of the RMA10 model clearly show the presence of these conditions, with distinguishable changes in the temperature and salinity profiles in the water column.
The periods of major and minor upwelling simulated by the RMA10 model coincides perfectly with reports of previous studies in the area [
34,
35]. The test statistic to determine the magnitude of the error in the comparison of the results of the model and the field measurements confirmed the validation of the model by obtaining low values in the application of this parameter (NMAE <0.04). This is based on a sparse data scenario, as only one CDT profile per month was available. In the future, it is necessary to improve the availability of temperature and salinity data to increase the reliability of the hydrodynamic model.
The effects of waves on dilution have been reported by several authors; however, there are very few reports of effects on plume elevation [
24]. For Santa Marta´s submarine outfall, these effects are important when the plume has already reached the surface. No effect on plume elevation was found: When the plume reaches neutral buoyancy levels at medium depths of the water column, the waves do not have a significant effect, on either the dilution, or the rise of the same, generated by the turbulence of the external waves.
The total dilution achieved by the discharge from a submarine outfall is the sum of the near-field, far-field, and the transition zone. The incorporation of the effects of the waves on the dilution in the near-field contributes to improving the determination of the total dilution in the dilution zone of submarine outfalls.
5. Conclusions
The initial dilution of the discharge of submarine outfall has been widely used to measure the assimilation of wastewater disposal in marine environments; by definition, this is the dimensionless relationship between the concentration of the effluent and the seawater at the time of discharge and occurs due to the entrains of seawater into the buoyant plume of wastewater discharge and reducing its density. In this study, the dilution levels achieved in the near field of Santa Marta´s submarine outfall were determined—that is, discharge that occurs through a 1 m diameter pipe, with a length of 442 m and located at 56 meters at its deepest point, where the residual water is disposed of in the marine environment by a system of 32 diffusers of 8 inches in diameter each.
During the period between December and March (year 2021), coinciding with the dry period, with the arrival of trade winds, and the occurrence of major upwelling, maximum dilutions of 1:130 were obtained when the plume appeared on the surface in near-field. The marine water then reached the lowest temperature of the year with uniform density profiles and minimum variation between the bottom and surface. No stratification episodes occurred. The factor was up to 1.90 for the center of the plume on the water column. The plume also reached the surface in a shorter period of time in July, when dilutions up to 1:260 were reached.
The effects of surface waves during other periods of time of the year were not significant; the factor, which quantifies this effect, ranged between 1.08 and 1.0. The minimum dilution is 1:22; this value was obtained when the plume just reached 18 meters caused by the stratification seen during the rainy periods (April-July and August-December). These periods coincide with water column temperatures reaching 30 °C, low magnitude winds, and waves that do not reach a height of 30 cm.
Author Contributions
Conceptualization, F.G.; methodology, F.G. G.H. and G.C.; software, F.G. G.H. and G.C.; validation, F.G. G.H. and G.C.; formal analysis, F.G. G.H. and G.C.; writing—original draft preparation, F.G. G.H. and G.C.; writing—review and editing, F.G. G.H. and G.C. All authors read and agreed to the published version of the manuscript.
Funding
This research received no external funding, and the APC was funded by G.F., C.G. and H.G.
Acknowledgments
The authors are grateful to Peter M. Tate, who provided the source code in Fortran of the PLUME3 model.
Conflicts of Interest
The authors declare no conflict of interest.
References
- Birocchi, P.; Dottori, M.; de Godoi, R.C.; Bairão, L.J. Study of three domestic sewage submarine outfall plumes through the use of numerical modeling in the São Sebastião channel, São Paulo state, Brazil. Reg. Stud. Mar. Sci. 2021, 44, 1–11. [Google Scholar] [CrossRef]
- Lamparelli, C.C.; Moura, D.O.; Pinto, K.C.; Camolez, A.C. Monitoring sea outfall discharges in São Paulo Coast - Brazil. International Symposium on Outfall Systems. IAHR-IWA Joint Committee on Marine Outfall Systems, Ottawa, Canada, 10 May.
- Lapointe, B.; Thacker, K.; Hanson, C.; Getten, L. Sewage pollution in Negril, Jamaica: effects on nutrition and ecology of coral reef macroalgae. Chin. J. Oceanol. Limnol. 2011, 29, 775–789. [Google Scholar] [CrossRef]
- Despland, L.M.; Vancov, T.; Aragno, M.; Clark, M.W. Diversity of microbial communities in an attached-growth system using Bauxsol™ pellets for wastewater treatment. Sci. Total Environ. 2012, 433, 383–389. [Google Scholar] [CrossRef] [PubMed]
- Wang, Z.H.; Yang, J.Q.; Zhang, D.J.; Zhou, J.; Zhang, C.D.; Su, X.R.; Li, T.W. Composition and structure of microbial communities associated with different domestic sewage outfalls. Genet. Mol. Res. 2012, 13, 7542–7552. [Google Scholar] [CrossRef] [PubMed]
- Roth, F.; Lessa, G.; Wild, C.; Kikuchi, R.; Naumann, M. Impacts of a high-discharge submarine sewage outfall on water quality in the coastal zone of Salvador (Bahia, Brazil). Mar. Pollut. Bulletin. 2016, 106, 43–48. [Google Scholar] [CrossRef] [PubMed]
- Inan, A. Modeling of Hydrodynamics and Dilution in Coastal Waters. Water 2019, 11, 83. [Google Scholar] [CrossRef]
- Fischer, H.B.; List, E.J.; Koh, R.C.Y.; Imberger, J.; Brooks, N.H. Mixing in inland and coastal waters. Academic Press, New York, 1979.
- Garcia, F.; Palacio, C.; Chang, G. Simulation of near field dilution of the submarine outfall of Santa Marta (Colombia). Dyna, 2013, 182, 138–146. [Google Scholar]
- Roberts, P.J.; Salas, H.J.; Reiff, F.M.; Libhaber, M.; Labbe, A.; Thomson, J.C. Marine wastewater outfalls and treatment systems., 2nd ed.; IWA Publishing: London, UK, 2011; pp. 51–134. [Google Scholar]
- Anghan, C.; Bade, M.; Banerjee, J. A review on fundamental properties of the jet in the wave environment. Ocean Engineering, 2022, 250, 2–23. [Google Scholar] [CrossRef]
- Otoo, E.; Chen, Y.; Xu, Z.; Chen, Y. Dilution characteristics of dual buoyant jets in wavy cross-flow environment. Water Sci. Eng. in press. 1016. [Google Scholar]
- Roberts, P.J.W. Ocean outfall dilution: effects of currents. Journal of the Hydraulics Division. ASCE 1980, 106, 769–782. [Google Scholar]
- Roberts, P.J.W. Modeling Mamala Bay outfall plumes. I: Near field. J. Hydraul. Eng. 1999, 125, 564–573. [Google Scholar] [CrossRef]
- Jirka, G.H.; Doneker, R.L.; Barnwell, T.O. CORMIX: An expert system for mixing-zone analysis. Waterence Technol. 1991, 24, 267–274. [Google Scholar] [CrossRef]
- Fan, L. Turbulent Buoyant Jets into Stratified or Flowing Ambient Fluids. California Institute of Technology: Pasadena, 1967. https://authors.library.caltech.edu/25955/1/KH-R-15.pdf. (accessed on 21 October 2022).
- Xu, Z.; Chen, Y.; Jiang, D. Experimental study on a buoyant jet in wavy crossflow. In Proceedings of the 28th International Ocean and Polar Engineering Conference, ISOPE, Sapporo, Japan, 10 June 2018. [Google Scholar]
- Xu, Z.; Otoo, E.; Chen, Y.P.; Ding, H.W. 2D PIV measurement of twin buoyant jets in wavy cross-flow environment. Water, 2019, 11, 399. [Google Scholar] [CrossRef]
- Chin, D.A. Influence of surface waves on outfall dilution. J. Hydraul. Eng. 1987, 113, 1006e1018. [Google Scholar] [CrossRef]
- Watanabe, R.; Gono, T.; Yamagata, T.; Fujisawa, N. Three-dimensional flow structure in highly buoyant jet by scanning stereo PIV combined with POD analysis. Int. J. Heat Fluid Flow 2015, 52, 98–110. [Google Scholar] [CrossRef]
- Lu, J.; Wang, L.L.; Tang, H.W.; Dai, H.C. Large eddy simulation of vertical turbulent jets under JONSWAP waves. Acta Mech. Sinica 2011, 27, 189–199. [Google Scholar]
- Fang, S.; Chen, Y.; Xu, Z.; Otoo, E.; Lu, S. An Improved Integral Model for a Non-Buoyant Turbulent Jet in Wave Environment. Water 2019, 11, 765. [Google Scholar] [CrossRef]
- Tate, P.M. The Rise and Dilution of Buoyant Jets and Their Behaviour in an Internal Wave Field. PhD thesis. University of New South Wales, Faculty of Science, School of Mathematics. June, 20 June.
- Niu, H. Dispersion of offshore discharged produced water in the marine environment: hydrodynamic modeling and experimental study. PhD thesis, University of Newfoundland, 2008.
- Hwung, H.; Chyan, J.; Chang, C.; Chen, Y. The dilution processes of alternative horizontal buoyant jets in wave motions. Coast. Eng. Proceedings. 1994, 24, 3045–3059. [Google Scholar]
- Xu, C.; Chen, Y.; Wang, Y. ; Zhang. Near-field dilution of a turbulent jet discharged into coastal waters: Effect of regular waves. Ocean Eng. 2017, 140, 29–42. [Google Scholar]
- Shuto, N.; Ti, L.H. Wave effects on buoyant plumes. Proceedings of 14th Conference in Coastal Engineering, 2199–2209., ASCE 1974. [Google Scholar]
- Chen, Y.P.; Li, C.; Zhang, C. Numerical Modeling of a Round Jet Discharged into Random Waves. Ocean Eng. 2008, 35, 77–89. [Google Scholar] [CrossRef]
- Chin, D.A. Model of buoyant-jet-surface-wave interaction. J. Waterw. Port Coast. Ocean Eng. 1988, 114, 331–345. [Google Scholar] [CrossRef]
- Tam, B.-F.; Li, C.W. Flow induced by a turbulent jet under random waves. J. Hydraul. 2008, 46, 820–829. [Google Scholar] [CrossRef]
- Huang, R.R.; Yang, W.C.; Chiang, T.P. Effects of Surface Waves on a Buoyant Jet. J. Mar. Environnmental Eng. 1996, 3, 63–84. [Google Scholar]
- Chyan, J.M.; Hwung, H.H.; Chang, C.Y.; Chen, I.P. Effects of Discharge Angles on Dilution of Buoyant Jet in Wave Motions. 2002; v2. [Google Scholar]
- Andrade, C.A.; Barton, E.D. The guajira upwelling system. Cont. Shelf Res. 2005, 25, 1003–1022. [Google Scholar] [CrossRef]
- Arroyave, D.M.; Bartoli, M.; Bresciani, M.; Luciani, G.; Toro, M. Biogeochemical modelling of a tropical coastal area undergoing seasonal upwelling and impacted by untreated submarine outfall. Mar Pollut Bull. 2021, 172, 1–20. [Google Scholar] [CrossRef] [PubMed]
- Lozano, Y.; Medellín, J.; Navas, G. Contexto climatológico y oceanográfico del mar caribe Colombiano. Biodiversidad del margen continental del Caribe colombiano. Serie de Publicaciones Especiales, Instituto de Investigaciones Marinas y Costeras José Benito Vives de Andréis -INVEMAR: Santa Marta, Colombia, 2010; p. 4588. [Google Scholar]
- Tate, P.M.; Holden, C.J.; Tate, D.J. Influence of plume advection and particle settling on wastewater dispersion and distribution, Marine Pollution Bulletin 2019, 145, 678–690.
- Tate, P.M.; Middleton, J.H. Unification of non-dimensional solutions to asymptotic equations for plumes of different shape. Bound.-Layer Meteorol. 2000, 94, 225–251. [Google Scholar] [CrossRef]
- Tate, P.M.; Middleton, J.H. Buoyant jets of elliptical shape: an approximation for duckbill valves. J. Hydraul. Eng. 2004, 130, 432–440. [Google Scholar] [CrossRef]
- Fossati, M.; Piedra, I. Numerical modelling of residual flow and salinity in the Rio de la Plata. Appl. Math. Model. 2008, 32, 1066–1086. [Google Scholar] [CrossRef]
- Garcia, F.F.; Palacio, C.; Garcia, U. Uso de un modelo regional para el mar Caribe para obtener condiciones fronteras abiertas en un modelo local para la bahía de Santa Marta – Colombia. Boletín Científico CIOH 2008, 26, 33–46. [Google Scholar] [CrossRef]
- Garcia, F.F.; Palacio, C.y.; Garcia, U. Simulation of hydrodynamic conditions at Santa Marta coastal area (Colombia). Dyna 2012, 174, 119–126. [Google Scholar]
- Garcia, F.F.; Palacio, C.; Garcia, U. Calibración y validación de un modelo 3D para el área costera de Santa Marta (Colombia). Rev. Fac. Ing. Univ. Antioq. 2012, 62, 177–188. [Google Scholar]
- Alewell, C.; Manderscheid, B. Use of objective criteria for the assessment of biogeochemical ecosystem models. Ecol. Model 1998, 107, 213–224. [Google Scholar]
- U.S. ARMY CORPS OF ENGINEERS. Shore Protection Manual, Vol. I., 4th Edition. 1984. Available online: http://ft-sipil.unila.ac.id/dbooks/S%20P%20M%201984%20volume%201-1.pdf.
- Simionato, C.; Meccia, V.; Dragani, W.; Nuñez, M. On the use of the NCEP/NCAR surface winds for modeling barotropic circulation in the Río de la Plata. Estuar. Coast. Shelf Sci. 2006, 70, 195–206. [Google Scholar] [CrossRef]
- Muhammetoglu, A.; Yalcin, O.B.; Ozcan, T. Prediction of wastewater dilution and indicator bacteria concentrations for marine outfall systems. Mar. Environ. Res. 2012, 78, 53–63. [Google Scholar] [CrossRef]
|
Disclaimer/Publisher’s Note: The statements, opinions and data contained in all publications are solely those of the individual author(s) and contributor(s) and not of MDPI and/or the editor(s). MDPI and/or the editor(s) disclaim responsibility for any injury to people or property resulting from any ideas, methods, instructions or products referred to in the content. |
© 2024 by the authors. Licensee MDPI, Basel, Switzerland. This article is an open access article distributed under the terms and conditions of the Creative Commons Attribution (CC BY) license (https://creativecommons.org/licenses/by/4.0/).
