3.1. Physicochemical relationships between water and wood that are important for long-distance moisture transport
Since water is transported from the root to the leaf in the xylem (
Figure 2 at
b b) and there is a high affinity between water and xylem, some physicochemical relationships of wood that are important for understanding water transport are then discussed in more detail in 3.1. Moist wood can be considered as an anisotropic gel [
27]. "In the case of wood, an analogy exists to an aqueous solution. The wood can be thought of as being partially dissolved in the sorbed water. As with a true solution this water is held at a vapor pressure p, lower than the saturated vapor pressure p
0 of pure water" [
27]. Damp wood is in equilibrium at a defined water content, depending on the type of wood, with a certain relative humidity RH. The relative humidity RH of the air is defined as p/p
0 where p means the existing water vapor pressure is generally lower than the saturation water vapor pressure p
0
(RH multiplied by 100 is the percentage relative humidity).
In the wood of living plants, water may be present in three main forms: 1) easily movable liquid water completely or partially filling the cell cavities in
Figure 3 at
a and
b. 2) water vapor in the cell cavities at
c and
d and 3) bound water in the cell wall at
a,
b,
c and
d.
"The liquid water in the cell cavities is sometimes called ‘free’ water to distinguish it from the cell-wall water which may then be called ‘bound’ water. This is because it is attracted or bound to the wood with stronger forces than those which hold the so-called ‘free’ water.“ [
27].
The terms "free" and “bound” are relative because the water is subjected to more or less large adsorptive van der Waals force fields depending on the water content in the cell cavities and is therefore not in the same thermodynamic state as ordinary liquid water in a large container.
The point of water content at which a given xylem cell has lost its cavity water or "free" water and contains only water vapor in the lumen, but the cell walls are still fully saturated, is called the fiber saturation point M
f (
Figure 3 at
c). Near the fiber saturation point (sometimes called the: fiber saturation range), several technical wood properties change in addition to physicochemical ones.
Legend: " a) The parenchyma covering the root tip. b b) The wood body composed of tracheids in tangential section. The tracheids ... ; their upper part is filled with air, the lower part with water. All conducting structures, which are in contact with the parenchyma of the root or the leaves, show a spiral pattern on the wall, so that the water can easily pass through the large thinned surfaces. ......, c) The leaf parenchyma, which gets the water from the spiral vessels and loses it by transpiration." (Translated from German).
Figure 2.
Reduced tangential section of a coniferous plant in [
28].
Figure 2.
Reduced tangential section of a coniferous plant in [
28].
The outward epidermis with cuticle and stomata in the leaf at
c) and the cambium, cortex and bark of the woody body at
b b), are not drawn in [
28].
Cambium, cortex and bark form the almost hermetic closure of the xylem to the outside. In fact, according in [
29], one of the foci of the water transport principle is based on the "hermetic closure" of its tracheal pathways to the outside.
Figure 3.
Schematic, idealized representation of the moisture distribution in the cross-section of a wood cell:
a above the fiber saturation point M
f at the maximum water content M
max,
b above the fiber saturation point M
f,
c at the fiber saturation point M
f and
d below M
f. Based on [
27].
Figure 3.
Schematic, idealized representation of the moisture distribution in the cross-section of a wood cell:
a above the fiber saturation point M
f at the maximum water content M
max,
b above the fiber saturation point M
f,
c at the fiber saturation point M
f and
d below M
f. Based on [
27].
For different species, the moisture content of fiber saturation point M
f is generally between 25% and 35%, based on dry wood. The maximum moisture content M
max in
Figure 3 at
a, can range from about 30% (Pock wood: 31%) to more than 230% (Balsa wood: 767%). The maximum moisture content is rarely reached in living wood. Even at maximum water content M
max moisture is retained almost without tension by the adsorption force fields of the wood at any growth height. Only when a drop of water is placed on the upper interface of a branch cut off at two points and held vertically with maximum water content in the woody part, does a drop escape at the bottom. At this high moisture value M
max it can additionally no longer be held by the adsorption force in the wood compared to the gravitational force and drips off.
To maintain the vital water transport in the apoplast from the root via the stem to the leaf, a continuous liquid film must be present in the xylem, the moisture content in the xylem must be greater than the fiber saturation M
f. Below this value, water transport is only possible in insufficient amount in vapor form. Trapped air can make the matrix more hydrophobic, its possible rehydration therefore more difficult. Among other things, it follows: "Already the conduction channels of the seedlings are filled with water and remain filled accordingly ..." [
29] (Translated from German). A main task, that the pathways are not emptied too far in the course of transpiration but remain "filled accordingly", comes to the closing movements of the stomata and the almost hermetic closure of the conducting tissue to the outside. The nearly airtight closure of the wood could be measured by [
30] using absolute pressure sensors in sapwood. While July/August in stem of
Pedula pendula, the moisture/vapor pressure of the wood rarely dropped to 0.0043 MPa absolute pressure (corresponding to the boiling range of water at 30 °C). In contrast, the pressure more often rose to more than 0.8 MPa. The maintenance of these significant deviations from normal pressure indicate a high airtight closure of the stem.
3.2. Water transport is driven by transpiration, a diffusional process
Just before sunrise and adequate water supply, the plant should be almost completely hydrated. There is no net movement of moisture. From this state of equilibrium, the stomata open in the leaf after sunrise, and transpiration starts. During it, water evaporates from a thin film covering the walls of the leaf intercellular surface belonging to the apoplast. The phase transition from water film to vapor during evaporation, represents a diffusive process. The latter is part of transpiration. The reason for evaporation is the clear concentration gradient for water between the liquid phase of the intercellular walls with high water concentration and the water vapor phase of the outside air with low water concentration. The atmosphere is relatively dry and can: "... dehydrate the plant" [
16]. Without any energy input of their own, rooted land plants exploit the external concentration gradient between moist soil and relatively dry atmosphere for water transport from root to stem to top. The diffusive evaporation of water during transpiration physically follows Fick's first law:
In equation (2) J [mol/s] means the quantity of a substance diffused per unit time, D its diffusion coefficient [m2/s], A the crossed area [m2] and Δc/Δx the concentration gradient [mol/m3 · m] of the substance. The quantity of a substance diffused per unit time J [mol/s], is directly proportional to the size of the diffusion coefficient D [m2/s], der crossed area A [m2] and the driving concentration gradient Δc/Δx [mol/m3 · m]. The minus sign occurs because the direction of net diffusion is towards regions of lower concentration.
The movement of water vapor from respiratory cavities outward to the atmosphere within the transpiration process also occurs by diffusion. The moist intercellular area A of the respiratory cavities, adjacent to the outside air when the stomata are open, is huge. By additional action of wind, a large concentration gradient Δc/Δx of water vapor between leaf interior and atmosphere may be maintained at the leaf surface. Wind amplifies the quantity of total stomatal and cuticular transpiration.
The transpiration- or diffusion- rate E [mol/m
2 · s] of water between foliage and atmosphere measured in many studies reflects about 70-75% of the amount of water taken up by the root, moved and released to the atmosphere by transpiration (diffusion) [
31]. For example, the transpiration- diffusion- rate of a
Tradescantia zebrina plant [
32] in still air E = 1.5 · 10
-3 [mol/ m
2 · s] and for strongly moving air almost three times the amount (= 4.4 · 10
-3 [mol/ m
2 · s]) was measured (Experimental conditions: 23°C ±2°C, relative humidity of ambient air RH = 0.65, stomata width = 15 µm).
Transpiration requires a high amount of energy, which can dehydrate the plant. The energy must be supplied by the environment of the plant. The molar heats of vaporization of water ΔH
0 at standard pressure and 30°C is: ΔH
0 = 43,7 kJ. For comparison: the enthalpy change by warming-up one mole of water ΔH
w from 30 °C to 31°C needs significantly less energy: ΔH
w = 0,075 kJ [
43]. Transpiration involves a simultaneous transfer of energy and mass.
In the apoplast too, a concentration gradient Δc/Δx develops between the water-bearing root xylem which is higher in moisture to the water-releasing intercellular walls in the leaves which have lower moisture concentration but without phase change. Spontaneously, the water diffuses down the physiological concentration range from the root to the intercellular walls in the leaf. A purely diffusive water transport is superimposed on its path in the xylem by a desorption/adsorption process triggered by the partial dehydration of the plant via the effect of van der Waals forces in the apoplast (Compare section 3.4). The huge outer and inner surface A of root and leaf, as well as the huge inner apoplastic surface of root, stem and leaf, allow - in addition to the factors described above - a potentially high thermodynamic mass movement triggered by diffusive transpiration.
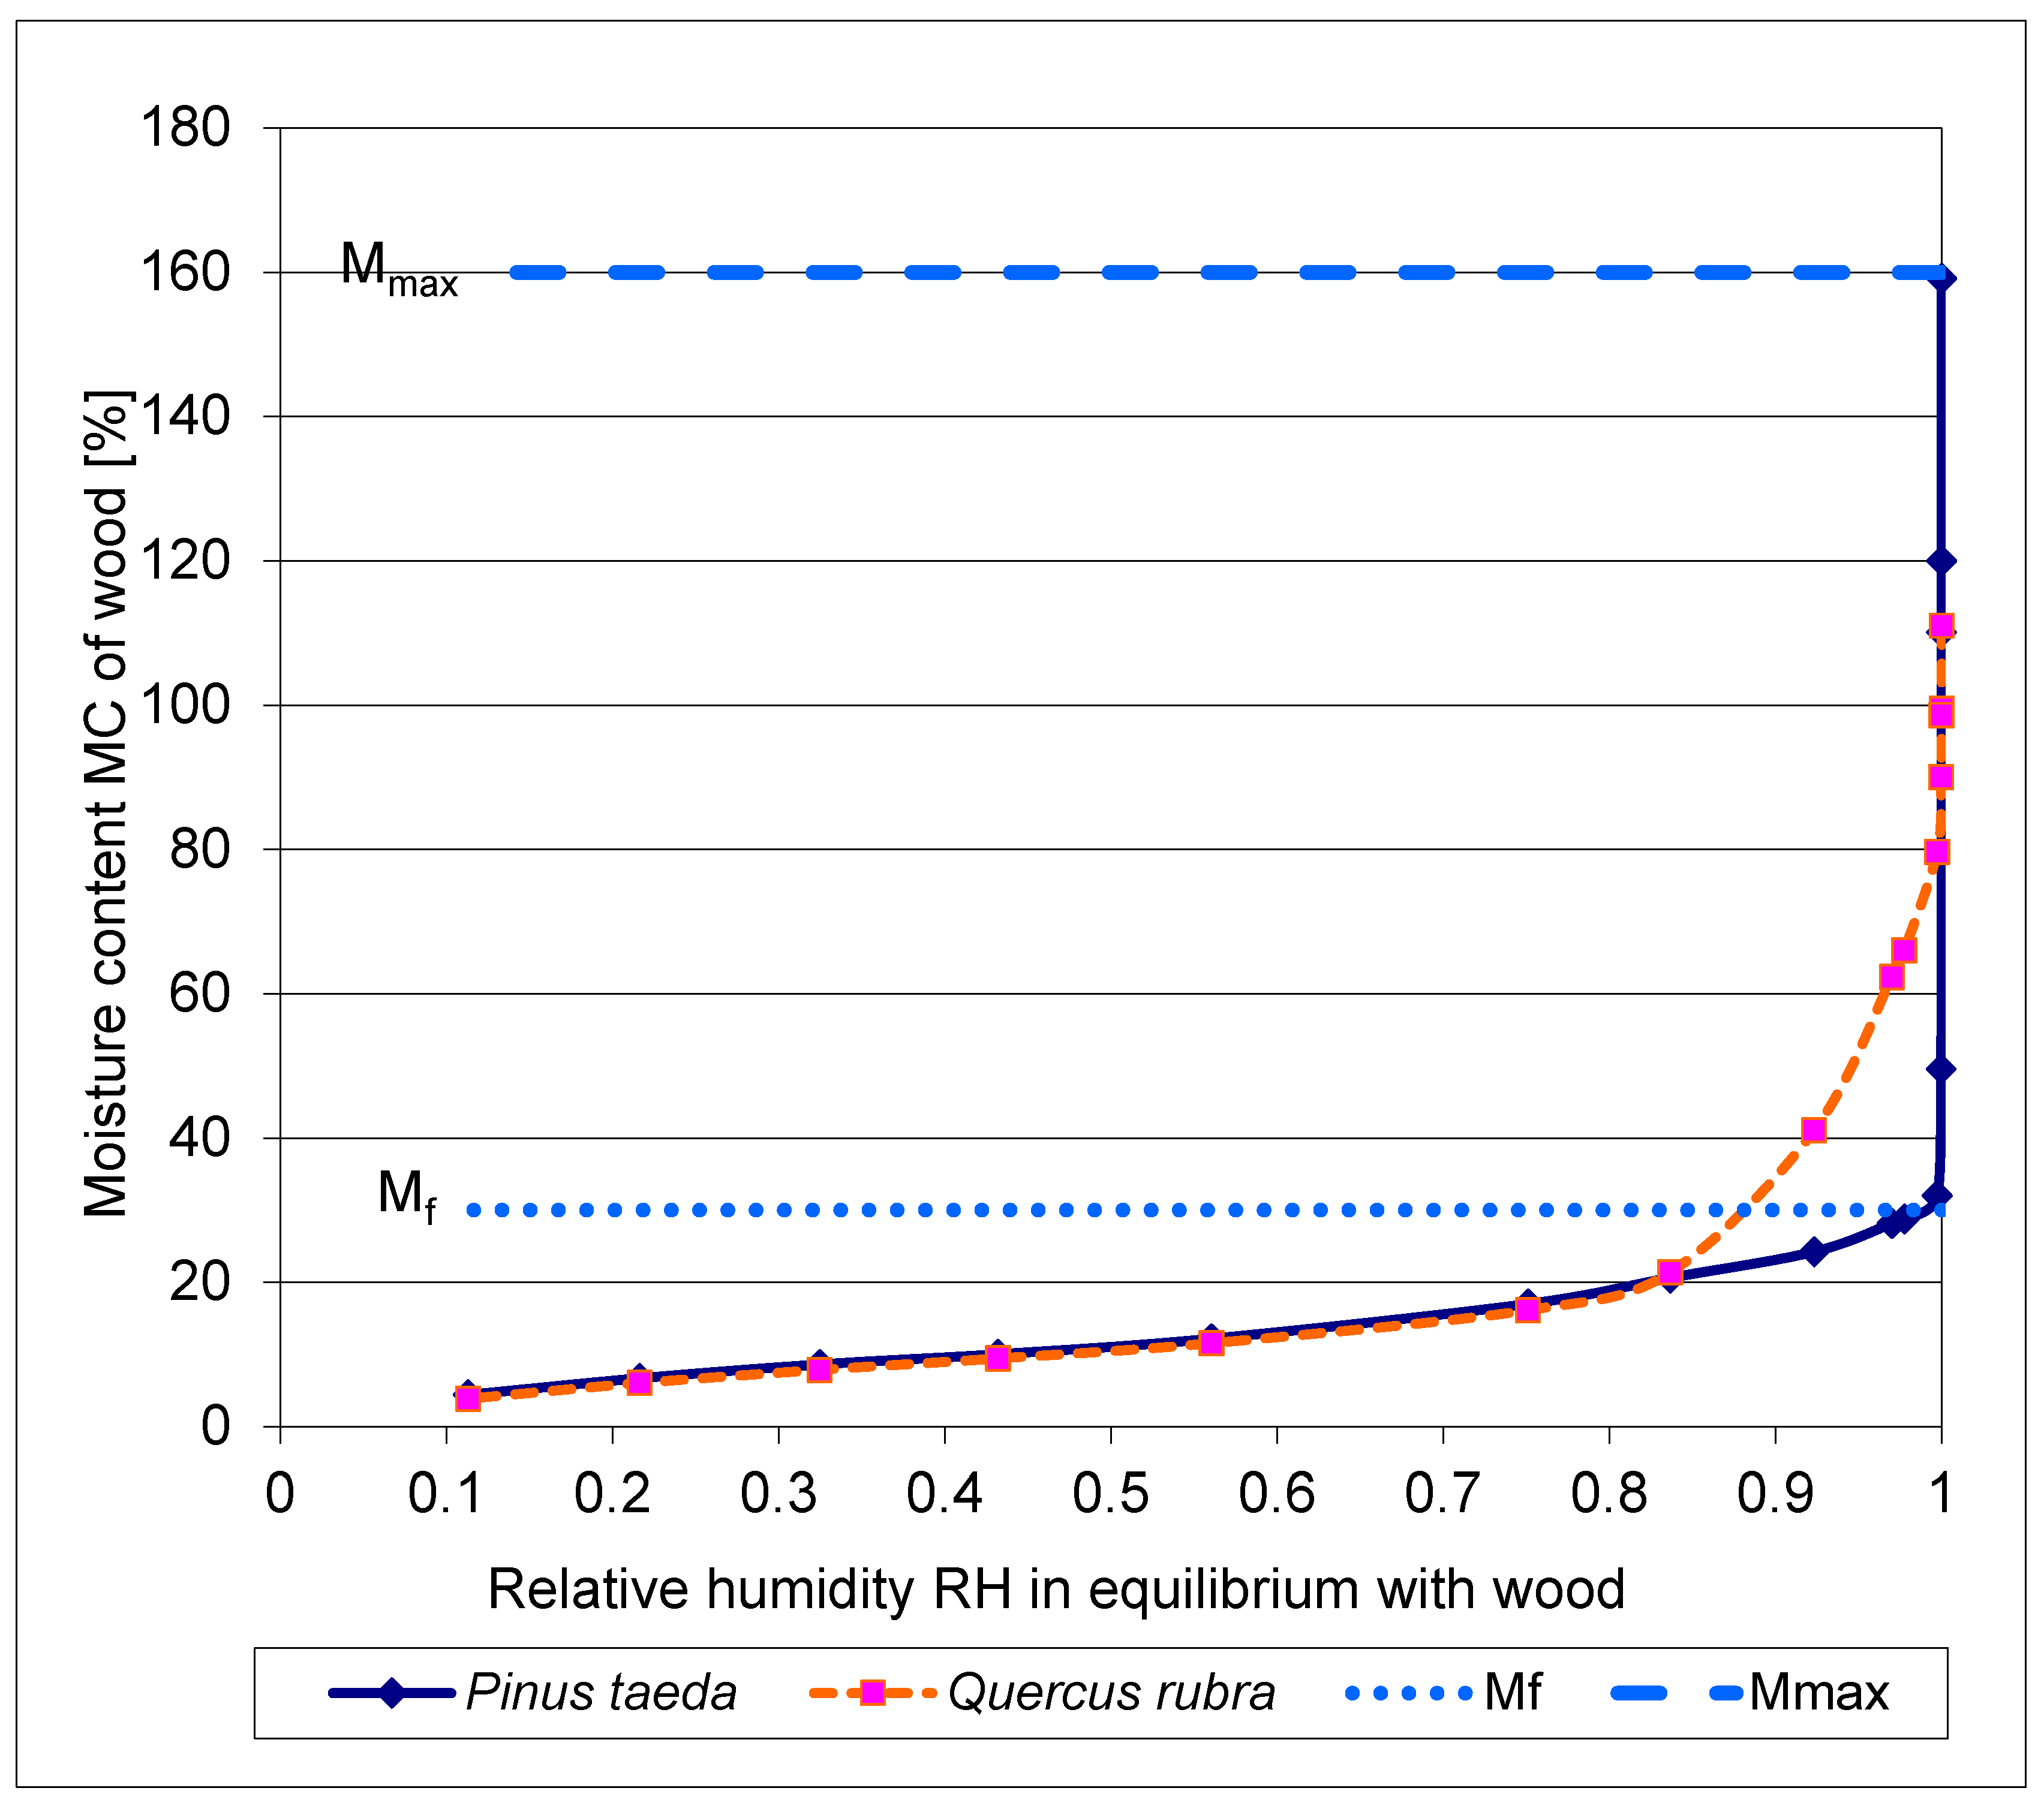
3.5. The desorption isotherms of moist wood of Pinus taeda and Quercus rubra
The desorption isotherm of water-saturated wood, respectively of a coniferous tree
Pinus taeda and a deciduous tree
Quercus rubra, is shown in
Figure 5.
To the aim of their work the authors point out in [
40]: "Specifically, it should provide insight into the fundamental driving force for the transport of water in wood ...". In [
41] similar studies on
Picea mariana are performed.
Using special relative humidity measurement methods beyond the isopiestic method above RH = 0.955, characteristic desorption curves are obtained over the entire range of moisture content. These are the tension plate, the pressure plate and the pressure membrane methods.
For undisturbed water transport in the xylem from root to apex, the continuous presence of liquid water, i.e. above the fiber saturation concentration M
f, is crucial. According to [
40], "liquid" water is present in the physiological range of the wood of
Pinus taeda and
Quercus rubra above a relative humidity of about RH = 0.98 (
Figure 5). This region is above a moisture content corresponding to the fiber saturation point M
f (
Figure 3 in
a and
b).
For comparison with the leaf moisture conditions (at the inner side of the stomata), the relative humidity amounts to RH = 0.95 (25 °C) [
42]. The authors in [
16] mention: ” .. a value of nearly 1 ..." for the relative humidity inside a leaf.
During the desorption (dehydration) of the wood, starting from the maximum water content M
max (for
Pinus taeda = 160%, for
Quercus rubra = 120% in [
40]), the range around M
f coincides with the loss of liquid water in the cell cavities of the xylem (
Figure 3 at
c). M
f is assumed to be = 30% for
Pinus taeda and M
f = 25% for
Quercus rubra.
The abrupt transition of water content at Mf from the so-called over-hygroscopic- (above Mf) to the hygroscopic- range (below Mf) in the coniferous wood of Pinus taeda appears remarkable.
In the hardwood of Quercus rubra, the decrease in concentration from the over-hygroscopic moisture range to the hygroscopic range is much less abrupt than in the softwood plant. This may be related to the fact that there is always more living parenchyma in hardwood than in softwood.
Figure 5.
Comparison of the de-sorption isotherms of
Pinus taeda and
Quercus rubra, measured at 30 °C over the entire range [
40]. For clarity, the range of fiber saturation point M
f (≈ 30%) and maximum water content M
max (≈160%), is plotted for
Pinus taeda only.
Figure 5.
Comparison of the de-sorption isotherms of
Pinus taeda and
Quercus rubra, measured at 30 °C over the entire range [
40]. For clarity, the range of fiber saturation point M
f (≈ 30%) and maximum water content M
max (≈160%), is plotted for
Pinus taeda only.
3.6. Energetic consideration of sorptive plant water transport on moist wood of Pinus taeda
Using the measuement results from [
40] in column 1 (“Moisture content”) and 2 (“Relative humidity”) of
Table 1, it is possible to calculate the decrease in molar free energy ΔG
s, according to (3), listed in column 3 (“Calculated”), made during spontaneous adsorptive rewetting of the wood from M
f to M
max. During the adsorption of one mole of water m
w (m
w = 0,018 kg) for example from M
f to M
max of the wood of
Pinus taeda, ΔG
s = 7,1 [J/mol] free energy is released (
Table 1). According to (4), this value corresponds to molar (lifting-) work w
max,s ≙ 7,1 [N · m/mol]. Without loss, one can adsorptively raise the mass m
w of one mole of water by the height h = w
max,s/(m
w · g) ≈ 40 m (with: g = 9,81 [m/s
2] and: N = kg · m/s
2). Using measurements of the desorption isotherm on
Picea mariana in [
41], similar calculations are made for
Picea mariana in [
12].


