Preprint
Article

Does a Rural-Urban Gradient Affect Arthropod Assemblages in an Arid Ecosystem?

Altmetrics

Downloads

191

Views

63

Comments

0

A peer-reviewed article of this preprint also exists.

Submitted:

26 January 2023

Posted:

27 January 2023

You are already at the latest version

Alerts
Abstract
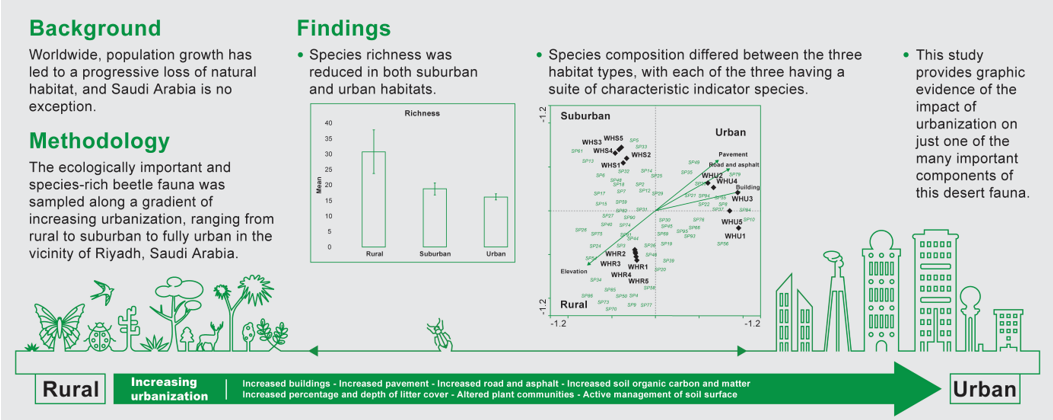
Urbanization affects all elements of the pre-urban environment, including soils, hydrology, vegetation, and microclimate. Recently, Saudi Arabia has experienced rapid urbanization and growth. Thus, the country's biodiversity has been threatened. In Riyadh, beetle assemblages were assessed along a rural-suburban-urban gradient. A total of 2,791 individuals from 94 species belonging to seven families were collected at 15 sites along three different gradients of urbanization in Wadi Hanifa. Tenebrionidae dominated abundance (60.1%) and richness (38%). Beetle abundance, evenness, and diversity were not different among habitats; however, species richness was higher in rural habitats. DCA and CCA analyses showed distinct differences among sites along gradients. Urbanization intensity, soil variables, and land cover were significantly correlated with DCA axis 1, while elevation and flora were significantly correlated with DCA axis 2. The most critical operating environmental variables in Wadi Hanifa were buildings, elevation, soil organic carbon, litter cover, and litter depth, as well as plants such as Launaea capitata, Lycium shawii, Alhagi graecorum, and Heliotropium currasavicum. Ten species in our study are associated with urban habitats, six with suburban habitats, and seven with rural habitats. Consequently, expanding urban areas may negatively affect the richness and composition of beetles and may result in the loss of some native species.
Keywords: 
Subject: Biology and Life Sciences  -   Insect Science

1. Introduction

Urbanization is not a recent phenomenon; the earliest urban settlements were first developed in eastern Asia, Mesopotamia, and Egypt. Urbanization gradually spread to all continents over time [1,2]. City dwellers have increased in number [3] with more than half of the global population now living in urban areas [4]. In cities, dense human populations associated with transportation activities and intensive industrial activity [5,6] results in significant landscape changes both at scale and within individual sites [7,8]. The consequences of city growth are noticeable on a landscape level as built-up areas disturb surrounding natural habitats producing partially or tiny isolated patches [9,10]. Additionally, disturbed natural habitats often become non-permanent environments such as abandoned sites characterized by altered chemical and physical properties of soil [11,12,13].
The effects of pre-urban development on soils, hydrology, vegetation, climate and animal populations can be seen in the altered regional environmental factors such as increased levels of nutrients, soil impermeability and pollution [8,14,15]. These conditions are expected to differentially affect species within the original communities by either favoring well-adapted species or displacing less adapted ones [16,17,18]. Such a selection process may lead to population decline or replacement for some native taxa with more generalist and tolerant individuals taking advantage of an improved environment [16,19]. The displacement of natives is usually associated with urbanization [13].
Invertebrates, specifically arthropods, make ideal study subjects for investigating urban biodiversity [2,20,21]. Their small size and environmental needs allow them to thrive in an urban environment, and their diverse life histories provide insight into the composition of metropolitan fauna [21,22]. Many studies have revealed that complex arthropod communities can be found within cities [17,18]. Beetle species are a significant part of Earth's animal population, representing about one-fourth of all known species [23], and many are threatened by human activity such as development or pollution [24]. Knowing how these populations change with respect to both abundance and composition of beetles allows ecologists and municipalities to monitor changes in the cityscape [2,24].
Since the 1970s, Saudi Arabia's population has increased rapidly as a result of oil revenues (3.4% annually) [25]. As a result, large areas of formerly wild lands have been dramatically developed, most notably in Al Sarawat, Hijaz and the Northern and Central regions [25]. Consequently, some indigenous species that used to inhabit these areas are now at high risk for complete loss due to urbanization. Despite this fact, more ecological work still needs to be done in these settings [26,27,28] particularly Wadi Hanifa (WH) (Central Saudi Arabia), where an assessment was conducted using beetles as bioindicators in this study.

2. Materials and Methods

2.1. Study area

In the Wadi Hanifa (WH) in Riyadh, central Saudi Arabia, we investigated beetle diversity along a gradient of urbanization (Figure 1). As an eminent natural landmark in central Saudi Arabia, the WH occupies a geographical area between 24°30'N and 46°30'E to 24°45N and 46°45'E. The wadi is 120 kilometers long, with a depth ranging from 10 to 100 meters and a width ranging from 100 to 1,000 meters. It flows through the heart of Riyadh City from the northwest to the open desert in the southeast. Seasonal rains and sewage are the primary water sources in WH, with more than 4,000 square kilometers of the catchment area.
In terms of climate, WH has a relatively mild winter and a hot summer, with an average annual temperature of 26°C and an average relative humidity of 24.4%. Annual precipitation is 85 mm, but it does not rain from June to September [29].
In the rural area, sampling was conducted near Haysiah Dam, west of Al Uyaynah District (Diriyah Governorate) and 60 kilometers northwest of the center of Riyadh City. The area included native and natural flora, such as Acacia spp. trees, and shrubs like Arabian boxthorn Lycium shawii Roem. & Schult. (Solanaceae) and harmel Rhazya stricta Decne. (Apocynaceae), and annual herbs such as huwa Launaea capitata (Spreng.) Dandy (Asteraceae) and little mallow Malva parviflora L. (Malvaceae). A number of unpaved roads are located in the area, as well as sheds for goats, sheep, and camels.
Compared to rural and urban habitats, the area was characterized by deciduous casuarina trees Casuarina equiseifolia L. (Casuarinaceae), drought-tolerant species like camel thorn shrubs Alhagi graecorum Boise. (Fabaceae) and desert thistle Echinops spinosissimus Turra (Asteraceae), perennial herbs such as thumam Pennisetum divisum (Forssk. ex J.F.Gmel.) Henrard (Gramineae) and annual herbs such as rough cocklebur Xanthium strumarium L. (Asteraceae). A number of detached buildings and gardens, as well as paved and unpaved roads, were found in the area.
Urban sampling sites were selected in the extensive park areas in Al Jaradiyah, Siyah, and Sultanah districts (Riyadh Governorate), 35 km southeast of suburban sampling sites. There are still patches of original vegetation on these sites, although they have been enriched by exotic plants and trees. The city's stormwater drainage system discharges groundwater into a surface flow channel that runs through the urban area until south of Al-Hair Town. Continuous water flows have created ideal conditions for diverse plant species to flourish (for instance, algae and other aquatic plants grow in abundance), wildlife communities to thrive, and recreational opportunities to flourish [14,30]. Several tree species can be found in the area, including Acacia spp., Prosopis, Prosopis koelziana Burkart, and P. juliflora (Sw.) DC. (Fabaceae), Christ's thorn jujube, Ziziphus spina-christi (L.) Desf. (Rhamnaceae), and river red gum, Eucalyptus camaldulensis Dehnh. (Myrtaceae). There are also annual herbs such as lagoon saltbush, Atriplex suberecta I. Verd. (Amaranthaceae), and giant pigweed, Trianthema portulacastrum L. (Aizoaceae) as well as flowering perennial evergreen shrubs such as heliotrope, Heliotropium currasavicum L. (Boraginaceae), and Chaste shrub Vitex spp. (Lamiaceae).

2.2. Sampling procedure

We conducted quantitative sampling following the protocols for the GLOBENET (Global Network for Monitoring Landscape Change) project. We randomly selected 15 sites (replicates) along a rural-suburban gradient (Table 1). Each gradient contained five replicate sites comprising two parallel rows of five pitfall traps (diameter 10 cm, 5 m apart). A total of 150 pitfall traps were used in three gradients (3 x 50). A distance of at least 200 meters was maintained between sites to ensure sample independence. A 250-mm propylene glycol solution was used to fill the traps. Each trap was left working for a week, and sampling was conducted quarterly for 12 months. At the King Saud University Museum of Arthropods (KSMA), Department of Plant Protection, College of Food and Agricultural Sciences, identification of the beetle species collected was conducted.
To measure the level of urbanization, we used the total amount of built-up area as a proxy. The total amount of built-up area was used to reflect the urbanization level. Buildings, pavements, roads, and asphalt-covered paths were the most influential determinants of built-up areas. A high-resolution aerial image captured in Google Earth was used to extract the determinants within each site for a square of one kilometer surrounding the sampling location (Table 1). We used a handheld GPS unit (Garmin, Montana 650 handheld Global Positioning System) to determine the elevation at each site.
Within each site, soil samples were collected in triplicate along a diagonal line from the top to 15 cm using a soil auger. All three samples were consolidated into one composite sample, mixed thoroughly (total weight 1.5‒2.0 kg), and sent for analysis to the Soil Laboratory at the College of Food and Agricultural Sciences, King Saud University. A number of physio-chemical characteristics of the soil have been measured, including clay, silt, sand, texture, soil reaction (pH), soil electrical conductivity (EC), soil organic carbon (SOC), and soil organic matter (SOM) (Table 2).
We collected vegetation data from ten randomly chosen meter-square quadrats at each site (plant cover, litter cover, litter depth, logs, and bare ground). Plant species were surveyed in April 2019, and specimens were identified at the King Saud University Herbarium within the Department of Botany and Microbiology.

2.3. Data analysis

Across sites and urbanization levels, variation in beetle assemblages and species composition was described based on abundance, species diversity, evenness, Shannon and Simpson diversity indexes, composition, assemblage variability, and indicator species. These variations assessed using one-way ANOVA tests. The mean number of individuals from each species collected from each site was used to measure abundance, while the total number of species recorded was used to measure species richness.
Detrended correspondence analysis (DCA) was used to ordinate the sites against axes based on beetle abundance and species composition [31]. The influence of environmental variables on the beetle assemblages was tested by canonical correspondence analysis (CCA) [32]. By using CANOCO program and the PC-ORD package, we conducted both CCA and DCA analyses. Using the CANOCO program, the CCA was conducted using a forward selection mode, and the significance of each variable was tested sequentially using a Monte Carlo simulation algorithm before adding it to the final model. We included only species present at two or more sites in our DCA analysis. Models were based on variables that were significant at p<0.05. On CCA triplots, variables are displayed as arrows pointing toward maximum variation, whose length varies according to the rate of change [32]. We examined the similarity among the beetle assemblages using analysis of similarity (ANOSIM, using a nested two-way design). Based on square-root transformed beetle abundance data, ANOSIM was performed on Bray-Curtis similarity matrixes with 999 permutations. We used the program PRIMER version 7.0.17 for the ANOSIM analysis. Indicator species analysis was used to determine the species characteristic of the level of the urbanization gradient [33]. Indicator species analysis was performed using the PC-ORD statistical package.

3. Results

3.1. Beetle diversity

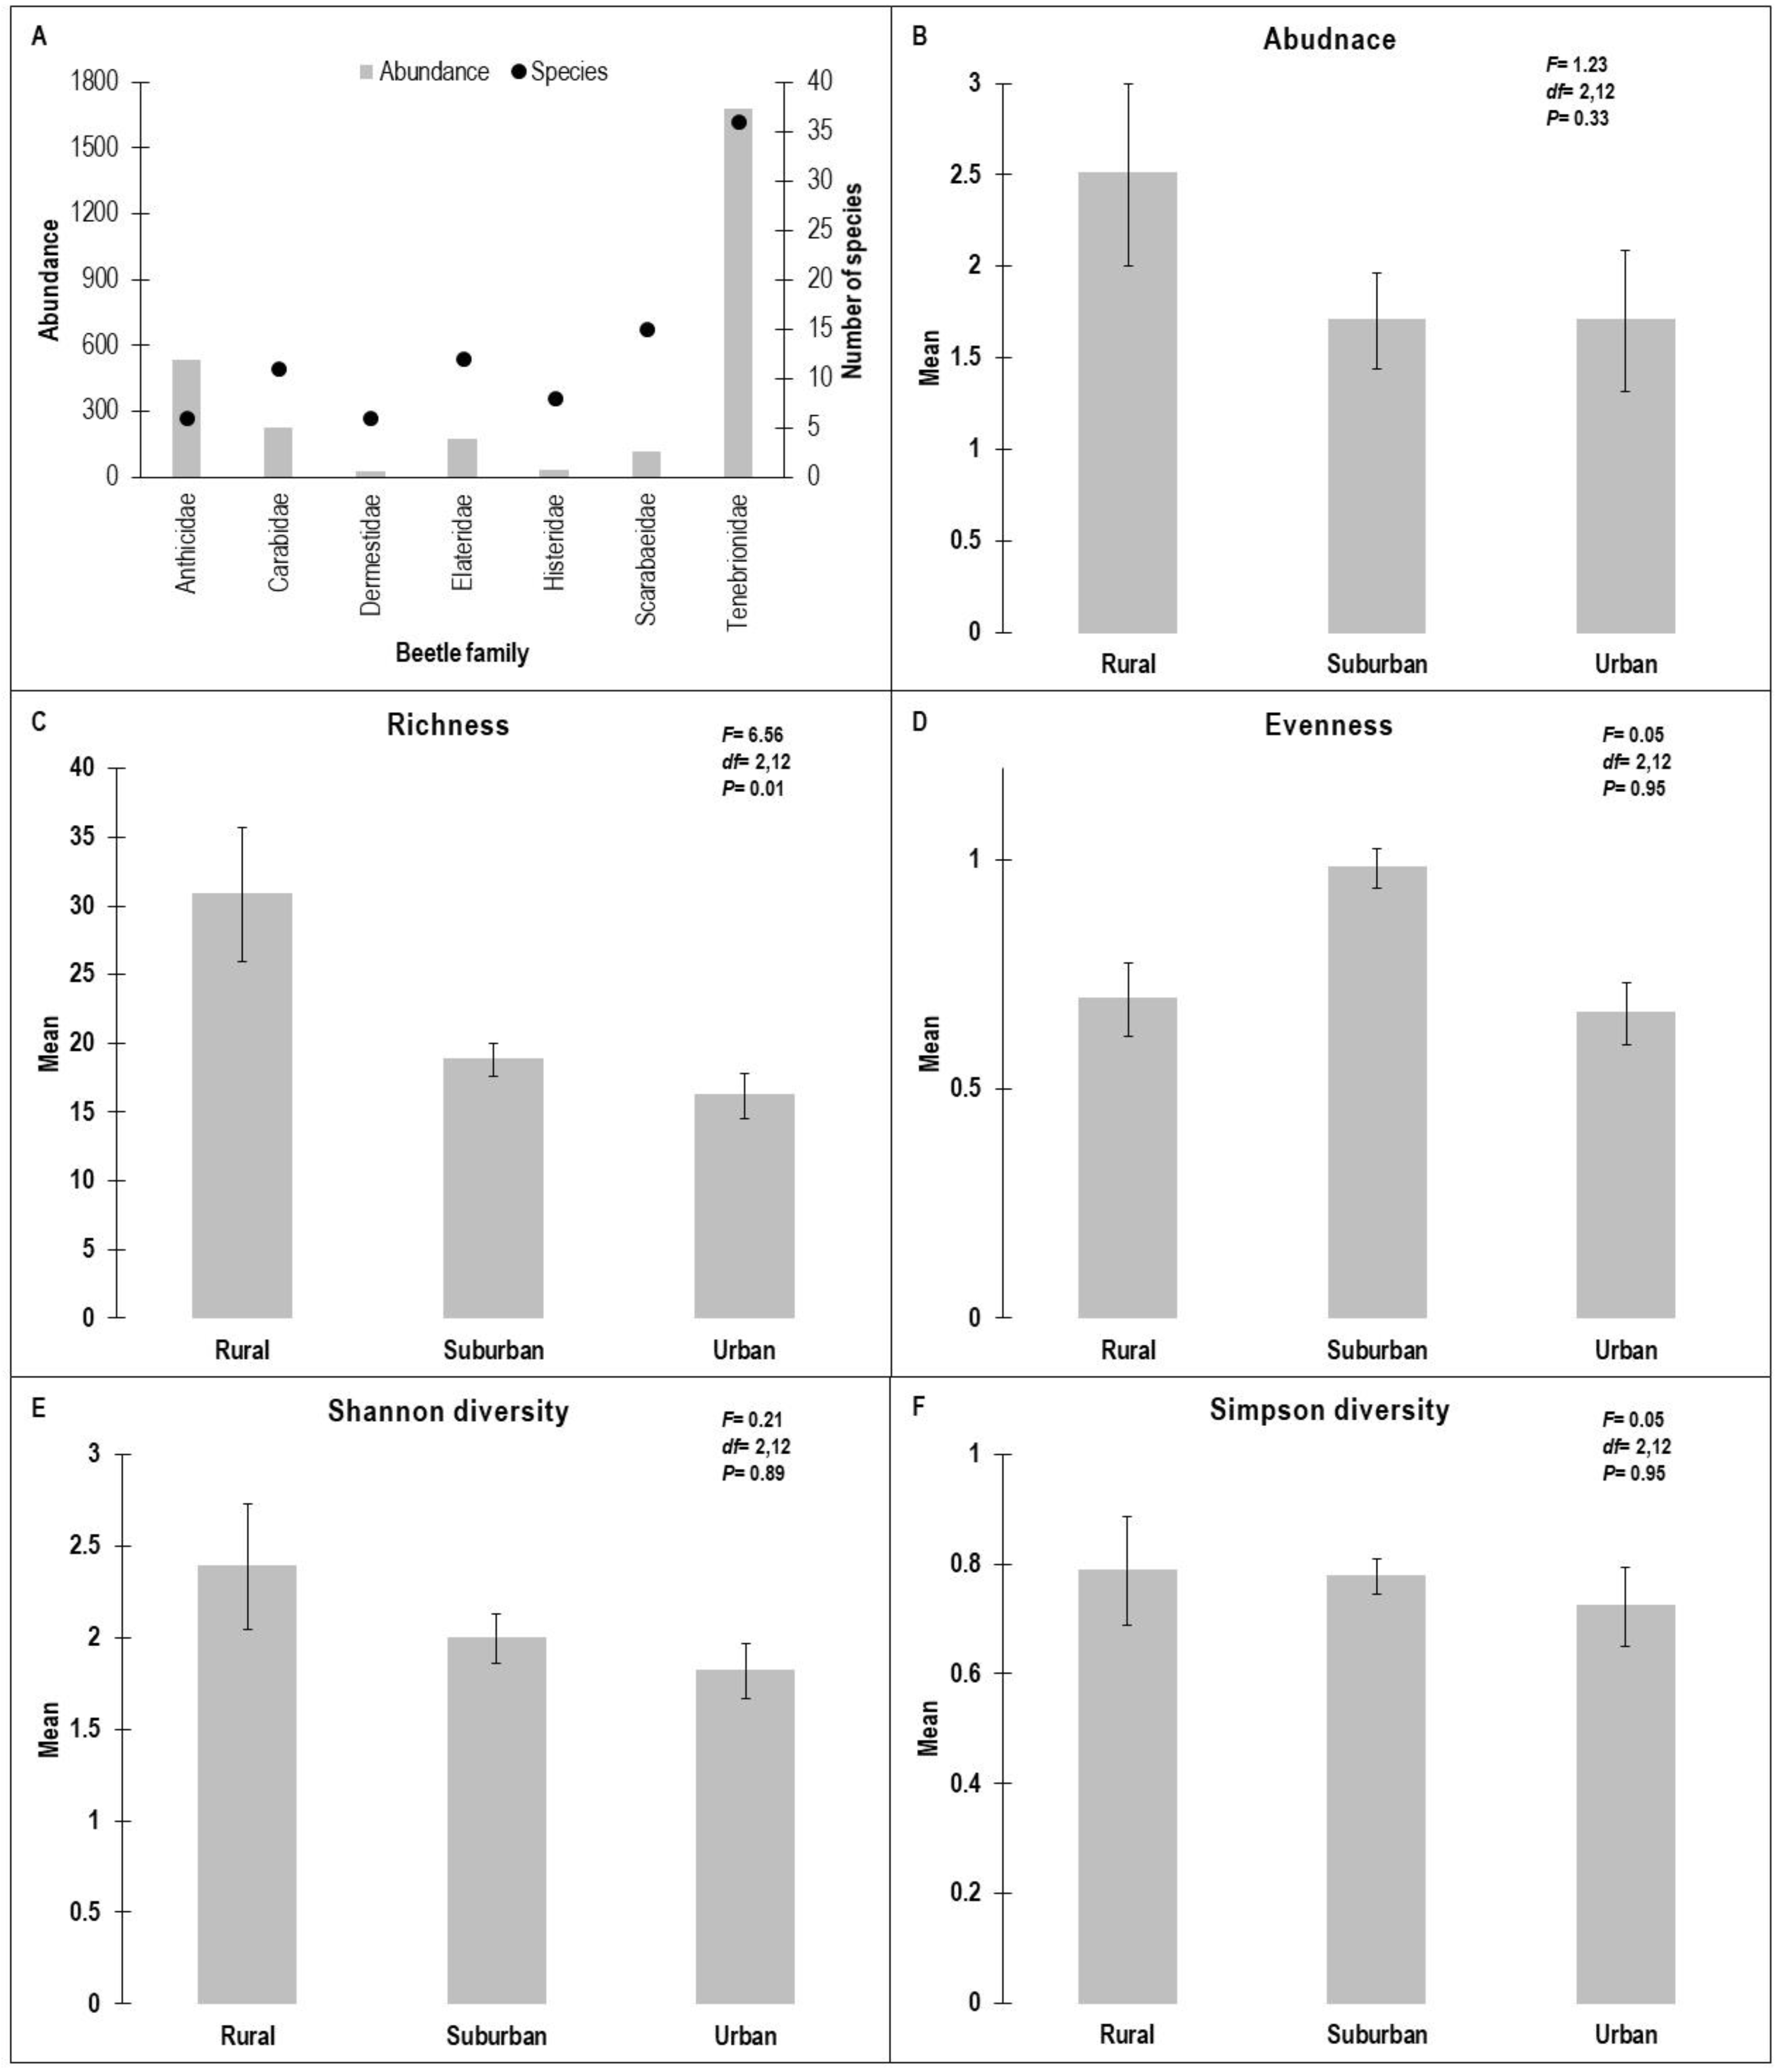
The urbanization gradient yielded 2,791 individuals representing 94 species among 62 genera and seven families (Figure 2A, Table S1). In the rural habitat, we caught 1,170 individuals belonging to 66 species; in the suburban habitat, 712 individuals and 42 species; and in the urban habitat, 802 individuals and 32 species. The family Tenebrionidae dominated the richness (38.3%, 36 spp.) and abundance (60.1% of the total catch) (Figure 2A). About 54% of the individuals belonged to six species, Adesmia stoeckleini, Mesostena puncticollis and Zophosis punctate (Tenebrionidae), Anthelephila caeruleipennis and Anthicus crinitus (Anthicidae), and Bembidion wittmeri (Carabidae) (Table A). None of the 94 beetle species occurred at all 15 studied sites. As illustrated by the distribution ranges of some documented species, M. puncticollis was recorded at 13 sites and had the highest abundance (14%), whereas A. cancellata was found at 11 locations. Twenty-one species, or 22% of the total species recorded, were represented by a single specimen; eight species (8.4%) appeared in all habitats along the urbanization gradient.
Rural sites had a significantly higher mean number of species (30.8 species) than suburban (18.8) or urban (16.2) ones (Figure 2B). A gradient of disturbance from rural to urban did not reveal any obvious patterns in abundance, evenness, or Shannon or Simpson diversity (Figure 2C–F).

3.2. Species composition

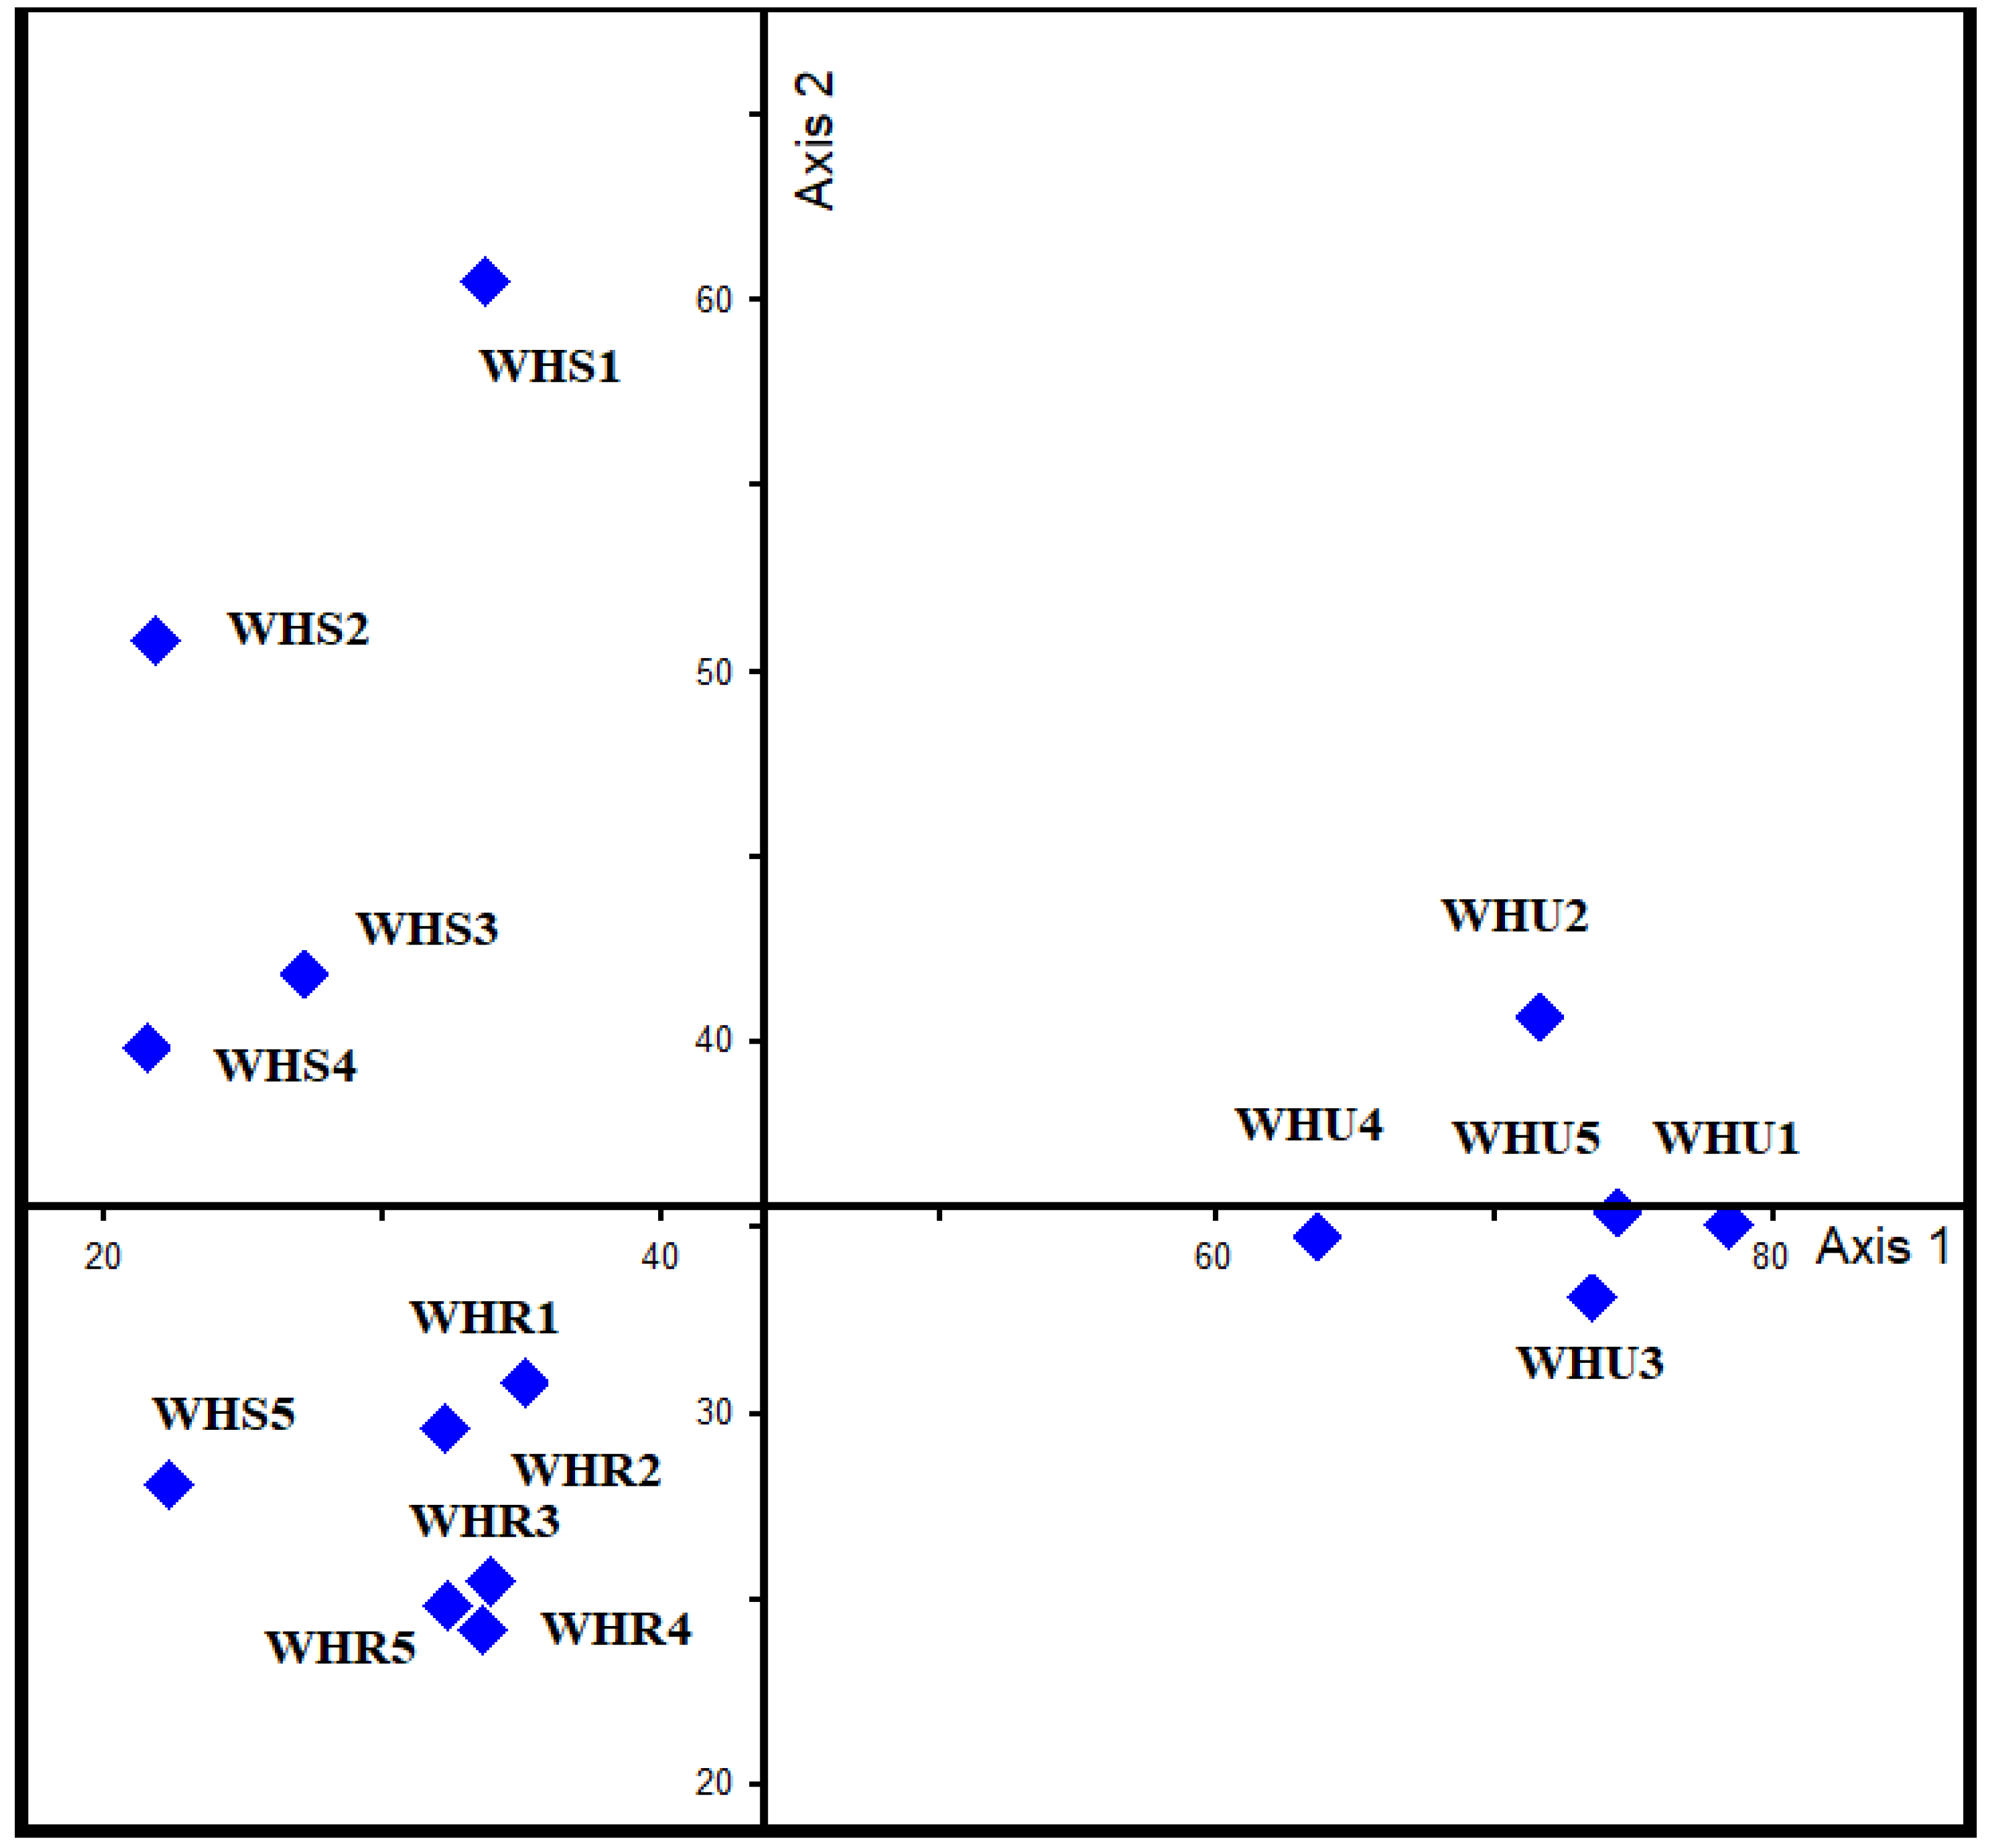
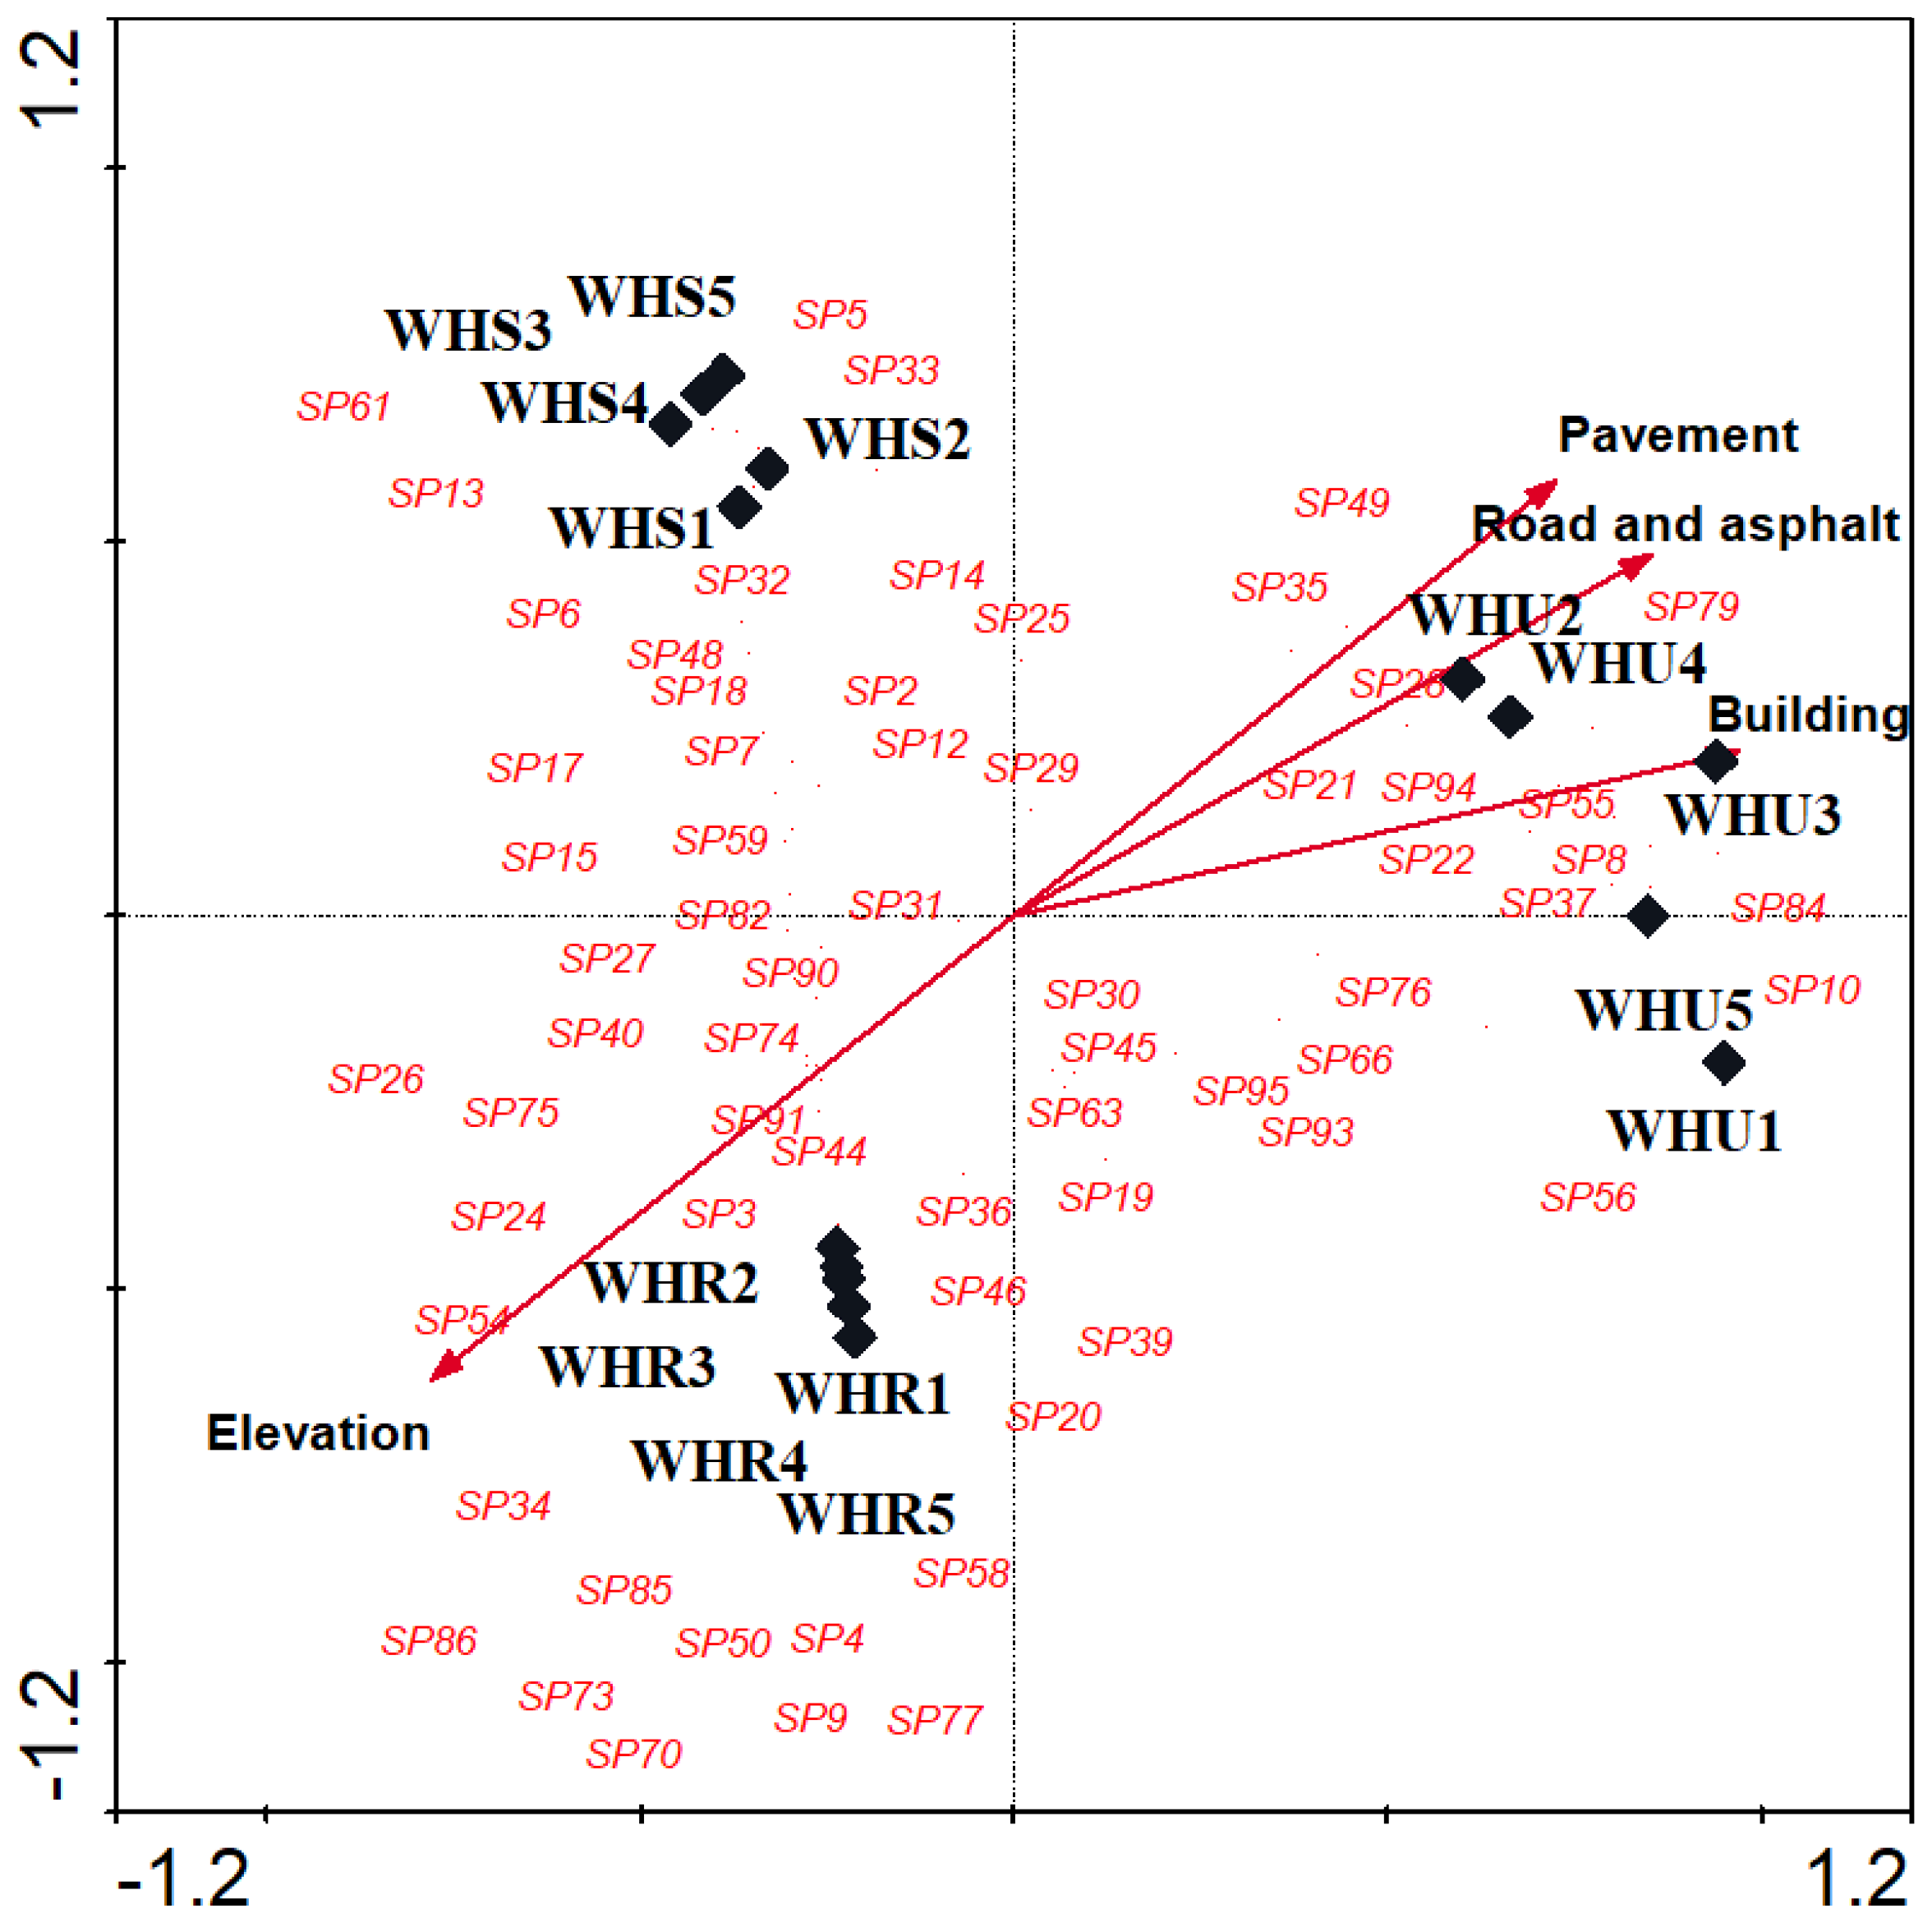
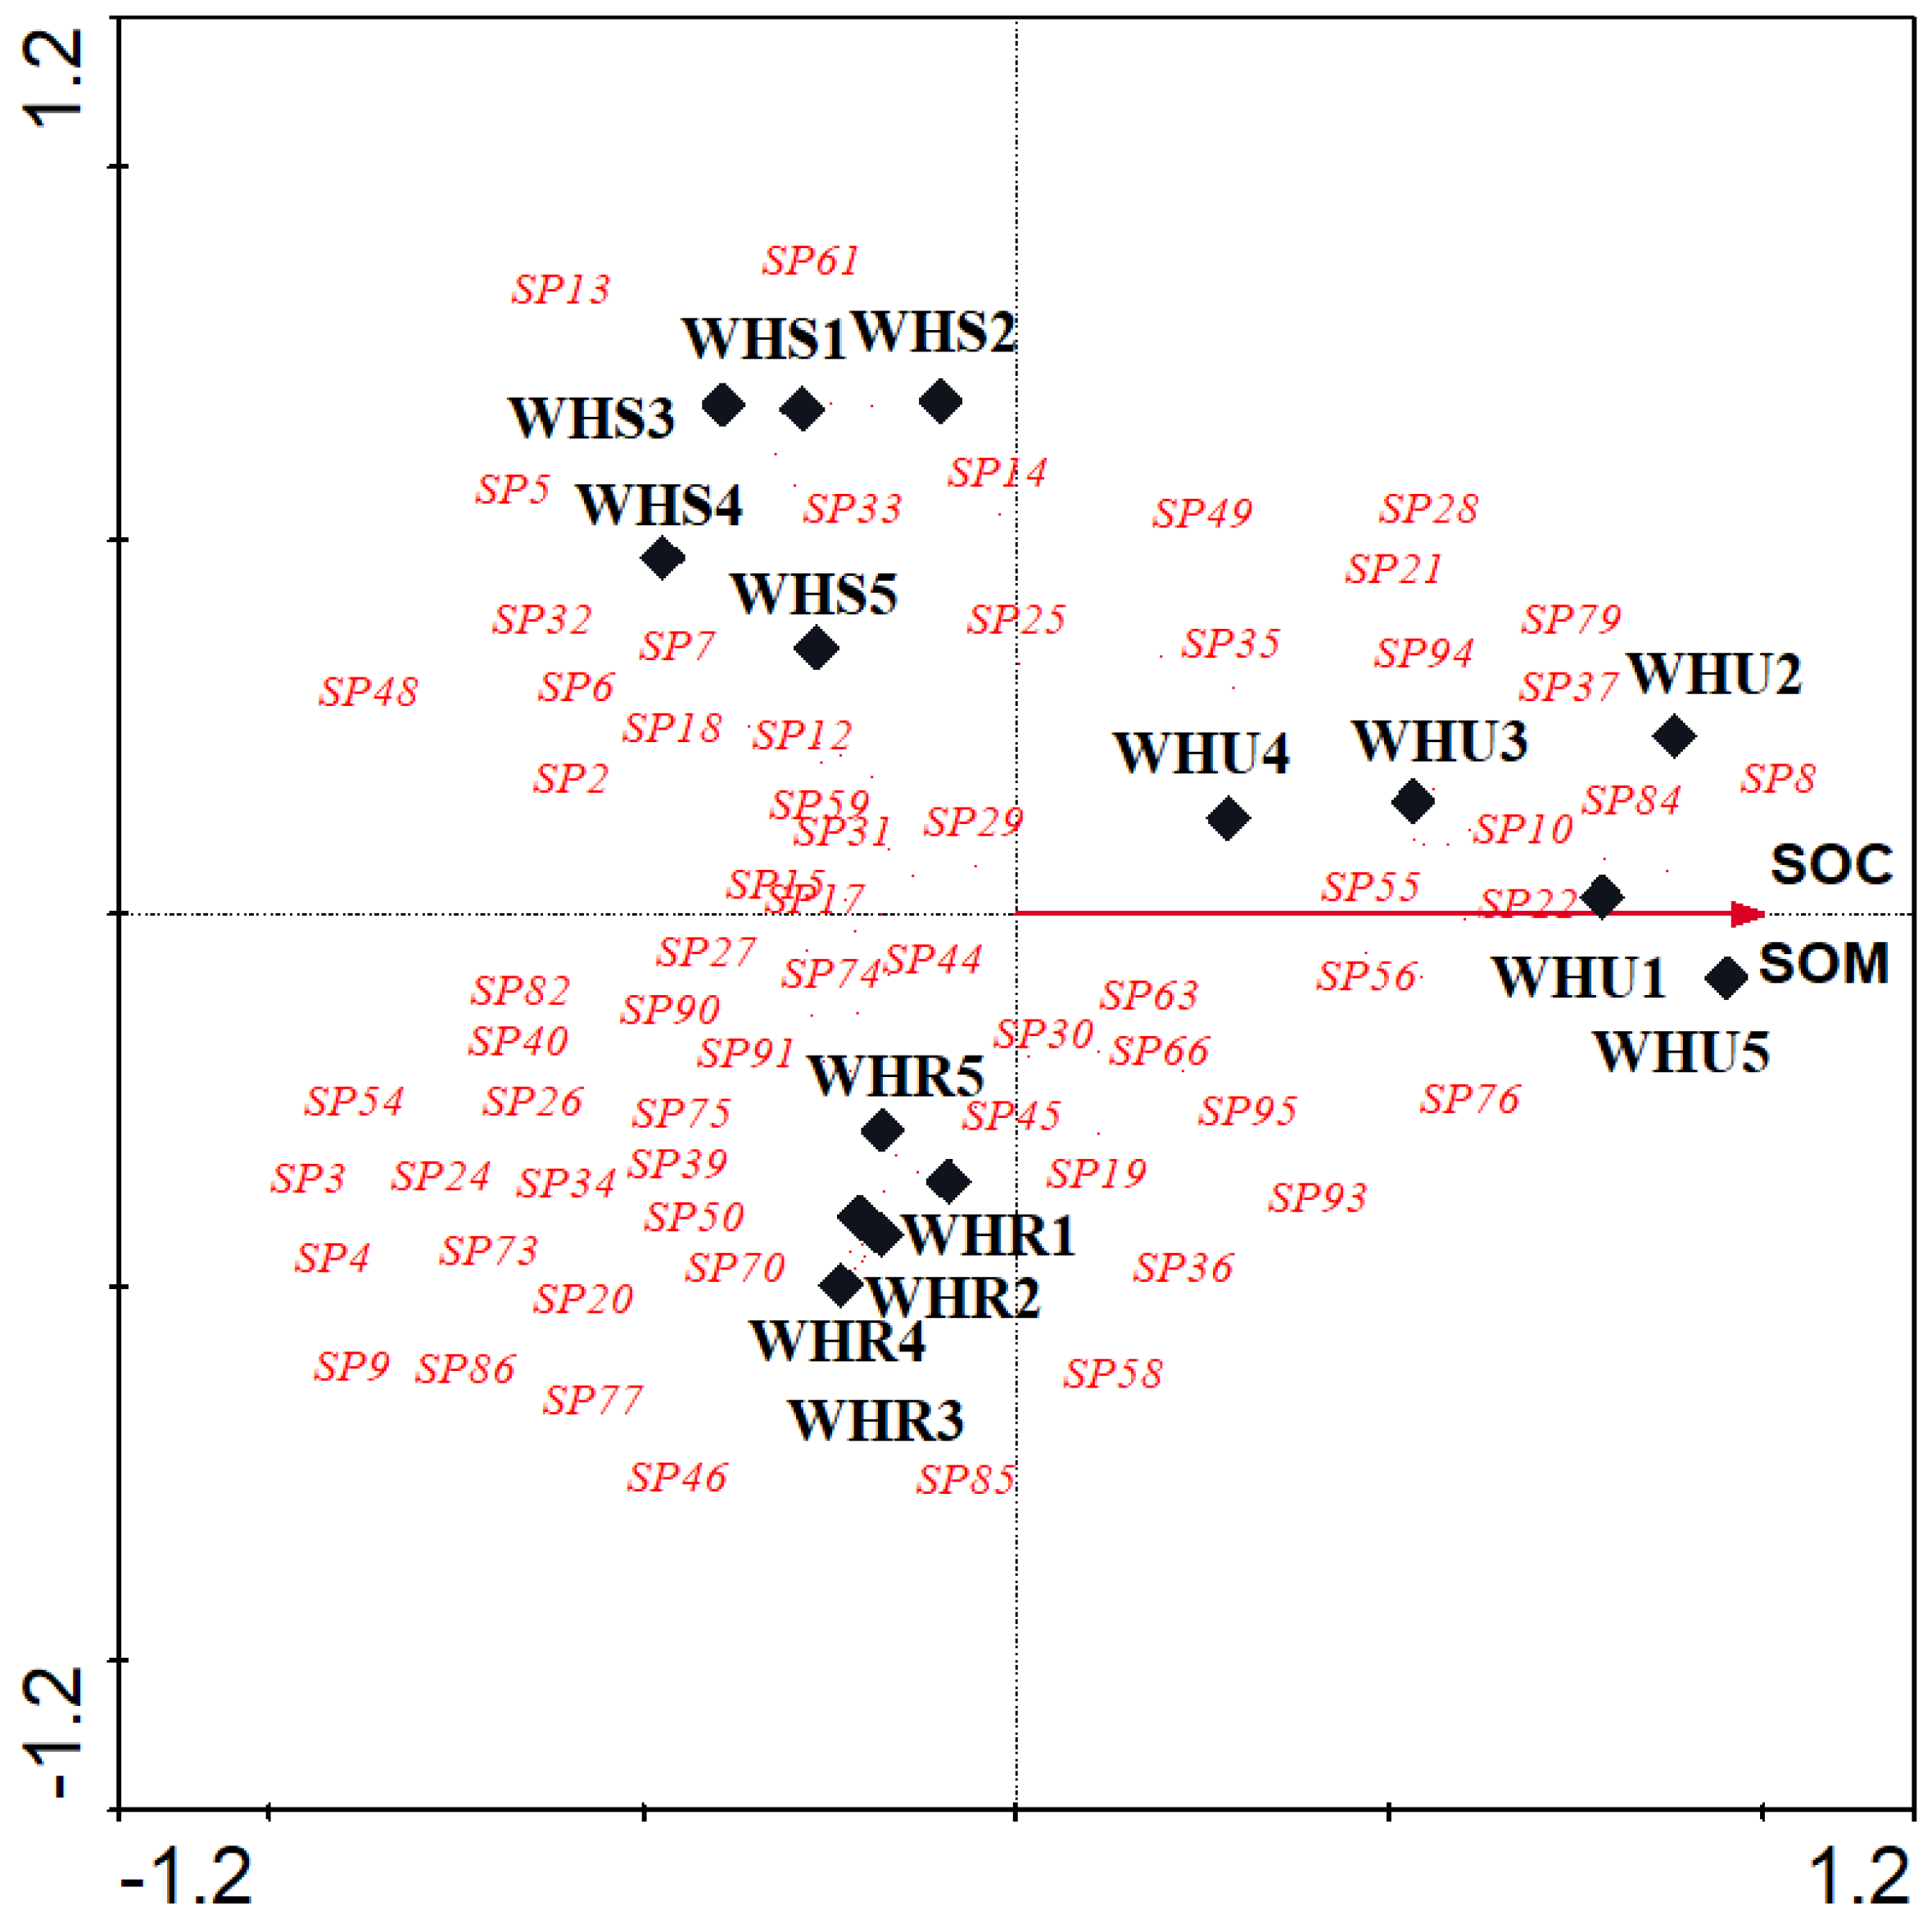
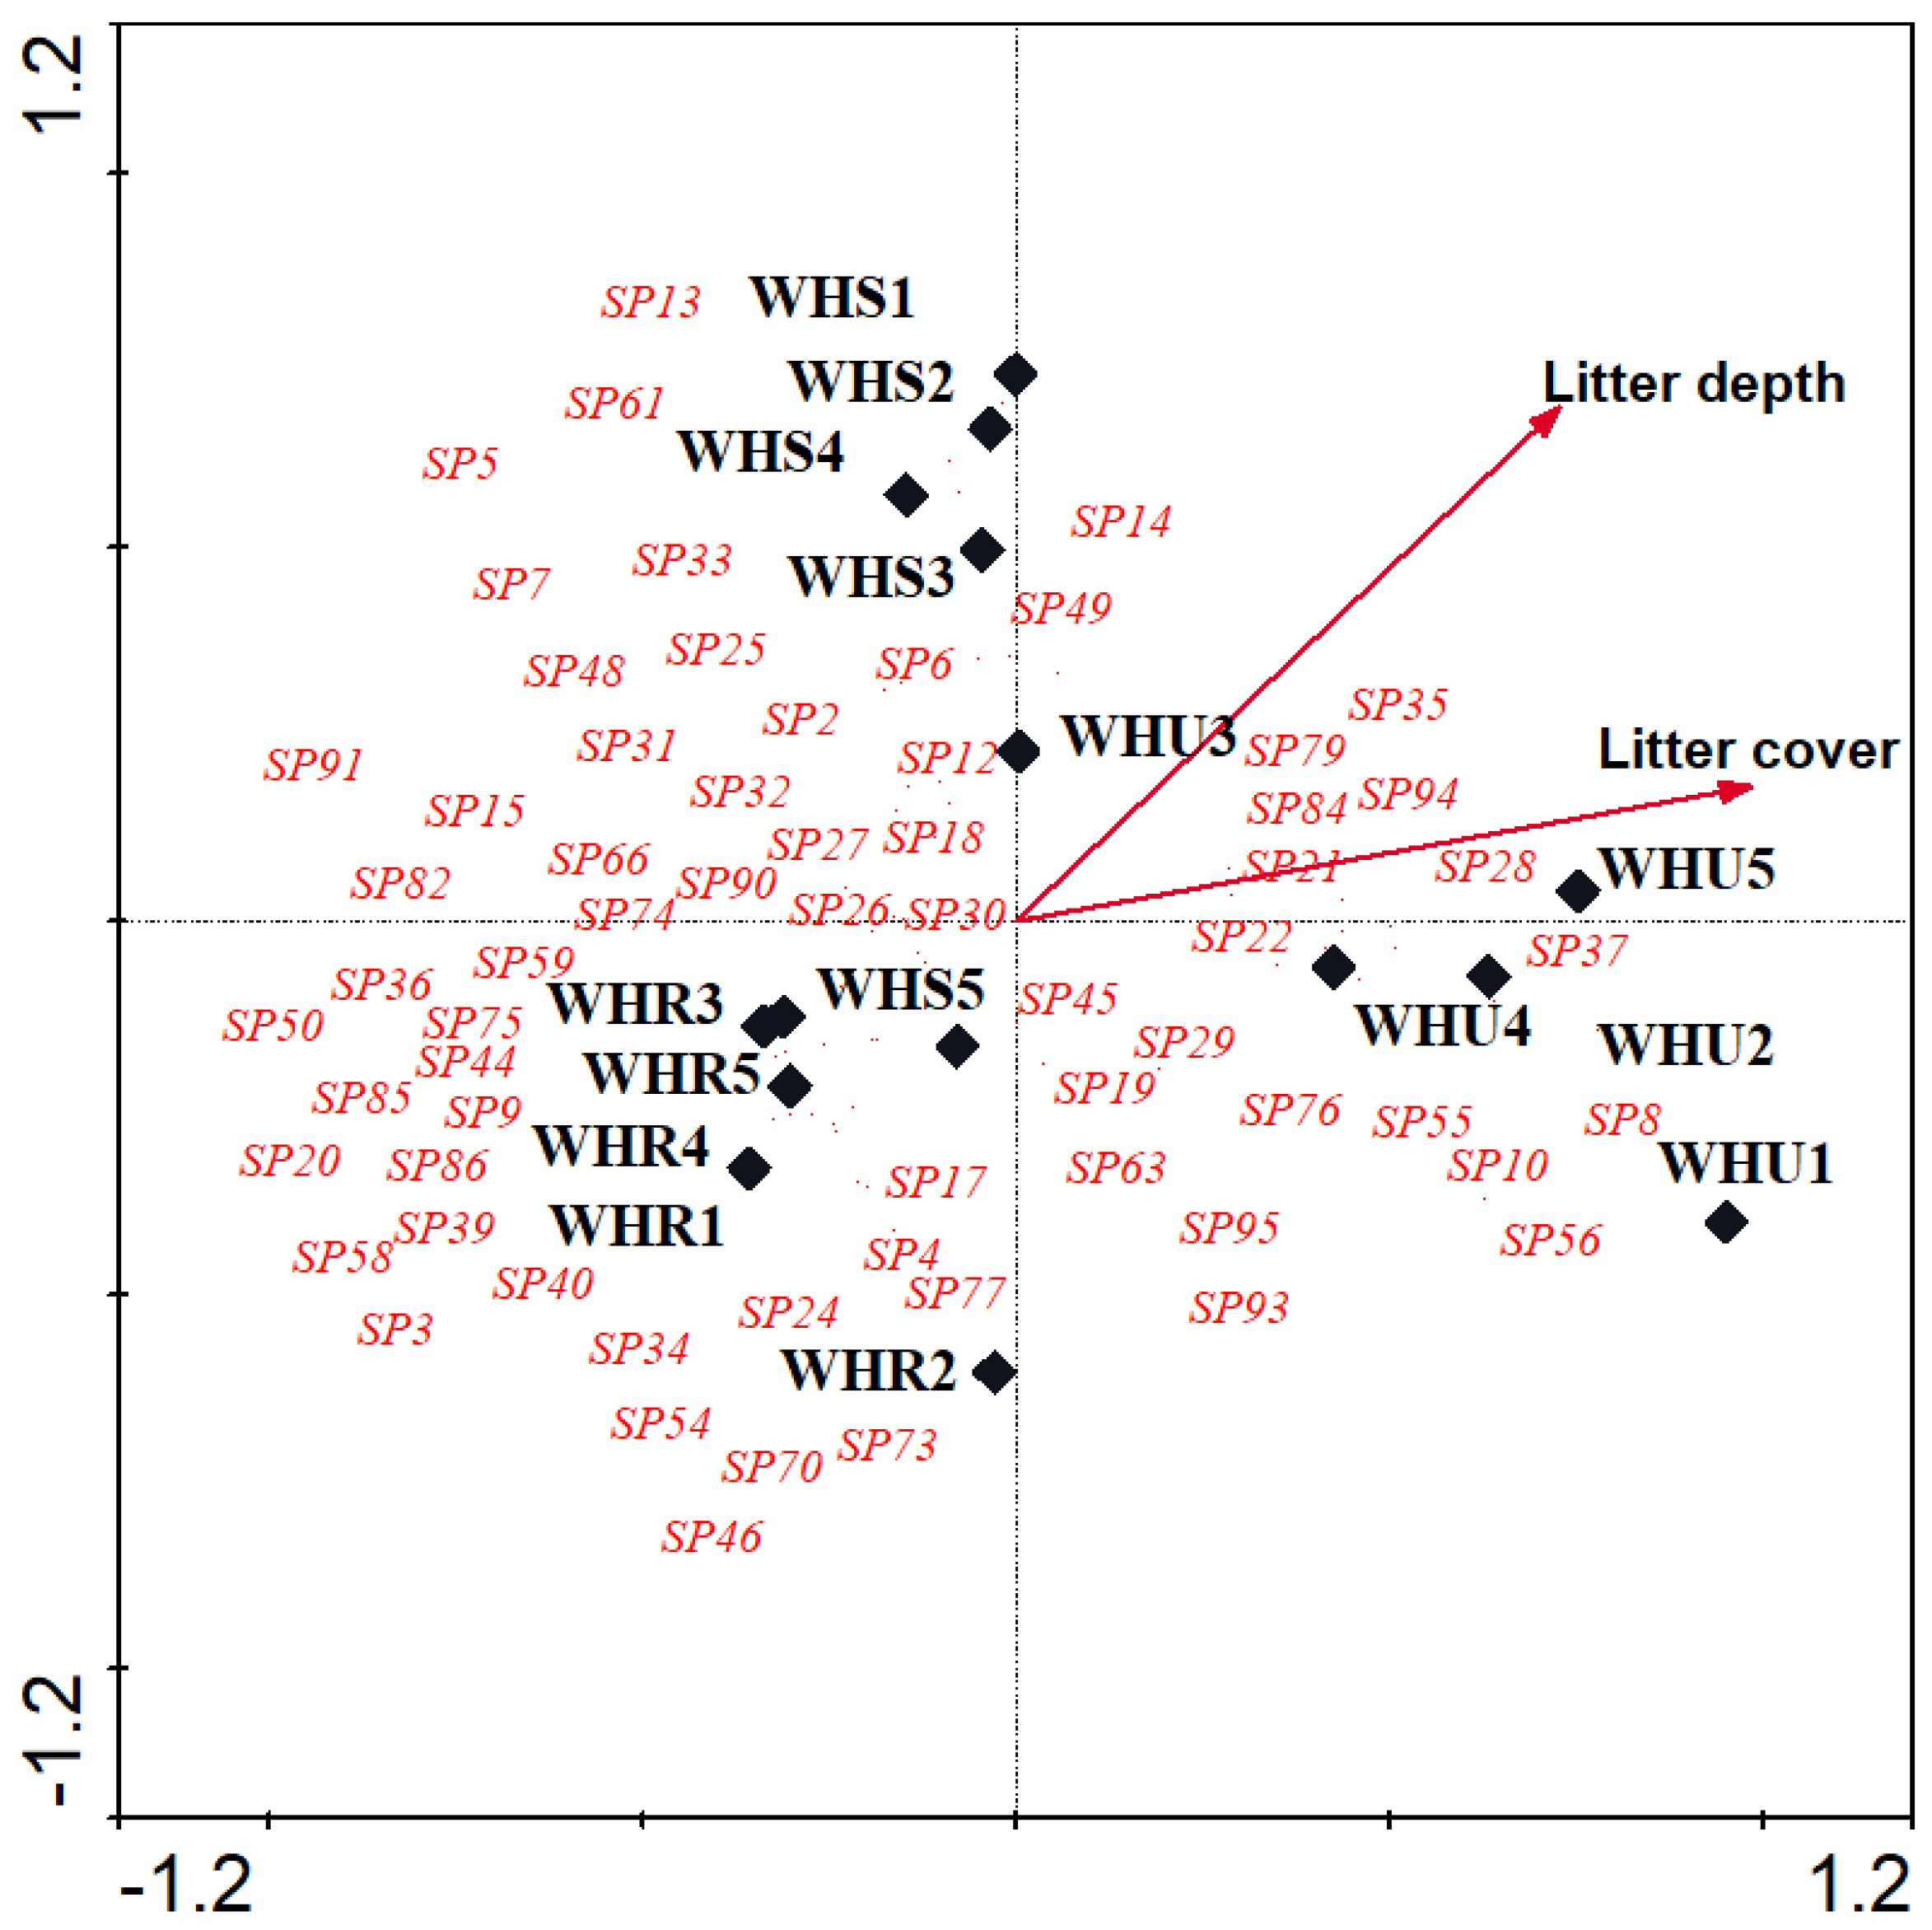
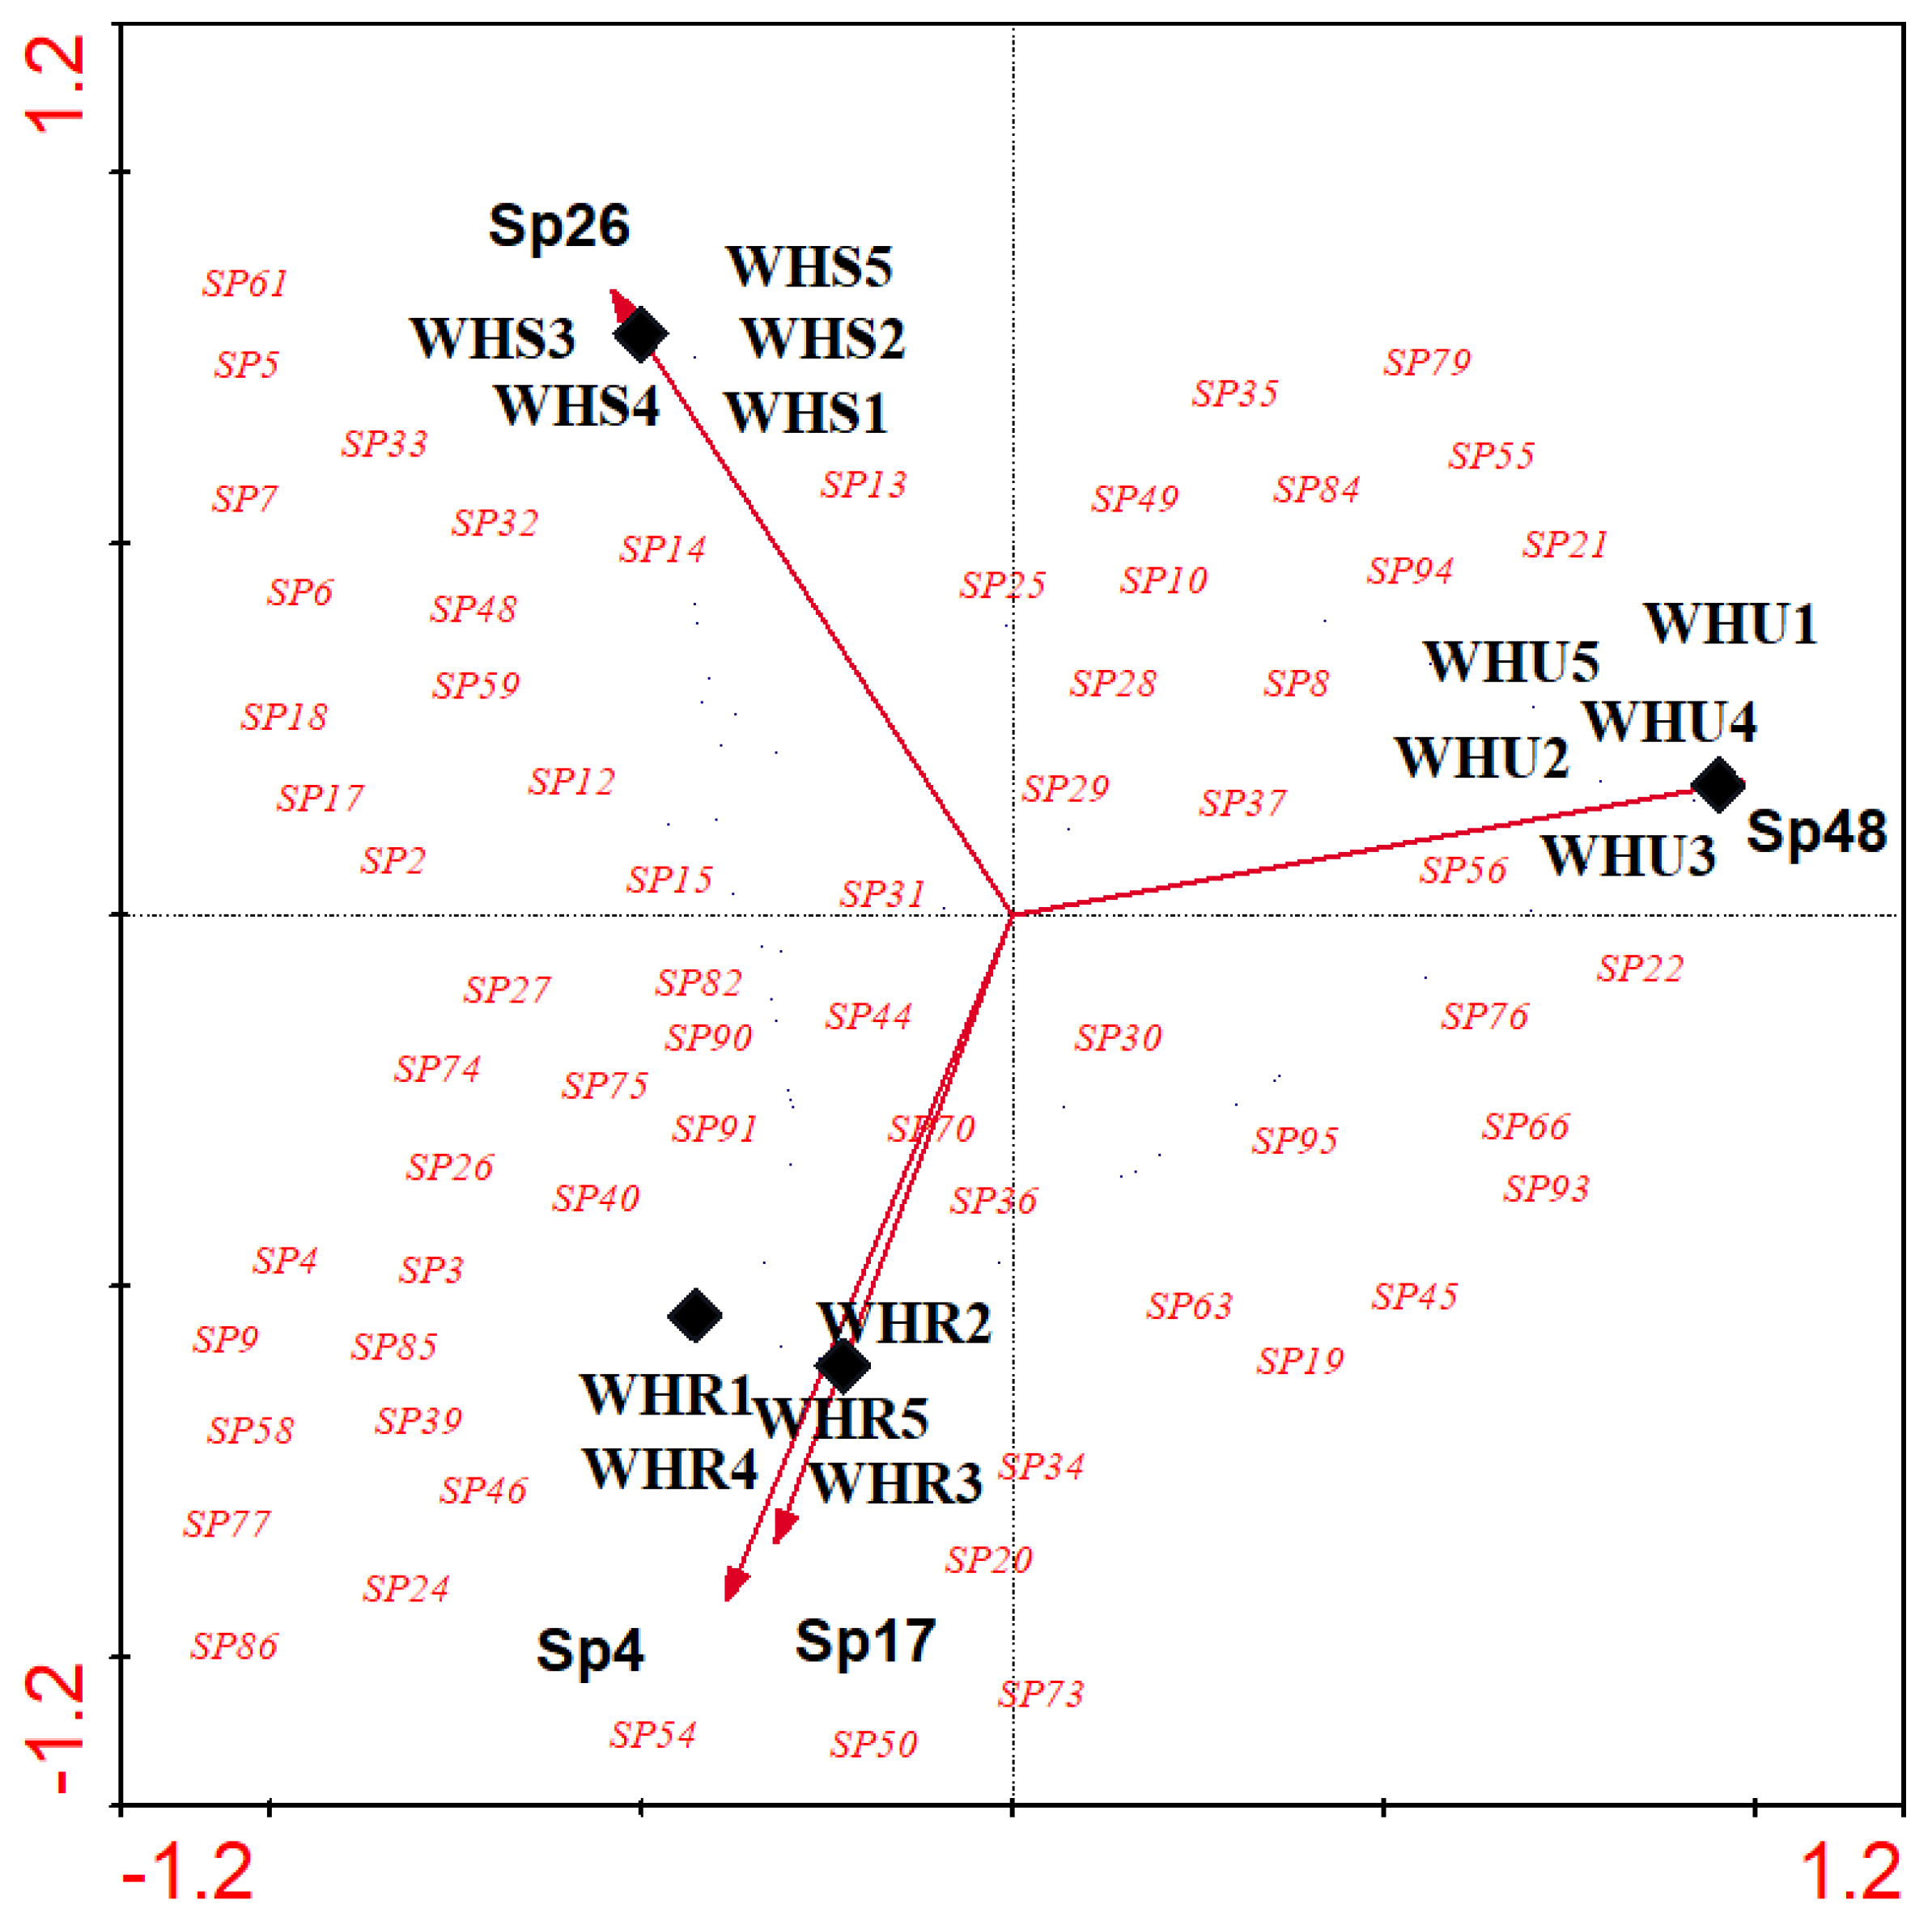
A distinct separation was observed along the urbanization gradient according to DCA analysis. In contrast to the DCA (Figure 3), the CCA produced similar ordination patterns, with most sites remaining in their respective divided groups (Figure 4, Figure 5, Figure 6 and Figure 7). DCA and CCA yielded small eigenvalue reductions, indicating that this study may have missed other less critical environmental variables. The CCAs considered a variety of environmental variables, including urbanization (3 variables), elevation, soil (7 variables), land cover (5 variables), and flora (43 species). Nevertheless, only urbanization levels (3 variables), soil (1 variable), and land cover (2 variables) were retained in the models, along with four species of flora. The CCAs identified buildings, pavements, roads and asphalt, elevation, soil organic carbon (SOC), soil organic matter (SOM), % litter cover, litter depth, A. graecorum, H. currasavicum, L. capitata and L. shawii as essential with beetle species composition/sites (Mnte Carlo permutation test, P<0.05) (Table 2, Figure 4, Figure 5, Figure 6 and Figure 7).
In terms of DCA axis 1 and 2, 15 sites were plotted and clustered into three groups based on urbanization gradients, with eigenvalues of 0.56 and 0.24, respectively (Figure 3). Across axis 1, the urban habitat is separated on the right end and is dominated by Endomia lefebvrei, Sclerum orientalis, and A. caeruleipennis. At the left end, however, suburban and rural habitats were found. CCA (Figure 4, Figure 5, Figure 6 and Figure 7) interprets axis 1 as urbanization level, organic contents, and litter, and these variables increase from left to right along axis 1. The rural sites (WHR1‒5), along with one suburban site (WHS5), were located on the negative part of axis 2 and were dominated by A. stoeckleini, Oxycara saudarabica, and Scleropatroides sp. The rest of the suburban sites (WHS1‒4) were placed on the positive side of axis 2, with their characteristic beetle species Pimelia thomasi thomasi, Z. punctate, and Rhyssemus saudi. Axis 2 was interpreted as an elevation gradient. Similarity levels among the three urbanization gradient sample groups differed significantly from each other based on ANOSIM (R = 0.97, P = 0.001).

3.3. Beetle indicator species

Based on their Indicator Values, beetle species were divided into three affinity groups (Table 3), namely: (1) species preferred the urban habitats (e.g., A. caeruleipennis, A. crinitus, E. lefebvrei, Gonocephalum besnardi, G. prolixum, G. rusticum, Maladera insanabilis, Microlestes infuscatus, Pentodon algerinus, S. orientalis); (2) species preferred the suburban habitat (e.g., Anthrenus malkini, G. soricinum, P. thomasi thomasi, R. saudi, Tentyrina deserta deserta, Z. punctate); and (3) species characteristic of the rural habitat (e.g., A. stoeckleini, Akis spinosa, Blaps kollari kollari, Eremolestes sulcatus, Mesolestes quadriguttatus, O. saudarabica, Scleropatroides sp.).

4. Discussion

Among the most important approaches to studying the effects of urbanization is the rural-urban gradient methodology. Nevertheless, most studies tend to be more varied and oversimplified when presuming linear patterns of change or difference [34]. Urbanization leads to habitat degradation, fragmentation, and loss, often associated with biodiversity loss and significant changes in species composition [16,18]. A significant potential benefit of urbanization is the promotion of urban adapters and exploiters, usually exotic generalist species [16,19]. Invertebrates are significantly impacted by urban gradients due to their capacity to capture a wide range of urban impacts [20,21]. Several factors contribute to the importance of the study area, including its status as a prominent natural landmark, its status as the largest and most important valley in Riyadh, and its position in the middle of the Najd Plateau of Saudi Arabia [29,35,36].

4.1. Beetle diversity

The preponderance of the family Tenebrionidae at these sites characterizes the insect fauna in arid and semi-arid environments. This result and those found previously in arid and semi-arid environments [26,37,38,39,40,41] both highlight a strong dominance of darkling beetles (Tenebrionidae), which indicates a highly adaptable beetle fauna. The high species richness (38.3% of total species) and abundance (60.1% of total catch) are due to this adaptation. All rural and suburban sites and 1-3 urban sites were dominated by tenebrionid species such as A. cancellate, M. puncticollis, and Trachyderma philistina were found to be the most abundant. In rural and suburban habitats (98.9%), they were more abundant than in urban habitats (1.1%). A decline in their number in urban habitats may be attributed to the alteration of microhabitats as a result of urbanization [21,42,43]. Another factor that may affect habitat choice [44] is the increasing temperature due to urbanization [45,46]. As urbanization progresses, the number of species-rich beetle habitats changes significantly, with rural habitats having a higher species richness than suburban and urban habitats. As surprising as it might seem, species abundance, evenness, and diversity were invariant along urbanization gradients despite the change in species richness. A possible explanation for this contradiction is the diverse reactions of beetle species to urbanization and their sensitivity to environmental changes. Some evidence suggests that poor dispersal species may have limited environmental tolerances and may be particularly sensitive to urbanization (e.g., Adoretus granulifrons, Micipsa arabica, Mycetocharina vanharteni, Schizonycha sp., and Sepidium tricuspidatum). Urban habitats provide a lower availability of resources (dung) than rural habitats, which limits the diversity of coprophilous species (species (e.g., some members of Glaresidae, Histeridae, and Scarabaeidae) [47]. The urbanization-induced conditions may also benefit generalists and widespread species (e.g., G. rusticum and T. philistina) and also generalist species (e.g., M. puncticollis and Thriptera kraatzi) [2,48].

4.2. Species composition

Overall diversity along the urbanization gradient generally displayed heterogeneous patterns [49]. Species, abundance, richness, and diversity of beetles showed one of three patterns. The first are those decrease along the rural-urban gradient [22,50,51,52,53,54]. Second, some species exhibit higher species richness and diversity in urban habitats than in rural areas [55,56,57,58,59]. Finally, there are those species that show no significant differences between urban and rural habitats [7,42,60,61,62,63,64]. Based on the results of all these studies, it seems that species richness, abundance, or diversity are not entirely appropriate parameters for assessing the effects of urbanization on soil and ground-dwelling beetles [2]. Species identity and associated natural history offer greater insight into a beetle composition in these habitats than species richness or diversity alone [41,65,66].
A range of factors, such as local urbanization intensity, edaphic factors [67,68,69], vegetation cover, and flora [42,70,71,72,73,74], contribute to variations in the distribution and composition of beetle species associations along Wadi Hanifa. As revealed by CCA, the most significant factors determining the distribution of beetles are urbanization intensities, elevation, soil organic contents, land cover, and flora. DCA has determined that the beetle list falls into three distinct clusters: urban, suburban, and rural. Each cluster contains a different assemblage of beetles (<9% of species shared). ANOSIM analysis confirmed this grouping (R = 0.97, P = 0.001), which aligns with previous reports on ant assemblages in the same area [28]. The increasing density of buildings, soil organic carbon, percentage and depth of litter cover, as well as the presence of H. currasavicum, all of which were strongly correlated with axis 1. There were small-sized (e.g., Gonocephalum spp., M. infuscatus, and S. orientalis) and scavenger and opportunistic predator beetle species (e.g., A. caeruleipennis, A. crinitus, and E. lefebvrei). Unlike axis 1, the second axis was associated with elevation and the predominant flora of A. graecorum, L. capitata, and L. shawii. In rural habitats, sites with a high elevation and dominant flora of L. capitata and L. shawii were associated with large, xerophilic species (e.g., Anthia duodecimguttata, A. spinosa, and B. kollari kollari), predators (e.g., E. sulcatus M. quadriguttatus), and detritivores (e.g., Scleropatroides sp.). There is a correlation between beetle assemblage structure and rural plants (L. capitata, L. shawii, and M. parviflora), suburban plants (Casuarina equisetifolia and A. graecorum), and urban plants (Panicum coloratum, Atriplex nummularia, and H. currasavicum). It appears that soil moisture and nutrients are similar among these groups [75,76]. The composition of beetle communities is generally influenced by the tree canopy and dense herb cover, which in turn impacts soil moisture, solar radiation, microclimate conditions, as well as the type of prey available [42,77,78].
Lack of management contributes to an increase in litter and logs [42]. In unmanaged urban sites within Wadi Hanifa, an increase in litter cover and depth has been observed due to the conversion of native flora to perennial vegetation and irrigation. As a result, a significant influence of leaf litter cover and depth was observed in our study on the composition of beetle communities. Litter layers are argued to sustain a significant portion of beetle diversity by creating favorable microenvironments [79,80,81] for prey [72] or larger polyphagous and generalist beetle species [58] and enhancing egg and larval development [56]. Nevertheless, this study found that species richness decreased in conjunction with litter percentage and depth increases. Guillemain et al. [82], Molnar et al. [83], and Fuller et al. [84] also demonstrated this negative correlation between leaf litter cover and beetle richness.
As a critical factor in soil characteristics, the organic content of soil (SOC, SOM) also plays a significant role [63,85,86]. Consequently, the insects inhabiting the soil significantly influence the number and composition of trapped beetle species [67,87,88,89]. A CCA analysis indicated that both SOC and SOM were higher at urban sites than at suburban and rural sites. This concurs with Asabere et al. [15], who found that dumping inorganic and organic materials and decaying plant material resulted in increased SOM and SOC in urban areas. A large number of small-sized beetles (e.g., Anthelephila caeruleipennis, A. crinitus, and Endomia lefebvrei) is indicative of this. These indicator beetles correlated positively with SCO and SOM in urban habitats, whereas SCO and SOM were negatively correlated with suburban and rural indicator beetles.
The construction of houses in urbanized communities leads to homogenized landscapes and uniform disturbance on all sites where topsoil is removed and replaced with pavement. The rigid surfaces (such as buildings, roads, and paving) not only seal off large soil areas but also enhance the proliferation of ruderal plant species. As a result, many soils and ground-dwelling animals' habitats are altered [21,42,43,90,91]. As one moves from the heart of Riyadh City to the south, the buildings, pavements, roads, and asphalt represent a gradient of urbanization intensity along Wadi Hanifa. Our urban study sites gradually became overrun with exotic plants such as A. nummularia, Pennisetum setaceum, and Phragmites australis as native vegetation was gradually replaced. As a result of human modification of habitats, certain types of beetles are more likely to survive, such as opportunistic predators (e.g., members of the family Anthicidae).

4.3. Beetle indicator species

According to New [24], the variation within each habitat can be explained by shifts in highly abundant species. Across the rural-urban gradient, beetle indicators differed in terms of their ecological factors. According to the present findings, urban sites that experienced the most disturbance differed from rural and suburban sites in composition. A total of 23 characteristic beetles have been identified, which have an essential role in determining the structure of the beetle assemblage, as shown by the ordination results. Urban habitats have a high content of indicator species (10 species), perhaps due to the high number of plants and trees [73,74]. The perennial vegetation and the irrigation in unmanaged urban areas may act as source habitat for herbivores (e.g., M. insanabilis, P. algerinus, and Gonocephalum spp.) and opportunistic predators (e.g., members of Anthicidae) [58]. With increasing levels of anthropogenic disturbance, urban habitats can retain some species from the natural habitats (e.g., M. puncticollis, T. kraatzi, and T. philistina). However, their richness and abundance will also decrease [62]. The occurrence of native, habitat-specific beetles (e.g., B. wittmeri and members of family Elateridae) in rural areas tend to be higher than in urban areas [42,92,93].

5. Conclusions

In response to urbanization, beetle species composition has significantly changed, resulting in heterogeneous diversity patterns [49] and subsequent loss of native species [16,18]. The study found that local edaphic factors, vegetation cover, and flora can drive changes in the number of species and composition of beetles along rural-urban gradients. In arid ecosystems, darkling beetles (Tenebrionidae) are conspicuous components that may help to illustrate biodiversity changes in response to various environmental changes. Several interactions and responses have been observed due to different levels of urbanization and environmental factors, including changes in the small species, native species, generalists, coprophilous species, and opportunistic species. Our study concludes that species richness, abundance, and diversity are not entirely appropriate parameters to assess the impact of urbanization on soil and ground-dwelling insects [2,28]. In fact, the composition of beetles is quite fundamental, and studying species identity and associated natural history will provide a much deeper understanding of environmental changes than focusing solely on species richness and diversity [41,65,66]. It is also necessary to investigate the response of insect-feeding guilds to the microhabitat alterations due to urbanization in Saudi Arabia, as these issues need to be addressed in future research.

Supplementary Materials

Table S1: List of ground-dwelling beetles and their abundance along the rural-urban gradient in Wadi Hanifa, Riyadh, Saudi Arabia.

Author Contributions

Conceptualization, M.S.A., M.R.S., J.D.M. and G.M.O.; methodology, M.S.A., J.D.M., M.K.A., A.S.A., H.M.A. and G.M.O.; validation, M.R.S., A.M.S., A.S.A. and H.M.A.; formal analysis, M.S.A., J.D.M. and G.M.O.; investigation, M.S.A., M.R.S., M.K.A., A.M.S., A.S.A. and H.M.S.; resources, A.M.S.; data curation, M.SA., M.R.S. and G.M.O..; writing—original draft preparation, M.S.A. and G.M.O.; writing—review and editing, all authors ; visualization, M.S.A., J.D.M. and G.M.O.; supervision, M.K.A. and M.R.S..; project administration, H.M.A.; funding acquisition, M.S.A. All authors have read and agreed to the published version of the manuscript.

Funding

This research was funded by The King Abdulaziz City for Science and Technology, National Plan for Science, Technology and Innovation (NSTIP), King Saud University, grant number 12-ENV2804-02.

Institutional Review Board Statement

Not applicable.

Data Availability Statement

The data presented in this study are available in Supplementary Material here.

Acknowledgments

The authors thank the King Saud University Museum of Arthropods team for assisting in the field work and sorting the collected specimens.

Conflicts of Interest

The authors declare no conflict of interest.

References

  1. Antrop, M. Changing patterns in the urbanized countryside of Western Europe. Landsc. Ecol. 2000, 15, 257-270. [CrossRef]
  2. Magura, T.; Lövei, G.L. Consequences of Urban Living: Urbanization and Ground Beetles. Curr. Landsc. Ecol. Rep. 2021, 6, 9-21. [CrossRef]
  3. Chaolin, G. Urbanization. In International Encyclopedia of Human Geography, Kobayashi, A., Ed.; Elsevier: Oxford, 2020; Volume 14, pp. 141-153.
  4. UnitedNations. World Urbanization Prospects: The 2014 Revision: Highlights in P.D. . Available online: https://population.un.org/wup/publications/files/wup2014-report.pdf (accessed on April, 11).
  5. McDonnell, M.J.; Pickett, S.T.A.; Groffman, P.; Bohlen, P.; Pouyat, R.V.; Zipperer, W.C.; Parmelee, R.W.; Carreiro, M.M.; Medley, K. Ecosystem processes along an urban-to-rural gradient. Urban Ecosyst. 1997, 1, 21-36. [CrossRef]
  6. Piano, E.; De Wolf, K.; Bona, F.; Bonte, D.; Bowler, D.E.; Isaia, M.; Lens, L.; Merckx, T.; Mertens, D.; van Kerckvoorde, M.; et al. Urbanization drives community shifts towards thermophilic and dispersive species at local and landscape scales. Glob. Chang. Biol. 2017, 23, 2554-2564. [CrossRef]
  7. Kwon, T.-S.; Kim, Y.S.; Lee, S.W.; Park, Y.-S. Changes of soil arthropod communities in temperate forests over 10 years (1998–2007). J. Asia-Pacif. Entomol. 2016, 19, 181-189. [CrossRef]
  8. Parris, K.M. Ecology of Urban Environments, First ed.; Wiley-Blackwell: New York, United States, 2016; p. 240.
  9. Parris, K.M.; Schneider, A. Impacts of Traffic Noise and Traffic Volume on Birds of Roadside Habitats. Ecol. Soc. 2009, 14. [CrossRef]
  10. Rotholz, E.; Mandelik, Y. Roadside habitats: effects on diversity and composition of plant, arthropod, and small mammal communities. Biodivers. Conserv. 2013, 22, 1017-1031. [CrossRef]
  11. Small, E.C.; Sadler, J.P.; Telfer, M.G. Carabid beetle assemblages on urban derelict sites in Birmingham, UK. J. Insect Conserv. 2002, 6, 233-246. [CrossRef]
  12. Tóthmérész, B.; Máthé, I.; Balázs, E.; Magura, T. Responses of carabid beetles to urbanization in Transylvania (Romania). Landsc. Urban Plan. 2011, 101, 330-337. [CrossRef]
  13. Piano, E.; Bona, F.; Isaia, M. Urbanization drivers differentially affect ground arthropod assemblages in the city of Turin (NW-Italy). Urban Ecosyst. 2020, 23, 617-629. [CrossRef]
  14. Al-Homaidan, A.A.; Al-Ghanayem, A.A.; Alkhalifa, A.H. Green algae as bioindicators of heavy metal pollution in Wadi Hanifah Stream, Riyadh, Saudi Arabia. Int. j. water resour. 2011, 1, 10-15.
  15. Asabere, S.B.; Zeppenfeld, T.; Nketia, K.A.; Sauer, D. Urbanization Leads to Increases in pH, Carbonate, and Soil Organic Matter Stocks of Arable Soils of Kumasi, Ghana (West Africa). Front. Environ. Sci. 2018, 6. [CrossRef]
  16. Kark, S.; Iwaniuk, A.; Schalimtzek, A.; Banker, E. Living in the city: can anyone become an ‘urban exploiter'? J. Biogeogr. 2007, 34, 638-651. [CrossRef]
  17. McKinney, M.L. Effects of urbanization on species richness: A review of plants and animals. Urban Ecosyst. 2008, 11, 161-176. [CrossRef]
  18. Knop, E. Biotic homogenization of three insect groups due to urbanization. Glob. Chang. Biol. 2016, 22, 228-236. [CrossRef]
  19. McKinney, M.L. Urbanization as a major cause of biotic homogenization. Biol. Conserv. 2006, 127, 247-260. [CrossRef]
  20. Pickett, S.T.A.; Cadenasso, M.L.; Grove, J.M.; Nilon, C.H.; Pouyat, R.V.; Zipperer, W.C.; Costanza, R. Urban Ecological Systems: Linking Terrestrial Ecological, Physical, and Socioeconomic Components of Metropolitan Areas. Annu. Rev. Ecol. Syst. 2001, 32, 127-157. [CrossRef]
  21. New, T.R. Insect conservation and urban environments, First ed.; Springer Cham: Switzerland, 2015; p. 244.
  22. Niemelä, J.; Kotze, D.J. Carabid beetle assemblages along urban to rural gradients: A review. Landsc. Urban Plan. 2009, 92, 65-71. [CrossRef]
  23. Bouchard, P.; Grebennikov, V.V.; Smith, A.B.T.; Douglas, H. Biodiversity of Coleoptera. In Insect biodiversity: science and society, Foottit, R.G., Adler, P.H., Eds.; Wiley-Blackwell: West Sussex, UK, 2009; pp. 265-301.
  24. New, T.R. Beetles in conservation, First ed.; Springer: Dordrecht, Netherlands, 2010; p. 246.
  25. NCWCD. The national strategy for conservation of biodiversity in the Kingdom of Saudi Arabia. Available online: http://www.cbd.int/doc/world/sa/sa-nbsap-01-en.pdf. (accessed on 11 April 2022).
  26. Aldryhim, Y.N.; Mills, C.W.; Aldawood, A.S. Ecological distribution and seasonality of darkling beetles (Coleoptera: Tenebrionidae) in the central region of Saudi Arabia. J. Arid Environ. 1992, 23, 415-422. [CrossRef]
  27. Al-Dawood, A.S.; Alahmed, A.M.; Kheir, S.M.; Hussein, S.M. Population dynamics of sandflies (Diptera: Psychodidae) in Hanifah valley, Riyadh, Saudi Arabia. Pak. J. biol. Sci 2004, 7, 464-467. [CrossRef]
  28. Abdel-Dayem, M.S.; Sharaf, M.R.; Majer, J.D.; Al-Sadoon, M.K.; Aldawood, A.S.; Aldhafer, H.M.; Orabi, G.M. Ant diversity and composition patterns along the urbanization gradients in an arid city. J. Nat. Hist. 2021, 55, 2521-2547. [CrossRef]
  29. al-Asad, M.; Yavuz, Y. Wadi Hanifah Wetland. Available online: https://archive.archnet.org/sites/4458/publications/1206 (accessed on 23 Dec 2023).
  30. Samhouri, W. On Site Review Report: Wadi Hanifa Wetlands. Available online: http://archnet.org (accessed on 23 Dec 2022).
  31. Ter Braak, C.J. Canonical community ordination. Part I: Basic theory and linear methods. Ecoscience 1994, 1, 127-140. [CrossRef]
  32. Ter Braak, C.J. Canonical correspondence analysis: a new eigenvector technique for multivariate direct gradient analysis. Ecology 1986, 67, 1167-1179. [CrossRef]
  33. Dufrêne, M.; Legendre, P. Species assemblages and indicator species: the need for a flexible asymmetrical approach. Ecol. Monogr. 1997, 67, 345-366. [CrossRef]
  34. Ramalho, C.E.; Hobbs, R.J. Time for a change: dynamic urban ecology. Trends Ecol. Evol. 2012, 27, 179-188. [CrossRef]
  35. Alhamid, A.A.; Alfayzi, S.A.; Hamadto, M.A. A sustainable water resources management plan for Wadi Hanifa in Saudi Arabia. J. King Saud Univ. Sci. 2007, 19, 209-221. [CrossRef]
  36. Al-Obaid, S.; Samraoui, B.; Thomas, J.; El-Serehy, H.A.; Alfarhan, A.H.; Schneider, W.; O’connell, M. An overview of wetlands of Saudi Arabia: Values, threats, and perspectives. Ambio 2017, 46, 98-108. [CrossRef]
  37. Faragalla, A.; Adam, E. Pitfall trapping of tenebrionid and carabid beetles (Coleoptera) in different habitats of the Central Region of Saudi Arabia. J. Appl. Entomol. 1985, 99, 466-471. [CrossRef]
  38. Abdel-Dayem, M.S.; Orabi, G.M.; Semida, F.M. Assessing the potential role of beetles as bioindicators in south Sinai, Egypt. In Proceedings of the Second International Conference of Entomological Society of Egypt, Cairo, Egypt, 8-11 December 2007.
  39. Piñero, F.; Tinaut, A.; Aguirre-Segura, A.; Miñano, J.; Lencina, J.; Ortiz-Sánchez, F.; Pérez-López, F. Terrestrial arthropod fauna of arid areas of SE Spain: Diversity, biogeography, and conservation. J. Arid Environ. 2011, 75, 1321-1332. [CrossRef]
  40. El Surtasi, E.I.; Semida, F.M.; Abdel-Dayem, M.S.; El Bokl, M.M. The threat of urbanization on beetle diversity in New Damietta City, Egypt. Nat. Sci. Sleep. 2012, 10, 15-23.
  41. Aldhafer, H., M., Abdel-Dayem, Mahmoud, S. ; Aldryhim, Y., N. ; Fadl, H., H. ; El-Torkey, A., M.; Elgharbawy, A., A. ; Setyaningrum, H.; . Diversity and composition of ground-dwelling beetle assemblages (Insecta: Coleoptera) in Rawdhat Khorim National Park, Kingdom of Saudi Arabia. J. Arid Environ. 2016, 127, 187-191. [CrossRef]
  42. Magura, T.; Tóthmérész, B.; Molnár, T. A species-level comparison of occurrence patterns in carabids along an urbanisation gradient. Landsc. Urban Plan. 2008, 86, 134-140. [CrossRef]
  43. Bennett, A.B.; Gratton, C. Measuring natural pest suppression at different spatial scales affects the importance of local variables. Environ. Entomol. 2012, 41, 1077-1085. [CrossRef]
  44. Ismail, O.K.; Bartholomew, A. Increased preference of darkling beetles Akis subtricostata Redtenbacher, 1850 and Trachyderma philistina Reiche and Saulcy, 1857 (Coleoptera, Tenebrionidae) for vegetation with increasing temperature. Bull. Iraq Nat. Hist. Mus. 2020, 16, 113-124. [CrossRef]
  45. Pickett, S.T.; Cadenasso, M.L.; Grove, J.M.; Boone, C.G.; Groffman, P.M.; Irwin, E.; Kaushal, S.S.; Marshall, V.; McGrath, B.P.; Nilon, C.H. Urban ecological systems: Scientific foundations and a decade of progress. J. Environ. Manage. 2011, 92, 331-362. [CrossRef]
  46. Qiu, J.; Yang, X.; Cao, B.; Chen, Z.; Li, Y. Effects of urbanization on regional extreme-temperature changes in China, 1960–2016. Sustainability 2020, 12, 6560. [CrossRef]
  47. Foster, C.W.; Kelly, C.; Rainey, J.J.; Holloway, G.J. Effects of urbanisation and landscape heterogeneity mediated by feeding guild and body size in a community of coprophilous beetles. Urban Ecosyst. 2020, 23, 1063-1077. [CrossRef]
  48. Park, J.-W.; Lee, C.M. Response of Ground Beetle (Coleoptera: Carabidae) Communities to Effect of Urbanization in Southern Osaka: An Analytical Approach Using GIS. Sustainability 2021, 13, 7134. [CrossRef]
  49. Magura, T.; Horváth, R.; Tóthmérész, B. Effects of urbanization on ground-dwelling spiders in forest patches, in Hungary. Landsc. Ecol. 2010, 25, 621-629. [CrossRef]
  50. Gaublomme, E.; Hendrickx, F.; Dhuyvetter, H.; Desender, K. The effects of forest patch size and matrix type on changes in carabid beetle assemblages in an urbanized landscape. Biol. Conserv. 2008, 141, 2585-2596. [CrossRef]
  51. Philpott, S.M.; Cotton, J.; Bichier, P.; Friedrich, R.L.; Moorhead, L.C.; Uno, S.; Valdez, M. Local and landscape drivers of arthropod abundance, richness, and trophic composition in urban habitats. Urban Ecosyst. 2014, 17, 513-532. [CrossRef]
  52. Vergnes, A.; Pellissier, V.; Lemperiere, G.; Rollard, C.; Clergeau, P. Urban densification causes the decline of ground-dwelling arthropods. Biodivers. Conserv. 2014, 23, 1859-1877. [CrossRef]
  53. Egerer, M.H.; Arel, C.; Otoshi, M.D.; Quistberg, R.D.; Bichier, P.; Philpott, S.M. Urban arthropods respond variably to changes in landscape context and spatial scale. J. Urban Ecol. 2017, 3, jux001. [CrossRef]
  54. Chiu, M.-C.; Chou, T.-Y.; Kuo, M.-H. Seasonal patterns of stream macroinvertebrate communities in response to anthropogenic stressors in monsoonal Taiwan. J. Asia-Pacif. Entomol. 2018, 21, 423-429. [CrossRef]
  55. Eversham, B.C.; Roy, D.B.; Telfer, M.G. Urban, industrial and other manmade sites as analogues of natural habitats for Carabidae. In Proceedings of the Ann. Zool. Fenn., 1996; pp. 149-156.
  56. Magura, T.; Tóthmérész, B.; Molnár, T. Changes in carabid beetle assemblages along an urbanisation gradient in the city of Debrecen, Hungary. Landsc. Ecol. 2004, 19, 747-759. [CrossRef]
  57. Zolotarev, M.P.; Belskaya, E.A. Ground-dwelling invertebrates in a large industrial city: Differentiation of recreation and urbanization effects. Contemp. Probl. Ecol. 2015, 8, 83-90. [CrossRef]
  58. Philpott, S.M.; Albuquerque, S.; Bichier, P.; Cohen, H.; Egerer, M.H.; Kirk, C.; Will, K.W. Local and Landscape Drivers of Carabid Activity, Species Richness, and Traits in Urban Gardens in Coastal California. Insects 2019, 10, 112. [CrossRef]
  59. Castro, A.V.; Porrini, D.P.; Lupo, S.; Cicchino, A.C. Minimal stories in Southeast Buenos Aires grasslands: carabid beetle biodiversity throughout an urban-rural gradient. Urban Ecosyst. 2020, 23, 331-343. [CrossRef]
  60. Pywell, R.F.; James, K.L.; Herbert, I.; Meek, W.R.; Carvell, C.; Bell, D.; Sparks, T.H. Determinants of overwintering habitat quality for beetles and spiders on arable farmland. Biol. Conserv. 2005, 123, 79-90. [CrossRef]
  61. Deichsel, R. Species change in an urban setting—ground and rove beetles (Coleoptera: Carabidae and Staphylinidae) in Berlin. Urban Ecosyst. 2006, 9, 161-178. [CrossRef]
  62. Elek, Z.; Lövei, G.L. Patterns in ground beetle (Coleoptera: Carabidae) assemblages along an urbanisation gradient in Denmark. Acta Oecol. 2007, 32, 104-111. [CrossRef]
  63. Do, Y.; Lineman, M. Effects of agricultural abandonment on carabid beetles in paddy fields. Balt. J. Coleopterol. 2012, 12, 65-75.
  64. Fusco, N.A.; Zhao, A.; Munshi-South, J. Urban forests sustain diverse carrion beetle assemblages in the New York City metropolitan area. PeerJ 2017, 5, e3088. [CrossRef]
  65. Work, T.T.; Shorthouse, D.P.; Spence, J.R.; Volney, W.J.A.; Langor, D. Stand composition and structure of the boreal mixedwood and epigaeic arthropods of the Ecosystem Management Emulating Natural Disturbance (EMEND) landbase in northwestern Alberta. Can. J. For. Res. 2004, 34, 417-430. [CrossRef]
  66. Orabi, G.M.; Semida, F.M.; Abdel-Dayem, M.S.; Sharaf, M.R.; Zalat, S.M. Diversity patterns of ants along an elevation gradient at St. Catherine Protectorate, South Sinai, Egypt. Zool. Middle East 2011, 54, 101-112. [CrossRef]
  67. Liu, J.-L.; Li, F.-R.; Liu, C.-A.; Liu, Q.-J. Influences of shrub vegetation on distribution and diversity of a ground beetle community in a Gobi desert ecosystem. Biodivers. Conserv. 2012, 21, 2601-2619. [CrossRef]
  68. Kosewska, A.; Nietupski, M.; Damszel, M. Role of urban forests as a source of diversity of carabids (Coleoptera: Carabidae) in urbanised areas. Balt. J. Coleopterol. 2013, 13, 27-39.
  69. Belskaya, E.; Zolotarev, M.; Zinovyev, E. Carabidae assemblages in pine forests with different recreation regimes within and outside a megalopolis. Urban Ecosyst. 2020, 23, 27-38. [CrossRef]
  70. Niemelä, J.; Haila, Y.; Halme, E.; Lahti, T.; Pajunen, T.; Punttila, P. The distribution of carabid beetles in fragments of old coniferous taiga and adjacent managed forest. Ann. Zool. Fenn. 1988, 25, 107-119.
  71. Nietupski, M. Assemblages of epigeic Carabidae [Col.] in a peatbog nature reserve situated in an urban area. Pol. J. Nat. Sci. 2008, 23, 611-623. [CrossRef]
  72. Seibold, S.; Bässler, C.; Baldrian, P.; Reinhard, L.; Thorn, S.; Ulyshen, M.D.; Weiß, I.; Müller, J. Dead-wood addition promotes non-saproxylic epigeal arthropods but effects are mediated by canopy openness. Biol. Conserv. 2016, 204, 181-188. [CrossRef]
  73. Ouchtati, N.; Brandmayr, P.; Saouache, Y. A comparative analysis of the community of carabid beetles associated with two native xerophytic shrub species (Atriplex halimus L. and Artemisia herba alba L.) in the semi-arid zone of Algeria. Afr. Entomol. 2020, 28, 164-174, 111. [CrossRef]
  74. Ariza, G.M.; Jácome, J.; Esquivel, H.E.; Kotze, D.J. Early successional dynamics of ground beetles (Coleoptera, Carabidae) in the tropical dry forest ecosystem in Colombia. ZooKeys 2021, 1044, 877-906. [CrossRef]
  75. Langor, D.; Pohl, G.; Hammond, H. A coarse-filter approach to conserving arthropod biodiversity in Canadian forests. Arthropods of Canadian Forests Newsletter 2006, 2, 9-13.
  76. Bergeron, C.; Spence, J.; Volney, J. Landscape patterns of species-level association between ground-beetles and overstory trees in boreal forests of western Canada (Coleoptera, Carabidae). ZooKeys 2011, 147, 577-600. [CrossRef]
  77. Sanderson, R.A.; Rushton, S.P.; Cherrill, A.; Byrne, J.P. Soil, Vegetation and Space: An Analysis of Their Effects on the Invertebrate Communities of a Moorland in North-East England. J. Appl. Ecol. 1995, 32, 506-518, doi:doi.org/10.2307/2404648.
  78. Ings, T.; Hartley, S. The effect of habitat structure on carabid communities during the regeneration of a native Scottish forest. For. Ecol. Manage. 1999, 119, 123-136. [CrossRef]
  79. Niemelä, J.K.; Spence, J.R. Distribution of forest dwelling carabids (Coleoptera): spatial scale and the concept of communities. Ecography 1994, 17, 166-175. [CrossRef]
  80. Koivula, M.; Punttila, P.; Haila, Y.; Niemelä, J. Leaf Litter and the Small-Scale Distribution of Carabid Beetles (Coleoptera, Carabidae) in the Boreal Forest. Ecography 1999, 22, 424-435. [CrossRef]
  81. Hopp, P.W.; Ottermanns, R.; Caron, E.; Meyer, S.; ROß-NICKOLL, M. Recovery of litter inhabiting beetle assemblages during forest regeneration in the Atlantic forest of Southern Brazil. Insect. Syst. Divers. 2010, 3, 103-113. [CrossRef]
  82. Guillemain, M.; Loreau, M.; Daufresne, T. Relationships beetween the regional distribution of carabid beetles (Coleoptera, Carabidae) and the abundance of their potential prey. Acta Oecol. 1997, 18, 465-483. [CrossRef]
  83. Molnár, T.; Magura, T.; Tóthmérész, B.; Elek, Z. Ground beetles (Carabidae) and edge effect in oak-hornbeam forest and grassland transects. Eur. J. Soil Biol. 2001, 37, 297-300. [CrossRef]
  84. Fuller, R.J.; Oliver, T.H.; Leather, S.R. Forest management effects on carabid beetle communities in coniferous and broadleaved forests: implications for conservation. Insect. Syst. Divers. 2008, 1, 242-252. [CrossRef]
  85. Lal, R. Soil Carbon Sequestration Impacts on Global Climate Change and Food Security. Science 2004, 304, 1623-1627. [CrossRef]
  86. Lal, R.; Augustin, B.J. Carbon Sequestration in Urban Ecosystems. In Proceedings of the Springer Netherlands, 2012.
  87. Hemerik, L.; Brussaard, L. Diversity of soil macro-invertebrates in grasslands under restoration succession. Eur. J. Soil Biol. 2002, 38, 145-150. [CrossRef]
  88. Magdoff, F.; Weil, R.R. Soil organic matter in sustainable agriculture, First ed.; CRC press: Boca Raton, Florida, USA, 2004; p. 412.
  89. Brock, C.; Oberholzer, H.R.; Franko, U. Soil organic matter balance as a practical tool for environmental impact assessment and management support in arable farming. Eur. J. Soil Sci. 2017, 68, 951-952. [CrossRef]
  90. Lundholm, J.T.; Marlin, A. Habitat origins and microhabitat preferences of urban plant species. Urban Ecosyst. 2006, 9, 139-159. [CrossRef]
  91. Sadler, J.; Small, E.C.; Fiszpan, H.A.; Telfer, M.; Niemela, J. Investigating environmental variation and landscape characteristics of an urban-rural gradient using woodland carabid assemblages. J. Biogeogr. 2006, 33, 1126-1138. [CrossRef]
  92. Gagne, S.A.; Fahrig, L. Do birds and beetles show similar responses to urbanization? Ecol. Appl. 2011, 21, 2297-2312. [CrossRef]
  93. Hartley, J.D.; Koivula, J.M.; Spence, R.J.; Pelletier, R.; Ball, E.G. Effects of urbanization on ground beetle assemblages (Coleoptera, Carabidae) of grassland habitats in western Canada. Ecography 2007, 30, 673-684. [CrossRef]
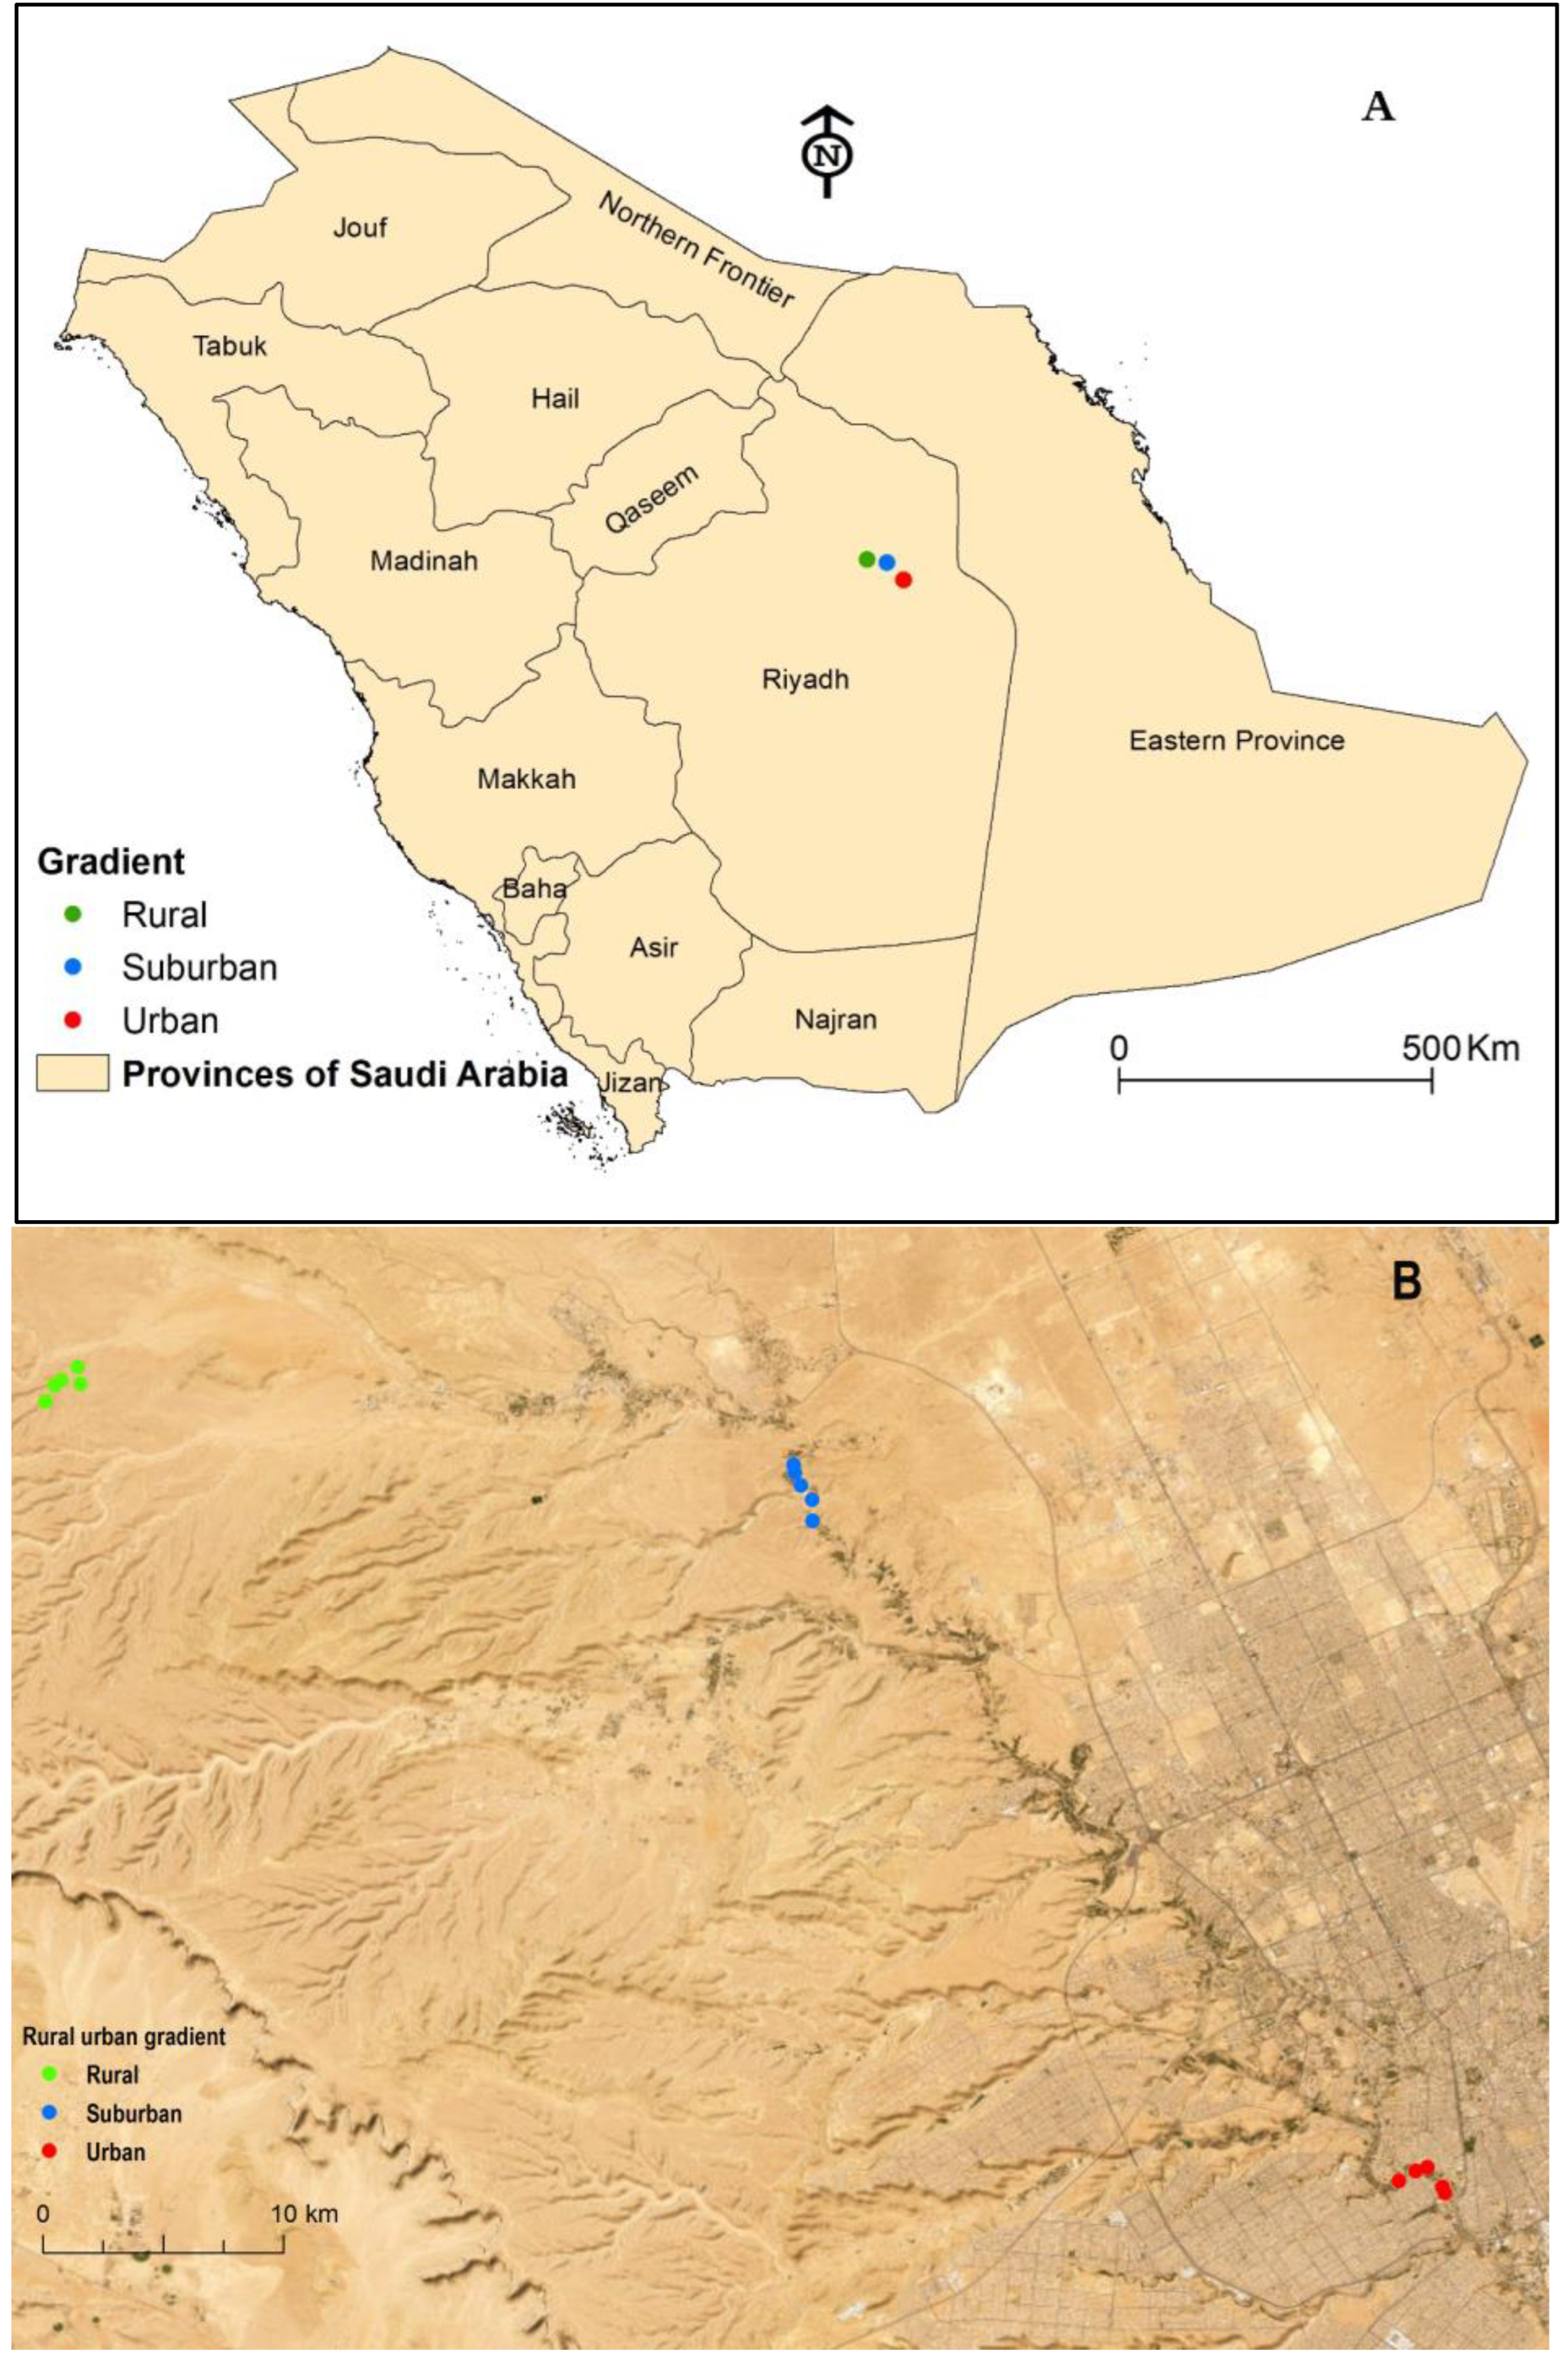
Figure 1. Map of the study area: (A) An overview of Saudi Arabia showing the study sites (colored dots) in Wadi Hanifa in Riyadh Province; (B) An enlarged representation of the sites in Wadi Hanifa along a continuum of rural-urban gradient (Rural, green dots; Suburban, blue dots; Urban, red dots).
Preprints 67899 g001
Figure 2. The ground-dwelling beetle along the rural-urban gradient in Wadi Hanifa, Saudi Arabia: (A) Abundance and richness of collected families; (B) mean abundance; (C) mean species richness; (D) mean evenness; (E) mean Shannon diversity; (F) mean Simpson diversity.
Preprints 67899 g002
Figure 3. Detrended correspondence analysis (DCA) diagram showing the distribution of sites using presence/absence data of 94 beetle species. WHR, rural habitat; WHS, suburban habitat; WHU, urban habitat.
Preprints 67899 g003
Figure 4. Canonical correspondence analyses (CCA) triplot with urbanization level and elevation represented by arrows, different studied sites represented by solid diamonds. And beetle species represented by species code in red. WHR, rural habitat; WHS, suburban habitat; WHU, urban habitat.
Preprints 67899 g004
Figure 5. Canonical correspondence analyses (CCA) triplot with the essential soil variables (1 of 7) represented by arrows, different studied sites represented by solid diamonds. Beetle species represented by species code in red. SOC, Soil Organic Carbon; SOM, Soil Organic Matter; WHR, rural habitat; WHS, suburban habitat; WHU, urban habitat.
Preprints 67899 g005
Figure 6. Canonical correspondence analyses (CCA) triplot with the essential land cover (2 of 5 variables) represented by arrows, different studied sites represented by solid diamonds. beetle species represented by species code in red, WHR, rural habitat; WHS, suburban habitat; WHU, urban habitat.
Preprints 67899 g006
Figure 7. Canonical correspondence analyses (CCA) triplot with effective flora species (3 of 43) represented by arrows, different studied sites represented by solid diamonds.beetle species represented by species code in red. Sp4, Launaea capitata; Sp17, Lycium shawii; Sp26, Alhagi graecorum; Sp48, Heliotropium currasavicum; WHR, rural habitat; WHS, suburban habitat; WHU, urban habitat.
Preprints 67899 g007
Table 1. This is a table. Tables should be placed in the main text near to the first time they are cited.
Environmental variable Rural Suburban Urban
Elevation range (m) 800‒820 690-710 570-590
Average Buildings (area in km2) 0 0.0218 0.2564
Average Road & Asphalt (length in km) 0 3.728 11.06
Average Pavement (length in km) 0 1.094 2.242
Average pH 8.618 8.562 8.416
Average EC (µS/cm) 159.10 493.42 1196.30
Average Soil Organic Carbon (SOC) 0.383 0.311 0.883
Average Soil Organic Matter (SOM) 0.659 0.534 1.521
Average clay 24 21.5 23.5
Average silt 14.5 10.5 14.5
Average sand 61.5 68 62
Texture Sandy
Clay Loam
Sandy
Clay Loam
Sandy
Clay Loam
Average bar ground percentage 34 26 20
Average plant cover percentage 66 74 79
Average litter cover percentage 1.36 0.5 11
Average litter depth 0.31 0.05 0.01
Average log percentage 7.94 32.54 28.08
Table 2. Results of the CCA of 15 sites and the Monte Carlo permutation test with F and P for the retained investigated environmental variables in the models.
Eigenvalue F P Weighted correlation matrix
Axis 1 Axis 2 Total Axis 1 Axis 2
Urbanization level 0.638 0.356 2.169
Buildings 5.18 0.0020 0.9589 0.2135
Pavements 1.21 0.270 0.7182 0.5657
Roads and asphalt 0.62 0.884 0.8437 0.4683
Elevation 3.75 0.0020 -0.7707 -0.6028
Vegetation cover 0.459 0.314 2.169
Litter cover 3.45 0.0020 0.8676 0.1654
Litter depth 2.74 0.0020 0.6417 0.6300
Flora 0.649 0.366 2.195
Alhagi graecorum 3.327 0.01 -0.5362 0.8231
Heliotropium currasavicum 5.33 0.0020 0.9770 0.1765
Launaea capitata 3.80 0.0020 -0.3841 -0.9034
Lycium shawii 1.88 0.0260 -0.3173 -0.8271
Soil chemical properties 0.568 0.385 2.195
Soil Organic Carbon (SOC) 4.53 0.0020 0.9420 0.0000
Soil Organic Matter (SOM) 0.67 0.80 0.9415 -0.0007
Table 3. Indicator beetle species identified by indicator species analysis for each urbanization gradient at Wadi Hanifa, Riyadh, Saudi Arabi, with the observed indicator value (IV) and significance level (P).
Family Species Gradient IV P
Tenebrionidae Adesmia stoeckleini Koch, 1940 0 100 0.001
Tenebrionidae Blaps kollari kollari Seidlitz, 1896 0 66.7 0.01
Tenebrionidae Scleropatroides sp. 0 66.7 0,02
Tenebrionidae Oxycara saudarabica Kaszab, 1979 0 72.3 0.007
Carabidae Mesolestes quadriguttatus (Mateu, 1979) 0 66.7 0.02
Carabidae Eremolestes sulcatus (Chaudoir, 1876) 0 66.7 0.02
Tenebrionidae Akis spinosa (Linnaeus, 1764) 0 66.7 0.016
Tenebrionidae Pimelia thomasi thomasi Blair, 1931 1 75 0.01
Tenebrionidae Gonocephalum soricinum (Reiche & Saulcy, 1857) 1 73.3 0.01
Tenebrionidae Tentyrina deserta deserta Kaszab, 1981 1 54.5 0.045
Scarabaeidae Rhyssemus saudi Pittion, 1984 1 63.8 0.035
Tenebrionidae Zophosis punctata Brullé , 1832 1 72.5 0.007
Dermestidae Anthrenus malkini Mroczkowski, 1980 1 50 0,05
Tenebrionidae Gonocephalum besnardi Kaszab, 1982 2 60 0.02
Tenebrionidae Sclerum orientalis (Fabricius, 1775) 2 80 0,006
Anthicidae Anthelephila caeruleipennis (La Ferté-Sénectère, 1847) 2 85.7 0.003
Anthicidae Anthicus crinitus LaFerté-Sénectère, 1849 2 66.7 0.011
Scarabaeidae Maladera insanabilis (Brenske, 1894) 2 61 0.03
Anthicidae Endomia lefebvrei (LaFerté-Sénectère, 1849) 2 100 0.001
Scarabaeidae Pentodon algerinus (Füessly, 1778) 2 60 0.03
Carabidae Microlestes infuscatus (Motschulsky, 1859) 2 60 0.03
Tenebrionidae Gonocephalum prolixum (Erichson, 1843) 2 60 0.02
Tenebrionidae Gonocephalum rusticum (Olivier, 1811) 2 70 0.001
* WHN1‒5, WHS5 = 0; WHS1‒4 = 1; WHU1‒5 = 2.
Disclaimer/Publisher’s Note: The statements, opinions and data contained in all publications are solely those of the individual author(s) and contributor(s) and not of MDPI and/or the editor(s). MDPI and/or the editor(s) disclaim responsibility for any injury to people or property resulting from any ideas, methods, instructions or products referred to in the content.
Copyright: This open access article is published under a Creative Commons CC BY 4.0 license, which permit the free download, distribution, and reuse, provided that the author and preprint are cited in any reuse.
Prerpints.org logo

Preprints.org is a free preprint server supported by MDPI in Basel, Switzerland.

Subscribe

© 2024 MDPI (Basel, Switzerland) unless otherwise stated