Preprint
Article

A Novel Animal Model in Diabetes Research: Regeneration of β cells in the Axolotl Salamander?

Altmetrics

Downloads

361

Views

332

Comments

0

A peer-reviewed article of this preprint also exists.

Submitted:

17 January 2023

Posted:

31 January 2023

You are already at the latest version

Alerts
Abstract
Diabetes is a group of diseases characterized by loss of β cell mass and/or -function, resulting in hyperglycemia. Approx. 537 million people worldwide suffer from diabetes – a number which is expected to increase. Diabetes is primarily treated by exogenous insulin, which comes with the challenges of maintaining glycemic control to prevent ketoacidosis and severe complications. The need for a curative treatment has initiated the research in β cell regeneration. Several studies in mice have identified essential genes for β cell fate, which can be manipulated in other cells to induce generation of new β cells. Zebrafish, a regeneration-positive animal model, has shown several different sources of new β cells, including regeneration by self-replication, neogenesis by duct-associated progenitor cells, and transdifferentiation of other endocrine islet cells. The animal models used in this research area are either limited by their low regenerative ability (mice), or their small size and remoteness from humans (zebrafish). There is a need for new animal models of diabetes, in which the molecular pathways of endogenous regeneration can be studied. This study proposes the axolotl salamander (Ambystoma mexicanum) as a model for studying the regeneration of β cells. The axolotl has shown great regenerative capability, as they have proven capable of regenerating amputated limbs, and hearts with myocardial infarction, among other organs. This study aims to establish a diabetic axolotl model, investigate their regenerative ability in the pancreas, and examine the potential systemic effects of the induced disease. In a pilot study, five different protocols using STZ (streptozotocin) were tested, and the most optimal protocol was found. Furthermore, the glucose tolerance test was optimized to characterize the glycemic state of the animals. The effect of the treatment on blood glucose levels was measured to characterize the development and decline of the disease. The histological changes in the pancreas were examined. Moreover, the systemic effects of the STZ treatment were investigated in blood and urine. The study indicated that it is possible to induce diabetes in the axolotl, but variations between the animals should be minimized, or the sample size should be increased to conduct a satisfying experiment, as it was not possible to induce diabetes in all animals. Regeneration was not observed histologically, but a restoration of blood glucose levels was seen over the span of the experiment. Lastly, edema formation was observed in some of the STZ-treated animals, but the cause of edema remains undetermined.
Keywords: 
Subject: Medicine and Pharmacology  -   Endocrinology and Metabolism

Introduction

Diabetes is a group of metabolic diseases, which are caused by the loss of β cell mass or -function, resulting in hyperglycemia[1]. This chronic hyperglycemic state can result in long-term damage to organs such as the vascular system, heart, eyes, kidneys, and liver, among others[2]. Diabetes is classified into four categories[1,2]:
  • Type 1 diabetes, which is caused by cell-mediated autoimmune destruction of β cells, resulting in absolute endogen insulin deficiency.
  • Type 2 diabetes, which is characterized by relative insulin deficiency and insulin resistance.
  • Other specific types of diabetes, comprising genetic defects (including Maturity-Onset Diabetes of the Young), genetic defects in insulin action, exocrine pancreas disease, diabetes due to endocrinopathies, drug/chemically induced, infections, uncommon immune-mediated diabetes, and other genetic syndromes sometimes associated with diabetes.
  • Gestational diabetes mellitus, which can develop during pregnancy.
According to the International Diabetes Federation (2021), an estimate of 537 million people suffers from diabetes, expected to reach 643 million people in 2030, making it one of the fastest-growing global health emergencies today[3]. Studies on type 1 diabetes have also shown an increase in incidence[4,5]. According to the International Diabetes Federation, the number of deaths related to diabetes is around 6.7 million in the adult population. In Denmark, approximately 280,000 people have diabetes, of which 10% suffer from type 1 diabetes[6].
Thus, diabetes is an increasing global health care problem, and a solution is heavily needed. In this study, I will be focusing on the two major types of diabetes, type 1 and type 2 diabetes.

Diabetes – Diagnosis and Treatment

In the traditional paradigm, type 1 and type 2 diabetes have been clearly separated by time of disease onset – type 1 diabetes had disease onset in childhood, whereas type 2 diabetes had in adulthood[1]. However, this is not the case anymore, as type 1 diabetes can have onset later in life, and type 2 diabetes vice versa. In fact, diabetes is a very heterogeneous disease, which is reflected in the symptoms[1]. Common symptoms of diabetes are excessive thirst and urination (polydipsia/polyuria), abnormal sense of hunger (polyphagia), and weight loss[1, 2]. Blurring of vision and ketoacidosis are seen in severe cases.
Diagnosis of patients with diabetes is based on blood glucose measurements. Several tests are used in the clinic. Hyperglycemia can be detected by measuring fasting blood glucose, performing a glucose tolerance test, or by the A1C test[1]. For the fasting blood glucose test, blood glucose is measured after fasting for a minimum of 8 hours, with a blood glucose value of 7.0 mmol/L indicating diabetes[1]. In the glucose tolerance test, patients receive a known oral glucose dose (75 g for adults and 1.75 g/kg body mass for children) followed by blood glucose measurements two hours after glucose ingestion, with blood glucose values of 11.1 mmol/L demonstrating diabetes[1]. As for the A1C test, the amount of glycated hemoglobin is measured[1]. HbA1c is measured for long-term diabetes, as it indicates the glycemic role over the last 2-3 months[1].
Patients with diabetes are in acute need of treatment, as untreated diabetes can have severe consequences. Exogen insulin is the mainstay of therapy for patients with type 1 diabetes and moderate to severe type 2 diabetes[7]. Glycemic control is maintained by manual subcutaneous injection of insulin, and self-monitoring of blood glucose levels is therefore important for correct glycemic management. Blood glucose levels can be monitored with hand-held devices or newer devices, which can measure real-time blood glucose levels[2]. However, this glycemic management with insulin is not without its risks. Incorrect insulin dosage can lead to hyperinsulinemia and hypoglycemia, which – in worst case – can result in death[2].
Several alternative therapies are currently being investigated. One of these is the development of an artificial pancreas, which secretes insulin and glucagon depending on blood glucose levels[7], thus assuring tight glycemic control. As for curative therapies, the main strategy is to find a way to replace the lost β cells, and, thus, restore normal insulin secretion. Research in this area goes back nearly a century, but an ideal treatment has not yet been found. The different strategies being investigated are cadaveric pancreas/islet transplantation, differentiation of pluripotent stem cells to either β cells or pancreatic progenitor cells, stimulation of β cell replication, reprogramming of non-β cells to β cells, xenotransplantation, and transplantation of animal-grown human pancreas[8]. All these treatment strategies come with their limitations, such as the necessity of immunosuppressants, difficulty in adapting methods to large-scale production, the need for invasive procedures, and finding the right target to trigger the production of new β cells. Probably the most promising method has proven to be infusion of stem cell-derived β cells through the hepatic portal vein. The first patients have successfully been treated with this, in which one patient did not need exogenous insulin treatment after 270 days, but the other patients showed more moderate responses to the treatment[9,10]. The treatment is still dependent on immunosuppressive treatment, but methods to evade the immune system are currently under investigation, such as by Clustered Regularly Interspaced Short Palindromic Repeats (CRISPR) gene-editing technology[11] and encapsulation of β cells[12]. Even though this is a huge advancement toward a curable treatment for diabetes, this has only been tested in a few patients with varying results, thus alternative treatments still need to be investigated.

The Pancreas – Development, Anatomy, and Function

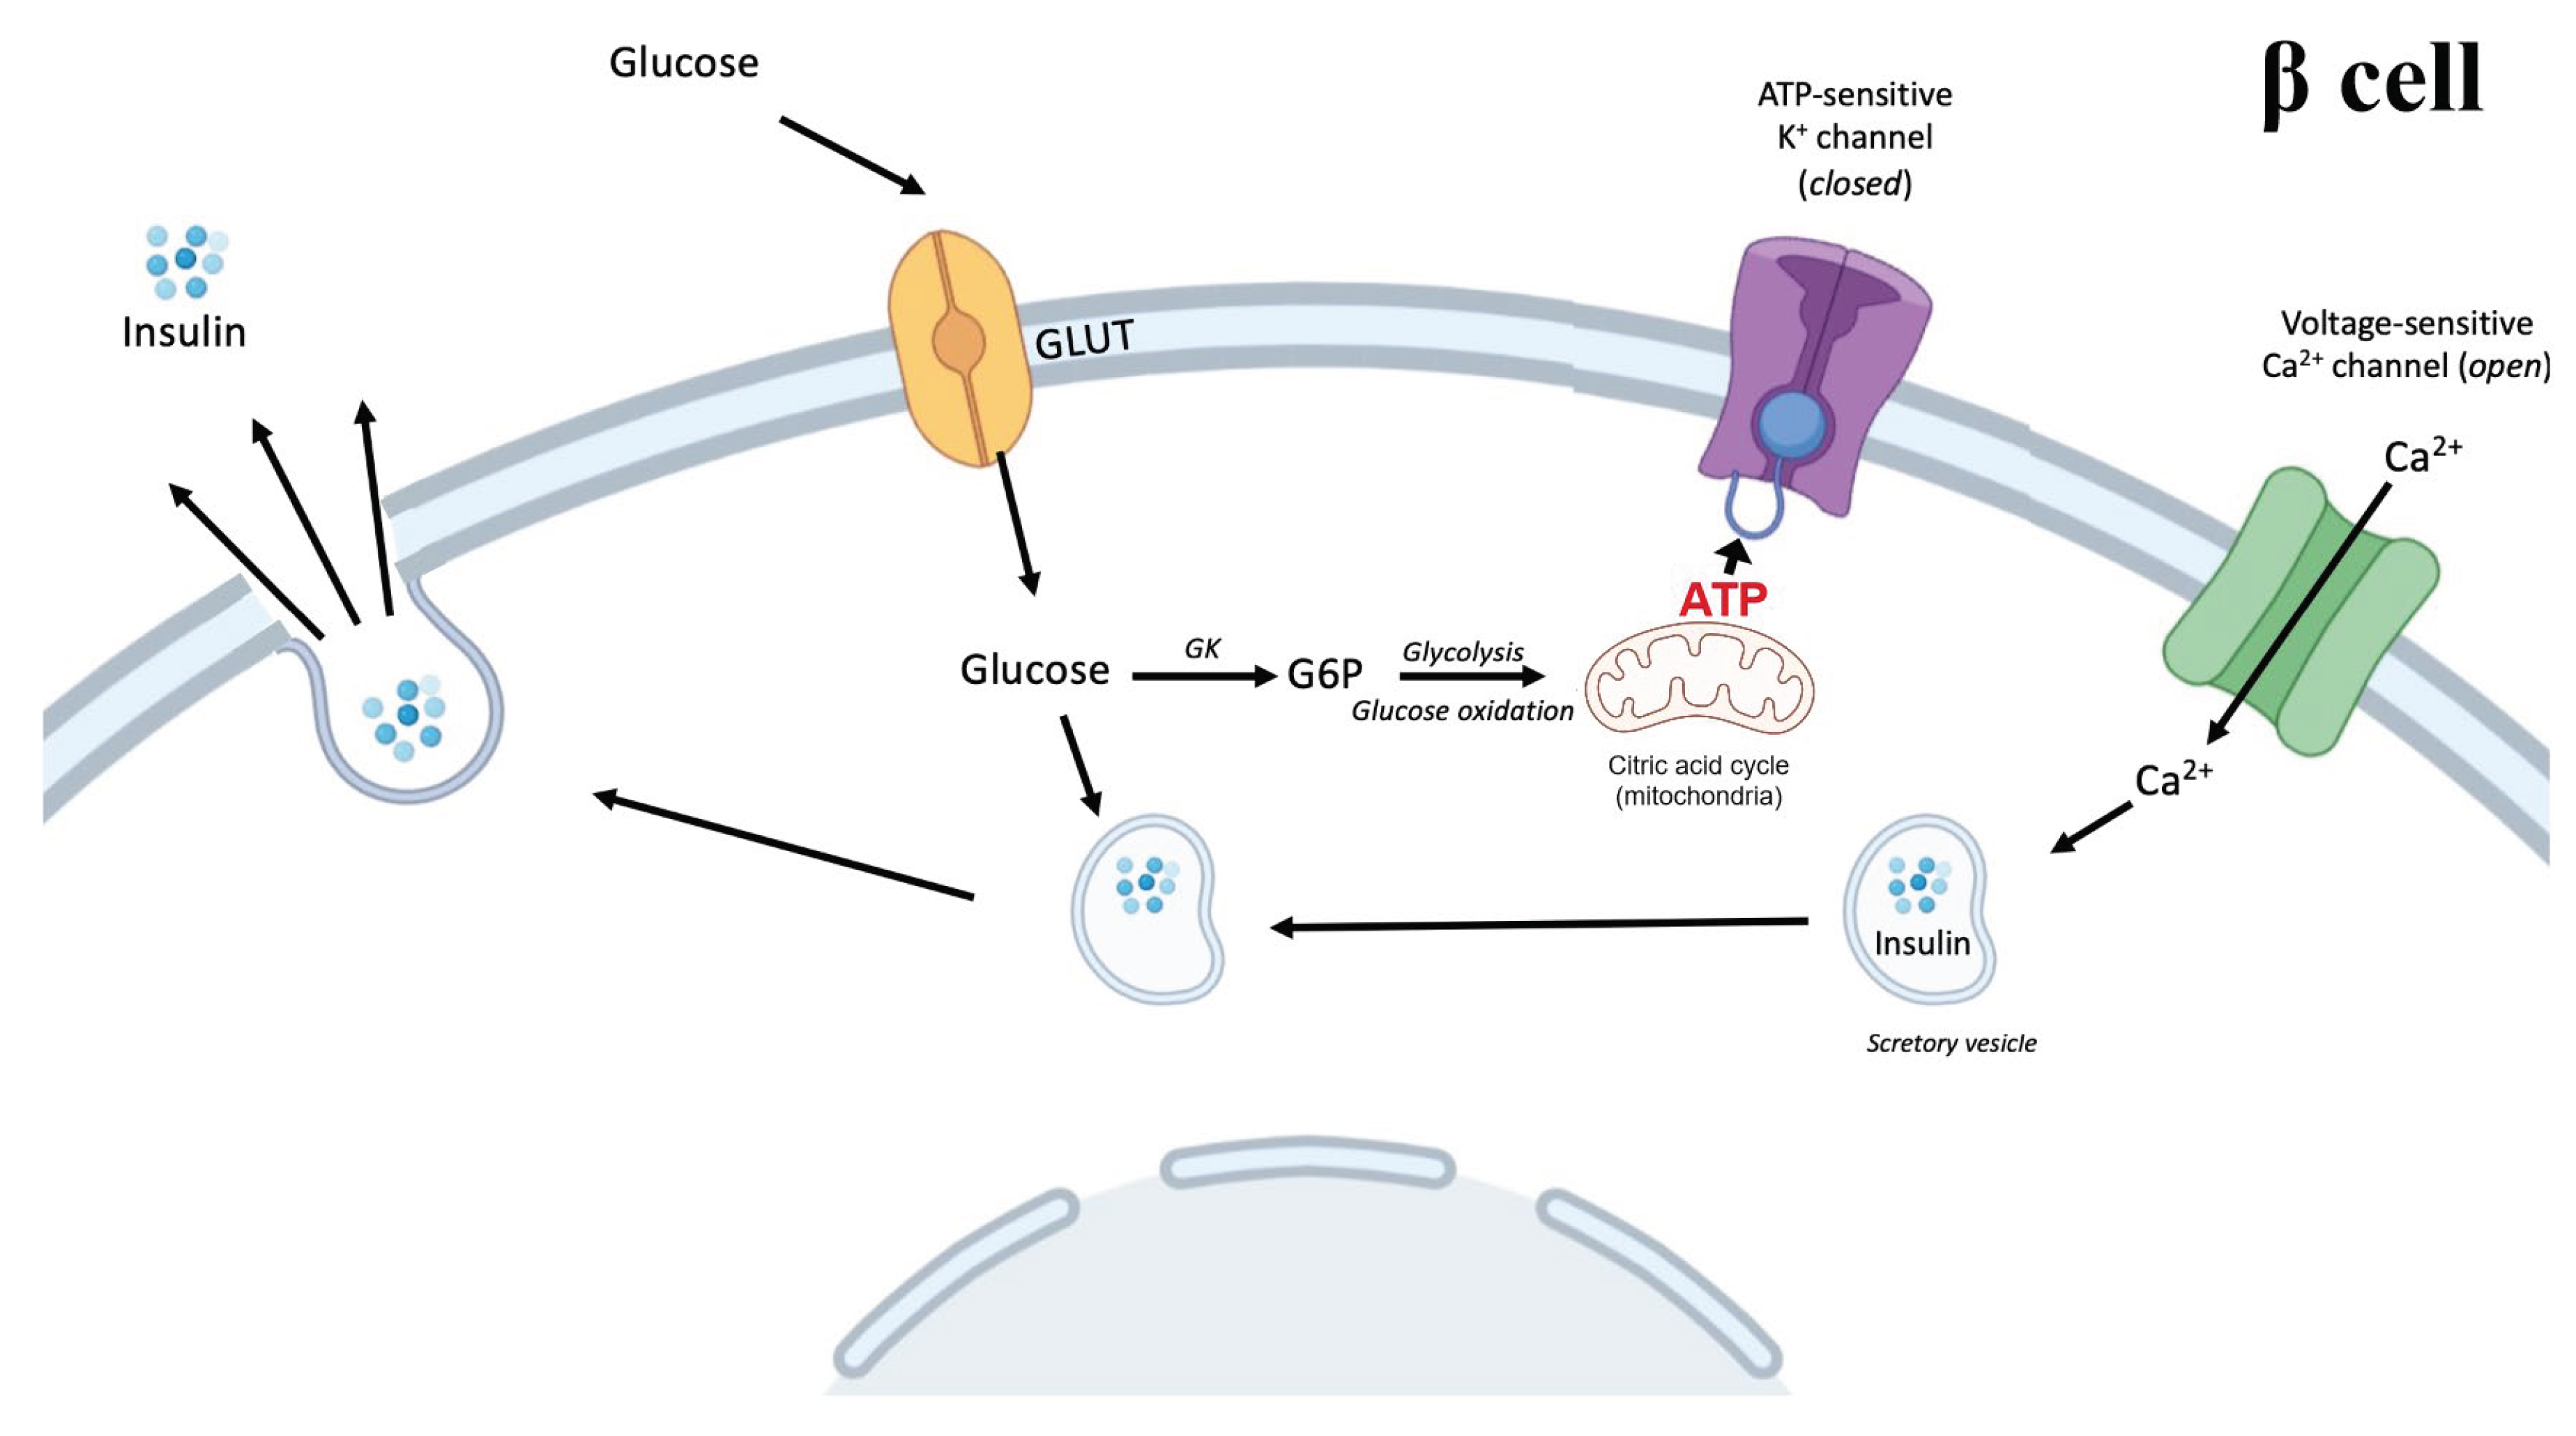
The pancreas is a long, slender organ, which is connected to the digestive tract. It has an exocrine and an endocrine part. The exocrine function of the pancreas is to produce and secrete digestive enzymes, whereas the endocrine pancreas secretes different hormones affecting the metabolism. The endocrine pancreas in humans is anatomically assembled in clusters of endocrine cells (called islets of Langerhans), comprising five primary cell types: Insulin-expressing β cells, glucagon-expressing α cells, somatostatin-expressing δ cells, ghrelin-expressing ε cells, and PP cells, which produce pancreatic polypeptide[8]. The secretion of these hormones is highly dependent on circulating nutrients, especially glucose. In a normal functioning pancreas, increased circulating glucose would result in an increase in insulin secretion and a decreased glucagon secretion, and vice versa. Circulating glucose enters β cells through glucose transporters (GLUTs; GLUT2 in rodents, GLUT1-3 in humans) and is phosphorylated by glucokinase and further metabolized to generate adenosine triphosphate (ATP)[2] (Figure 1). The increased cytosolic ATP level causes ATP-sensitive K+-channels to close, reducing potassium efflux and, thus, promoting depolarization of the cell membrane and influx of calcium through Ca2+-channels, which triggers the secretion of insulin. The secretion of insulin occurs in two phases: 1. An initial burst and 2. a prolonged, stable secretion[2].
Especially the liver, skeletal muscle, and adipose tissue are targets of insulin action. In the liver, insulin promotes glycogen synthesis and inhibits gluconeogenesis and glycogen synthesis, among other metabolic pathways[13]. In fat, the primary roles of insulin are to inhibit lipolysis and promote fatty acid uptake, and in muscle, insulin promotes glycogenesis, protein synthesis, and amino acid uptake[13,14]. Insulin also has autocrine functions, such as inhibition of apoptosis, stimulation of proliferation, and regulation of insulin and glucokinase gene expression[15,16]. Thus, insulin is necessary for β cell function and survival.
In human and mouse development, the pancreas arises from the fusion of a dorsal and ventral bud from the foregut endoderm[17]. In this early event, the expression of three transcription factors – pancreatic and duodenal homeobox 1(PDX1), SRY(sex-determining region Y)-box transcription factor 9 (SOX9), and GATA binding protein 4 (GATA4) - are important, and PDX1 inactivity can lead to absence of the pancreas[17,18]. Both endocrine and exocrine cells arise from the same progenitor cells, with different genetic expressions deciding the cell fate. The transcription factor neurogenin-3 (NGN3) is required for the commitment to an endocrine cell fate and is not expressed in duct cells[18,19]. Also, the Notch signaling pathway has proven to be important in deciding multipotent progenitor cell fate in mice[19] and zebrafish[20]. For endocrine cell fate, the genes paired box 4 (PAX4) and aristaless related homeobox (ARX) have proven to be important for the differentiation of either β cells or α cells, respectively[19,21]. Collombat et al. have shown the importance of these genes for cell fate by inducing transdifferentiation of α cells to β cells by expressing Pax4 in adult α cells[22], and that loss of either Arx or Pax4 gene activity leads to a shift in the cell fate[23].
The development and histology of the pancreas are similar across mammals, birds, reptiles, amphibians, and some fish[17]. To my knowledge, the pancreas of the axolotl (Ambystoma mexicanum) has not been a subject of study, but the development and histology of the pancreas in Xenopus, another common laboratory amphibian model, has been investigated[24]. In Xenopus, α, β, δ, and PP cells have been identified, and there has been seen a similar developmental process as in mice and humans[24]. Also, insulin expression has been identified located throughout the entire pancreas, and the endocrine cells are arranged in clusters, as seen in other species[24]. Similar cell fate-specific genes have also been identified, such as pdx1, sox9, and ngn3[24]. Also, pax4 and arx have been identified in Xenopus, but the role of these genes in the pancreas has not been elucidated[24]. There is great comparability of the histology and development of the pancreas between species, which makes it more compatible to model pancreatic diseases, such as diabetes, in different animal models.
The role of insulin is not as well-studied in amphibians as in mice, but the effect of pancreatectomy has been investigated in some amphibians. In anuran, removal of the pancreas has proven to result in diabetes, with effects such as hyperglycemia, glucosuria, polyuria, increase in blood ketone bodies, body weight loss, and a decrease in liver and muscle glycogen, and, interestingly, in some toads regeneration of pancreas occurred[25]. In Bufo arenarum, an elevation in blood glucose and ketone levels occurred immediately after the operation but worsened over the period of 13 days (blood glucose and ketone levels were not measured afterward). This delayed hyperglycemic response was also seen in lizards (Tupinambis teguixin), in which the initial response was hypoglycemia, and hyperglycemia only occurred eight weeks postoperatively[25]. Urodeles are even less studied than anurans, but a study in Taricha torosa showed that pancreatectomy also resulted in an elevation in blood glucose levels[25].
Moreover, studies in amphibians also showed that injections of insulin resulted in hypoglycemia, but the action of insulin was delayed and of prolonged duration, dependent on the metabolic rate of the animals[25].
The glucose tolerance test has been used in anuran to investigate glucose consumption, and a study showed that by i.v. (intravenous) injecting 3 mg/g body mass of glucose in male toads (Bufo marinus), glucose levels returned to fasting levels after 10h[25]. Other studies in anurans have given similar results, in which blood glucose levels normalized between 8-24h after glucose injection, depending on species. This shows that amphibians have a much slower metabolic rate than the one seen in humans.
In metabolic studies of amphibians, it is worth noting that amphibians are carnivores, and their macronutrient requirements are different from species such as rodents because they rely more on lipid/protein uptake than carbohydrates[26]. In other carnivores, such as the domestic cat, protein has a more prominent role as a gluconeogenic substrate than carbohydrates[27].
All in all, studies in different amphibian species show that there are many similarities, but also some distinct differences, between humans and amphibians (Table 1). Blood glucose levels are regulated by insulin secretion, as in humans, but the metabolic rate of glucose is lower than seen in mice and humans.

Pathology of Diabetes

Both type 1 and type 2 diabetes are characterized by chronic hyperglycemia. In type 1 diabetes, this results from autoimmune destruction of β cells due to the presence of autoantibodies, which leads to an inadequate cell amount for insulin secretion[1]. In children, severe onset has been characterized by a near-total loss of β cell mass, with a mass reduction of over 80%, but in older onset patients, a 40-60% reduction in β cell mass has proven to be sufficient for disease development[29,30] (Table 1). In contrast, a β cell loss of 70-90% or more is required for disease in mice[8,31,32]. The loss of β cell mass results in insufficient insulin levels in the blood, causing inadequate glucose uptake via insulin-dependent pathways of metabolic organs.
As for type 2 diabetes, the disease is a result of metabolic stress and elevated demand of insulin caused by insulin resistance, which cause exhaustion of the β cells and can result in β cell death[29,33]. Patients with type 2 diabetes have shown both β cell function (insulin secretion) and β cell mass increase as a compensatory effect of the elevated insulin demand[29,34,35,36]. However, at some point, this effect is not enough, resulting in a reduction of β cell mass, β cell dysfunction, and, consequently, severe disease.
Insulin insufficiency results in an increased glucagon/insulin ratio, which induces a biochemical fasting mode, independent of blood glucose levels[37]. Consequently, glucose is unable to enter cells in target tissues, resulting in chronic activation of gluconeogenesis, glycogenolysis, and ketogenesis[37]. Gluconeogenesis and glycogenolysis result in the production of more glucose, contributing to the hyperglycemic state. To get rid of circulating glucose, it is excreted in the urine. As for ketogenesis, the lack of carbohydrates as fuel energy leads to breakdown of lipids and proteins, liberating free fatty acids and ketogenic amino acids, and, thus, the production of alternative fuel energy: Ketone bodies[37]. Severe diabetes is dominated by the production of ketone bodies, which can, at high levels, disrupt the acid-base balance in the kidneys, resulting in a low pH in blood and dehydration, and, in worst case, death[37].
Diabetes also has many complications, despite treatment with exogenous insulin. These are a result of inadequate glycemic control, which damages the blood vessels and causes angiopathy, affecting several organs. Microvascular complications include retinopathy, neuropathy, and nephropathy. Diabetic retinopathy is caused by lesions in the retina, and it is a major cause of blindness[38]. Diabetic neuropathy can result in amputations of the extremities, impaired wound healing, erectile dysfunction, and nerve fiber deterioration, amongst other life-changing effects[39]. Diabetic nephropathy is characterized by proteinuria, hypertrophy, changes in glomerular filtration rate, and poor control of fluid balance and blood pressure via salt reabsorption[39]. Macrovascular complications include cardiovascular disease, which can result in atherosclerosis, myocardial infarction, and strokes, causing diabetic patients to have a risk of myocardial infarction equivalent to that of nondiabetic patients with prior myocardial infarction[39,40]. Thus, diabetes is a disease that can result in severe complications, further emphasizing the necessity of research in a curative treatment to resolve this major health care burden.

Regeneration of β Cells – What We Know Now

As mentioned before, extensive research has been done on the regeneration of β cells and the origin of new β cells, mostly in animal models such as mice and zebrafish, and the current methods that are being investigated to induce regeneration are based on findings in these animal models. These findings have led to three primary theories on the sources of new β cells:
  • Proliferation of surviving β cells
  • Neogenesis by stem cells/duct- or duct-associated progenitor cells
  • Transdifferentiation of adult islet cells, such as α or δ cells.
Studies have shown that the β cell mass is dynamic and can adapt to maintain euglycemia in both humans and rodents[34,41]. Normally, young mice display a rather high proliferation rate of β cells, which is lost in adult mice[8,42]. However, adult mice have shown the ability to adapt to increased demand, such as during pregnancy, by inducing the proliferation of β cells[43]. Also, a lineage-tracing study in adult mice undergoing pancreatectomy has shown that new β cells are formed and are a product of the proliferation of pre-existing β cells[44]. Moro et al. showed that β cells self-replicate both in early development and in adult zebrafish and that this is the main mechanism of β cell mass expansion[45]. However, other findings indicate that the capacity for the formation of new β cells through the proliferation of existing β cells is limited in mammals, especially in humans[8,46].
Another source of new β cells is neogenesis. Neogenesis is defined as the generation of new β cells from stem cells or progenitor cells, which can come from dedifferentiated duct cells[47]. There has been mixed evidence of neogenesis from pancreatic stem/progenitor cells[8,47]. A study in mice undergoing duct ligation showed Ngn3 + endocrine precursor cells in the ductal structures[48], and another study in alloxan-treated mice showed differentiation of Sox9 + ductal cells to β cells[49], but several lineage-tracing studies in mice have shown little to no evidence of neogenesis[50,51,52,53]. As for zebrafish studies, Delaspre et al. demonstrated in a lineage-tracing study that the zebrafish pancreas contains centroacinar cells (duct cells), which give rise to new β cells after pancreatectomy or metronidazole treatment, demonstrating neogenesis in a regeneration-positive animal model[54].
However, studies also show that new β cells can come from fully differentiated, adult cells, a process called transdifferentiation. Several studies have shown that α cells or δ cells can give rise to β cells. In mice, Xiao et al. were able to induce transdifferentiation of α cells to β cells in vivo by inducing expression of Pdx1 and v-maf musculoaponeurotic fibrosarcoma oncogene family, protein A (avian) (Mafa)[55], and Thorel et al. showed that a transgenic model of diptheria-toxin-induced acute selective near-total β cell ablation also regenerated its β cells by transdifferentiation of α cells[56]. Also, Chera et al. confirmed the process of α-to-β cell transdifferentiation in mice, but they also showed that, before puberty, β cell regeneration happened through δ cell transdifferentiation instead, emphasizing the plasticity of islet cells[57]. Several studies in zebrafish have shown α cells as the source of new β cells[58]. Also, genetic manipulation of the cell fate-specific genes, such as Arx, Pax4, and Pdx1, have also been shown to promote α-to-β cell conversion in mice[22,59,60,61].
Thus, research show several possible sources of new β cells, and it is, therefore, essential to further investigate this in other regeneration-positive animal models.

Animal Models Used to Study the Regeneration of β Cells

In the studies mentioned above, the animal models used to study the regeneration of β cells in diabetes are commonly mice and zebrafish. To study the regeneration of β cells, there are three common ways to kill β cells and hereby induce type 1 diabetes:
  • Surgical injury
  • Genetically induced diabetes
  • Chemical ablation of β cells
Surgical injury models mainly comprise pancreatectomy. A near-total removal of the pancreas is necessary to induce diabetes in mice, as glycemic control can be maintained with only 10% of islet mass[8]. In this model, however, not only β cells are destroyed, but also the exocrine pancreas and the rest of the endocrine pancreas. Thus, this model does not accurately reflect diabetes, but it can be used to study pancreas regeneration in general.
In rodents, spontaneous genetic alterations inducing β cell destruction due to an autoimmune response have been discovered, namely the non-obese diabetic (NOD) mice, Biobreeding rats, and LEW.1AR1/iddm rats[62]. The NOD mice are the most used of these three models[62]. In this model, insulitis causes β cell destruction, and diabetes develops until they are 30 weeks of age, and they then require insulin treatment[62]. Even though it reflects the disease rather well, it comes with its limitations, such as early development of diabetes and therefore treatment requirement until the necessary age for the specific study has been reached, it is restricted to this species, and that disease only develops in 60-90% of females and 10-30% of males[62].
For the chemical ablation of β cells, two main compounds are used: STZ (streptozotocin) and alloxan[62]. Both are glucose analogues, which mimic and compete with glucose to enter β cells through Glut2/glut2[62,63], which is the primary glucose transporter in β cells of both mice and zebrafish. These drugs kill a large amount of β cells and cause near-total β cell ablation[62]. STZ is the most used drug to model diabetes in animals[63], and it was used as an alkylating agent in the chemotherapy of metastatic pancreatic islet tumors before its discovery as a diabetogenic drug in 1963[63]. When STZ enters β cells, it forms diazomethane, causing DNA (deoxyribonucleic acid) methylation, increased NADPH (nicotinamide adenine dinucleotide phosphate) levels and free reactive oxygen species, activation of protein kinase C pathway, accumulation of advanced glycation end products, and cytokine secretion, which all lead to β cell death[63]. Though, STZ has shown to have non-specific toxic effects on other organs expressing GLUT2, such as the liver[64,65] and kidneys[66,67], but also on other organ systems such as the nervous system, and cardiovascular system, among others[63,68,69], and causes high mortality in experimental animals[63]. Nonetheless, it is a simple, effective, and low-cost method to induce diabetes in animal models[62].
Thus, type 1 diabetes can be induced in several ways and in several different animal models, but not all animal models of diabetes can be used to study the regeneration of β cells. Mammals show a limited ability to regenerate β cells naturally, which limits the choice of animal models significantly. Mice are frequently used, as mentioned before, but their regenerative capacity is only present in young rodents, as they have shown tissue growth after pancreatectomy, but this ability declines in adult animals[70,71,72]. Typically, mice models are used to study the significance of specific genes by inducing or inhibiting gene expression and investigating the effect of this manipulation. As for regeneration-positive animal models, several studies have shown that zebrafish can endogenously regenerate functional β cells after near-total β cell ablation[58,73,74]. However, zebrafish are limited by their small size (adult zebrafish length ranges between 2-5 cm[75,76]), which results in the inability to collect serial blood samples, and, moreover, they are teleost and thus not as closely related to humans as mice.
However, the axolotl salamander is a tetrapod with a similar body plan to humans, and it is one of few tetrapods which can regenerate complex structures[77,78]. The axolotl can regenerate the limbs, heart, lungs, and spinal cord, among other tissues[79,80,81,82,83]. Compared to zebrafish, axolotls are larger(up to 30 cm in length), allowing serial blood collection, more complicated surgical operations, and the use of imaging techniques such as magnetic resonance imaging, echocardiography, and positron emission tomography[80]. Zebrafish are more well-studied genetically, but there are developed genomic databases of the axolotl, and several transgenetic axolotl models have been applied[84,85,86,87,88]. How the axolotl can regenerate complex structures has not yet been determined. It has been postulated that its regenerative capabilities were a result of their neoteny i.e., they remain aquatic their whole life and do not undergo metamorphosis, but by inducing metamorphosis using thyroid hormone they are still able to regenerate, but with a slower rate[78,89].
The axolotl is therefore an ideal model for studying regeneration of β cells after inducing type 1 diabetes.

Methods and Materials

Experimental Design

This study is composed of four parts:
  • Pilot studies covering the histology of the pancreas, insulin measurement methods, optimization of the glucose tolerance test, and establishment of a protocol for STZ-mediated induction of diabetes in the axolotl.
  • Investigation of the induction of diabetes and the potential regeneration of β cells in the axolotl by measuring changes in blood glucose levels over time.
  • Histological examination of the diabetic state on day 22, 35, and 84 of the experiment.
  • Characterization of systemic effects of the STZ-induced disease.
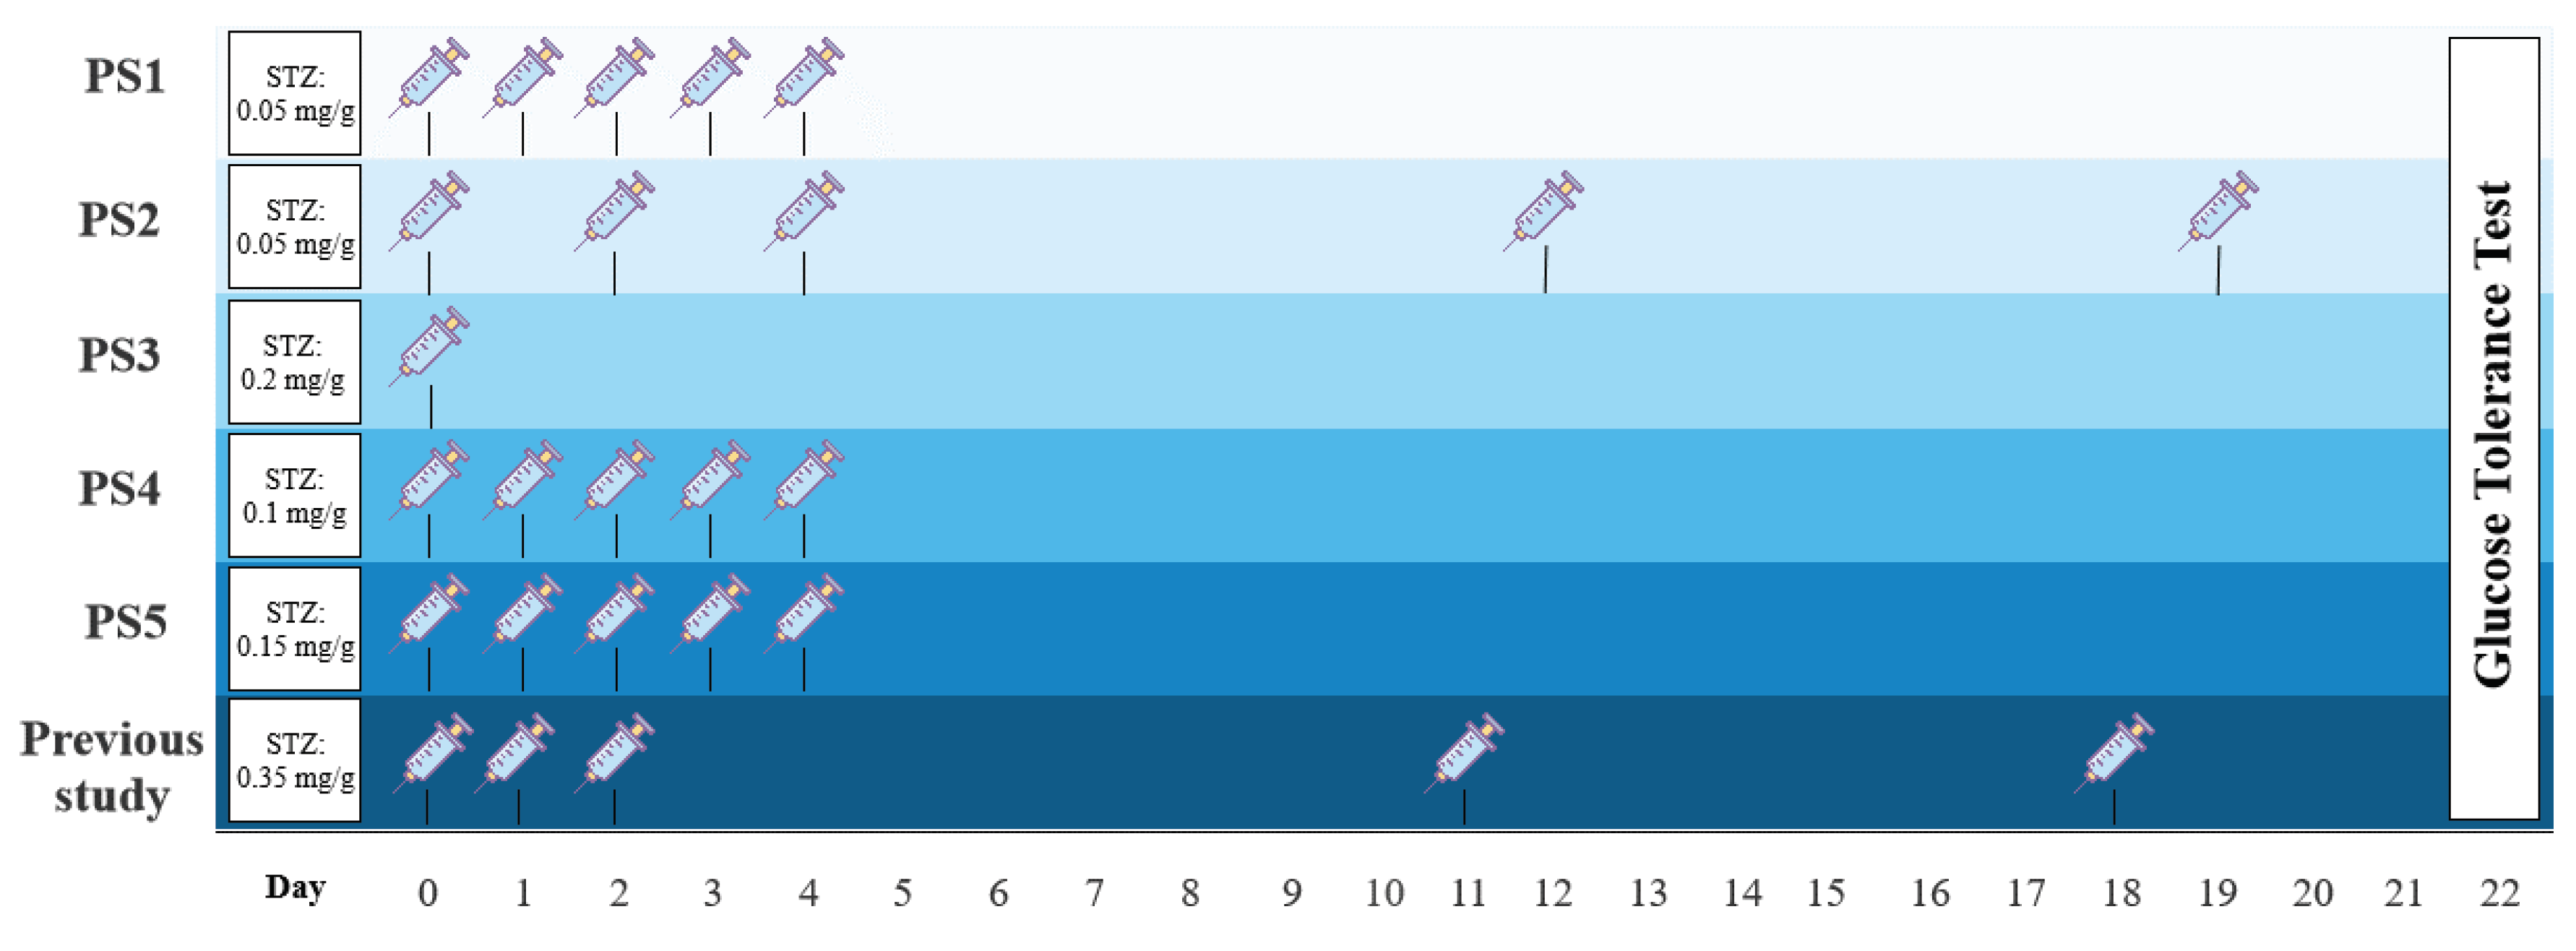
In part I, several pilot studies (PS1-5) were conducted to find the optimal dosage regime of STZ (Figure 2). Previously, I have examined a protocol inspired by a study in zebrafish[90], in which 0.35 mg/g body mass of STZ was i.p. (intraperitoneal) injected at day 0, 1, 2, 11, and 18 of the experiment. However, the pilot study resulted in high mortality and premature termination[91]. In this study, I investigate several dosage regimes inspired by rodent studies to find a treatment protocol that makes the animals diabetic without causing high mortality. Firstly, PS1 was treated with 0.05 mg/g body mass of STZ on 5 consecutive days, group PS2 received 0.05 mg/g body mass of STZ at day 0, 2, 4, 12, and 19, and PS3 was given a single dose of STZ of 0.2 mg/g body mass at day 0. Two additional pilot groups were included, in which PS4 was treated with 0.15 mg/g body mass of STZ, and PS5 was given 0.2 mg/g body mass of STZ, both at 5 consecutive days. The best protocol was decided by evaluation of blood glucose levels using fasting blood glucose levels and a glucose tolerance test.
In part II, the optimal STZ treatment protocol was applied to two groups, one receiving STZ (stz_d84) and one receiving a sham treatment (sham_d84). Stz_d84 was subjected to a glucose tolerance test at day 22 to confirm hyperglycemia caused by the treatment, and again at day 32, 42, 52, and 72 of the experiment to monitor changes in blood glucose levels over time to identify potential regeneration of β cells. Sham_d84 was subjected to the glucose tolerance test at day 22, 42, and 72.
In part III, four additional groups were included – stz_d22 and stz_d35, which received the STZ treatment, and sham_d22 and sham_d35, which received a sham treatment. The diabetic state after the STZ treatment was investigated at three distinct stages: 1. When hyperglycemia peaked (day 22), 2. When the regenerative process was assumed to initiate (day 35), and 3. When β cell function was restored (day 84) (Figure 3).
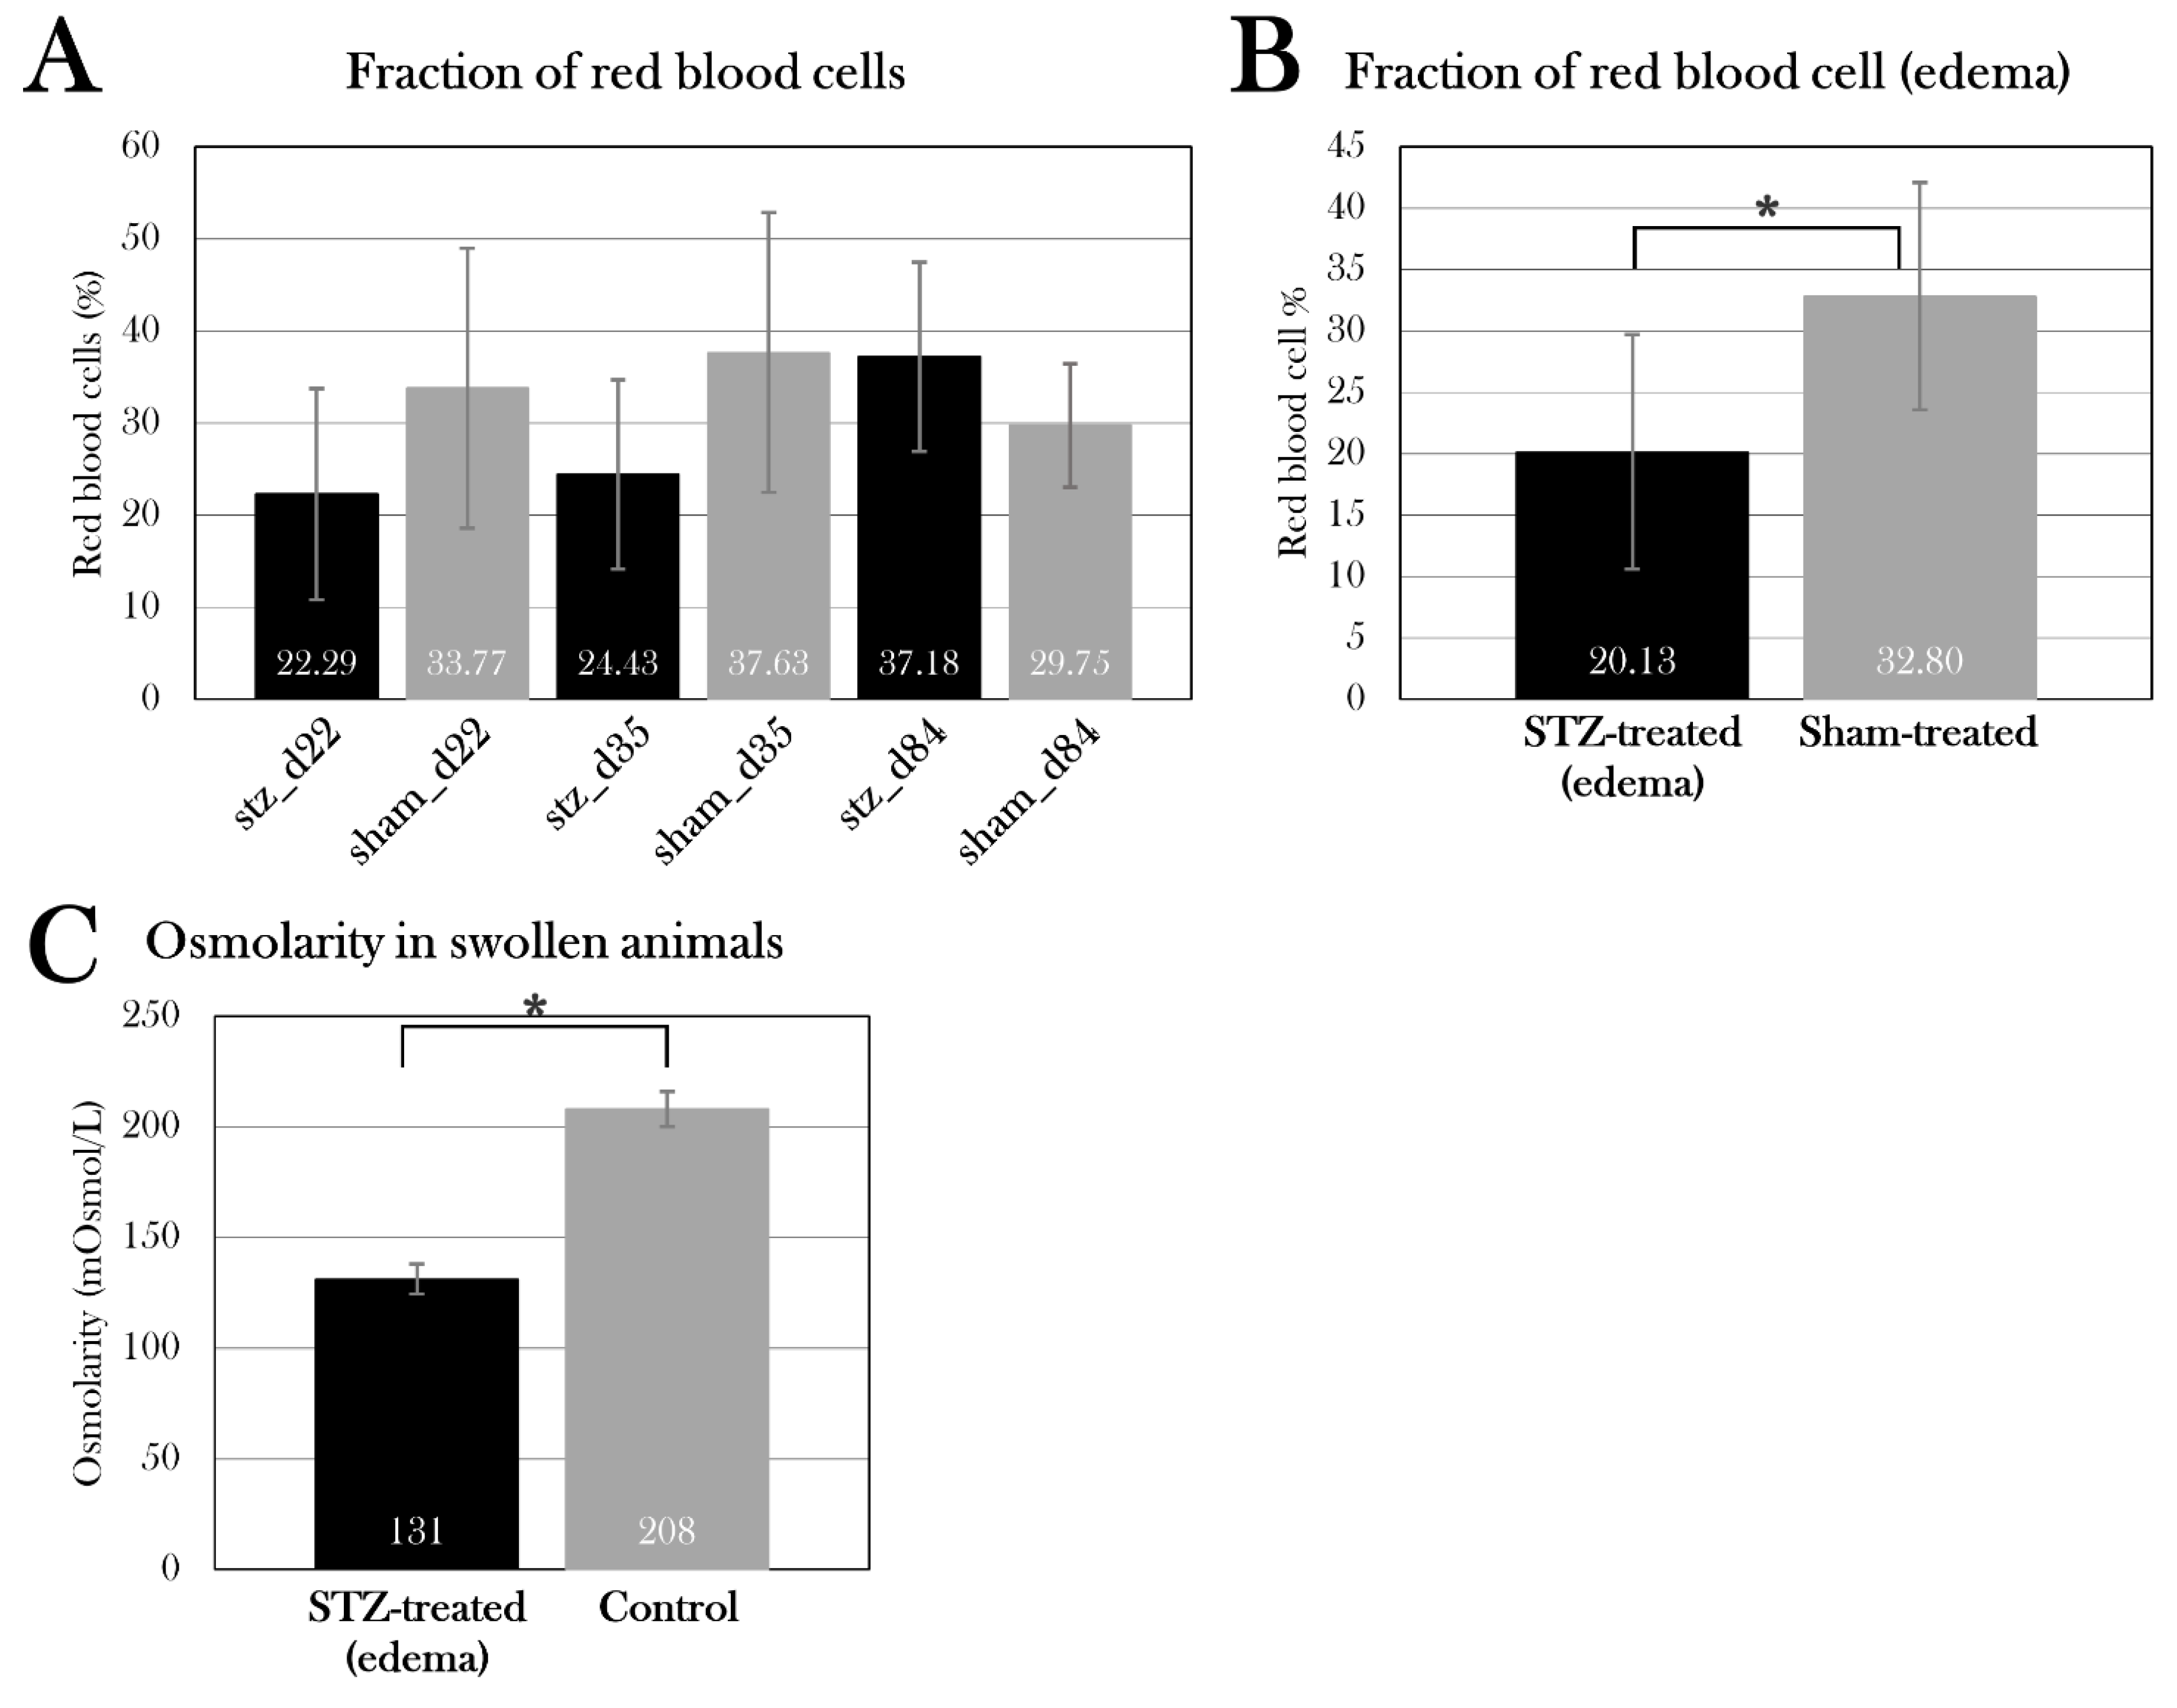
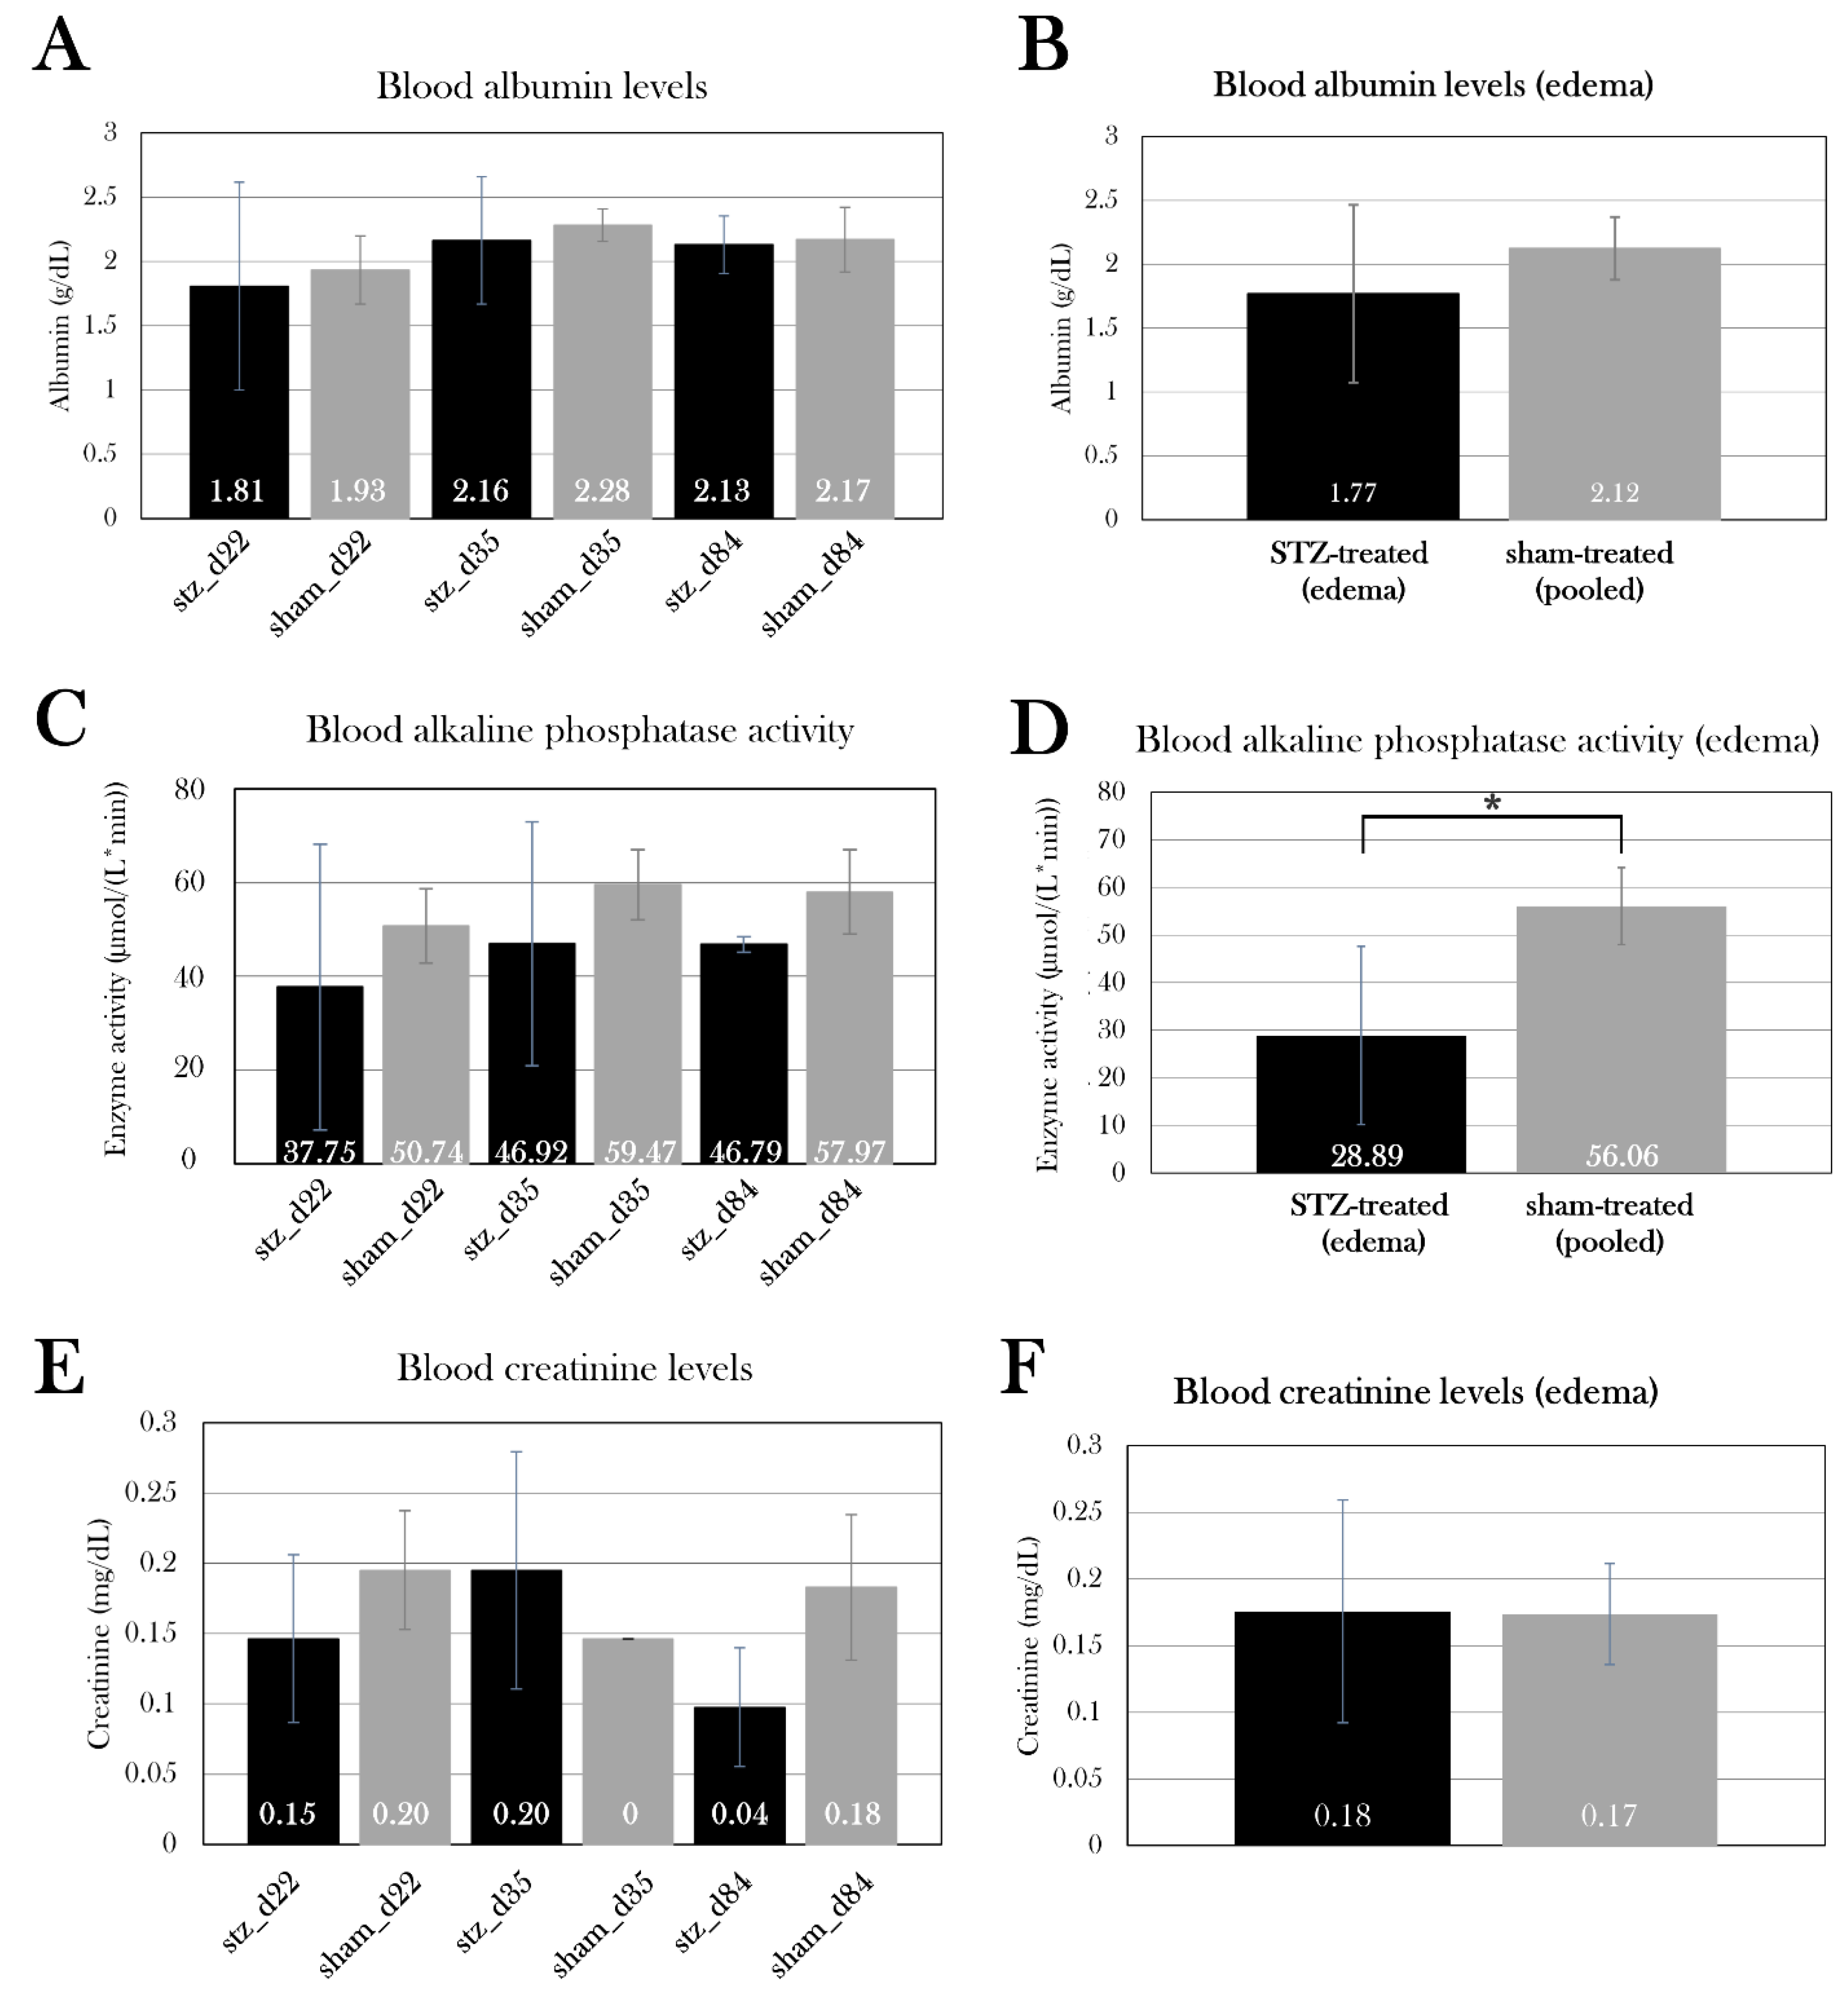
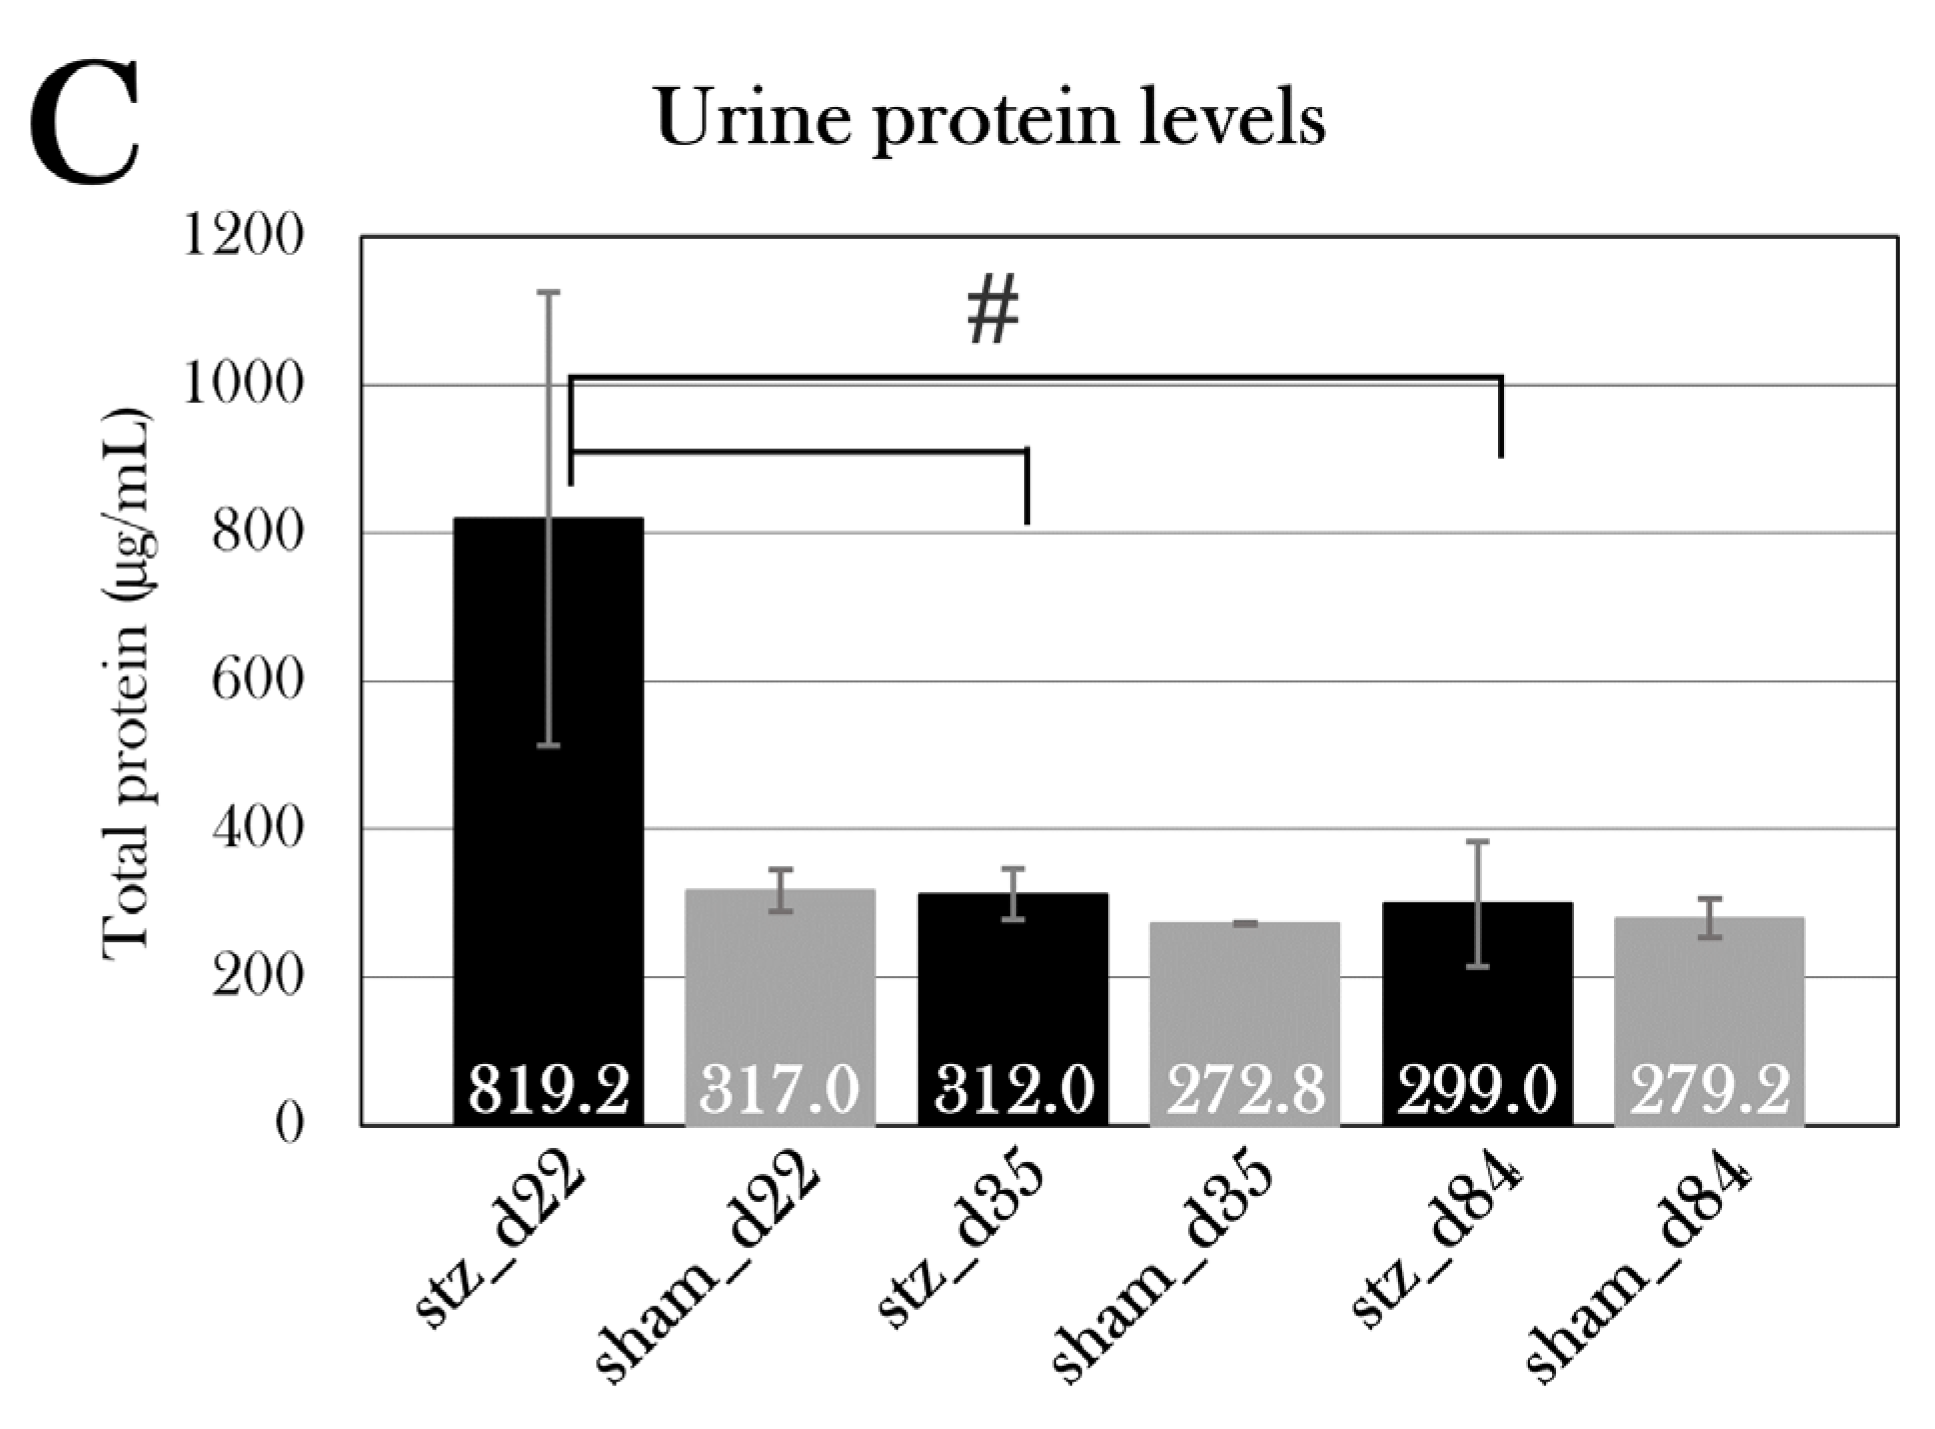
In part IV, potential whole-body effects of the STZ-induced diabetes were characterized by examination of changes in body mass, percentage of red blood cells in whole blood, plasma osmolarity, and several plasma and urine parameters.
Table 2. Data table of the animal groups used in the pilot study and the main study.
Group name Treatment type Mean start body mass (g) Mean end body mass (g) Mean of start and end length (snout to tail) (cm) # animals at the endpoint Color* Birth date
Pilot study groups
PS1 STZ 21.6±2.8 20.0±1.7 14.5±0.5 3 WT: 33.3% Leu: 33.3% Alb: 33.3% 10 March 2020
PS2 STZ 21.7±6.4 20.9±3.3 14.8±1.2 3 WT: 33.3% Leu: 33.3% Alb: 33.3% 10 March 2020
PS3 STZ 22.6±3.5 22.8±4.0 15.1±0.6 3 WT: 66.6% Leu: 33.3% Alb: 0% 10 March 2020
PS4 STZ 24.7±3.8 38.4±2.0 14.6±0.4 3 WT: 33.3% Leu: 66.6% Alb: 0% 10 March 2020
PS5 STZ 22.3±4.0 31.5±1.2 14.2±1.1 3 WT: 66.6% Leu: 33.3% Alb: 0% 10 March 2020
PS_control - 20.1±3.2 - 14.4±1.0 3 WT: 33.3% Leu: 33.3% Alb: 33.3% 10 March 2020
Ins_baseline - 40.3±9.1 - - 3 WT: 66.6% Leu: 0% Alb: 33.3% Mixed
Main study groups
Stz_d22 STZ 29.5±8.1 44.4±22.8 16.0±1.1 6 WT: 66.6% Leu: 33.3% Alb: 0% Mixed
Sham_d22 Sham 30.8±7.6 32.3±7.2 15.5±0.2 4 WT: 75% Leu: 25% Alb: 0% Mixed
Stz_d35 STZ 23.4±3.9 32.5±11.5 14.8±0.2 4 WT: 50% Leu: 25% Alb: 25% Mixed
Sham_d35 Sham 24.5±7.7 26.9±7.3 15.7±1.4 3 WT: 33.3% Leu: 66.6% Alb: 0% Mixed
Stz_d84 STZ 23.2±2.5 30.3±4.1 16.1±0.6** 5 WT: 0% Leu: 100% Alb: 0% 10 March 2020
Sham_d84 Sham 22.7±4.5 31.3±3.9 16.5±0.9** 6 WT: 33.3% Leu: 66.6% Alb: 0% 10 March 2020
*wt: wild type, leu: leucistic, alb: albino ** endpoint length only, as the start length of sham_d84 was not registered.

Axolotl Husbandry

Axolotls were bought from a local breeder and housed in groups of 1-3 animals. A mixture of wild type, leucistic, and albino salamanders of both sexes were included in the experiments (Table 2). Animals were housed in containers (39cm x 28cm x 14cm) with tap water and a water depth of 10cm at 19-22 and exposed to 12h light-dark cycles. Water was changed 2-3 times a week, and animals were fed 3 pills 3 times a week.
Animals acclimated to the housing conditions for one week and were fasting during the acclimatization period to achieve the correct dosage of STZ during the treatment period. During the treatment period, animals given STZ were kept under a fume hood to prevent contamination of the environment. Due to lack of space in the fume hood, the study groups were treated in different periods (Appendix A. – Study schedule). Animals were housed in lower water depth (6-7 cm depth) during the injection period, to minimize the production of STZ waste. For information on the used animals, see Table 2. The experiments were approved by the Danish National Animal Experiments Inspectorate (protocol# 2020-15-0201-00688).

Anesthesia

Animals were anesthetized by full-body submersion in 200 mg/L benzocaine solution (Sigma-Aldrich) dissolved in 2-3 mL acetone, in 2L water tanks. Animals were anesthetized for 20 min prior to STZ-, EdU-, and glucose injection and all blood collections, and they were anesthetized for a minimum of 30 min before euthanasia. Anesthesia is absorbed via the gills and transdermally, and animals were kept in paper towels soaked in anesthetic water during the procedures to keep them anesthetized. Following the procedures, the animals were moved to their normal housing and regained consciousness within an hour.

STZ Injection

Injections of the STZ/sham treatment were performed under a fume hood and with protective equipment (double nitrile rubber gloves and a back-closure gown). STZ (solid) (EMD Millipore Corp., cat. no: 572201) was kept at -20 before use and was diluted in amphibian Ringer’s solution and mixed well with a pipette. Sham-treated animals received an injection of amphibian Ringer’s solution without STZ. The dosage was adjusted to the body mass of the individual animal. The STZ solution was administered within 30 minutes of preparation. Animals were anesthetized and placed on wet blankets on a hard surface, and the STZ/sham solution was i.p. injected with a BD Micro-Fine 0.5 mL insulin syringe (30G). After injection, the animals were transferred to their normal housing and monitored until normal gill movement. Animals were fasting for 24h prior to STZ injections and a week prior to the first injection.

Glucose Tolerance Test

To monitor changes in blood glucose levels, animals were subjected to a glucose tolerance test. Animals were fasted for three days before each test. 1.75 mg/g body mass of a 30% D(+)-glucose solution (Sigma, cat. no. G8270) was injected into the vena cava after measurement of fasting blood glucose levels. After the injection, animals were placed in the normal living tank until the next blood collection. Blood glucose was measured at several time points over the span of 24h with a FreeStyle Precision Neo glucometer and glucose test strips (Abbott). In the pilot studies, blood glucose was measured 0h, 10min, 4h 40 min, 9h 20 min, 14h, and 24h after glucose injection. In the main studies, blood glucose was measured 0h, 10min, 14h, and 24h after glucose injection. Before euthanasia, blood glucose was measured 0h, 10 min, and 9h 20 min after glucose injection.

Blood Ketone Measurements

Blood ketone was measured before the glucose tolerance test with a FreeStyle Precision Neo glucometer and ketone test strips (Abbott).

Tissue Sample Harvest

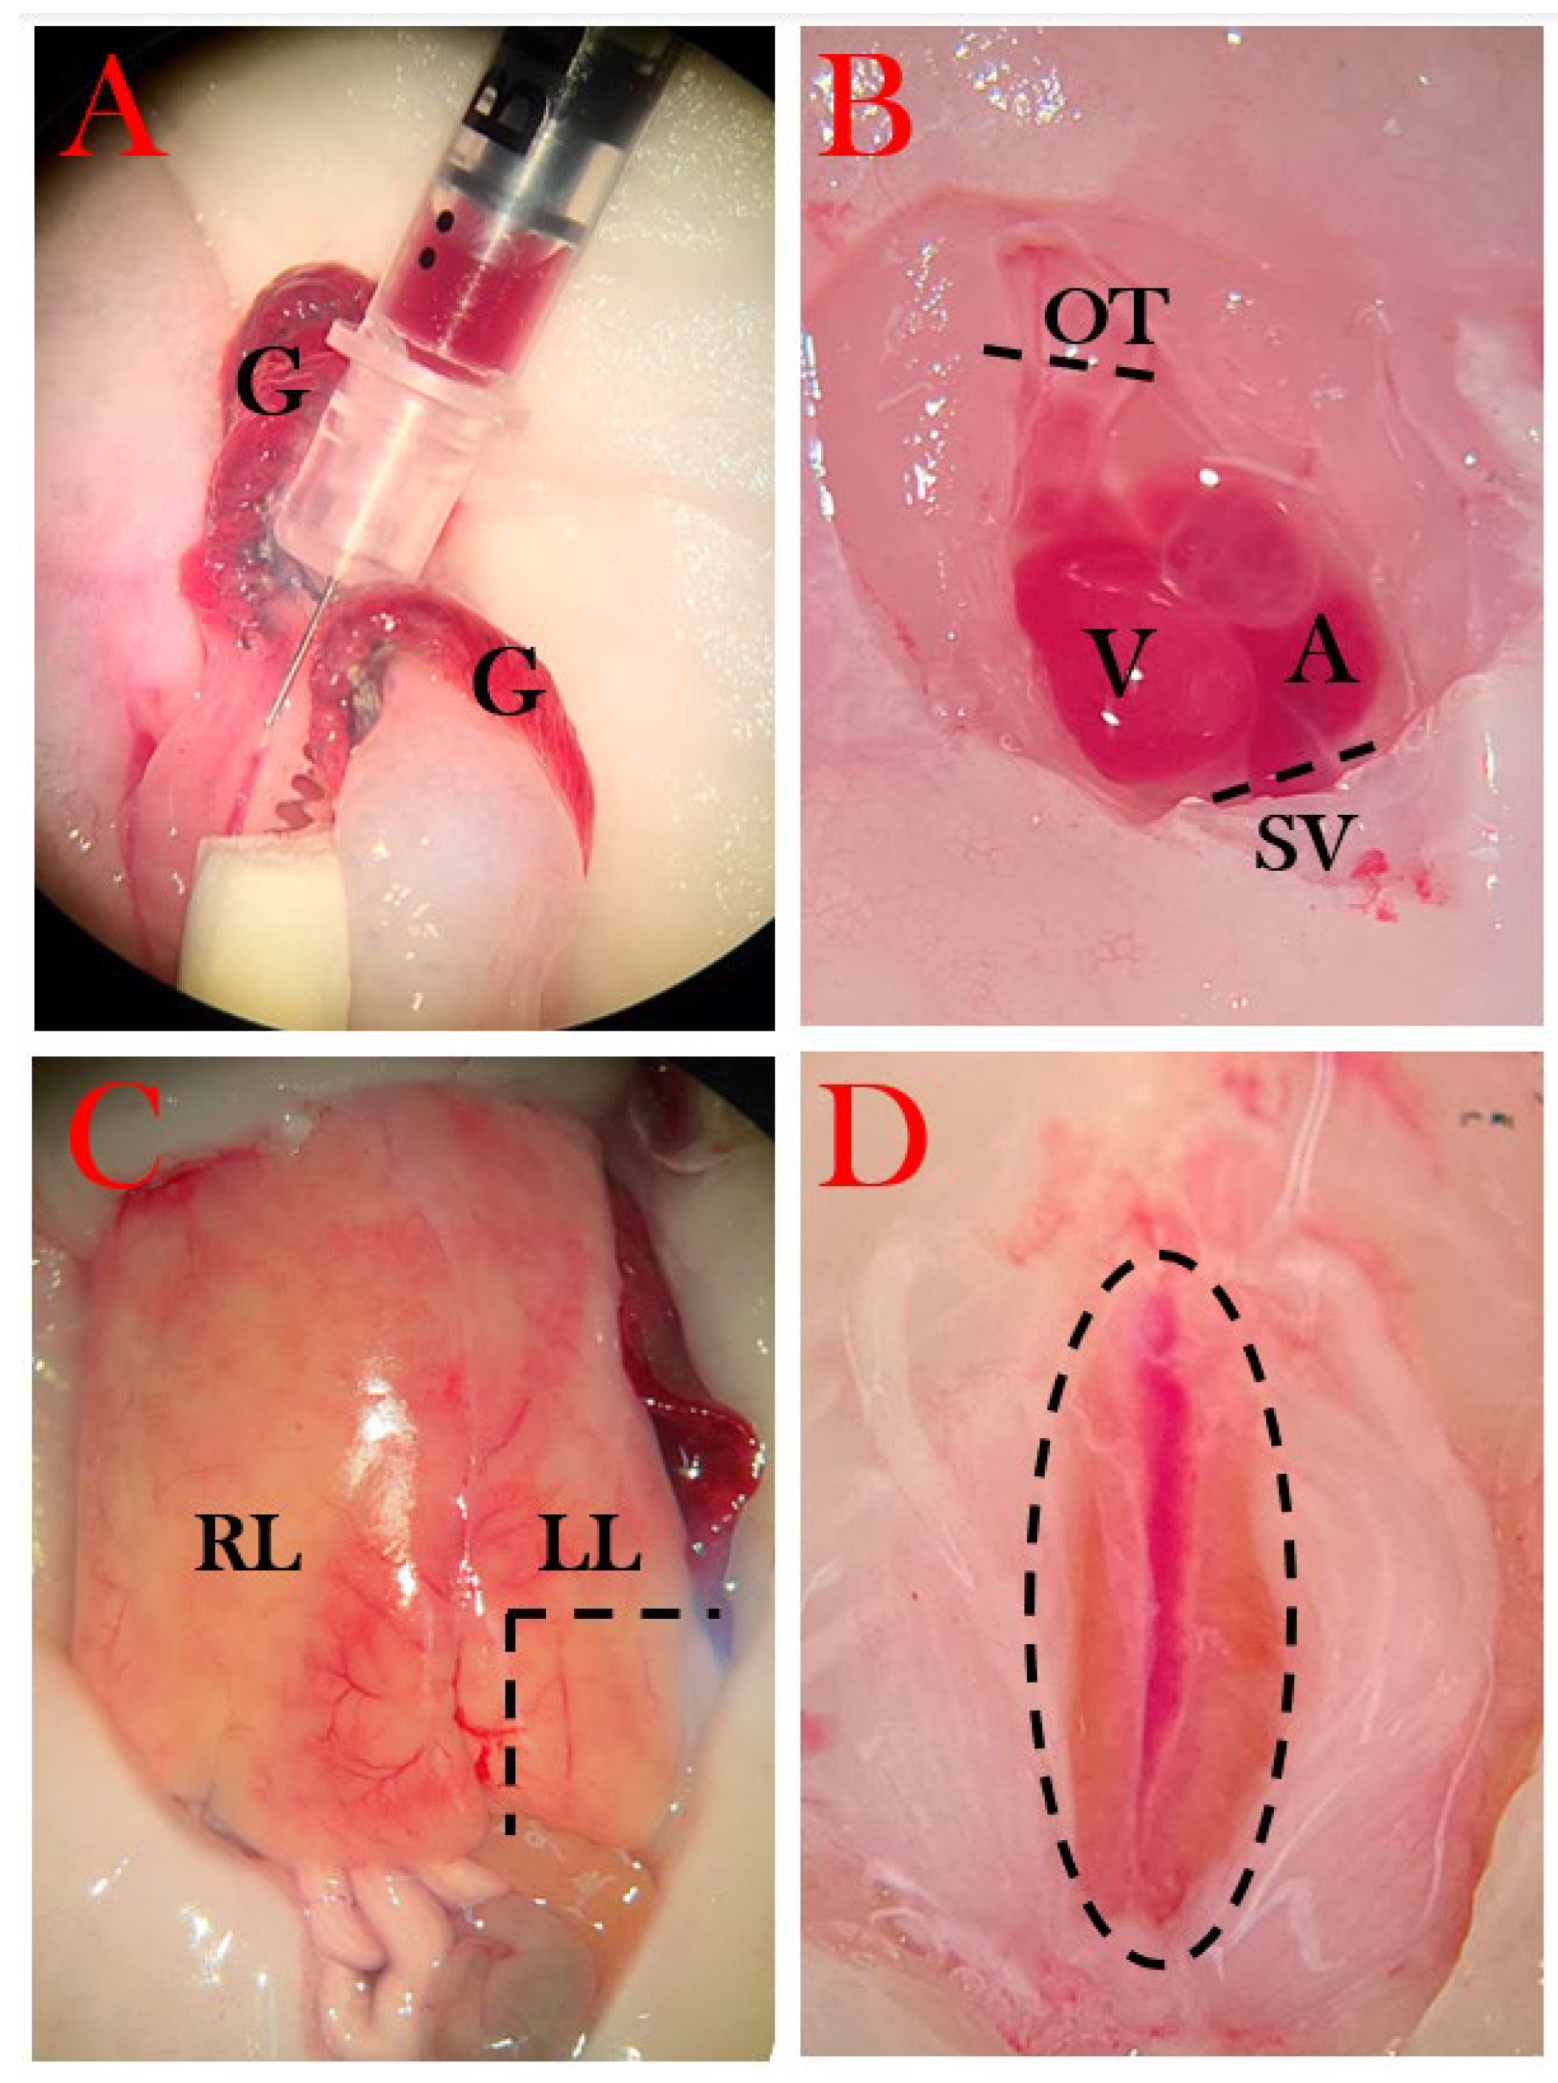
Blood was harvested either from gill arteries or directly from the heart (only at the endpoint) with firstly a heparin-coated 0.5 mL insulin syringe, followed by an EDTA (ethylenediaminetetraacetic acid)-coated syringe (Figure 4A). Whole blood was transferred to a pre-weighted Eppendorf tube and spun at 6000 rpm for 5 min, and plasma was collected and deposited in a new pre-weighed tube. The tubes were weighed, from which the percentage of red blood cells was calculated, followed by immediate snap-freezing in liquid nitrogen and storage at -80°C.
The thoracic cavity was opened using micro scissors by removing skin, muscle, and the cartilage plates protecting the heart, followed by an incision in the pericardium. The outflow tract was severed from which blood could be collected, followed by severing of other vessels (sinus venosus, among others) to free the heart (Figure 4B). The heart was moved to a petri dish with amphibian Ringer’s solution, in which it remained pulsating until most blood had exited the heart, and it was transferred to a mold and covered with OCT cryo embedding matrix (CellPath) before snap freezing in liquid nitrogen and stored in -80°C.
Next, the abdominal cavity was opened to expose the bladder. Urine was removed by carefully inserting a syringe while extending the bladder with a tweezer, and collected urine was transferred to a tube and snap-frozen.
A piece of the left liver lobe was excised and transferred to a mold and covered in OCT cryo embedding matrix followed by snap freezing (Figure 4C).
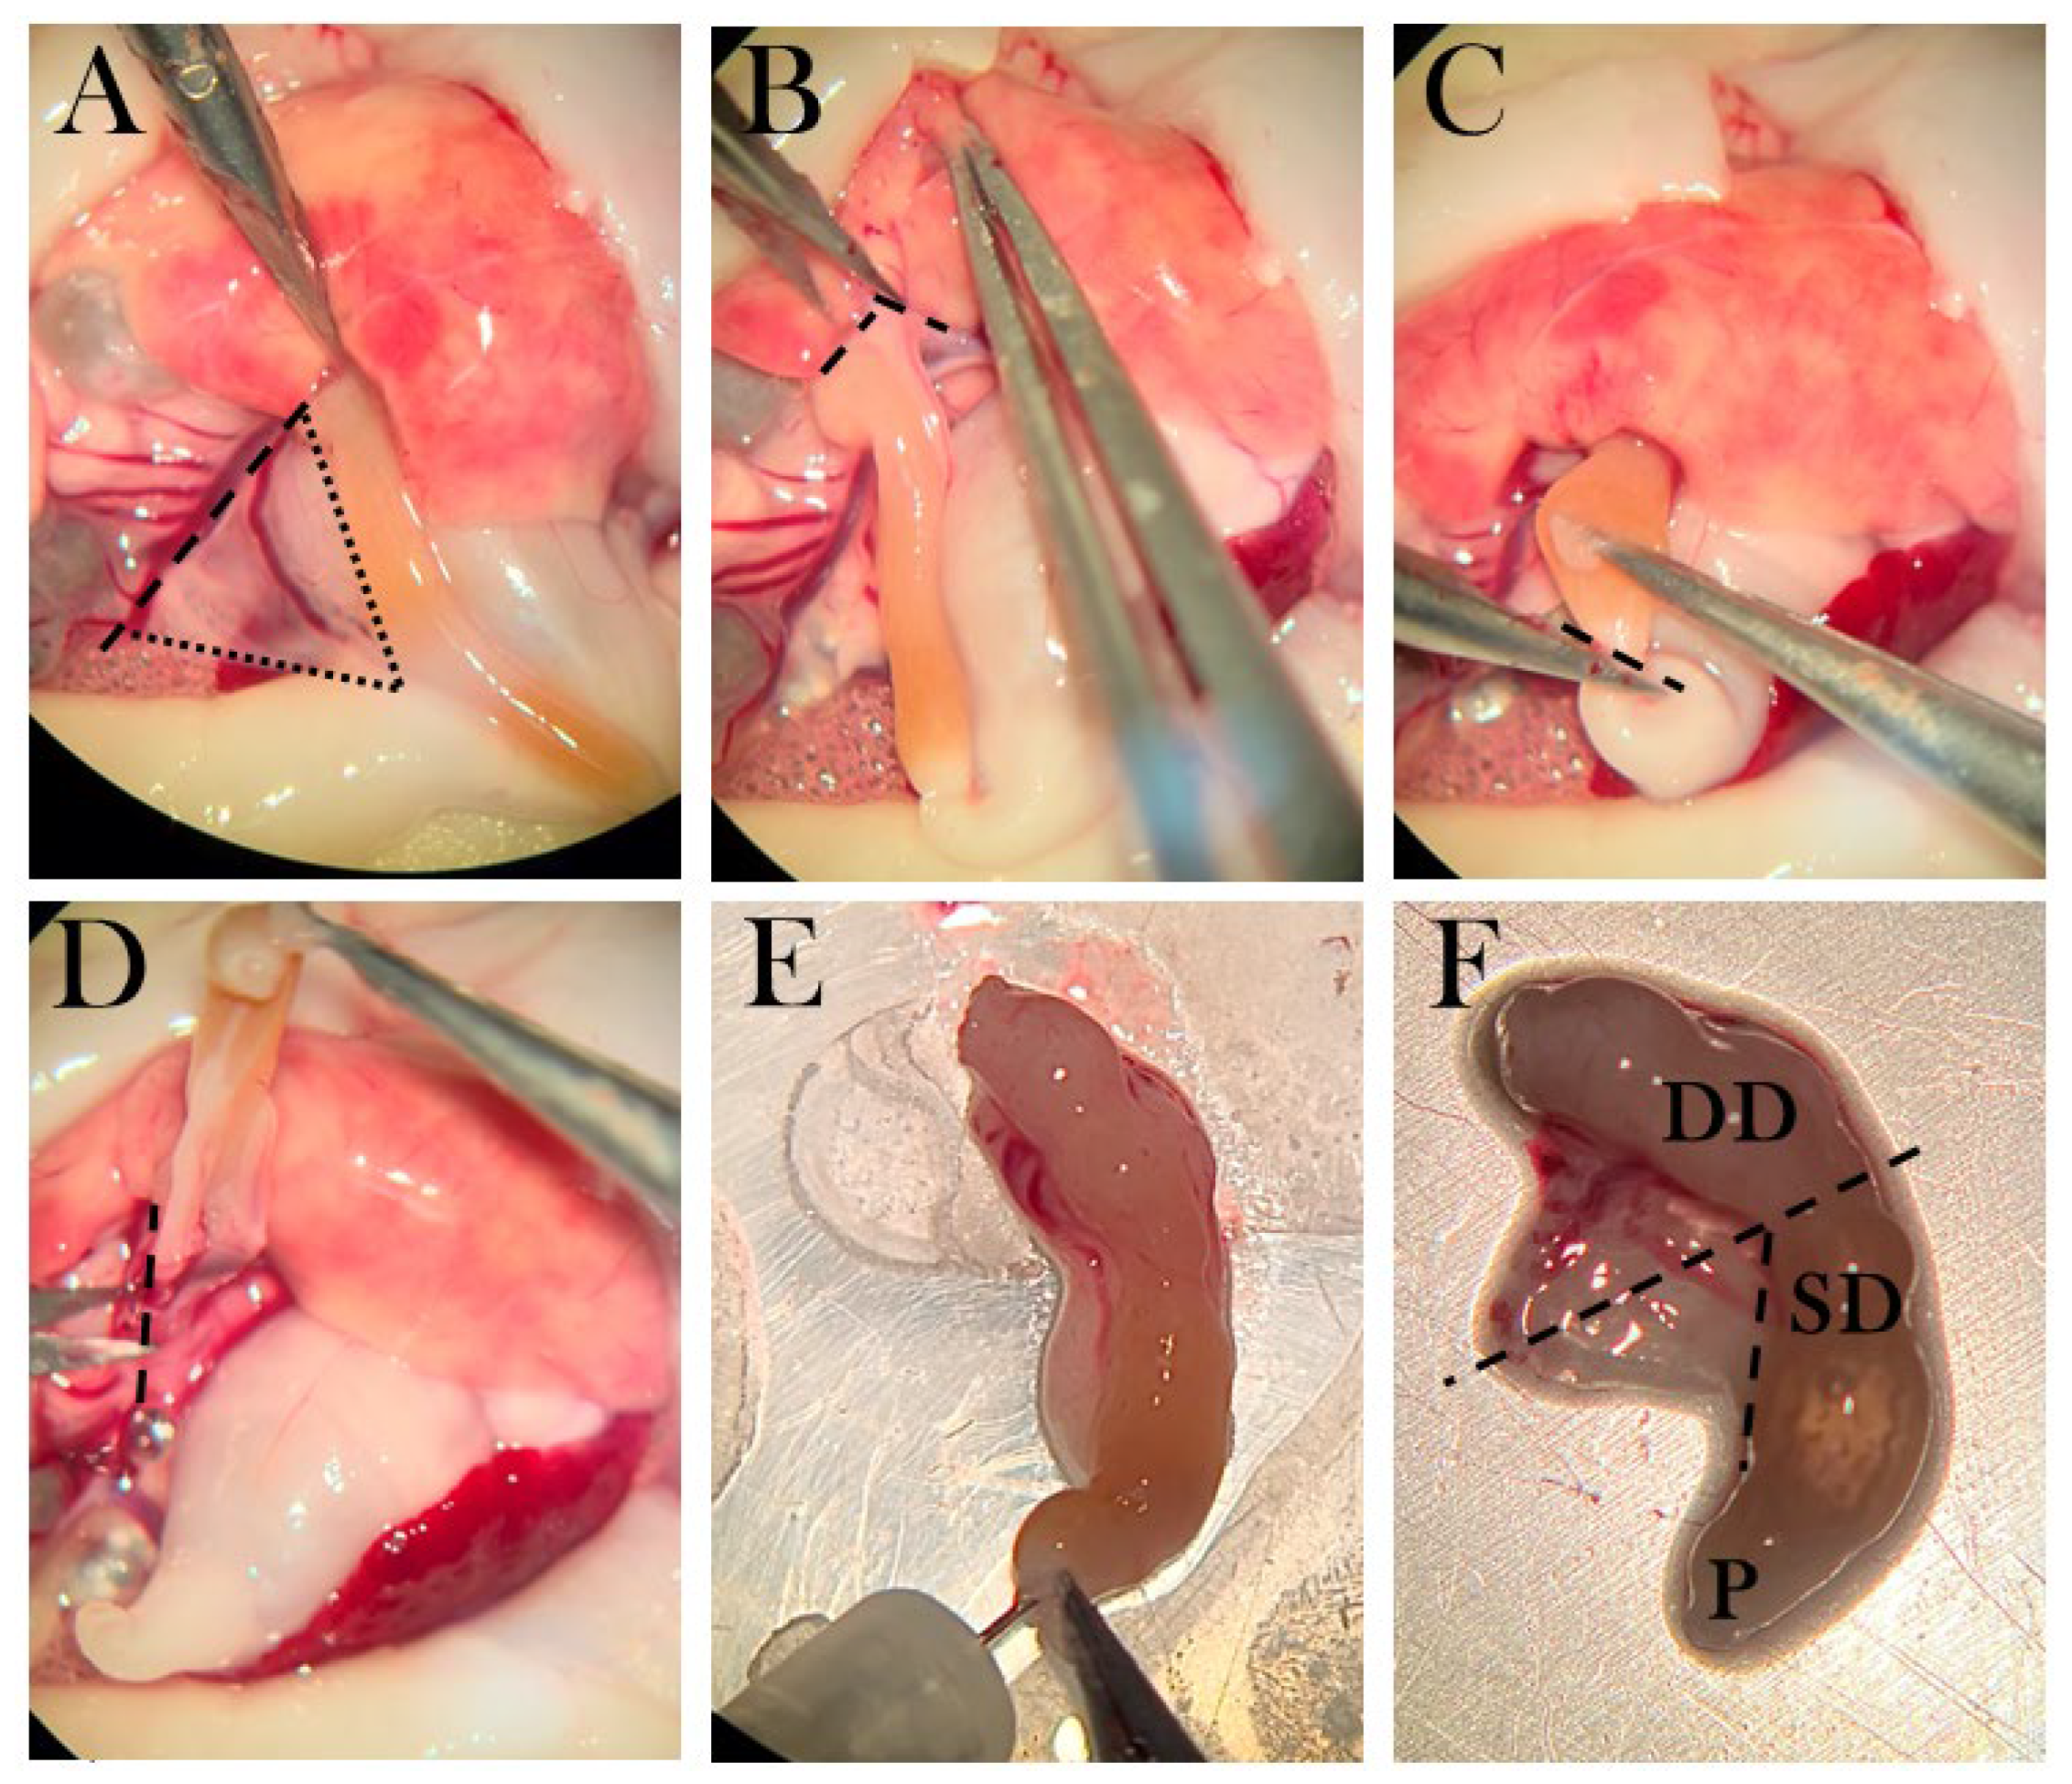
The pancreas was removed by first separating the liver lobe from the pancreas (Figure 5B), then severing the duodenum from the stomach (Figure 5C), and severing pancreas tissue from connecting tissue (Figure 5D). The pancreas was cleaned by rinsing with amphibian Ringer’s solution through the duodenal opening and by removing blood clots (Figure 5E). Next, the pancreas was severed at the midpoint, and the half attached to the duodenal part closest to the stomach was separated from the duodenum and transferred to a tube for later insulin measurements (Figure 5F). The other half was placed in OCT and snap-frozen.
The kidneys were removed by opening to the lower part of the abdominal cavity and first severing the rectum as close to the cloaca as possible, followed by separation of the kidney tissue from the abdominal wall (Figure 4D). It was transferred to an OCT-embedded mold and snap-frozen.
Lastly, the eyes were removed carefully with micro scissors, and the left eye was OCT-embedded in a mold, while the right eye was transferred to a tube and snap-frozen.
Figure 5. The dissection method of the pancreas. A) The triangular pancreas, in which dotted lines frame the organ and the striped line shows the incision from connective tissue. B) Pancreas is separated from the liver lobe. C) The duodenum is cut near the pylorus. D) Connective tissue is separated from the pancreas. E) The duodenum is rinsed with amphibian Ringer’s solution. F) The pancreas is connected to a superior duodenal (SD) part near the pylorus (P) and a descending part (DD). Striped lines indicate the incision points, in which the part connected to SD is transferred to a tube for ELISA, and the part connected to DD is transferred to a mold.
Preprints 67511 g005

Osmolarity

Osmolarity was measured on plasma samples from swollen animals using an osmometer (Advanced Instruments, Inc., Model 3320).

Histology and Immunostaining

Frozen pancreas tissue was sectioned as follows. A 7 µm section was placed on one slide, and the next 7 µm section was discarded before placing the next 7 µm section on the next slide, creating a series of neighboring sections with 7 µm between each (Figure 6). There were prepared 2-3 slides for every stain type, and the four best neighboring pancreas sections were chosen using the hematoxylin-stained slides for guidance, and the best sections were used in the immunofluorescence staining procedures. Sections were stored at -80°C.

Hematoxylin Staining

All sections in the hematoxylin slide series were equilibrated to RT (room temperature) for 5-7 min before fixation in methanol for 1 min, followed by washing in demineralized water. Slides were immersed in RT-equilibrated hematoxylin (Sigma-Aldrich, cat. No. GHS316) for 1 min, and slides were washed and dried, before applying Eukitt Quick-hardening mounting medium (Sigma-Aldrich, cat no. 03989) and coverslips.

Staining of Apoptotic Cells with a TUNEL Assay in the Pancreas

Four neighboring pancreas sections were chosen to examine apoptotic cells and insulin-positive cells.
To stain apoptotic cells, the Click-iT Plus TUNEL Assay (Invitrogen) was used. All stock solutions were prepared per the manufacturer’s protocol.
Firstly, tissue sections were equilibrated to RT for 5-7 min before fixation in 4% paraformaldehyde (PFA) (Alfa Aesar, cat no. J61899) for 15 min in RT, washed in 70% Phosphate-buffered saline (PBS), and permeabilized using 1:25 proteinase K in PBS solution, followed by incubation for 7 min in RT in a humidity chamber. Slides were then washed in PBS for 2x 5 min and fixated again in 4% PFA for 5 min. The washing step was repeated twice, and slides were rinsed in deionized water before the addition of TdT reaction buffer for 10 min at 37 °C to perform the TdT reaction. The TdT reaction buffer was removed, and 50 µL of TdT reaction mixture (47 µL TdT reaction buffer, 1 µL EdUTP, and 2 µL TdT enzyme) was added to each tissue section, then incubated for 1h at 37 °C in the humidity chamber. The slides were rinsed in deionized water and immersed in permeabilizing solution (3% bovine serum albumin (BSA) and 0.1% Triton X-100 in PBS (Sigma)) for 5 min, followed by 2x 5 min wash in 70% PBS. The Click-iT Plus reaction was performed by adding 50 µL Click-iT Plus TUNEL reaction cocktail (45 µL Click-iT Plus TUNEL Supermix and 5µL 10X Click-iT Plus TUNEL reaction buffer additive) and incubated for 30 min in 37 °C in darkness, before 5 min washing in 3% BSA and 2x 5 min wash in 70% PBS, thus ending the TUNEL stain.

Staining of Insulin-Positive Cells in the Pancreas

Following the TUNEL stain, sections were immersed in blocking buffer (PBS with 3% BSA and 5% normal goat serum) for 3h in RT and under gentle shaking. Primary antibody against insulin (Insulin/proinsulin monoclonal antibody (D3E7 (5B6/6), ThermoFisher Scientific, cat no. MA1-83256) was diluted in a 50% blocking buffer in PBS solution (1:75) and added to sections, followed by overnight incubation in a humidity chamber at 4°C. After removal of the primary antibody and 5x 5 min of washing in PBS, goat anti-mouse IgG1 Alexa Fluor 488 secondary antibody (ThermoFisher Scientific, cat no. A-21121) in a 50% blocking buffer in PBS solution (1:500) was applied and incubated in a humidity chamber at RT for 3h in darkness. Slides were again washed 5x 5 min in PBS, air-dried, and DAPI Diamond mounting media (ThermoFischer Scientific, cat no. P36966) was applied. Coverslips were added and cured in RT for at least 24h before imaging. For storage, slide edges were sealed with nail polish, and slides were kept in darkness at 4°C before imaging.

Staining of glut2-Positive Cells in the Pancreas

GLUT2 polyclonal primary antibody (ThermoFisher Scientific, cat no. PA5-77459) was evaluated on control pancreas, liver, and kidney tissue. Slides were fixated for 10 min in PFA, followed by 3x 5 min washing. Staining was evaluated both with and without a permeabilization step (15 min with 0.25% Triton X-100). Slides were washed 2x 5 min and blocked with 3% BSA and 5% goat serum in PBS for 3h. The primary antibody was assessed in three concentrations (1:50, 1:100, and 1:500) in 50% blocking buffer in PBS and incubated for 24h in a humidity chamber at 4°C. After washing 5x 5 min, goat anti-rabbit IgG (H+L) Alexa Fluor 647 secondary antibody (ThermoFisher Scientific, cat no. A32733) was used as secondary antibody and applied to the sections, followed by incubation in a humidity chamber for 3h in RT. Slides were mounted with DAPI Diamond mounting media and covered with coverslips. Slides were stored in darkness at 4°C before imaging.

Staining of Proliferating Cells in the Pancreas

Neighbor sections were stained for proliferating cells using a Click-iT® EdU Imaging Kit (Invitrogen, cat no. C10637), in which 5-ethynyl-2’-deoxyuridine (EdU) is incorporated into DNA during active DNA synthesis.

Injection of EdU Solution

Firstly, EdU was injected into animals 24h before euthanasia. Animals were anesthetized as described previously. EdU was dissolved in Amphibian Ringer’s solution shortly before use. Animals received 0.035 mg/g body mass of EdU solution using body weight measurements from one week before the time of injection to adjust to the edema seen in some animals and to minimize expenses. Animals were placed in wet towels on ice for 1h before returning to normal housing.

Staining of Pancreas Tissue Sections

Slides with tissue sections were fixated in a 4% PFA solution for 15 min and washed in 3% BSA in PBS 2x 5 min and in 70% PBS 2x 5 min, followed by permeabilization in 0.5% Triton X-100 in PBS for 20 min and washed again as mentioned before. For EdU detection, 100 µL Click-iT® reaction cocktail was added to each tissue section and incubated for 30 min in RT in darkness. The Click-iT® was prepared per the manufacturer’s protocol, by mixing 86 µL 1X Click-iT® reaction buffer, 4 µL CuSO4, 0.24 µL Alexa Fluor® azide, and 10 µL reaction buffer additive per tissue section (ingredients were added in this order).
After reaction cocktail incubation, slides were washed as before and nuclear stained by adding 100 µL Hoechst 33342 solution (1:2000 in PBS) and incubated for 30 min in darkness. The nuclear stain was removed, and the slides were washed as before, including a wash in dH2O before mounting with ProLong Diamond Antifade Mountant (ThermoFischer Scientific, cat. no. P36965). Sections were placed in darkness in RT for 24h and then moved to 4 before imaging.

Imaging and Analysis

All stained slides were imaged using a slide scanner (Upright Widefield Fluorescence) Olympus VS120 at Health Bioimaging Core Facility, Aarhus University.
Hematoxylin-stained slides were imaged in 20x magnification, while immunofluorescence-stained slides were imaged in 40x magnification.
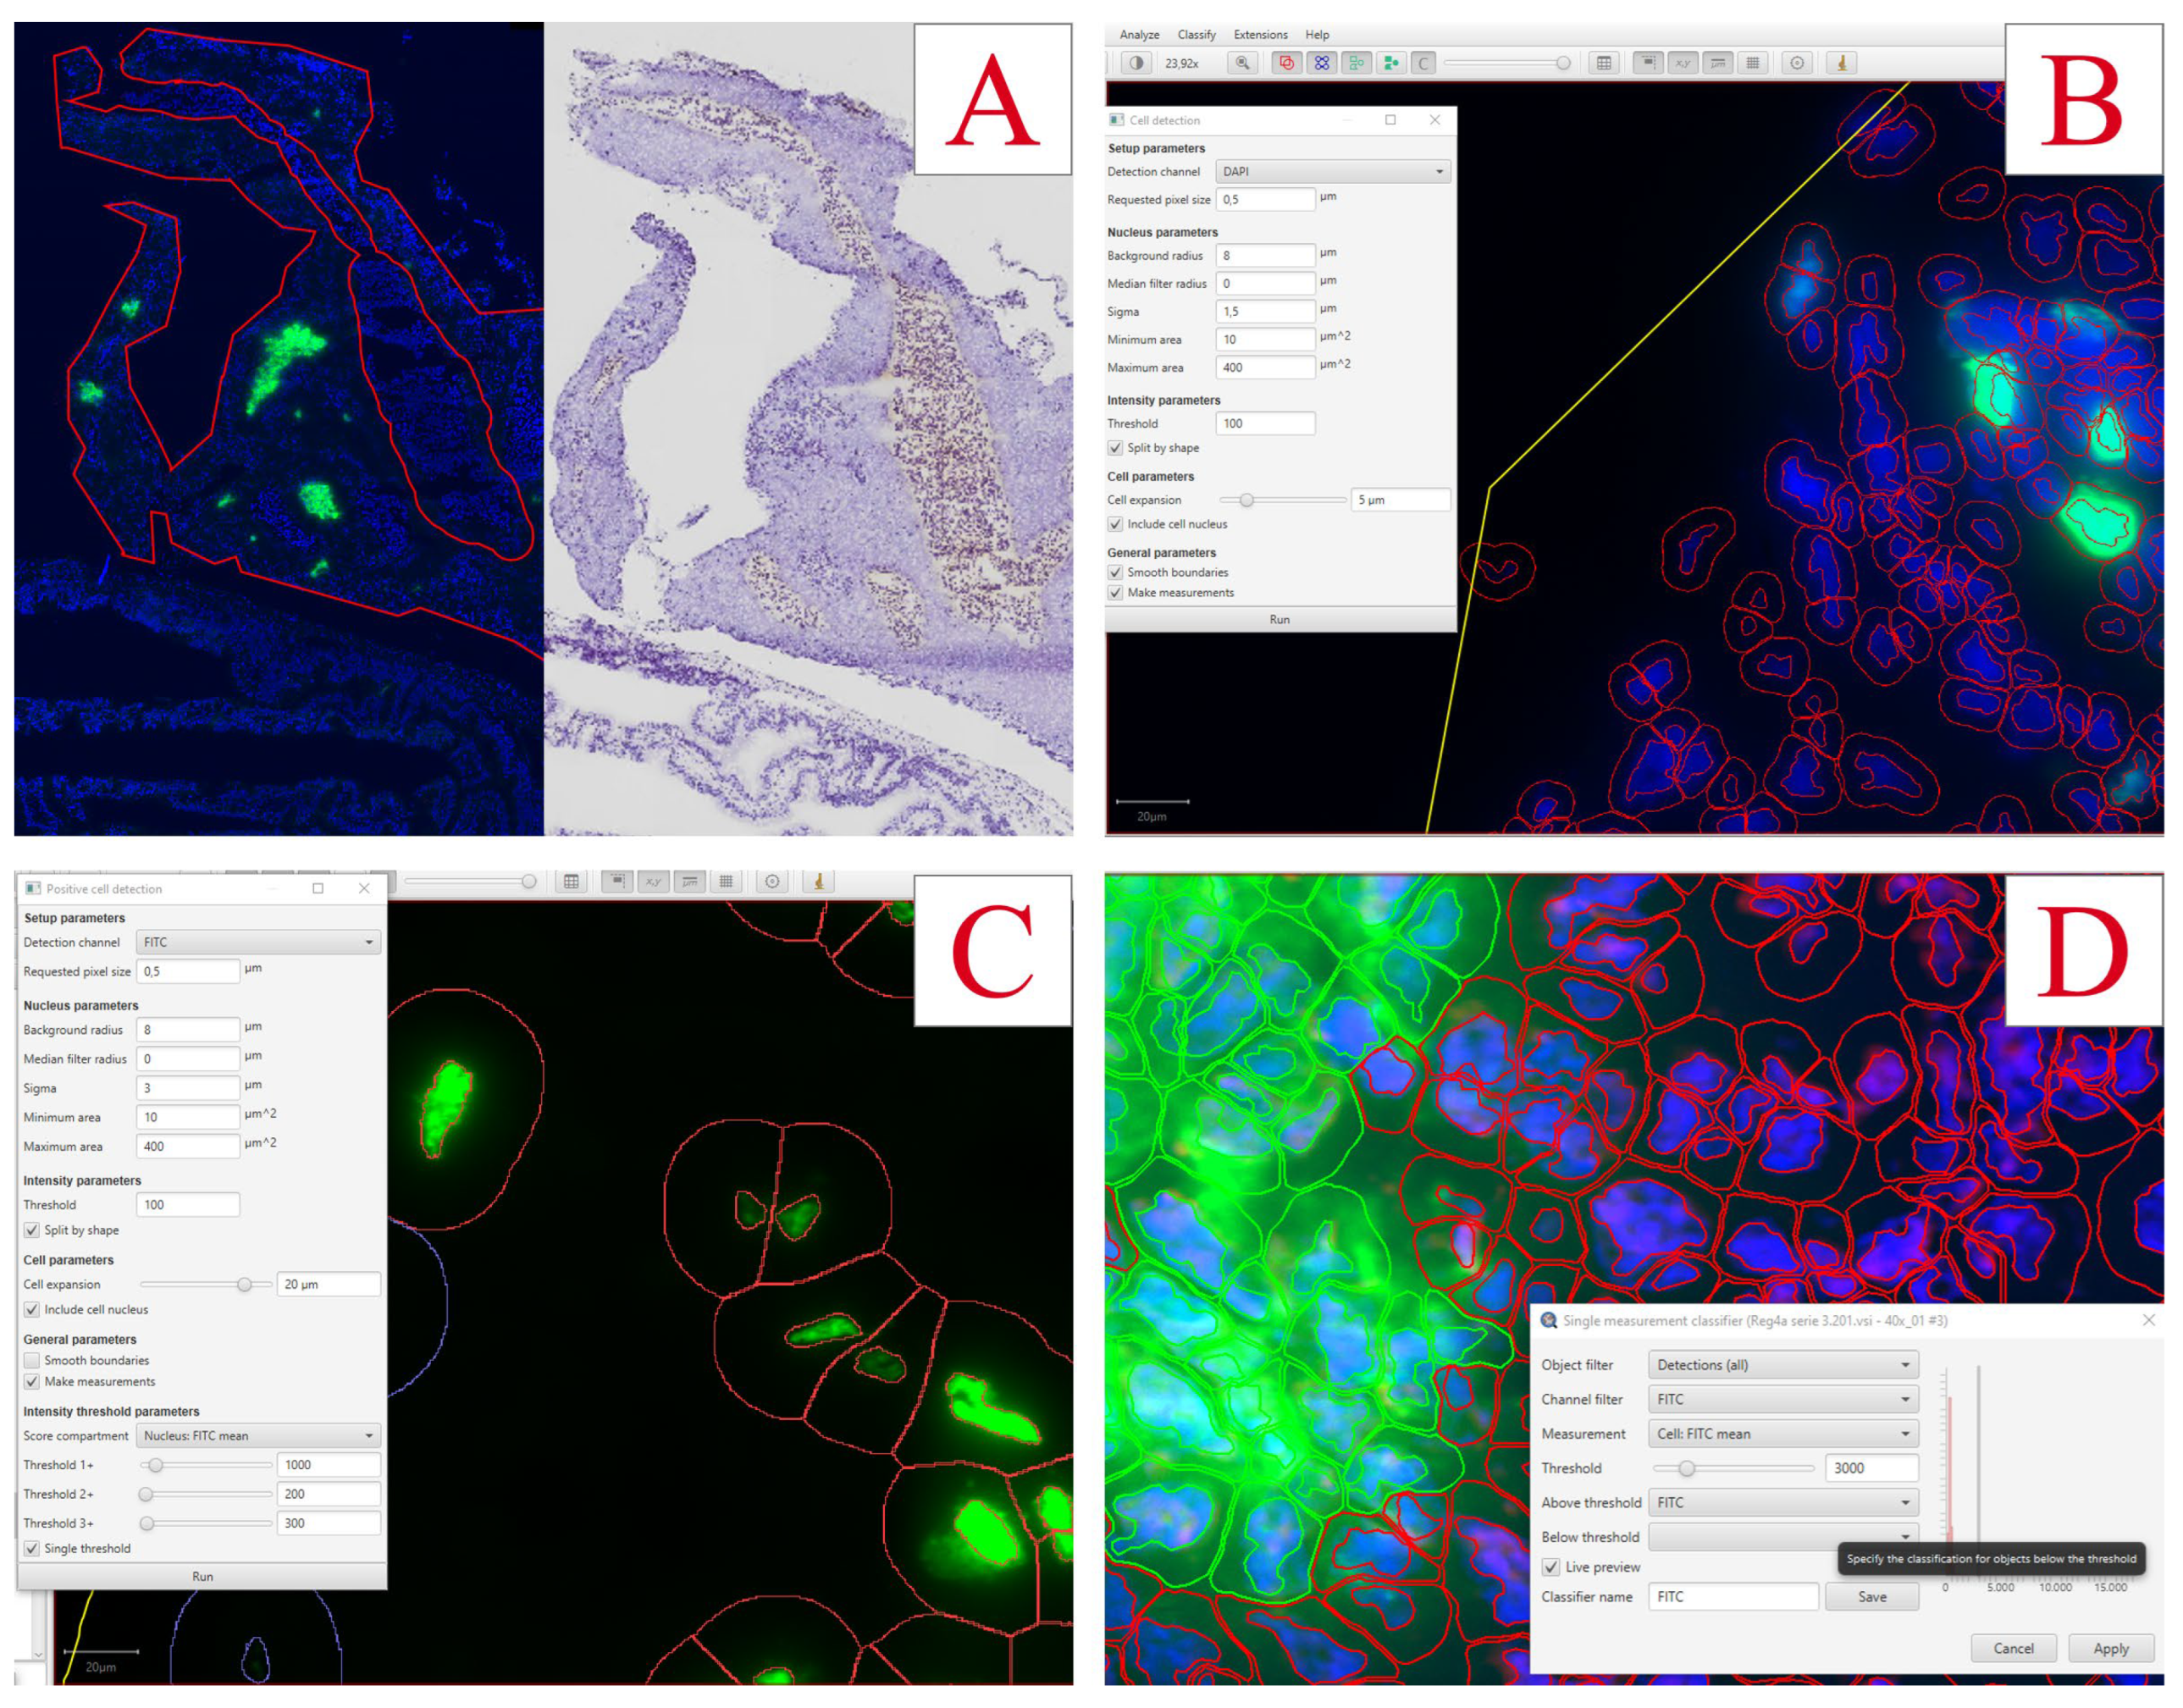
Insulin-positive cells and EdU-positive cells were quantified using QuPath v0.3.2 Software. The pancreas was defined as the region of interest using the QuPath toolset and by comparing it to the hematoxylin stains of neighbor sections (Figure 7A). The total number of cells was detected using the DAPI channel with the Cell Detection tool accessed by the following commands: Ctrl+L => Cell detection (Figure 7B). With small adjustments to the nucleus parameters and a threshold of 100, nuclei were detected for all cells in the region. To find a fitting threshold for all channel detections, intensity measurements of all detected cells were evaluated by the following commands: Measure => Show detection measurements.
For EdU-positive cells, FITC-stained nuclei were detected by following commands: Ctrl+L => Positive cell detection (Figure 7C). The sigma value was set to 3, the threshold to 100, and the tool was set to detect the mean FITC intensity in the nucleus.
For insulin-positive cells, FITC-stained cells were detected by first detecting DAPI-positive cells and then classifying insulin-positive cells with the following commands: Classify => Object classification => Create single measurement classifier (Figure 7D). The classifier was set to measure FITC mean intensity in the total cell with a threshold of 3000. To detect cells fitting this classification: Classify => Object classification => Load object classifier.
For both EdU-positive cells and insulin-positive cells, the percentage of positive cells compared to the total number of cells was calculated for each section. Four sections per animal were used in the analyses, and a mean percentage of positive cells was found for each animal and used for statistical analysis.
Figure 7. Analyses of immunofluorescence staining in pancreas using QuPath Software. A) Pancreas tissue is outlined using QuPath tools, and the hematoxylin-stained neighbor section is used as reference. B) The settings for cell detection using the DAPI nuclear stain. C) The settings used for detecting EdU-positive cells. D) The settings used for the detection of insulin-positive cells.
Preprints 67511 g007

Measurement of Insulin in Plasma and Pancreas Tissue with ELISA

A mouse insulin enzyme-linked immunosorbent assay (ELISA) kit (Invitrogen, cat no. EMINS) was assessed using both plasma samples and excised pancreas tissue to investigate the possibility to quantify the amount of insulin in the tissue. The plasma was collected with EDTA-coated syringes and the pancreas tissue was collected as described in Tissue sample harvest. The kit was used per the manufacturer’s instructions and all reagents were diluted as instructed. To calculate the concentration in the samples, a standard curve was prepared with concentrations ranging from 400-6.25 µIU/mL.

Pancreas Tissue Extraction

Tissue extract was prepared using a Tissue Extraction Reagent II (Thermofischer Scientific), Halt protease inhibitor cocktail, and EDTA (ThermoFischer Scientific, cat no. 87786).10 mL per 1g tissue of tissue extraction solution was prepared by mixing tissue extraction reagent with 1% inhibitors and 1% EDTA. The tissue and the tissue extraction solution were added to the tube with beads, and the tissue was centrifugally homogenized with the following settings: Cycles: 6, speed: 3500, time: 15 min. The tissue solution was transferred to an Eppendorf tube and was centrifuged at maximal speed for 5 min, followed by collection of the supernatant for usage in the ELISA kit.

Dilution of Samples

To find the appropriate concentration for both plasma samples and pancreas tissues, several dilutions were evaluated as follows. Two plasma samples from control animals were diluted with a dilution factor of 1, 2, 4, 8, and 20. As for pancreas extract, dilution factors of 2, 4, 8, 20, 40, 100, 140, 200, 300, 400, 600, 750, 1000, 1200, and 2000 were assessed.

The ELISA Procedure

100 µL of samples (dilutions of pancreas supernatant and plasma), blanks, and standards were loaded in duplicates on the insulin-coated 96-well plate, and the plate was incubated at a shaker for 2.5h with a speed of 200 rpm at 20 . After incubation, the wells were washed by adding 4x 300 µL of wash buffer, followed by the addition of 100 µL biotin solution and incubation for 1h with the same settings. The washing step was repeated, and 100 µL streptavidin-horseradish peroxidase solution was added to each well and incubated for 45 min. Again, the wells were washed as before, and 100 µL 3,3',5,5'-Tetramethylbenzidine (TMB) substrate was added, and the plate was incubated for 30 min in darkness, followed by the addition of 50 µL stop solution to each well, and the OD450nm was measured. Curve fitting of the standard curve was used to calculate the concentrations of the samples, giving the following equation: y = 0.0057 x 0.1748 .

Measurements of Blood Parameters with Microplate Assays

Blood samples were collected from axolotl gills and heart at the endpoint using a heparin-coated syringe and transferred to an Eppendorf tube as described previously (see Tissue sample harvest).

Albumin Assay

Albumin was measured in the plasma by using the QuantiChrom BCP Albumin Assay Kit (BioAssay Systems, cat no. DIAP-250). Plasma was thawed on ice and 20 µL was used from each animal for the assay. The standard curve was performed using BSA.
20 µL plasma or standard was added to each well in a 96-well plate, followed by adding 200 µL working solution. The plate was incubated for 5 min in RT and OD610nm was measured using a Synergy H1 microplate reader (BioTek).
Albumin concentration was calculated using the equation of the standard curve where x is the concentration of albumin and y is the measured optical density:
y = 0.0018 x 3 + 0.0206 x 2 + 0.0895 x

Alkaline Phosphatase Activity Assay

Alkaline phosphatase activity was measured using QuantiChrom Alkaline Phosphatase Assay Kit (BioAssay Systems, cat no. DALP-250). Plasma was thawed on ice and 10 µL was collected from each animal for the assay. The working solution was prepared by mixing 200 µL Assay Buffer, 5 µL Mg Acetate (final concentration of 5 mM), and 2 µL pNPP liquid substrate (10 mM) for each well. For concentration calculations, 200 µL distilled water and 200 µL Calibrator were added in duplicates. As for samples, 10 µL plasma was added in singlets, followed by the addition of 190 µL working solution. OD405nm was measured at t=0 and t=4 min on a plate reader.
The alkaline phosphatase activity was calculated with the following equation:
A P   a c t i v i t y = O D s a m p l e ( t = 4 m i n ) O D s a m p l e t = 0 · R e a c t i o n   v o l u m e ( O D c a l i b r a t o r O D H 2 O ) · S a m p l e   v o l u m e · t · 35.3
In which t shows minutes between measurements.

Creatinine Assay

Creatinine was measured in plasma samples using QuantiChrom Creatinine Assay Kit (BioAssay Systems, cat no. DICT-500). Plasma was thawed on ice and 10 µL was collected from each animal for the assay. Plasma was diluted in distilled water to a total volume of 30 µL. The standard was diluted by adding 5 µL 50 mg/dL standard stock to 120 µL distilled water, resulting in a concentration of 2 mg/dL, and 30 µL was added in doublets to a 96-well plate. 30 µL diluted plasma was added in singlets to the plate, followed by the addition of 100 µL of a 1:1 solution of Reagent A and Reagent B to each well. OD510nm was measured after 0 min (t=0) and 5 min (t=5) using a Synergy H1 microplate reader (BioTek).
Creatinine concentration was calculated with the following equation:
c r e a t i n i n e = O D s a m p l e ( t = 5 m i n ) O D s a m p l e ( t = 0 ) O D s t a n d a r d ( t = 5 m i n ) O D s t a n d a r d ( t = 0 m i n ) · [ s t a n d a r d ]

Glucose Measurements of Urine Samples

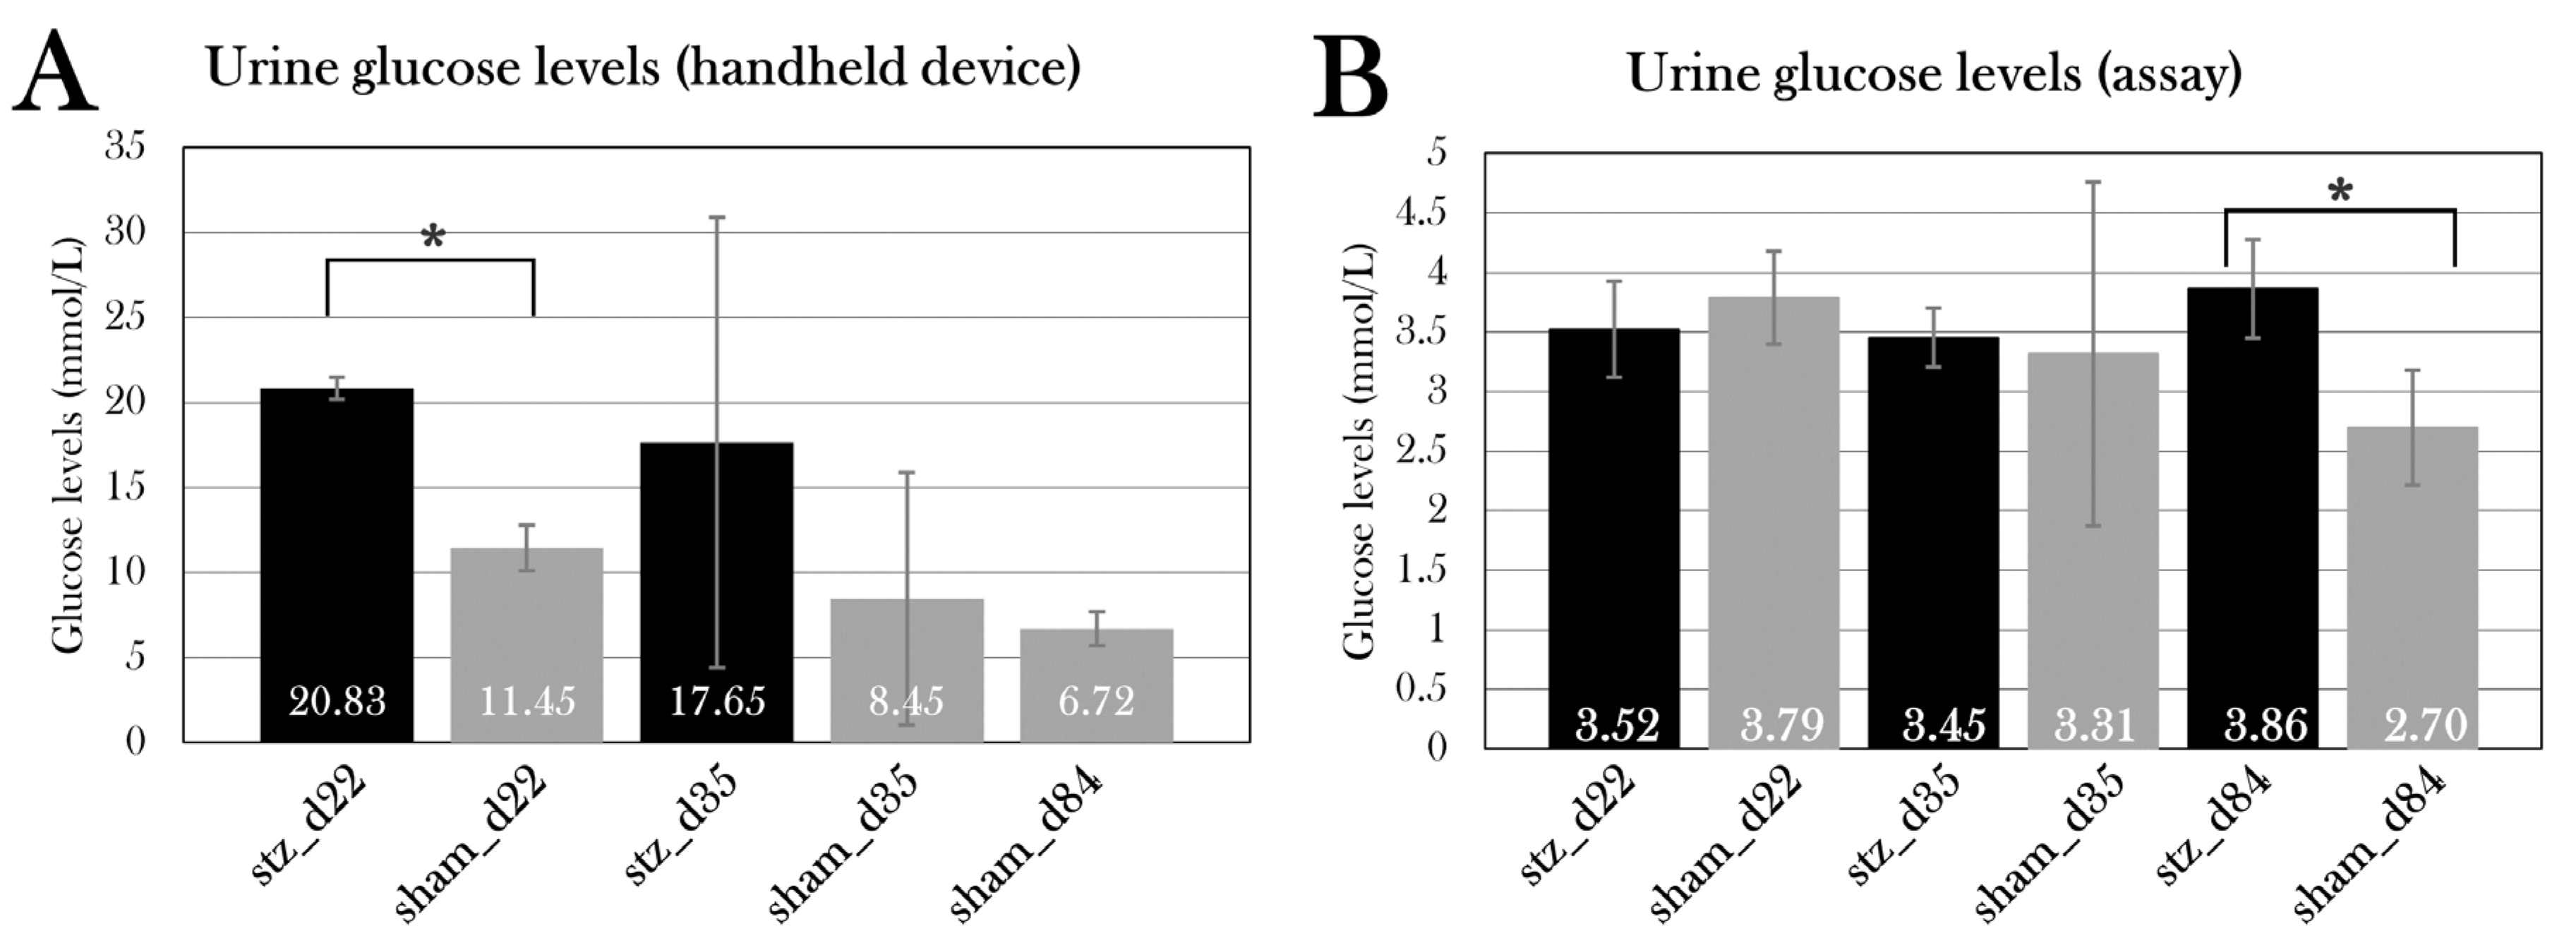
When extracting urine from the bladder, urine glucose was measured using the FreeStyle Precision Neo glucometer and glucose test strips before snap-freezing.
Glucose was also measured using a glucose assay kit II (Abnova, cat. No. KA0832). A standard curve was prepared by diluting the standard stock, ending with standards of 0, 2, 4, 6, 8, and 10 nmol, generating a curve with the following equation used to calculate the glucose quantity in samples:
y = 0.0825 x + 0.1087 Before glucose assaying, urine samples were deproteinized using the Deproteinizing Sample Preparation Kit – TCA (abcam, cat no. ab204708). For protein precipitation, 9 µL cold TCA was added to 60 µL urine sample and incubated on ice for 15 min, followed by centrifugation at 12,000 x g for 5 min. The supernatant was collected, and the TCA in the samples was neutralized by adding 6 µL cold neutralization solution and mixed. Samples were incubated on ice for 5 min, before the initiation of the glucose assay.
Urine samples were prepared in a 5:50 dilution in glucose assay buffer, and 50 µL standards and diluted samples were added to a 96-well plate in duplicates before adding 50µL glucose reaction mix (46 µL glucose assay buffer, 2 µL glucose enzyme mix, and 2 µL glucose substrate mix) to each well. The plate was incubated for 30 min in RT in darkness, followed by measurement of the absorbance at 450 nm. Glucose concentration was calculated using the equation of the standard curve to calculate the amount of glucose, from which the concentration was calculated by the following conversion:
g l u c o s e = s a m p l e   g l u c o s e   a m o u n t ( n m o l ) s a m p l e   v o l u m e ( µ L )

Protein Measurement of Urine Samples

Using Pierce Microplate BCA Protein Assay Kit (Thermo Scientific, cat no. 23252), protein was quantified in urine samples. Before the assay, the pH of the urine samples from two animals per group was measured to adjust the protocol for this. All pH levels were 6-7.5, and the reagents were then prepared per the manufacturer’s protocol.
Standard curves were prepared in a serial dilution, ending up with concentrations of 2000, 1500, 1000, 750, 500, 250, and 125 µg/mL. As for blanks, a working reconstitution buffer without reducing agents was used. 9µL of standards, blanks, and samples were loaded in duplicates in a 96-well plate. 4 µL Compatibility Reagent Solution was added to each well, and the plate was shaken for 1 min and incubated for 15 min at 37°C. 260µL Working Reagent was added to each well, followed by shaking for 1 min and incubation for 30 min at 37°C. After cooling in RT for 5 min, OD562nm was measured immediately. Sample concentrations were calculated by extracting the blank and using equation of the standard curve:
y = 0.0006 x 0.0732

Statistical Analysis

Statistical analyses were performed using Microsoft Excel. Unpaired Student’s T-Test was used to compare the STZ-treated groups with sham-treated groups for each day of euthanasia (day 22, 35, and 84), taking the variance of the respective dataset into account. For comparison of paired blood glucose or ketone measurements for stz_d84 and sham_d84, respectively, a one-way repeated measurements ANOVA test was used to determine changes over time. For comparison of all groups with the same treatment type (STZ or sham), a single factor ANOVA test was used to determine differences. For all tests, a p-value < 0.05 was considered statistically significant, and grouped data is displayed as mean ± standard deviation.

Results

Part I: Pilot Studies

Characterization of the Pancreas in the Axolotl

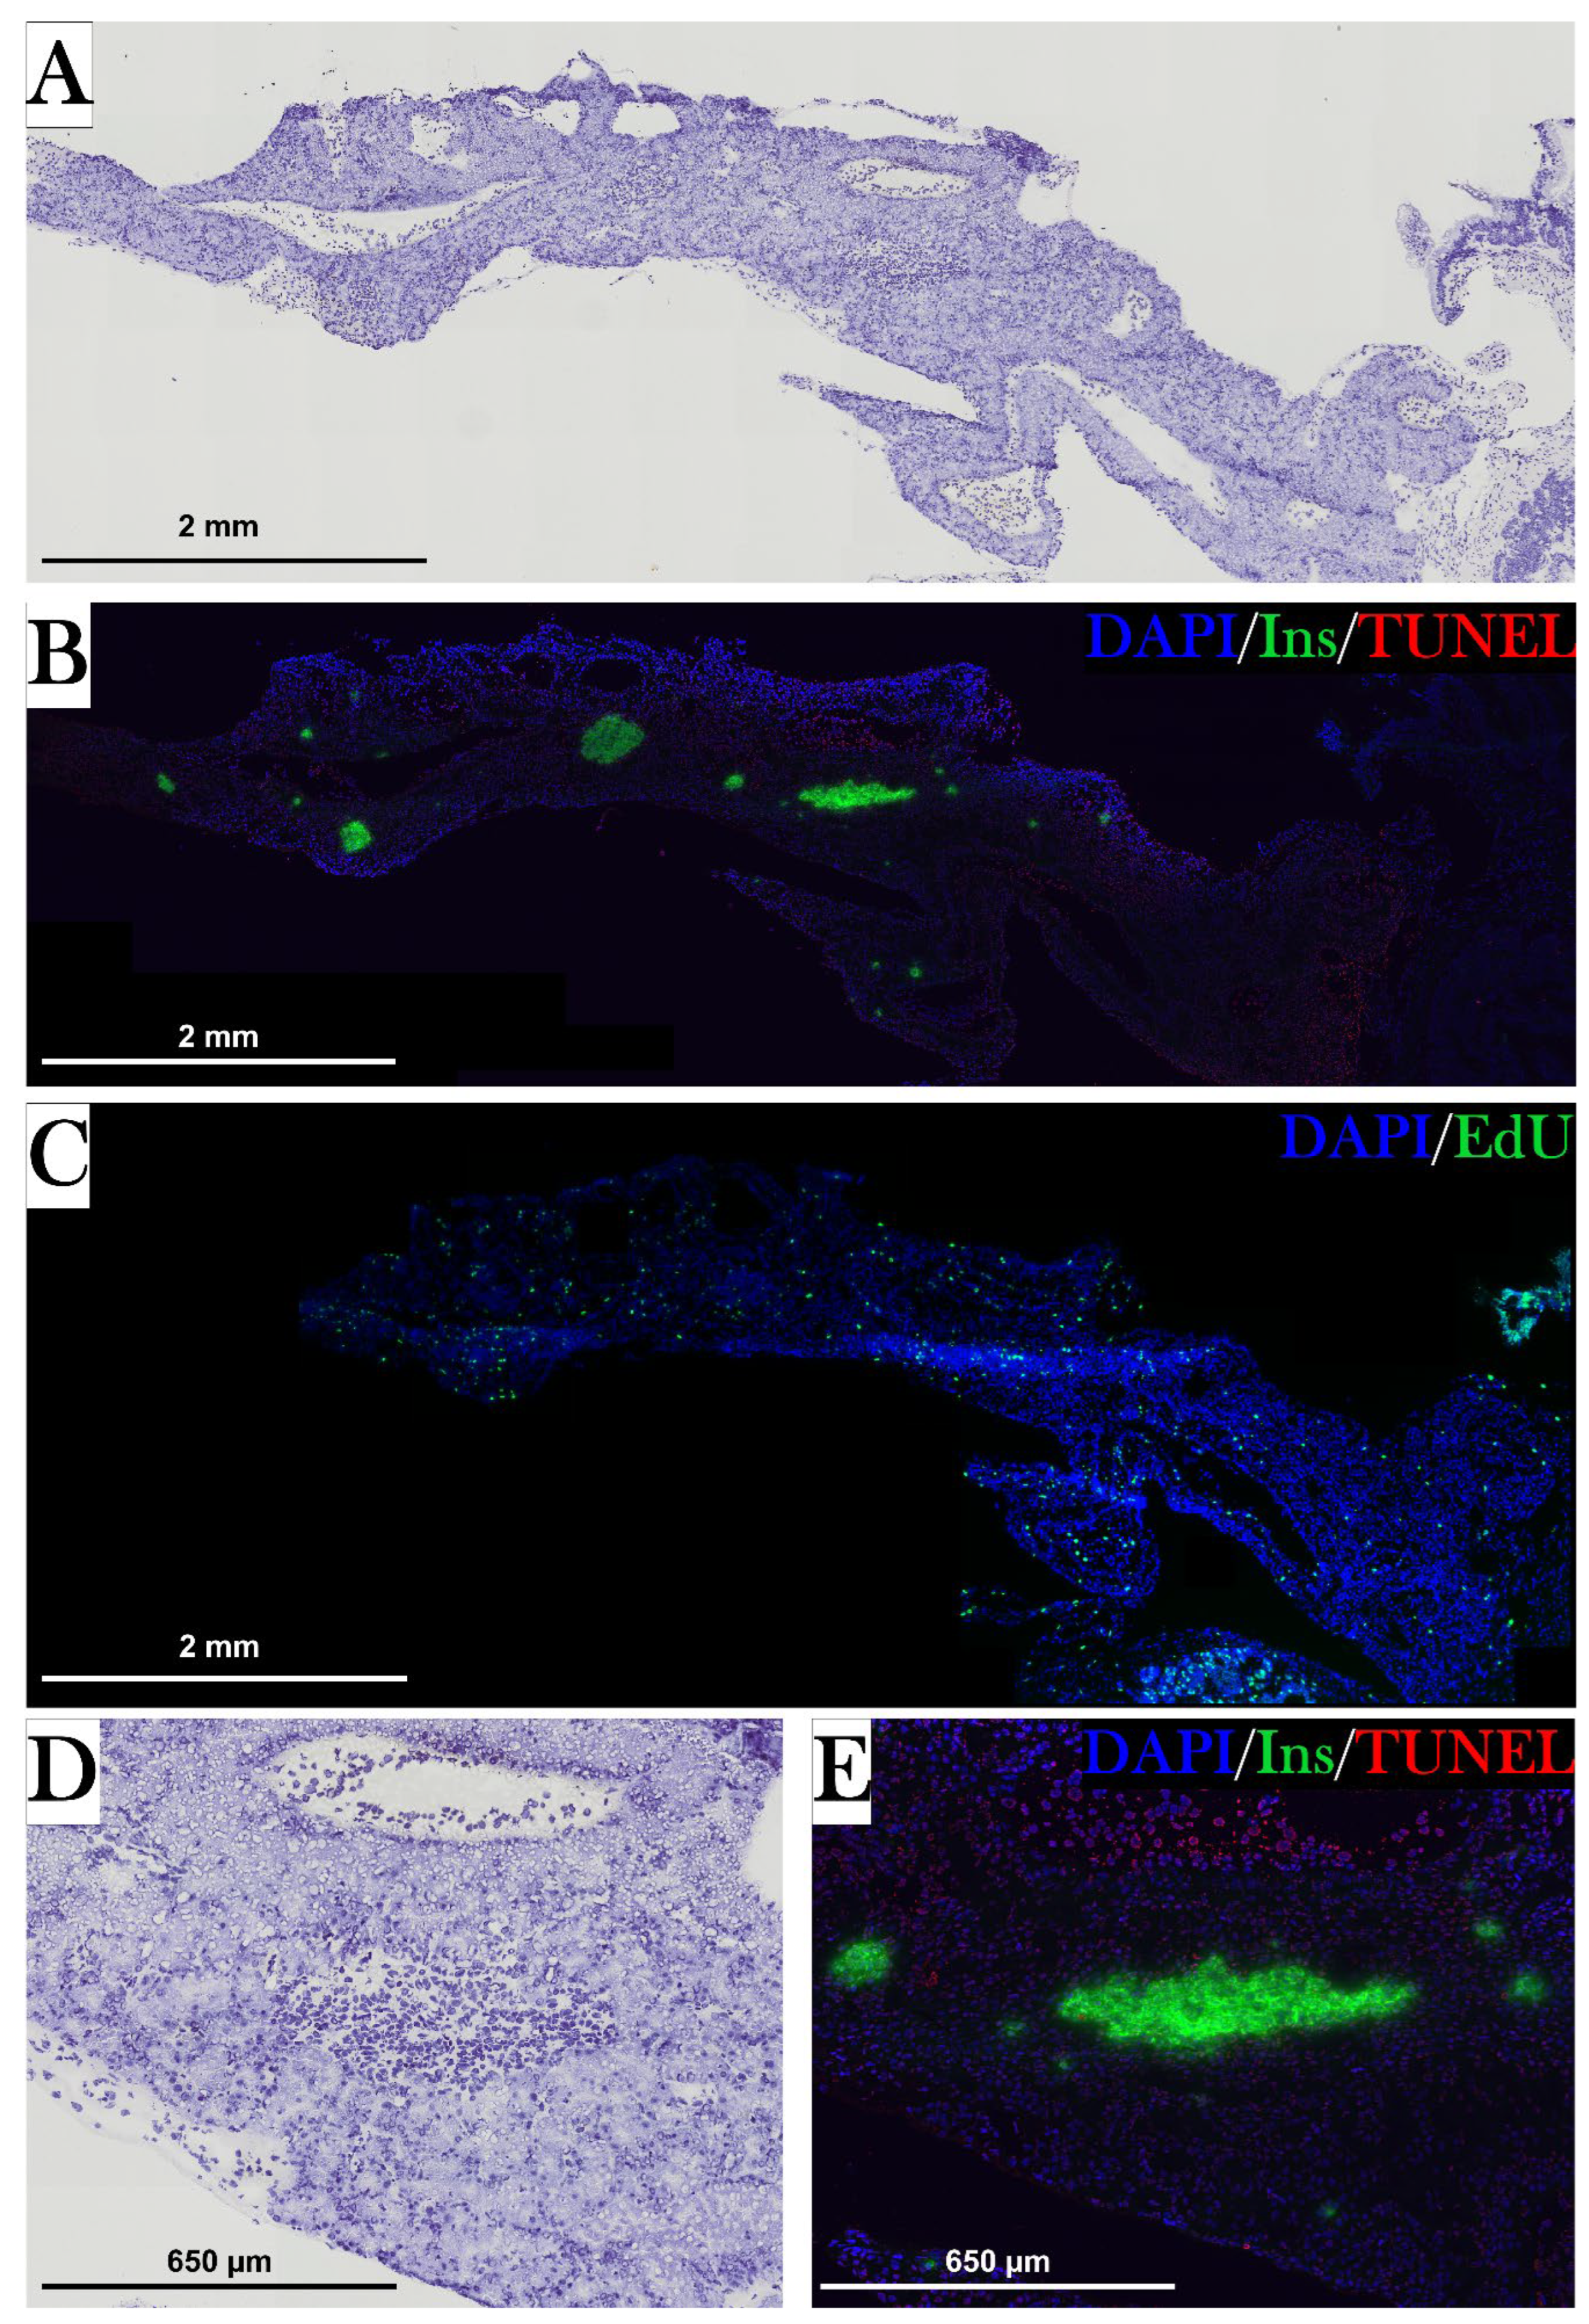
To examine the diabetogenic effect of STZ in the axolotl, the axolotl pancreas was characterized, as there is a limited number of studies on this topic. The pancreas of the axolotl is a triangular organ, which connects directly to the duodenum and the liver (Figure 5). In hematoxylin-stained sections of the pancreas, the exocrine and endocrine pancreas can be clearly distinguished. The endocrine cells are located in islet-like structures, as seen in other species, and have a darker, well-rounded nucleus and light cytoplasm compared to exocrine cells, in which the cytoplasm is light purple and the nucleus is not so well defined (Figure 19D). As the endocrine islet structures contain not only β cells but all endocrine cells in the pancreas, the β cells were identified by staining insulin-positive cells (Figure 19E). Insulin is accumulated in the cytoplasm but is also found in the nucleus.
As GLUT2/Glut2/glut2 is the primary glucose transporter in the pancreas of mice and zebrafish, but not humans (Table 1), a mouse anti-Glut2 antibody was tested to investigate the presence of this transporter in the β cells of the axolotl, also to attain a membrane-associated β cell marker. However, this antibody resulted in unspecific staining in liver and kidney tissue and no signal in pancreas tissue (Figure 8). Consequently, another antibody must be investigated for the detection of the glucose transporter.
Figure 8. Immunofluorescence staining of glut2 in liver tissue of control animals. The procedure led to unspecific staining in liver tissue. The nuclear stain (blue) (A) overlaps with the stain of glut2 (red) (C), as can be seen in B.
Preprints 67511 g008

Optimizing the Glucose Tolerance Test

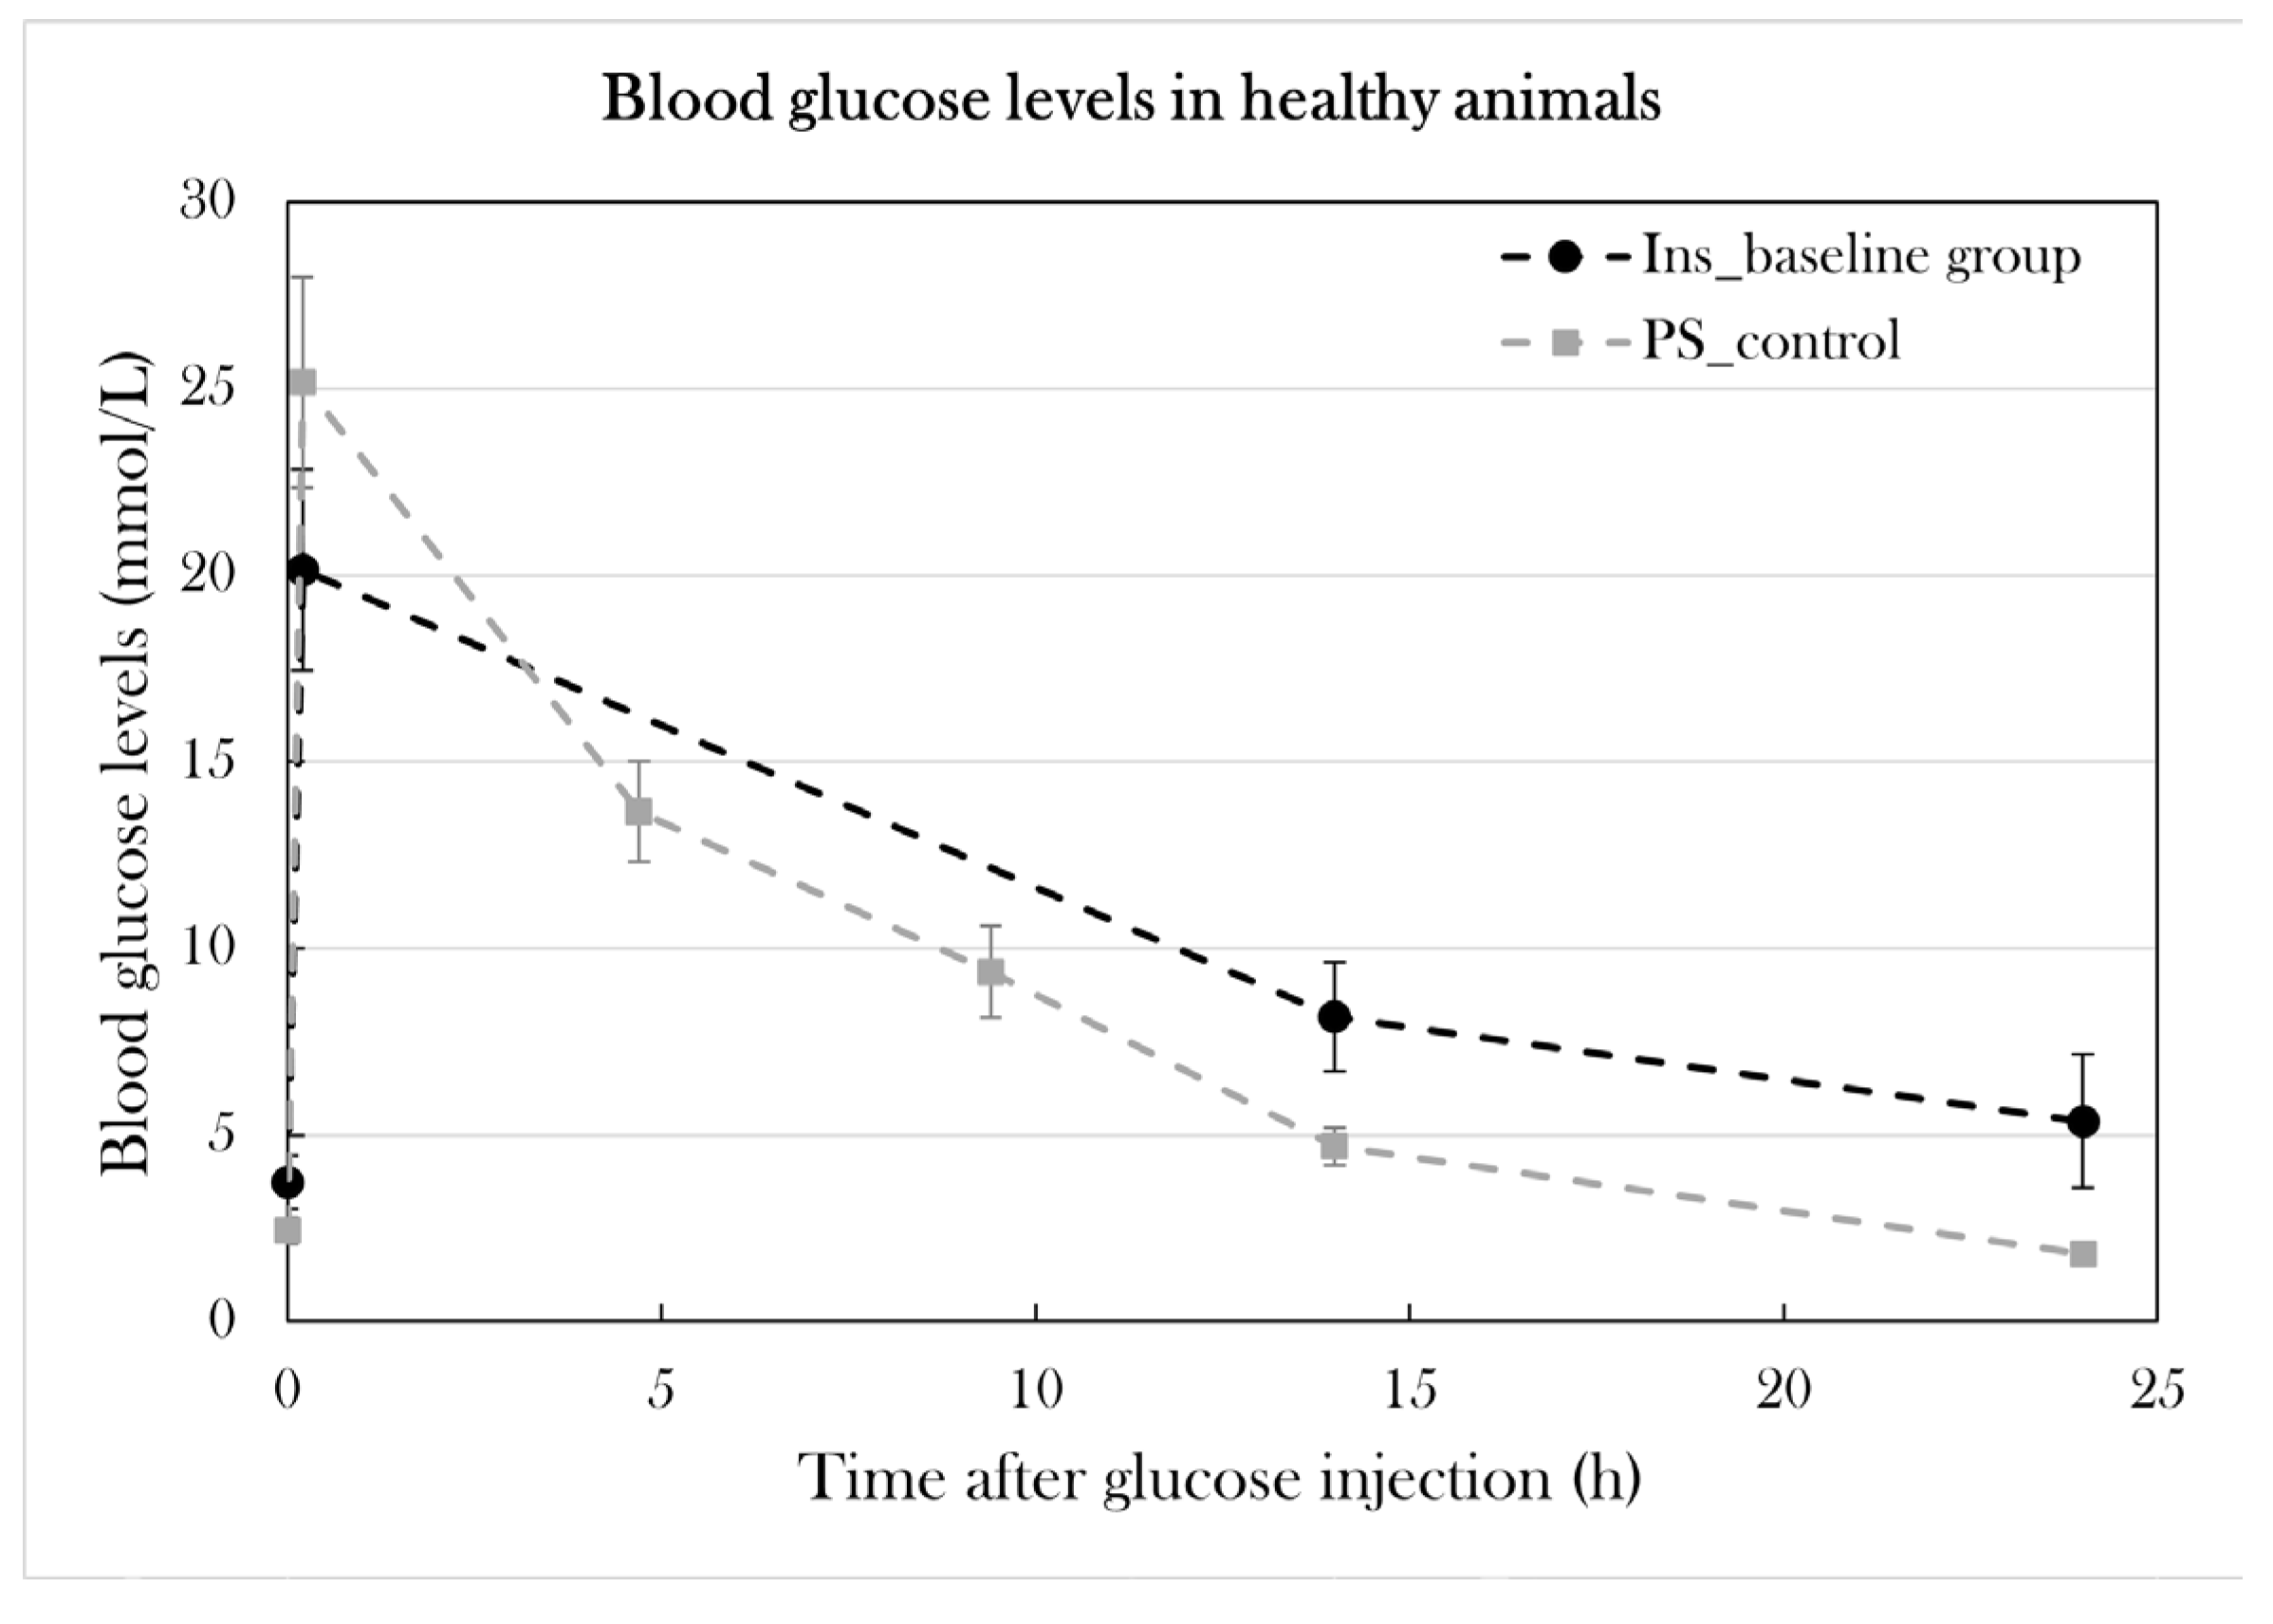
The glucose tolerance test is used as a diagnostic tool in the clinic, but also in diabetes research to investigate disease in animal models. I have previously adjusted it for use in the axolotl, as the axolotl, like other amphibians[25], has a slower metabolic rate[91]. In this study, I have further optimized the protocol. Intravenous injection of 1.75 mg/g body mass results in a massive increase in blood glucose levels (approx. 22-27 mmol/L after 10 min), and approx. 60% of glucose is consumed after 14h[91]. Previously, blood glucose levels were measured 0h, 10 min, and 14h after glucose injection. Three additional time points were included: 4h 40 min, 9h 20 min, and 24h after glucose injection. These time points were included to further study the glucose consumption over the span of 24h, including the 24h measurement, as glucose is fully consumed at this point in healthy axolotls (see PS_control in Figure 9).
Furthermore, I investigated if larger blood samples could be collected during the glucose tolerance test for later analysis and to generate a blood insulin curve to examine the relationship between glucose and insulin in the axolotl. For this, a group of healthy animals (n=6) was subjected to the optimized glucose tolerance test. 60 µL of blood was collected from each animal 0h, 4h 40 min, and 9h 20 min after glucose injection and was planned to be collected 14h and 24h after glucose injection as well, but the blood collections resulted in difficulty in returning from the anesthetic state at first and, later in the test, mortality for 4/6 animals. As a consequence, the pilot study was ended prematurely.
Another pilot group (Ins_baseline) (n=3) was subjected to the glucose tolerance test, and 30-40 µL of blood was collected 0h, 14, and 24h after glucose injection. This group did not experience the complications seen in the previous pilot group, and blood glucose levels were able to return to fasting levels, as seen in a control group (PS_control), in which blood only was collected in small amounts for the glucose measurements. Even though blood glucose levels after 24h (5.4±1.8 mmol/L) were higher than fasting blood glucose levels (3.7±0.7 mmol/L) in Ins_baseline, the difference was not statistically significant (p=0.12) (Figure 9). Therefore, it is possible to collect small quantities of blood at several points during the glucose tolerance test, but not all. Also, blood must be collected carefully to not cause mortality.

Quantification of Insulin in Blood Samples and Pancreas Tissue Using ELISA

As diabetes is characterized by the destruction of the insulin-producing β cells, insulin content in the pancreas or blood is an indicator of the diabetic state of an animal model. Therefore, ELISA was investigated as a potential method to measure insulin content in both pancreas and blood of axolotls.
For this, a mouse insulin ELISA kit (Invitrogen) was evaluated, using blood samples and pancreas tissue extraction from two healthy animals – one animal fasting for one day, the other receiving a meal 4-5h before tissue harvest. As the method should be able to measure insulin levels in diabetic animals, thus with low insulin content in the blood, animals were not subjected to a glucose tolerance test before tissue harvest. The ELISA kit was not able to measure insulin concentration in diluted blood samples, and only insignificant amounts in undiluted blood samples, indicating that a kit with a lower range is necessary for measurements of insulin in axolotl blood samples.
As for the pancreas, more than a 400-fold dilution was necessary to stay within range of the kit, and the control sample measured an insulin concentration of 176.13 mlU/mL.
Thus, the ELISA kit can measure insulin content in pancreas tissue after a 400-fold dilution, but plasma insulin levels are too low in the axolotl for measurements with this assay, and another kit must be assessed for this.

Finding the Optimal STZ Treatment Protocol to INDUCE diabetes in the Axolotl

Previously, a STZ dosage of 0.35 mg/g body mass given five times over the span of 18 days resulted in severe systemic toxicity and premature termination of the experiment[91]. Thus, five new treatment strategies were evaluated (Figure 2).
Three pilot study groups (PS1-3) were included with three animals in each group. PS1 was given 0.05 mg/g body mass on five consecutive days, PS2 received 0.05 mg/g body mass on day 0, 2, 4, 12, and 19, and PS3 was given a single dose of 0.2 mg/g body mass. As for other adjustments to the previous STZ protocol, animals were fasted for one week prior to the experimental start. This makes the body mass-dependent STZ treatment more precise and effective because STZ is a glucose analogue and competes with glucose for transportation, therefore improving STZ uptake in β cells by fasting.
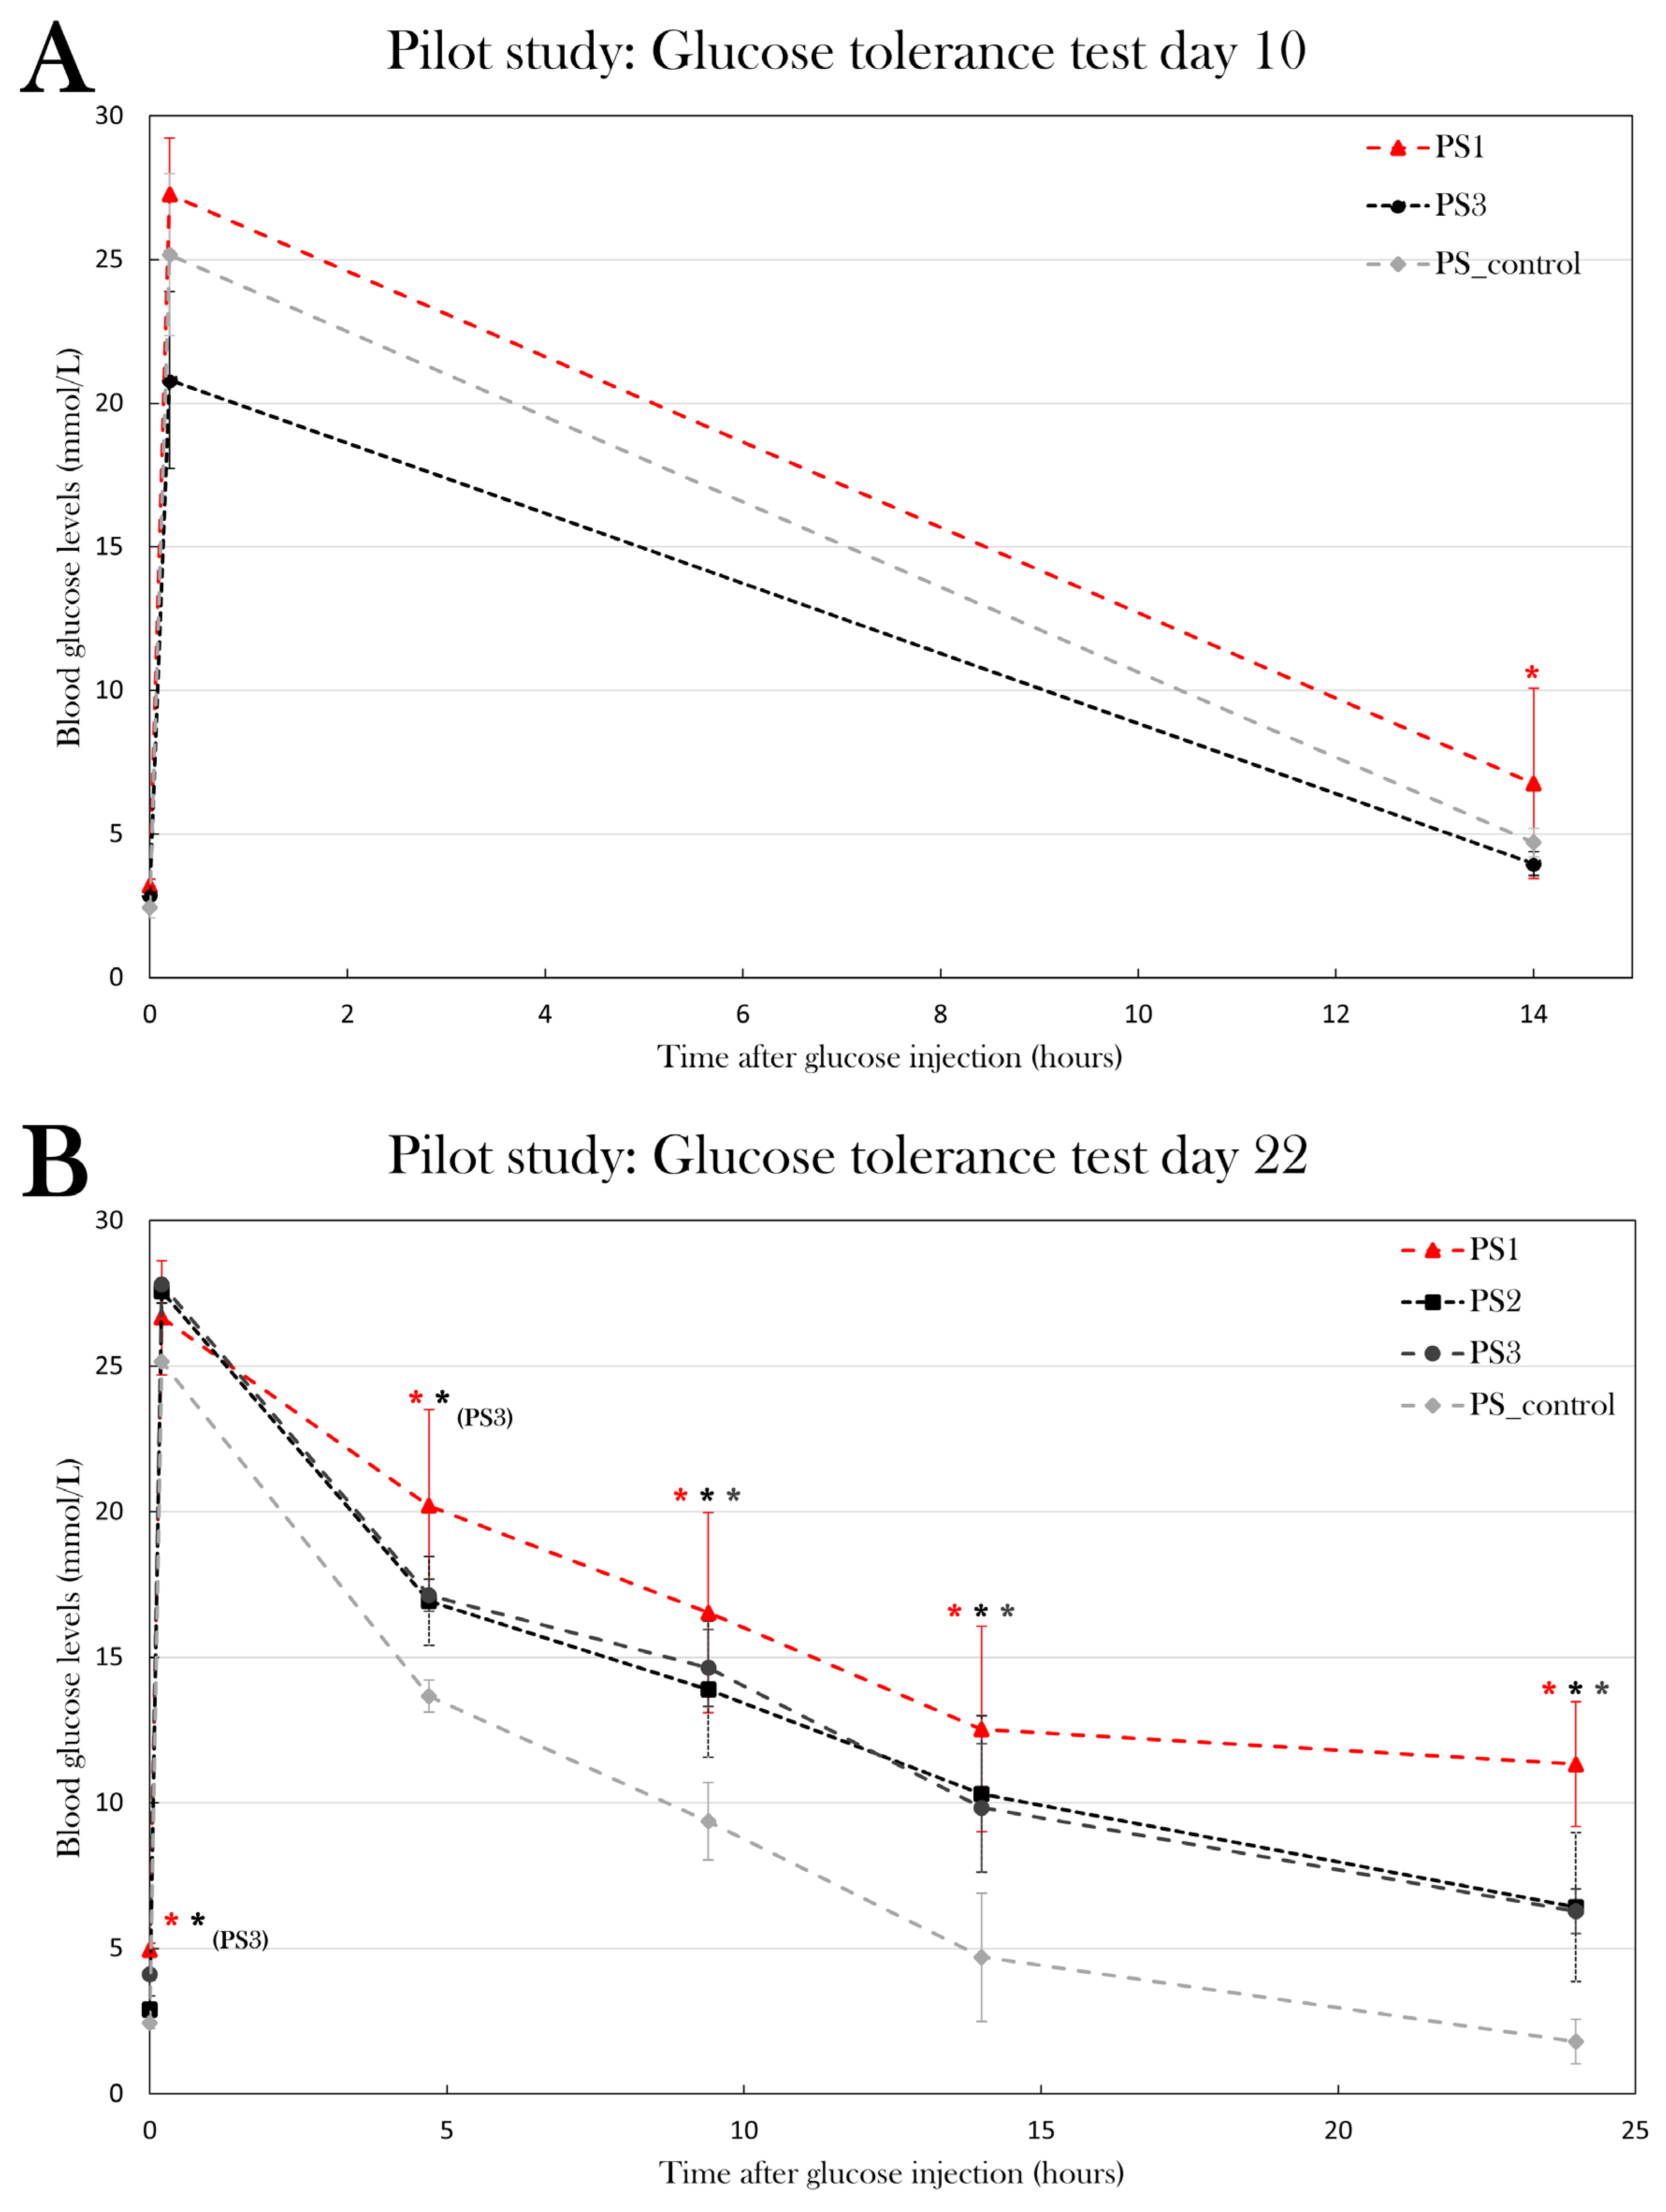
To assess their glycemic state, animals were subjected to the optimized glucose tolerance test. PS1 and PS3 were subjected to the glucose tolerance test 10 days after the last STZ injection (experimental day 14 and 10, respectively), and PS1, PS2, and PS3 were all subjected to the test on day 22 of the experiment. The STZ-treated groups were compared to a control group, which consisted of healthy, untreated animals (PS_control).
On day 10 after the last STZ injection, blood glucose levels were measured 0h, 10 min, and 14h after glucose injection. Blood glucose levels were not significantly higher at baseline for either PS1 or PS3 (p=0.11 and p=0.19, respectively), but PS1 displayed a significantly higher blood glucose level 14h after glucose injection (p=0.013), whereas PS3 did not differ from PS_control after 14h (p=0.12) (Figure 10A).
On day 22 of the experiment, blood glucose levels were measured at 0h, 10 min, 4h 40 min, 9h 20 min, 14h, and 24h after glucose injection (Figure 10B). PS1 and PS3 had fasting blood glucose levels of 4.9±0.2 and 4.1±0.002 mmol/L, which is significantly higher than the blood glucose levels of 2.4±0.4 mmol/L seen in PS_control (p=0.00050) and p=0.0020), respectively), while PS2 did not have significantly higher fasting blood glucose levels (p=0.23). After 4h 40 min, PS1 and PS3 displayed significantly higher blood glucose levels compared to the PS_control (p=0.034 and p=0.015, respectively), while PS2 did not have higher blood glucose levels (p=0.050). After 9h 20 min, 14h, and 24h, all pilot groups displayed significantly higher blood glucose levels compared to PS_control. After 9h 20 min, PS1 had blood glucose levels of 16.5±3.4 mmol/L (p=0.027), PS2 of 13.9±2.3 mmol/L(p=0.041), and PS3 of 14.6±1.3 mmol/L(p=0.007) compared to 9.4±1.2 mmol/L in PS_control. After 14h, blood glucose levels were 12.5±3.5 mmol/L for PS1(p=0.019), 10.3±2.7 mmol/L for PS2 (p=0.024), and 9.8±2.2 mmol/L for PS3 (p=0.017) compared to 4.7±0.5 mmol/L in PS_control. After 24h, blood glucose levels had normalized in PS_control (1.8±0.1 mmol/L), whereas all STZ-treated groups displayed hyperglycemia. PS1 had blood glucose levels of 11.3±2.2 mmol/L (p=0.0016), PS2 had 6.4±2.6 mmol/L (p=0.036), and PS3 had 6.3±0.8 mmol/L (p=0.00056).
These results indicate that all pilot groups developed a hyperglycemic response to the STZ treatment, thus displaying symptoms of diabetes. On the tenth day after the last STZ treatment, neither PS1 nor PS3 displayed the full effect of the STZ treatment. On day 22 of the experiment, PS1 and PS3 displayed the most severe hyperglycemic response of the pilot groups, as both blood glucose levels at baseline and during the glucose tolerance test were significantly higher than the blood glucose levels of PS_control, indicating that these are the most effective treatment protocols to induce diabetes.
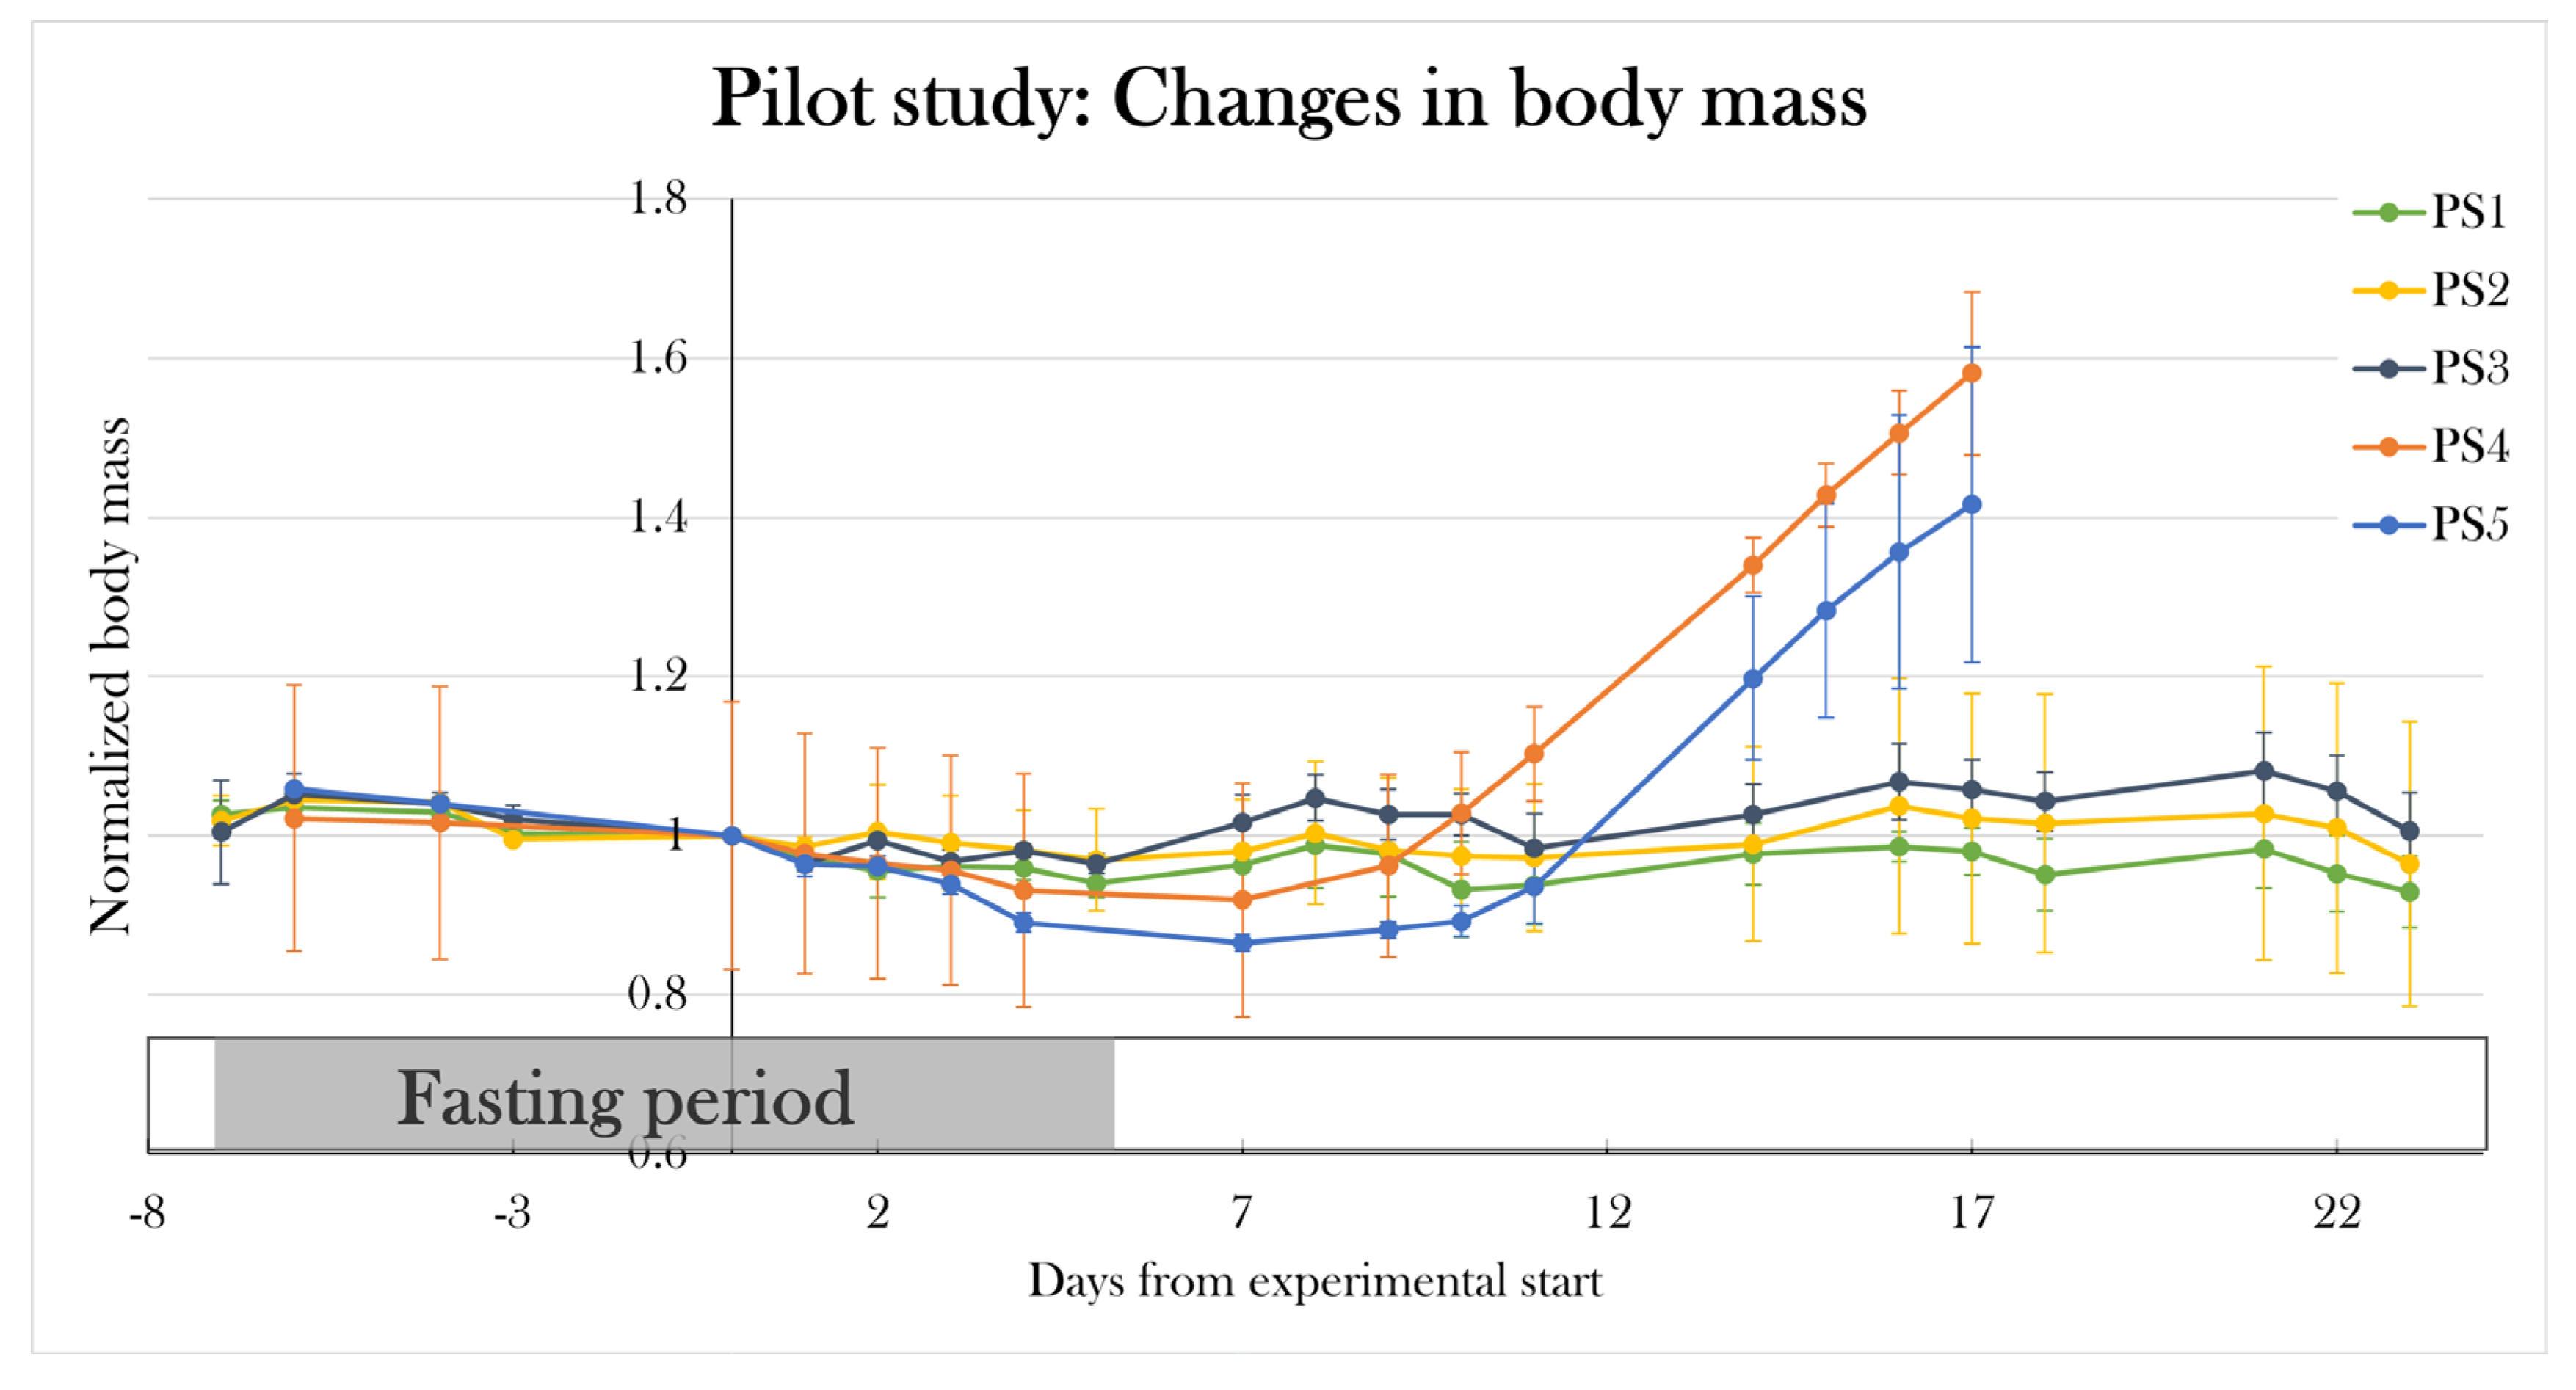
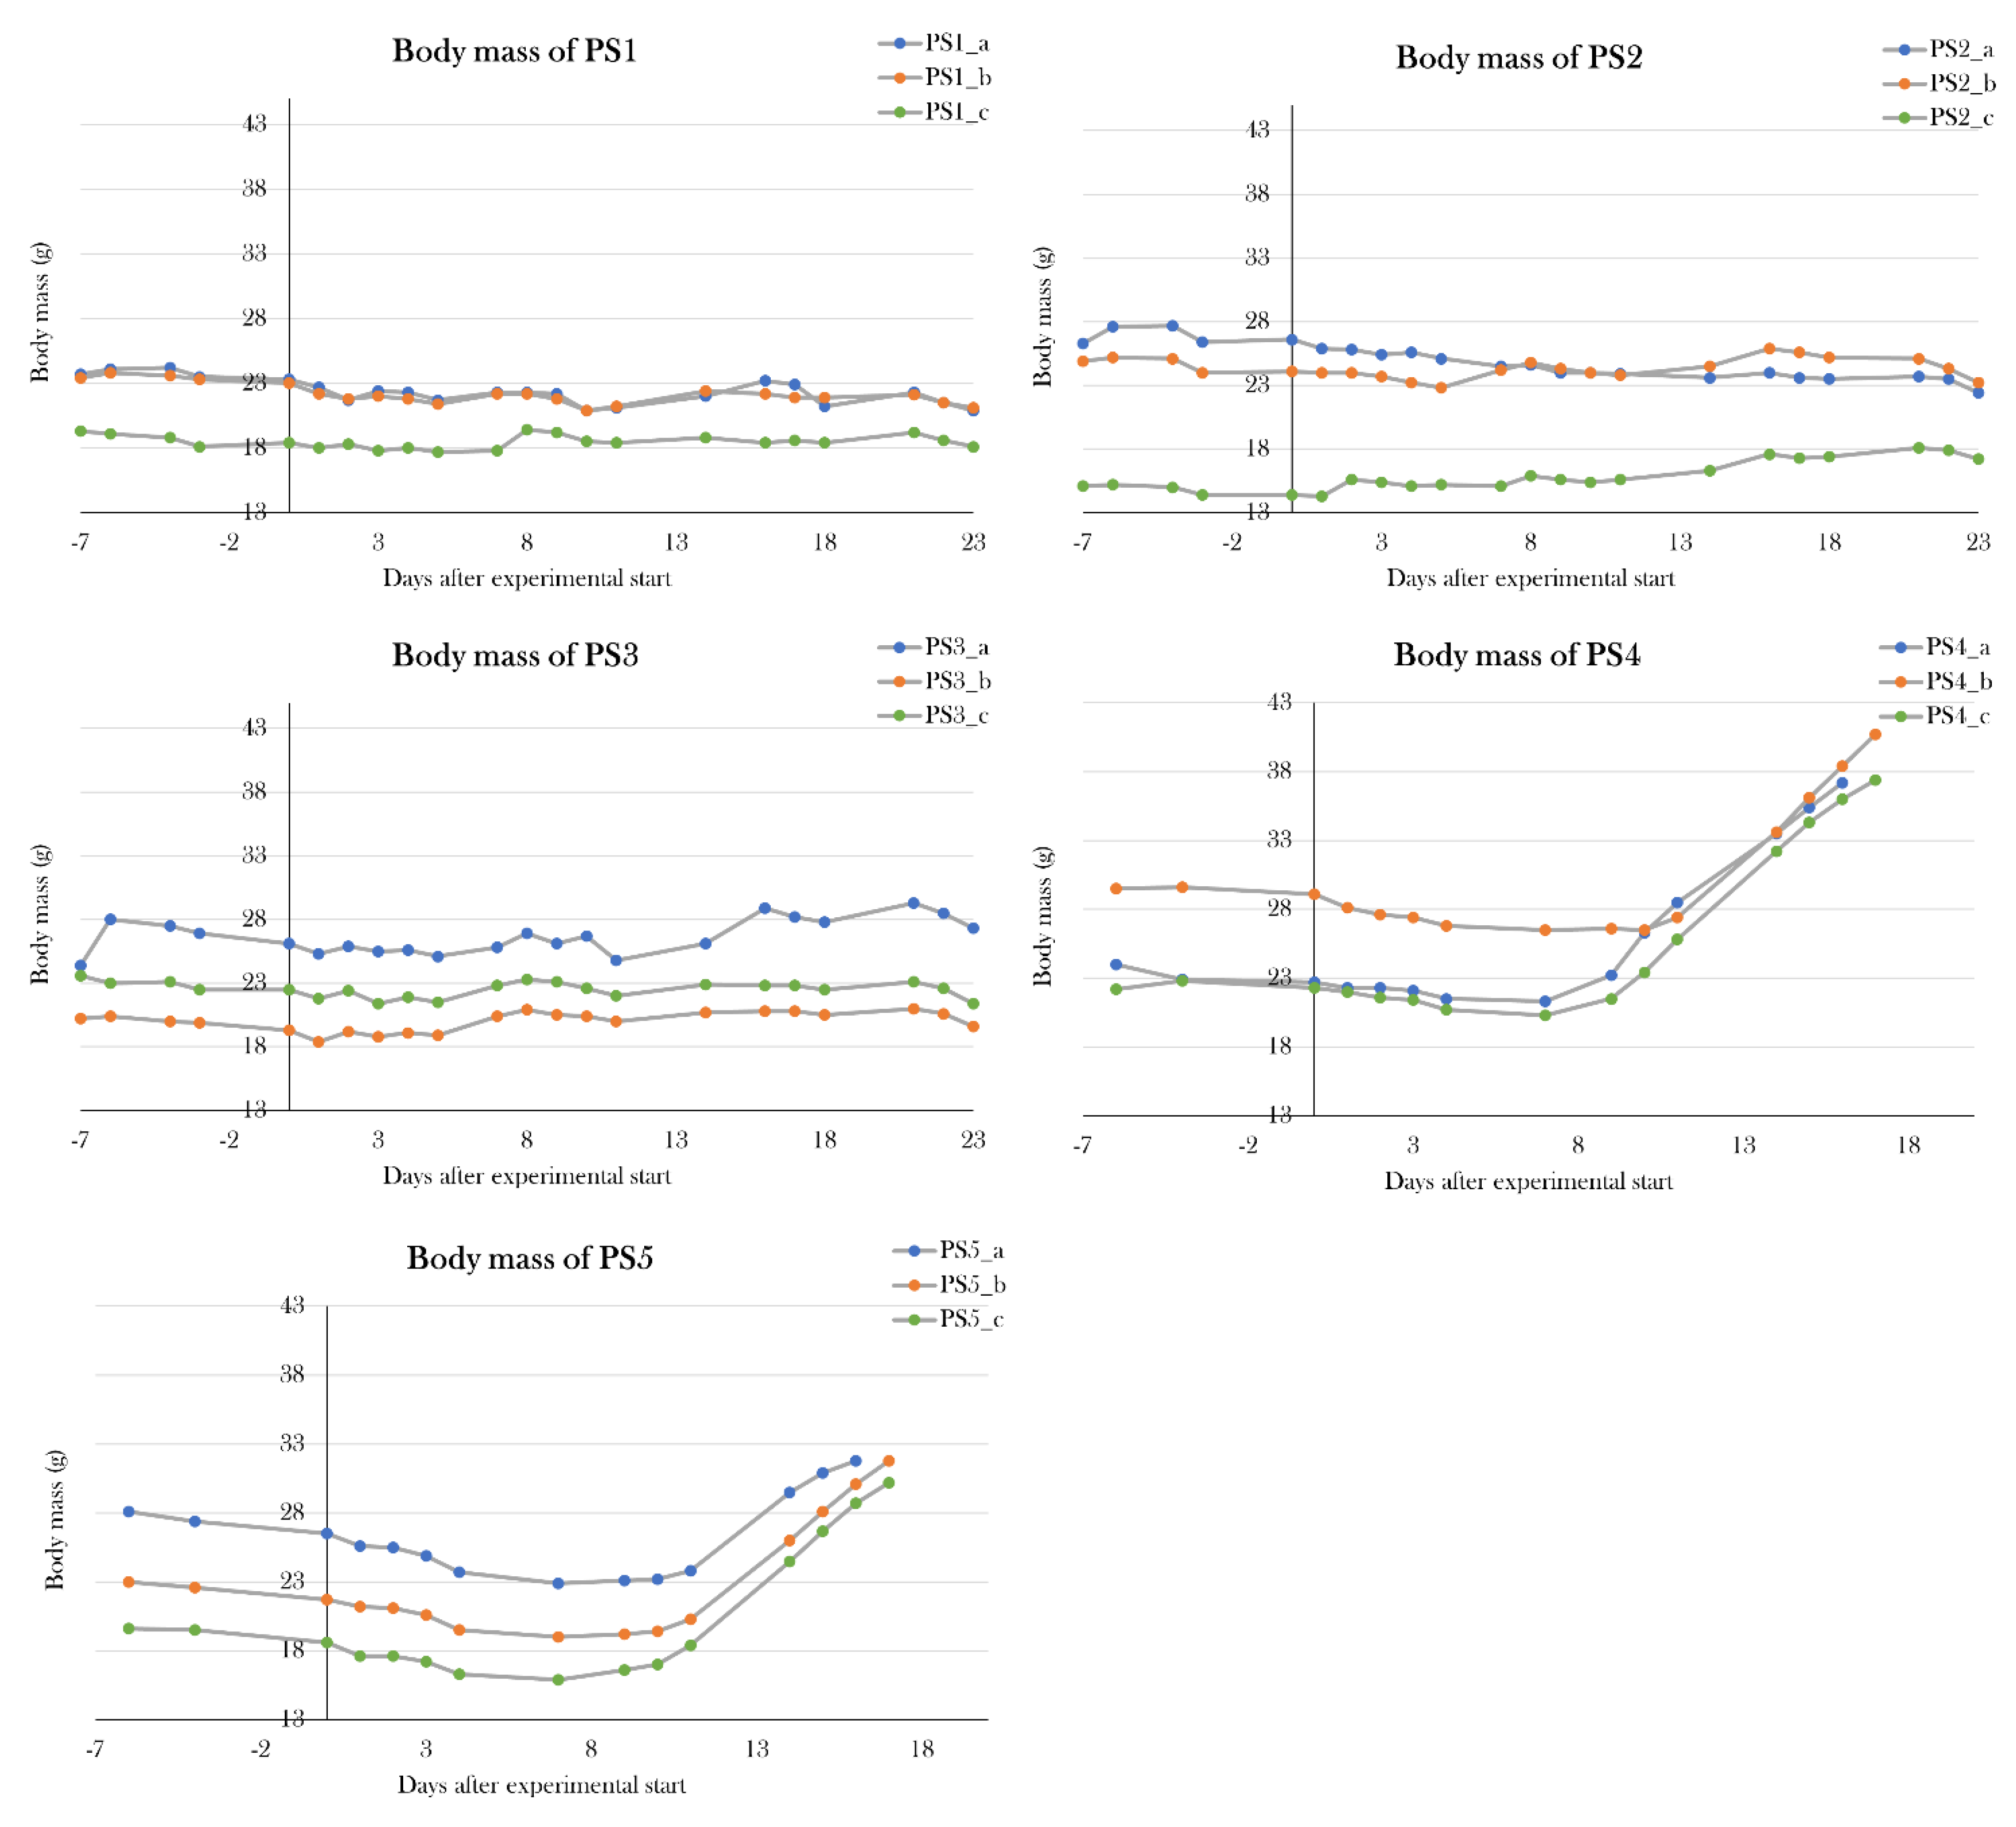
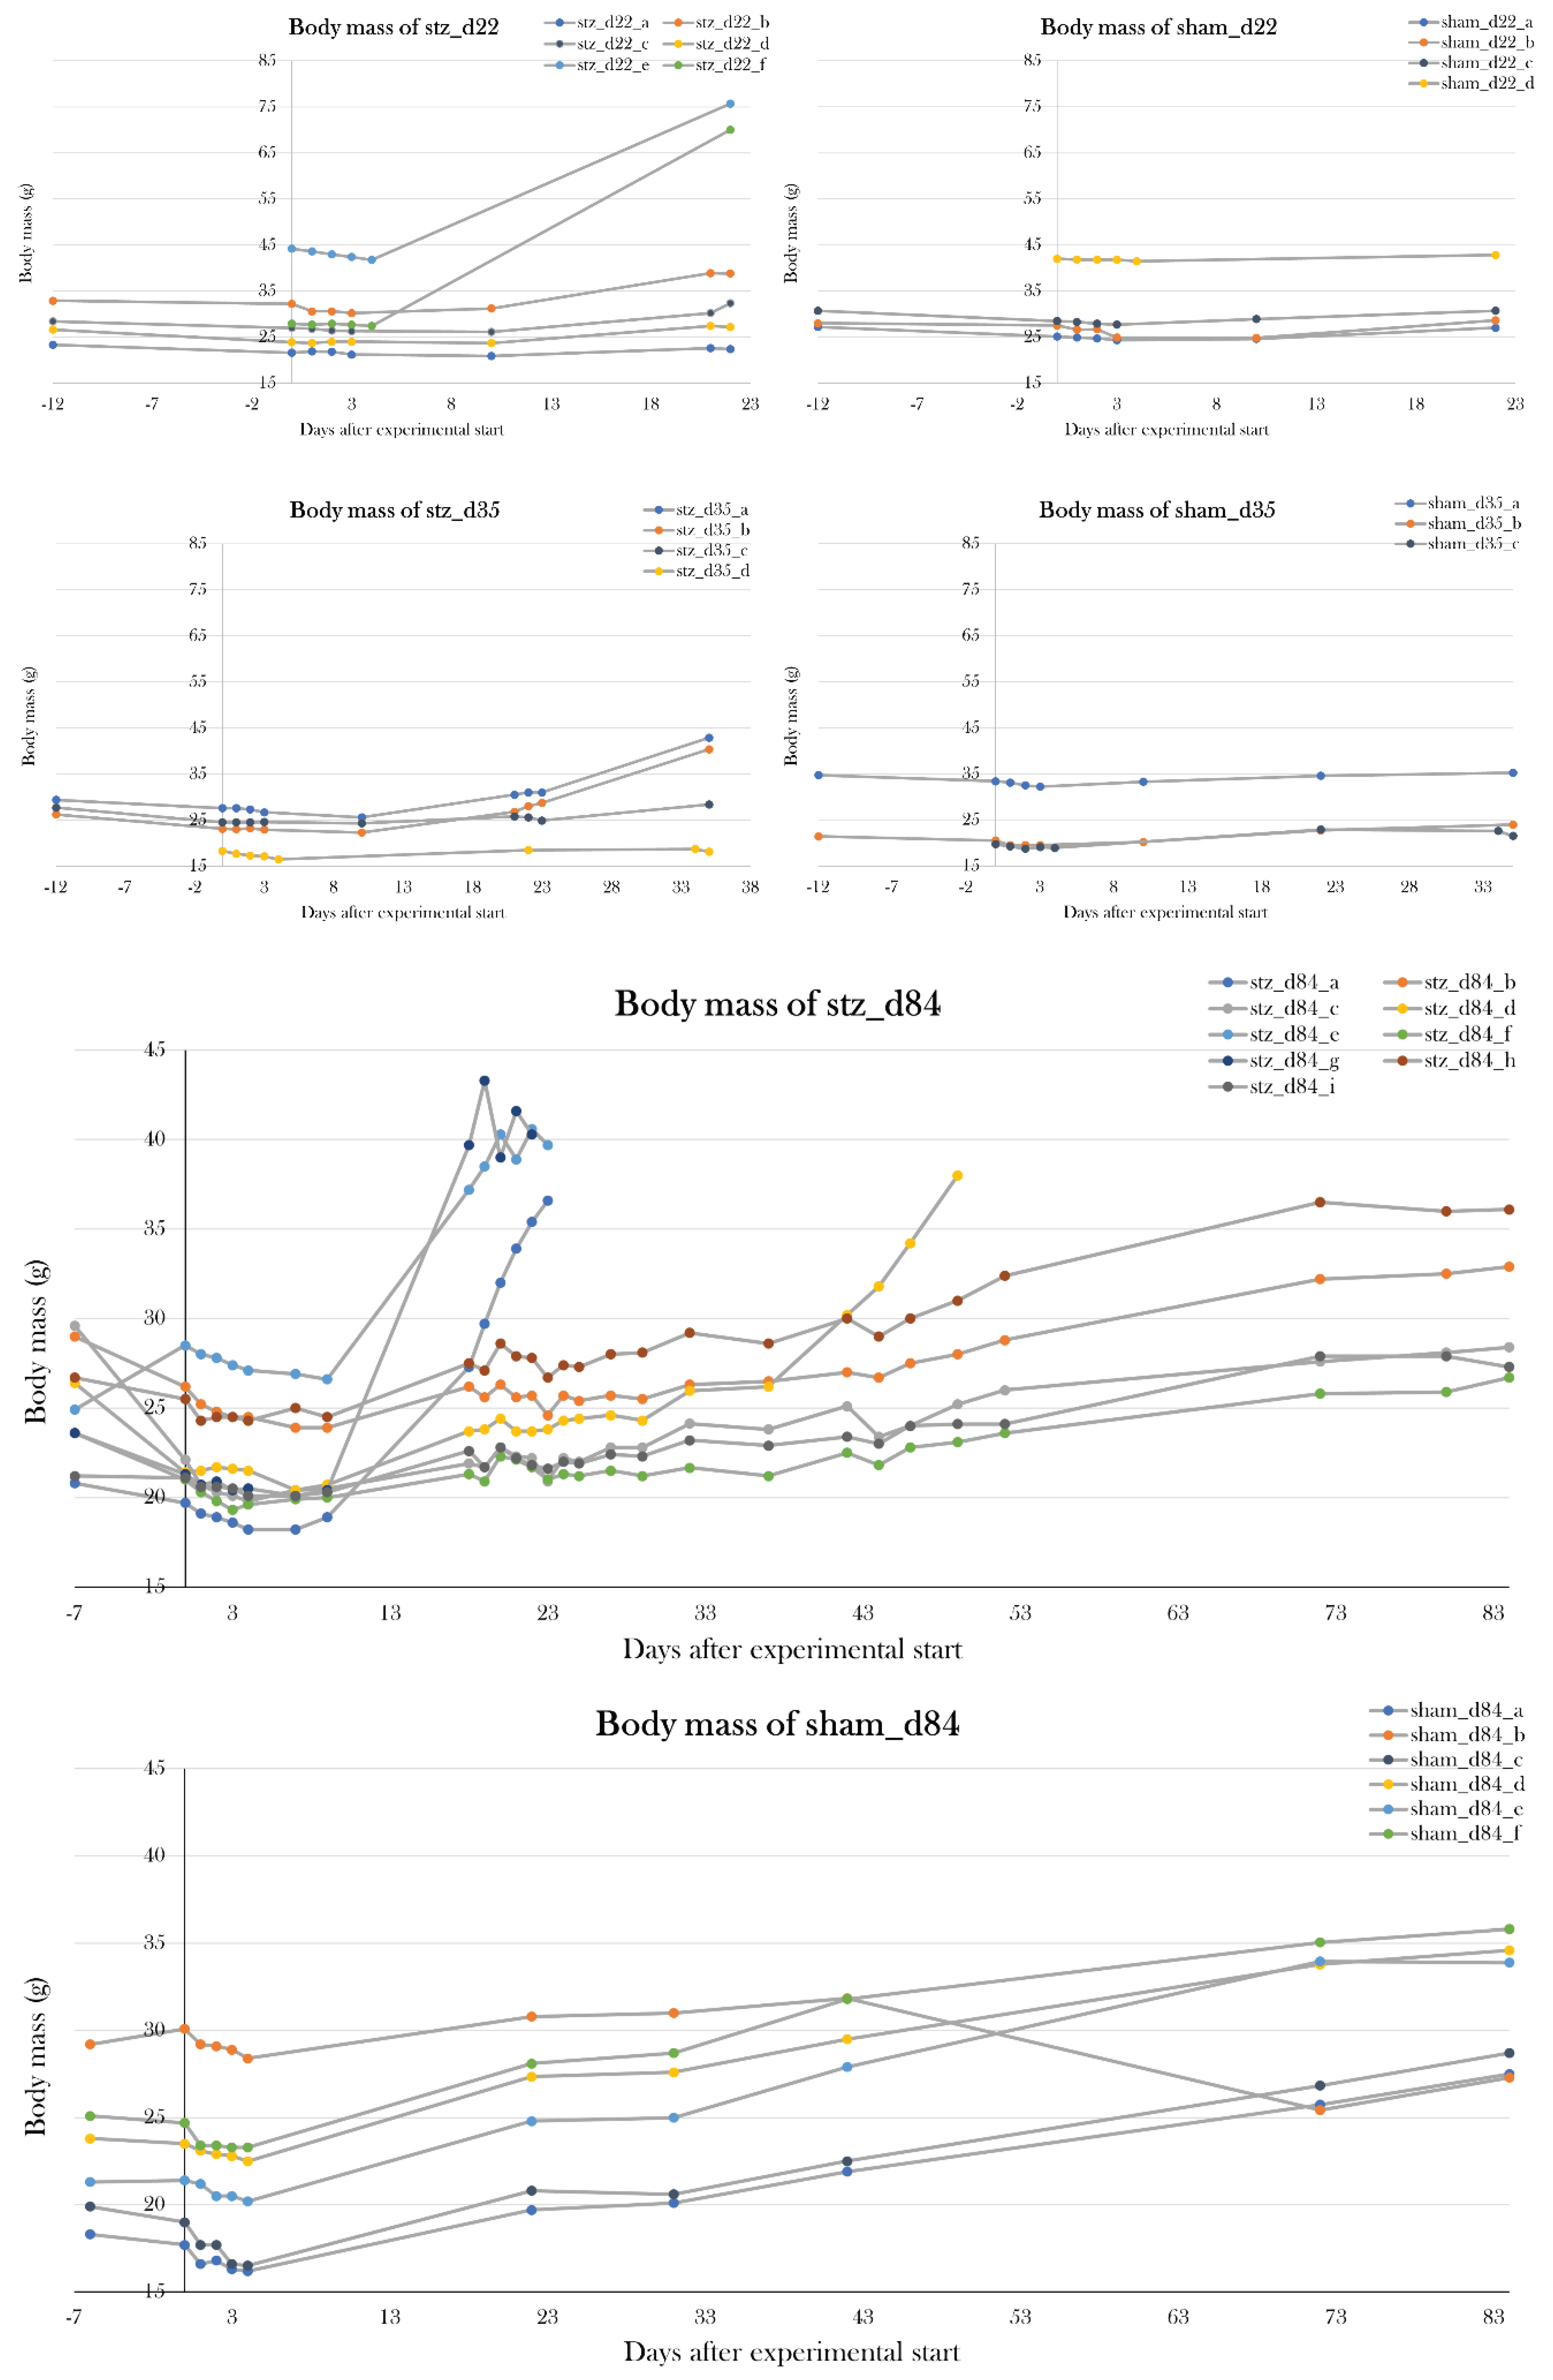
To test if I had found the most optimal protocol in which the STZ treatment resulted in maximal hyperglycemia, but not systemic toxicity as seen previously[91], two additional pilot study groups (PS4 and PS5) were included, and each received a higher dose of STZ but followed the same schedule as used in PS1. PS4 and PS5 were treated for five consecutive days receiving 0.15 and 0.2 mg/g body mass, respectively. Animals were scheduled to be subjected to the glucose tolerance test on day 22 of the experiment, however, all animals were prematurely terminated on either day 16 or 17, as PS4 and PS5 increased their body mass by 57.2±15.1% and 44.0±19.8% since day 0. This change in body mass was not seen in the other pilot groups (Figure 11).
Therefore, the PS1 treatment protocol of 0.05 mg/g body mass of STZ at five consecutive days made the most optimal protocol, as it resulted in severe hyperglycemia in the glucose tolerance test without detrimental effects at day 22 of the experiment.
Figure 11. Changes in body mass in the pilot groups over the experimental period. Plotted data show mean group values ± SD normalized to the average body mass of all the groups at day 0 of the experiment. PS1, PS2, and PS3 did not experience any significant changes in mean body mass, but PS4 and PS5 increased their body mass by 57.2±15.1% and 44.0±19.8%, respectively, since day 0, resulting in premature euthanasia.
Preprints 67511 g011

Part II: STZ-Treated Animals Reached Normoglycemia after 84 Days

Using the new treatment protocol, two groups were included to investigate if animals remained hyperglycemic after day 22, or if blood glucose levels normalized, indicating some sort of restoration of β cell activity – possibly through β cell regeneration.
For this, two groups of animals were included, one treated with STZ (stz_d84, n=9) and the other receiving a sham treatment (sham_d84, n=6). Weight, length, and colors did not differ significantly between groups (Table 2). Stz_d84 was subjected to the glucose tolerance test at day 22, 32, 42, 52, and 72, whereas sham_d84 was subjected to the test at day 22, 42, and 72. To minimize blood loss during the glucose tolerance test, two measurements were excluded from the test, and blood glucose was measured 0h, 10 min, 14h, and 24h after glucose injection. At day 84, the animals were sacrificed 9h after glucose injection for histological examination (see Part III: Diabetic state at day 22, day 35, and day 84).

Induction of Diabetes at Day 22

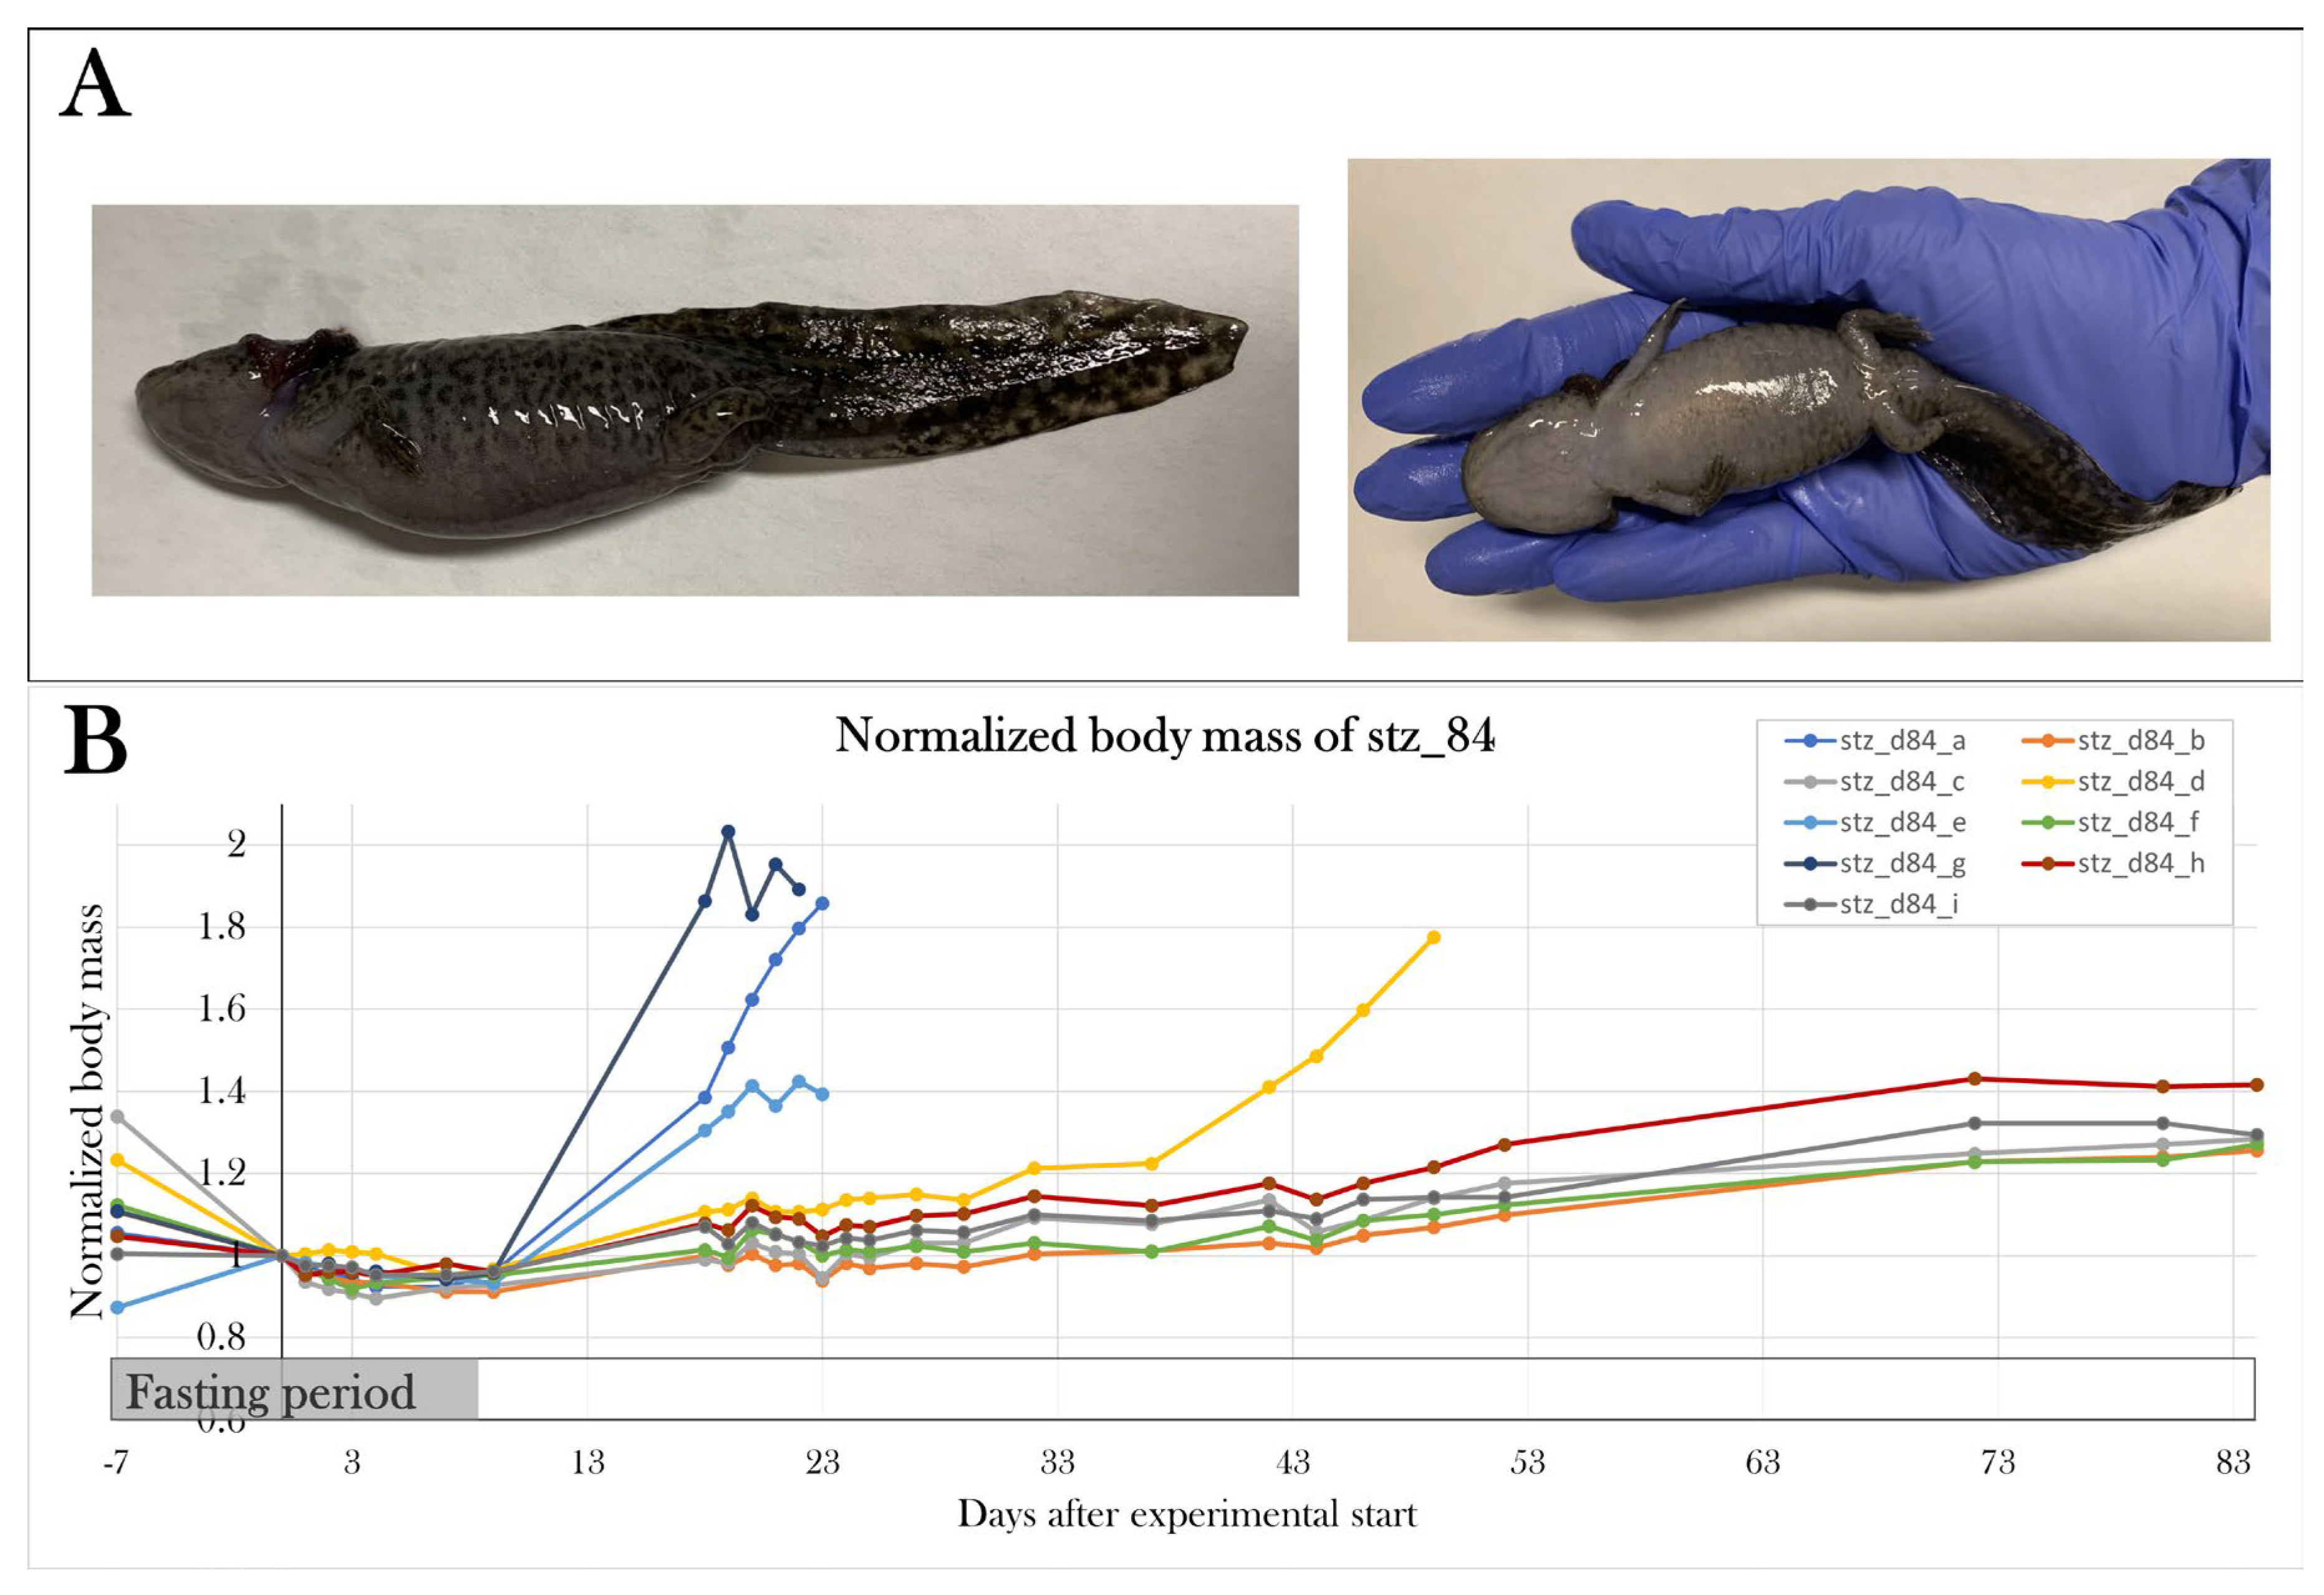
At day 22, 3/9 of stz_d84 were affected by swelling, and one was excluded from the experiment prior to the glucose tolerance test due to a weight gain of 89.2% since day 0. Animals were given glucose injections normalized to their weight with the assumption that glucose is distributed in the whole body, unaffected by swelling.
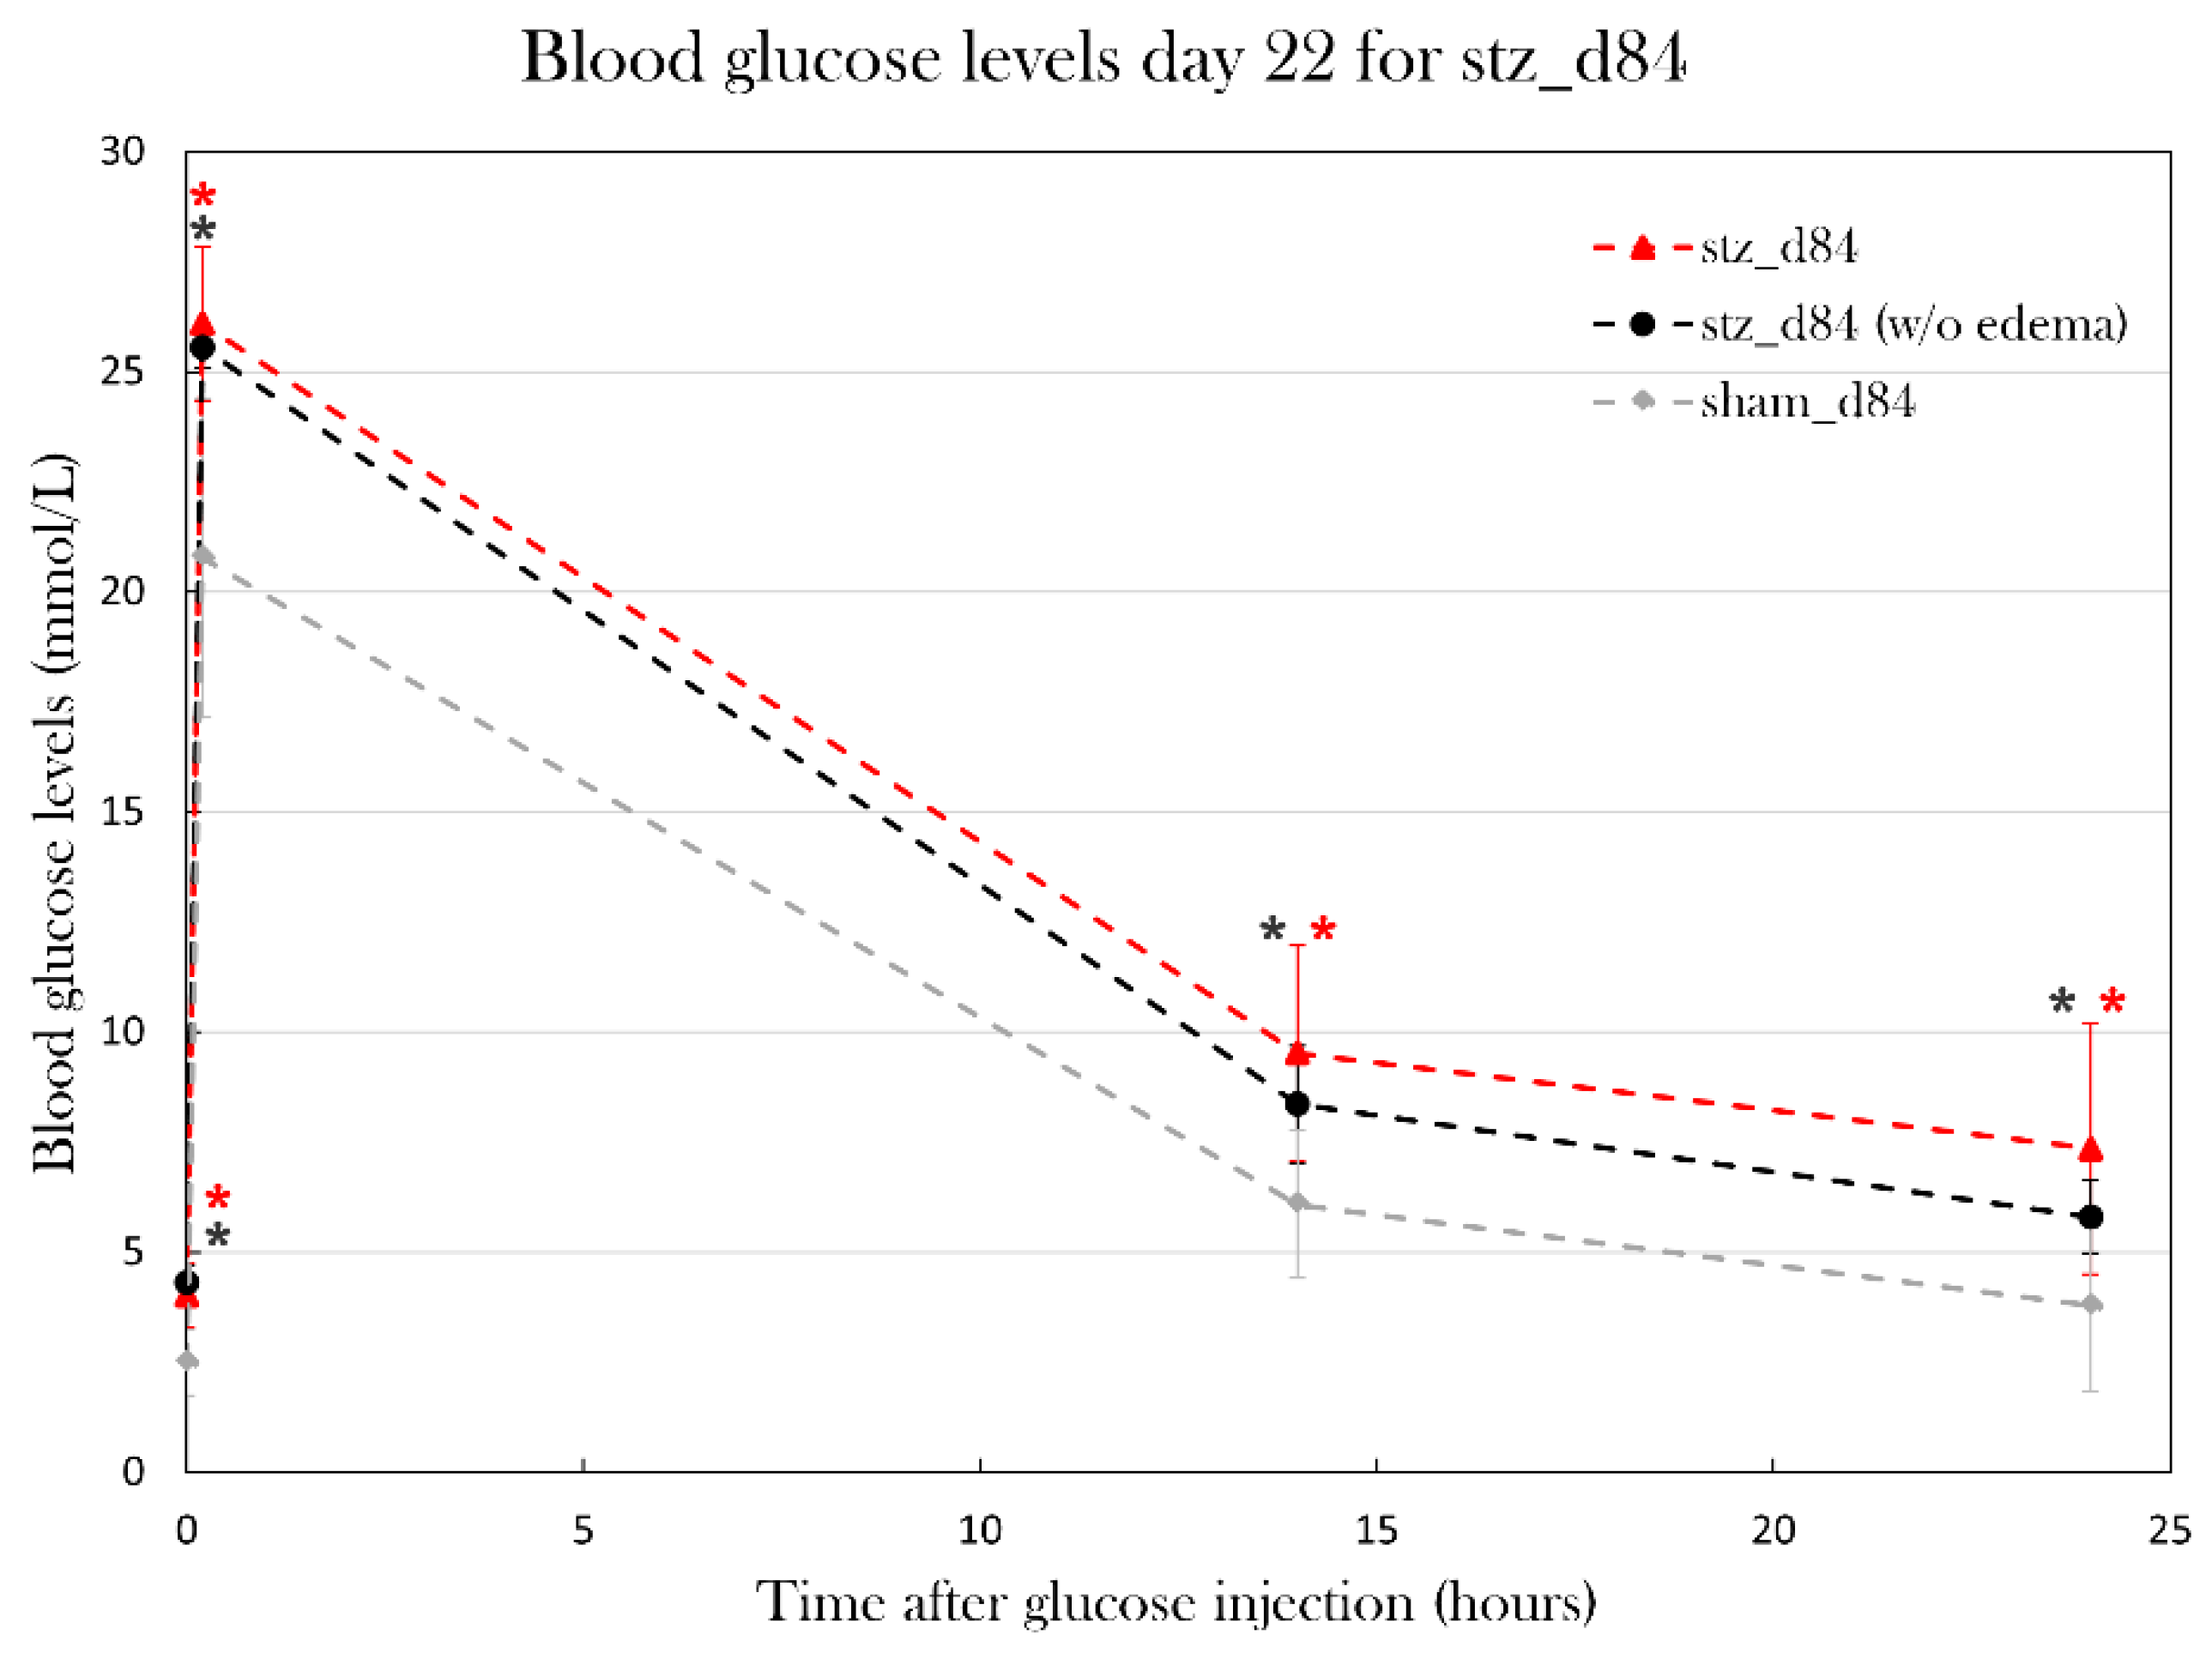
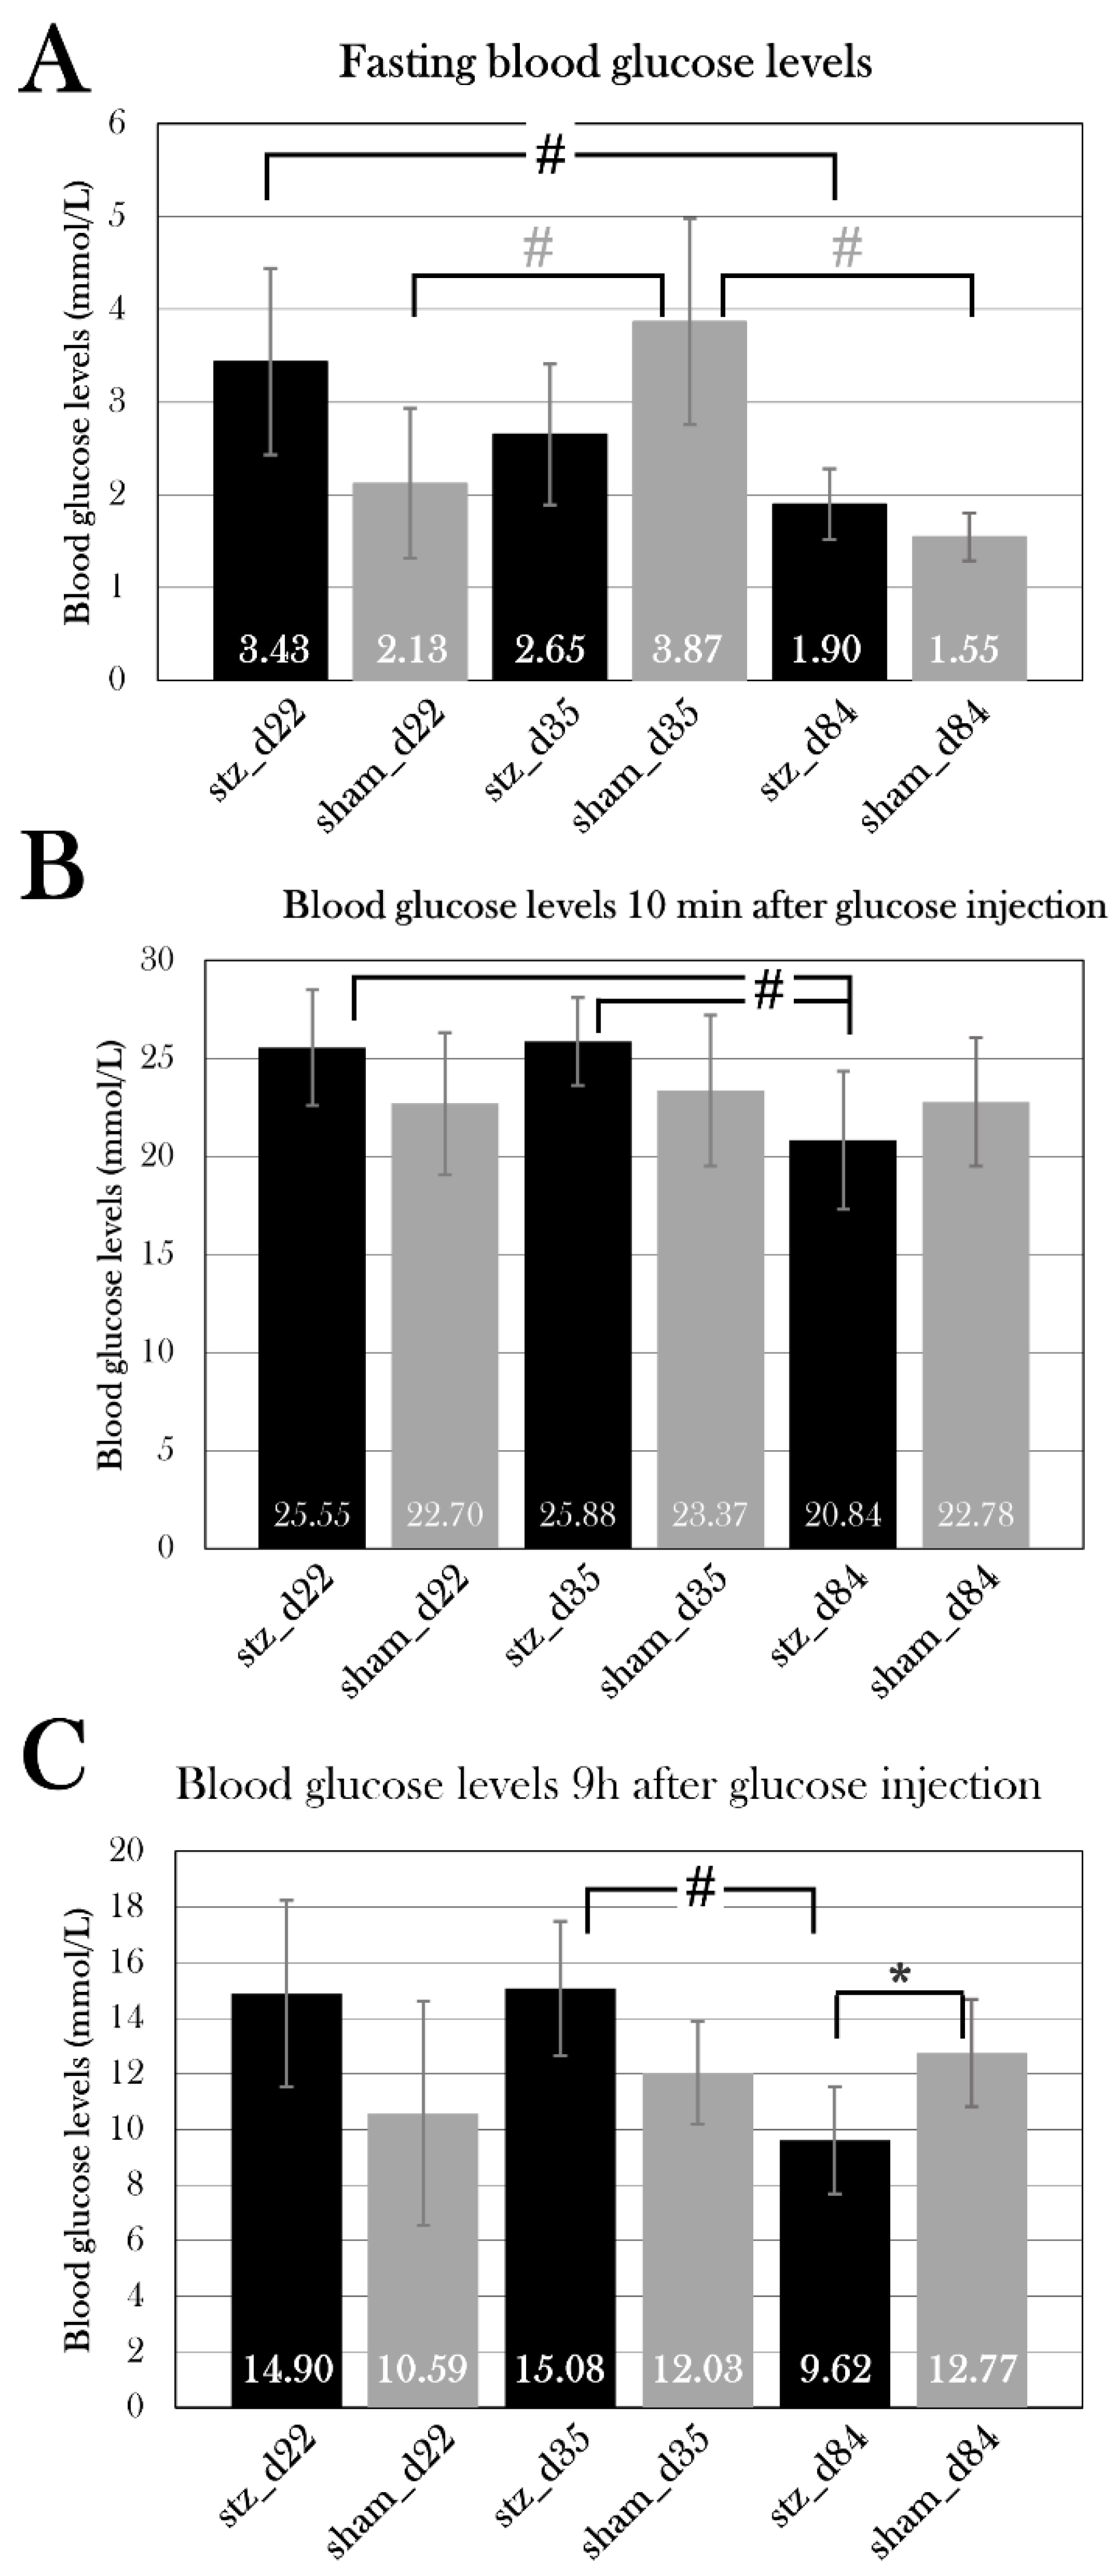
Blood glucose levels were significantly higher in stz_d84 compared to sham_d84, even when excluding the swollen animals (Figure 12). Fasting blood glucose levels were significantly higher in stz_d84 compared to sham_d84 (2.5±0.7 mmol/L), both with (4.0±0.7 mmol/L) (p=0.0027) and without (4.3±0.6 mmol/L) (p=0.0013) the swollen animals. After glucose injection, blood glucose levels were significantly higher after 10 min (26.1±1.7 mmol/L) (p=0.0033), 14h (9.5±2.4 mmol/L) (p=0.012), and 24h (7.5±2.9 mmol/L) (p=0.022) in stz_d84 compared to sham_d84 (10 min: 20.8 mmol/L, 14h: 6.1±1.7 mmol/L, 24h: 3.8±2.0 mmol/L). By excluding the swollen animals, blood glucose levels were still significantly increased after 10 min (25.9±0.6 mmol/L) (p=0.0113), 14h (8.5±0.8 mmol/L) (p=0.0090), and 24h (6.1±0.9 mmol/L) (p=0.0265). These results show that the STZ treatment made the animals hyperglycemic, indicating that I was able to induce diabetes in stz_d84.
Figure 12. Blood glucose levels in the glucose tolerance test at day 22 of the experiment for stz_d84 (all), stz_d84 (without swollen/edema animals) and sham_d84. Plotted data show mean group values ± SD. An asterisk (*) indicates significant differences between a group compared to the sham_d84 determined with a Student’s T-test (*p=0.05). stz_d84 both with (red) and without (black) swollen animals have significantly higher blood glucose levels throughout the test compared to sham_d84 (grey).
Preprints 67511 g012
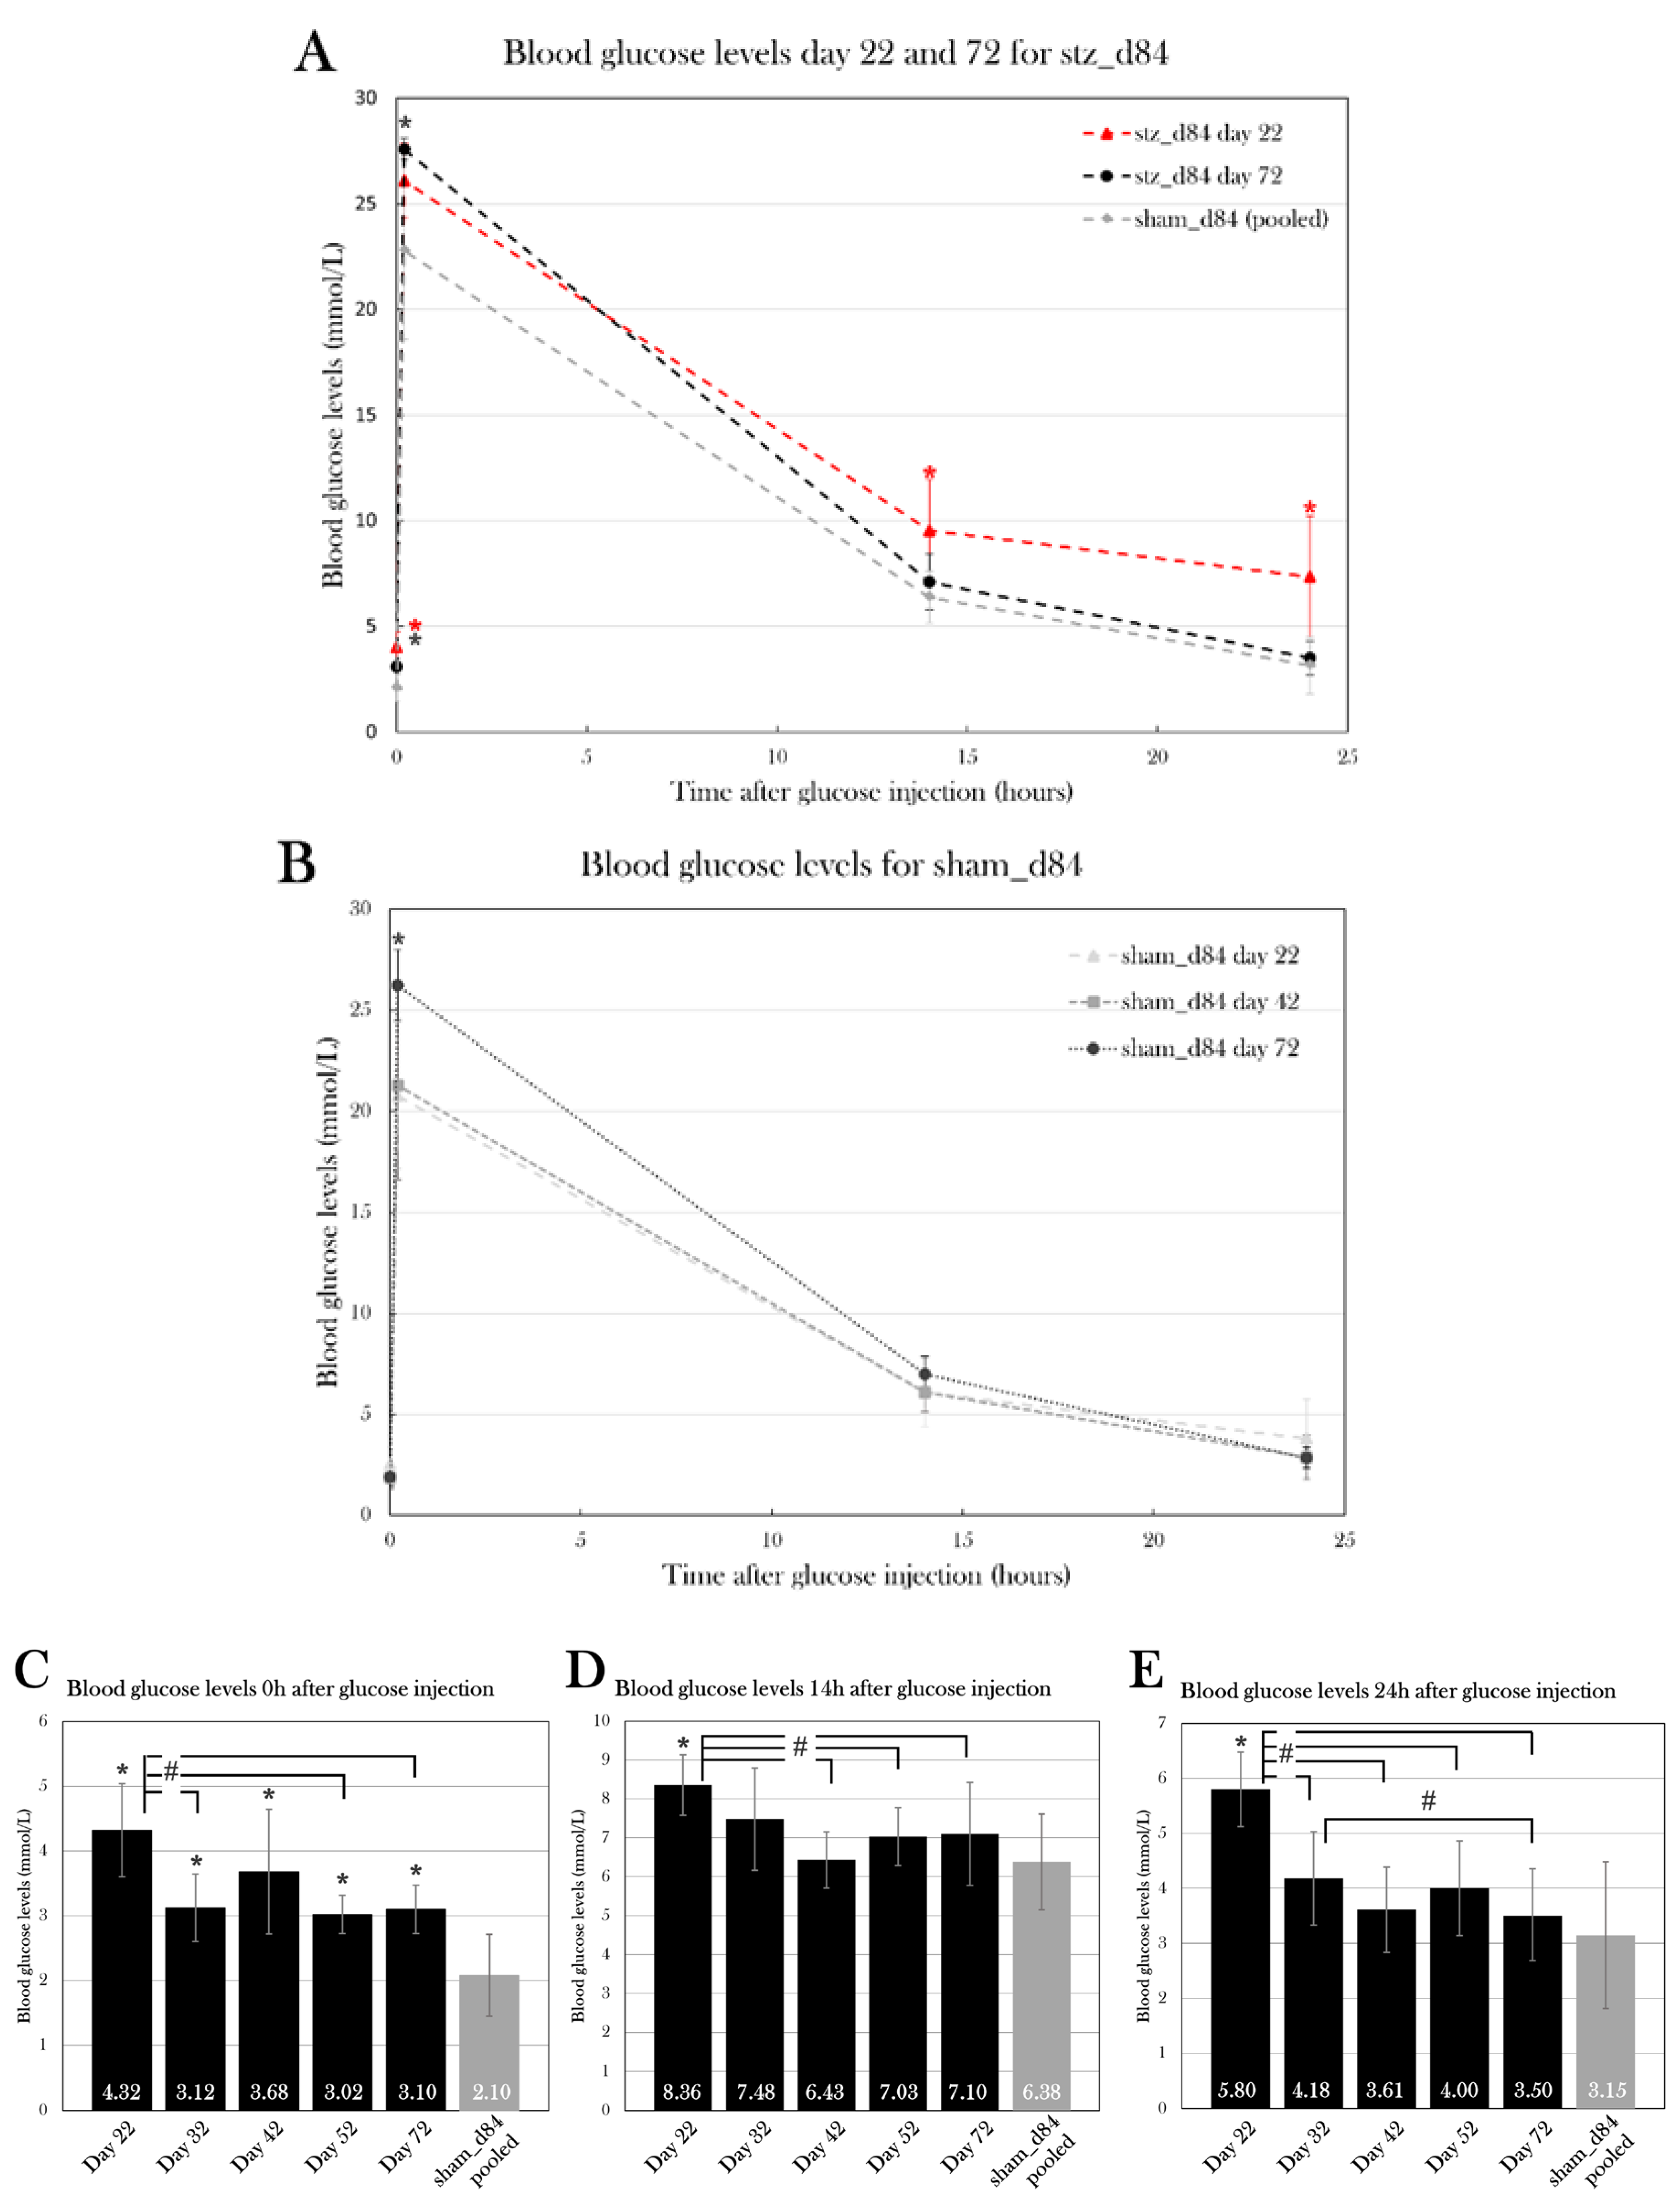
Figure 13. stz_d84 and sham_d84 were subjected to the glucose tolerance test throughout the experiment. Plotted data show mean group values ± SD. An octothorpe (#) indicates significant differences between the blood glucose levels of stz_d84 measured at different days determined with an ANOVA test (#p=0.05). An asterisk (*) indicates significant differences between a group compared to the sham_d84 determined with a Student’s T-test (*p=0.05). A) Blood glucose levels at day 22 (red) and 72 (black) of stz_d84 compared to sham_d84 (grey). B) Blood glucose levels at day 22 (triangle) statistically compared to day 42 (square) and 72 (circle) of sham_d84. C-E) Blood glucose values of stz_d84 (black) in the glucose tolerance test at different days compared to sham_d84 (grey) 0h (C), 14h (D), and 24h (E) after glucose injection.
Preprints 67511 g013

Blood Glucose Levels Normalized over the Span of 72 Days

Blood glucose levels were monitored during the experiment by subjecting stz_d84 day 22, 32, 42, 52, and 72 and sham_d84 at day 22, 42, and 72 to the glucose tolerance test. 4/9 of stz_d84 were excluded from the blood glucose analysis, as animals experienced swelling and were sacrificed over the course of the experiment.
The blood glucose levels of stz_d84 decreased over time, showing maximal hyperglycemia at day 22 and normalizing over time, nearly returning to blood glucose levels seen in sham-treated animals by day 72 of the experiment (Figure 13A). Using a one-way repeated measures ANOVA test and a pairwise paired T-test, blood glucose measured 0h, 10, 14h, and 24h after glucose injection at each day were compared. According to the ANOVA test, there was a significant difference between the fasting blood glucose levels measured at the different days for stz_d84 (p=0.025), especially between day 22 and day 32 (p=0.024), 52 (p=0.042), and 72(p=0.049) (Figure 13C). There was no significant difference between the days at the 10 min measurement (p=0.18). However, this significant change over time was also seen at the 14h glucose measurement(p=0.021) (Figure 13D). The pairwise paired T-Test showed that blood glucose levels at day 22 differed from day 42 (p=0.0079), day 52 (p=0.038), and day 72 (p=0.031). The blood glucose levels after 24h also differed significantly between the days (p=6.67×10⁻⁵), in which blood glucose levels differed between day 22 and day 32 (p=0.021), 42 (p=0.0018), 52 (p=0.0009), and 72 (p=0.0052), and blood glucose levels measured day 32 differed from day 72 (p=0.011) (Figure 13E). At blood glucose measurements after 14h and 24h, stz_d84 also displayed variations between the subjects (p=0.020 and p=0.0050, respectively).
As for sham_d84, there was no difference between blood glucose measurements at after 14h or 24h, but there was a difference after 10 min between day 72 and day 22 (p=0.0057) and 42(p=0.043) (Figure 13B). However, the difference in blood glucose levels 10 min after glucose injection did not affect the glucose consumption rate throughout the glucose tolerance test, as blood glucose levels did not differ between the test days 14h (p=0.28) and 24h (p=0.23) after glucose injection. Thus, blood glucose levels 10 min after glucose injection does not seem to reflect true blood glucose levels, but more an unequal distribution of glucose in the body tissues at this timepoint, or other factors which makes the exact level at this timepoint insignificant.
Thus, measurements were pooled at each timepoint for sham_d84 to compare to the blood glucose levels at each test day for stz_d84. Using a Student’s T-Test, fasting blood glucose levels showed to be significantly higher at day 22 (p=9.76×10⁻⁷), 32 (p=0.0030), 42 (p=0.00021), 52 (p=0.0044), and 72 (p=0.0027) compared to pooled sham_d84 (Figure 13C). However, fasting blood glucose levels decreased from 4.3±0.7 mmol/L to 3.1±0.4 mmol/L from day 22 to day 72 (paired T-Test: p=0.049) compared to 2.1±0.6 mmol/L in pooled sham_d84, showing a normalization of fasting blood glucose levels over time.
As for 14h and 24h after glucose injection, only blood glucose levels at day 22 were significantly higher compared to sham_d84 (Figure 13D, E). At day 22, stz_d84 had blood glucose levels of 8.4±0.8 mmol/L compared to 6.4±1.2 mmol/L seen in sham_d84 14h after glucose injection (p=0.0028), and blood glucose levels of 5.8±0.7 mmol/L compared to 3.2±1.3 mmol/L seen in sham_d84 24h after glucose injection (p=0.00037).
Thus, stz_d84 displayed maximal hyperglycemia at day 22, and blood glucose levels normalized over the span of the experiment.

Blood Ketone Levels Were High at Day 22 and Decreased over Time in stz_d84

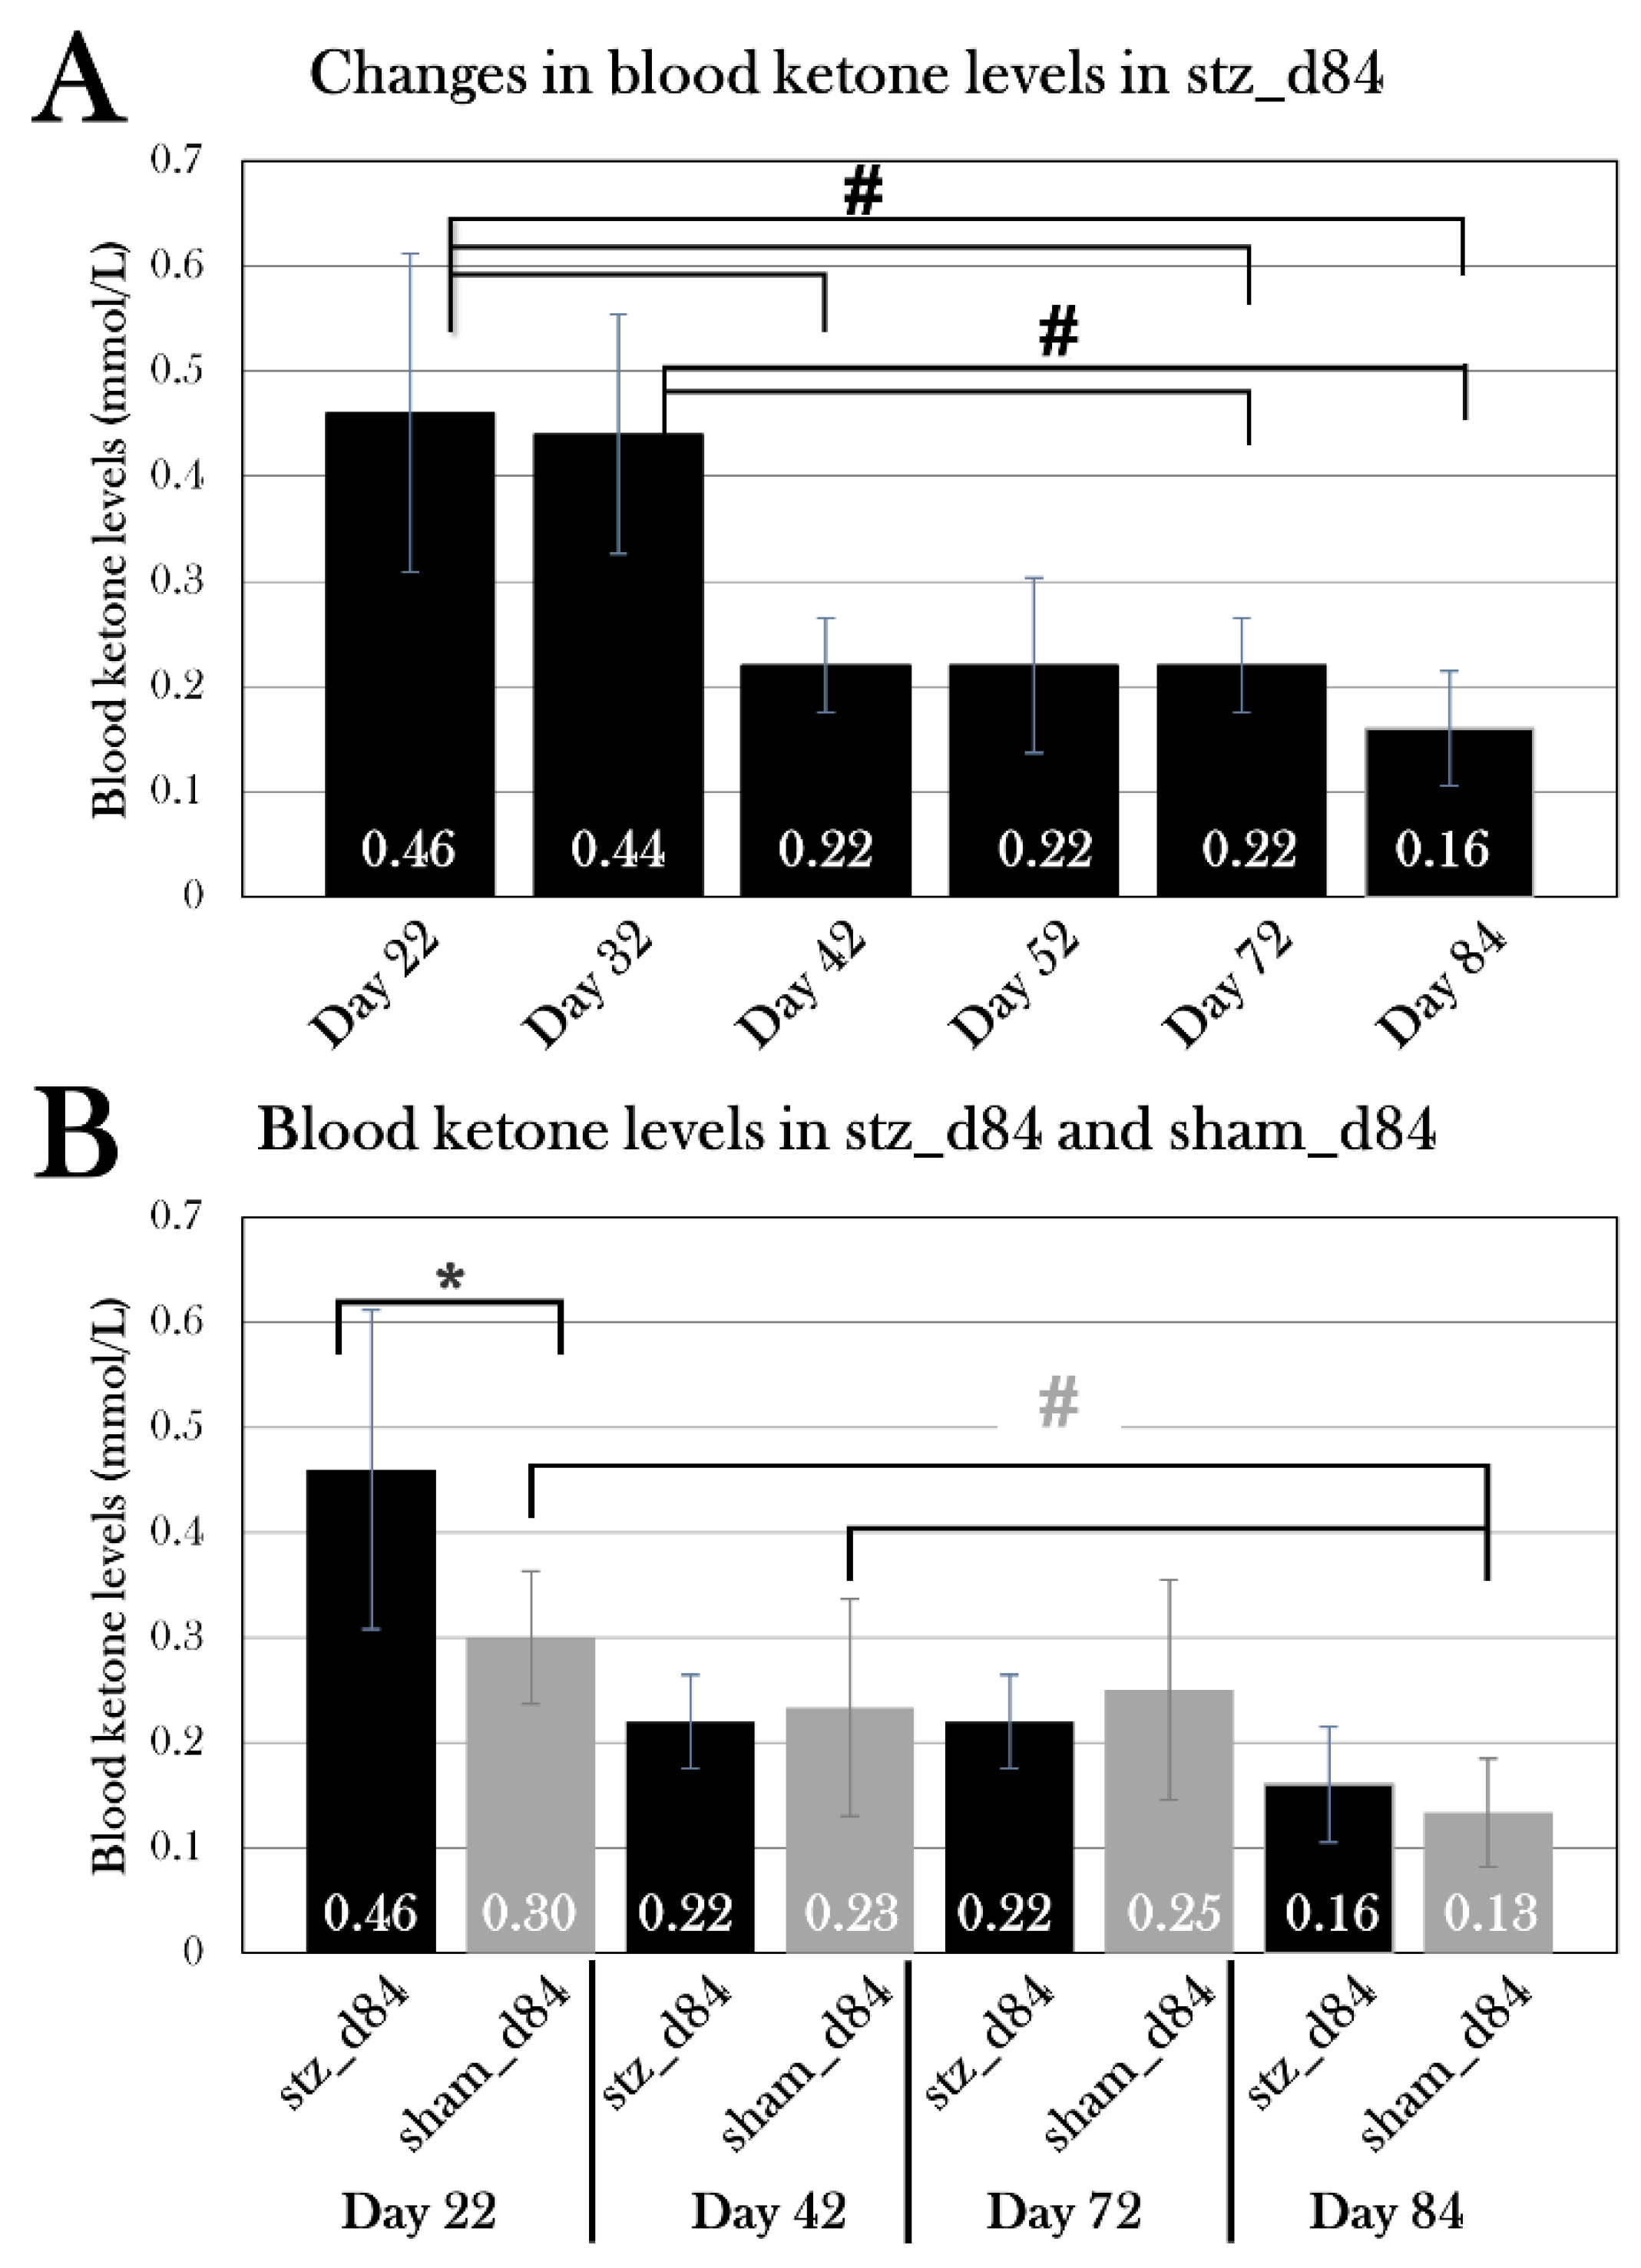
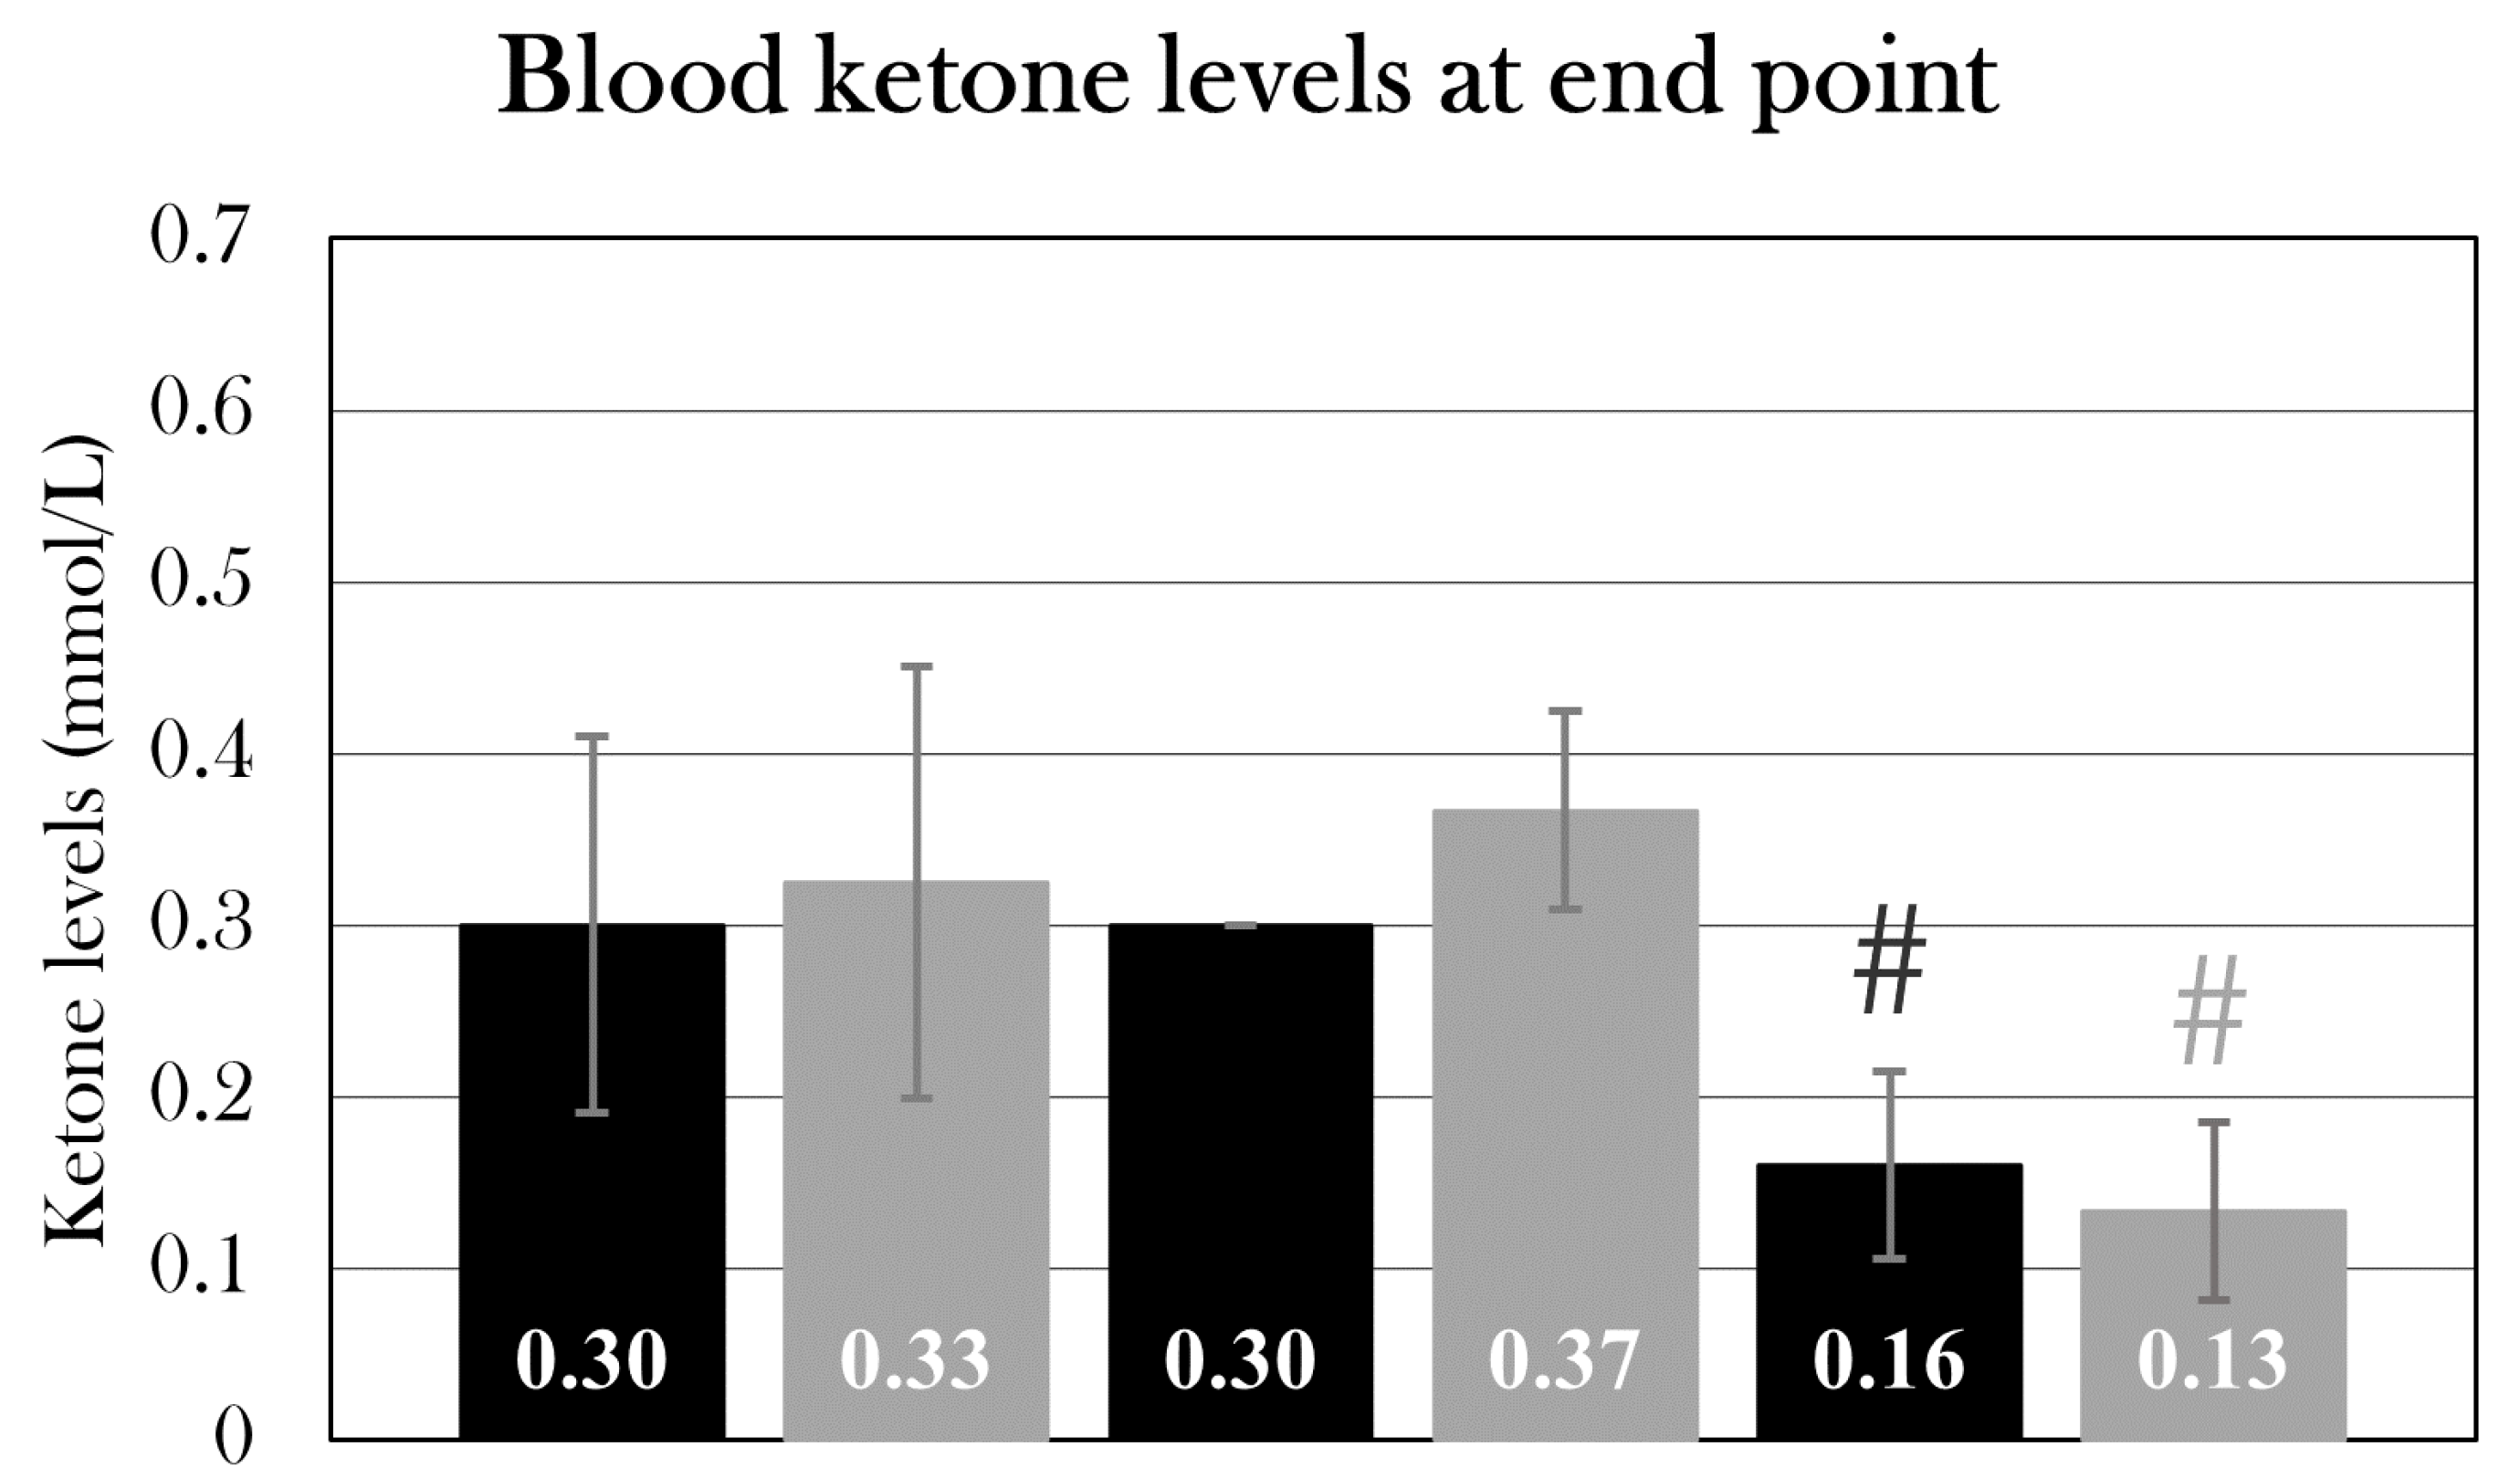
As ketone bodies are an alternative metabolic fuel used by the body when suffering from severe diabetes, and since increased ketone bodies in the blood are seen in other amphibians after a pancreatectomy[25], the changes in blood ketone levels over the course of the experiment was measured before every glucose tolerance test on both stz_d84 and sham_d84. For stz_d84, blood ketone levels decreased over time, from blood ketone levels of 0.46±0.02 mmol/L at day 22 to 0.16±0.003 mmol/L at day 84 (Figure 14A). Using the one-way repeated measures ANOVA test and the pairwise paired T-Test, the change in blood ketone levels from day 22 to day 84 was analyzed, showing a significant change over time (p=0.0001), especially between blood ketone levels day 22 and day 42 (p=0.0093), 72 (p=0.0093), and 84 (p=0.013), and also between ketone levels at day 32 and day 72 (p=0.030) and 84 (p=0.020). However, sham_d84 also showed a significant change in blood ketone levels over the span of the experiment (p=0.030), between blood ketone levels day 84 and day 22 (p=0.011) and 42 (p=0.041), suggesting that another factor than the STZ treatment resulted in the decrease in blood ketone levels seen at day 84. However, blood ketone levels were significantly higher in stz_d84 than in sham_d84 at day 22 (p=0.042) (Figure 14B), indicating that the STZ treatment has resulted in an initial increase in ketone content in the blood.

Part III: Diabetic State at Day 22, Day 35, and Day 84

As I was able to induce hyperglycemia and, thus, diabetes-like disease in stz_d84, four additional groups were included in the study to investigate the histological changes in the pancreas. Two groups, stz_d22 and sham_d22, were treated with STZ and sham, respectively, and sacrificed on day 22, as the blood glucose measurements in stz_d84 indicated maximal hyperglycemic response at this time point. The other groups, stz_d35 and sham_d35, were also treated with STZ and sham, respectively, but sacrificed at day 35, as blood glucose levels of stz_d84 decreased in the period between day 22 and 42, suggesting a physiological response causing normalization of blood glucose levels, possibly caused by β cell regeneration.
The weight, length, and age of the animals differed both internally and externally between the groups (Table 2), but they were used nonetheless with the assumption that the STZ protocol adjusted for body mass differences.

The STZ Treatment Did not Induce Hyperglycemia in stz_d22 and stz_d35

At the day of euthanasia, all animals were subjected to a glucose tolerance test and were sacrificed 9h 20 min after glucose injection, in which blood glucose was measured 0h, 5 min, and 9h 20min after glucose injection. Neither stz_d22 nor stz_d35 differed from sham_d22 and sham_d35 when comparing blood glucose levels at all time points, whereas stz_d84 had a blood glucose of 9.6 ±1.9 mmol/L after 9h, which was lower than what was seen in sham_d84 (Figure 15C).
The STZ-treated groups were compared using the single factor ANOVA test and the pairwise T-Test, showing a significant difference in fasting blood glucose levels (p=0.0231), especially between stz_d22 and stz_d84 (p=0.012) (Figure 15A). Blood glucose levels also differed after 10 min (p=0.038), as blood glucose levels were lower for stz_d84 than stz_d22 (p=0.045) and stz_d35 (p=0.036) (Figure 15B). The blood glucose levels of the STZ-treated animals also differed significantly at the endpoint (p=0.012), especially between stz_d35 and stz_d84 (p=0.011) (Figure 15C). However, conducting the same comparison between the sham-treated groups showed a significant difference in fasting blood glucose levels (p=0.0027) (Figure 15A), but no difference was seen in blood glucose levels after 10 min or at the endpoint. This suggests that animal variations affect fasting blood glucose levels. However, as there was no significant difference between blood glucose measurements between Stz_d22 and Stz_d35 compared to sham_d22 and sham_d35, respectively, there are no indications of diabetes based on blood glucose measurements, and I was therefore not able to induce diabetes in these animals.
Figure 15. Blood glucose levels in the glucose tolerance test at the day of euthanasia. Plotted data show mean group values ± SD of the STZ-treated (black) and sham-treated (grey) groups. An octothorpe (#) indicates significant differences between the blood glucose levels of either STZ-treated or sham-treated groups determined with an ANOVA test and a pairwise T-Test (#p=0.05). An asterisk (*) indicates significant differences determined with a Student’s T-test (*p=0.05). A) Fasting blood glucose levels. There is a significant difference between both the STZ-treated and the sham-treated groups. B) Blood ketone levels 10 min after glucose injection. There is a significant difference between STZ-treated group, as stz_d84 has lower blood glucose levels than stz_d22 and stz_d35. C) Blood glucose levels 9h after glucose injection. Stz_d84 has significant lower blood glucose levels than stz_22 and stz_d35, but also sham_d84.
Preprints 67511 g015

The STZ Treatment Did not affect BLOOD Ketone Levels in stz_d22 or stz_d35

As stz_d84 displayed higher blood ketone levels at day 22, which decreased over time, the blood ketone levels were measured in all groups at the endpoint right before the glucose injection. There was no significant difference between STZ-treated groups and sham-treated groups at day 22, 35, or 84, but stz_d84 displayed significantly lower blood ketone levels than stz_d22 and stz_d35 (p=0.021), and sham_d84 displayed significantly lower blood ketone levels than sham_d22 and sham_d35 (p=0.0033) (Figure 16). However, the measurements do not suggest that the STZ treatment affected the blood ketone levels in any ways.

The Percentage of Insulin-positive CELLS is Lower in STZ-Treated Animals at Day 84, but not at Day 22 or 35

To study the effect of STZ on the pancreatic β cells, insulin-positive cells were detected using immunofluorescence staining in the pancreas of all groups (Figure 19B, E). The β cell mass was quantified, and the percentage of insulin-positive cells was calculated.
According to a Student’s T-Test, there was no significant difference between STZ-treated and sham-treated groups at day 22 (p=0.20) or day 35 (p=0.99) (Figure 17), supporting the analysis of the blood glucose measurements showing that I was not able to induce hyperglycemia in these animals.
However, stz_d84 experienced a lower percentage of insulin-positive cells in the pancreas compared to sham_d84 (p=0.022) (Figure 17). There was 1.82±0.73% of insulin-positive cells in stz_d84 compared to 3.97±0.73% in sham_d84, suggesting that the STZ treatment resulted in a reduction of β cell mass in stz_d84, which has not been replenished at day 84. Furthermore, it indicates that this percentage of insulin-positive cells is enough to restore blood glucose levels, as the glucose tolerance test at day 84 showed normalized blood glucose levels when comparing to sham_d84 (Figure 15).
The pancreatic number of insulin-positive cells was compared between the STZ-treated groups and the sham-treated groups. There was no difference between the STZ-treated groups, but a significant difference between the sham groups (p=0.049), with a pairwise T-Test showing that sham_d84 had a significantly higher percentage of insulin-positive cells than sham_d22 (p=0.035), but this could be caused by the variations seen between the animals, such as age and body mass (Table 2).
Figure 17. Percentage of insulin-positive cells of total cells in the pancreas of stz_d22 (n=4), sham_d22 (n=3), stz_d35 (n=4), sham_d35 (n=3), stz_d84 (n=3), and sham_d84 (n=3). An octothorpe (#) indicates significant differences between either STZ-treated or sham-treated groups determined with an ANOVA test and a pairwise T-Test (#p=0.05). An asterisk (*) indicates significant differences determined with a Student’s T-test (*p=0.05). For each animal, four pancreas sections were used, the percentage of insulin-positive cells was calculated, and the mean for all sections was used as the value for the animal. Plotted data show mean group values ± SD of the STZ-treated (black) and sham-treated (grey) groups. stz_d84 had a significantly lower percentage of insulin-positive cells in the pancreas compared to sham_d84. There was no difference between the STZ-treated groups at day 22, 35, and 84, but sham_d84 had a significantly higher percentage of insulin-positive cells than sham_d35.
Preprints 67511 g017

Cell Proliferation is Unchanged at Day 35

To investigate if the axolotl regenerates β cells after the STZ treatment and if a proliferative response is the cause of the blood glucose normalization seen in stz_d84, the pancreas of stz_d35 and sham_d35 were stained for proliferative cells using an EdU kit to detect DNA proliferation.
There was no significant difference in the percentage of proliferating cells between stz_d35 and sham_d35 (p=0.20) (Figure 18), and proliferation was scattered in the tissue, not centered in the endocrine islets (Figure 19C).

Staining of Apoptosis Resulted in Whole-Organ Stain

To investigate if cell apoptosis was visible in the endocrine islet structures in the pancreas of STZ-treated animals, pancreas tissue was stained for DNA fragmentation in both STZ-treated animals and sham-treated animals. However, this TUNEL staining protocol resulted in staining of nearly all cells in the pancreas of all animals, indicating that the staining protocol must be optimized for the staining of axolotl pancreas before further analysis (Figure 19B, E).
Figure 19. Immunohistochemistry of pancreas. The tissue is from a STZ-treated animal, and the pancreas is halved. A) Hematoxylin-stained pancreas, showing the halved pancreatic tissue with darker islets of endocrine cells. B) Insulin- and TUNEL-stained pancreas. DAPI-stained nuclei are shown in blue, insulin in green and TUNEL in red. Insulin-positive β cells are located in islets, scattered randomly throughout the pancreas tissue. The TUNEL assay has stained nuclei of numerous cells, indicating that the assay must be optimized for axolotl pancreas to detect apoptosis, or that another marker for apoptosis must be used. C) EdU-staining (green) and DAPI-staining (blue) in the pancreas, showing that proliferating cells are scattered throughout the tissue. D) An endocrine islet in the hematoxylin-stained pancreas. E) The same islet as seen in (D) is stained for insulin (green), apoptosis (red), and nuclei (blue).
Preprints 67511 g019

Part IV: Systemic Effects of the STZ Treatment

Even though STZ is known to selectively target β cells, STZ has been seen to cause nonspecific toxicity[63], and the STZ treatment resulted in swelling and abnormal weight gain in both pilot groups (Figure 11) and the main study groups (Appendix B. – Body mass of experimental animals). Also, systemic effects have previously been seen in the STZ-treated axolotl, such as bleedings in the skin, liver, and kidney, including accumulation of fluid in the pericardium and the abdomen[91]. However, systemic effects can also be a result of hyperglycemia, as diabetes is also known to affect other organs, such as the kidneys and liver. Therefore, systemic effects can both be a non-specific effect of STZ, but also a result of diabetes, and these systemic effects was investigated by measuring blood and urine parameters.

The STZ Treatment Resulted in Massive Weight Gain Caused by Edema in Some Animals, but not All

10/19 animals in the STZ-treated groups responded to the STZ treatment by a gain of body mass. This was seen in 4/6 of stz_d22, 2/4 of stz_d35, and 4/9 of stz_d84 (Appendix B. – Body mass of experimental animals).
In stz_d22, two animals had increased their weight by 20.3±0.4%, and two animals had increased their weight by 111.1±56.3% over the period of 22 days (day 0 to 22). Two animals in stz_d35 had increased their weight by 65.5±13.8% over the period of 35 days (day 0 to 35). In stz_d84, three animals increased their weight by 70.5±24.7% over the period of 22 days (day 0 to 22), and one animal increased its weight by 43.9% over the period of 49 days (day 0 to 49) (Figure 20). These animals in stz_d84 were therefore euthanized and excluded from the rest of the experiment. These changes in body mass were observed to happen suddenly and over a short period. The other animals only experienced slight changes in body mass and were thus unaffected by this effect of STZ. Interestingly, this change in body mass was primarily seen early in the experiment (around day 20), but one animal in stz_d84 suffered from edema after 43 days (Figure 20B).
Of all swollen animals, 8/10 were of wild type, whereas two were leucistic, indicating that the color of the animal could influence the effect of STZ on body mass.
By autopsy, it was discovered that this massive change in body mass was a result of edema (Figure 20A), as fluid was found in the pericardium, skin, and abdomen, among other locations. The assembling of fluid in pericardium was so extensive in some animals that it slowed the heart rate. Furthermore, animals affected by edema had punctured, emptied bladders.
Figure 20. Macroscopic changes in some STZ-treated animals. A) Two pictures that show an axolotl suffering from edema after STZ treatment, seen from two different angles. B) Body masses of the individual animals in stz_d84 normalized to the average body mass of the group at day 0 of the experiment. Some animals steadily increase their mass over time, whereas some (stz_d84 a, d, e, and g) suddenly increase their body mass by 40-100%, resulting in euthanasia.
Preprints 67511 g020

The Osmolarity and Red Blood Cell Fraction Were Abnormal in the Blood of the Swollen Animals

Hyperosmolarity is seen in diabetic patients and STZ-treated animal models[92]. To investigate if the STZ treatment influenced the concentration of osmolytes in the animals which suffered from edema, plasma osmolarity was measured. Mean plasma osmolarity was 131±6.8 mOsmol/L for PS4 and PS5 (n=5), which is lower than the osmolarity of healthy animals (p=4.17×10⁻⁸), which our group previously has measured as 208±8 mOsmol/L (n=6) (Figure 21C).
Furthermore, the fraction of red blood cells in whole blood was examined, as the swollen STZ-treated animals were observed to have thin blood. There was no difference in the fraction of red blood cells between the stz_d22 and sham_d22, stz_d35 and sham_d35, and stz_d84 and sham_d84 (Figure 21A). Thus, the swollen STZ-treated animals of stz_d22, stz_d35, and stz_d84 (n=7) were grouped for the analysis and their fraction of red blood cells was compared to all sham-treated animals (n=13), showing that swollen STZ-treated animals have a significantly lower fraction of red blood cells in whole blood (p=0.011) (Figure 21B).
Consequently, the STZ treatment does not result in changes in the blood composition of red blood cells, but animals suffering from edema are affected by hypoosmolarity and lowered fraction of red blood cells in the blood.

Blood Creatinine, Albumin, and Alkaline Phosphatase Activity Were not Altered in STZ-Treated Animals, but Animals Affected by Edema Had Lowered Alkaline Phosphatase Activity in the Blood

STZ has been reported to cause hepatic and renal failure[64,66,67], and these organs can also be affected by hyperglycemia in diabetic patients[66,67,93]. To address this, albumin concentration, creatinine concentration, and alkaline phosphatase activity were measured in plasma to study liver and kidney function. Plasma was analyzed from the same 3-4 animals from each group. No statistically significant differences were detected by comparing STZ-treated animals with sham-treated animals at each day, and there was no significant change between STZ-treated groups or sham-treated groups (Figure 22A, C, E). However, by pooling animals affected by edema from stz_d22 and stz_d35 and comparing their plasma values with a pooled sham-treated group, it showed that animals affected by edema had a significantly lower alkaline phosphatase activity (p=0.0024) (Figure 22D).

Urine Glucose Levels Were Significantly Higher in stz_d84

In diabetic patients, the body regulates hyperglycemia by excreting glucose in the urine when the glucose amount surpasses the amount which can be reabsorbed by the proximal tubules in the kidneys, resulting in glycosuria[94]. Changes in urine glucose levels can therefore be used to identify diabetes. Therefore, glucose amount was measured in urine, first using the handheld device used for blood glucose measurements, and secondly by performing a glucose assay. Unfortunately, the sample size was small in the STZ-treated groups day 22 and 35, as edema resulted in puncture of the bladder, and I was therefore not able to collect urine from those animals.
Using the handheld device, urine glucose levels measured 20.8±0.6 mmol/L in stz_d22 (n=3) and 11.45±1.3 mmol/L in sham_d22, which is significantly higher in STZ-treated animals (p=0.0016) (Figure 23A). There was no significant difference between stz_d35 (n=2) (17.7±13.2 mmol/L) and sham_d35 (n=2) (8.5±7.4 mmol/L), but glucose measurements also displayed great variance between the subjects. Urine glucose levels of stz_d84 were not measured using the handheld device, but sham_d84 (n=6) had urine glucose levels of 6.7±1.0 mmol/L.
Using the glucose assay, urine glucose levels measured 3.5±0.4 mmol/L in stz_d22 (n=4), 3.8±0.4 mmol/L in sham_d22 (n=2), 3.5±0.3 mmol/L in stz_d35 (n=2), and 3.3±1.4 mmol/L in sham_d35 (n=3), but there was no significant difference between STZ-treated and sham-treated animals (Figure 23B). However, the urine glucose levels were significantly higher in stz_d84 (n=5) with levels of 3.9±0.4 mmol/L compared to 2.7±0.5 mmol/L in sham_d84 (n=6) (p=0.0021), suggesting that stz_d84 have a higher glucose excretion through urine. However, this could also suggest that the kidney function is inhibited by STZ treatment, even though the blood measurements did not indicate kidney dysfunction. Furthermore, the measurements using the glucose assay indicate that the handheld device cannot be used for urine sample measurements, as the glucose assay is a more reliable and thoroughly tested method.
Figure 23. Glucose levels in the urine of STZ-treated and sham-treated groups measured with the handheld device (A) and a glucose assay (B). Plotted data show mean group values ± SD. An asterisk (*) indicates significant differences determined with a Student’s T-test (*p=0.05). The handheld device is normally used to measure blood glucose, but it was assessed if this easily used tool could measure urine glucose. However, it overestimated the values massively and measured differences between stz_d22 and sham_d22, even though the glucose assay did not detect any differences at day 22. Instead, the glucose assay showed a significant difference between stz_d84 and sham_d84, in which urine glucose was higher in the STZ-treated animals.
Preprints 67511 g023

Urine Protein Levels Were Unaltered in STZ-Treated Animals

As mentioned previously, diabetic nephropathy is a common complication of diabetes and is characterized by proteinuria[39]. To investigate this, urine protein levels were measured in stz_d22 (n=3), sham_d22 (n=2), stz_d35 (n=2), sham_d35 (m=2), stz_d84 (n=5), and sham_d84 (n=6). There was no significant difference between urine protein levels between STZ-treated animals at day 22 (p=0.10), day 35 (p=0.35), or day 84 (p=0.64), but a comparison of the STZ-treated groups showed a significant difference between protein levels at day 22 compared to day 35 and 84 (p=0.012) (Figure 24). Therefore, there is a tendency that the STZ treatment increases urine protein levels at the start of the treatment, which decreases over time, but there is no significant difference between STZ-treated and sham-treated animals.

Discussion

In this project, I have investigated the axolotl as a potential regeneration-positive animal model of diabetes. As the axolotl has not been used in studies on diabetes prior to this project, a protocol for inducing diabetes was needed. For this, I have previously tested a protocol, in which 0.35 mg/g body mass of STZ is given five times over the span of 19 days, inspired by a previous study in zebrafish[90]. This protocol resulted in severe systemic toxicity and high mortality[91]. In this study, I have optimized the protocol and assessed five different treatment regimes in five pilot groups, in which the glycemic state of the animals was evaluated using the glucose tolerance test to measure the metabolic activity of glucose. Results showed that especially two treatment protocols made the animals hyperglycemic – PS1, in which 0.05 mg/g body mass was given five consecutive days, and PS3, in which 0.2 mg/g body mass was given once. Higher doses resulted in edema. Even though the protocol used in PS3 is easier to manage, the PS1 protocol was chosen as the most optimal protocol, as this already proved to have a minor effect after 10 days, and because studies in rodents have shown that multiple smaller doses of STZ have a better and less toxic effect than one larger dose[63]. It is possible that the protocol used on PS2 would make the animals diabetic at a later point in time than day 22, since the STZ injections are spread over a larger period than in PS1 and PS3, but in the interest of time, this was not investigated further, as a fast treatment response is of the most interest in experimental animals.
A method to quantify the amount of insulin was investigated, as such a method could be used to characterize diabetes in the animals. For this, a mouse insulin ELISA assay was evaluated on both plasma samples and pancreas tissue. The amount of insulin in plasma samples proved to be beyond the range of the assay, even when undiluted, indicating that the axolotl has a small level of insulin in the blood. More knowledge of the role of insulin in axolotl metabolism is heavily needed. On the other hand, the assay could detect insulin in pancreas tissue of control animals. To continue this study, I will use the ELISA kit and measure insulin content in the pancreas of the animals used in this project, but another assay with a lower range is needed for plasma measurements.
To characterize if I was able to induce diabetes in the animals, the glucose tolerance test was used, as it is a commonly used diagnostic tool. I have previously adjusted this test for axolotls[91], as they have a slow metabolic rate compared to rodents and humans, but the test was further optimized in this study, by including additional measurements (after 4h 40 min and 9h 20 min) during the test and adjusting the test to span over 24h instead of 14h, as blood glucose levels have returned to normal after 24h. This process can result in excessive blood loss, even though only small amounts of blood are collected for glucose measurements using a handheld device. The blood collection procedure itself will result in some loss of blood and, as seen when collecting blood samples throughout the test for insulin measurements, excessive blood loss can result in mortality. Thus, blood glucose levels were only measured 0h, 10 min, 14h, and 24h after glucose injection in the main study, as these animals were subjected to the test every tenth day.
Even though the injected glucose amount was adjusted to the body mass of the individual animal, the blood glucose measurement after 10 min varied between groups and between measurement days, as seen in sham_d84 (Figure 13B). This difference was not expected since glucose consumption is not believed to be initiated yet with the slow metabolic rate seen in axolotls. It can be speculated if this difference is a result of uneven distribution of glucose in the blood of the body, and it, therefore, does not reflect the true blood glucose content. It could also be a result of difficulty in correct injection, as puncture of the vessel with the syringe could cause spillage of glucose out in the tissue, causing blood glucose levels to be lower. However, a comparison of the glucose tolerance test results of sham_d84 at day 22, 42, and 84 suggests that the blood glucose levels 10 min after glucose injection do not affect blood glucose levels after 14h and 24h. Even though the blood glucose levels after 10 min differed at day 22, 42, and 84, the glucose levels were indifferent after 14h and 24h (Figure 13B). It suggests that the blood glucose levels 10 min after glucose injection does not affect the glucose consumption in the body and the blood glucose levels afterward.
As correct glucose injection is important for the glucose tolerance test as a diagnostic tool, glucose dosage was adjusted to the body mass of the animals. However, some animals experienced massive body mass changes caused by edema, which brings the question if the glucose injection should be adjusted to the exact weight of the animals, or if the mass of fluid should be considered metabolic inactive and thus be subtracted from the used weight. In this study, glucose was given with the assumption that the whole-body mass of the animal reflected the amount of metabolic active tissue, and that glucose also would be distributed evenly in the excessive fluid. As seen in the glucose measurements at day 22 in stz_d84, animals were hyperglycemic even when excluding the animals affected by swelling, and blood glucose levels did not differ particularly between stz_d84 with and without swollen animals, indicating that these assumptions of glucose distribution in the body are correct.
By using the adjusted STZ protocol and glucose tolerance test, the study of blood glucose changes over the span of 72 days was initiated. stz_d84 was hyperglycemic at day 22, like what was seen in the pilot experiment, and the blood glucose values normalized over time, nearly returning to blood glucose values seen in sham_d84 by day 72. The hyperglycemic state seen at day 22 indicates that I was able to induce diabetes in the stz_d84 and that some physiological response was initiated around day 32, as blood glucose levels were already lower at this point compared to day 22, but still significantly higher than blood glucose levels at day 72. Only at day 22 were the blood glucose levels during the glucose tolerance test significantly higher in stz_d84 compared to sham_d84, but fasting blood glucose levels continued to be higher in stz_d84 than in sham_d84 throughout the period. Thus, the animals were able to initiate a response to the sudden rise in blood glucose levels after glucose injection, but the animals were not able to return to the low fasting blood glucose levels. The high fasting blood glucose levels seen in stz_d84 are not considered diabetic blood glucose levels when considering diagnostic values used in humans (7 mmol/L[1]), but these parameters are not comparable between axolotls and humans, as the metabolic need is different between species. Thus, the fasting blood glucose levels seen in stz_d84 can be considered an indicator of diabetes, as they are significantly different from sham_d84.
The histological examination of β cell mass further emphasized that diabetes was induced in stz_d84, as stz_d84 showed a reduced β cell mass after the STZ treatment. Interestingly, this reduction in β cell mass was no longer reflected in the blood glucose levels at this point, as fasting blood glucose levels were significantly lower in stz_d84 at day 84 than in sham_d84, indicating that stz_d84 regained full β cell function with only 45.7% of the β cell mass seen in sham_d84. Therefore, the results suggest that diabetes was induced in stz_d84, having a full disease response around day 22, followed by normalization of blood glucose levels and restoration of β cell function at day 84.
stz_d22, sham_d22, stz_d35, and sham_d35 were included in the study, but blood glucose measurements did not indicate that diabetes was induced by the STZ treatment in these animals. Fasting blood glucose levels were not significantly different when comparing STZ-treated and sham-treated groups for each day of euthanasia, and sham_d35 even displayed higher fasting blood glucose levels than stz_d35. The histological examination of β cell mass in the pancreas did not show a difference between the STZ-treated and sham-treated groups, either. These four additional groups comprised animals with great variation in size and age, whereas stz_d84 and sham_d84, including all the animals used in the pilot studies, were animals from the same batch. Therefore, it can be hypothesized that these variations in blood glucose values could be caused by the biological variations of the animals. Therefore, it would be of interest to replicate the study, but with animals from the same batch, to investigate if the variations in age and size of the animals are the cause of the results in this study being inconclusive. This signifies one of the limitations with using axolotls as an experimental animal, as they are not commonly used, and supply in great amounts with limited variations can therefore be a challenge. Another way to adjust to the problem of animal variations would be to increase the sample size, as blood glucose values showed a hyperglycemic trend, and it is possible that this would be statistically significant with a larger sample size.
Even though stz_d35 did not display hyperglycemia, stz_d35 and sham_d35 were subjected to an EdU assay to detect eventual proliferation in the pancreas, which would be expected in a regenerative process, but the proliferating cells were scattered throughout the pancreas instead of being centered in the islets of β cells. Furthermore, even though there was a higher percentage of proliferating cells in stz_d35 than sham_d35, this was not statistically significant. This can be explained by the variations between the animals, but as the results indicate that we were not able to induce diabetes in these animals and thus not induce β cell death, we would not expect a proliferating response. Another thing to consider is the dosage of EdU for injection. Contradicting to what I did with the glucose injections, EdU injections were adjusted to the body masses of the animals one week prior to the experimental endpoint, as the animals experienced swelling shortly before the endpoint. As the glucose tolerance test showed that injected glucose was distributed in the whole tissue, unaffected by edema, EdU could have been administered accordingly, but as the EdU assay is expensive, it was adjusted as mentioned, and the staining still resulted in detectable signals in all animals.
Other histological examinations were conducted, including the TUNEL assay, which detects DNA fragmentations and would show if the STZ treatment resulted in β cell death, but this stain resulted in staining of most cells in the pancreas, indicating that the staining process failed and must be optimized for axolotl pancreas tissue. Furthermore, another β cell marker was investigated. Glucose transporter 2 is the transmembrane protein used by glucose, but also by STZ to enter β cells and induce its cytotoxic effects. An antibody was used to detect this protein, but this resulted in unspecific staining. It can be a challenge to find antibodies and kits in general that work in axolotl tissue as there are no species-specific kits on the market. This is yet another limitation of the axolotl as an experimental animal model. In future studies, it would be of interest to include more stains to detect other pancreatic cells, such as staining of glucagon to identify α cells. If the axolotl proves to be able to regenerate the pancreas, it would be of interest to identify the source of new β cells.
Blood ketone levels were also measured in all the groups at the endpoint, but there was no difference between the ketone values at day 22, 35, and 84 in the STZ-treated or sham-treated groups. However, the endpoint blood ketone levels were significantly lower in both stz_d84 and sham_d84 compared to the other groups of their treatment type, but this is not an effect of the STZ treatment. This can be explained again by inter-group variations, as stz_d84 and sham_d84 are from the same batch, whereas the other groups consist of animals of different ages and origins.
The continued measurements of blood ketone levels of stz_d84 and sham_d84 from day 22 to day 84 showed an initial increase of ketone bodies after the STZ treatment, which decreased over time, similar to what was observed in the glucose measurements. As with blood glucose levels, diagnostic values of blood ketone levels used in patients, with levels over 0.5 mmol/L seen in diabetic patients[95], cannot be used in axolotls, as their metabolic rate and their primary diet differ from humans. Though, stz_d84 displayed blood ketone levels of 0.5 mmol/L at day 22, and such high levels were not seen in any of the other groups. This suggests that there was a need for another metabolic fuel, like if glucose was not available.
Previously, we have seen an increase in body mass caused by edema in STZ-treated axolotls[91], but this effect was not seen in the pilot studies. However, all STZ-treated groups in the main study were affected by an increase in body mass caused by edema (Appendix B. – Body mass of experimental animals). The excessive fluid was distributed in the whole body, both in the abdomen, pericardium, and blood, which was emphasized by a lowered osmolarity and fraction of red blood cells in edema-affected animals. To investigate the cause of edema, kidney and liver function were studied by measuring albumin concentration, creatinine concentration, and alkaline phosphatase activity in blood. There was no significant difference between the STZ-treated groups compared to the sham-treated groups, but by pooling the swollen animals in stz_d22 and stz_d35, it showed that the edema-affected animals had decreased blood alkaline phosphatase activity. Normally, liver damage is characterized by elevation of alkaline phosphatase activity in blood, and lower levels of alkaline phosphatase are less common, but this is seen in anemia, among other diseases[96]. As swollen animals suffer from a reduced fraction of red blood cells in the blood, this could be the cause of the lowered alkaline phosphatase activity. More likely, it is an indicator of an imbalance in hematocrit values rather than liver and kidney functions.
Liver and kidney tissue have been harvested from all animals, and it will be investigated in future studies if there are any histological changes in the tissue which could indicate dysfunction, especially in the kidneys. The kidneys have a key role in maintaining the hydromineral balance in amphibians, by removing excess water from the body and minimizing ion loss[97], and a study in larval Ambystoma punctatum showed that the removal of the kidneys led to an expansion of the pericardial and abdominal cavities, caused by edema[98]. Urine glucose and protein levels were measured, which also can reflect renal function, but urine was not obtained from all animals suffering from severe edema due to puncture of the bladder. Yet, stz_d22 displayed a high level of protein in the urine, but this was not statistically significant. Also, stz_d84 had a higher level of glucose in the urine than sham_d84, which could indicate renal dysfunction, but it could also be a result of the animals’ inability to reabsorb all the glucose due to the reduced β cell mass and, thus, a higher need for excretion of excessive glucose. The kidneys must be further investigated, and in future studies, the function of the kidneys could be examined by measuring the glomerular filtration rate.
Other than the kidneys, the lymph system is important for the body-fluid balance in amphibians. In amphibians, fluid is collected by small lymph capillaries and transported to subcutaneous lymph sacs, in which it is redistributed and passed along by the pumping of the lymph hearts[99]. These lymph hearts are composed of skeletal muscle and connective tissue[99]. Edema could be caused by dysfunction of the lymph system, specifically the lymph hearts. Glucose is an important fuel for muscle tissue, and without knowing which glucose transporter handles the uptake of glucose in the muscle tissue of the lymph hearts, it is possible that STZ can enter these cells and cause cell death. This must be investigated in future studies.
Even though it is still unknown what caused edema in some of the animals, a method to drain the animals of excessive fluid could be investigated to avoid loss of animals. However, there is a risk that drainage would be a short-term solution, and that the animals would swell up again shortly after drainage. Another solution could be to house the animals in isosmotic water (Amphibian Ringer’s solution), as our group previously has prevented edema in long-term anesthetic animals by adjusting the osmolarity of the housing water.
Other than the liver and kidneys, the heart and eyes were harvested from the animals to characterize the effect of diabetes on these organs in future studies. Using the liver, kidney, and heart, glycogen storage would be investigated, as diabetes leads to a decrease in glycogen content in the liver, but an increase in glycogen in the heart and kidney[100]. Furthermore, the eyes were collected to study the effect on the retina by measuring the thickness of the retinal layers, inspired by a study in hyperglycemic zebrafish which showed a reduction in the retinal layers[101].
In future studies, variations between the animals should be minimized. Variations in animals have also shown to be a liability in rodent studies of diabetes, as the effect of STZ is affected by these factors[63]. Optimally, the animals should be of the same age, from the same batch, and preferably be leucistic or albino, as most of the edema-affected animals were of wild type and edema formation therefore could be avoided. One limitation of the axolotl as an animal model is, as mentioned, the difficulty in animal supply, especially when minimizing the variations in animals.
Another limitation in this study is the systemic effect of the STZ treatment causing edema formation in over half of the animals. It is not uncommon that STZ induces toxicity and mortality in animals[63], but it should be avoided, if possible. In rats, a STZ dose of 0.06 mg/g causes hyperglycemia, but a dose of 0.075 mg/g results in mortality[63]. This illustrates the narrow range of optimal STZ-induced diabetic response, which also was seen in the pilot studies where five STZ doses of 0.05 mg/g caused hyperglycemia, but five STZ doses of 0.1 mg/g caused mortality. Thus, I still believe the used STZ protocol in this study is the most optimal for axolotls, and the mortality of the animals must be limited by other factors, such as by housing them in isosmotic water, or by not using wild type animals.
As I was unable to induce diabetes in all animals, the regenerative capacity in the pancreas of the axolotl was not possible to investigate. Therefore, further studies will focus on fully establishing diabetes in the animals and thereafter investigate regeneration with a study design like this one, but with the beforementioned adjustments to minimize animal variations and edema formation.

Conclusions

This study aimed to investigate the axolotl as a novel animal model in diabetes research and to examine their potential regeneration of β cells.
For this, a method to induce diabetes in the axolotl was necessary, and a pilot study consisting of five groups receiving five different STZ treatments was conducted, showing that five consecutive STZ doses of 0.05 mg/g made the animals hyperglycemic at day 22, whereas five consecutive STZ doses of 0.1 mg/g or more resulted in edema formation and mortality. Thus, the most optimal method to induce hyperglycemia and, thus, diabetes in the animals was by five consecutive STZ doses of 0.05 mg/g.
Using this protocol, two groups were included in the main study – one receiving the STZ treatment, the other a sham treatment. The development of hyperglycemia was studied by subjecting the animals to glucose tolerance tests, assessing changes in blood glucose levels from day 22 to day 84 of the experiment. The blood glucose measurements showed that the STZ treatment resulted in severe hyperglycemia at day 22, but the animals regained glycemic control, and the blood glucose levels normalized by day 84. By histological examination of the pancreas, it showed that the STZ-treated animals had a reduced β cell mass at day 84, even though blood glucose levels were normalized. All evidence suggests that diabetes was induced in this group of STZ-treated animals (stz_d84).
With the established protocol, four groups were included to study the STZ-induced ablation of β cells and the potential regeneration of these. For this, STZ-treated and sham-treated animals were euthanized on two different days – day 22, as the previous study showed severe hyperglycemia at this point, and day 35, as blood glucose levels normalized between day 22 and day 42 in the previous study, indicating potential regeneration occurring at this point. However, neither the blood glucose measurements nor the histological examinations indicated diabetic disease, suggesting that the treatment did not have an effect on these animals, or that the great variation between the animals used in these groups (e.g., age and size) affected the measured parameters. Consequently, it was not possible to examine potential regeneration in this study, and a new study with animals from the same batch will be conducted in the future.
The systemic effects of the STZ treatment were investigated by measuring different blood and urine parameters. Over half of the STZ-treated animals experienced edema formation, resulting in a massive gain of body mass and a need for euthanasia in some animals. The edema-affected animals showed a reduced osmolarity and fraction of red blood cells in blood. Blood measurements had no indication of edema was caused by kidney or liver dysfunction, as blood creatinine and albumin levels were normal in STZ-treated animals, both with and without the swollen animals. Blood alkaline phosphatase activity was reduced in swollen animals, but this is more likely a result of the reduced hematocrit values. As for the urine parameters, it was not possible to separate the values of swollen animals from the rest of the STZ-treated animals, as the urinary bladder was punctured in many of the swollen animals. However, urine protein levels were higher in STZ-treated animals at day 22, but not significantly. Furthermore, urine glucose levels were measured, showing a higher excretion of glucose in one STZ-treated group (stz_d84). If this is caused by kidney dysfunction or the diabetic effect on these animals is difficult to determine.

Abbreviations

Abbreviation: Description:
ADP adenosine diphosphate
alb albino
ARX aristaless related homeobox
ATP adenosine triphosphate
BSA bovine serum albumin
CRISPR Clustered Regularly Interspaced Short Palindromic Repeats
DNA deoxyribonucleic acid
EDTA ethylenediaminetetraacetic acid
EdU 5-ethynyl-2’-deoxyuridine
ELISA Enzyme-linked immunosorbent assay
GATA4 GATA binding protein 4
GLUTs glucose transporters
h hour
i.p. intraperitoneal
i.v. intravenous
leu leucistic
Mafa v-maf musculoaponeurotic fibrosarcoma oncogene family, protein A (avian)
min minute
NADPH nicotinamide adenine dinucleotide phosphate
NGN3 neurogenin-3
NOD mice non-obese diabetic mice
PAX4 paired box 4
PBS phosphate-buffered saline
PDX1 pancreatic and duodenal homeobox 1
PFA paraformaldehyde
RT room temperature
SOX9 SRY(sex determining region Y)-box transcription factor 9
STZ streptozotocin
TMB 3,3',5,5'-Tetramethylbenzidine
wt wild type

Appendix A. Study Schedule

Month / year 9/21 10/21 11/21 12/21 1/22 2/22 3/22 4/22 5/22 6/22
PS1+2+3
 
PS4+5
 
Stz_d84
 
Sham_d84
 
Stz_22 + Sham_d22 +
Stz_d35 +Sham_d35
(Part 1)
Stz_22 + Sham_d22 +
Stz_d35 +Sham_d35
(Part 2)
The study schedule of the animal experiments conducted in this project. The grey boxes show when the animal experiments of the group were active. The STZ-treated and sham-treated animals euthanized on day 22 and 35 were split into two parts, as there was limited space in the fume hood, and since they were included to increase the sample size.

Appendix B. Body Mass of Experimental Animals

The body mass of every experimental animal used in the pilot study and the main study.
Preprints 67511 i001
Preprints 67511 i002

References

  1. Classification and Diagnosis of Diabetes: Standards of Medical Care in Diabetes—2018. Diabetes Care 2018, 41 (Supplement_1), S13–S27. [CrossRef]
  2. Holt, R.I.G.; et al. Textbook of diabetes. 2017.
  3. IDF Diabetes Atlas. 2021; Available from: https://diabetesatlas.org/atlas/tenth-edition/?dlmodal=active&dlsrc=https%3A%2F%2Fdiabetesatlas.org%2Fidfawp%2Fresource-files%2F2021%2F07%2FIDF_Atlas_10th_Edition_2021.pdf.
  4. Harjutsalo, V.; Sjöberg, L.; Tuomilehto, J. Time trends in the incidence of type 1 diabetes in Finnish children: a cohort study. Lancet 2008, 371, 1777–1782. [Google Scholar] [CrossRef]
  5. Taplin, C.E.; et al. The rising incidence of childhood type 1 diabetes in New South Wales, 1990–2002. Medical Journal of Australia 2005, 183, 243–246. [Google Scholar] [CrossRef]
  6. Diabetes i tal. 2020; Available from: https://videncenterfordiabetes.dk/viden-om-diabetes/generelt-om-diabetes/diabetes-i-tal.
  7. Akil, A.A.-S.; et al. Diagnosis and treatment of type 1 diabetes at the dawn of the personalized medicine era. Journal of Translational Medicine 2021, 19, 137. [Google Scholar] [CrossRef]
  8. Zhou, Q.; Melton, D.A. Pancreas regeneration. Nature 2018, 557, 351–358. [Google Scholar] [CrossRef] [PubMed]
  9. Vertex Provides Updates on Phase 1/2 Clinical Trial of VX-880 for the Treatment of Type 1 Diabetes. 2022, Vertex.
  10. Vertex Announces Positive Day 90 Data for the First Patient in the Phase 1/2 Clinical Trial Dosed With VX-880, a Novel Investigational Stem Cell-Derived Therapy for the Treatment of Type 1 Diabetes. 2021, Vertex.
  11. CRISPR Therapeutics and ViaCyte, Inc. Announce First Patient Dosed in Phase 1 Clinical Trial of Novel Gene-Edited Cell Replacement Therapy for Treatment of Type 1 Diabetes (T1D). 2022, ViaCyte.
  12. Butler, P.C.; Gale, E.A.M. Reversing type 1 diabetes with stem cell–derived islets: a step closer to the dream? Journal of Clinical Investigation 2022, 132. [Google Scholar] [CrossRef] [PubMed]
  13. Petersen, M.C.; Shulman, G.I. Mechanisms of Insulin Action and Insulin Resistance. Physiological Reviews 2018, 98, 2133–2223. [Google Scholar] [CrossRef] [PubMed]
  14. Sylow, L.; et al. The many actions of insulin in skeletal muscle, the paramount tissue determining glycemia. Cell Metabolism 2021, 33, 758–780. [Google Scholar] [CrossRef] [PubMed]
  15. Shanta, D.; Peter, M. Insulin signalling in islets. Biochemical Society Transactions 2008, 36, 290–293. [Google Scholar]
  16. Leibiger, B.; et al. Selective Insulin Signaling through A and B Insulin Receptors Regulates Transcription of Insulin and Glucokinase Genes in Pancreatic β Cells. Molecular Cell 2001, 7, 559–570. [Google Scholar] [CrossRef] [PubMed]
  17. Slack, J.M. Developmental biology of the pancreas. Development 1995, 121, 1569–1580. [Google Scholar] [CrossRef]
  18. Jennings, R.E.; et al. Human pancreas development. Development 2015, 142, 3126–3137. [Google Scholar] [CrossRef]
  19. Rukstalis, J.M.; Habener, J.F. Neurogenin3: A master regulator of pancreatic islet differentiation and regeneration. Islets 2009, 1, 177–184. [Google Scholar] [CrossRef]
  20. Matsuda, H. Zebrafish as a model for studying functional pancreatic β cells development and regeneration. Development, Growth & Differentiation 2018, 60, 393–399. [Google Scholar]
  21. Collombat, P.; et al. Opposing actions of Arx and Pax4 in endocrine pancreas development. Genes & Development 2003, 17, 2591–2603. [Google Scholar] [CrossRef] [PubMed]
  22. Collombat, P.; et al. The Ectopic Expression of Pax4 in the Mouse Pancreas Converts Progenitor Cells into α and Subsequently β Cells. Cell 2009, 138, 449–462. [Google Scholar] [CrossRef]
  23. Collombat, P.; et al. The simultaneous loss of Arx and Pax4 genes promotes a somatostatin-producing cell fate specification at the expense of the α-and β-cell lineages in the mouse endocrine pancreas. Development 2005, 132, 2969–2980. [Google Scholar] [CrossRef]
  24. Pearl, E.J.; et al. Xenopus pancreas development. Developmental Dynamics 2009, 238, 1271–1286. [Google Scholar] [CrossRef] [PubMed]
  25. Penhos, J.C.; Ramey, E. Studies on the Endocrine Pancreas of Amphibians and Reptiles. American Zoologist 1973, 13, 667–698. [Google Scholar] [CrossRef]
  26. Brenes-Soto, A.; Dierenfeld, E.S.; Janssens, G.P.J. The interplay between voluntary food intake, dietary carbohydrate-lipid ratio and nutrient metabolism in an amphibian, (Xenopus laevis). PLOS ONE 2018, 13, e0208445. [Google Scholar] [CrossRef]
  27. Verbrugghe, A.; et al. The glucose and insulin response to isoenergetic reduction of dietary energy sources in a true carnivore: the domestic cat (Felis catus). British Journal of Nutrition 2010, 104, 214–221. [Google Scholar] [CrossRef]
  28. Yang, B.; Covington, B.A.; Chen, W. In vivo generation and regeneration of β cells in zebrafish. Cell regeneration (London, England) 2020, 9, 9–9. [Google Scholar] [CrossRef]
  29. Chen, C.; et al. Human beta cell mass and function in diabetes: Recent advances in knowledge and technologies to understand disease pathogenesis. Molecular Metabolism 2017, 6, 943–957. [Google Scholar] [CrossRef]
  30. Klinke, D.J. Extent of Beta Cell Destruction Is Important but Insufficient to Predict the Onset of Type 1 Diabetes Mellitus. PLoS ONE 2008, 3, e1374. [Google Scholar] [CrossRef]
  31. Sreenan, S.; et al. Increased beta-cell proliferation and reduced mass before diabetes onset in the nonobese diabetic mouse. Diabetes 1999, 48, 989–996. [Google Scholar] [CrossRef]
  32. Song, I.; et al. Beta Cell Mass Restoration in Alloxan-Diabetic Mice Treated with EGF and Gastrin. PLOS ONE 2015, 10, e0140148. [Google Scholar] [CrossRef]
  33. Rahier, J.; et al. Pancreatic β-cell mass in European subjects with type 2 diabetes. Diabetes, Obesity and Metabolism 2008, 10, 32–42. [Google Scholar] [CrossRef] [PubMed]
  34. Saisho, Y.; et al. β-Cell Mass and Turnover in Humans. Diabetes Care 2013, 36, 111–117. [Google Scholar] [CrossRef] [PubMed]
  35. Mezza, T.; et al. Insulin resistance alters islet morphology in nondiabetic humans. Diabetes 2014, 63, 994–1007. [Google Scholar] [CrossRef] [PubMed]
  36. Camastra, S.; et al. Cell Function in Morbidly Obese Subjects During Free Living: Long-Term Effects of Weight Loss. Diabetes 2005, 54, 2382–2389. [Google Scholar] [CrossRef] [PubMed]
  37. Dhatariya, K.K.; et al. Diabetic ketoacidosis. Nature Reviews Disease Primers 2020, 6. [Google Scholar] [CrossRef] [PubMed]
  38. Frank, R.N. Diabetic Retinopathy. New England Journal of Medicine 2004, 350, 48–58. [Google Scholar] [CrossRef] [PubMed]
  39. Forbes, J.M.; Cooper, M.E. Mechanisms of Diabetic Complications. Physiological Reviews 2013, 93, 137–188. [Google Scholar] [CrossRef] [PubMed]
  40. Haffner, S.M.; et al. Mortality from Coronary Heart Disease in Subjects with Type 2 Diabetes and in Nondiabetic Subjects with and without Prior Myocardial Infarction. New England Journal of Medicine 1998, 339, 229–234. [Google Scholar] [CrossRef] [PubMed]
  41. Bonner-Weir, S.; et al. Compensatory Growth of Pancreatic β-Cells in Adult Rats After Short-Term Glucose Infusion. Diabetes 1989, 38, 49–53. [Google Scholar] [CrossRef]
  42. Montanya, E.; et al. Linear correlation between beta-cell mass and body weight throughout the lifespan in Lewis rats: role of beta-cell hyperplasia and hypertrophy. Diabetes 2000, 49, 1341–1346. [Google Scholar] [CrossRef]
  43. Parsons; J. A.; Brelje, T.C.; Sorenson, R.L. Adaptation of islets of Langerhans to pregnancy: increased islet cell proliferation and insulin secretion correlates with the onset of placental lactogen secretion. Endocrinology 1992, 130, 1459–1466. [Google Scholar] [CrossRef]
  44. Dor, Y.; et al. Adult pancreatic β-cells are formed by self-duplication rather than stem-cell differentiation. Nature 2004, 429, 41–46. [Google Scholar] [CrossRef]
  45. Moro, E.; et al. Analysis of beta cell proliferation dynamics in zebrafish. Developmental Biology 2009, 332, 299–308. [Google Scholar] [CrossRef] [PubMed]
  46. Bonner-Weir, S.; Sharma, A. Pancreatic stem cells. The Journal of Pathology 2002, 197, 519–526. [Google Scholar] [CrossRef] [PubMed]
  47. Aguayo-Mazzucato, C.; Bonner-Weir, S. Pancreatic β Cell Regeneration as a Possible Therapy for Diabetes. Cell Metabolism 2018, 27, 57–67. [Google Scholar] [CrossRef]
  48. Xu, X.; et al. β Cells Can Be Generated from Endogenous Progenitors in Injured Adult Mouse Pancreas. Cell 2008, 132, 197–207. [Google Scholar] [CrossRef]
  49. Zhang, M.; et al. Growth factors and medium hyperglycemia induce Sox9+ ductal cell differentiation into β cells in mice with reversal of diabetes. Proceedings of the National Academy of Sciences 2016, 113, 650–655. [Google Scholar] [CrossRef] [PubMed]
  50. Kopp, J.L.; et al. Sox9+ ductal cells are multipotent progenitors throughout development but do not produce new endocrine cells in the normal or injured adult pancreas. Development 2011, 138, 653–665. [Google Scholar] [CrossRef] [PubMed]
  51. Solar, M.; et al. Pancreatic Exocrine Duct Cells Give Rise to Insulin-Producing β Cells during Embryogenesis but Not after Birth. Developmental Cell 2009, 17, 849–860. [Google Scholar] [CrossRef] [PubMed]
  52. Kopinke, D. and L.C. Murtaugh, Exocrine-to-endocrine differentiation is detectable only prior to birth in the uninjured mouse pancreas. BMC Developmental Biology 2010, 10, 38. [Google Scholar] [CrossRef] [PubMed]
  53. Desai, B.M.; et al. Preexisting pancreatic acinar cells contribute to acinar cell, but not islet β cell, regeneration. Journal of Clinical Investigation 2007, 117, 971–977. [Google Scholar] [CrossRef] [PubMed]
  54. Delaspre, F.; et al. Centroacinar Cells Are Progenitors That Contribute to Endocrine Pancreas Regeneration. Diabetes 2015, 64, 3499–3509. [Google Scholar] [CrossRef] [PubMed]
  55. Xiao, X.; et al. Endogenous Reprogramming of Alpha Cells into Beta Cells, Induced by Viral Gene Therapy, Reverses Autoimmune Diabetes. Cell Stem Cell 2018, 22, 78–90.e4. [Google Scholar] [CrossRef]
  56. Thorel, F.; et al. Conversion of adult pancreatic α-cells to β-cells after extreme β-cell loss. Nature 2010, 464, 1149–1154. [Google Scholar] [CrossRef]
  57. Chera, S.; et al. Diabetes recovery by age-dependent conversion of pancreatic δ-cells into insulin producers. Nature 2014, 514, 503–507. [Google Scholar] [CrossRef]
  58. Ye, L.; et al. glucagon is essential for alpha cell transdifferentiation and beta cell neogenesis. Development 2015, 142, 1407–1417. [Google Scholar] [CrossRef] [PubMed]
  59. Lu, J. Transdifferentiation of pancreatic α-cells into insulin-secreting cells: From experimental models to underlying mechanisms. World Journal of Diabetes 2014, 5, 847. [Google Scholar] [CrossRef] [PubMed]
  60. Yang, Y.-P.; et al. Context-specific α-to-β-cell reprogramming by forced Pdx1 expression. Genes & Development 2011, 25, 1680–1685. [Google Scholar] [CrossRef] [PubMed]
  61. Wilcox, C.L.; et al. Pancreatic α-Cell Specific Deletion of Mouse Arx Leads to α-Cell Identity Loss. PLoS ONE 2013, 8, e66214. [Google Scholar] [CrossRef] [PubMed]
  62. King, A.J. The use of animal models in diabetes research. British Journal of Pharmacology 2012, 166, 877–894. [Google Scholar] [CrossRef]
  63. Goyal, S.N.; et al. Challenges and issues with streptozotocin-induced diabetes – A clinically relevant animal model to understand the diabetes pathogenesis and evaluate therapeutics. Chemico-Biological Interactions 2016, 244, 49–63. [Google Scholar] [CrossRef]
  64. Kume, E.; et al. Hepatic changes in the acute phase of streptozotocin (SZ)-induced diabetes in mice. Experimental and Toxicologic Pathology 2004, 55, 467–480. [Google Scholar] [CrossRef] [PubMed]
  65. Laguens, R.; et al. Streptozotocin-Induced Liver Damage in Mice. Hormone and Metabolic Research 1980, 12, 197–201. [Google Scholar] [CrossRef]
  66. Tay, Y.-C.; et al. Can murine diabetic nephropathy be separated from superimposed acute renal failure? Kidney International 2005, 68, 391–398. [Google Scholar] [CrossRef]
  67. Palm, F.; et al. Differentiating between effects of streptozotocinper seand subsequent hyperglycemia on renal function and metabolism in the streptozotocin-diabetic rat model. Diabetes/Metabolism Research and Reviews 2004, 20, 452–459. [Google Scholar] [CrossRef]
  68. Wold, L.E.; Ren, J. Streptozotocin directly impairs cardiac contractile function in isolated ventricular myocytes via a p38 map kinase-dependent oxidative stress mechanism. Biochemical and Biophysical Research Communications 2004, 318, 1066–1071. [Google Scholar] [CrossRef]
  69. Muller, Y.D.; et al. Immunosuppressive Effects of Streptozotocin-Induced Diabetes Result in Absolute Lymphopenia and a Relative Increase of T Regulatory Cells. Diabetes 2011, 60, 2331–2340. [Google Scholar] [CrossRef] [PubMed]
  70. Bonner-Weir, S.; Trent, D.F.; Weir, G.C. Partial pancreatectomy in the rat and subsequent defect in glucose-induced insulin release. Journal of Clinical Investigation 1983, 71, 1544–1553. [Google Scholar] [CrossRef]
  71. Watanabe, H.; et al. Aging is associated with decreased pancreatic acinar cell regeneration and phosphatidylinositol 3-kinase/Akt activation. Gastroenterology 2005, 128, 1391–1404. [Google Scholar] [CrossRef]
  72. Rankin, M.M.; Kushner, J.A. Adaptive Beta-Cell Proliferation Is Severely Restricted With Advanced Age. Diabetes 2009, 58, 1365–1372. [Google Scholar] [CrossRef] [PubMed]
  73. Moss, J.B.; et al. Regeneration of the Pancreas in Adult Zebrafish. Diabetes 2009, 58, 1844–1851. [Google Scholar] [CrossRef]
  74. Pisharath, H.; et al. Targeted ablation of beta cells in the embryonic zebrafish pancreas using E. coli nitroreductase. Mechanisms of Development 2007, 124, 218–229. [Google Scholar] [CrossRef]
  75. Singleman, C.; Holtzman, N.G. Growth and Maturation in the Zebrafish, Danio Rerio: A Staging Tool for Teaching and Research. Zebrafish 2014, 11, 396–406. [Google Scholar] [CrossRef] [PubMed]
  76. Benchoula, K.; et al. Optimization of Hyperglycemic Induction in Zebrafish and Evaluation of Its Blood Glucose Level and Metabolite Fingerprint Treated with Psychotria malayana Jack Leaf Extract. Molecules 2019, 24, 1506. [Google Scholar] [CrossRef]
  77. Schloissnig, S.; et al. The giant axolotl genome uncovers the evolution, scaling, and transcriptional control of complex gene loci. Proceedings of the National Academy of Sciences 2021, 118, e2017176118. [Google Scholar] [CrossRef]
  78. McCusker, C.; Gardiner, D.M. The Axolotl Model for Regeneration and Aging Research: A Mini-Review. Gerontology 2011, 57, 565–571. [Google Scholar] [CrossRef] [PubMed]
  79. McCusker, C.; Bryant, S.V.; Gardiner, D.M. The axolotl limb blastema: cellular and molecular mechanisms driving blastema formation and limb regeneration in tetrapods. Regeneration 2015, 2, 54–71. [Google Scholar] [CrossRef]
  80. Gardiner, D.M. Regenerative engineering and developmental biology : principles and applications. CRC Press Series In Regenerative Engineering. 2018, Boca Raton, Florida ;: CRC Press.
  81. Thygesen, M.; et al. A clinically relevant blunt spinal cord injury model in the regeneration competent axolotl (Ambystoma mexicanum) tail. Experimental and Therapeutic Medicine 2019, 17, 2322–2328. [Google Scholar] [CrossRef]
  82. Dittrich, A.; Lauridsen, H. Cryo-injury Induced Heart Regeneration in the Axolotl and Echocardiography and Unbiased Quantitative Histology to Evaluate Regenerative Progression. Journal of Visualized Experiments 2021, 171, e61966. [Google Scholar] [CrossRef]
  83. Jensen, T.B.; et al. Lung injury in axolotl salamanders induces an organ-wide proliferation response. Dev Dyn 2021, 250, 866–879. [Google Scholar] [CrossRef]
  84. Nowoshilow, S.; Tanaka, E.M. Introducing www.axolotl-omics.org – an integrated -omics data portal for the axolotl research community. Experimental Cell Research 2020, 394, 112143. [Google Scholar] [CrossRef]
  85. Whited, J.L.; Lehoczky, J.A.; Tabin, C.J. Inducible genetic system for the axolotl. Proceedings of the National Academy of Sciences 2012, 109, 13662–13667. [Google Scholar] [CrossRef]
  86. Tilley, L.; et al. The use of transgenics in the laboratory axolotl. Developmental Dynamics 2021, 251, 942–956. [Google Scholar] [CrossRef]
  87. Sobkow, L.; et al. A germline GFP transgenic axolotl and its use to track cell fate: dual origin of the fin mesenchyme during development and the fate of blood cells during regeneration. Dev Biol 2006, 290, 386–397. [Google Scholar] [CrossRef]
  88. Denis, J.-F.; et al. Axolotl as a Model to Study Scarless Wound Healing in Vertebrates: Role of the Transforming Growth Factor Beta Signaling Pathway. Advances in Wound Care 2013, 2, 250–260. [Google Scholar] [CrossRef]
  89. Monaghan, J.R.; et al. Experimentally induced metamorphosis in axolotls reduces regenerative rate and fidelity. Regeneration 2014, 1, 2–14. [Google Scholar] [CrossRef] [PubMed]
  90. Intine, R.V.; Olsen, A.S.; Sarras, M.P. A Zebrafish Model of Diabetes Mellitus and Metabolic Memory. Journal of Visualized Experiments 2013, 72, e50232. [Google Scholar] [CrossRef]
  91. Sørensen, P.L. Effect of streptozotocin in the axolotl (Ambystoma mexicanum): A pilot study. 2021.
  92. Serino, R.; et al. Upregulation of hypothalamic nitric oxide synthase gene expression in streptozotocin-induced diabetic rats. Diabetologia 1998, 41, 640–648. [Google Scholar] [CrossRef]
  93. Mertens, J.; et al. Hepatopathy Associated With Type 1 Diabetes: Distinguishing Non-alcoholic Fatty Liver Disease From Glycogenic Hepatopathy. Frontiers in Pharmacology 2021, 12, 768576. [Google Scholar] [CrossRef] [PubMed]
  94. Monobe, K.; et al. Clinical and genetic determinants of urinary glucose excretion in patients with diabetes mellitus. Journal of Diabetes Investigation 2021, 12, 728–737. [Google Scholar] [CrossRef]
  95. Allmdal, T. Diabetisk ketoacidose. 2021 [cited 2021 07/06]; Available from: https://www.sundhed.dk/borger/patienthaandbogen/hormoner-og-stofskifte/sygdomme/diabetes-type-1-hvad-er-det/diabetisk-ketoacidose/.
  96. Sharma, U.; Pal, D.; Prasad, R. Alkaline Phosphatase: An Overview. Indian Journal of Clinical Biochemistry 2014, 29, 269–278. [Google Scholar] [CrossRef]
  97. Hillyard, S.; et al. Osmotic and Ion Regulation in Amphibians. 2008, p. 367-441.
  98. Howland, R.B. Experiments on the effect of removal of the pronephros of Amblystoma punctatum. Journal of Experimental Zoology 1921, 32, 355–396. [Google Scholar] [CrossRef]
  99. Toews, D.P.; Wentzell, L.A. The Role of the Lymphatic System for Water Balance and Acid-Base Regulation in the Amphibia. 1995, Springer Berlin Heidelberg. p. 201-214.
  100. Sullivan, M.A.; Forbes, J.M. Glucose and glycogen in the diabetic kidney: Heroes or villains? EBioMedicine 2019, 47, 590–597. [Google Scholar] [CrossRef]
  101. Olsen, A.S.; Sarras, M.P.; Intine, R.V. Limb regeneration is impaired in an adult zebrafish model of diabetes mellitus. Wound Repair and Regeneration 2010, 18, 532–542. [Google Scholar] [CrossRef]
Figure 1. Increased circulating glucose after a meal enters β cells and enters the metabolic pathways. Through glycolysis and mitochondrial oxidation, the intracellular ATP/ADP (adenosine diphosphate) ratio increases and triggers the closing of ATP-sensitive potassium channels. This depolarizes the plasma membrane and opens voltage-sensitive calcium channels. The influx of calcium triggers exocytosis of insulin, which now can enter circulation and have its effect on target tissue such as liver, muscle, and adipose tissue. Elements of the figure are from BioRender.com.
Preprints 67511 g001
Figure 2. Study design of the five pilot studies (PS1-5) investigated in this thesis and a previous pilot study in axolotls performed in our group. Syringes indicate the time of STZ injection over a period of 22 days. Elements of the figure are from BioRender.com.
Preprints 67511 g002
Figure 3. Schematic illustration of the study design of part III. Elements of the figure are from BioRender.com.
Preprints 67511 g003
Figure 4. Collection of the blood, heart, liver, and kidneys. The incisions are marked with a striped line. A) Blood is collected with a syringe from the gill (G) artery vessel. B) The heart of the axolotl with the outflow tract (OT), ventricle (V), atria (A), and sinus venosus (SV). C) The liver with the right lobe (RL) and left lobe (LL). D) The axolotl kidneys.
Preprints 67511 g004
Figure 6. Serial cryosectioning of pancreatic tissue. The pancreas was sectioned for five different staining methods – hematoxylin, insulin/TUNEL stain, EdU stain, and two extra slides, in case of other stains were needed. Tissue was sectioned and distributed on the slides as numbered. A 7 µm section was placed on one slide, and the next 7 µm section was discarded before placing the next 7 µm section on the next slide, creating a series of neighboring sections with 7 µm between each. 2-3 slides were prepared for each staining method.
Preprints 67511 g006
Figure 9. Blood glucose levels in Ins_baseline and PS_control. Plotted data show mean group values ± SD. Blood glucose levels were measured 0h, 10 min, 4h 40 min, 9h 20 min, 14h, and 24h after glucose injection in PS_control to show glucose consumption in healthy animals. To examine the relationship between glucose and insulin, blood was collected in larger quantities (30-40 µL) for 0h, 14h, and 24h after glucose injection in Ins_baseline. Blood collection in this quantity did not cause mortality or decreased glucose consumption significantly when comparing fasting blood glucose levels and blood glucose levels 24h after glucose injection (p=0.12).
Preprints 67511 g009
Figure 10. Blood glucose levels in the glucose tolerance test at day 10 and day 22 of the experiment in the pilot study. Plotted data show mean group values ± SD. An asterisk (*) indicates significant differences between a group compared to PS_control determined with a Student’s T-test (*p=0.05). A) PS1 and PS3 was subjected to the glucose tolerance test at day 10 and compared to PS_control. B) PS1, PS2, and PS3 was subjected to the glucose tolerance test and compared to PS_control.
Preprints 67511 g010
Figure 14. Blood ketone levels was measured over a period from day 22 to day 84 in stz_d84 and sham_d84. Plotted data show mean group values ± SD. An octothorpe (#) indicates significant differences between the blood ketone levels of stz_d84 or sham_d84 measured at different days determined with an ANOVA test (#p=0.05). An asterisk (*) indicates significant differences determined with a Student’s T-test (*p=0.05). A) Blood ketone levels of stz_d84 at day 22, 32, 42, 52, 72, and 84. The blood ketone levels decreased significantly from day 22 to day 84. B) Blood ketone levels of stz_d84 (black) and sham_d84 (grey) on day 22, 42, 72, and 84. Blood ketone levels were significantly higher at day 22 in stz_d84 compared to sham_d84.
Preprints 67511 g014
Figure 16. Blood ketone levels of the STZ-treated and sham-treated groups at the endpoint. Plotted data show mean group values ± SD. An octothorpe (#) indicates significant differences between the blood ketone levels of either STZ-treated or sham-treated groups determined with an ANOVA test and a pairwise T-Test(#p=0.05). There was no difference between the STZ-treated and sham-treated groups at day 22, 35, or 84, respectively, but both stz_d84 and sham_d84 displayed lower blood ketone levels when comparing the STZ-treated groups and sham-treated groups separately.
Preprints 67511 g016
Figure 18. Percentage of proliferating cells in the pancreas of stz_d35 and sham_d35. For each animal, four pancreas sections were EdU-stained, and the percentage of EdU-positive cells was calculated, and the mean for all section was used as the value for the animal. Plotted data show mean group values ± SD (p=0.05). There was no significant difference between the groups.
Preprints 67511 g018
Figure 21. The effect of STZ on the fraction of red blood cells and osmolarity in blood. Plotted data show mean group values ± SD. An asterisk (*) indicates significant differences determined with a Student’s T-test (*p=0.05). A) The fraction of red blood cells in blood did not differ between the STZ-treated and sham-treated groups. B) The fraction of red blood cells was significantly lower in STZ-treated animals affected by edema compared to all sham-treated animals. C) The osmolarity was measured in STZ-treated animals affected by edema, and they were hypoosmolar when comparing to the blood osmolarity measured in healthy axolotls (control).
Preprints 67511 g021
Figure 22. Albumin, creatinine, and alkaline phosphatase activity in the blood of STZ-treated and sham-treated groups. Plotted data show mean group values ± SD. An asterisk (*) indicates significant differences determined with a Student’s T-test (*p=0.05). A) Albumin levels (A), creatinine levels (C), and alkaline phosphatase activity (E) were measured in the STZ-treated groups and compared to the sham-treated groups. There was no difference between the groups. STZ-treated animals affected by edema did not differ from sham-treated animals in blood albumin levels (B) or blood creatinine levels (E), but they had lower alkaline phosphatase activity (D), which could be caused by the lowered fraction of red blood cells in the blood of these animals.
Preprints 67511 g022
Figure 24. Urine protein levels in all the groups. Plotted data show mean group values ± SD. An octothorpe (#) indicates significant differences between either STZ-treated (black) or sham-treated (grey) groups determined with an ANOVA test (#p=0.05). Comparison of the STZ-treated group to the respective sham-treated group for each day showed no statistically significant difference in urine protein levels, even though stz_d22 showed higher urine protein levels than sham_d22. A one factor ANOVA test showed a significant difference between stz_d22 and stz_d35 and stz_d84.
Preprints 67511 g024
Table 1. Key physiological similarities and differences between humans, mice, zebrafish, and amphibians.
Adult humans Mice Zebrafish Amphibian
β cells are the predominant endocrine cell type in the pancreas Yes Yes Yes Yes
β cells mass necessary for normal function >40-60% >10-30% Near
total*
?
Loss of substantial β cells mass results in hyperglycemia Yes Yes Yes Yes
Capable of substantial regeneration of pancreatic tissue No Limited Yes Yes
Glucose transporter 2 is the primary glucose transporter in β cells No Yes Yes Unknown
Primary diet Omnivore Herbivore Omnivore Carnivore
*Near-total ablation of β cells is necessary to induce diabetes in zebrafish[28], but the exact percentage of necessary β cell mass is not known.
Disclaimer/Publisher’s Note: The statements, opinions and data contained in all publications are solely those of the individual author(s) and contributor(s) and not of MDPI and/or the editor(s). MDPI and/or the editor(s) disclaim responsibility for any injury to people or property resulting from any ideas, methods, instructions or products referred to in the content.
Copyright: This open access article is published under a Creative Commons CC BY 4.0 license, which permit the free download, distribution, and reuse, provided that the author and preprint are cited in any reuse.
Prerpints.org logo

Preprints.org is a free preprint server supported by MDPI in Basel, Switzerland.

Subscribe

© 2024 MDPI (Basel, Switzerland) unless otherwise stated