1. Introduction
With the purpose of ensuring performance, avoiding data leakage and legal liabilities, as well as promoting the safety and development of their employees, organizations are increasingly adopting strategies such as electronic monitoring of computers and employees [
1]. Electronic performance monitoring (EPM) refers to the use of technological means to observe, record, and analyze information related directly or indirectly to work performance.
Two major challenges faced by organizations that monitoring tools can assist in detecting are: data leakage and hate speech. Hate speech has become a significant social and psychological problem in society, with prejudices and negative peculiarities of each individual exposed and shared in several inappropriate networks and environments [
2].
One case that reflects how important it is to monitor hate speech in organizations is a lawsuit that Tesla lost and had to pay
$137 million to a former employee who was a victim of racist hate speech [
3]. The employee claimed to have witnessed racist and derogatory attitudes towards him several times during working hours by other employees. The incidents had an emotional and psychological impact on the former employee, who claimed to have suffered disturbances due to the assaults. The San Francisco court in charge of the case ruled that Tesla should pay
$7 million for the emotional damages and
$130 million as punishment. The American court says that the company neglected the case internally by not monitoring its employees and letting attitudes like these happen, and also categorized the work environment as racially hostile.
In recent years, one of the main social and psychological problems has become more and more expressive in the technological and virtual society that humanity has become. This problem is hate speech, which is reaching increasingly larger scales in such a globalized world, where prejudices and negative peculiarities of each individual are being verbalized and shared in several inappropriate networks and environments [
2].
In this way, it is evident that organizations need to take measures to monitor their workplace and, if there are problems, take proactive measures to protect their employees from hateful and/or intolerant conduct. Another important and worrying point currently in the business environment is the leakage of private data, several scandals and problems involving this issue have arisen since the beginning of the internet. IBM Security released the result of a survey on the cost of a data breach, which indicates that in 2022 the average cost of a breach was
$4.35 million [
4].
It also reveals that 83% of the companies surveyed had suffered more than one data breach, and only 17% reported that this was the first occurrence, and furthermore, 60% of the companies surveyed said they had increased the price of services or products due to the data breach. In this type of breach, just one exploited vulnerability can lead to millions in damages, not only due to the initial disruption but also leading to loss of consumer respect and potential compliance liabilities. In this regard, the report highlights that new approaches are needed to mitigate the impact of data breaches, especially in the face of a growing number of sophisticated attacks that cannot always be prevented.
Based on the challenges cited, this work proposes the monitoring of computers in corporate environments by applying techniques used in Spyware (a type of Malware that has the objective of spying on the victim) to monitor in a transparent and private way the behavior of employees. The proposed solution aims to implement an application that centralizes monitoring, such as Keylogger’s, Sniffer’s, and Scanner’s, having also, a prediction model responsible for classifying hate speech.
The following resources are foreseen in the solution: a) capture of the keys pressed by the user; b) capture of screenshots of the user’s screen; c) monitoring of processes (that are in some blacklist); d) monitoring of internet traffic; e) verification of vulnerabilities in computer ports; and, f) prediction models that warn of hate speech in typed phrases. Therefore, by applying the mentioned technologies in a microservices-based architecture, it is possible to make available an efficient and performant solution that will provide the necessary subsidies for the organizations to take the necessary measures.
The article is organized as follows: In
Section 2 the technologies and tools that were employed in the solution are presented, in
Section 3 the architecture of the solution is described, as well as brings details of the integration of its components.
Section 4 focuses on implementation aspects, such as the Spyware techniques and the applied prediction models. The related works are in
Section 5, and finally,
Section 6 describes the final considerations, presenting the preliminary’s results and future works.
2. Technologies & Tools
In this section we explore the tools and technologies that are employed in the proposed solution, bringing conceptual aspects, characteristics, and how they are integrated with the architecture aiming to achieve the proposed objectives.
2.1. SpringBoot Framework
SpringBoot is a Framework made for Java and Kotlin that aims to bring a platform for building web applications in a simple, efficient, performant and secure way [
5]. These points are achieved through the various modules present in the Framework, the main ones are the Starters, which seek to gather the necessary dependencies for specific areas of web development.
Among the main Starters is Spring Initializr, which facilitates all the initial configuration of the project, making the initialization of the server, database connection, creation of data sources, and application deployment automatic. However, even though all this configuration comes standard, you can still customize it to meet your demands. Another important module is Spring Security, which plays the role of maintaining security through password encryption strategies, authentication, authorization, JWT Token, and others [
6].
Other Framework packages that should be highlighted:
Autoconfigure: is responsible for reading the content contained in the project’s classpath and performs the necessary configurations so that the application works in an opinionated way;
Devtools: a set of functionalities that help the developer’s work, such as, for example, automatic restart of the application when some change in the code occurs;
Actuator: module responsible for monitoring the project and managing the deployed applications;
Starter Web: Helps build web applications by bringing already available for use, Spring MVC, Rest, and Tomcat as servers;
Starter Data JPA: It facilitates the construction of the persistence layer, helping in the abstraction of the database.
With the proper use of these modules and tools, SpringBoot turns out to be very practical and performs for the development of Web applications, from monoliths (even though this is not the goal) to encapsulated and well-defined microservices. In this paper, the use of SpringBoot aims to encapsulate and divide the responsibilities of the final solution. To this end, the main modules were used to ensure data security, reliability, and persistence, as well as good performance and guaranteed delivery of alerts.
2.2. Scikit-learn
Scikit-learn or Sklearn is a Framework for Python created specifically for applying Machine Learning techniques and tools. It contains features for predictive data analysis, is open source, and is built on top of the NumPy, SciPy, and Matplotlib packages, which are often applied for artificial intelligence [
7].
This library is organized with several modules [
8]:
Preprocessing: this is probably the most laborious step in the development of a machine-learning model. NumPy and Pandas are widely used in this step, but there are also functions for this purpose in sklearn, designed especially for processing data that will feed machine learning algorithms.
Classification: a stage that develops element categorizations by analyzing specific characteristics. It is possible to identify, for example, whether a person has a certain disease or not, or even which disease a person may have among several possible ones, among many other possibilities.
Regression: responsible for developing models that can assign a continuous value to an element. To predict the height of a person, the number of sales of a product, and the price of a property, for example.
Clustering: the creation of models for the automatic detection of groups with similar characteristics in their members. For example, it is possible to identify groups at risk of a certain disease or to verify patterns among residents of a city.
Dimensionality reduction: reducing the number of variables in a problem. With this reduction, it is possible to considerably reduce the number of calculations required in a model, increasing efficiency, with a minimum loss of assertiveness.
Parameter Tuning: compare, validate and choose parameters and models, in an automated way. Compare different parameters in the adjustment of a model, thus finding the best configuration for the application in question.
Through all these resources it is possible to create prediction models used for real applications, among them we can mention Logistic Regression, Multinomial Naive Bayes, and Support Vector Machine (SVM). These models will be treated next. Besides these models, the convolutional neural network (CNN) [
9], especially for computer vision [
10], long short-term memory (LSTM) [
11], ensemble learning methods [
12], and interpretive models are increasingly popular [
13].
The use of neural network-based techniques for classification [
14], prediction [
15] and optimization [
16] is growing. This makes it a challenge to determine which model is the most suitable to be used [
17]. For this reason, this paper presents a comparison between the Logistic Regression, Multinomial Naive Bayes, and SVM models.
2.2.1. Logistic Regression
Logistic regression is a statistical model used to determine the probability of an event occurring. It shows the relationship between features and then calculates the probability of a given outcome.
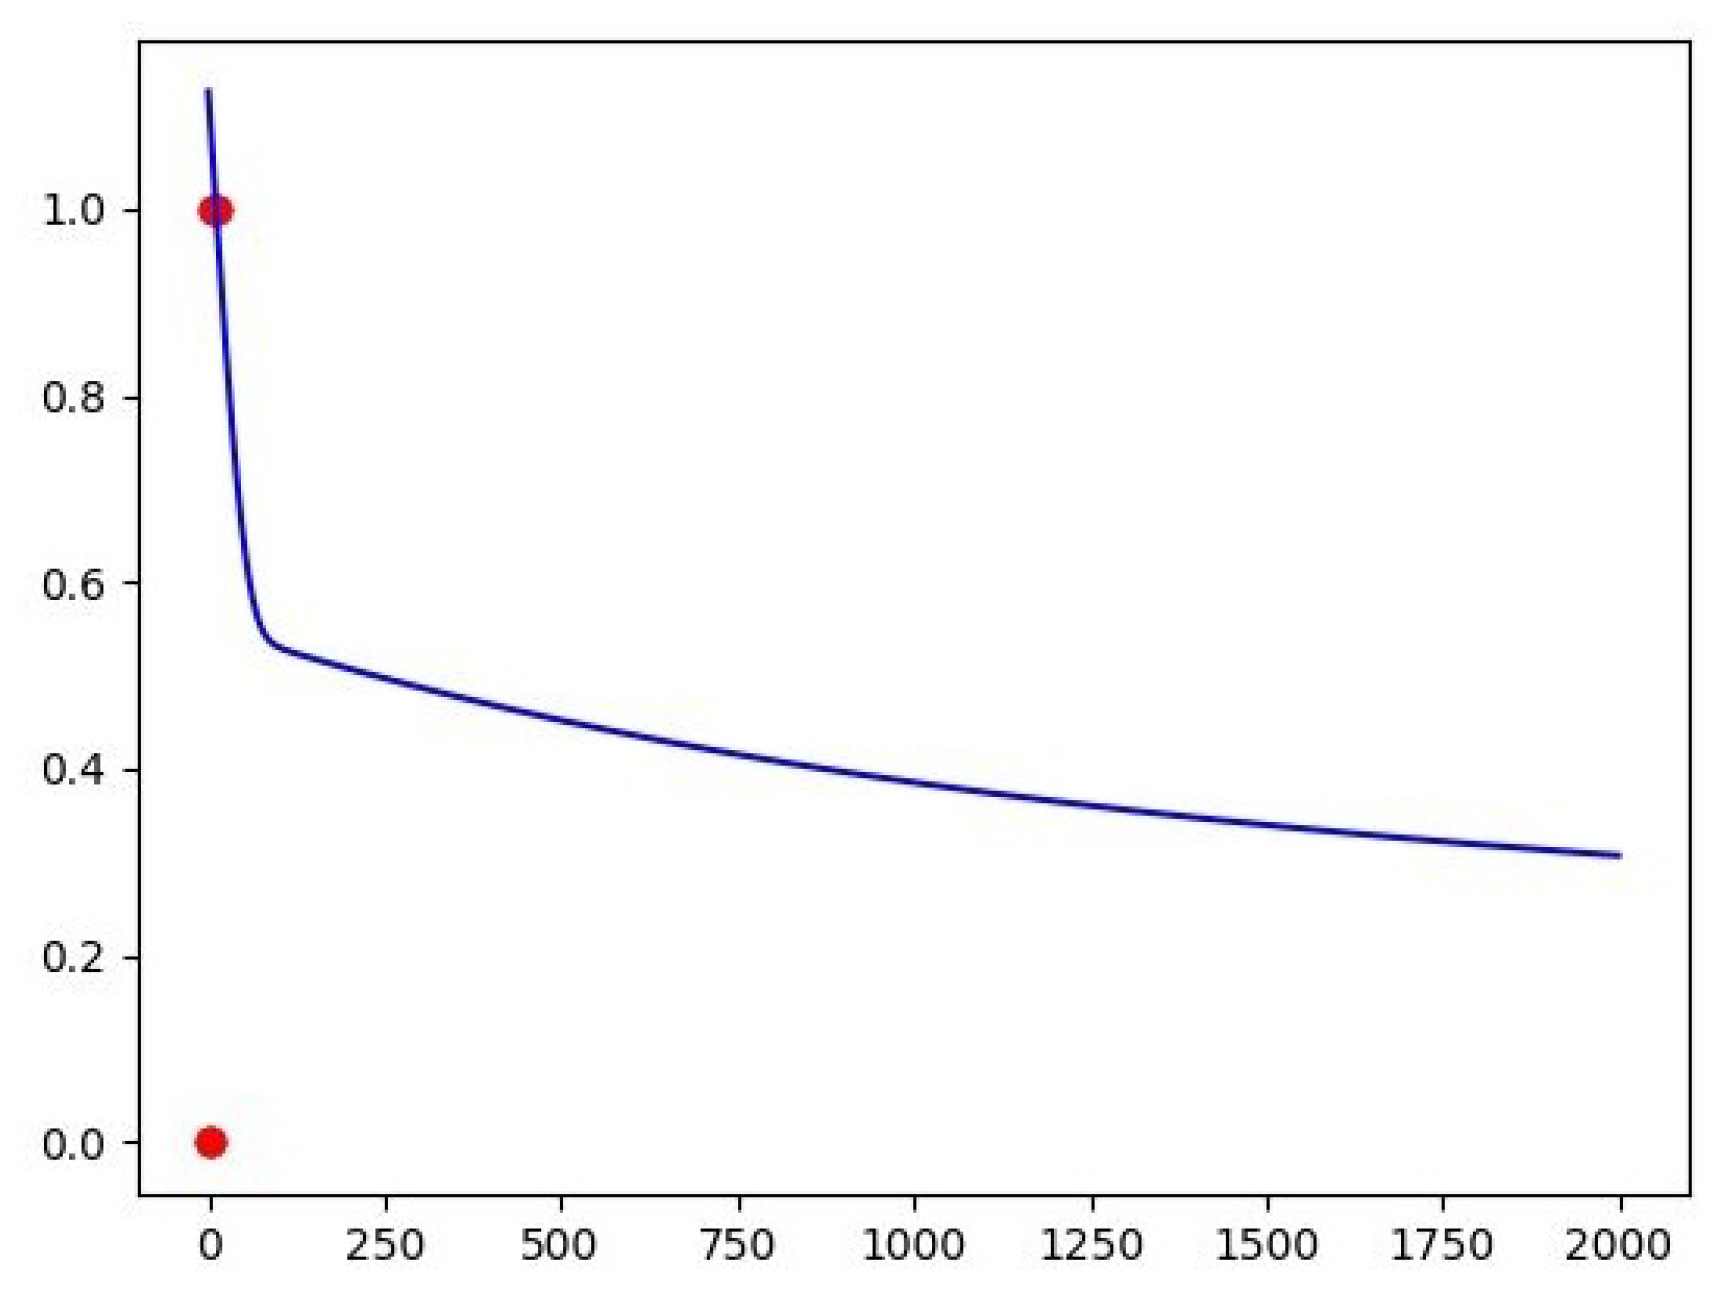
Figure 1 can be analyzed as an example of a graph resulting from a Logistic Regression where you can see a regression of the error on the Y-axis overtime on the X-axis [
18].
Logistic regression is used in areas such as the following:
In finance, it can detect the risk groups for the provision of credit;
In insurance, it can find customers who are sensitive to a certain insurance policy in relation to a given risk;
In medicine, it allows you to determine the group characteristics of sick individuals relative to healthy individuals.
Logistic regression looks at binomially distributed parameters in the following way, where the numbers of Bernoulli trials are known and the probabilities of success pi are unknown. An example of this distribution is the percentage of patients () who are cured of a drug after are treated with it.
The model is then obtained on the basis that the value of
i and the set of independent variables can inform the final probability. These explanatory variables can be regarded as a
k-dimensional vector
and the model then takes the form [
18]:
2.2.2. Multinomial Naive Bayes
The "Naive Bayes" algorithm is a probabilistic classifier based on "Bayes’ Theorem", which was created by Thomas Bayes (1701 - 1761) to try to prove the existence of God. Today, the algorithm has become popular for categorizing texts based on the frequency of the words used. The main characteristic of the algorithm, and also the reason it gets "naive" in its name, is that it completely disregards the correlation between the variables (features) [
19]. Bayes’ theorem is a corollary of the law of total probability, expressed mathematically in the form of the following equation:
where
A and
B are events and
is non-zero [
20].
2.2.3. Support Vector Machine (SVM)
An SVM’s role is to find a line (hyperplane) that separates the data from two distinct classes. This line seeks to maximize the distance between the closest points with respect to each of the classes. The distance between the hyperplane and the first point of each class is usually called the margin. SVM first tries to classify the classes correctly and then depending on this constraint defines the distance between the edges [
21].
2.3. Spyware
A Spyware, or spy program, is software that specializes in capturing information through some invasive script. This type of computer program is normally used as malware to obtain information such as passwords and private user data [
22]. In the context of this work, this software will not have this objective, since no user login data or access data will be obtained. This work employed some techniques embedded in Spyware’s, including KeyLogger, ScreenLogger, ProcessLogger, Sniffer and Scanner. These concepts will be discussed in more depth below.
2.3.1. KeyLogger, ScreenLogger, and ProcessLogger
These three techniques are used to capture information from computers, taking into account some trigger. KeyLogger is the term used for programs that record the keys pressed by the user, which can then be sent to an external API or to another user. The ScreenLogger’s aim is to capture screenshots of the user’s screen and other information, such as the position of the mouse cursor [
23]. And the ProcessLogger’s are used precisely to block unknown processes or in some known BlackList, to decrease the chance of Malware causing software or hardware damage to the machine in question [
24].
2.3.2. Sniffer
Sniffer is software that allows the user to monitor Internet traffic, capturing all packets entering and leaving a computer. Sniffing can be used both for malicious purposes and for network management, monitoring, and diagnosis of computer environments, which will be applied in the present work [
25].
2.3.3. Scanner
A Scanner is a software used to find vulnerabilities in systems in general. They can scan your network and websites for thousands of different security risks describing the vulnerabilities and providing steps on how to fix them [
26]. In the Spyware in question, a Port Scanner was used.
3. Solution Architecture
The architecture of the solution is based on a microservices model with several separate applications communicating through API gateways, with a security layer applying the JWT Token method for authentication. The solution also employs String Security features, with login and password encryption, in order to ensure both authentication and authorization of certain enpoints.
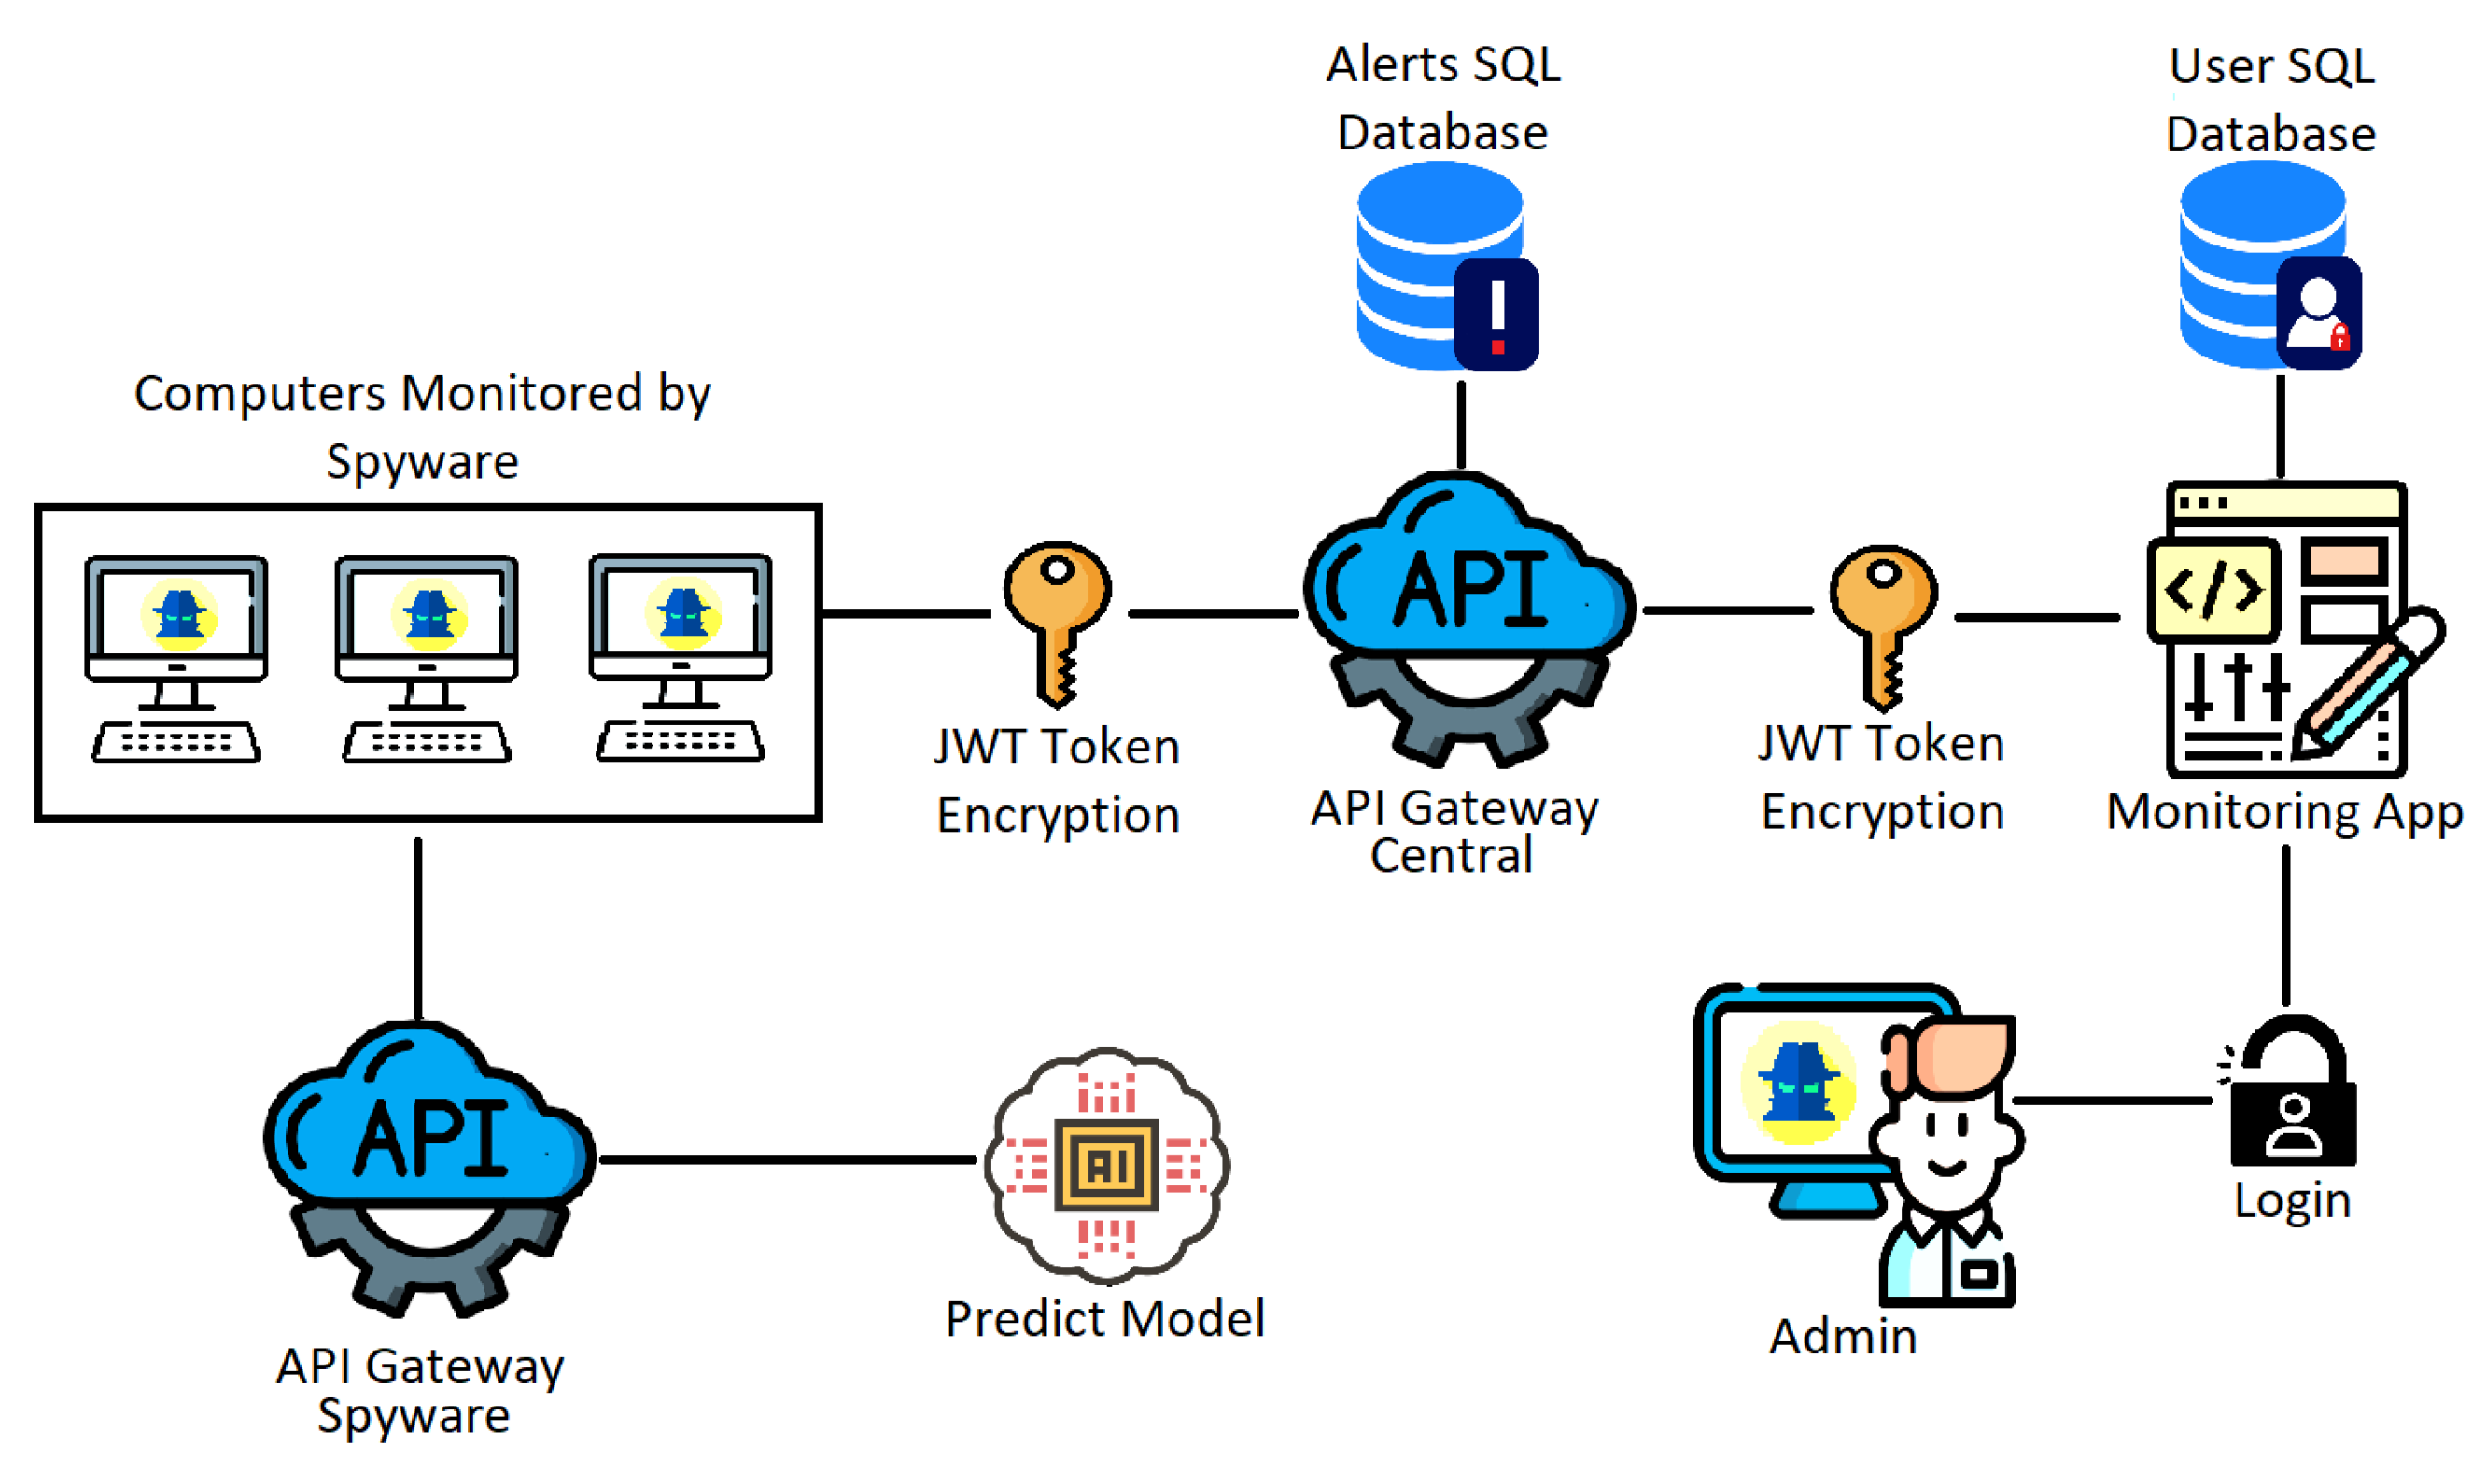
Figure 2 presents the proposed architecture with its components and interactions, which will be detailed below.
As can be seen in
Figure 2, the architecture has a central API Gateway that will communicate between the computers that will be monitored with Spyware and the Front-End application. This API Gateway will have endpoints to generate alerts, save images from the ScreenLogger, login, register new users and update the alert generation data, all with JWT Token authorization. This application will be connected to an SQL database to store this information.
The Front-End application has a connection to the API Gateway via HTTP requests, presenting the information in pages for viewing and managing the data and alerts generated, as well as the registration of new users. This way, the user who manages the data can have more control over the data, as well as provide viewing permissions to other users. This application will also be connected to a SQL database, but only to manage the users of the Front-End application which will not be the same as the API Gateway, to create another security layer over the sensitive data.
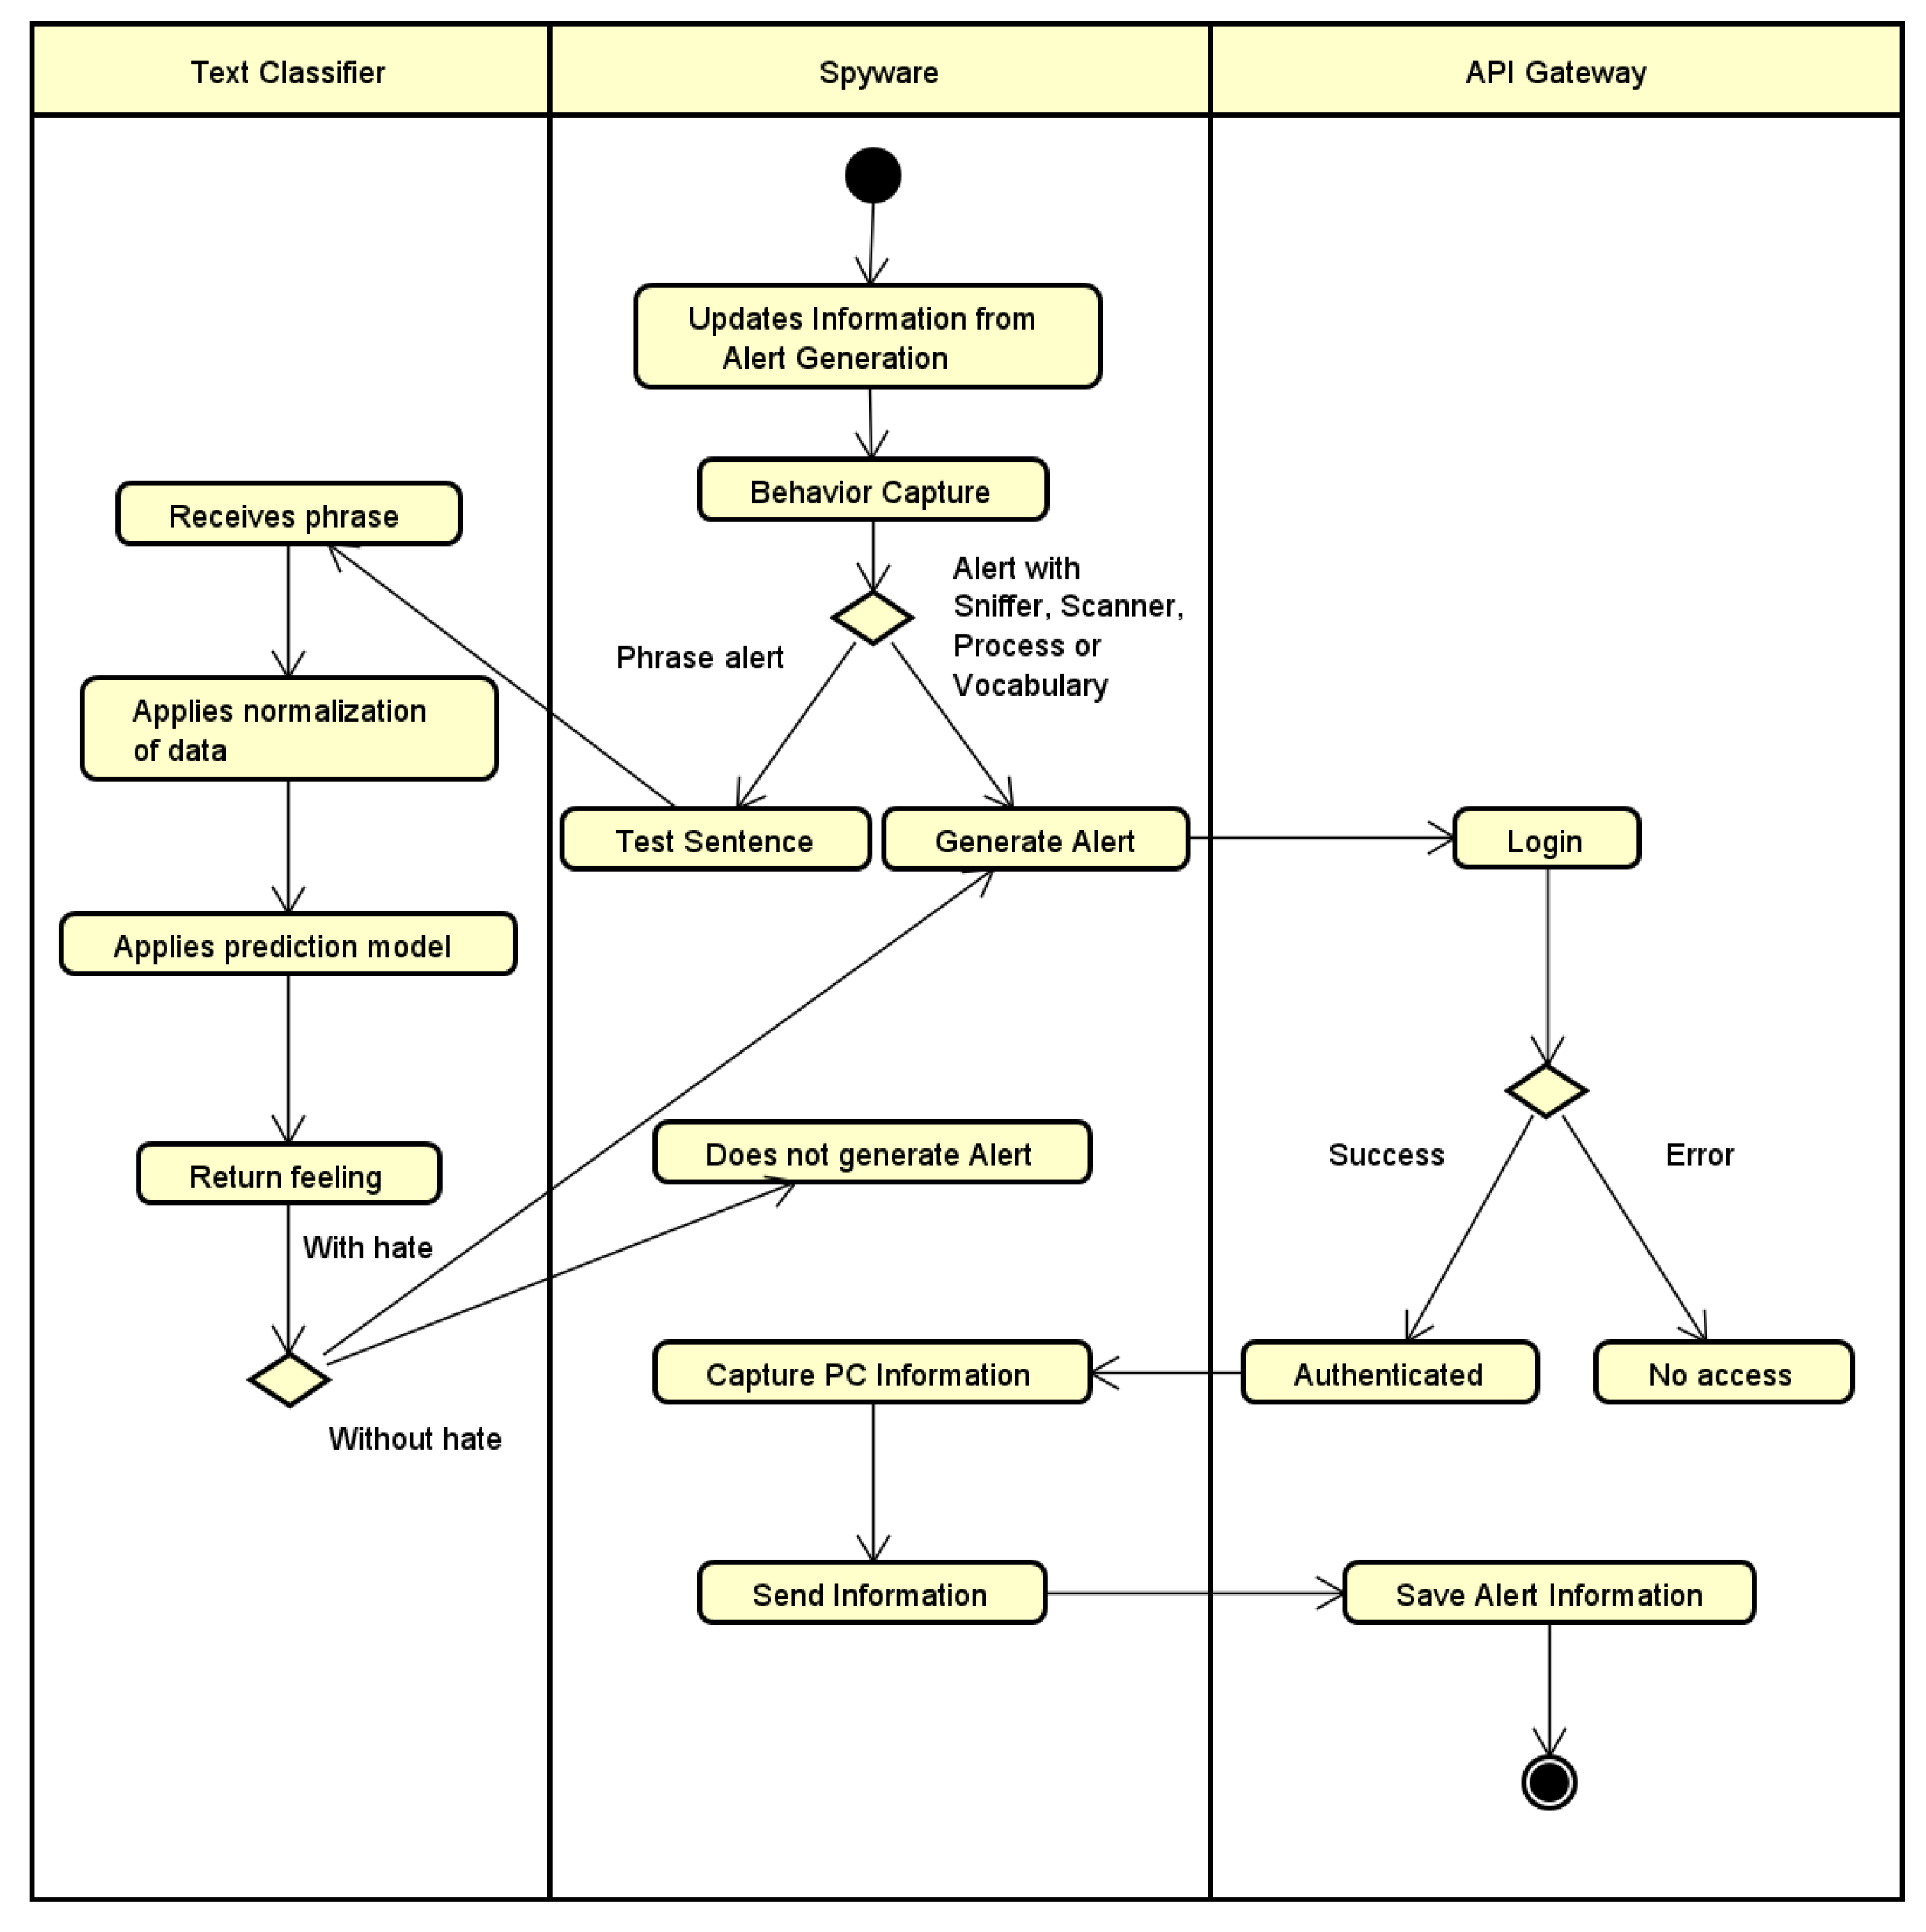
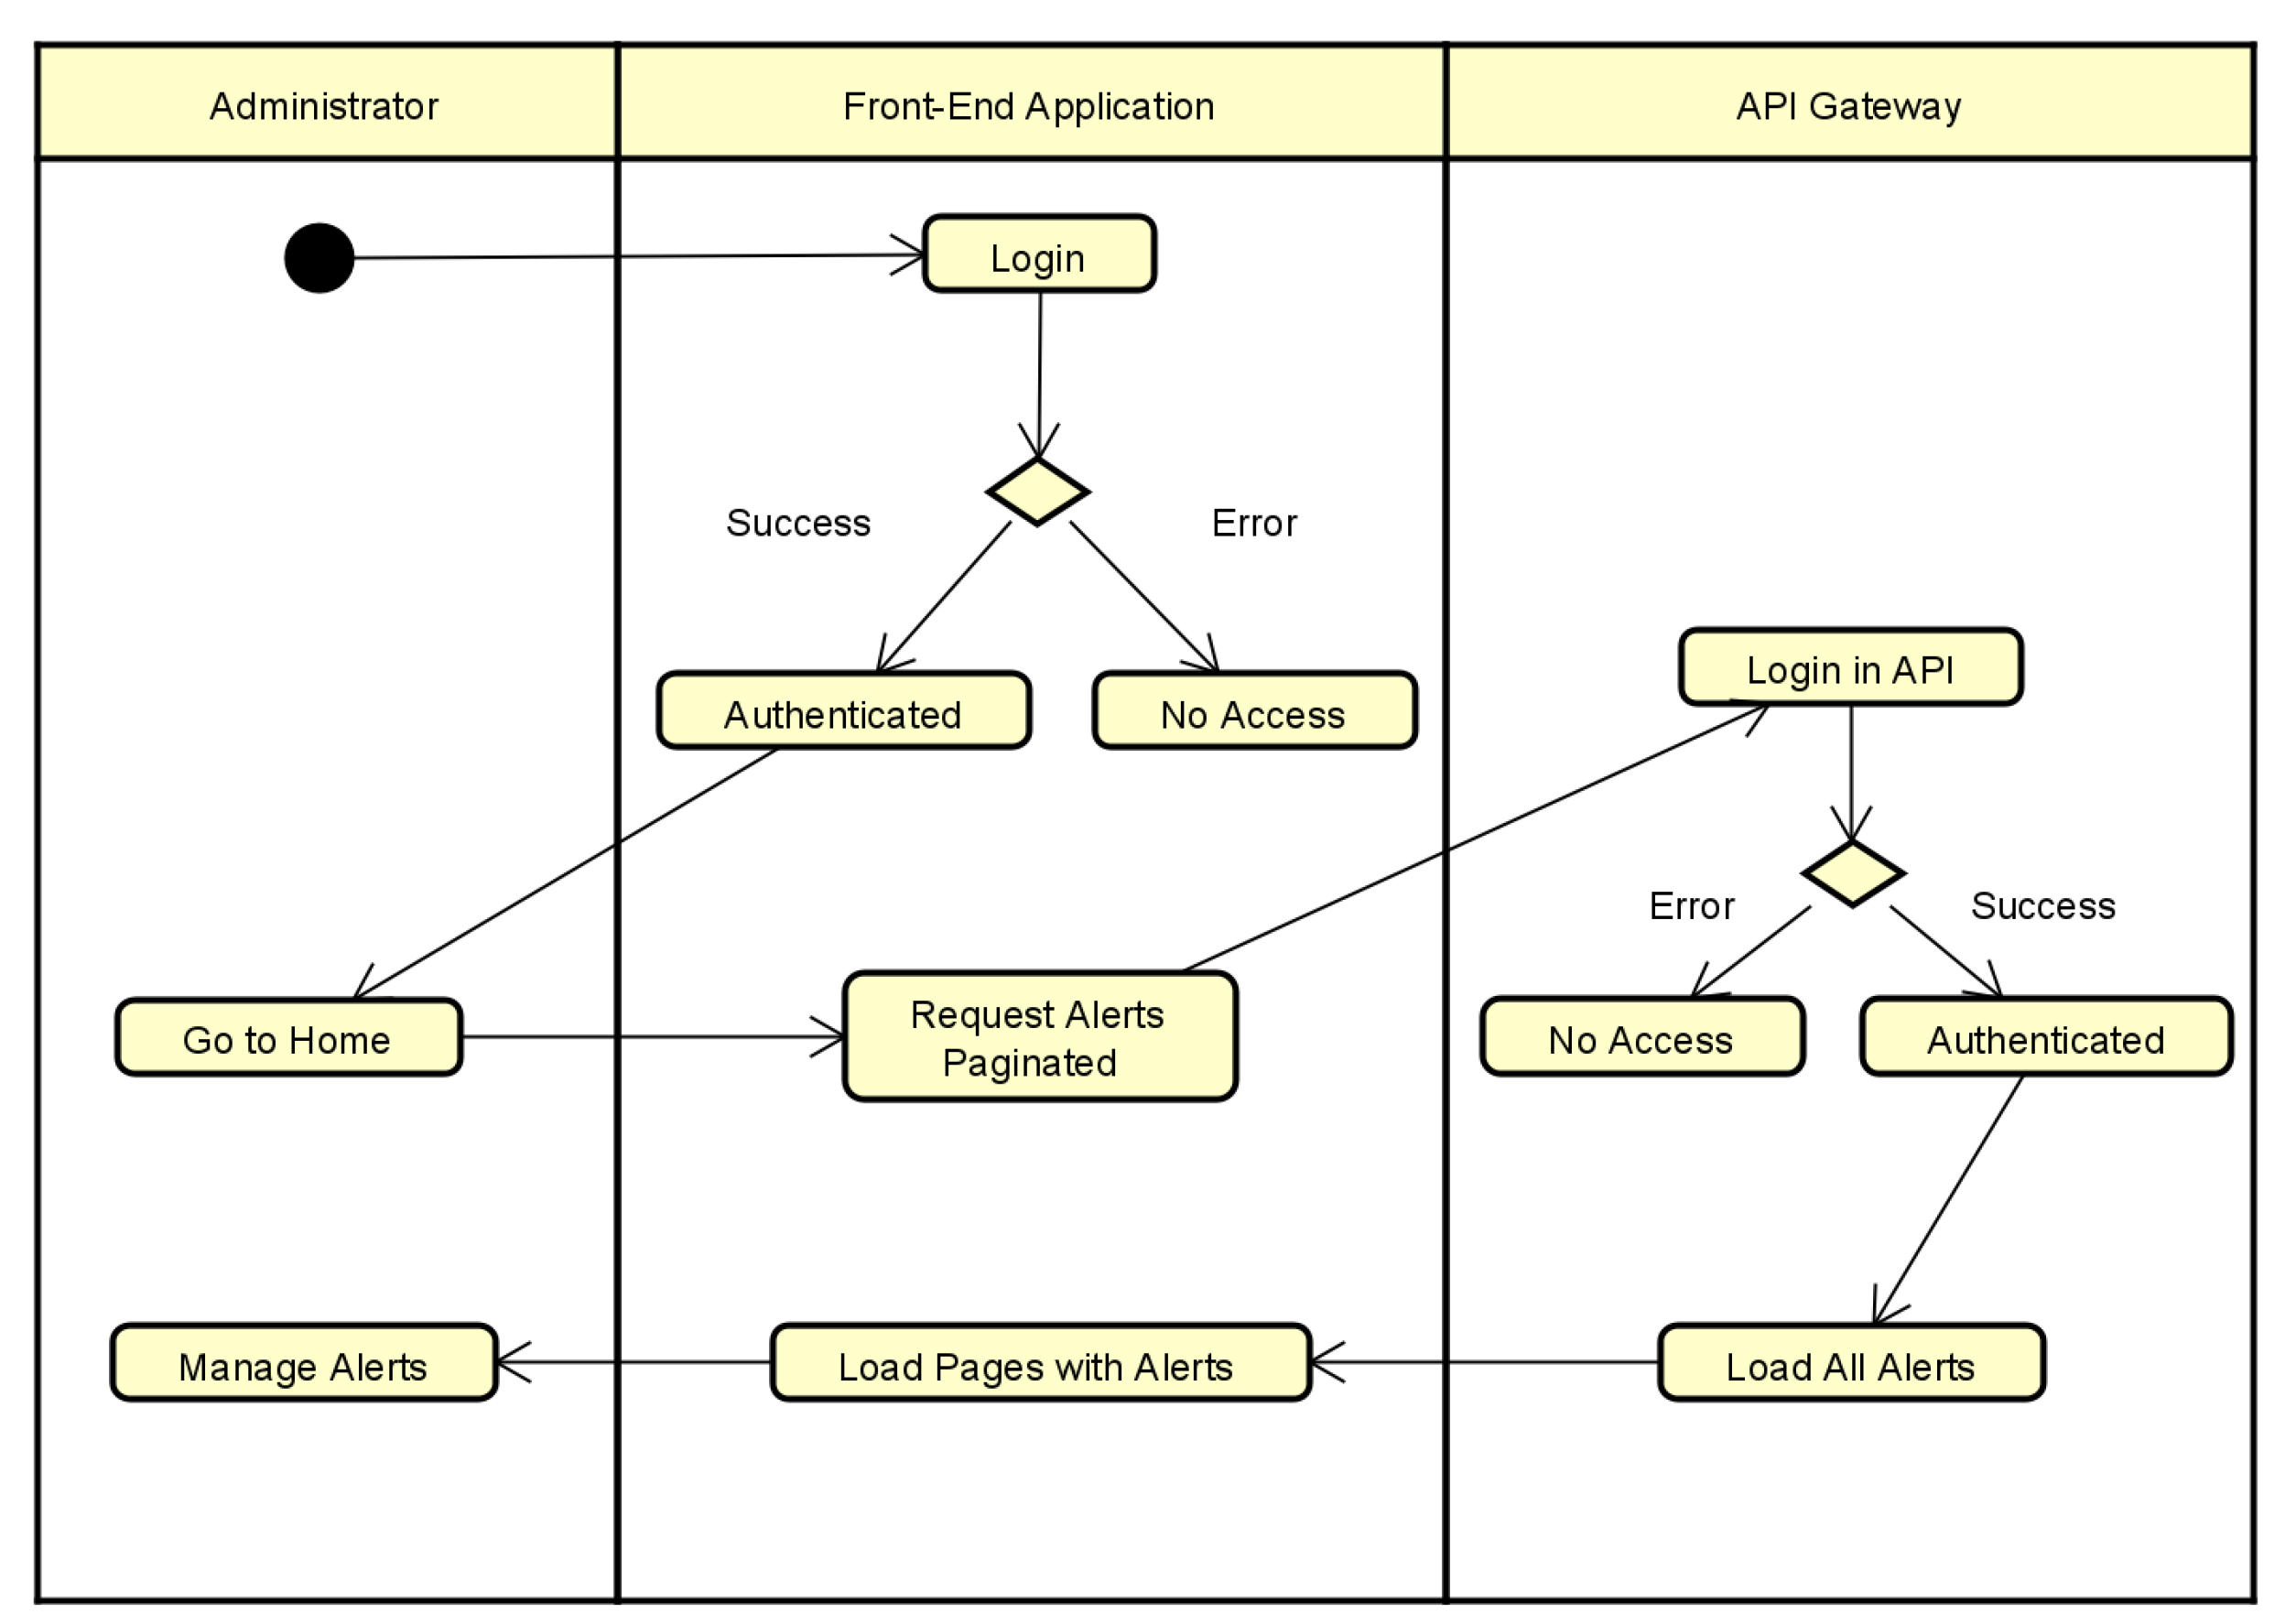
To illustrate the flows, you can analyze the activity diagrams in
Figure 3 and
Figure 4. The first diagram shows the sequence of alert generation activities, with all the routes and possibilities. In the second activity diagram, you can see and analyze the alerts administration flow, where the management happens through the Front-End application.
The architecture also has a unique API Gateway to manage the communication between the Spyware computers and the prediction models that analyze the sentences captured by the KeyLogger. This Spyware API Gateway has only one endpoint that receives a phrase, sends it to the prediction model that will tokenize, normalize and classify, returning whether the phrase is characterized as hate speech or not. This last information is returned to Spyware, which will follow the flow, according to the result obtained.
4. Implementation
In this section aspects related to the implementation of the proposed solution are presented, with strategies used for development, showing the main elements of each application. The main components presented in the architecture are addressed in order to obtain the expected results, abstracting the architecture elements already explained and the APIs developed for communication and data exposure.
Thus, the trained prediction/classification model is detailed, with the data processing involved in the process and the spyware script developed for monitoring, with the techniques presented in the literature review.
4.1. Spyware Monitoring
The proposed Spyware is a script developed in Python, using native and additional tools and frameworks, so that in this way it is possible to build monitoring that tracks active processes, sites accessed, words typed, what is running on open ports on the network and what is on display on the user’s screen.
In addition, the script in question needs to have some additional features for sending the generated alerts. The alert generation will use a trigger, for any of the monitoring mentioned. The alert trigger is triggered when the collected data fits the monitoring criteria. The alert generation criteria are parameterized and are updated every time the script is started, searching the API Gateway for the most current version. To generate an alert, besides the trigger, Spyware also needs to log into the API Gateway, generating a JWT Token to send the alert.
After the data update, the spyware separates the process into three main threads. One thread is the Sniffer, which is responsible for validating the accessed websites. Another thread is the Port Scanner, which splits into several other threads to validate the network ports. And the last thread runs the KetLogger, responsible for analyzing what the user writes. This way, using the data update, the communication with the API Gateway (using Token JWT), the parallelization of the processing, and all the monitoring techniques mentioned above, it is possible to obtain a fast, efficient, and the same time simple script.
4.2. Prediction Models
For efficient monitoring that can identify hate speech, a good mapping of the elements that compose this type of speech is necessary. In addition, good strategies for training, testing, normalization, vectorization, and a suitable model are also essential, so this subsection will address the strategies used to achieve this goal. Initially, a dataset [
27] formed of texts from the social network Twitter in Portuguese was selected, dividing the sentences into two classifications, with and without hate speech. After, a normalization of this data was performed, removing elements that hinder the final analysis, such as stopwords and special characters, followed by a vectorization of the words.
After all this pre-processing of the dataset, it is possible to start the training process of the prediction models, which in this case will be three classifiers: Logistic Regression, SVM, and Multinomial Naive Bayes.
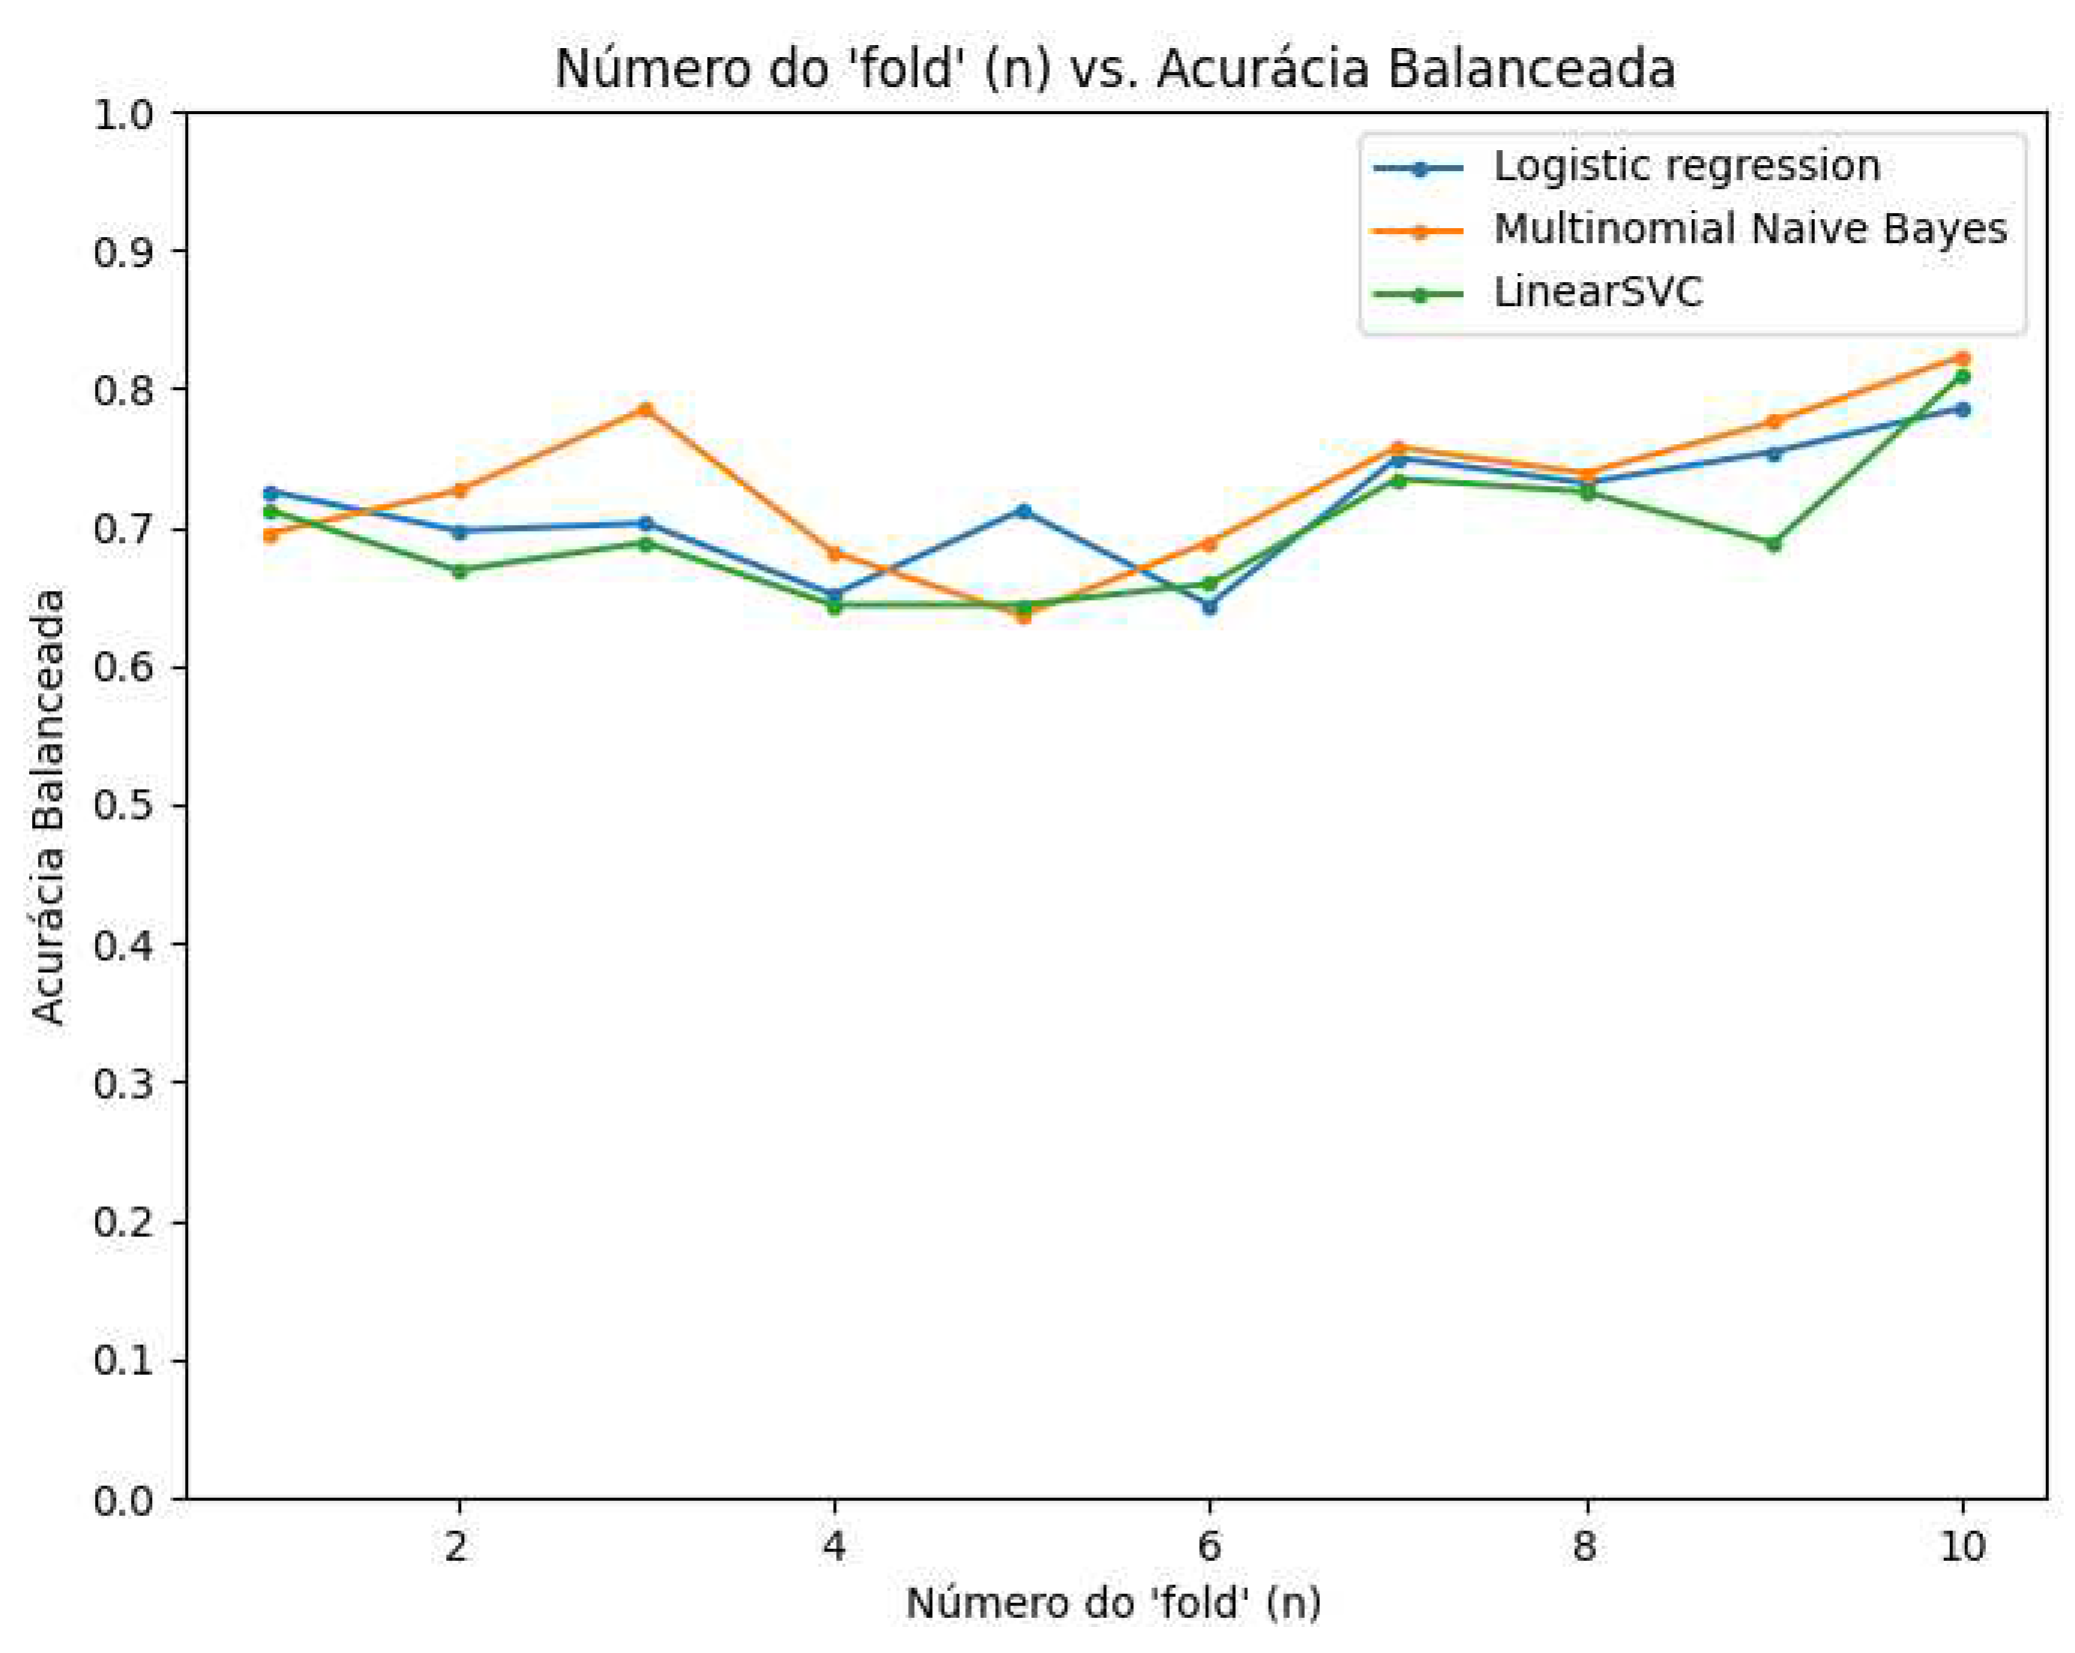
Figure 5 presents the performance measured by balanced accuracy for the three models used in the tests, which is possible to see that the three models have similar results, but the Multinominal Naive Bayes concludes being more accurate.
The used classifiers are widely used for classifications because they are models based on probabilistic action, thus they end up being very efficient and do not need a very large test base to achieve satisfactory results [
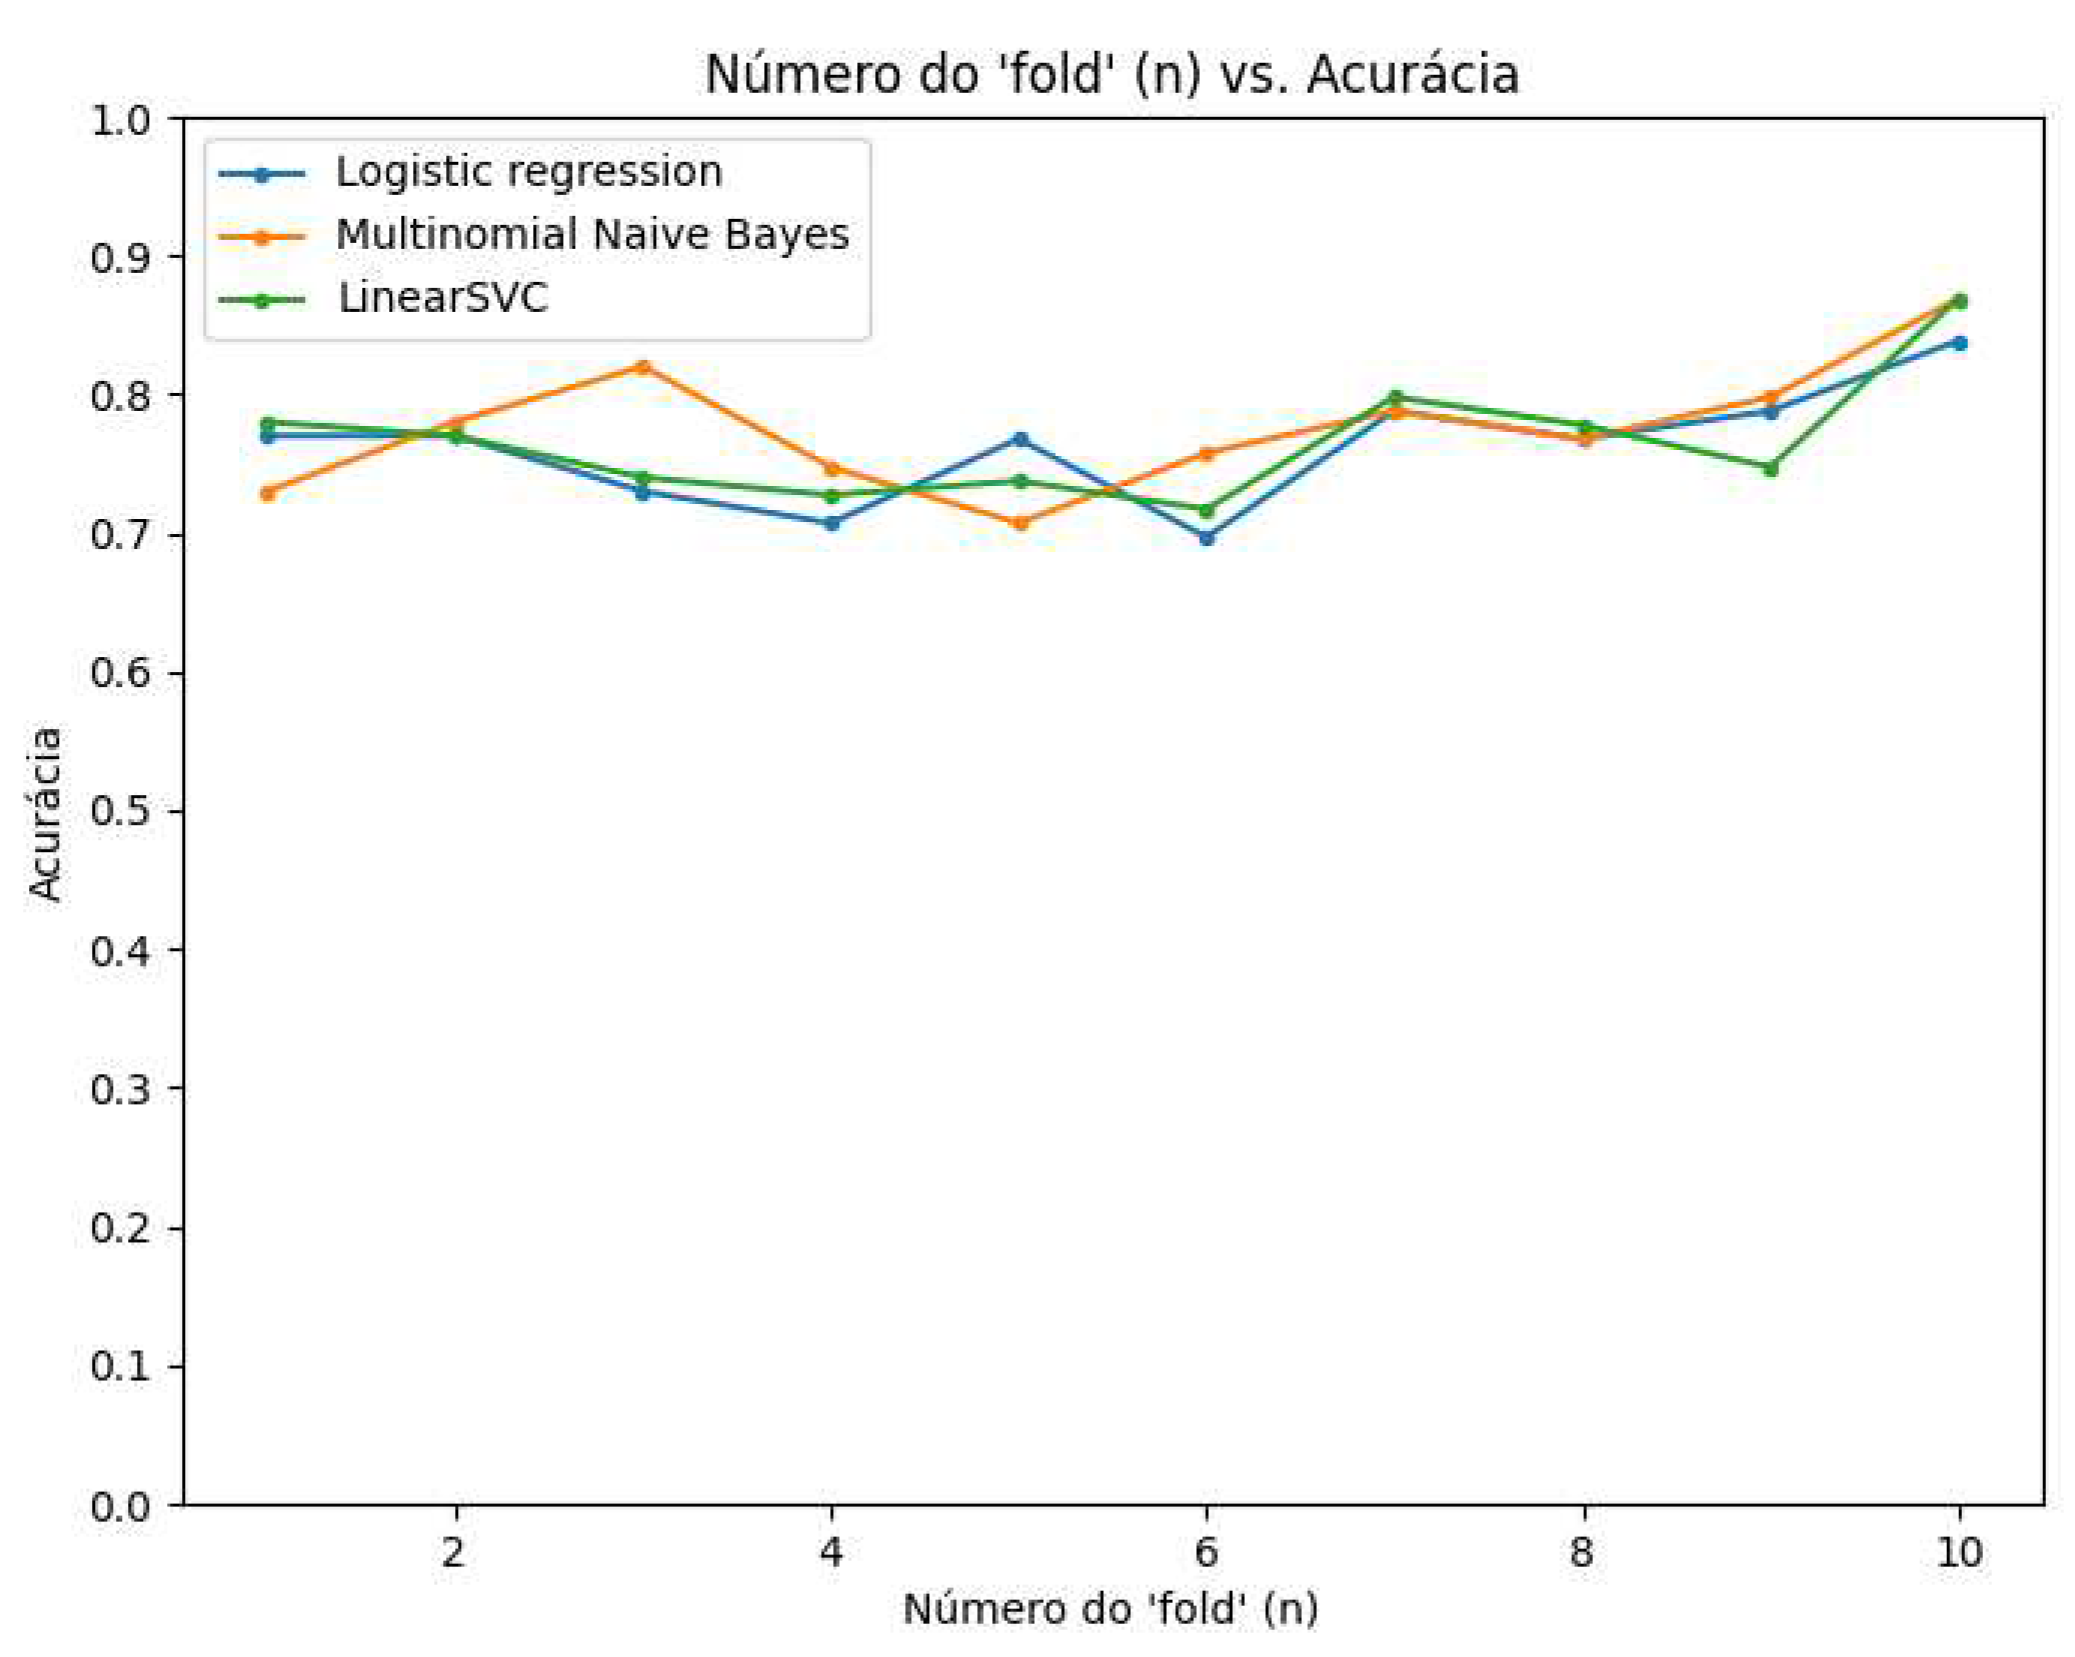
28]. In
Figure 6, the performance was measured by accuracy having the same behavior as the previous figure, with accuracy around 80%.
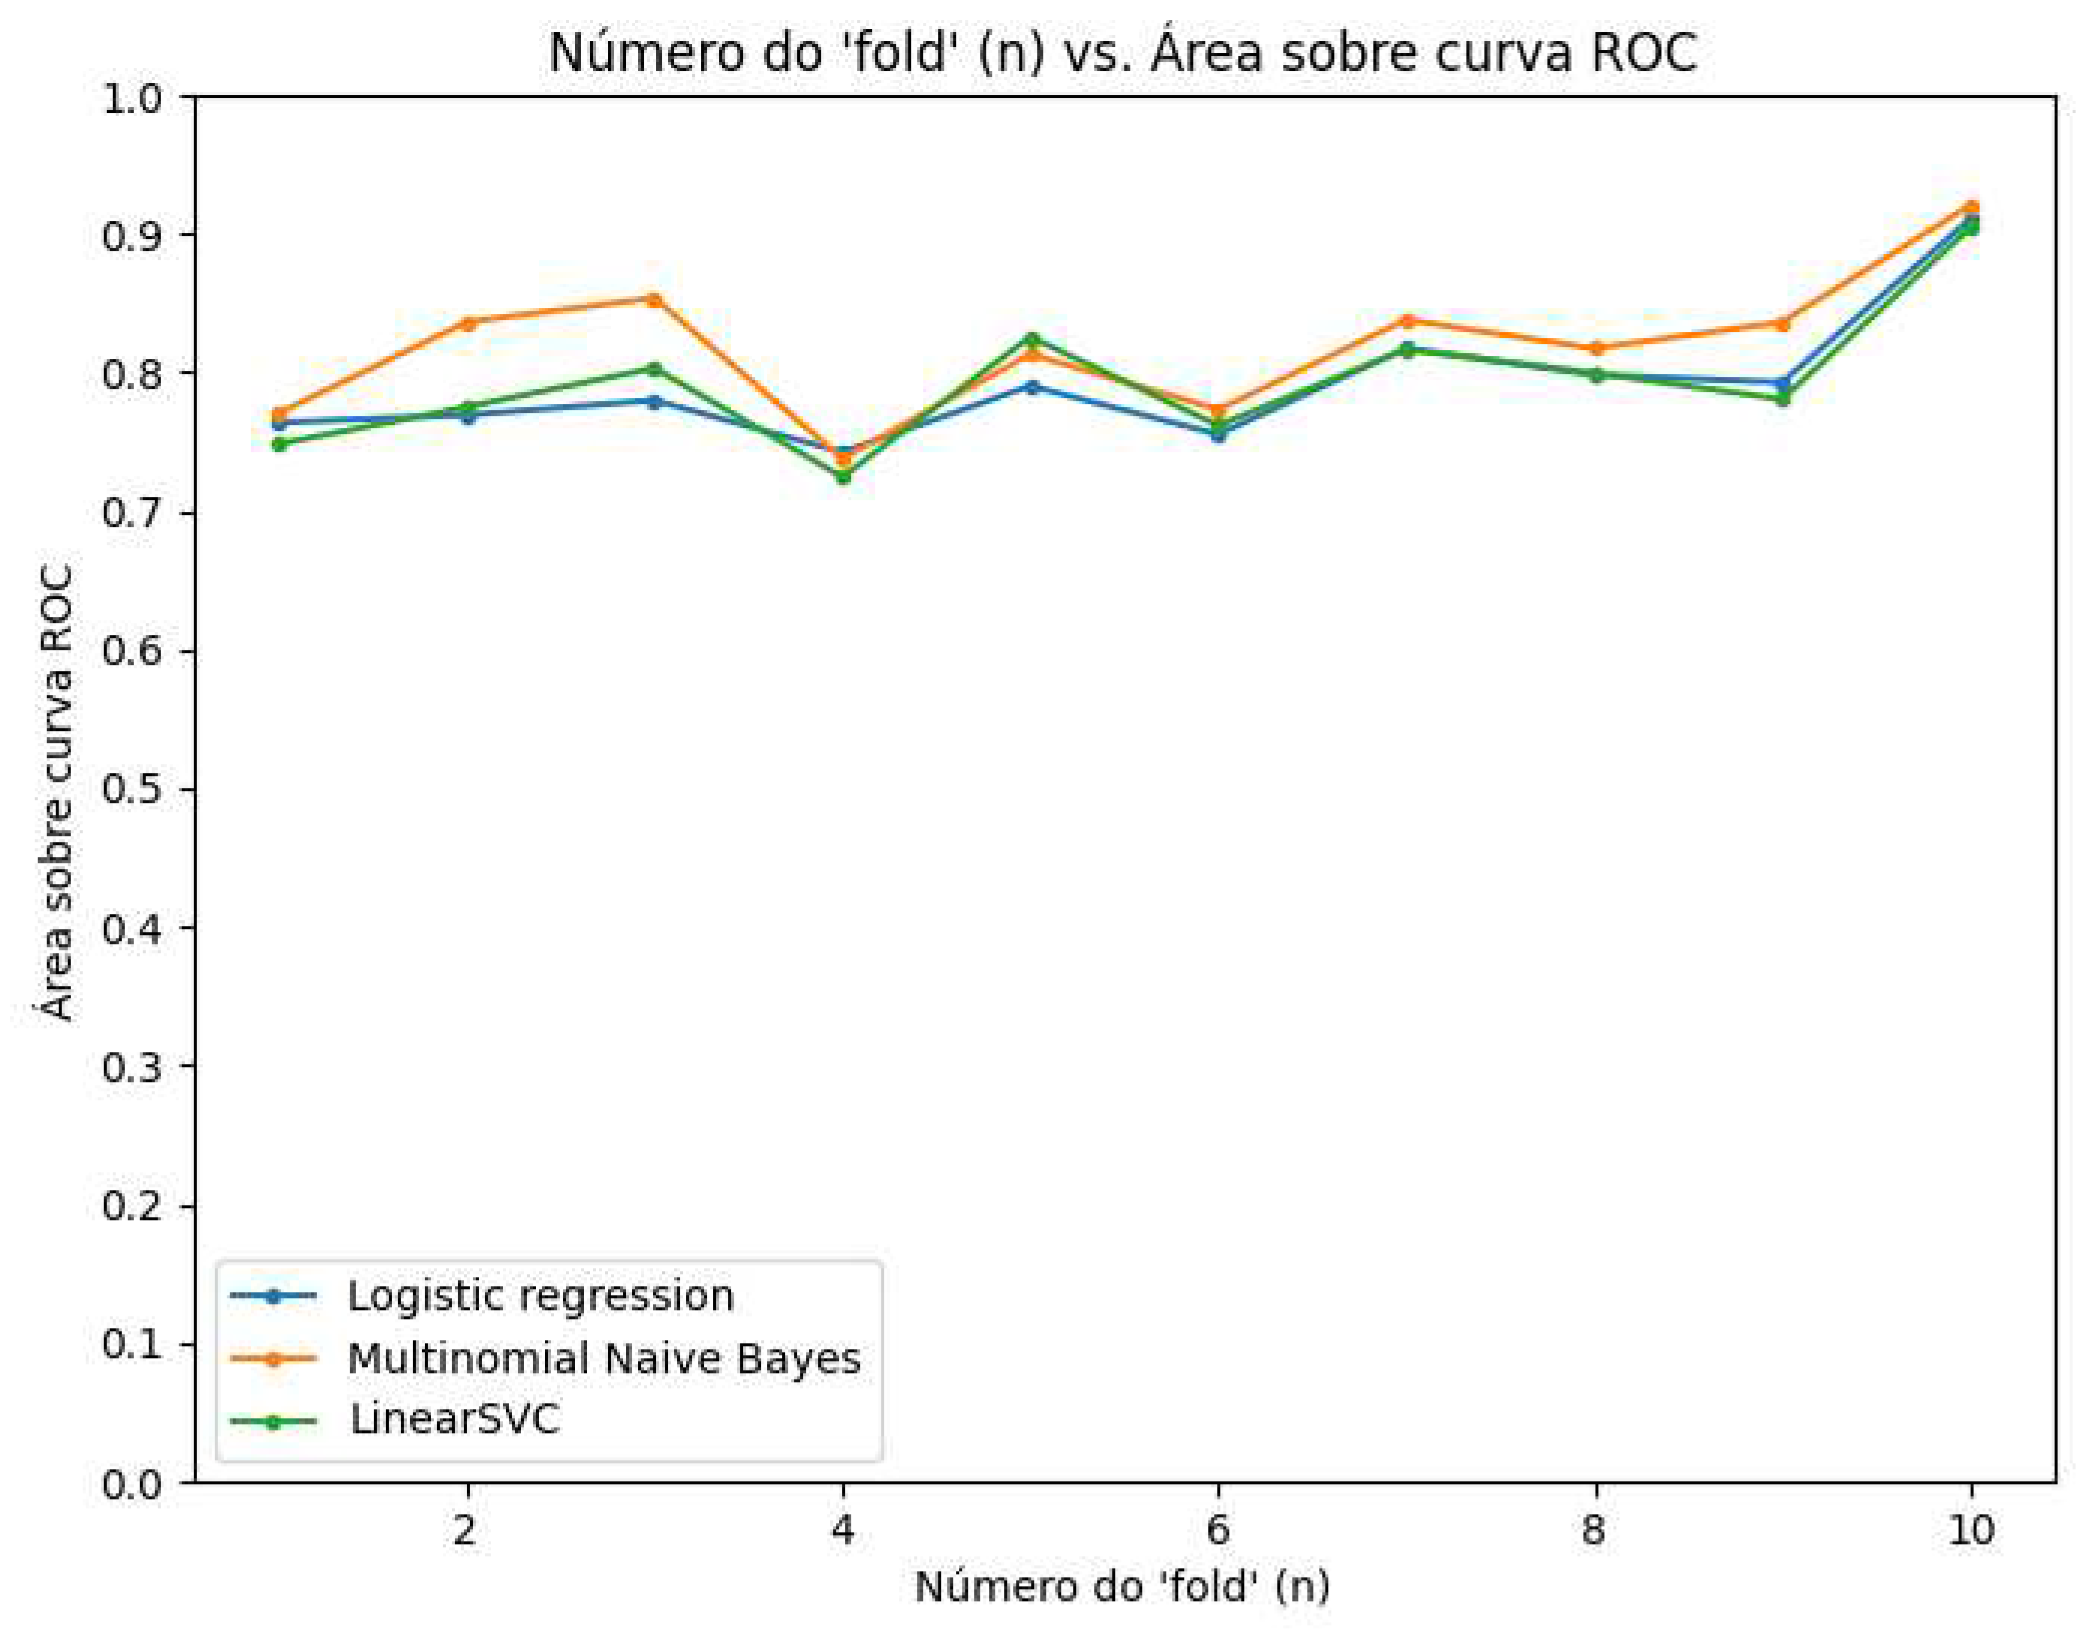
Finally, in
Figure 7, the performance was averaged by the area of the ROC curve where a superior performance can be observed for the three models, equally. It can be seen that in each of the three models, a similar and relatively acceptable performance was obtained, as there was no bias with the training data, but it remained at an average percentage of 87%.
5. Related Work Comparison
Companies, developers, and researchers have explored the potential of monitoring tools in the workplace. However, no solutions have been identified that integrate monitoring for hate speech identification in conjunction with vulnerability scanning techniques.
Commercial solutions include Kickidler [
29] which aims to automate the function of managing company employees by offering a set of tools to monitor employee computers and detect breaches during working hours. The main features are real-time viewing of employee screens with multi-user mode; employee work time reports; and Keylogger for saving keystroke history. However, the features of the unpaid version are limited.
ActivTrak [
30], also a commercial solution, monitors activity, analyzes performance and employee behavior on work computers, as well as for insider threat detection. Among its features are: real-time viewing of employee screens without multi-user mode; time accounting reports; Web site blocker; Keylogger; and screen capture.
FSense [
31] monitors computer usage and logs access to sites and applications not approved by the company, focusing on increasing staff productivity. The tool provides a dashboard with graphics and reports; a summary of monitored activities, idleness, and blocked machine; and a screen capture every 30 seconds for process analysis.
The work of [
32] proposes Mandola, a system for reporting and monitoring online hate speech. It uses an ensemble-based classification algorithm and is composed of six individual components, which communicate with each other to consume, process, store, and visualize statistical information about hate speech disseminated online.
In [
33] the authors present an approach to detect and visualize aggression in social media. A user interface based on a web browser plug-in was designed on Facebook and Twitter to visualize the aggressive comments posted on the social media user’s timelines. It is a solution available both to any citizen and to industry.
Table 1 presents a comparison between the cited works and ours regarding some functionalities. It highlights that none of the works integrates all the functions proposed in this paper. In addition, it is worth noting that the features provided in some of the commercial solutions are restricted in the free version, for example, the number of computers to be monitored or architectures as described [
34] or consensus algorithm [
35]. The solution proposed in this work has no limitations regarding the number of computers and all its features will be freely accessible. As for the solutions for identifying hate speech, both are limited to a few applications, unlike our solution which monitors everything typed by the user.
6. Final Remarks
This work presents a solution proposal for real problems of companies and institutions around the world, but with a focus on Portuguese-speaking countries since the hate speech detector was trained with texts in Portuguese. In addition, the application aims to provide a set of monitoring activities performed on the collaborators’ computers in a centralized way in the same architecture.
Therefore, it is possible to observe that, in technical terms, these purposes were achieved, since the architecture was tested in a controlled homologation environment, where it kept working during the proposed time with four computers being monitored.
It is also worth noting that employees should be aware of the computer monitoring process and that it should be used as a tool for learning and development rather than as a deterrent, i.e., to create more positive work cultures by deterring workplace hostility, harassment, incivility, and bullying behavior. Therefore, it is essential that companies define in the employment contract which behaviors will not be tolerated. In addition, there should be systematic feedback to employees about the alerts generated in the system, reflecting on the company’s commitments to maintain a culture of diversity, equity, and inclusion; since it affects the perception of the public and the business community about the company’s reputation and corporate responsibilities, seeking also, to avoid legal liability for such attitudes.
In future work, tests will be conducted with a larger number of computers in a real environment. In addition, it is intended to develop performance strategies to ensure the stability of the applications, such as a messaging service with RabbitMQ and some caching systems integrated with SpringBoot.
Author Contributions
Writing—original draft, methodology, and formal analysis, Darlan Noetzold; Writing—review and editing, supervision, Anubis Graciela de Moraes Rossetto; Supervision, Valderi Reis Quietinho Leithardt.
Funding
This work was supported by national funds through the Foundation for Science and Technology, I.P. (Portuguese Foundation for Science and Technology) by the project UIDB/05064/2020 (VALORIZA—Research Center for Endogenous Resource Valorization), and Project UIDB/04111/2020, ILIND–Lusophone Institute of Investigation and Development, under project COFAC/ILIND/COPELABS/3/2020.
Informed Consent Statement
Not applicable.
Data Availability Statement
Not applicable.
Conflicts of Interest
The authors declare no conflict of interest.
References
- Ravid, D.M.; Tomczak, D.L.; White, J.C.; Behrend, T.S. EPM 20/20: A Review, Framework, and Research Agenda for Electronic Performance Monitoring. Journal of Management 2020, 46, 100–126. [Google Scholar] [CrossRef]
- Razno, M. Machine learning text classification model with NLP approach. COLINS 2019. Volume II: Workshop, 2019.
- Nytime. Jury orders Tesla to pay $137 million to a former worker over racist treatment, 2021.
- IBM. Cost of a data breach 2022, 2022.
- Suryotrisongko, H.; Jayanto, D.P.; Tjahyanto, A. Design and development of backend application for public complaint systems using microservice spring boot. Procedia Computer Science 2017, 124, 736–743. [Google Scholar] [CrossRef]
- SpringBoot. Spring Boot Reference Documentation, 2022.
- Souza, B.J.; Stefenon, S.F.; Singh, G.; Freire, R.Z. Hybrid-YOLO for classification of insulators defects in transmission lines based on UAV. International Journal of Electrical Power & Energy Systems 2023, 148, 108982. [Google Scholar] [CrossRef]
- ScikitLearn. Getting Started, 2022.
- Stefenon, S.F.; Yow, K.C.; Nied, A.; Meyer, L.H. Classification of distribution power grid structures using inception v3 deep neural network. Electrical Engineering 2022, 104, 4557–4569. [Google Scholar] [CrossRef]
- Stefenon, S.F.; Corso, M.P.; Nied, A.; Perez, F.L.; Yow, K.C.; Gonzalez, G.V.; Leithardt, V.R.Q. Classification of insulators using neural network based on computer vision. IET Generation, Transmission & Distribution 2021, 16, 1096–1107. [Google Scholar] [CrossRef]
- Branco, N.W.; Cavalca, M.S.M.; Stefenon, S.F.; Leithardt, V.R.Q. Wavelet LSTM for Fault Forecasting in Electrical Power Grids. Sensors 2022, 22, 8323. [Google Scholar] [CrossRef] [PubMed]
- Stefenon, S.F.; Bruns, R.; Sartori, A.; Meyer, L.H.; Ovejero, R.G.; Leithardt, V.R.Q. Analysis of the Ultrasonic Signal in Polymeric Contaminated Insulators Through Ensemble Learning Methods. IEEE Access 2022, 10, 33980–33991. [Google Scholar] [CrossRef]
- Stefenon, S.F.; Singh, G.; Yow, K.C.; Cimatti, A. Semi-ProtoPNet Deep Neural Network for the Classification of Defective Power Grid Distribution Structures. Sensors 2022, 22, 4859. [Google Scholar] [CrossRef] [PubMed]
- Corso, M.P.; Perez, F.L.; Stefenon, S.F.; Yow, K.C.; Ovejero, R.G.; Leithardt, V.R.Q. Classification of Contaminated Insulators Using k-Nearest Neighbors Based on Computer Vision. Computers 2021, 10, 112. [Google Scholar] [CrossRef]
- Ochoa, I.S.; de Mello, G.; Silva, L.A.; Gomes, A.J.P.; Fernandes, A.M.R.; Leithardt, V.R.Q. FakeChain: A Blockchain Architecture to Ensure Trust in Social Media Networks 2019. pp. 105–118. [CrossRef]
- Stefenon, S.F.; Furtado Neto, C.S.; Coelho, T.S.; Nied, A.; Yamaguchi, C.K.; Yow, K.C. Particle swarm optimization for design of insulators of distribution power system based on finite element method. Electrical Engineering 2022, 104, 615–622. [Google Scholar] [CrossRef]
- Sopelsa Neto, N.F.; Stefenon, S.F.; Meyer, L.H.; Ovejero, R.G.; Leithardt, V.R.Q. Fault Prediction Based on Leakage Current in Contaminated Insulators Using Enhanced Time Series Forecasting Models. Sensors 2022, 22, 6121. [Google Scholar] [CrossRef] [PubMed]
- Fávero, L.P.; Belfiore, P.; Silva, F.d.; Chan, B.L. Análise de dados: modelagem multivariada para tomada de decisões, 2009.
- Ratz, A.V. Arthur V. Multinomial Nave Bayes’ For Documents Classification and Natural Language Processing (NLP), 2009.
- Ratz, A.V. Multinomial Naive Bayes’ For Documents Classification and Natural Language Processing (NLP), 2022.
- Bennett, K.P.; Campbell, C. Support vector machines: hype or hallelujah? ACM SIGKDD explorations newsletter 2000, 2, 1–13. [Google Scholar] [CrossRef]
- Basumalick, C. What Is Spyware? Definition, Types, Removal, and Prevention Best Practices in 2022, 2022.
- Singh, C.; others. Phishing website detection based on machine learning: A survey. 2020 6th International Conference on Advanced Computing and Communication Systems (ICACCS). IEEE, 2020, pp. 398–404. [CrossRef]
- Carrier, D.B. How to Detect Running Malware – Intro to Incident Response Triage (Part 7), 2022.
- N-able. What Is DNS Blocking, and What Should You Know about DNS Security?), 2021.
- Rohrmann, R.R.; Ercolani, V.J.; Patton, M.W. Large scale port scanning through tor using parallel Nmap scans to scan large portions of the IPv4 range. 2017 IEEE International Conference on Intelligence and Security Informatics (ISI). IEEE, 2017, pp. 185–187. [CrossRef]
- de Pelle, R.P.; Moreira, V.P. Offensive Comments in the Brazilian Web: a dataset and baseline results. 6th Brazilian Workshop on Social Network Analysis and Mining (BraSNAM), 2017. to appear. [CrossRef]
- Zulqarnain, M.; Ghazali, R.; Hassim, Y.M.M.; Rehan, M. A comparative review on deep learning models for text classification. Indones. J. Electr. Eng. Comput. Sci 2020, 19, 325–335. [Google Scholar] [CrossRef]
- Kickidler. Programa Para Monitorar e Controlar Computadores de Funcionários, 2023.
- ActivTrak. Workforce Analytics for Productivity Management, 2023.
- FSense. fSense: Sistema de Monitoramento Prático e Preciso para Estações de Trabalho, 2023.
- Paschalides, D.; Stephanidis, D.; Andreou, A.; Orphanou, K.; Pallis, G.; Dikaiakos, M.D.; Markatos, E. Mandola: A big-data processing and visualization platform for monitoring and detecting online hate speech. ACM Transactions on Internet Technology (TOIT) 2020, 20, 1–21. [Google Scholar] [CrossRef]
- Modha, S.; Majumder, P.; Mandl, T.; Mandalia, C. Detecting and visualizing hate speech in social media: A cyber Watchdog for surveillance. Expert Systems with Applications 2020, 161, 113725. [Google Scholar] [CrossRef]
- Viel, F.; Silva, L.A.; Valderi Leithardt, R.Q.; Zeferino, C.A. Internet of Things: Concepts, Architectures and Technologies. 2018 13th IEEE International Conference on Industry Applications (INDUSCON), 2018, pp. 909–916. [CrossRef]
- Morais, R.; Crocker, P.; Leithardt, V. Nero: A Deterministic Leaderless Consensus Algorithm for DAG-Based Cryptocurrencies. Algorithms 2023, 16. [Google Scholar] [CrossRef]
|
Disclaimer/Publisher’s Note: The statements, opinions and data contained in all publications are solely those of the individual author(s) and contributor(s) and not of MDPI and/or the editor(s). MDPI and/or the editor(s) disclaim responsibility for any injury to people or property resulting from any ideas, methods, instructions or products referred to in the content. |
© 2023 by the authors. Licensee MDPI, Basel, Switzerland. This article is an open access article distributed under the terms and conditions of the Creative Commons Attribution (CC BY) license (http://creativecommons.org/licenses/by/4.0/).
