Submitted:
31 January 2023
Posted:
01 February 2023
You are already at the latest version
Abstract

Keywords:
1. Introduction
2. Study Area Description
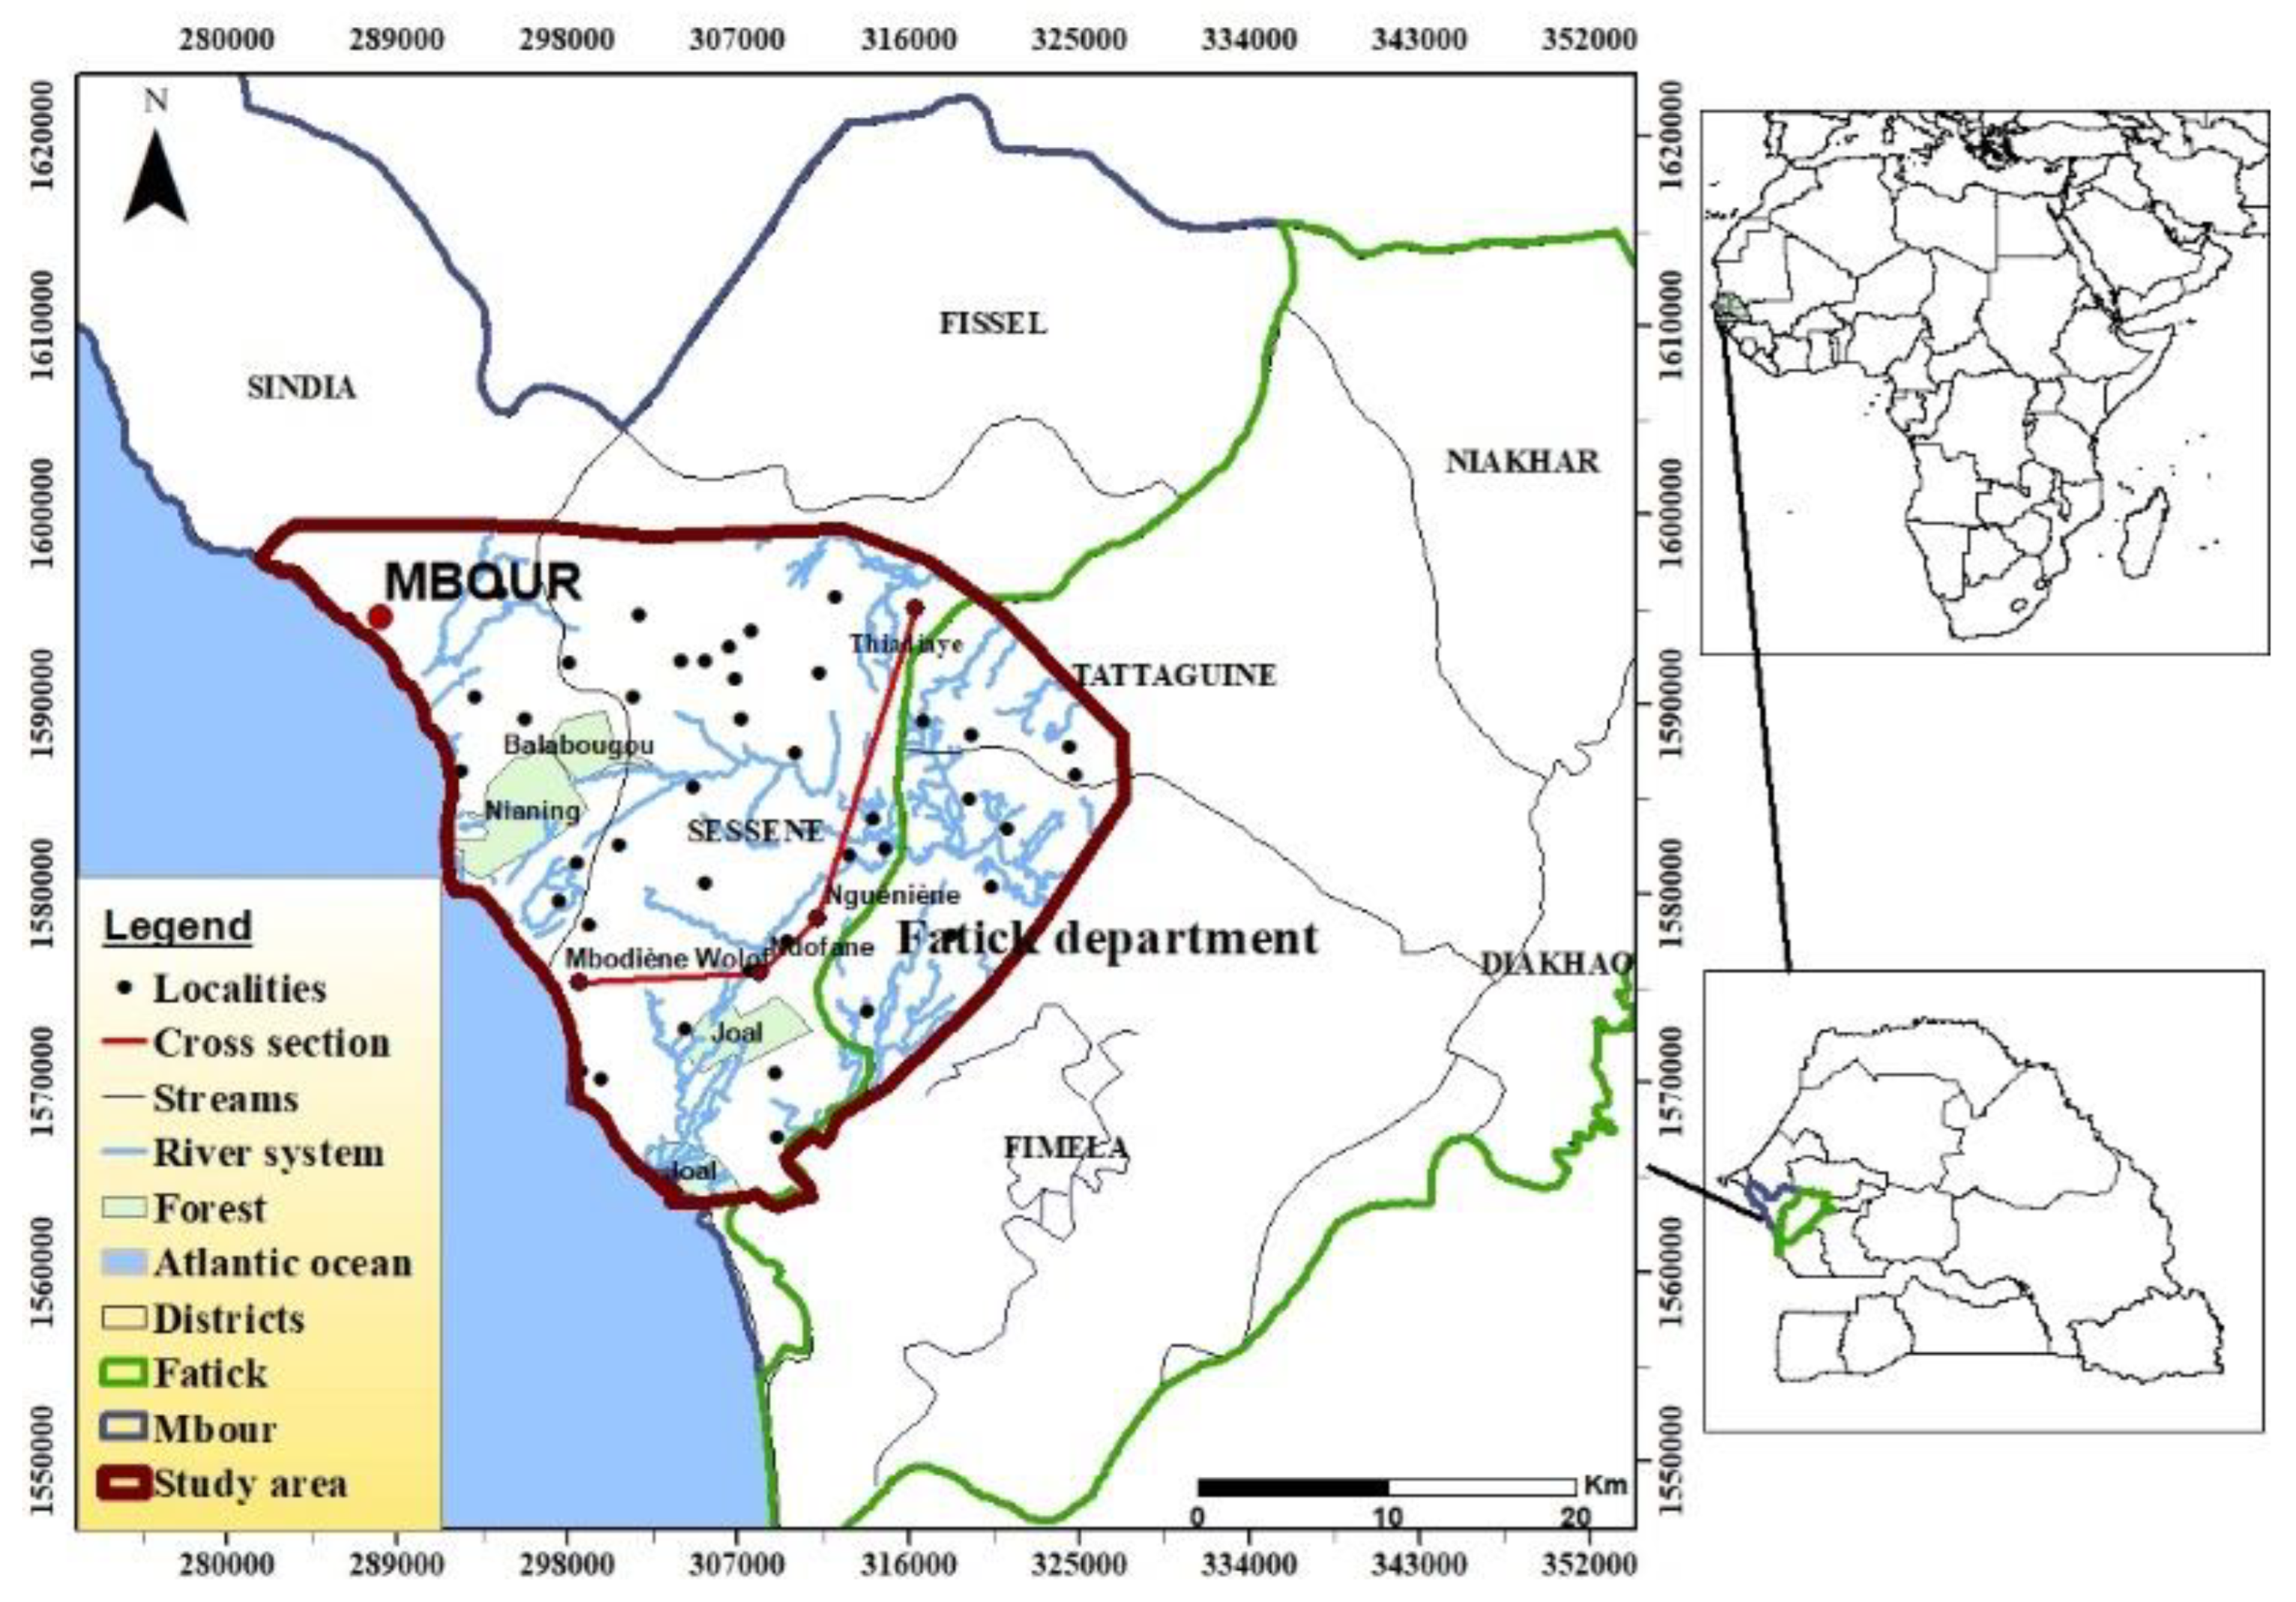
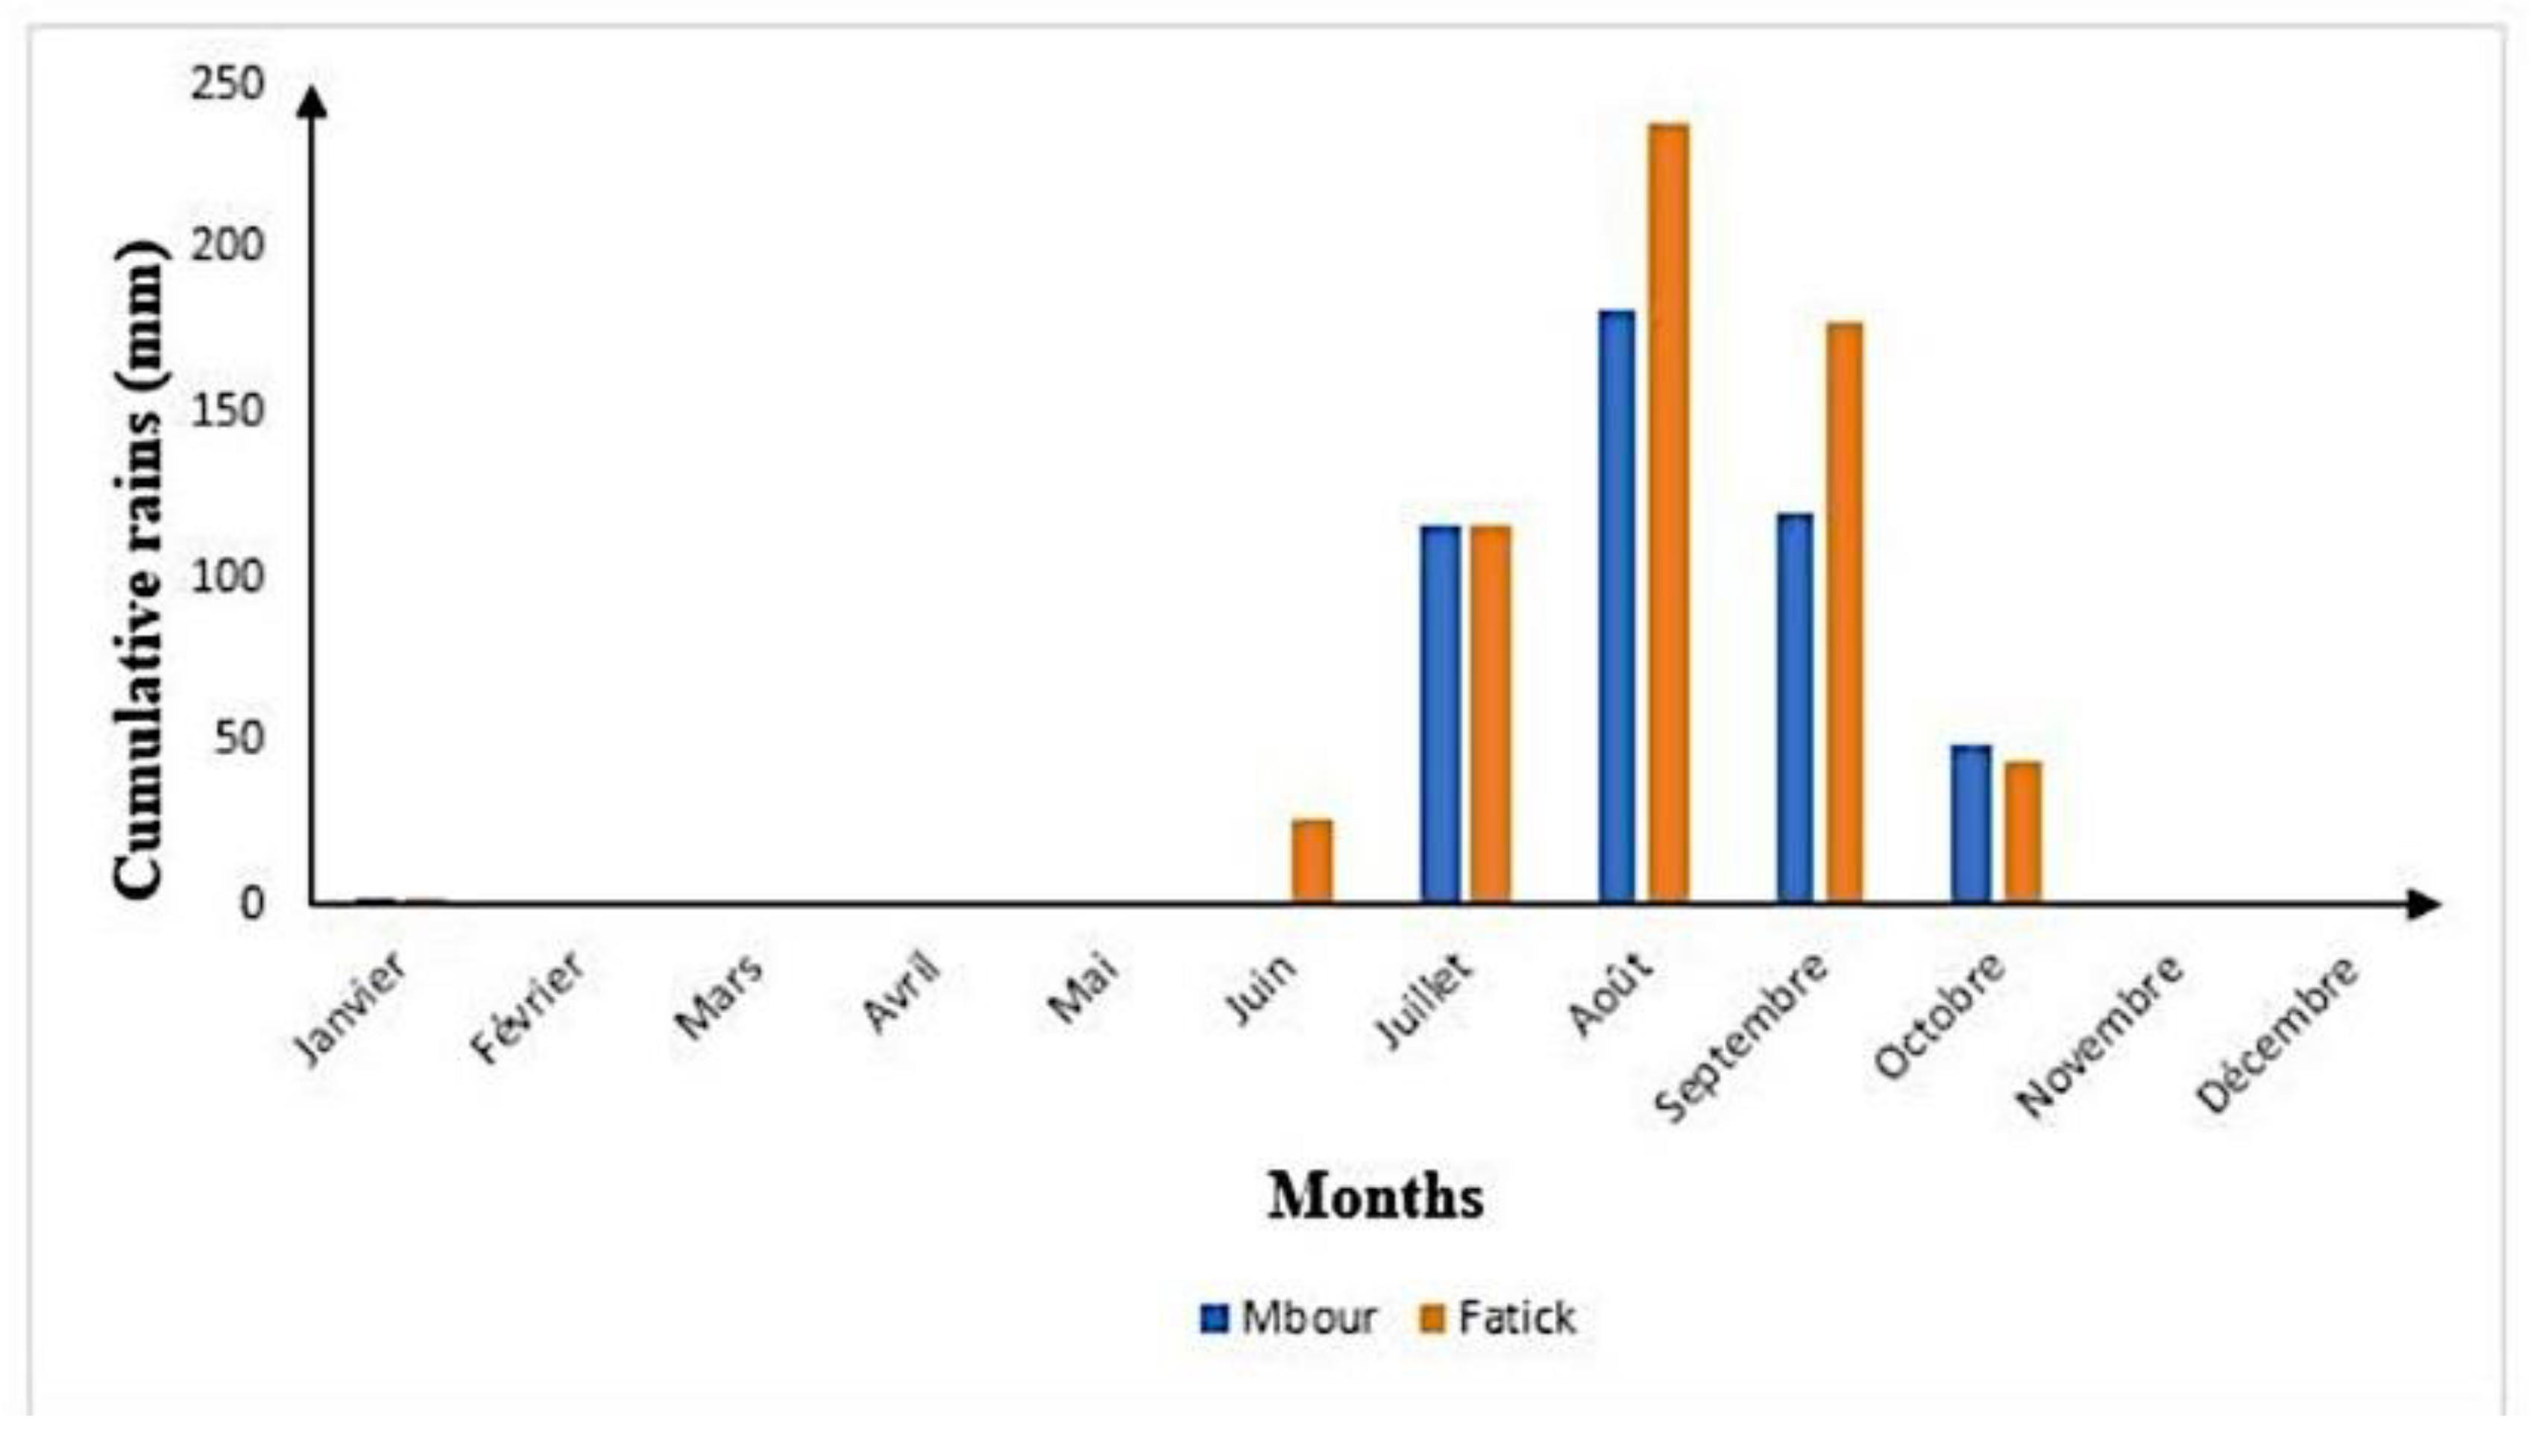
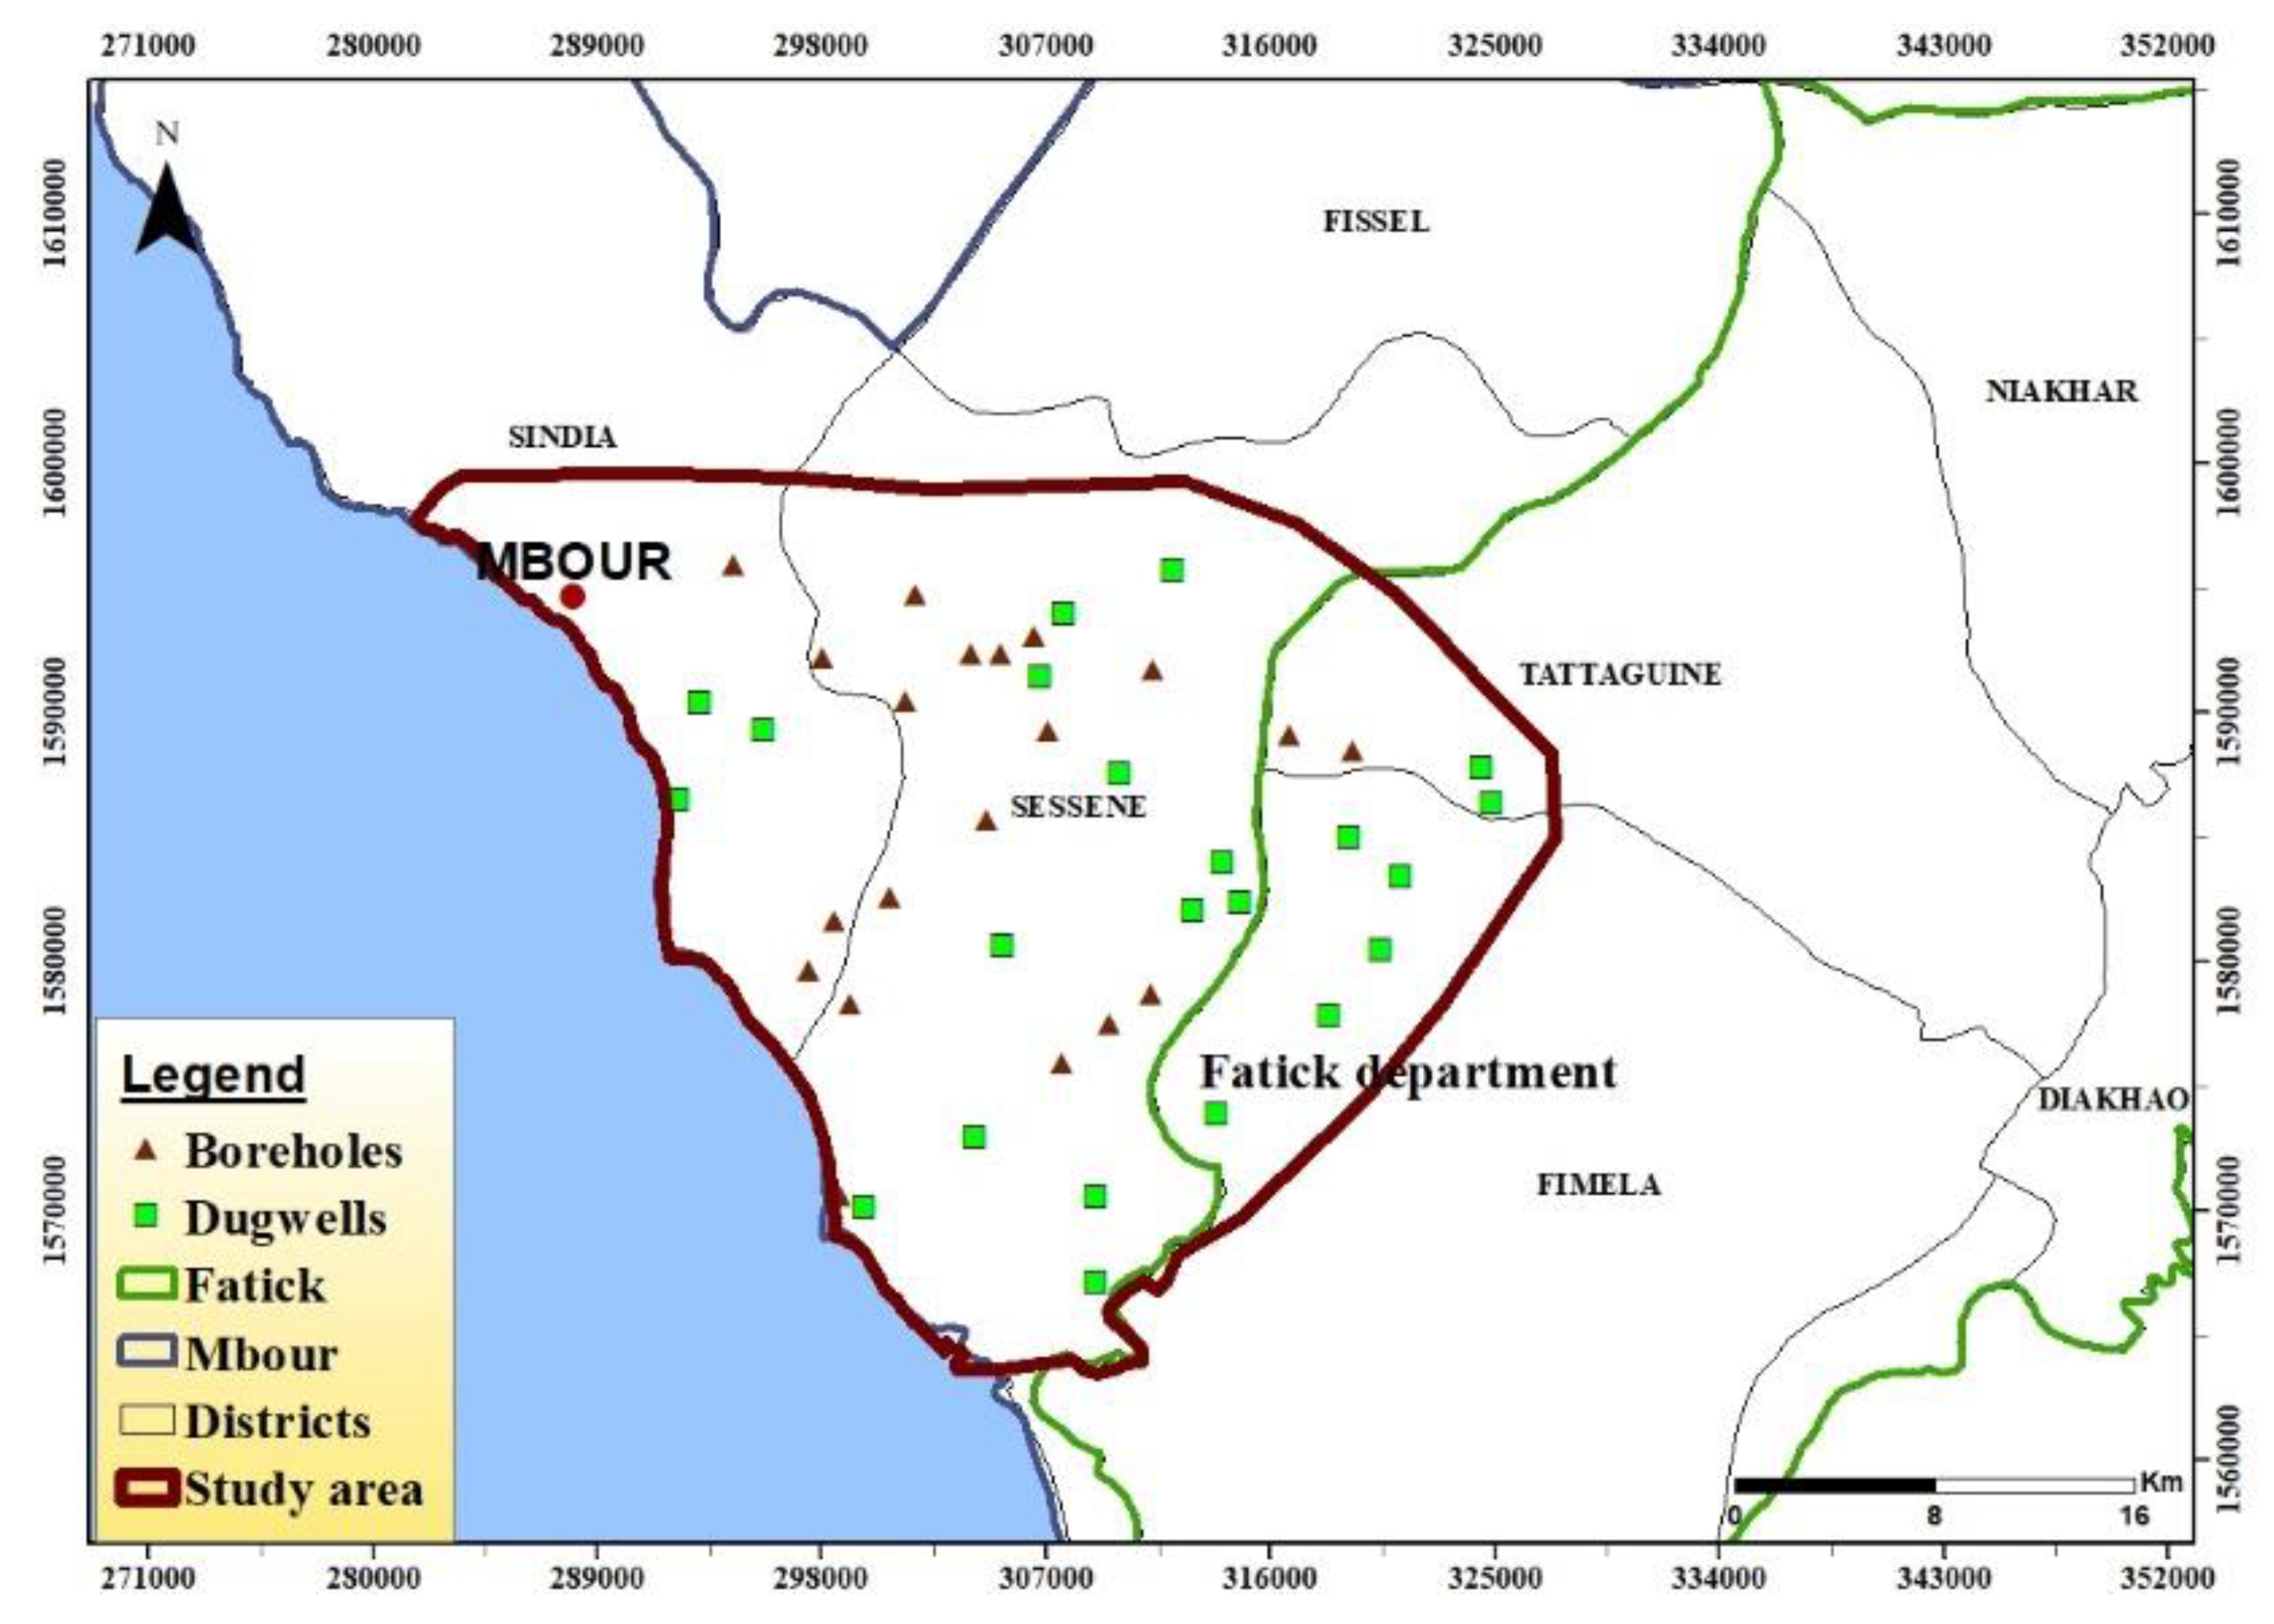
2.1. Location and Climate
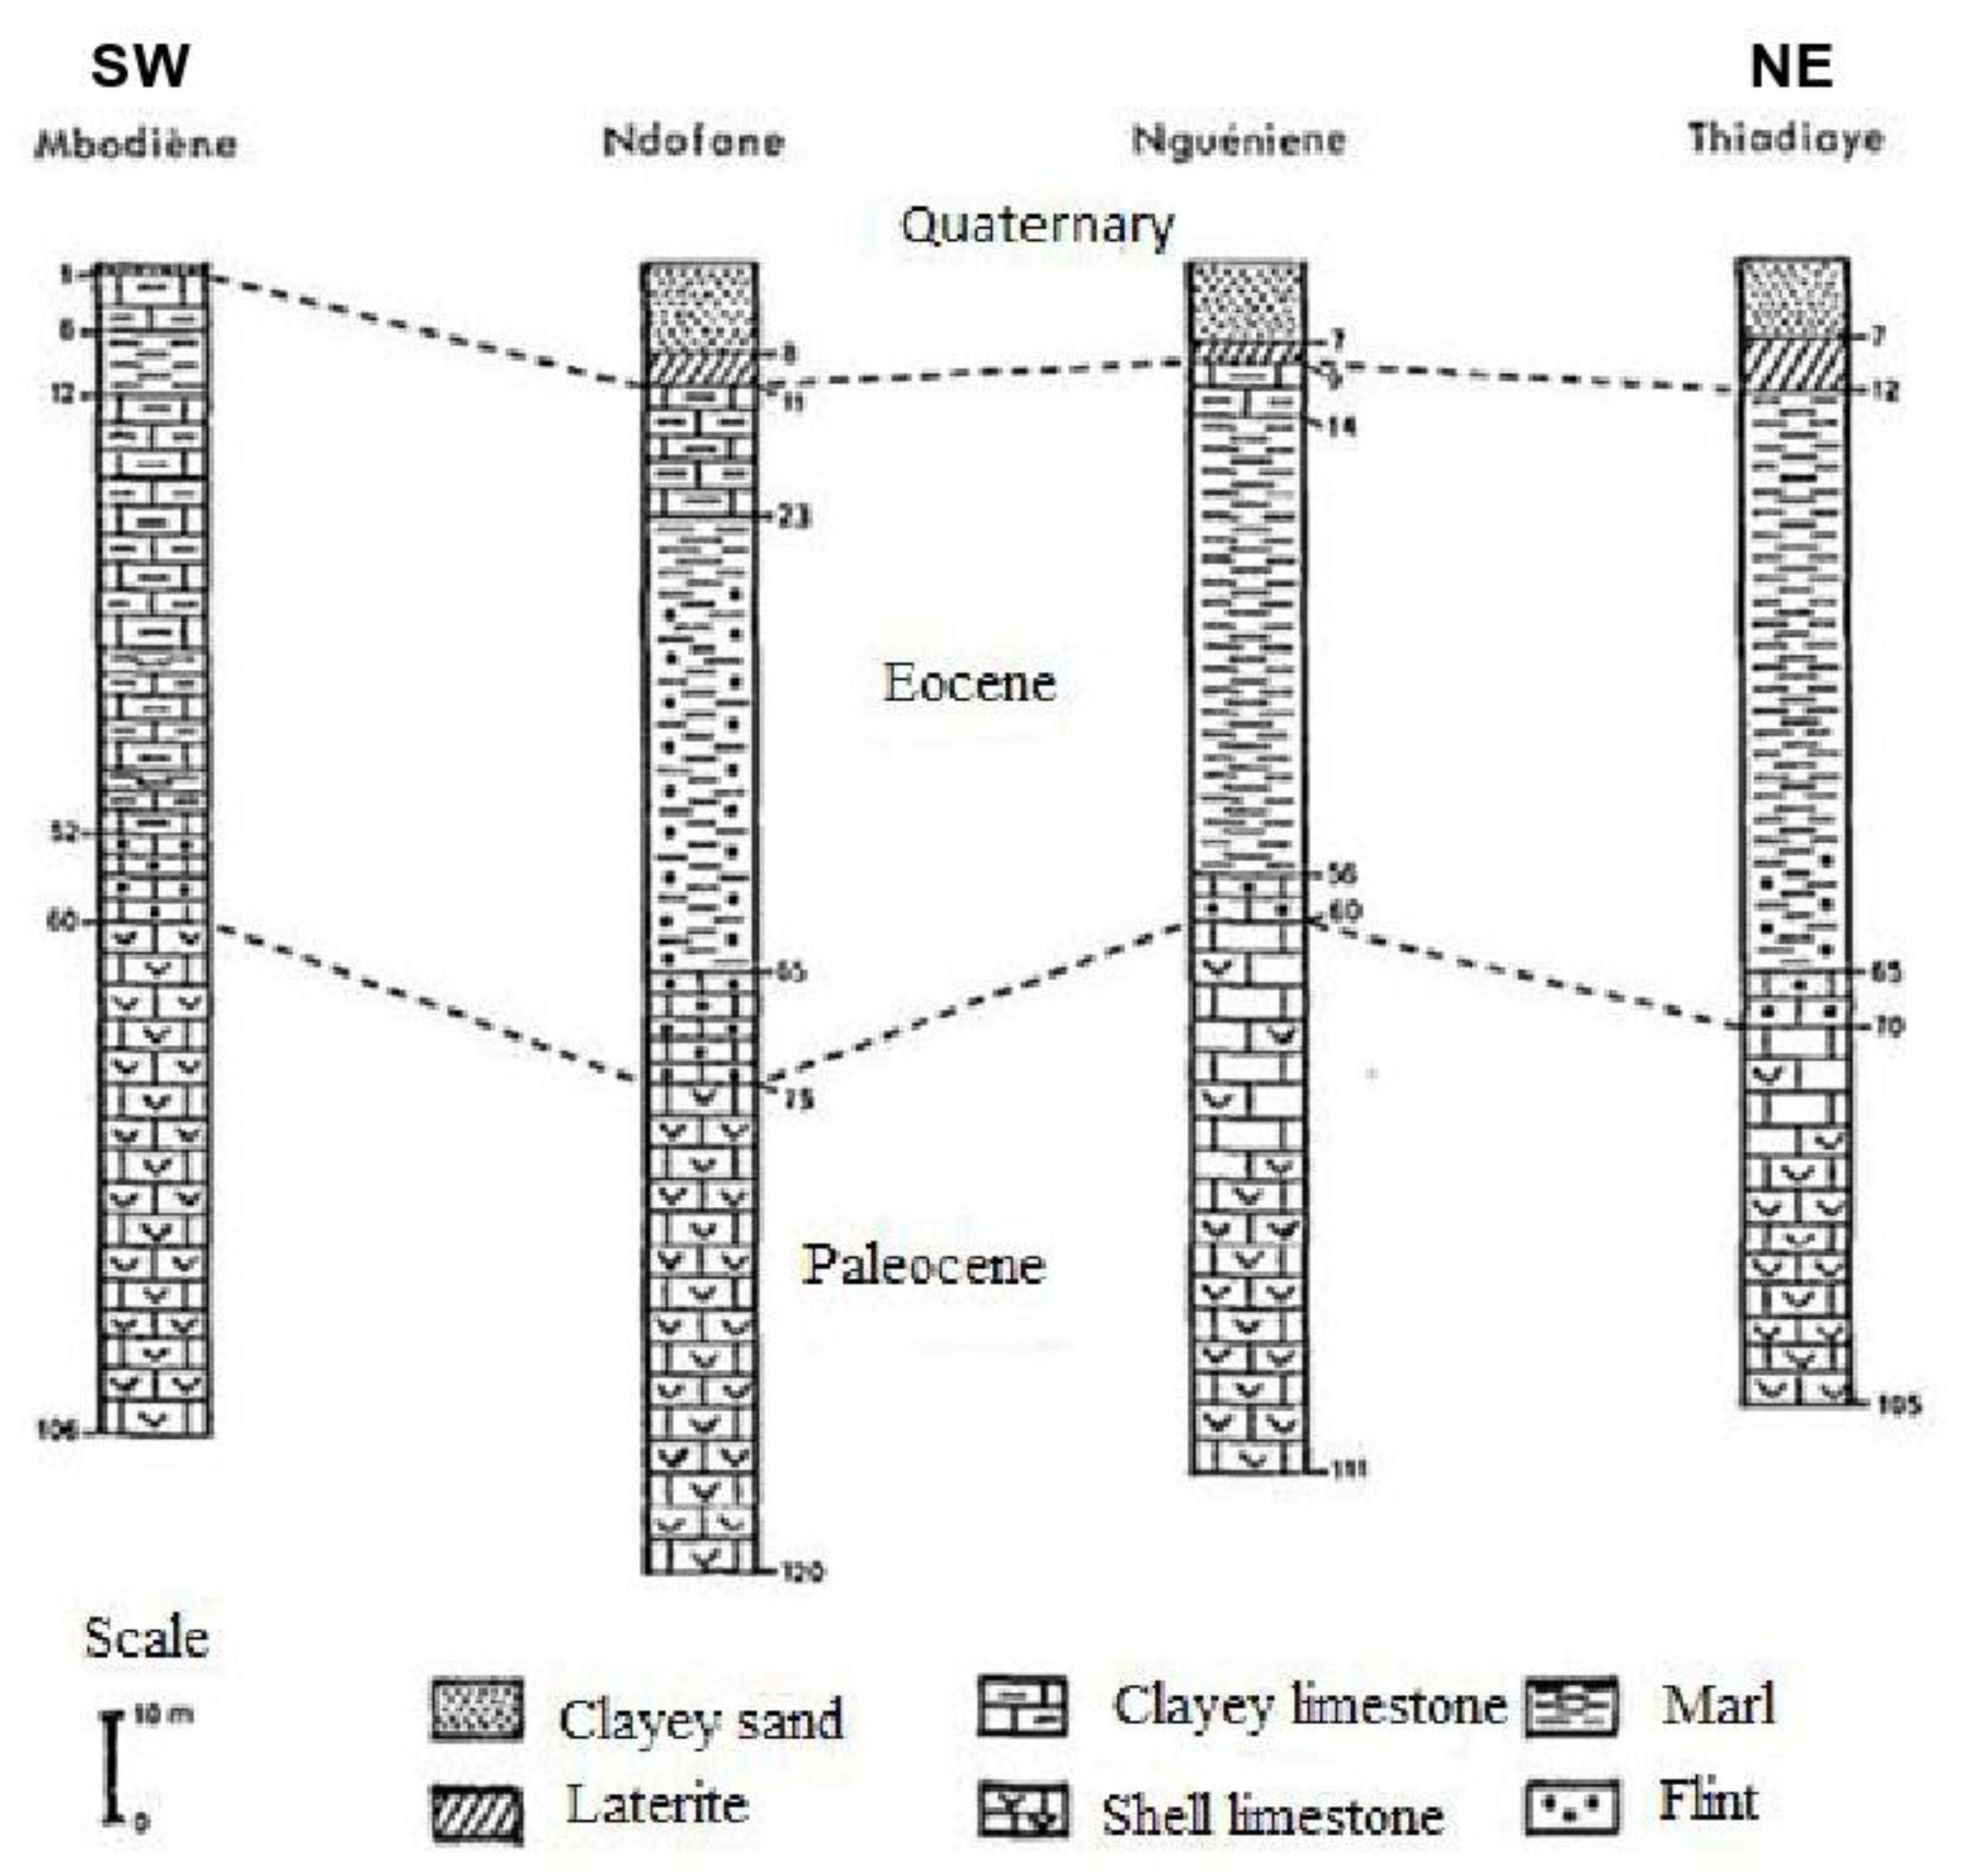
2.2. Geology and Hydrogeology
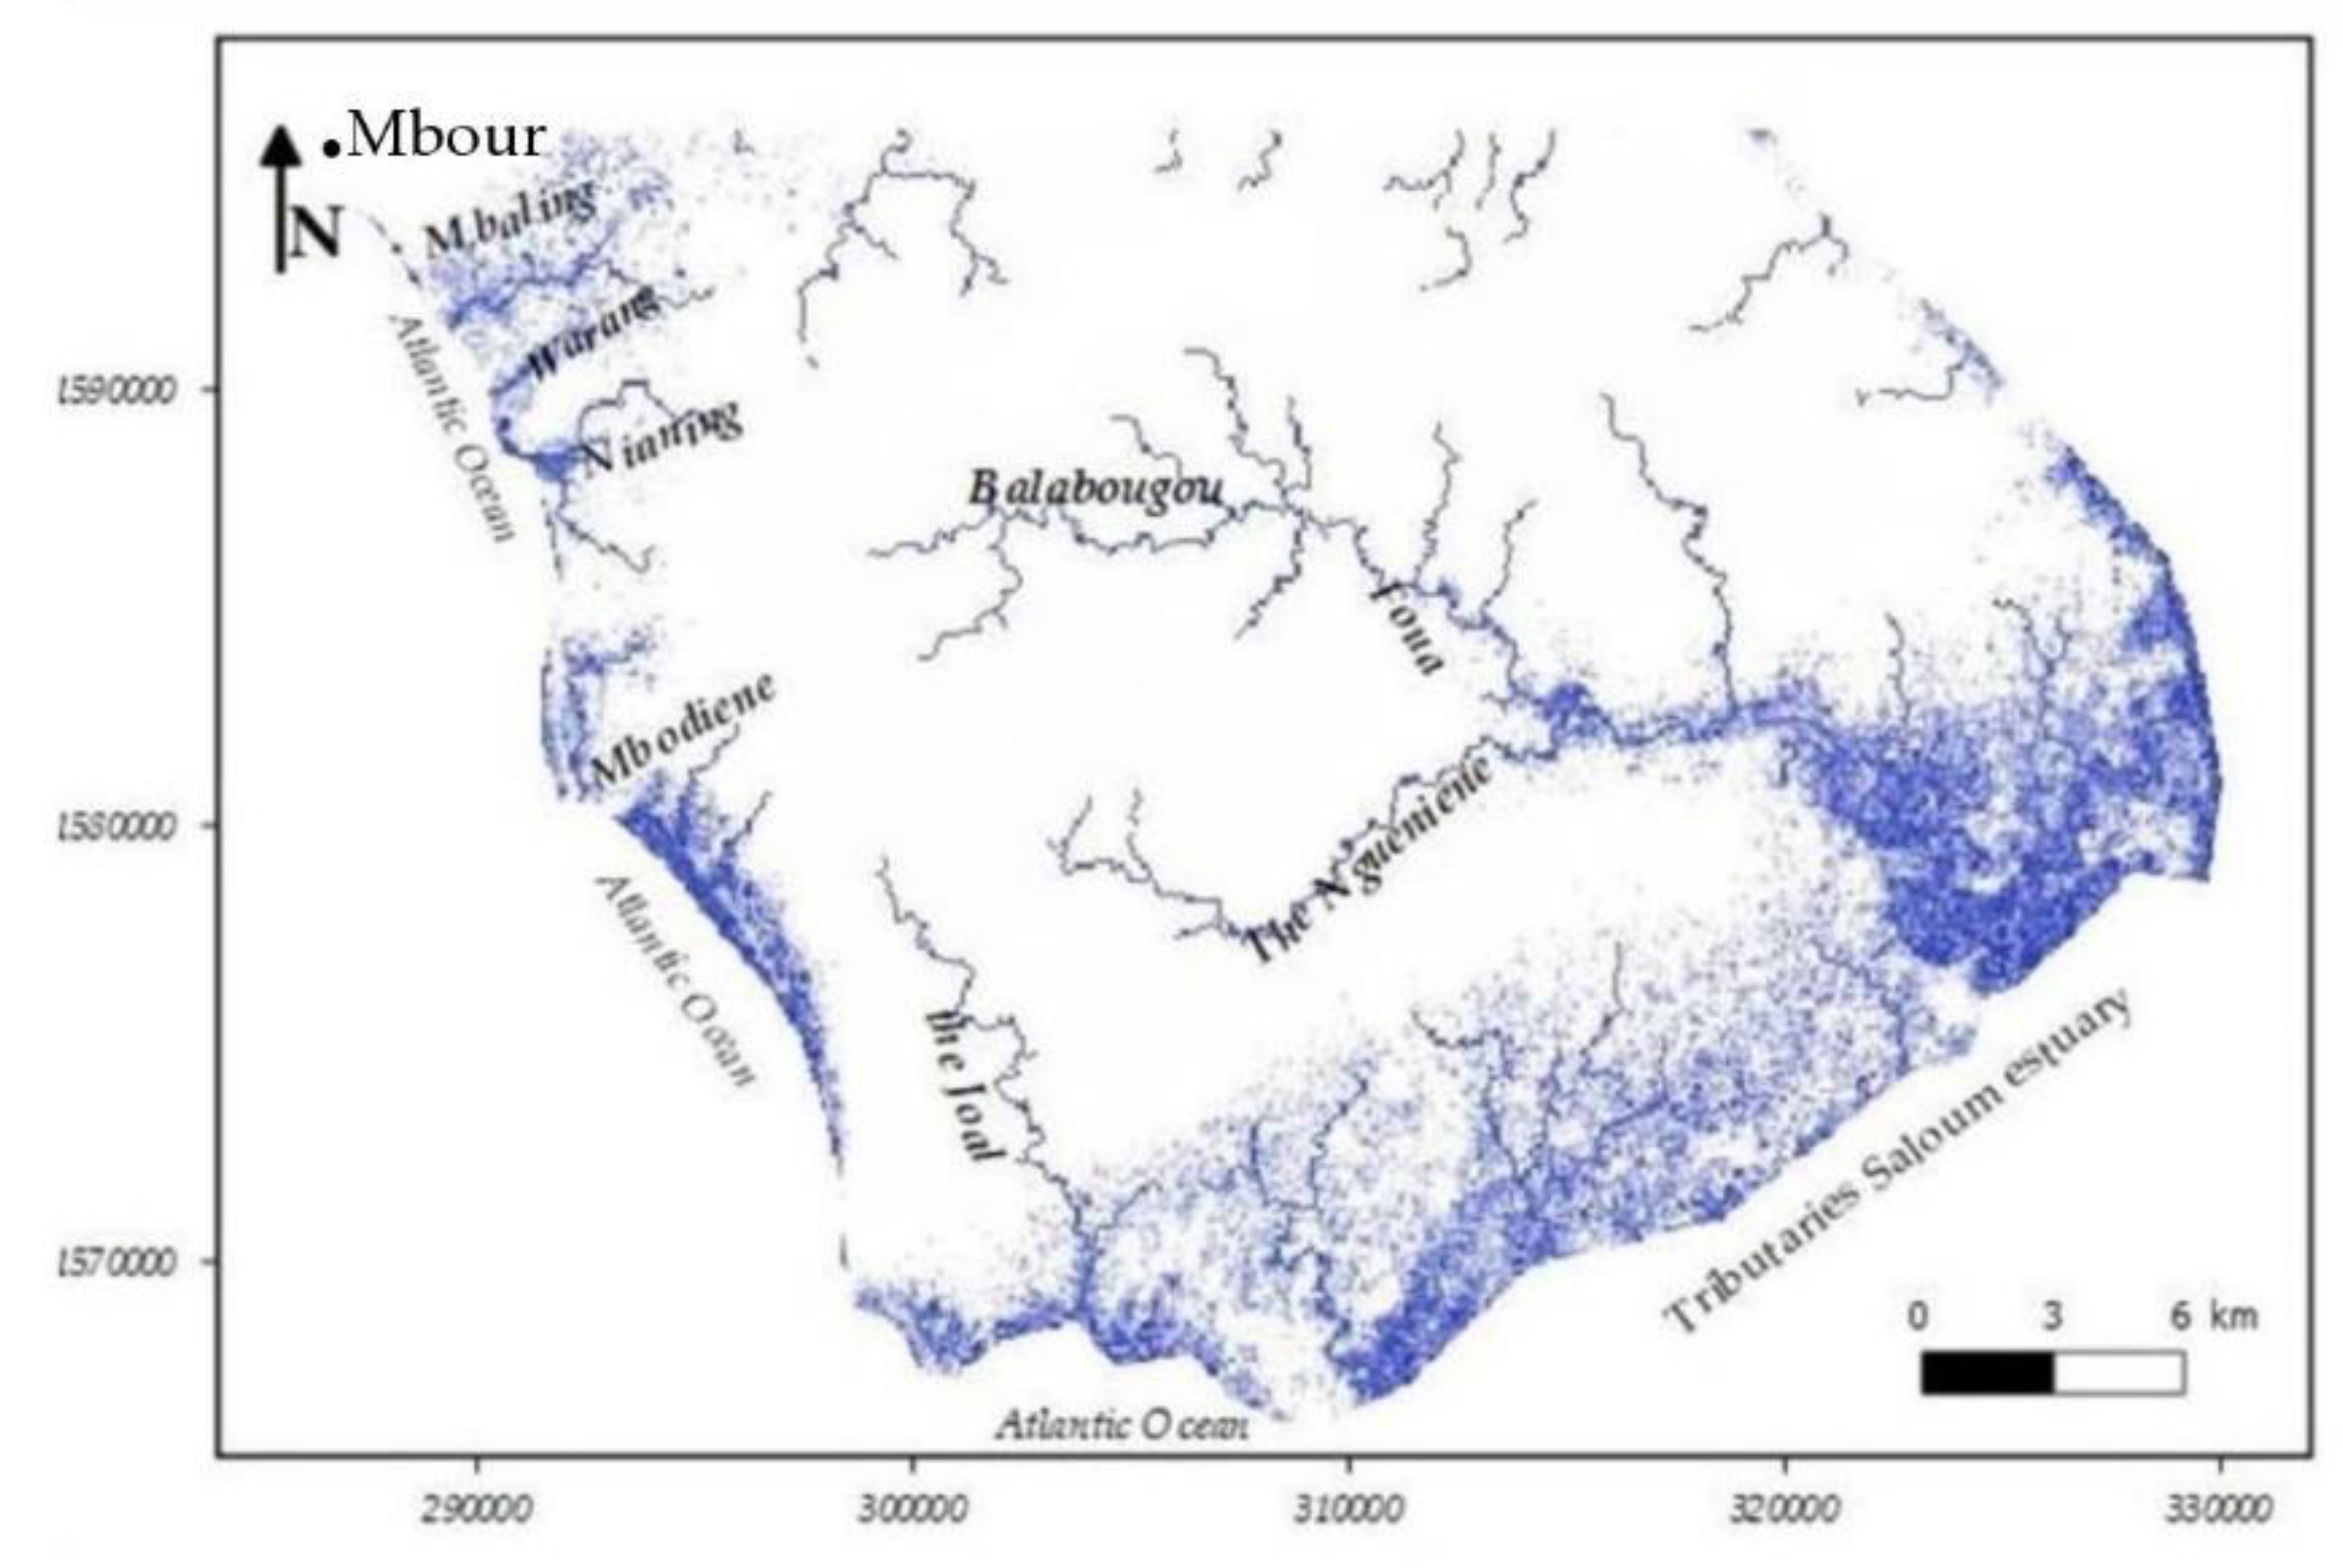
2.3. Hydrographic Network of the Dtudy Area
3. Materials and Methods
3.1. Groundwater Samples Collection and Analysis
3.2. Drinking Water Quality Evaluation
- qi is the rating based on concentration of each parameter
- n is the number of parameters.
3.3. Irrigation Water Quality
4. Results and Discussions
4.1. Hydrogeochemical Characteristics of Groundwater
4.2. Groundwater Suitability for Drinking
Total Hardness (TH)
Total Dissolved Solids (TDS)
Water Quality Index (WQI)
4.3. Groundwater Suitability for Irrigation
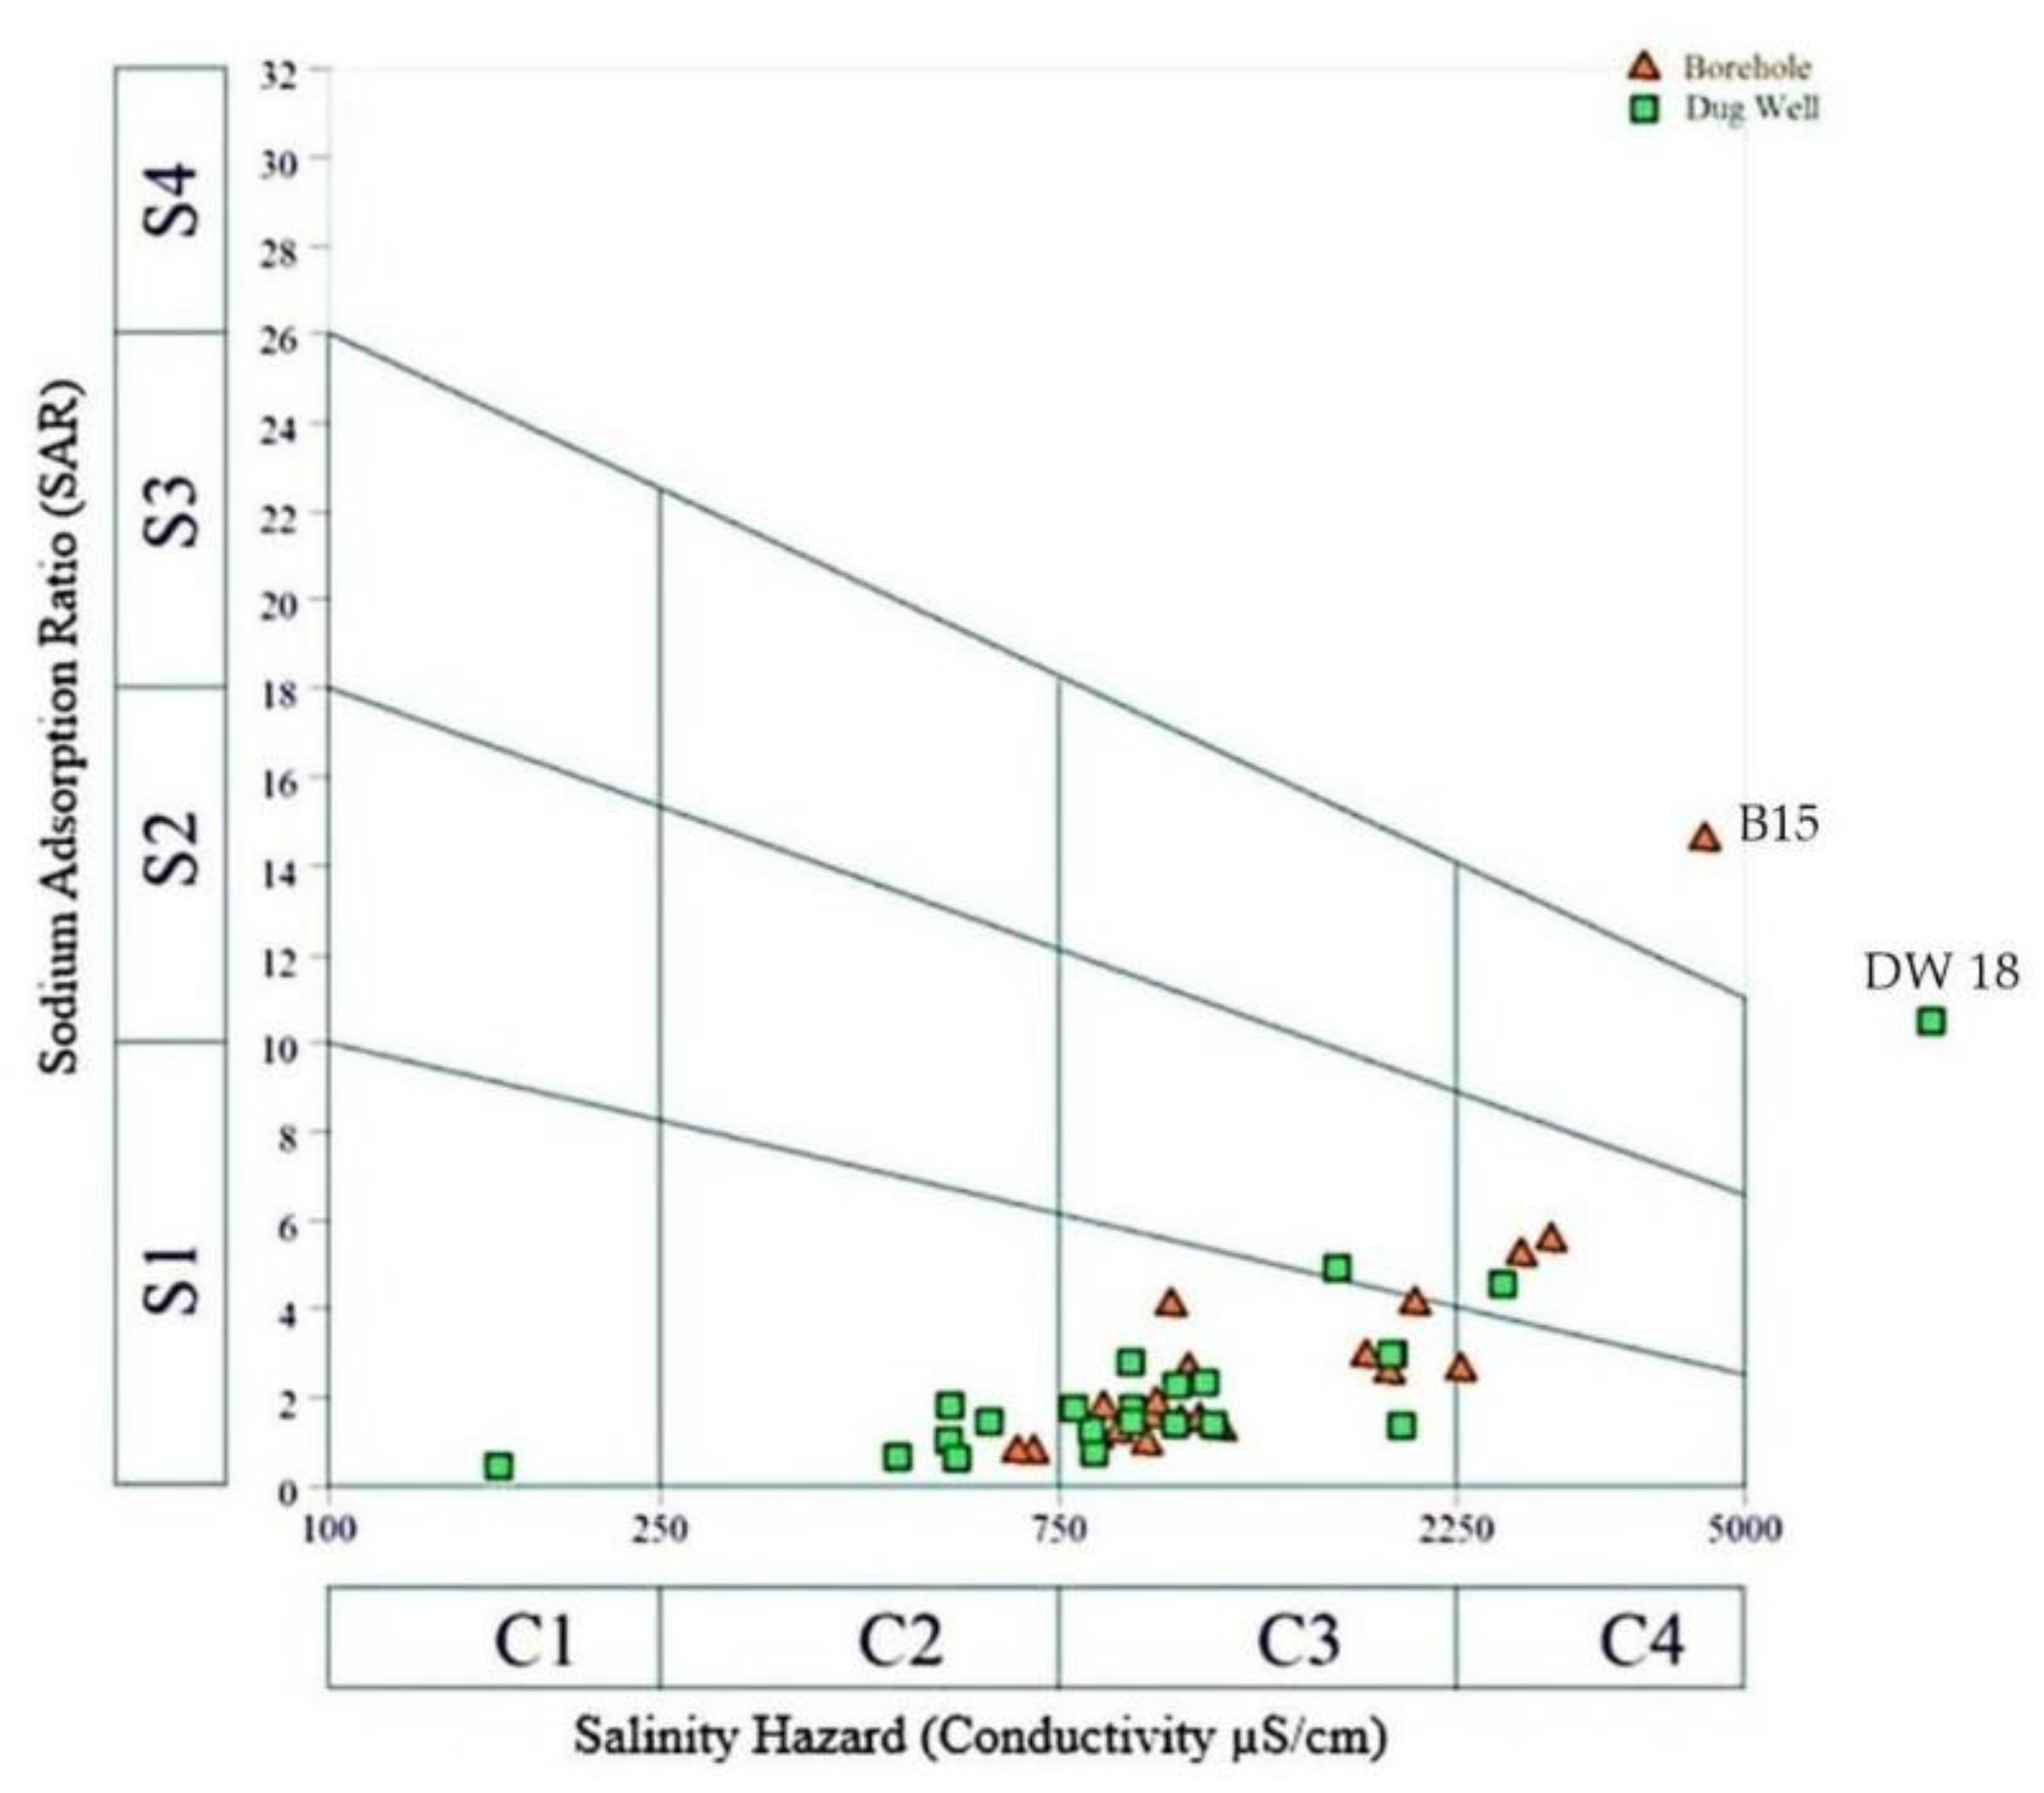
Sodium Adsorption Ratio (SAR)
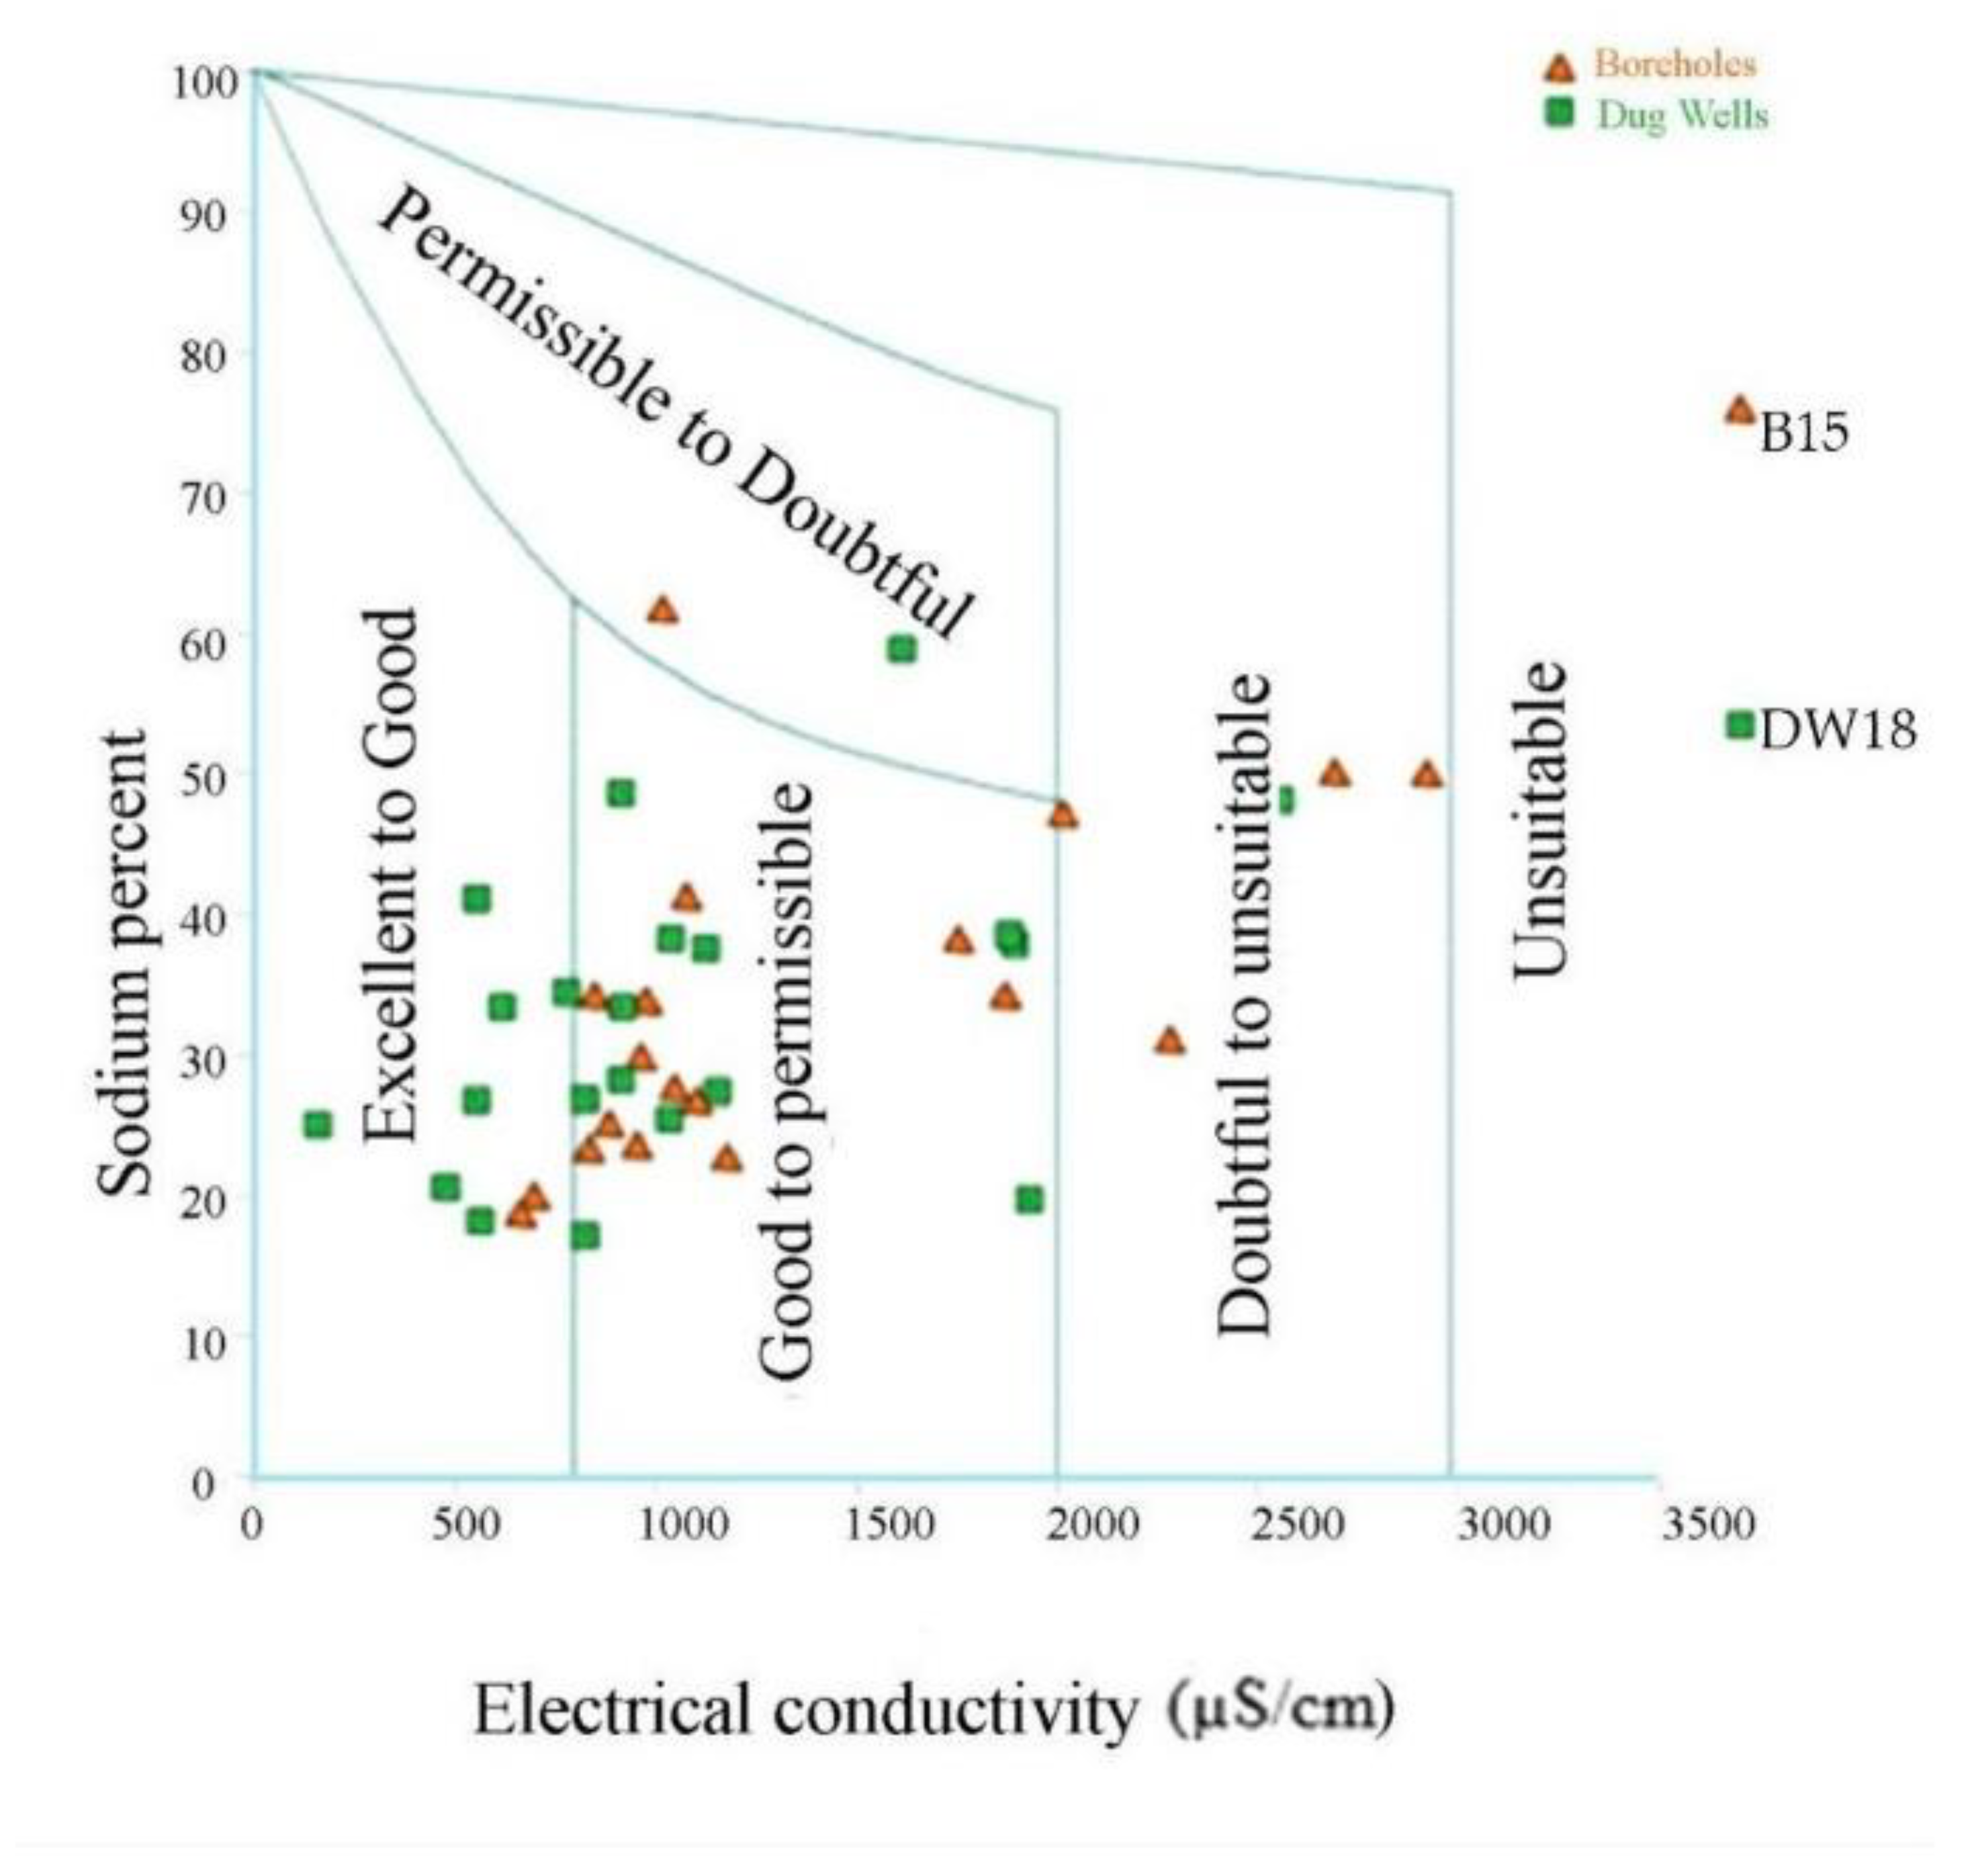
Sodium Percentage (%N)
Residual Sodium Carbonate (RSC).
Permeability Index (PI)
Kelly Ratio (KR)
Magnesium Ratio (MR)
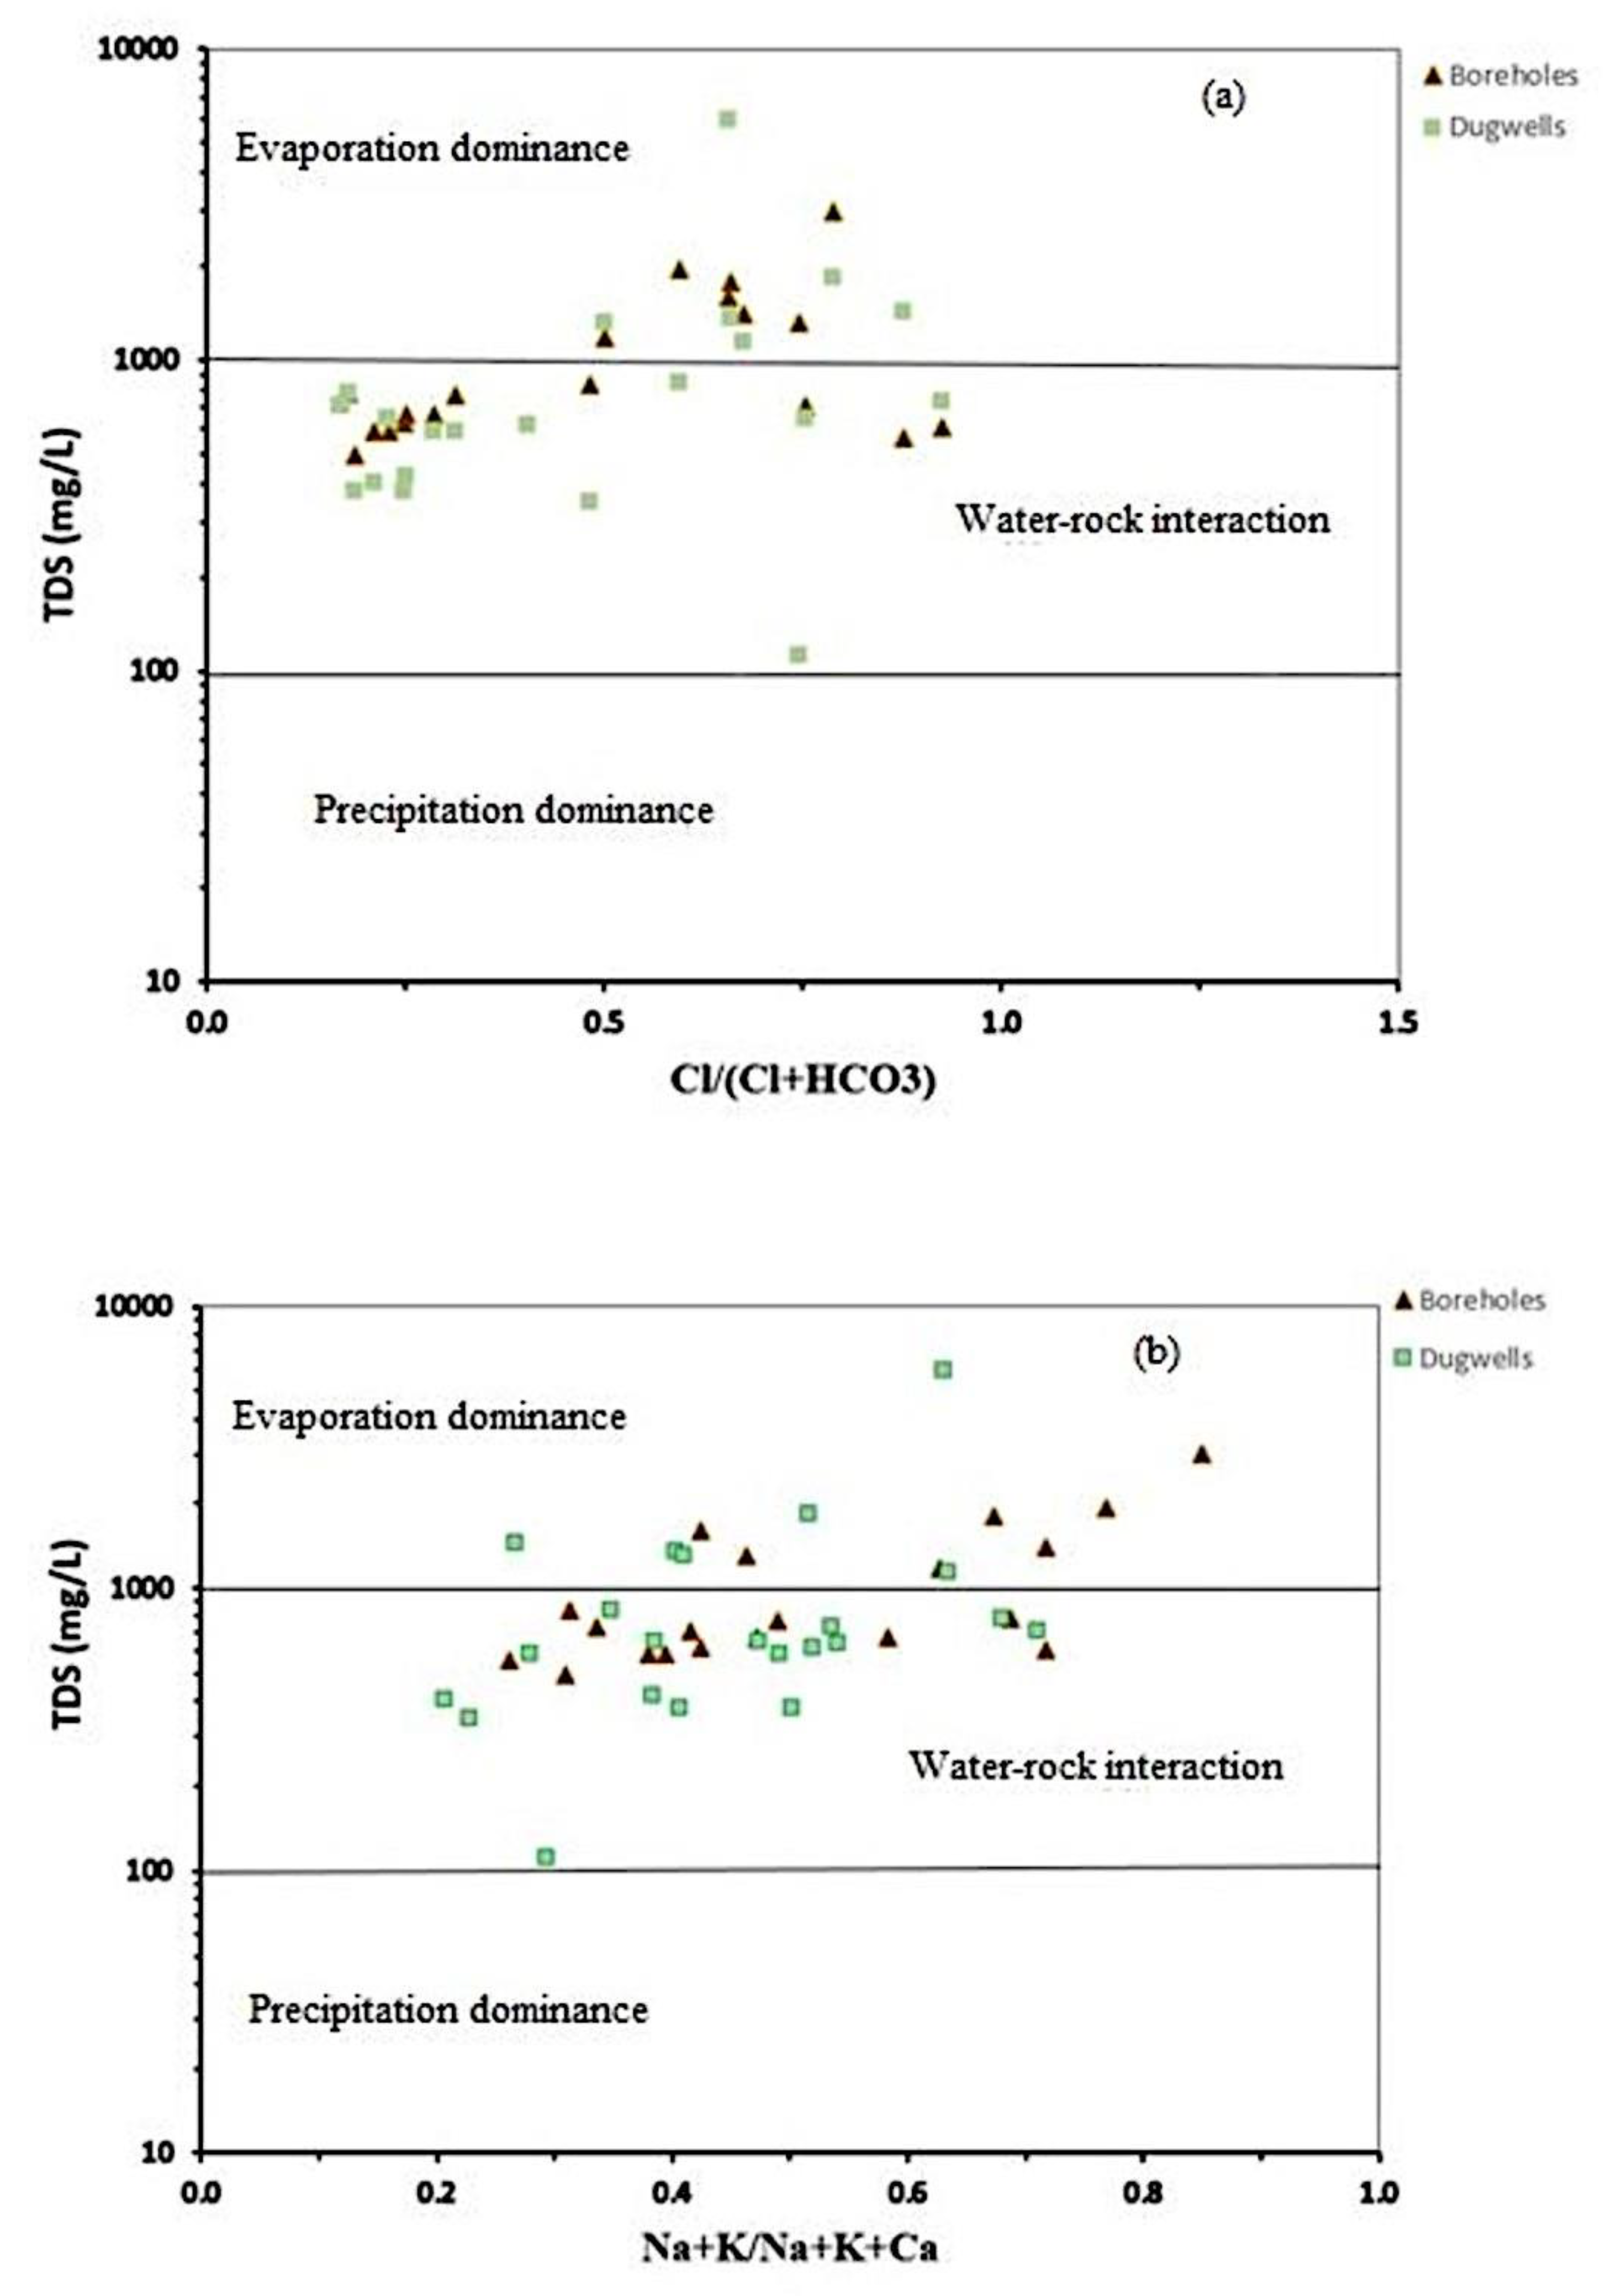
4.4. Mechanisms Controlling Groundwater Chemistry
Hydrochemical Facies
5. Conclusions
Acknowledgments
References
- Pointet, T. The United Nations World Water Development Report 2022 on Groundwater, a Synthesis. LHB 2022, 108, 2090867. [Google Scholar] [CrossRef]
- Nickson, R.T.; McArthur, J.M.; Shrestha, B.; Kyaw-Nyint, T.O.; Lowry, D. Arsenic and other drinking water quality issues, Muzaffargarh District, Pakistan. Appl Geochem. 2005, 55–68. [Google Scholar] [CrossRef]
- Amiri, V.; Sohrabi, N.; Dadgar, M.A. Evaluation of groundwater chemistry and its suitability for drinking and agricultural uses in the Lenjanat plain, central Iran. Environ Earth Sci. 2015, 74, 6163–6176. [Google Scholar] [CrossRef]
- Krishna Kumar, S.; Chandrasekar, N.; Seralathan, P.; Godson, P.S.; Magesh, N.S. Hydrogeochemical study of shallLow carbonate aquifers, Rameswaram Island, India. Environ Monit Assess. 2011. [Google Scholar] [CrossRef] [PubMed]
- Subramani, T.; Elango, L.; Damodarasamy, S.R. Groundwater quality and its suitability for drinking and agricultural use in Chithar River basin, Tamil Nadu, India. Environ. Geol. 2005, 47, 1099–1110. [Google Scholar] [CrossRef]
- Sharma, D.A.; Rishi, M.S.; Keesari, T. Evaluation of groundwater quality and suitability for irrigation and drinking purposes in southwest Punjab, India using hydrochemical approach. Appl Water Sci. 2016. [Google Scholar] [CrossRef]
- Adimalla, N.; Dhakate, R.; Kasarla, A.; Taloor, A.K. Appraisal of groundwater quality for drinking and irrigation purposes in central Telangana, India. Groundwater for Sustainable Developpment, 2020.
- Sarr, B. Etude hydrogéologique de la région de Joal-Fadiouth (Sénégal). Thèse 3ème cycle. Univ. C. A. Diop, Dakar, 192p. 1982.
- Travi, Y. Hydrogéologie et hydrochimie des aquifères du Sénégal. Hydrogéochimie du fluor dans les eaux souterraines. Strasbourg: Institut de Géologie – Université Louis-Pasteur, 1993. pp. 3-158. (Sciences Géologiques. Mémoire, 95).
- Saint Marc, P.; Sarr, R. Precisions biostratigraphiques et paleoenvironnementales sur Ie sommet du Paleocene et la base de l'Eocene de la region de Mbour-Joal (Senegal). J. Afr. Earth Sci. 1984, 2, 203–207. [Google Scholar]
- Tine, A.K.; Ba, M.I.; Gladima–Siby, A.S.; Essouli, O.F.; Faye, A.; Sarr, B. Réactualisation de la situation hydrogéologique des aquifères du maastrichtien et du paléocèene de la region de Mbour, Sénégal. J. Des Sci. Technol. 2011, 9, 23–32. [Google Scholar]
- Hounslow, A.W. Water quality data analysis and interpretation. CRC Press, Florida. 1995. [Google Scholar]
- Ramakrishnaiah, C.R.; Sadashivaiah, C.; Ranganna, G. Assessment of Water Quality Index for the Groundwater in Tumkur Taluk, Karnataka State, India. E-J. Chem. 2009, 6, 523–530. [Google Scholar] [CrossRef]
- Vasanthavigar, M.; Srinivasamoorthy, K.; Vijayaragavan, K.; Rajiv Ganthi, R.; Chidambaram, S.; Anandhan, P.; Manivannan, R.; Vasudevan, S. Application of water quality index for groundwater quality assessment: Thirumanimuttar sub-basin, Tamilnadu, India. Environ Monit Assess. 2010, 171, 595–609. [Google Scholar] [CrossRef]
- Sajil Kumar, P.J.; Elango, L.; James, E.J. Assessment of hydrochemistry and groundwater quality in the coastal area of South Chennai, India. Arab J. Geosci. 2013. [Google Scholar] [CrossRef]
- Patel, P.; Raju, N.J.; Reddy, B.C.S. Raja.; Suresh, U.; Gossel, W.; Wycisk, P. Geochemical processes and multivariate statistical analysis for the assessment of groundwater quality in the Swarnamukhi River basin, Andhra Pradesh, India. Environ Earth Sci. 2016, 75, 611. [CrossRef]
- Deepa, S.; Venkateswaran, S. Appraisal of groundwater quality in upper Manimuktha sub basin, Vellar river, Tamil Nadu, India by using Water Quality Index (WQI) and multivariate statistical techniques. Model. Earth Syst. Environ. 2018. [Google Scholar] [CrossRef]
- Talib, M.A.; Tang, Z.; Shahab, A.; Siddique, J.; Faheem, M.; Fatima, M. Hydrogeochemical Characterization and Suitability Assessment of Groundwater: A Case Study in central Sindh Pakistan. Int. J. Environ. Res. Public Health 2019, 16, 886. [Google Scholar] [CrossRef] [PubMed]
- Adimalla, N.; Li, P.; Venkatayogi, S. Hydrogeochemical Evaluation of Groundwater Quality for Drinking and Irrigation Purposes and Integrated Interpretation with Water Quality Index Studies Environ. Process 2018. [Google Scholar]
- Varol, S.; Davraz, A. Evaluation of the groundwater quality with WQI (Water Quality Index) and multivariate analysis: a case study of the Tefenni plain (Burdur/Turkey). Environ Earth Sci. 2014. [Google Scholar] [CrossRef]
- Arulbalaji, P.; Gurugnanam, B. Groundwater quality assessment using geospatial and statistical tools in Salem District, Tamil Nadu, India. Appl Water Sci. 2016. [Google Scholar] [CrossRef]
- Boateng, T.K.; Opoku, F.; Acquaah, S.O.; Akoto, O. Groundwater quality assessment using statistical approach and water quality index in Ejisu-Juaben Municipality, Ghana. Environ. Earth Sci. 2016, 75, 489. [Google Scholar] [CrossRef]
- Chung, S.Y.; Venkatramanan, S.; Kim, T.H.; Kim, D.S.; Ramkumar, T. Influence of hydrogeochemical processes and assessment of suitability for groundwater uses in Busam City, Korea. Environ. Dev. Sustain. 2015, 17, 423–441. [Google Scholar] [CrossRef]
- WHO. Guidelines for Drinking Water Quality., 3rd ed.; WHO: Geneva, Switzerland, 2004. [Google Scholar]
- WHO. Guidelines for Drinking Water Quality., 4th ed.; WHO: Geneva, Switzerland, 2011. [Google Scholar]
- Wilcox, L.V. Classification and Use of Irrigation Water; U.S Department of Agriculture: Washington, DC, USA, 1955; p. 969. [Google Scholar]
- Hem, J.D. Study and interpretation of the chemical characteristics of natural waters, 3rd edn. USGS Water Supply Paper. 1985, 2254, 117–120. [Google Scholar]
- Kumar Singh, A.; Raj, B.; Tiwari, A. k.; Mahato, M.K. Evaluation of hydrogeochemical processes and groundwater quality in the Jhansi district of Bundelkhand region, India. Environ Earth Sci. 2013. [Google Scholar] [CrossRef]
- Hem, J.D. Study and interpretation of the chemical characteristics of natural waters. Book 2254, 3rd edn. Scientific Publishers, Jodhpur, 1991, p 263.
- Sarath Prasanth, S.V.; Magesh, N.S.; Jitheshlal, K.V.; Chandrasekar, N.; Gangadhar, K. Evaluation of groundwater quality and its suitability for drinking and agricultural use in the coastal stretch of Alappuzha District, Kerala, India. Appl Water Sci. 2012, 2, 165–175. [Google Scholar] [CrossRef]
- Adimalla, N.; Venkatayogi, S. Geochemical characterization and evaluation of groundwater suitability for domestic and agricultural utility in semi-arid region of Basara, Telangana State, South India. Appl. Water Sci. 2018, 8, 44. [Google Scholar] [CrossRef]
- Ravikumar, P.; Somashekar, R.K.; Angami, M. Hydrochemistry and evaluation of groundwater suitability for irrigation and drinking purposes in the Markandeya River basin, Belgaum District, Karnataka State, India. Environ. Monit Assess. 2011, 173, 459–487. [Google Scholar] [CrossRef]
- Todd, D.K. Ground Water Hydrology; Wiley: New York, NY, USA, 1980. [Google Scholar]
- Sawyer, G.N.; McMcartly, D.L. Chemistry of Sanitary Engineers, 2nd ed.; McGraw Hill: New York, NY, USA, 1967; p. 518. [Google Scholar]
- Krishna kumar, S.; Logeshkumaran, A.; Magesh, N.S.; Godson, P.S.; Chandrasekar, N. Hydro-geochemistry and application of water quality index (WQI) for groundwater quality assessment, Anna Nagar, part of Chennai City, Tamil Nadu, India. Appl Water Sci. 2015, 5, 335–343. [Google Scholar] [CrossRef]
- Richards, L.A. Diagnosis and improvement of saline alkali soils. US Department of Agriculture, Hand Book, 1954, 60, p 160.
- Kumar, M.; Kumari, K.; Ramanathan, AL.; Saxena, R. A comparative evaluation of groundwater suitability for irrigation and drinking purposes in two intensively cultivated districts of Punjab, India. Environ Geol. 2007, 53, 553–574. [Google Scholar] [CrossRef]
- Arumugam, K.; Elangovan, K. Hydrochemical characteristics and groundwater quality assessment in Tirupur Region, Coimbatore District, Tamil Nadu, India. Environ Geol. 2009, 58, 1509–1520. [Google Scholar] [CrossRef]
- Xiao, J.; Jin, Z.; Wang, J. Assessment of the Hydrogeochemistry and Groundwater Quality of the Tarim River Basin in an Extreme Arid Region, NW China. Environ. Manag. 2014, 53, 135–146. [Google Scholar] [CrossRef]
- Kaur, T.; Bhardwaj, R.; Arora, S. Assessment of groundwater quality for drinking and irrigation purposes using hydrochemical studies in Malwa region, southwestern part of Punjab, India. Appl. Water Sci. 2016. [Google Scholar] [CrossRef]
- Lloyd, J.W.; Heathcote, J.A. Natural Inorganic hydrochemistry in relation to groundwater. Clarendon, Oxford, 1985, p 294.
- Doneen, L.D. Notes on Water Quality in Agriculture; Davis: Water Science and Engineering, University of California, 1964. [Google Scholar]
- Kelley, W.P. Use of saline irrigation water. Soil Sci. 1963, 95, 385–391. [Google Scholar] [CrossRef]
- Palliwal, K.V. Irrigation with Saline Water; ICARI Monograph No.2: New Delhi, India, 1972; p. 198. [Google Scholar]
- Gibbs, R.J. Mechanism controlling world water chemistry. Science 1970, 170, 1088–1090. [Google Scholar] [CrossRef] [PubMed]
- Li, P.; Wu, J.; Qian, H. Hydrochemical appraisal of groundwater quality for drinking and irrigation purposes and the major influencing factors: a case study in and around Hua County, China. Arab J. Geosci. 2016, 9, 15. [Google Scholar] [CrossRef]
- Krishna Kumar, S.; Rammohan, V.; Dajkumar Sahayam, J.; Jeevanandam, M. Assessment of groundwater quality and hydrogeochemistry of Manimuktha River basin, Tamil Nadu, India. Environ Monit Assess. 2009, 159, 341–351. [Google Scholar] [CrossRef]
- Yang, Q.; Li, Z.; Ma, H.; Wang, L.; Martín, J.D. Identification of the hydrogeochemical processes and assessment of ground water quality using classic integrated geochemical methods in the Southeastern part of Ordos’s basin, China. Environ. Pollut. 2016. [Google Scholar] [CrossRef]
- Sami, K. Recharge mechanisms and geochemical processes in a semi-arid sedimentary basin, Eastern Cape, South Africa. J. Hydrol. 1992, 139, 27–48. [Google Scholar] [CrossRef]
- Singh, A.K.; Mondal, G.C.; Singh, T.B.; Singh, S.; Tewary, B.K.; Sinha, A. Hydrogeochemical processes and quality assessment of groundwater in Dumka and Jamtara districts, Jharkhand, India. Environ Earth Sci. 2012, 67, 2175–2191. [Google Scholar] [CrossRef]
- Fisher, R.S.; Mulican, W.F. Hydrochemical evolution of sodium–sulphate and sodium–chloride groundwater beneath the Northern Chihuahuan desert, Trans-Pecos, Texas, USA. Hydrogeol J. 1997, 10, 455–474. [Google Scholar]
- Piper, A.M. A graphical procedure in the geochemical interpretation of water analysis. Trans. Am. Geophys. Union 1944, 25, 914–928. [Google Scholar]
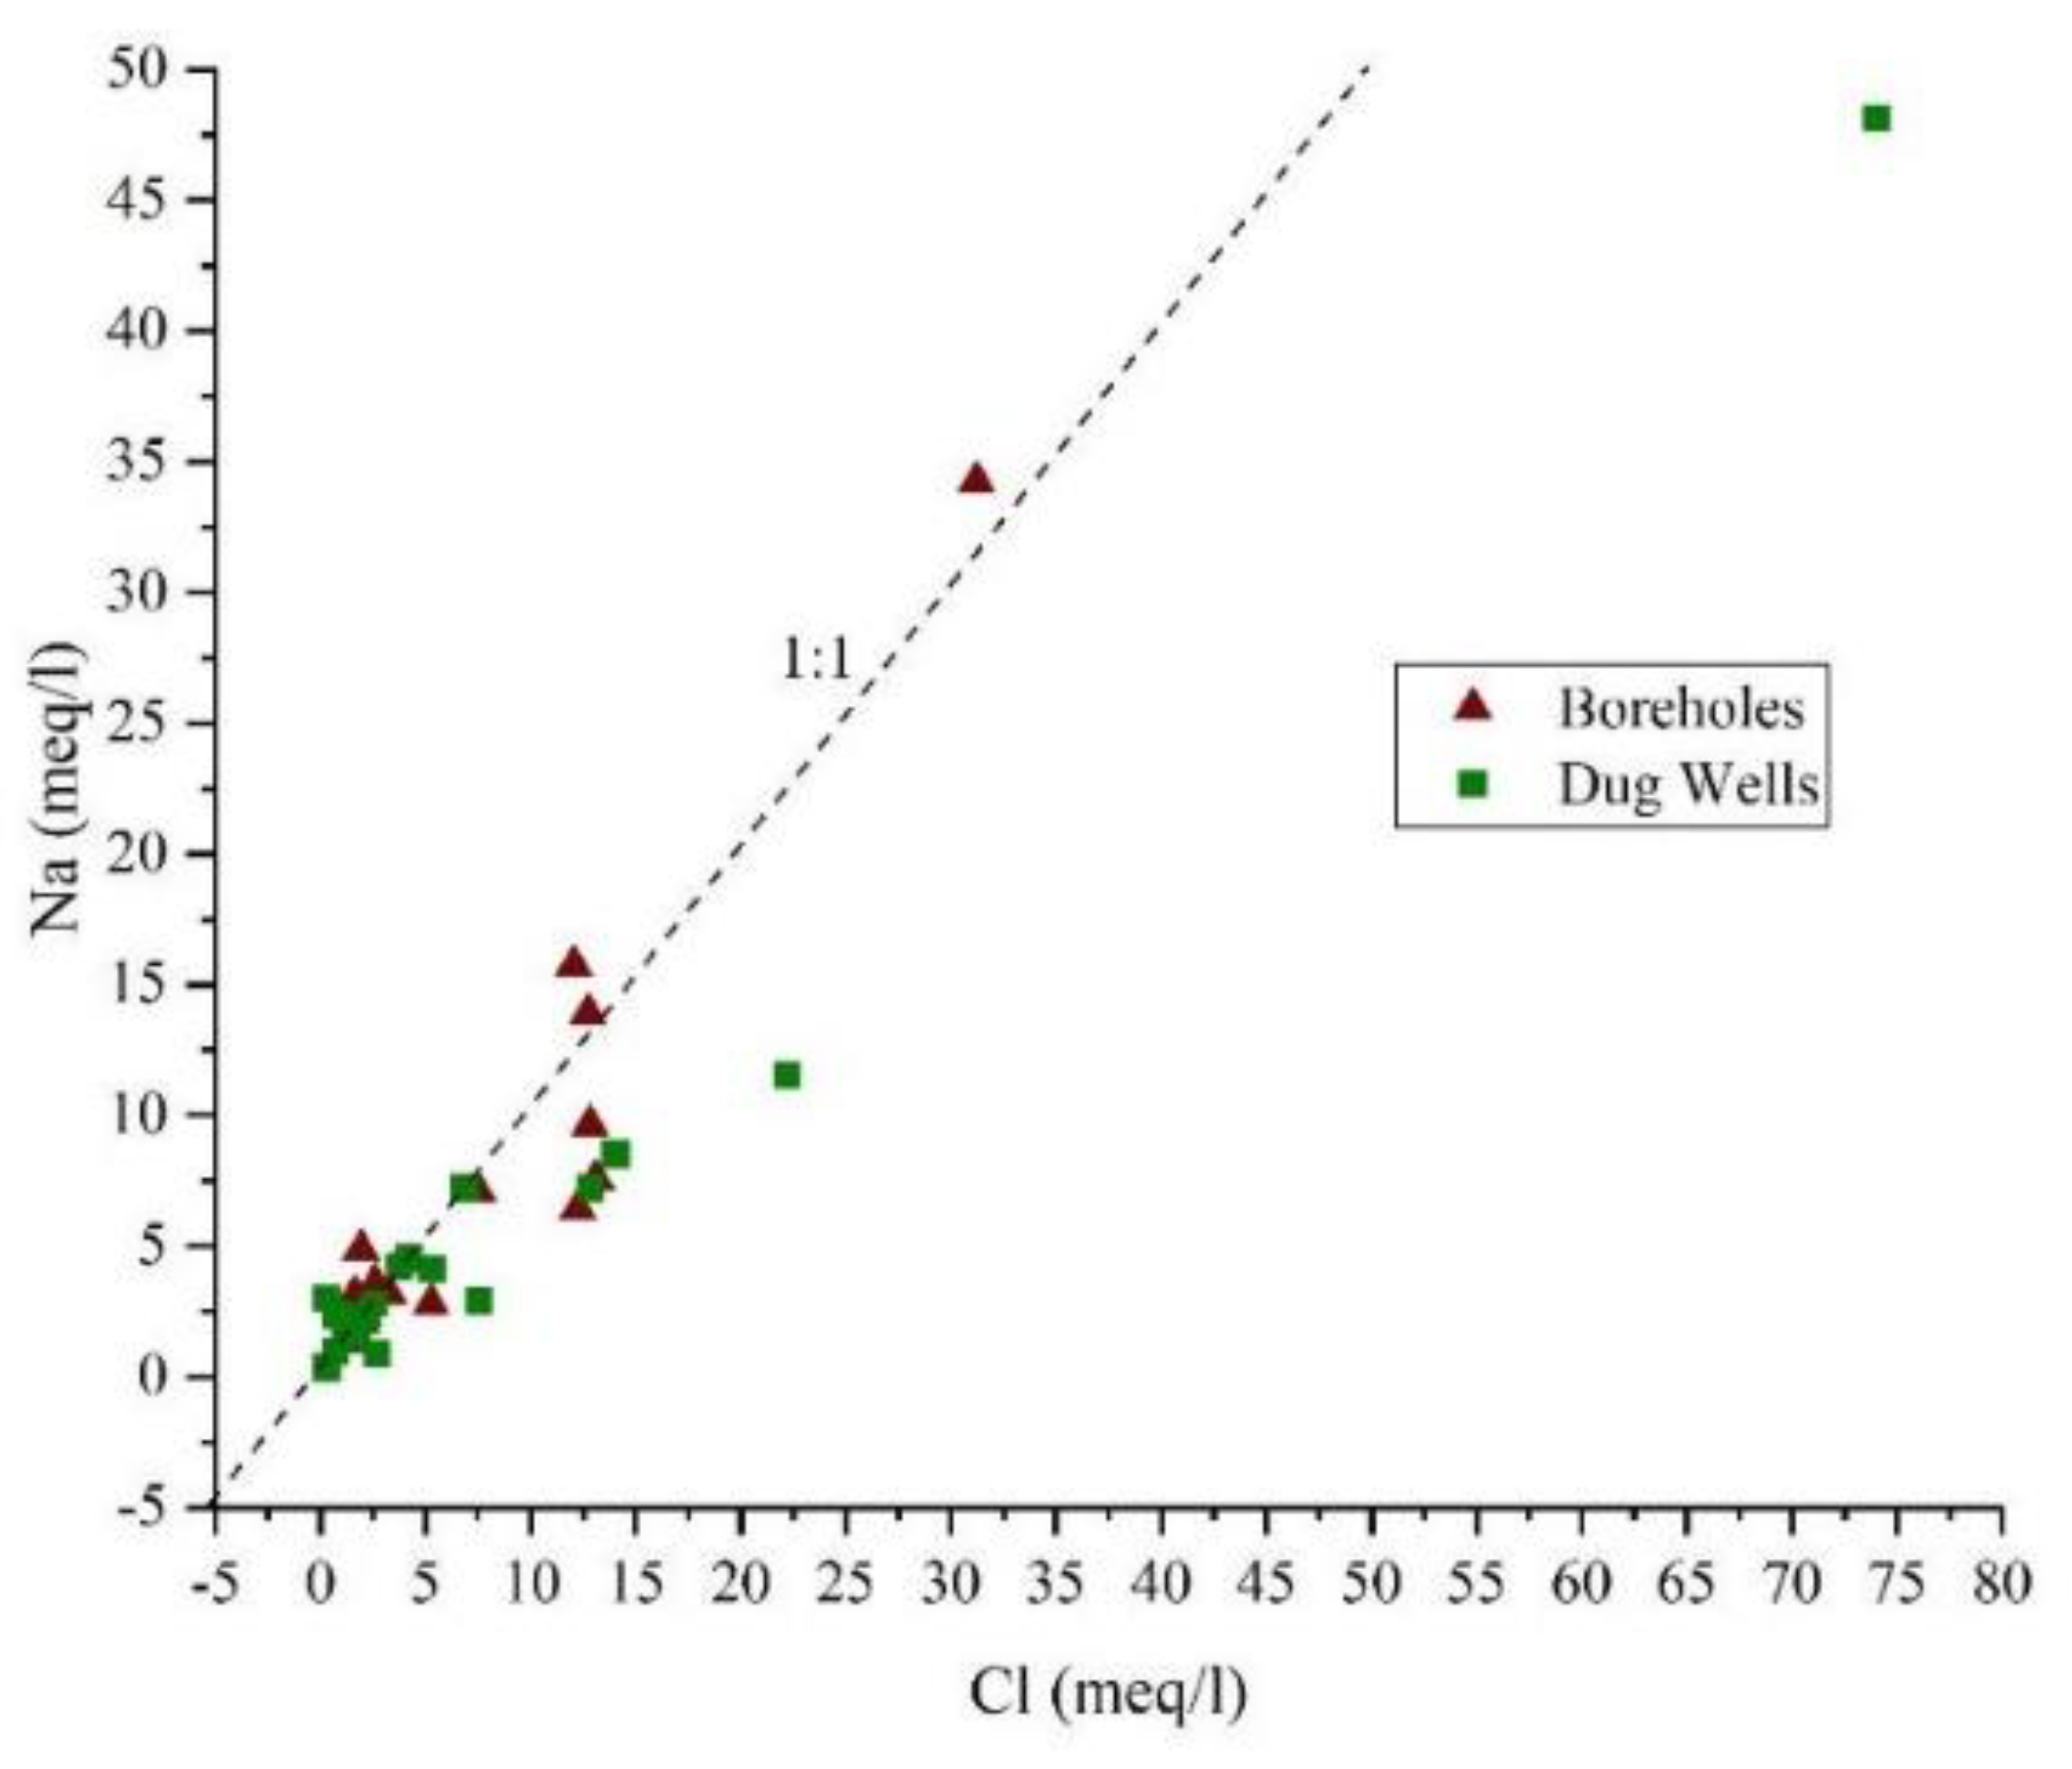
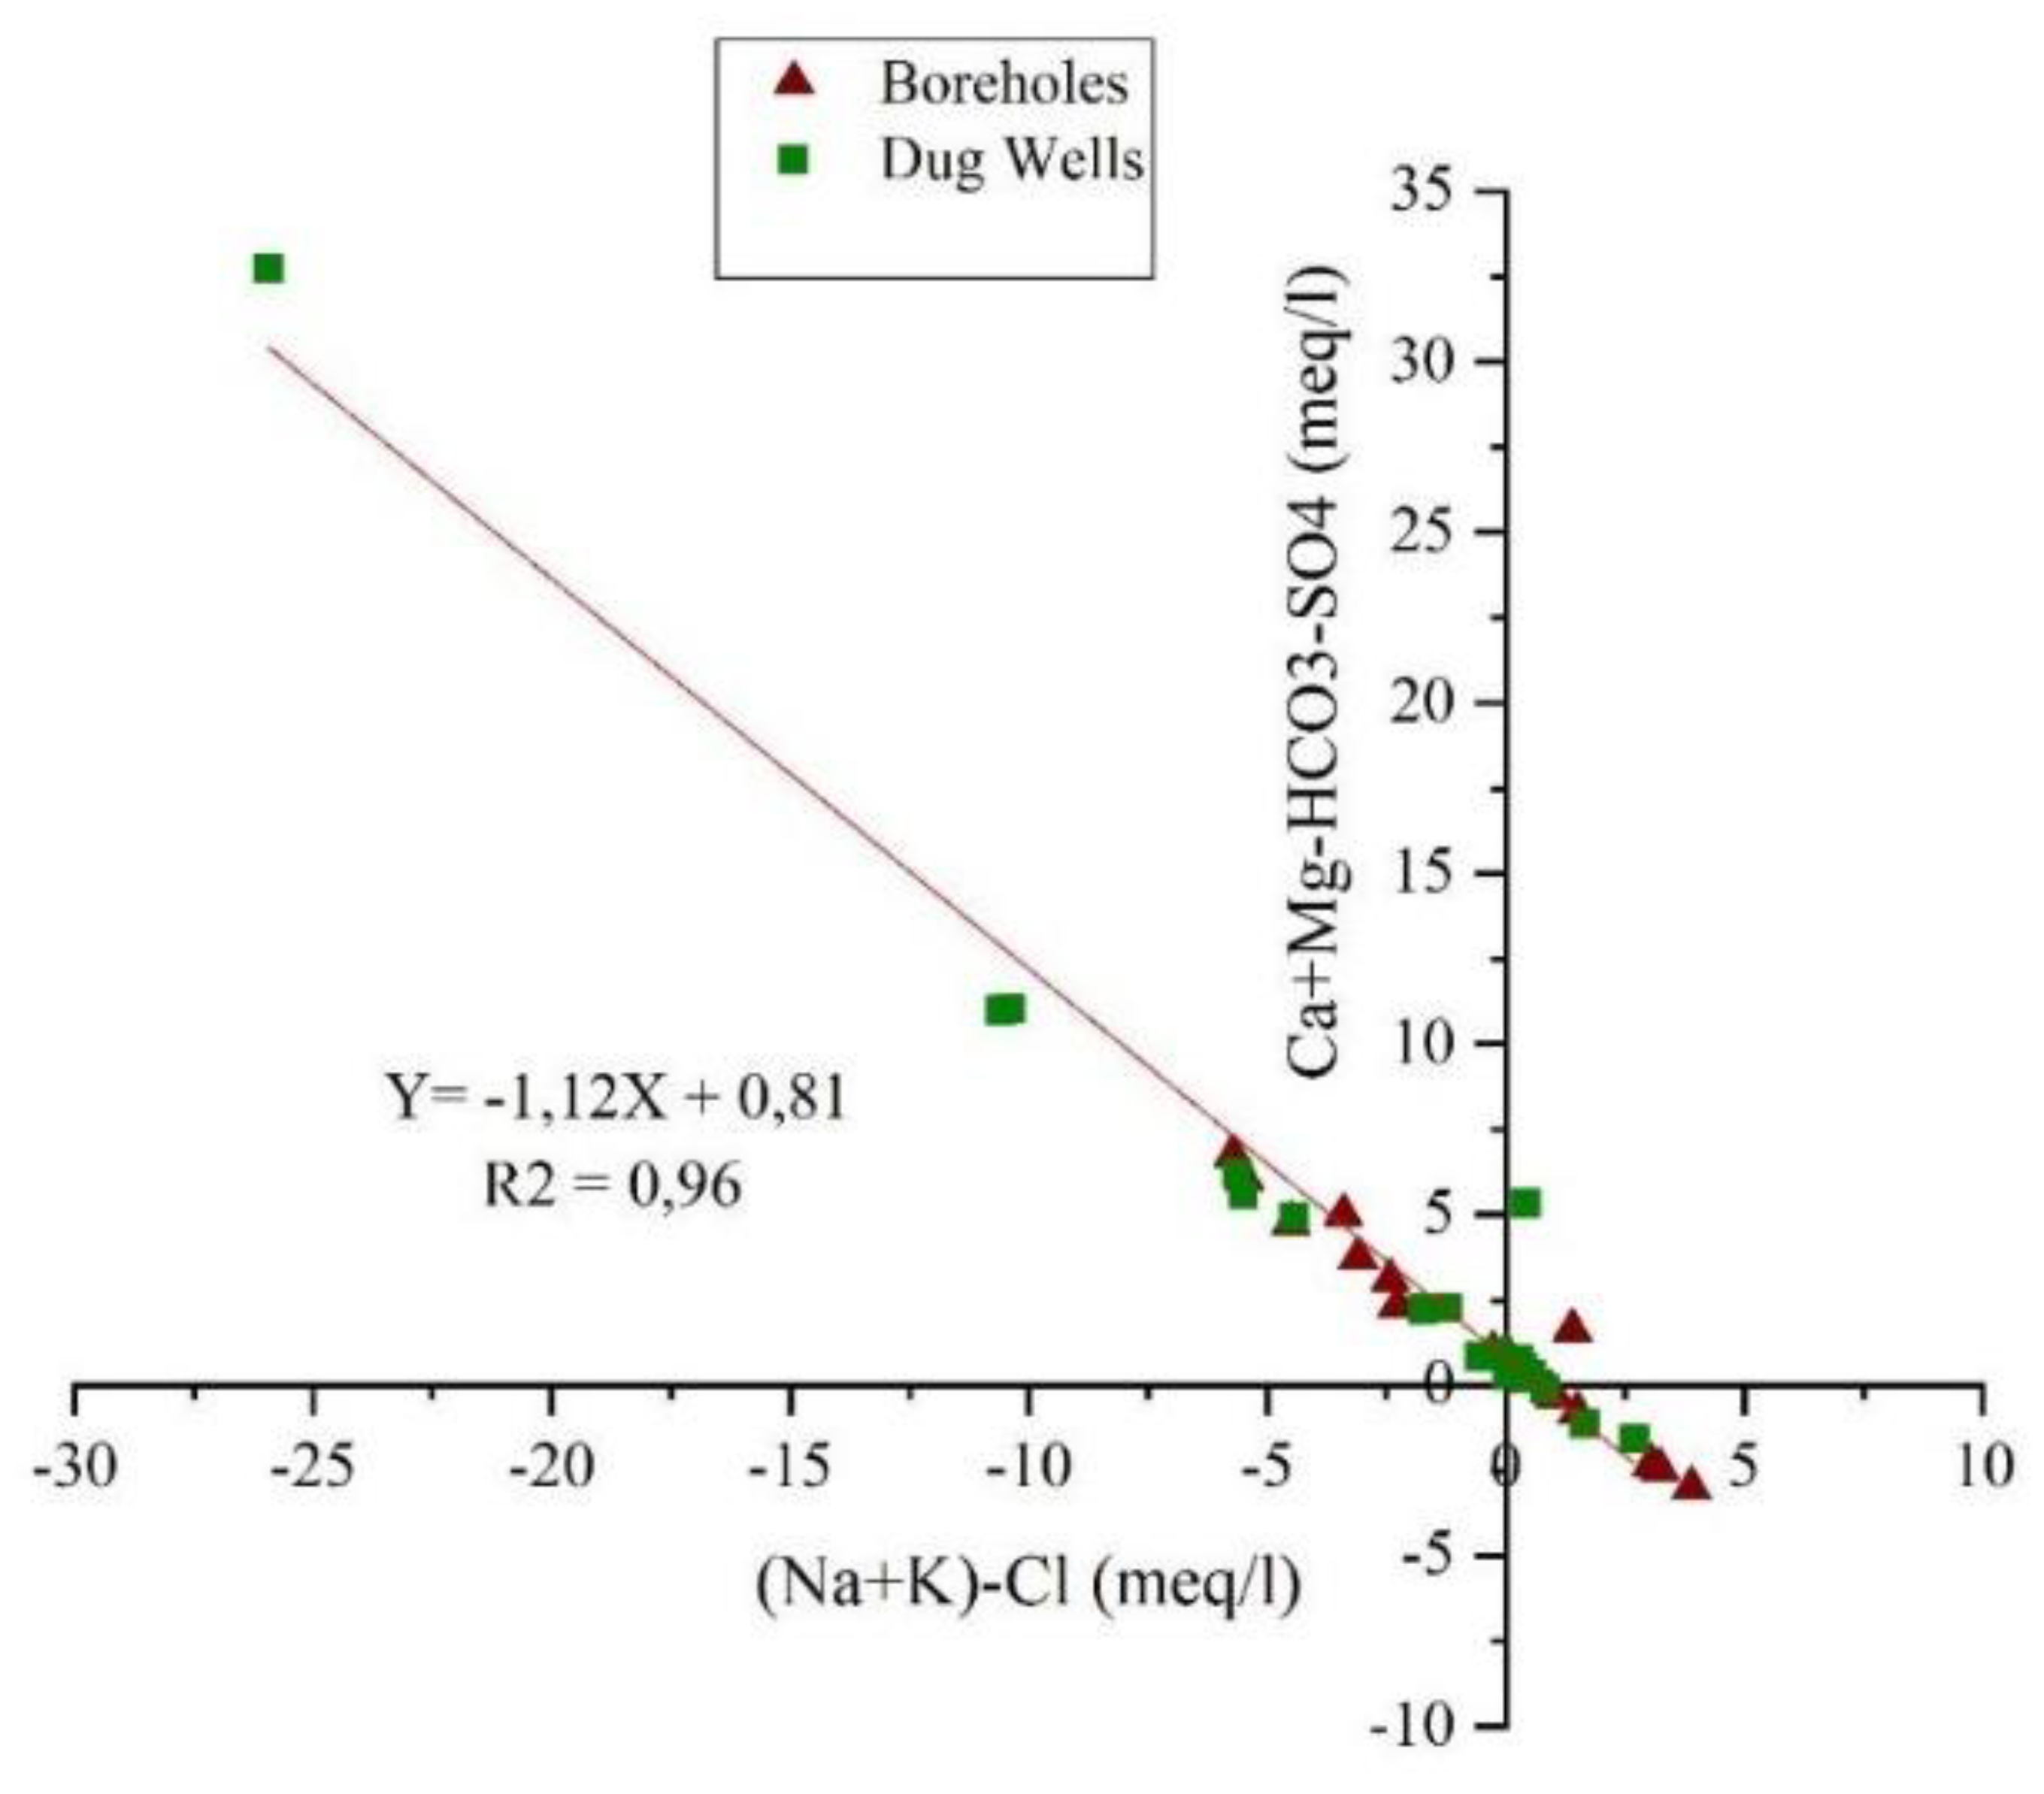
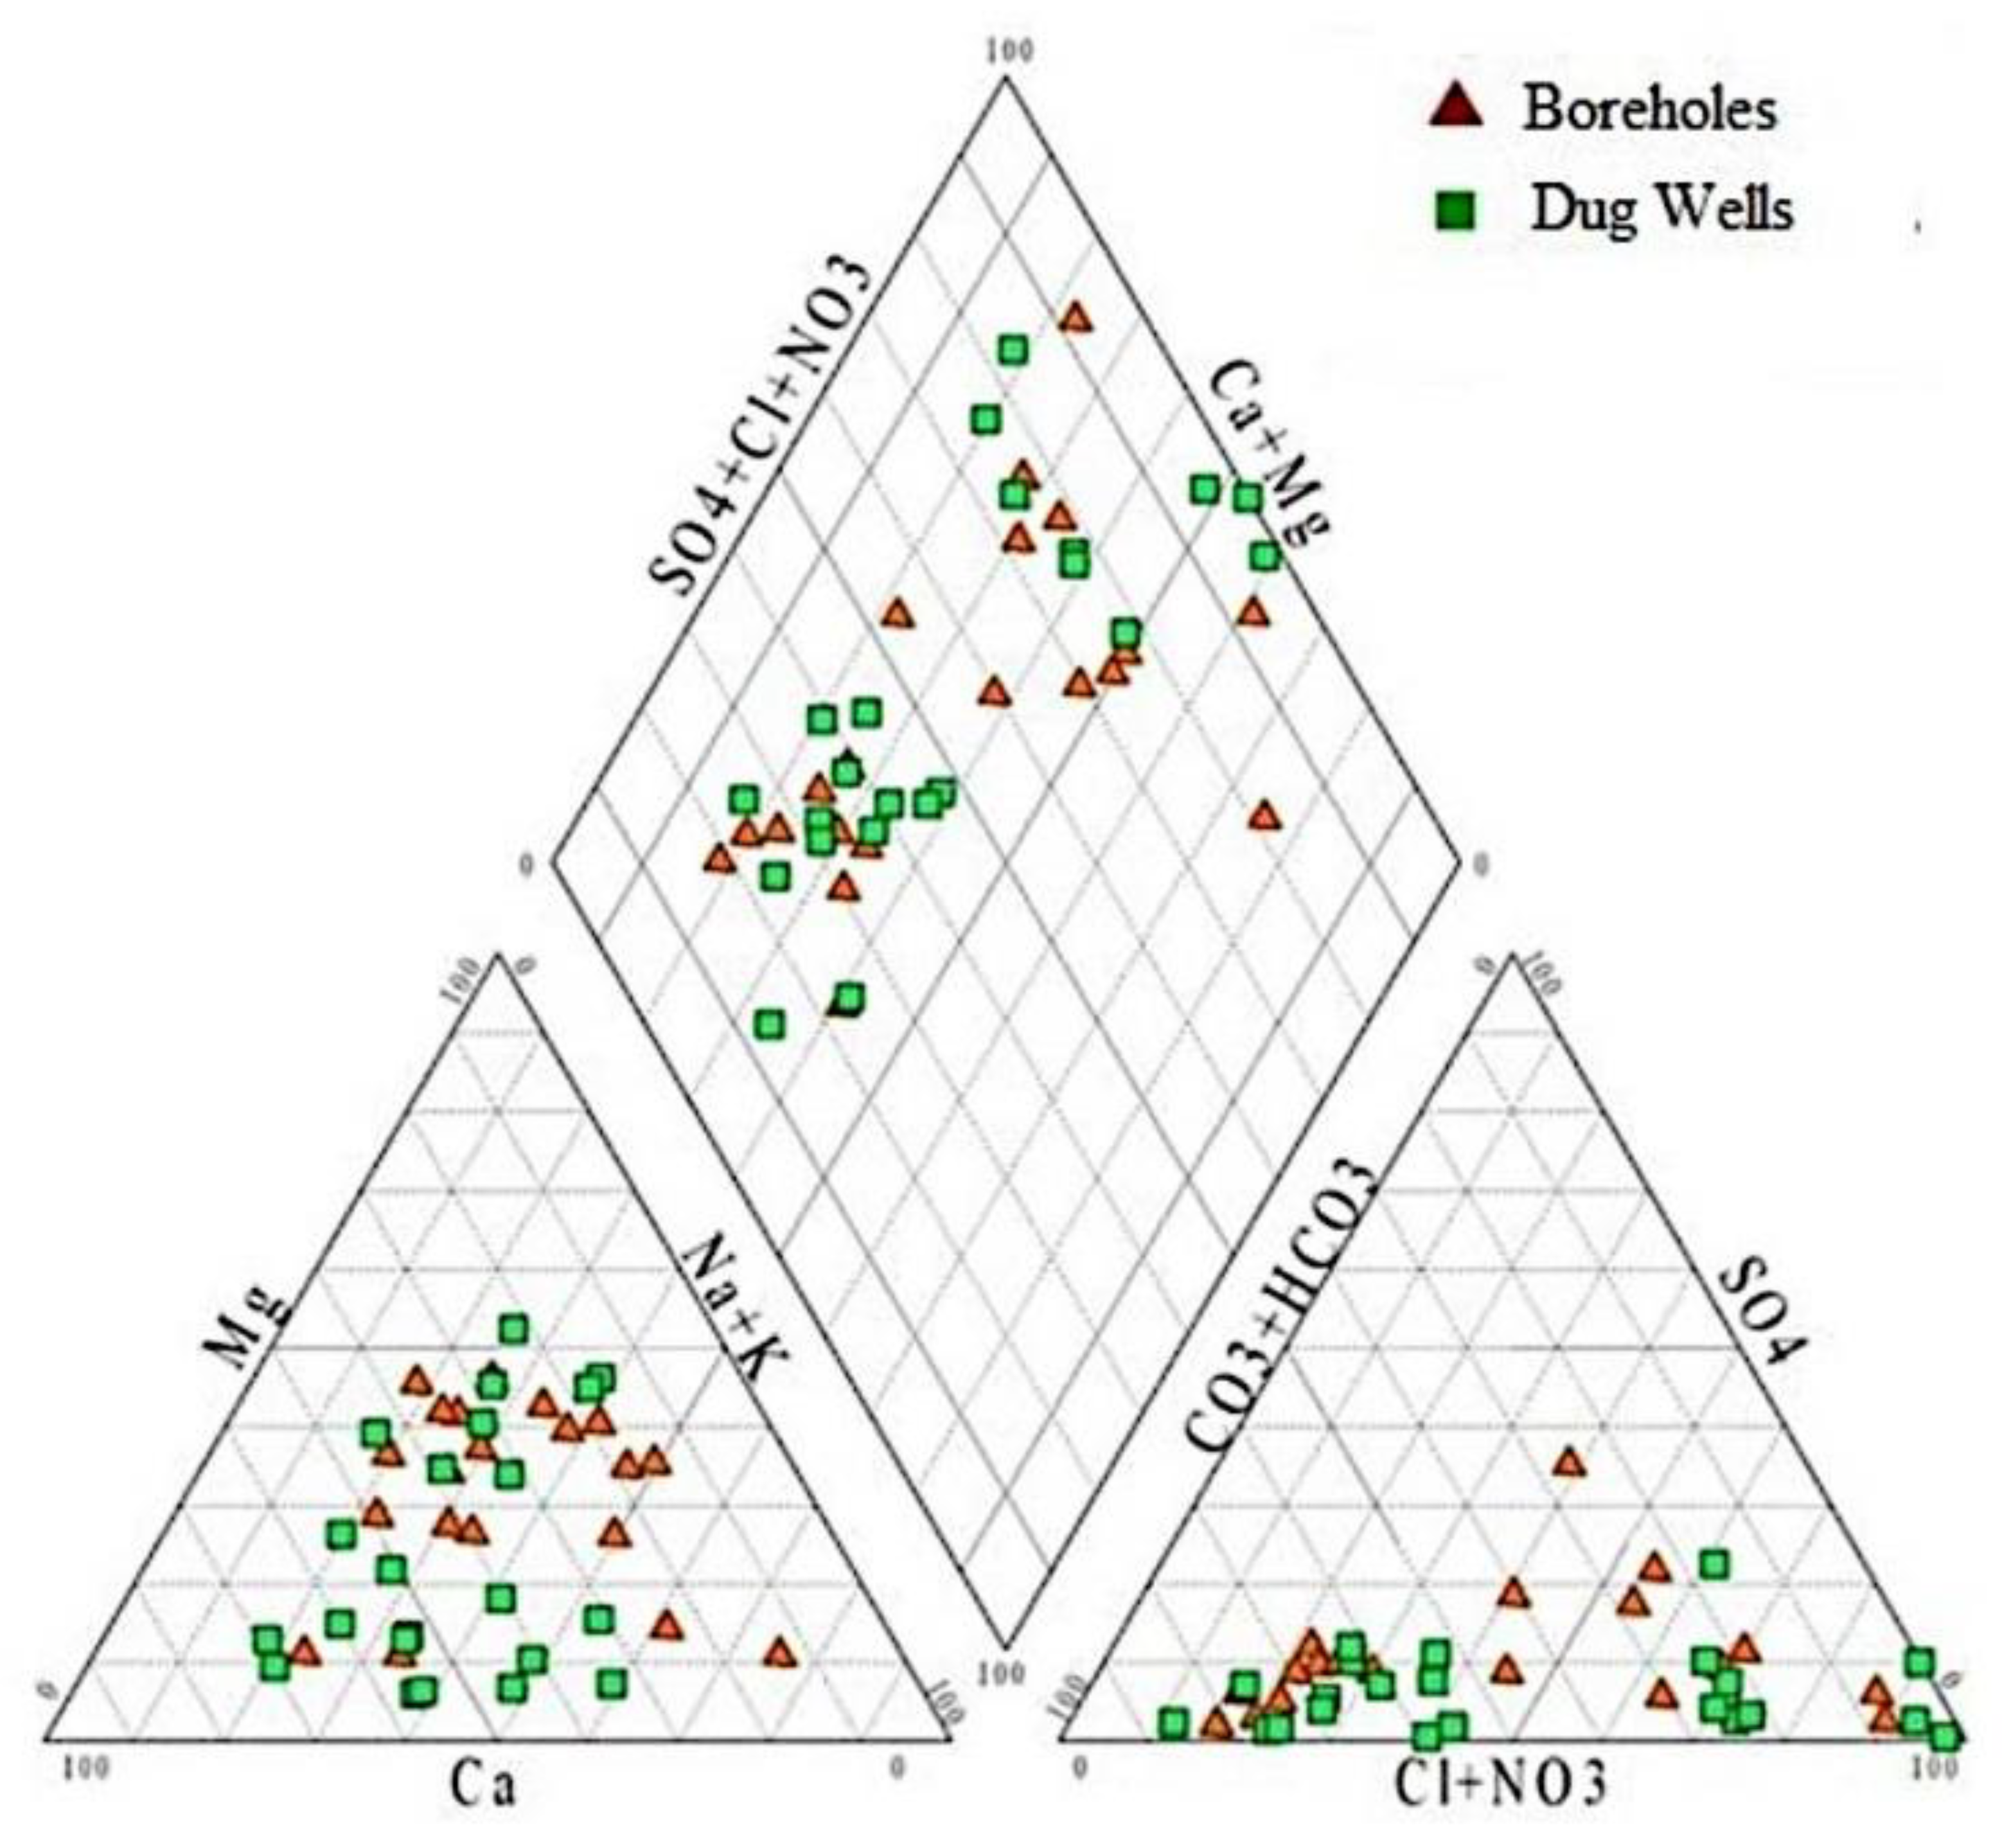
| Chemical Parameters | WHO Standard [24,25] | Weight (wi) | Relative Weight (Wi) |
|---|---|---|---|
| pH (-) | 6.5 - 8.5 | 3 | 0.073 |
| TDS (mg/l) | 1000 | 5 | 0.122 |
| TH (mg/l) | 500 | 4 | 0.098 |
| Ca2+ (mg/l) | 75 | 3 | 0.073 |
| Mg2+ (mg/l) | 50 | 3 | 0.073 |
| Na+ (mg/l) | 200 | 2 | 0.049 |
| K+ (mg/l) | 12 | 2 | 0.049 |
| HCO3- (mg/l) | 500 | 1 | 0.024 |
| SO42- (mg/l) | 250 | 4 | 0.098 |
| Cl- (mg/l) | 250 | 4 | 0.098 |
| NO3- (mg/l) | 50 | 5 | 0.122 |
| F- (mg/l) | 1.5 | 5 | 0.122 |
| 1 |
| Water Quality Parameters | Min. | Max. | Mean | Median | Standard Deviation | WHO Standard Limit [25] | Number of Samples Exceeding Allowable Limits | Percentage of Samples Exceeding Allowable Limits |
|---|---|---|---|---|---|---|---|---|
| pH (-) | 7.1 | 8.2 | 7.6 | 7.6 | 0.2 | 6.5 – 8.5 | 0 | 0 |
| EC (µS/cm) | 167 | 8880 | 1518 | 1065 | 1421 | 1500 | 13 | 31 |
| TDS (mg/L) | 112 | 5950 | 1017 | 714 | 952 | 500 | 35 | 83 |
| Ca2+ (mg/L) | 18 | 562 | 103 | 71 | 90 | 75 | 20 | 48 |
| Mg2+ (mg/L) | 2.7 | 168 | 46 | 44 | 35 | 50 | 16 | 39 |
| Na+ (mg/L) | 8.1 | 1106 | 142 | 72 | 202 | 200 | 6 | 14 |
| K+ (mg/L) | 0.3 | 10.7 | 3.2 | 2.3 | 2.7 | 12 | 0 | 0 |
| Cl- (mg/L) | 12 | 2627 | 280 | 133 | 436 | 250 | 15 | 36 |
| NO3- (mg/L) | 0.1 | 432 | 45 | 14 | 89 | 50 | 5 | 13 |
| SO42- (mg/L) | 1.2 | 528 | 71 | 30 | 113 | 250 | 3 | 7.1 |
| F- (mg/L) | 0.1 | 9.4 | 3.2 | 2.7 | 2.5 | 1.5 | 29 | 69 |
| HCO3- (mg/L) | 9.4 | 541 | 297 | 345 | 152 | 500 | 4 | 10 |
| Parameters | Range | Water Type | Number of Samples | % of Samples |
|---|---|---|---|---|
| TH (mg/L) | ˂ 75 | Soft | 1 | 2.4 |
| 75 - 150 | Moderately hard | 0 | 0 | |
| 150 - 300 | Hard | 10 | 23.8 | |
| ˃ 300 | Very hard | 31 | 73.8 | |
| TDS (mg/L) | 0-250 | Very fresh | 1 | 2 |
| 250 - 1000 | Fresh | 28 | 67 | |
| 1000 – 10000 | Brackish | 13 | 31 | |
| 10000-100000 | Saline | 0 | 0 | |
| ˃ 100000 | Brine | 0 | 0 |
| WQI Values | Water Quality Status | Number Of Samples | % of Samples |
|---|---|---|---|
| ˂50 | Excellent water | 5 | 11.9 |
| 50 – 100 | Good water | 22 | 52.4 |
| 100 – 200 | Poor water | 14 | 33.3 |
| 200 – 300 | Very poor water | Nil | Nil |
| ˃300 | Unsuitable water for drinking | 1 | 2.4 |
Disclaimer/Publisher’s Note: The statements, opinions and data contained in all publications are solely those of the individual author(s) and contributor(s) and not of MDPI and/or the editor(s). MDPI and/or the editor(s) disclaim responsibility for any injury to people or property resulting from any ideas, methods, instructions or products referred to in the content. |
© 2023 by the authors. Licensee MDPI, Basel, Switzerland. This article is an open access article distributed under the terms and conditions of the Creative Commons Attribution (CC BY) license (http://creativecommons.org/licenses/by/4.0/).


