1. Introduction
Land-use system directly reflects anthropogenic actions into the ecosystem and bridges the economy with the biosphere, mainly through agricultural and forestry management practices [
1]. Land-use changes in the form of deforestation, conversion of grassland to crop and pasture and the depletion of soil carbon through agricultural practices during the last 150 years caused one-third of all anthropogenic CO
2 emissions, primarily responsible for affecting climate change [
2,
3,
4,
5,
6]. Since the industrial revolution, land-use change has altered a large proportion of the earth’s land surface resulting emission of 150 billion metric tons of carbon which is 35 % of the total anthropogenic CO
2 emissions [
1,
7,
8]. Unabated land use changes are expected to release another 10 % of all CO
2 during the next century [
9]. Climate change is one of the present century's significant issues responsible for reducing biological diversity and the ability of biological systems to support human needs by altering ecosystem services [
10,
11]. An increased concern about climate change risk has led local to global efforts for its viable mitigation through proper land management activities which can double the carbon storage potential of the sink [
12,
13,
14,
15]. Land use and land cover change (LUCC) is critical to understand the spatial distribution, magnitude, and temporal change of terrestrial carbon sources and sinks [
16,
17,
18] but comprehensively neither studied nor estimated for the Indian sub-Himalayan region.
Studies have reported the relationship between plant diversity and carbon storage [
19,
20,
21] and the essential role of carbon sequestration by trees and soil as a low-cost net emission reduction [
22,
23]. Soil organic matter and biomass production by vegetation and soil plays an important role in the carbon cycle and is regarded as vital for their capacity to store carbon permanently and improve the local or regional and global environment [
20,
21,
24]. In the humid tropics establishment of tree-based systems on degraded pastures, croplands and grasslands would increase biomass carbon storage by 50 Mg ha
-1 in 20 years, as compared to 5-15 Mg ha
-1 in soils during the same period [
25]. This indicates that carbon sequestration measures can considerably mitigate climate change by storing carbon in terrestrial carbon sinks like plants, plant products and soils for a longer duration [
20,
21].
Terrestrial carbon management, thus is the most viable and effective strategy of the 21
st century to mitigate global climate changes. The tropical soils are low in organic carbon content and, in principle, have a large potential to sequester carbon through appropriate land, and crop management options [
26]. Therefore, biomass and soil carbon storage quantification are most relevant to analysing the total soil carbon sink and formulating management options at local, regional and global levels to mitigate climate change. However, the potential of carbon storage differs with different land use systems and their management practices because biomass production capacity and soil organic matter is the function of site-specific interactions among edaphic, climatic and topographic factors [
27]. Hence, management strategies in one place may not apply to another. This warrants site-specific studies on land use systems for quantifying its carbon storage.
Land resources have been under tremendous anthropogenic pressure due to their degradation. Land uses of Indian sub-Himalayan (Terai region of West Bengal) have been extensively managed and have the potential to enhance carbon sequestration provided the land resources of this region are managed efficiently. Unlike in developed countries, carbon inventories and data banks to monitor the carbon sequestration potential of different ecosystems still need to be prepared for the Indian sub-Himalayan region. Moreover, carbon sequestration studies for diverse land uses are scarce from this region [
20,
21,
28,
29,
30]. Such micro-level studies are essential for sustainable land use management for a country like India and especially for the Terai region of West Bengal to recommend suitable land use management prescriptions for carbon management meeting the local and national needs. Thus, the present study was conducted to assess the suitability of different tree-based land-use systems as an alternative to continuous cropping through the system’s ability to sequester and store carbon and to identify the most appropriate land-use system based on carbon stock.
2. Research Methodology
2.1. Study Site
The study site was the Terai zone, i.e., foot hills plains area of the Himalayas in the northern part of West Bengal, which lies between 26° 30' and 26° 56' N latitude and 88° 7' and 89° 53' E longitude. A preliminary field survey was conducted in the study area, and 33 tree-based land uses were identified for the present study. These land uses were categorized into five major land use systems: forest, forest tree plantations, agroforestry, commercial crop plantation, and fruit orchard. Other than forests, all other tree-based land use systems were on the agricultural landscape. The sampling details are given in
Table 1. All the plantations in the agricultural landscape were about 15-20 years of age. Samples were collected from all the above-mentioned tree-based land use systems, and the data were presented on an average for a particular land use category. This study did not consider biomass produced by annual crops.
2.2. Sampling and Sample Collection
A stratified random nested quadrate sampling was adopted for collecting vegetation data. Quadrate size of 20 m x 20 m was used in the present study. for trees within which two 5 m x 5 m quadrates were laid out at the diagonal corners for shrubs and five 1 m x 1 m quadrates at the four corners and one at the centre of the 20 m x 20 m quadrate for herbs. Composite soil samples were collected once separately from 0-20, 20-40, 40-60 cm depth with the help of Dutch augur from all the quadrates. In addition, litter was collected once from three 1 m x 1 m sub-quadrates placed diagonally (two at opposite corners and one in the centre) within the main quadrate [
31]. The litter collected were weighed in the field itself.
2.3. Diameter and Height
The diameter (at breast height) and their standing height for the trees were measured with the help of a tree calliper and Ravi’s Multimeter, respectively.
2.4. Soil Physical and Chemical Parameters
The different soil physical and chemical parameters were analysed following the method given below:
| Moisture |
Volumetric method |
| pH |
Beckman’s pH meter [32] |
| Moisture |
[33] |
| Electrical conductivity |
Soil water suspension [32] |
| Oxidizable organic carbon (%) |
Walkley and Black’s rapid titration method [32] |
| Available N Kg ha-1
|
Modified Kjeldahl method [32] |
| Available P2O5 Kg ha-1
|
Bray’s method [32,34] |
| Available K2O Kg ha-1
|
Flame Photometer method [32] |
2.5. Soil Organic Carbon Stock
Soil organic carbon stock was calculated by multiplying the organic carbon content with weight of the soil (bulk density and depth) for a particular soil depth and expressed as mega grams per ha (Mg ha-1).
2.6. Biomass and Biomass Carbon
Indirect or non-destructive method was adopted for biomass estimation. Tree biomass was estimated for each individual tree and then summed up.
where Y = biomass per tree, exponential function, D = diameter at breast height in cm. This equation predicts the trunk and canopy biomass of moist (1500-4000 mm rainfall) area with reasonable precision (R
2 = 0.97) and has become a standard approach [
35].
Biomass of coconut palm was estimated using the equation suggested by Kumar [
36]:
where R2 = 0.89, Y = biomass; x = Palm age in year.
Biomass of areca palm was estimated using equation suggested by Brown [
37]:
where Y = biomass and H = stem height in meter.
Biomass of tea was estimated using equations suggested by Kalita
et al. [
38,
39]:
Five shrubs were randomly selected and uprooted to measure their average fresh weight and then multiplied by the total number of shrubs in the quadrate. For herbs, all the plants from three randomly selected 1 m x 1 m plots were uprooted to measure their fresh weight. The total biomass estimated in a quadrate was converted into carbon by multiplying with a factor of 0.50 [
9]. The total of standing biomass carbon (trees + shrubs + herbs), litter carbon and oxidizable carbon up to 60 cm soil depth was considered as the ecosystem carbon storage.
2.7. Statistical Analysis
The data were analysed using software package SPSS version 17.0 (VSN International, Oxford, UK) and SAS. Pearson correlation test was performed at 0.05(*) and 0.01(**) probability levels. One-way variance analysis and Duncan multiple range test (DMRT) test was also employed.
3. Results and Discussions
3.1. Soil Organic Carbon (SOC) Storage in Relation to Different Land Uses
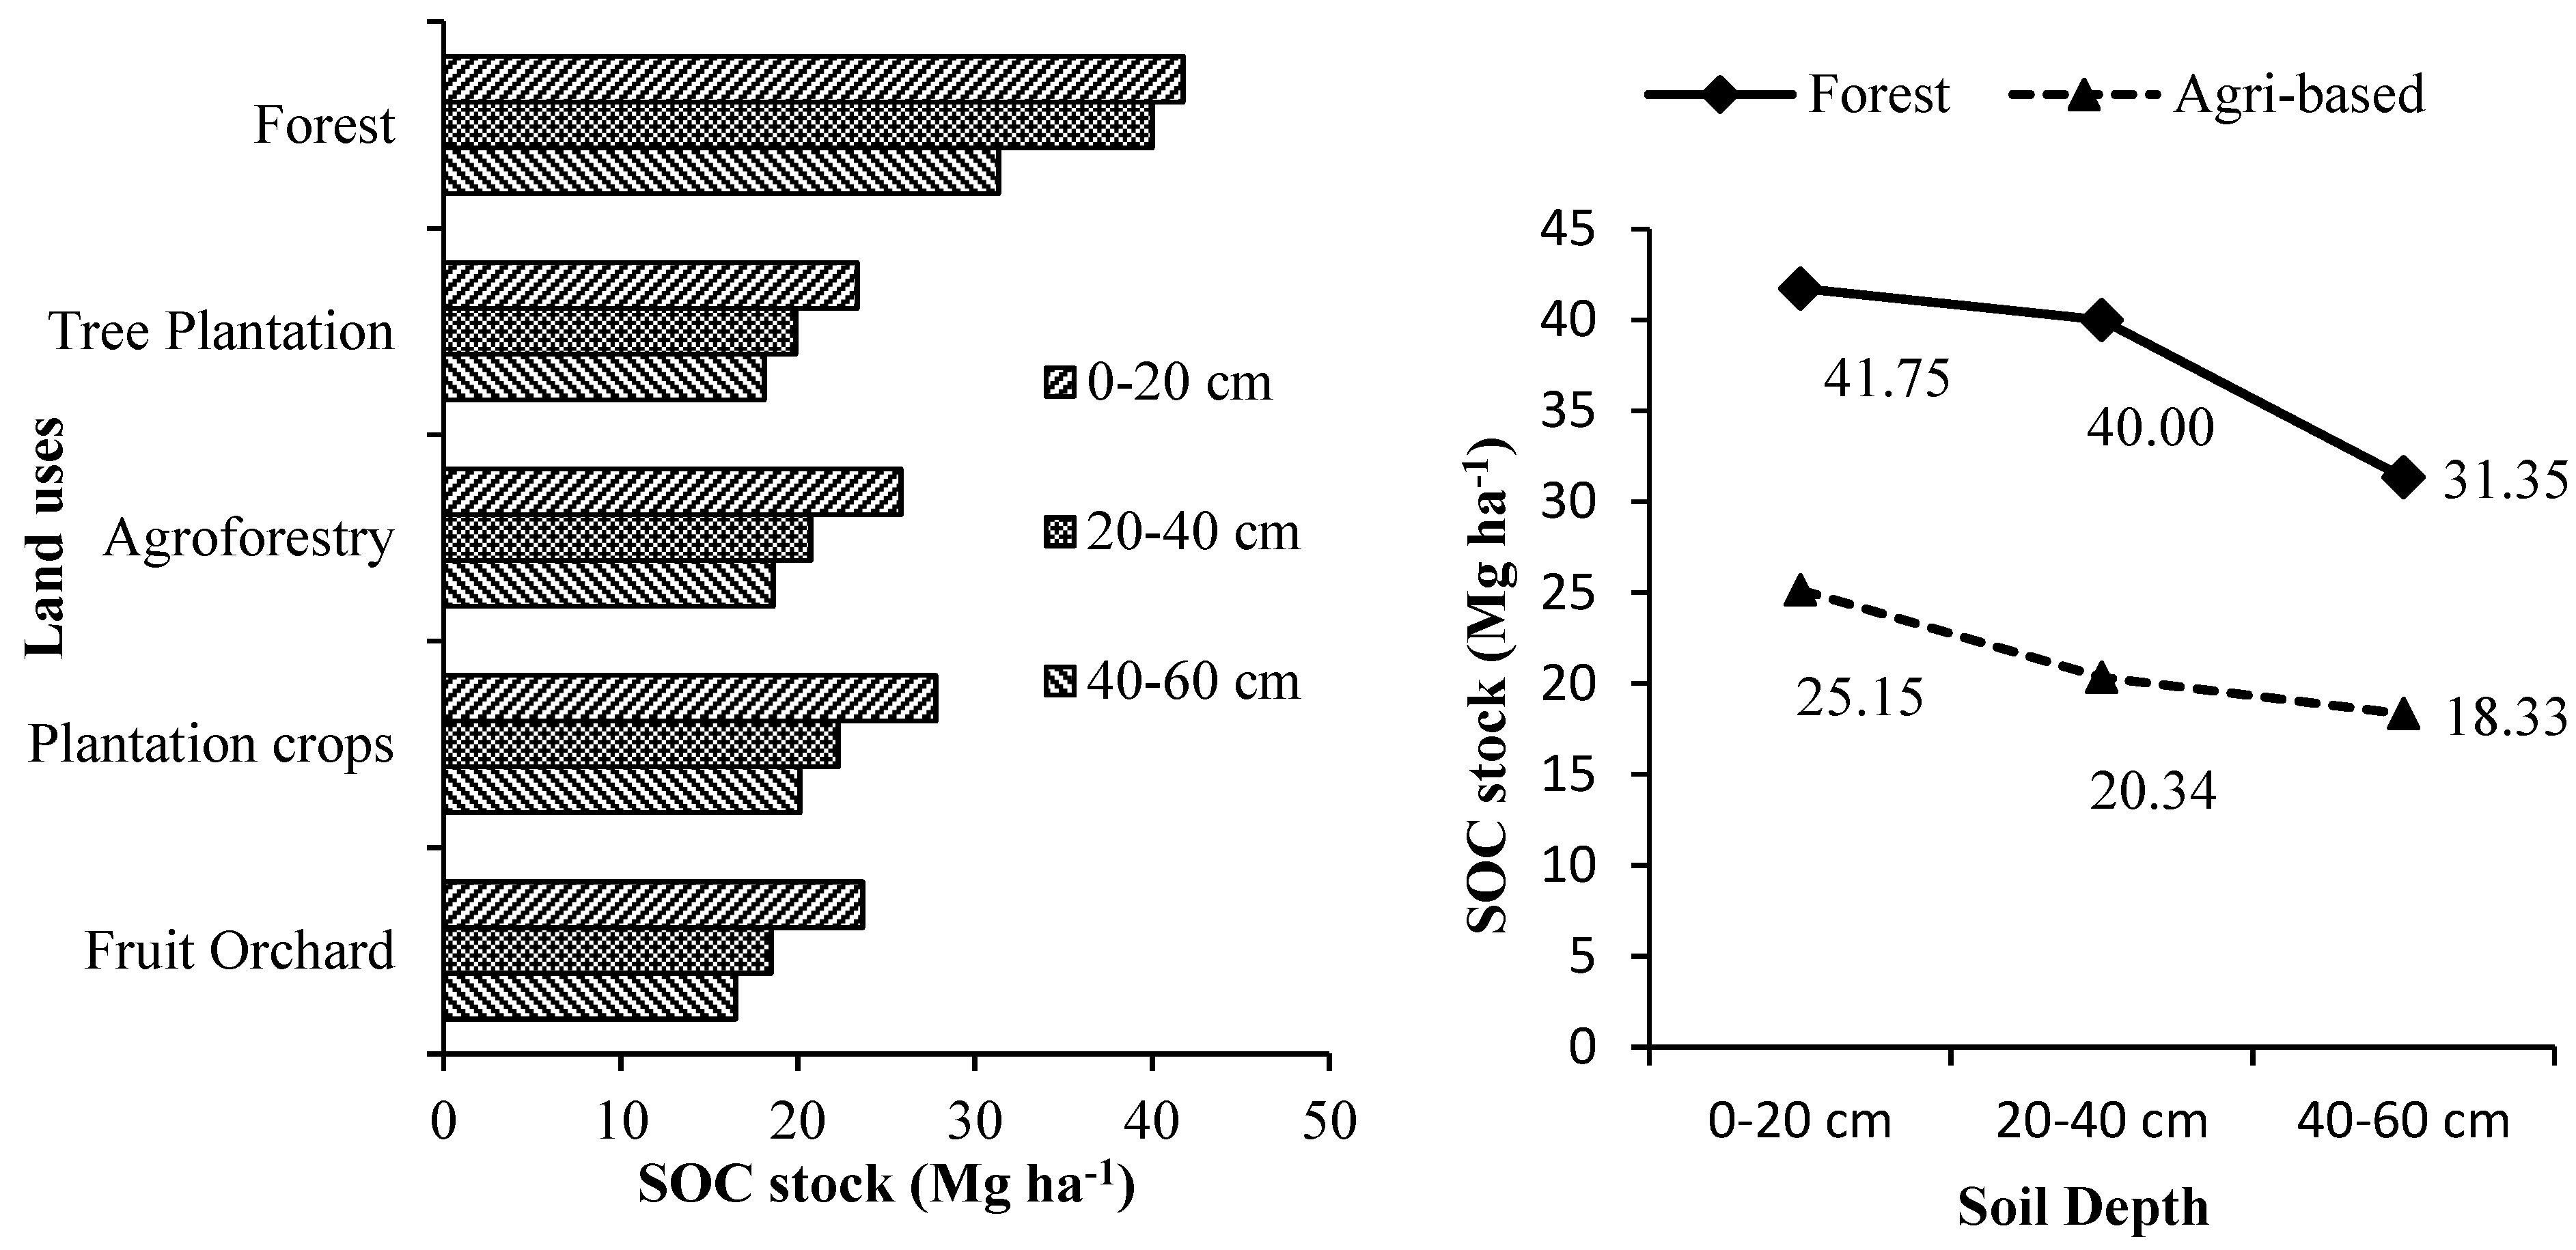
SOC (oxidizable) stock in different tree-based land use systems at different soil depths is given in
Supplementary Table S1 and
Figure 1. The tree-based land use systems and their soil depth significantly influenced SOC stock. SOC is influenced by the complex interaction of geographic location, rainfall, soil texture and land-use practices [
40]. In all the tree-based land use systems, the topmost soil layer (0-20 cm) was estimated with the highest amount of SOC stock that decreased significantly with an increase in soil depth.
This trend is due to the gradual decrease of organic matter with increasing soil depth [
20,
21,
41,
42,
43,
44]. The range of SOC stock estimated for the entire tree-based land use systems of the Terai zone of West Bengal was 22.55-47.06 Mg ha
-1, 18.15-47.13 Mg ha
-1 and 16.18-32.90 Mg ha
-1 at 0-20 cm, 20-40 cm and 40-60 cm soil depth, respectively. The mixed species forest land use was estimated with the highest amount of SOC stock at all the soil depths which was significantly higher than all other tree-based land use systems. Overall, on an average (hectare basis), homegardens and tea plantations was estimated with 40.22 % and 22.73 % lesser amount of SOC stock than mixed species forest systems, respectively. On average, tree-based land use systems in forested landscapes accumulated 78.2 % more SOC for a unit area than tree-based land use systems in agricultural landscapes.
Among the tree-based land use systems in the agricultural landscape, SOC stock of forest tree plantations, agroforestry systems, commercial crop plantations and fruit orchards was estimated with overall average range (up to 60 cm soil depth) and overall mean of 20.0-21.53 Mg ha
-1 and 20.43 Mg ha
-1; 20.19-30.11 Mg ha
-1 and 21.61 Mg ha
-1; 20.02-34.4 Mg ha
-1 and 23.39 Mg ha
-1 and 19.15-20.01 Mg ha
-1 and 19.53 Mg ha
-1, respectively. Thus, the order of tree-based land use system in terms of its overall mean estimated SOC accumulation in Terai zone of West Bengal is forests > commercial crop plantations > agroforestry systems > forest tree plantations > fruit orchards. Forests accumulated on an average 84 %, 74 %, 61 % and 91 % more SOC than forest tree plantations, agroforestry systems, and commercial crop plantations and fruit orchards, respectively. In the agricultural landscape, the selected forest tree plantations were more or less statistically similar in terms of their SOC accumulation. Similarly, the different fruit orchards also accumulated statistically similar amount of SOC. However, in agroforestry systems, homegardens were estimated with significantly higher amount of overall average SOC (up to 60 cm soil depth) than all other agroforestry systems like agri or hortisilviculture systems (
Supplementary Table S1). Similarly, among the commercial crop plantations, tea plantations accumulated significantly higher amount of overall average SOC (up to 60 cm soil depth). Similar amount of SOC in different land use systems was also reported by earlier studies from the Terai zone of West Bengal [
20,
21,
40,
41,
42,
43,
44,
45,
46] with highest in forest soils [
45,
46,
47,
48].
The high SOC storage in forest soil is due to the high litter addition of 13.6 Mg ha
-1 (
Supplementary Table S2) which regulated organic matter decomposition and formation of stable and liable soil organic matter pool [
49,
50]. On the other hand, the amount of SOC decreased with the soil depth in all the tree-based land-use systems due to humus formation and decomposition of organic matter in the upper layers. Therefore, SOC storing is vital to conserve and restrict carbon emissions. The average total SOC estimate of 113.09 Mg ha
-1 in forestland up to 60 cm soil depth is similar to that reported for other tropical moist deciduous forests in India, i.e., 8.9-176.1 Mg ha
-1 for top 50 cm depth [
51]. Based on major land uses, the highest mean SOC density in Indian soils under plantation systems was 253 Mg C ha
-1 followed by forest (139.9 t C ha
-1) and agricultural land (58.5-67.4 Mg C ha
-1) [
52]. The SOC storage between tree-based land uses in the Terai zone of West Bengal differed significantly. Thus, land-use conversion from higher SOC stock to lesser one will cause significant terrestrial carbon emissions, reducing the potential for land sustainability [
53]. Soil carbon sequestration through tree-based land use practices is thus an effective mitigation option to increase its carbon for agricultural productivity and sustainability and mitigate climate change [
54,
55]. Land use conversion from forest to agriculture can reduce more than half of the SOC stock of the system but converting to homegarden or coffee, mango, coconut, or areca nut-based agroforestry system or sole areca nut system on agriculture land can increase SOC stock of the system [
56].
3.2. Soil Electrical Conductivity, Moisture and pH
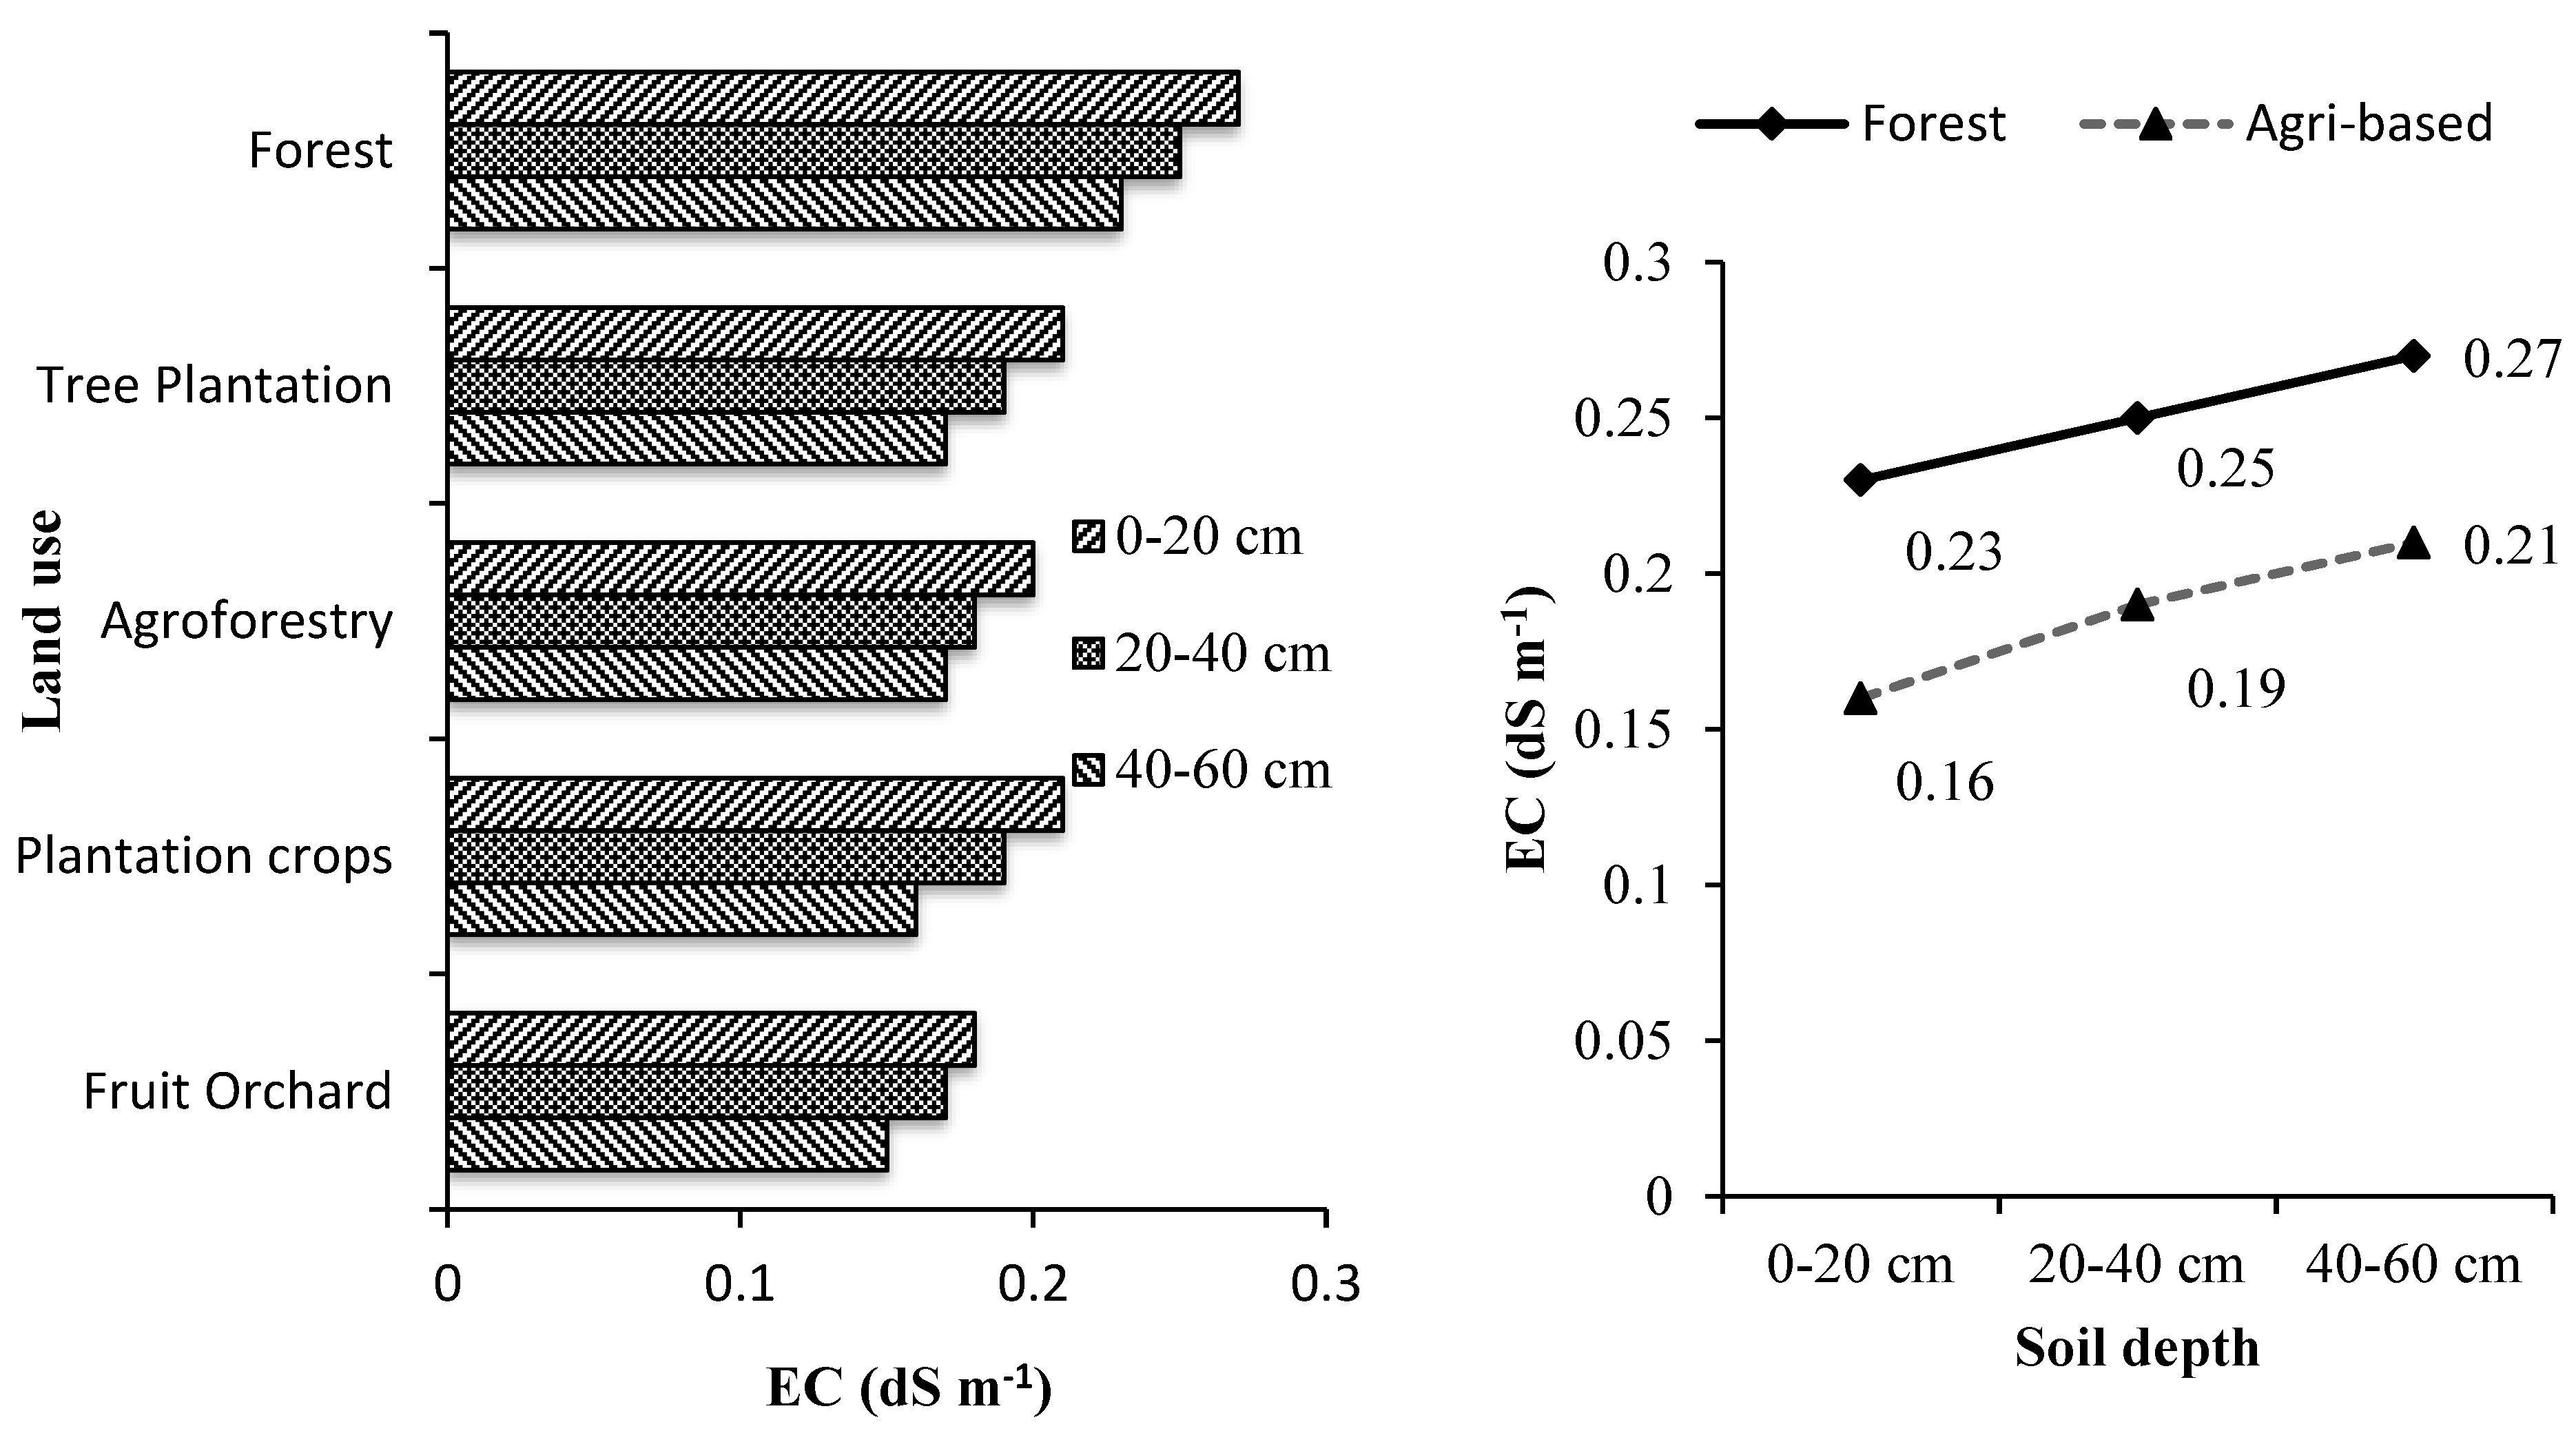
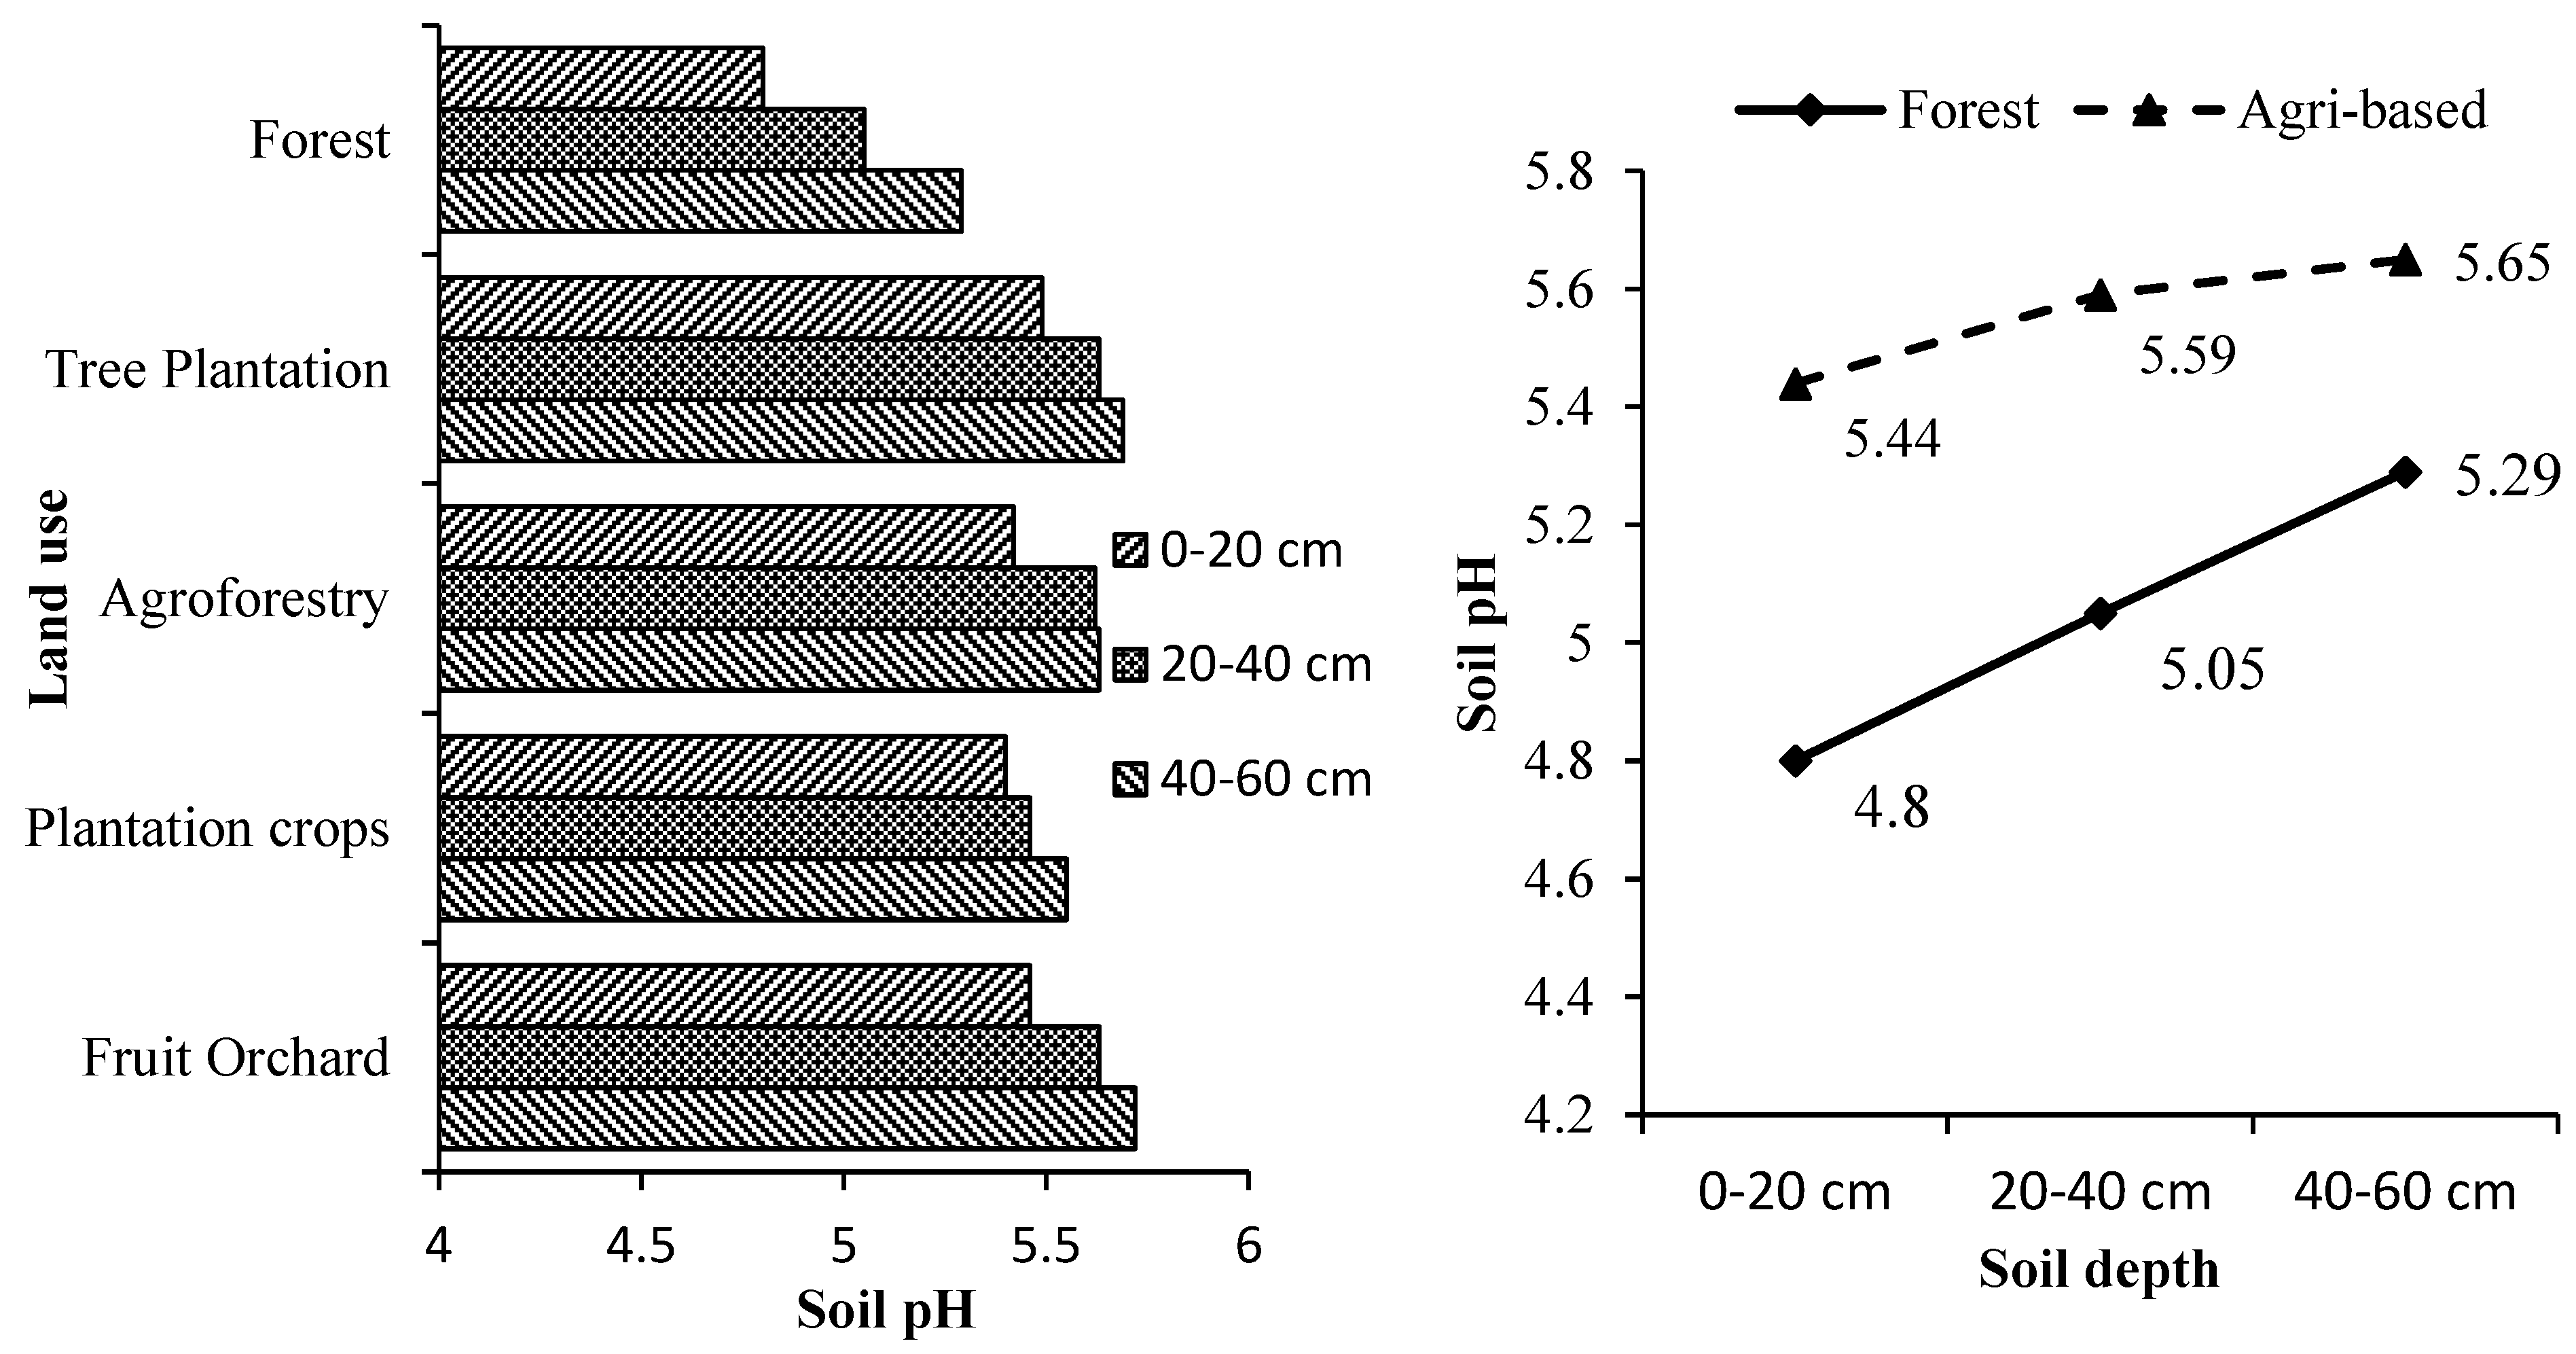
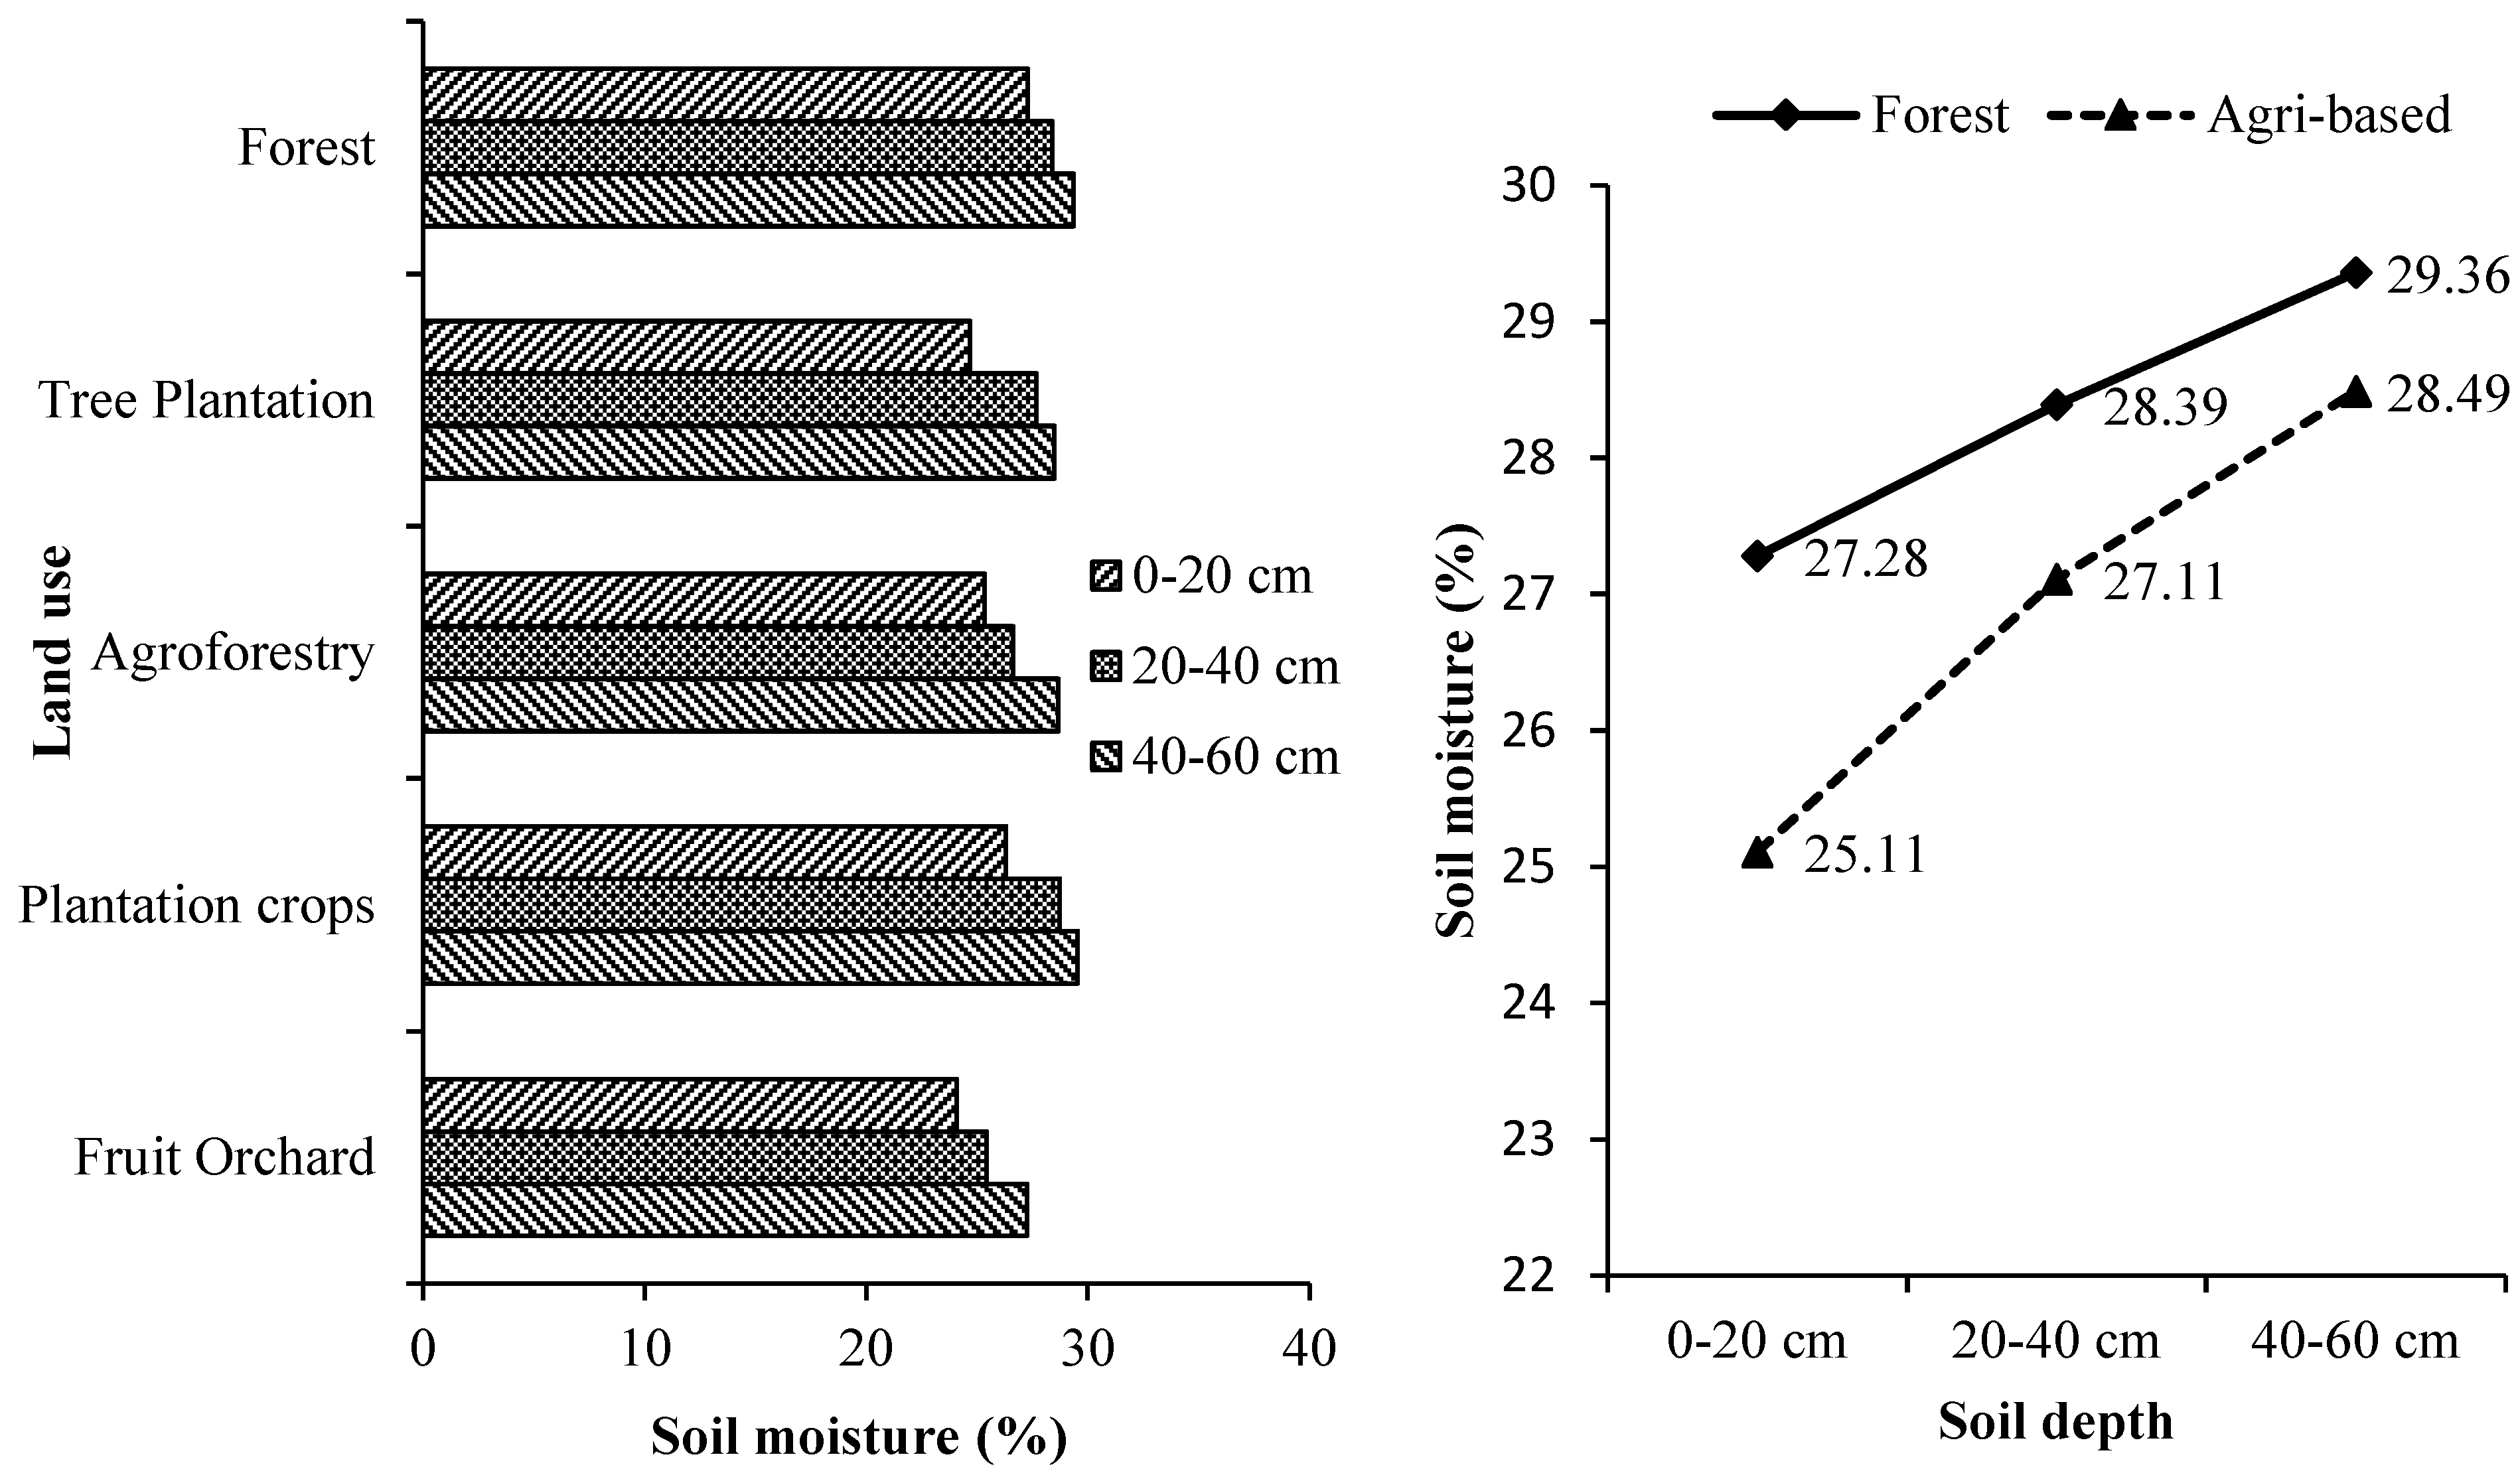
Soil depth and land use systems significantly influenced the soil’s electrical conductivity (EC), pH and moisture (
Supplementary Tables S3–S5 and
Figure 2,
Figure 3 and
Figure 4). The soil depth and land use systems significantly influenced the soil electrical conductivity (EC), pH and moisture. EC decreased significantly with increasing soil depth for all the tree-based land use systems while, the soil pH and moisture increased with the increase in soil depth. The soil under all the land use systems was acidic. Soil organic matter is mainly responsible for regulating the soil's physical and chemical properties [
57]. Generally, low pH in tree-based systems is due to higher organic matter accumulation [
58] that results in high SOC with the leaching of bases and increase the soil EC [
59]. On the other hand, higher EC and moisture of soils lower their pH [
59].
The reduction in pH can be attributed to the accumulation and subsequent slow decomposition of organic matter, which releases acids [
60]. This explains the more acidic nature of forest soils compared to the soils of other tree-based land use systems in which more soil organic matter is added through litter production. Forests soils especially with mixed species accumulated maximum soil organic matter than the other tree-based land use systems and thus were most acidic [
20,
21,
43,
44]. The surface layer was significantly more acidic than the sub-surface layers in all the tree-based land use systems. This is because of more organic matter in the form of litter in the top layer led to surface soil floor's acidic nature. The study area is humid and receives high rainfall. Humidity influences water retention directly by reducing evaporation rates and increasing water infiltration [
61]. Undisturbed and continuous canopy of the forests stands intercepted most of the solar radiation causing less evaporation thereby conserving high soil moisture as compared to other tree-based land use systems. Moreover, higher soil organic matter in the form of litter and humus absorbed and held substantial quantities of water, up to 20 times its mass in forest soil [
62]. The continuous canopy and higher moisture retention capacity of forest soils than the soils of other tree-based systems help reduce the evaporation rates and water infiltration to the groundwater layers.
3.3. Soil Available Primary Nutrients
3.3.1. Nitrogen
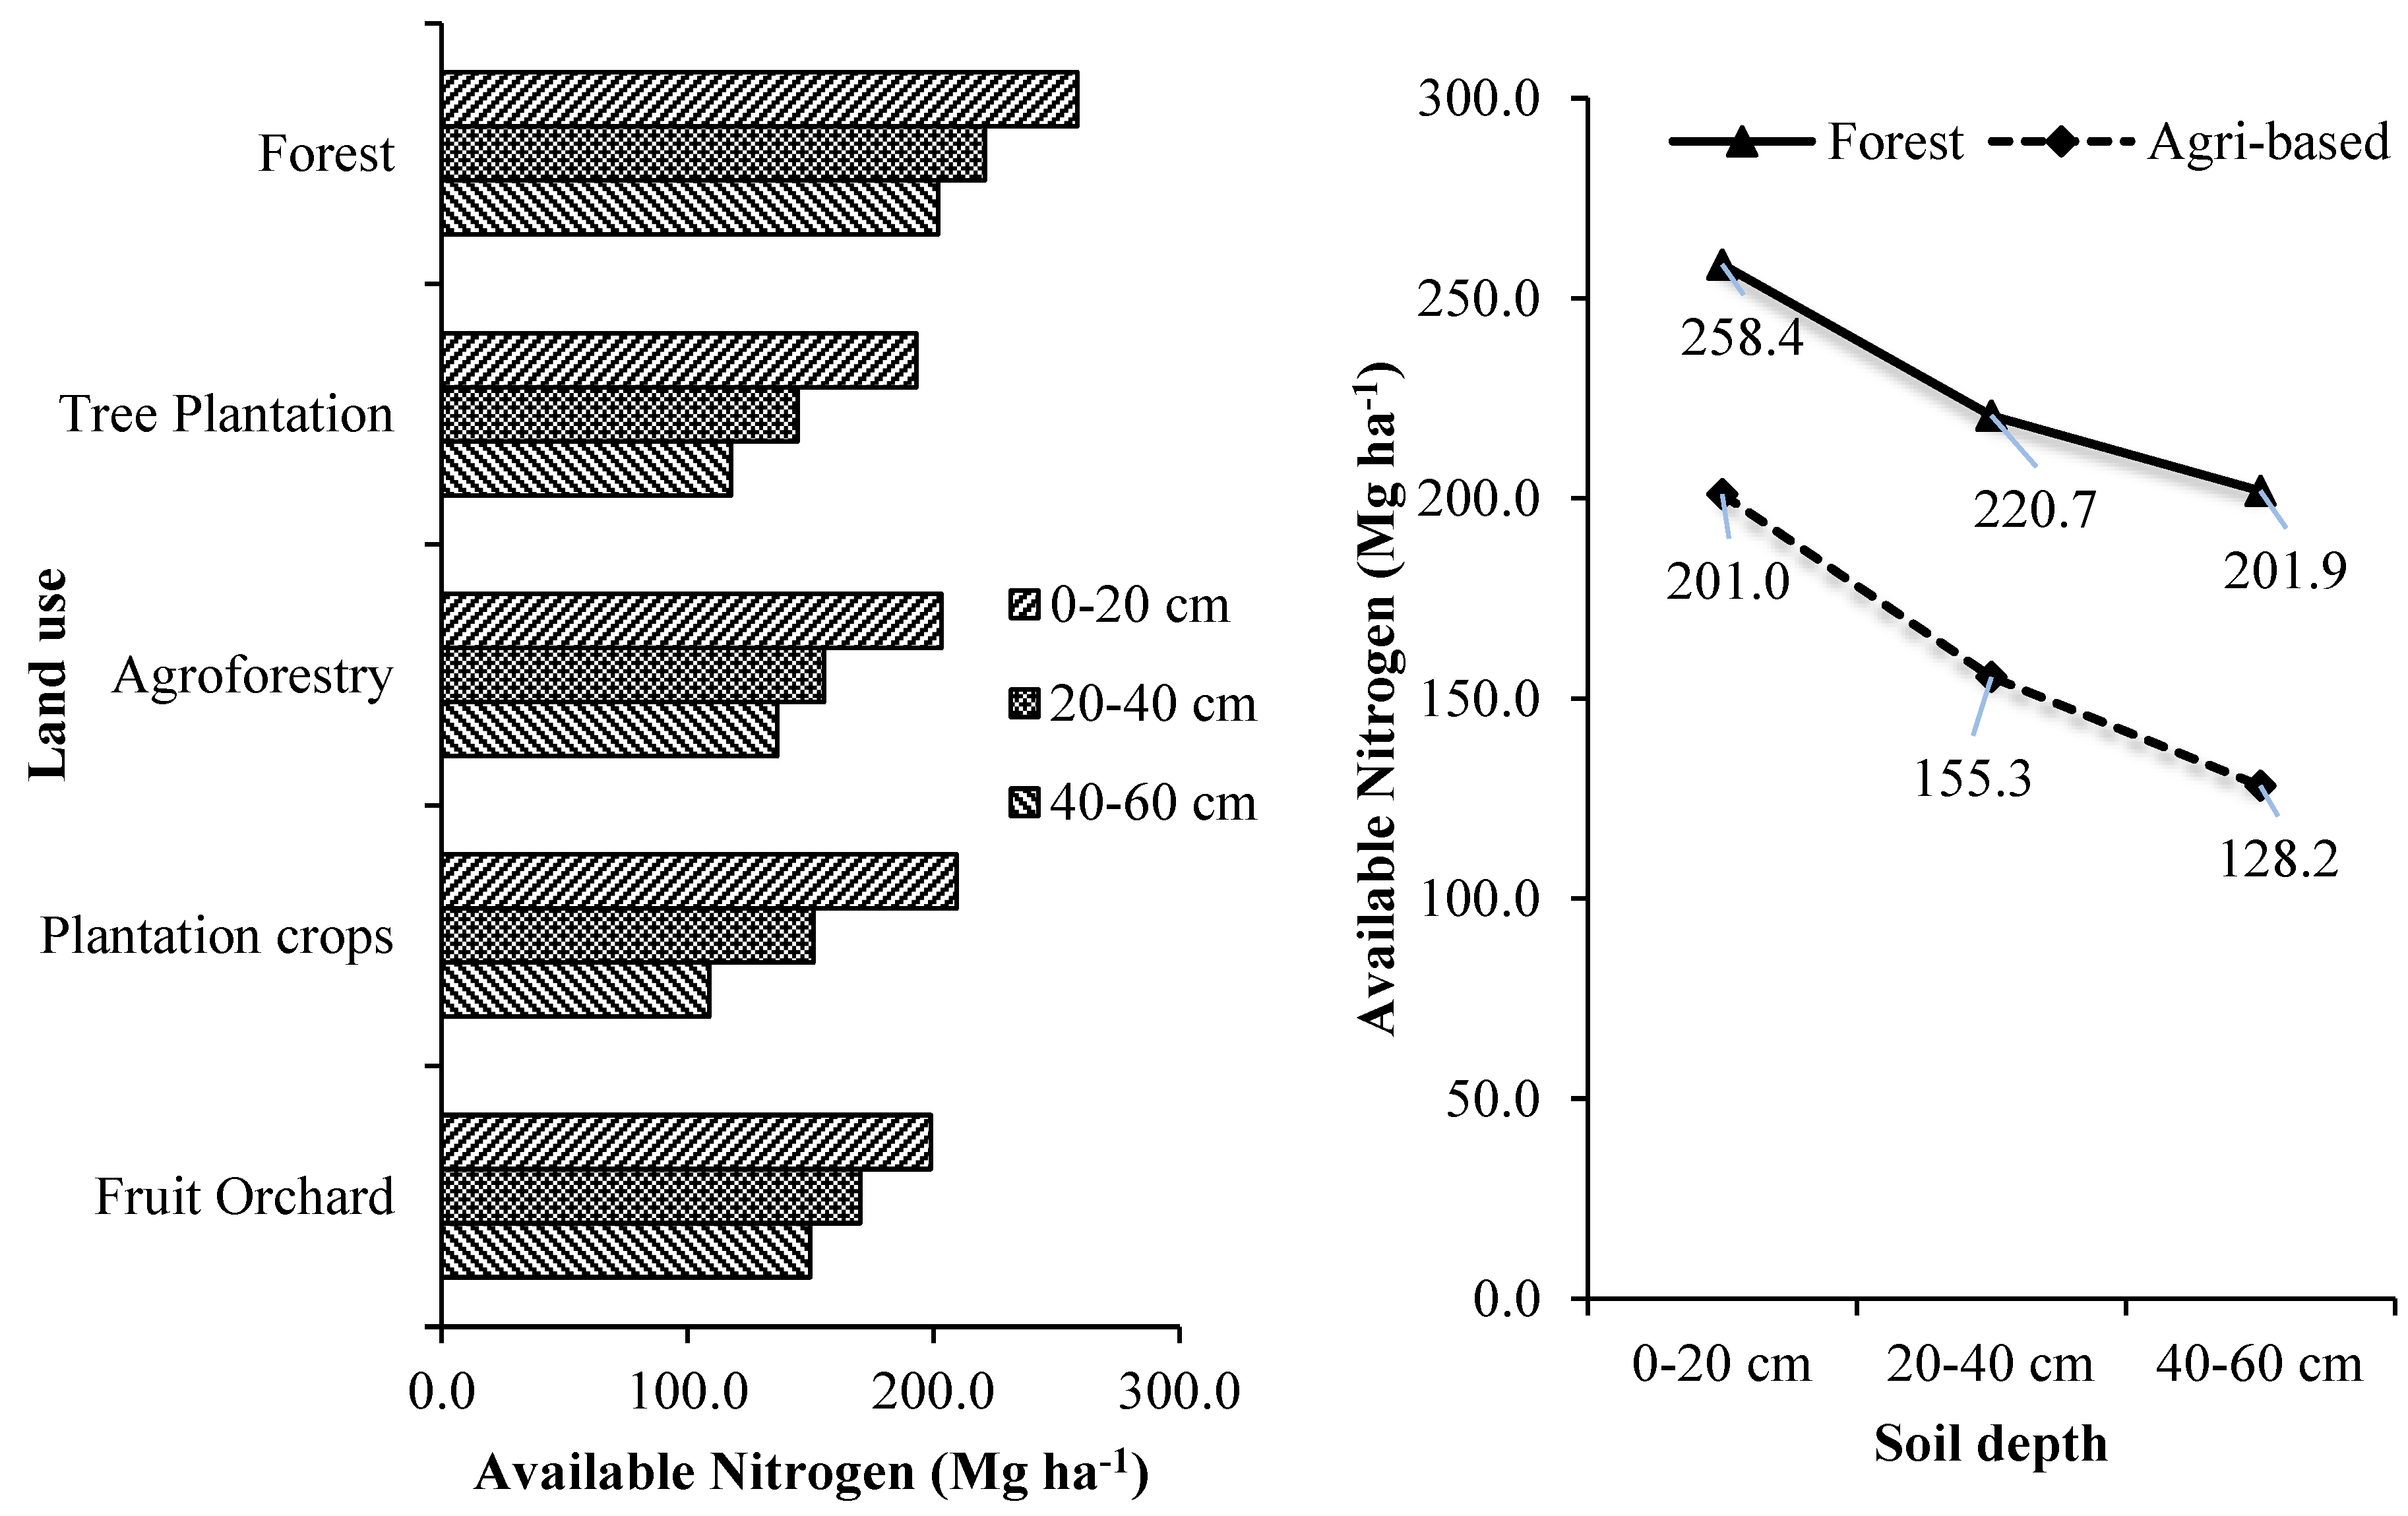
The soil available nitrogen in different tree-based land use systems at different soil depths are given in
Supplementary Table S6 and
Figure 5. Tree-based land use systems and the soil depth significantly influenced the soil available nitrogen. The soils of mixed species forests were estimated with the highest available nitrogen at all the soil depths. They were significantly higher than the estimated available nitrogen of other tree-based land use systems. On an average, the mixed species forest stored 12.79 % more available nitrogen (on a hectare basis) than
Shorea robusta stands, 17.03 % more than
Lagerstroemia parviflora stands, 17.64 % more than
Michelia champaca stands and 21.81 % more than
Tectona grandis stands. While it was 11.48 % more than homegardens and 42.24 % more than tea plantations. The order of tree-based land use system in terms of its mean estimated available nitrogen in Terai zone of West Bengal is forests > fruit orchards > agroforestry systems > commercial crop plantation > forest tree plantations. Forest land use systems accumulated on an average 49.65 %, 37.6 %, 45.08 % and 31.27 % more soil available nitrogen than forest tree plantations, agroforestry systems, commercial crop plantations and fruit orchards, respectively.
3.3.2. Phosphorus
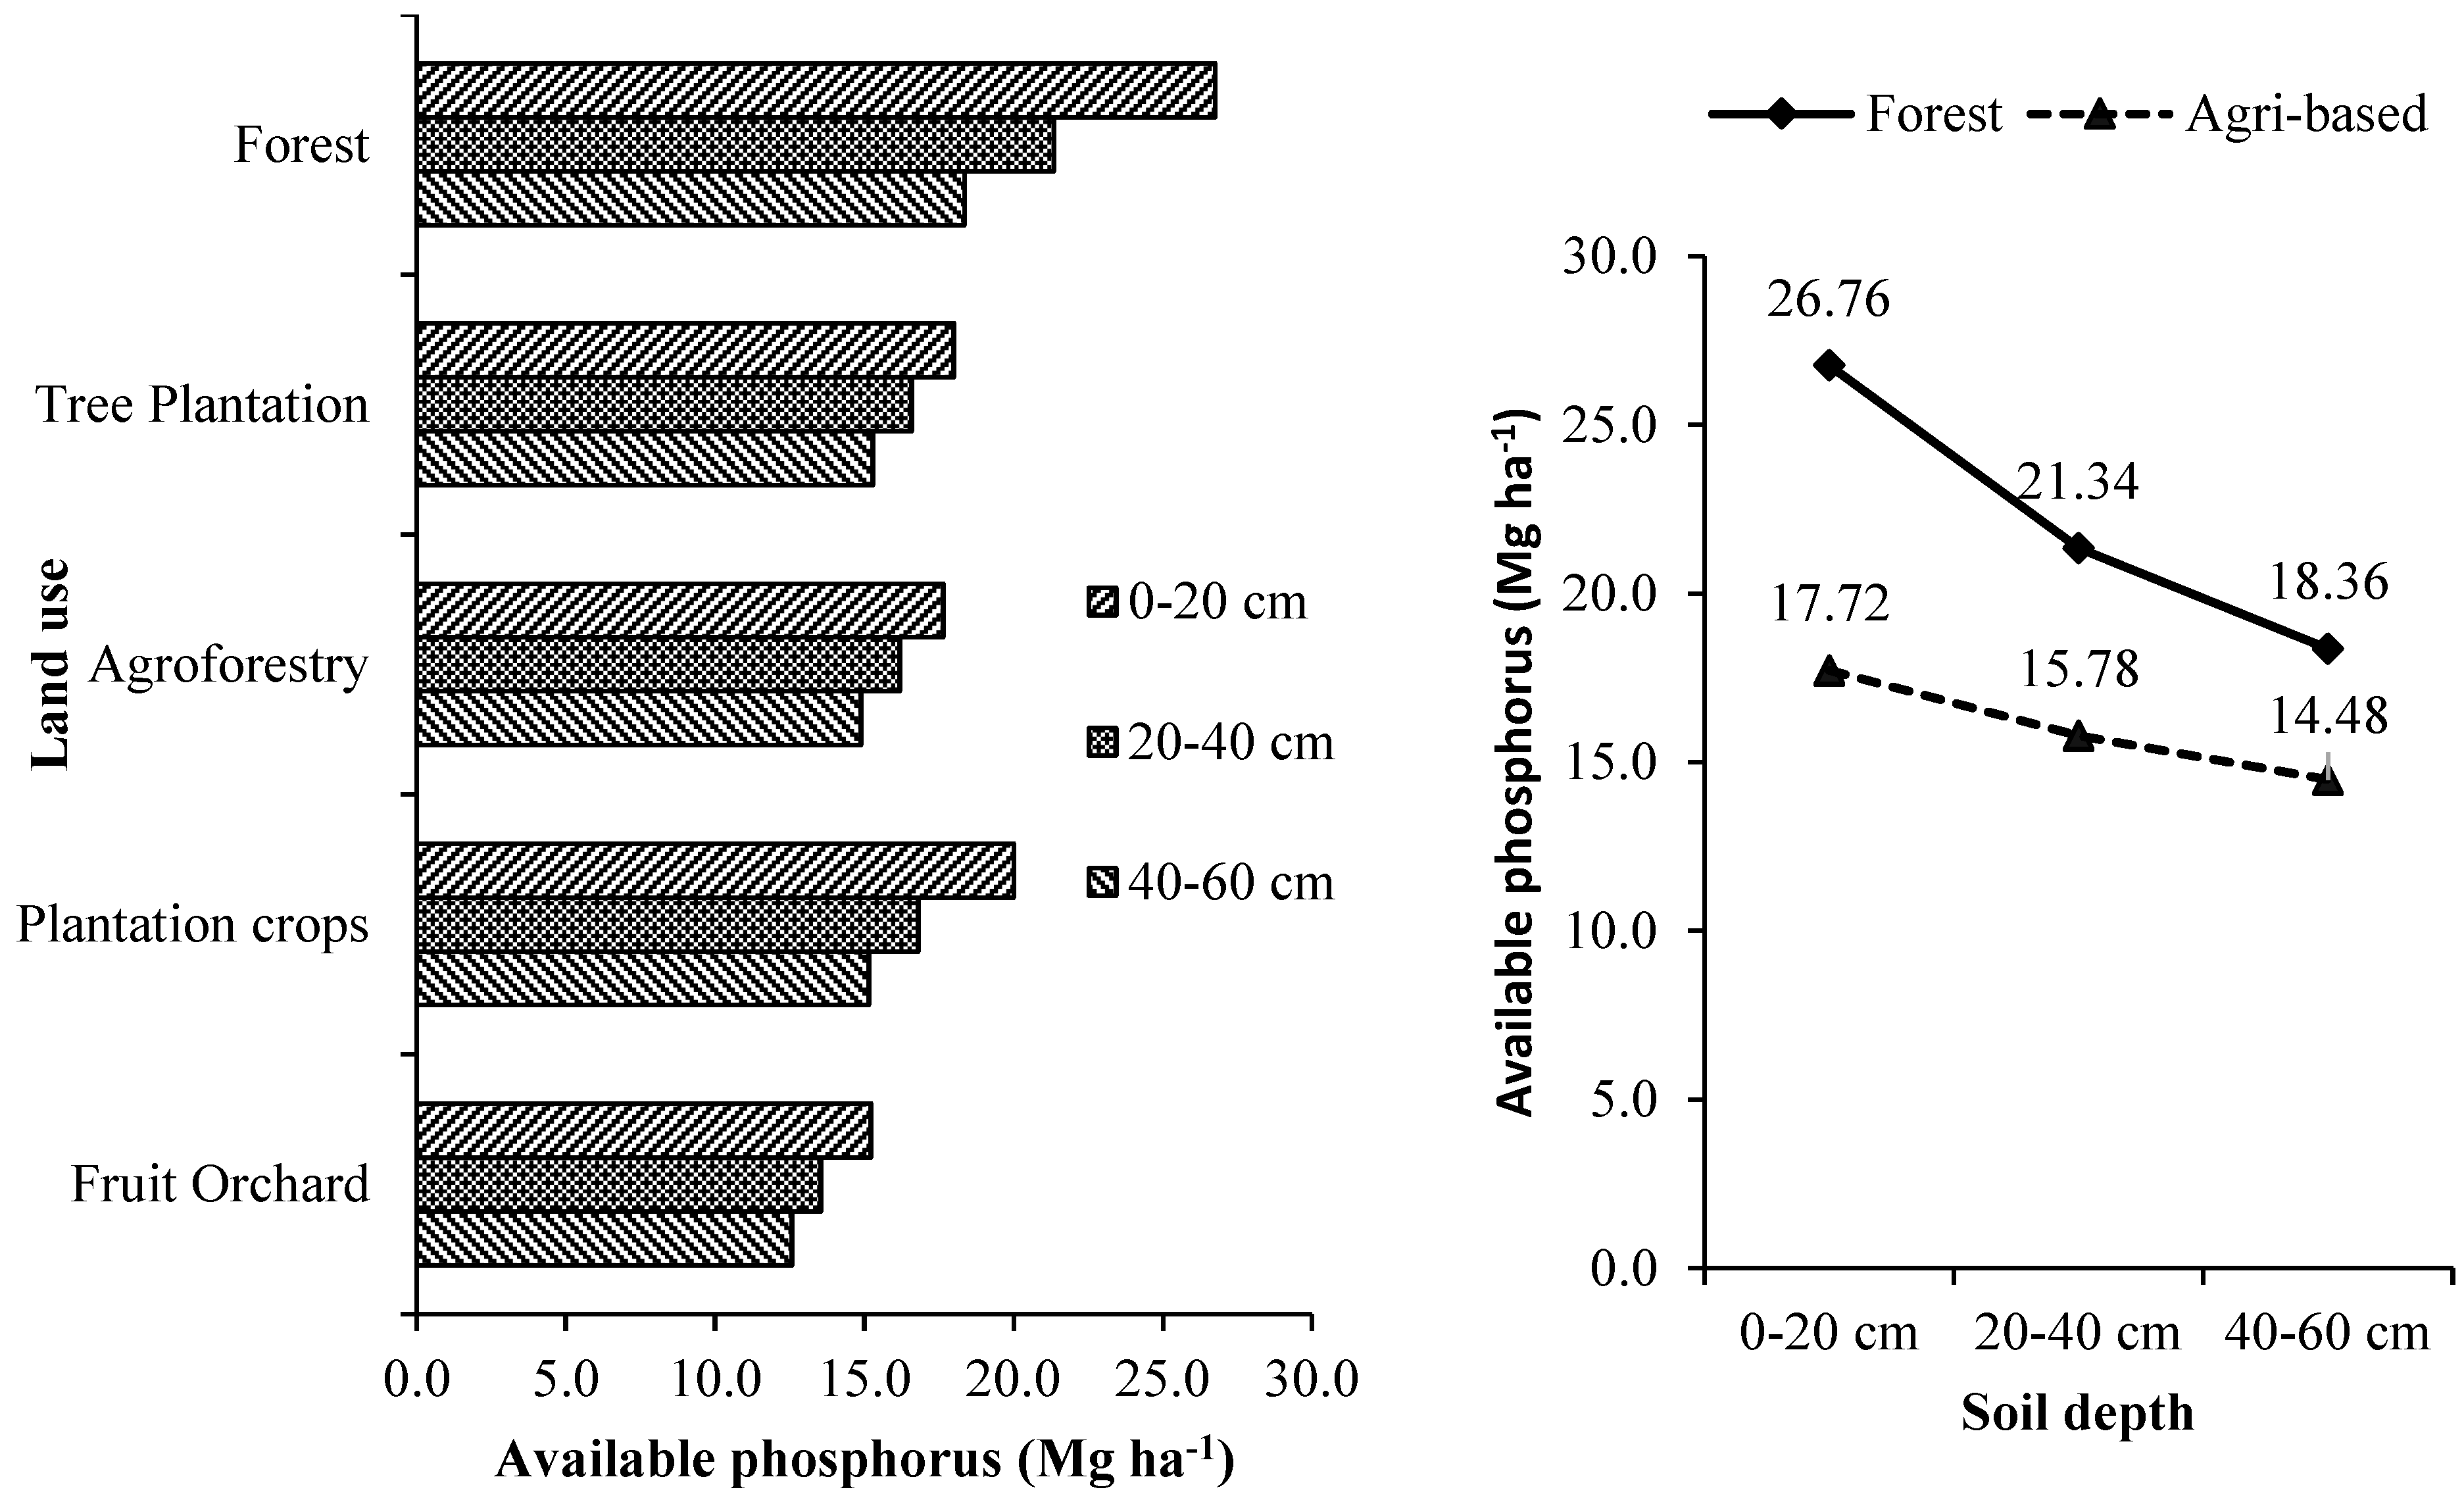
The available phosphorus estimated for different tree-based land use systems at different soil depth is given in
Supplementary Table S7 and
Figure 6. Tree-based land use systems and the soil depth significantly influenced the soil available phosphorus. The highest soil available phosphorus was found in forests at all the soil depths and was significantly higher than those estimated for other tree-based systems except the homegardens. The overall average available phosphorus (up to 60 cm soil depth) stored by tree-based land use systems in agricultural landscape was 15.99 kg ha
-1, i.e., 38.52 % less than what stored in the forests. In the agricultural landscape, tea plantations stored significantly higher amount of available phosphorus (52.64-64.08 %) than other tree-based systems. In Terai zone of West Bengal, the order of tree-based land use system in terms of its overall soil phosphorus availability is forests > commercial crop plantations > forest tree plantations > agroforestry systems > fruit orchards.
3.3.3. Potassium
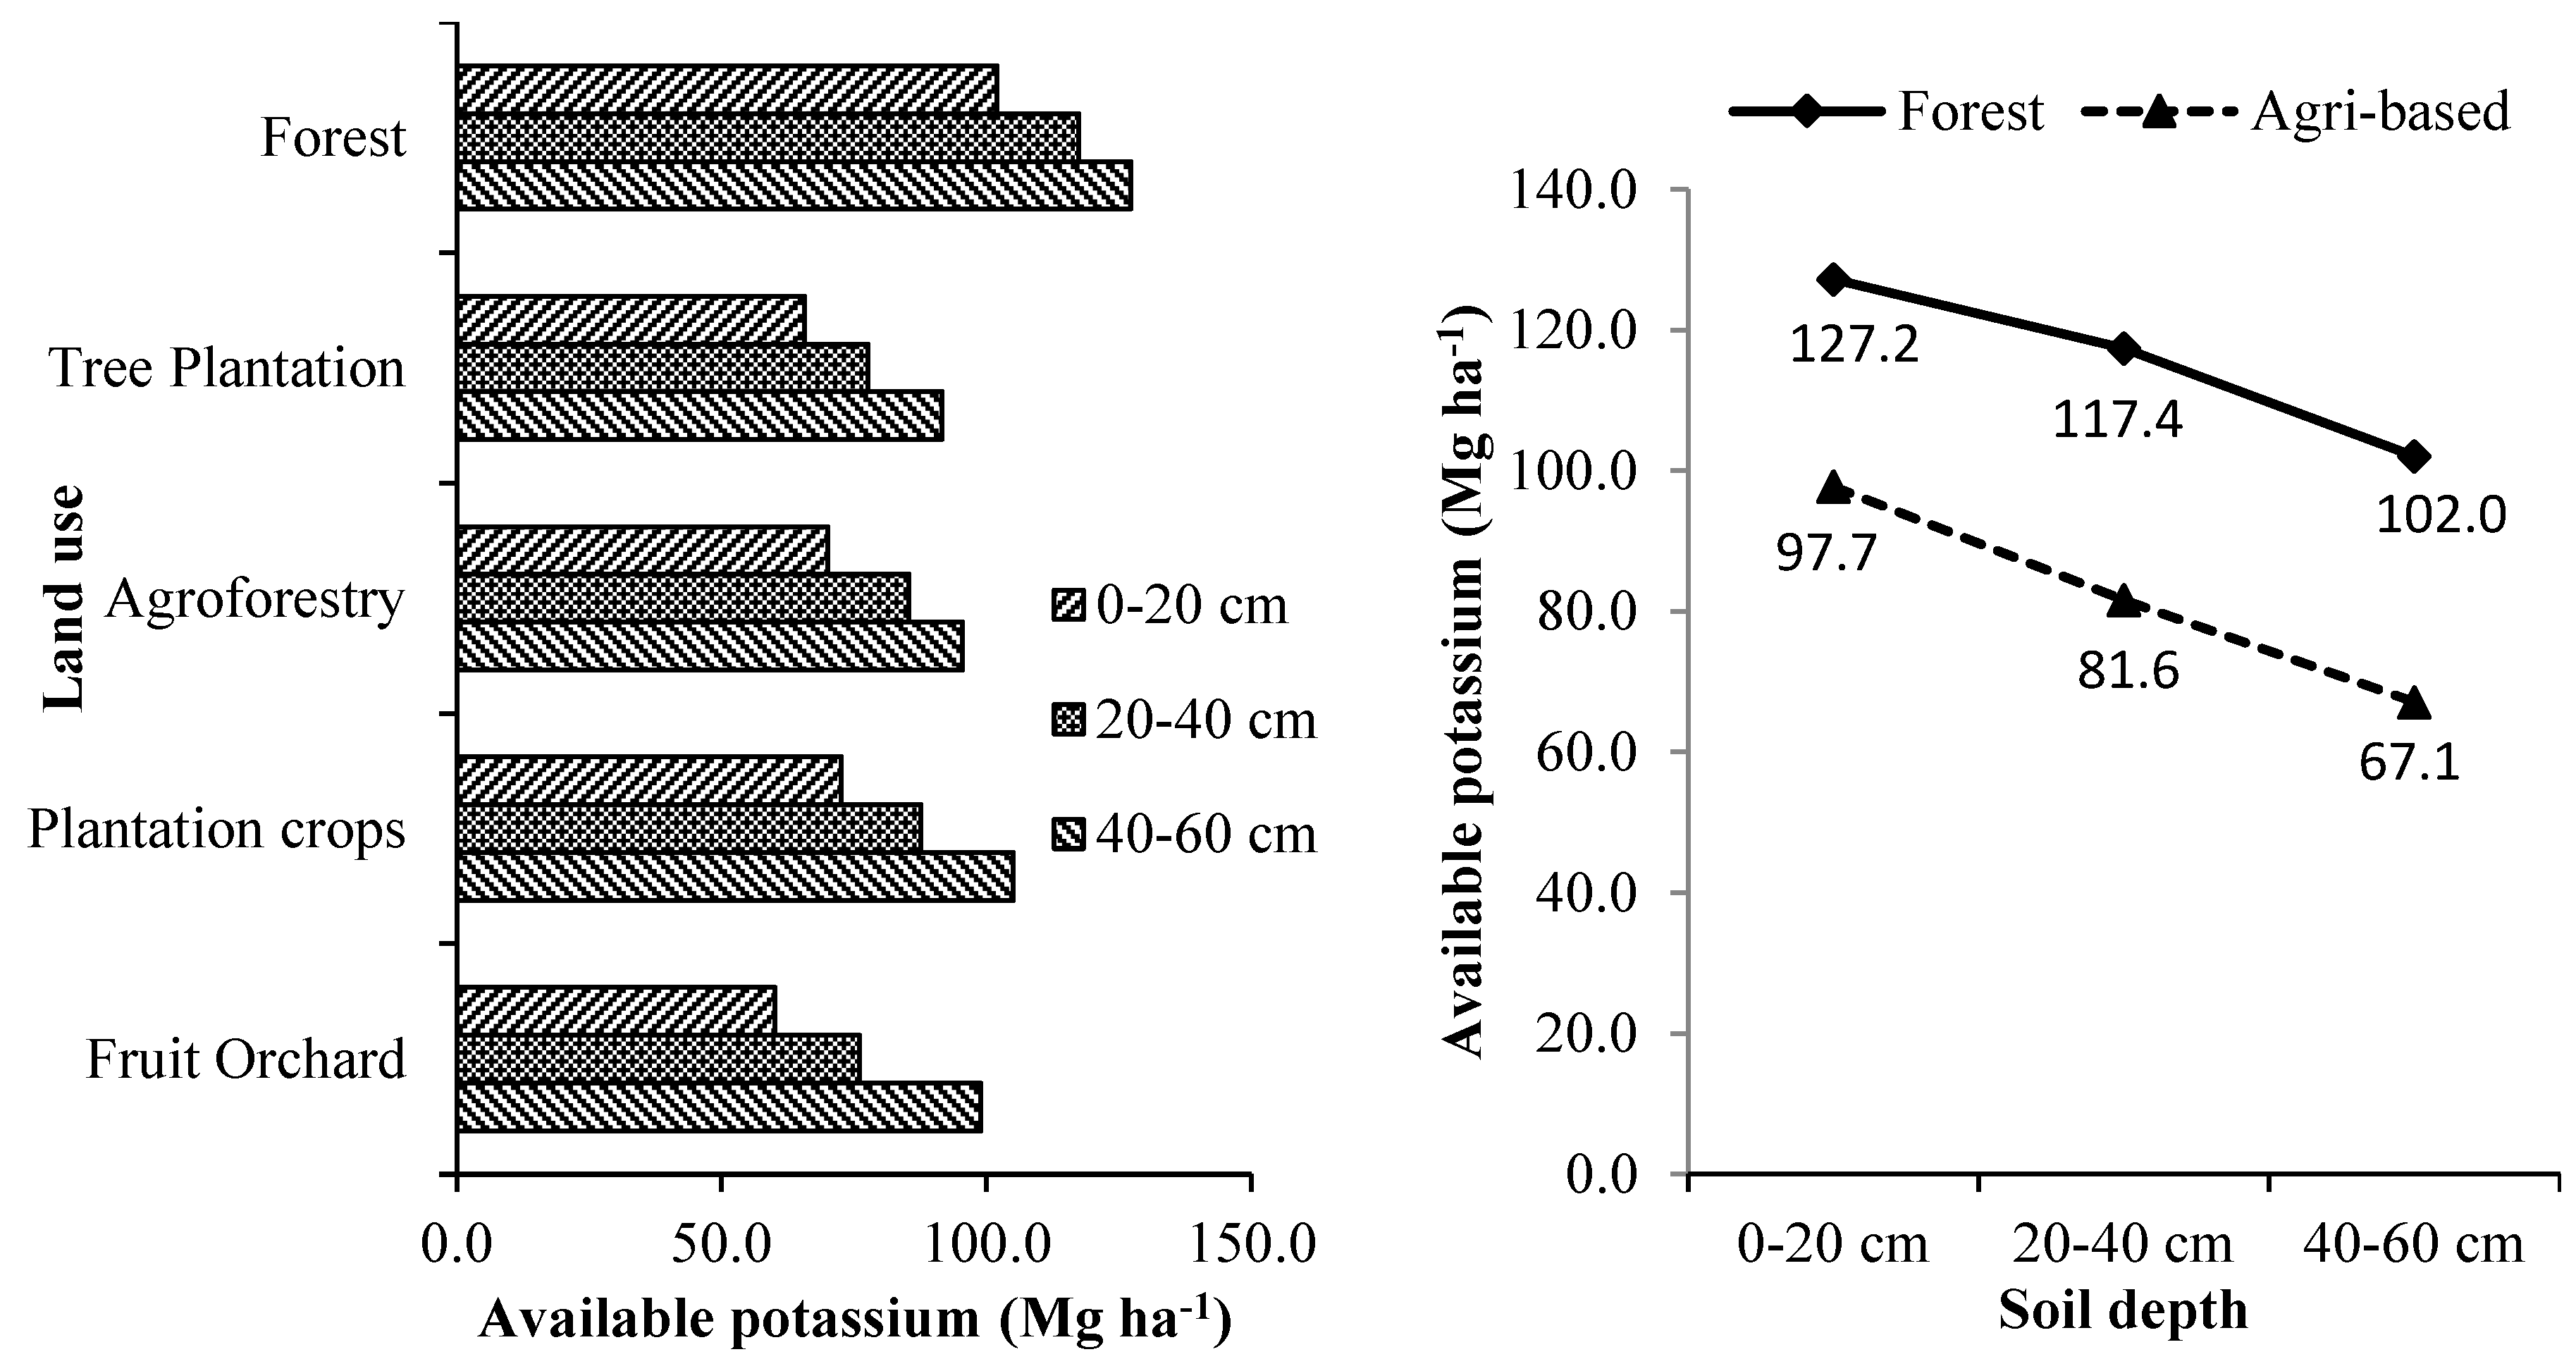
The estimated soil available potassium of the tree-based land use systems is given in
Supplementary Table S8 and
Figure 7. Land use and soil depth significantly influenced the availability of potassium. The trend of availability of potassium in the soils of the studied tree-based land use systems was similar to that of available phosphorus. The highest amount of soil available potassium was estimated for forests, which was significantly higher than the other tree-based land use systems. Available potassium in forest soils was 41.59 % more than the agricultural landscapes. The order of tree-based land use system in terms of its overall soil potassium availability is forests> commercial crop plantations > agroforestry systems > fruit orchards > forest tree plantations. The amount of these available primary nutrients decreased with the increase in the soil depth for all the land uses. The availability of primary soil nutrients in all the tree-based land use systems was in the order N > K > P. A similar order of these primary nutrients was also reported in earlier studies [
20,
21,
42]. The lesser soil primary nutrients and organic carbon estimated for tree-based systems than forests can be attributed to the conversions of natural forest and negative influence of such conversions were abundantly reported across the globe [
26,
63].
Additionally, nitrogen, potassium and phosphorus are differently absorbed and returned to the soil by different tree species growing in the different land use systems due to differences in the soil characteristics [
64]. Variations in soil water content, aeration, temperature, microorganisms and efficiency of the root system to absorb nutrients affect the availability of nutrients in the soil of different land use systems [
65]. The availability of primary nutrients in the soil is influenced by the amount of litter produced and the nutrient content in the litter [
66]. Litter produces soil organic matter, which is a source of SOC pool, and the amount of organic matter present in the soil regulates the soil's physical, chemical, and biological properties [
57]. Pearson’s correlation matrix (
Table 2) also confirmed the significant positive correlation of SOC with electrical conductivity, moisture content, and available soil primary nutrients while a significant negative correlation with soil pH. The quality and quantity of soil organic matter (SOM) in the soil determine the availability of soil nutrients and, thus, the production potential of the soil [
58,
67,
68]. The different tree-based land uses had different vegetation structure, composition and production [
69] thus, also had varied nutrient supply [
70]. Soil with higher organic matter also has higher total available nitrogen, available phosphorus and available potassium [
58]. Forests have higher organic matter in their soil compared to other land use systems due to diverse vegetation with higher litter production thus resulting in higher amount of available nutrient in its soil [
20,
21,
41,
42,
43,
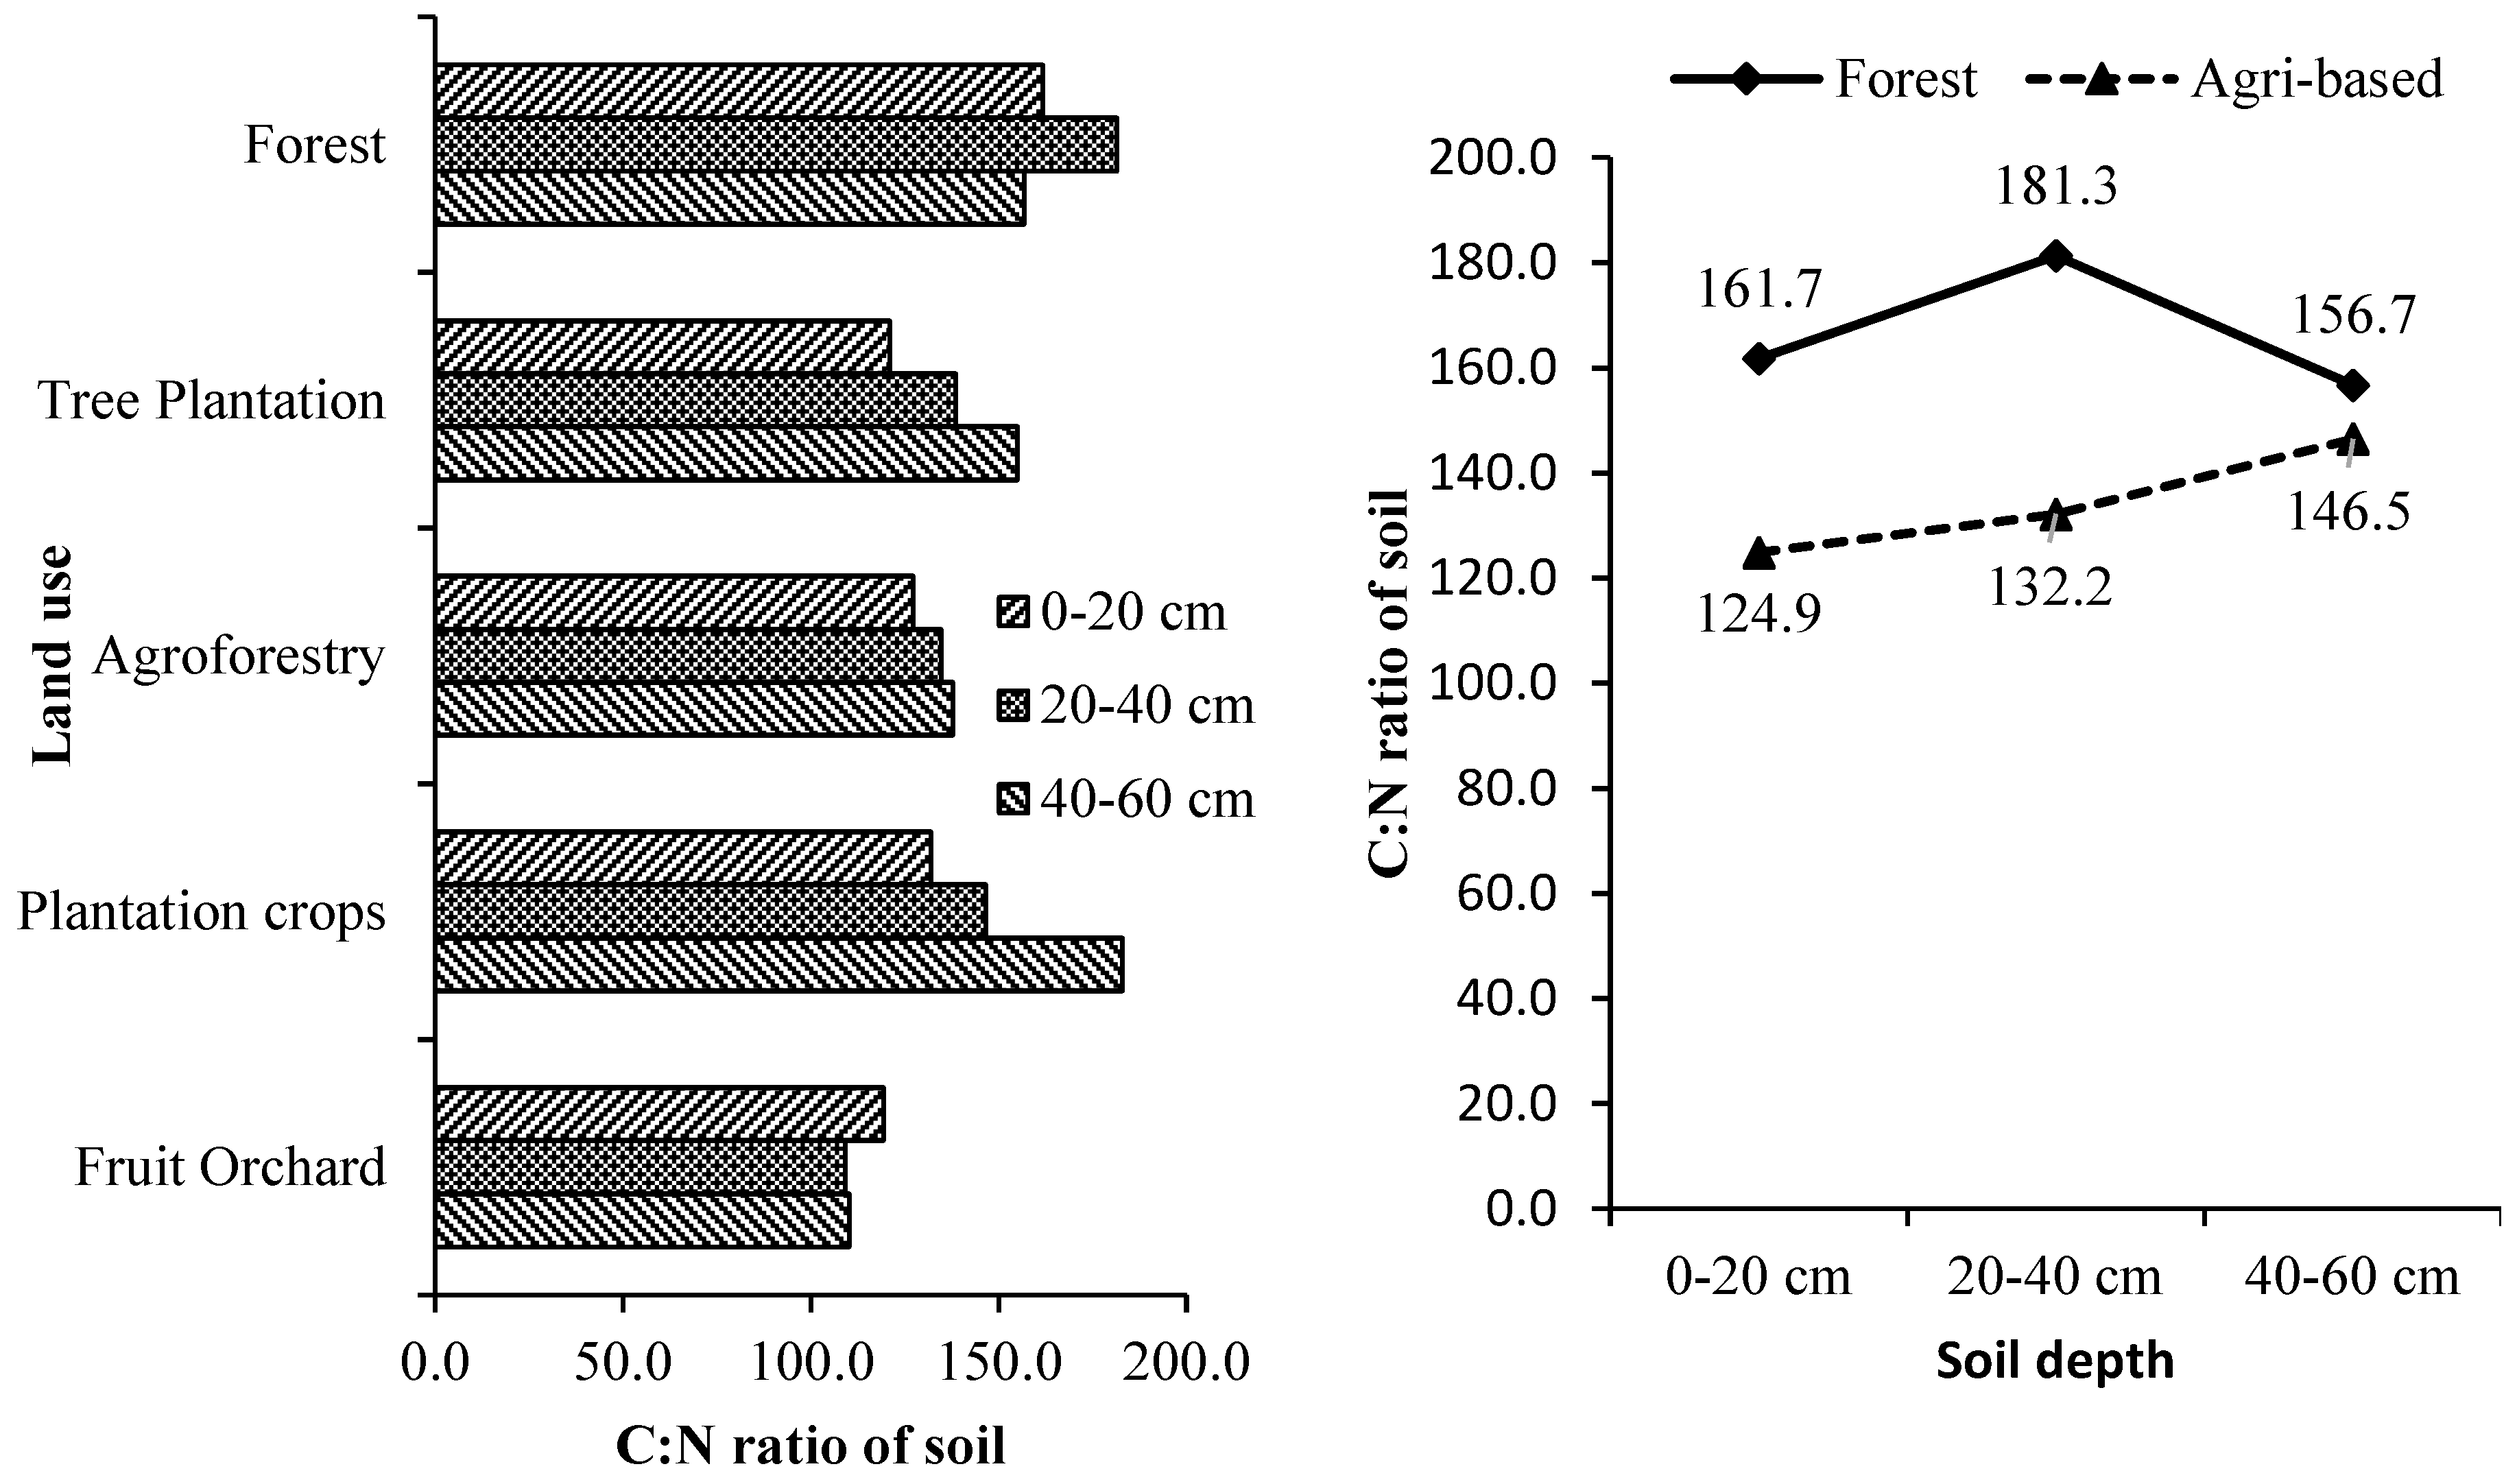
58]. Organic carbon, nitrogen and C: N ratio (
Supplementary Table S9 and
Figure 8) values are lowest in barren land, intermediate in cultivated well managed soil and highest in forest and cultivated unmanaged land [
71].
Studies also indicated the availability of carbon and nitrogen in the soil through its C: N ratio i.e., narrower the ratio more is the availability of nitrogen and vice versa [
72]. Soil C: N ratio varied significantly concerning soil depth, and tree-based land uses. The ratio became wider with increasing soil depth in all the tree-based land uses. Overall, tree-based land uses in the forested landscape were estimated with a broader C: N ratio than those in the agricultural landscapes. The order of tree-based land use systems in descending order based on the C: N ratio was Forests > Commercial Crop Plantations > Forest Tree Plantations > Agroforestry > Fruit Orchards. Considering the individual tree-based systems, the trend was Tea plantations (203:1) >
Lagerstroemia parviflora stand (173:1) >
Michelia champaca and
Tectona grandis (167:1) >
Shorea robusta (161:1).
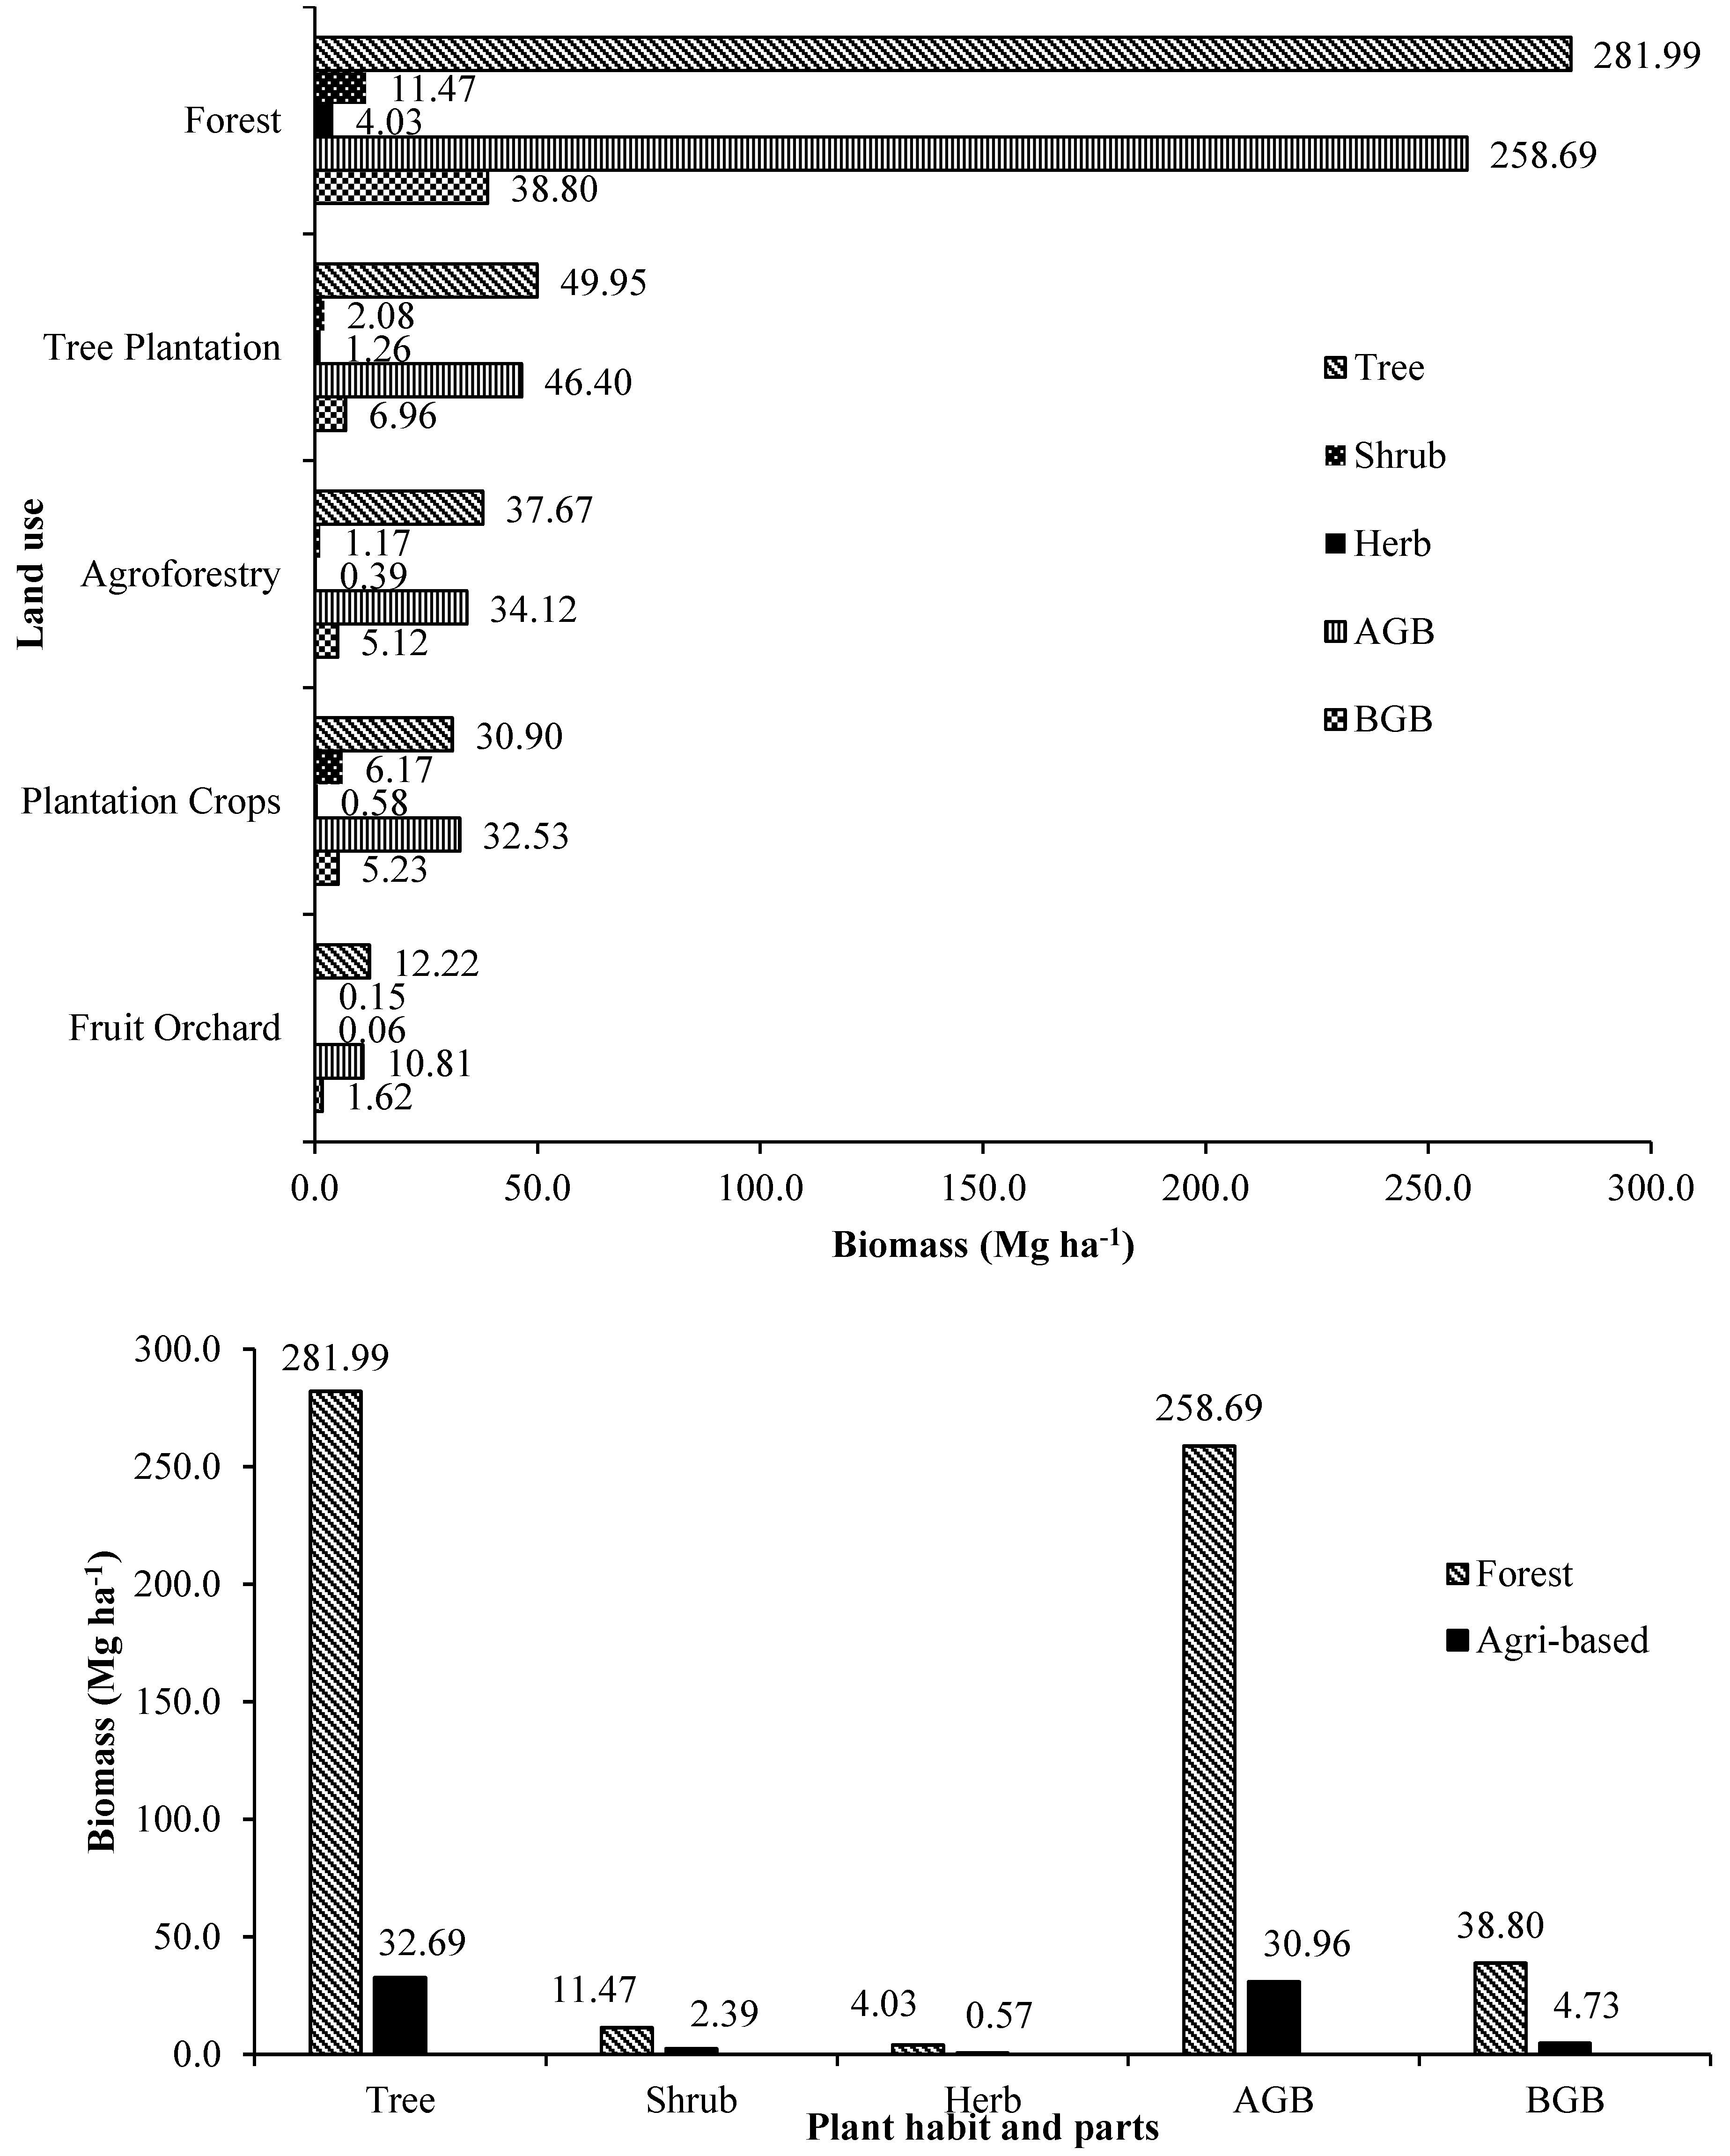
3.4. Biomass Accumulation and Partitioning
Standing plant biomass accumulation and partitioning in different tree-based land use systems of Terai zone of West Bengal is given in
Supplementary Table S2 and
Figure 9a,b. Biomass stock in the above ground and below ground parts of forests (mixed species) was the highest with 667.49 and 100.12 Mg ha
-1, respectively. High biomass storage in natural forests and stands have been reported from earlier studies [
20,
73]. The total biomass (trees, shrubs, herbs and litter) of the forest (mixed species) was highest (781.21 Mg ha
-1) was followed by
Shorea robusta stand (278.69 Mg ha
-1),
Michelia champaca stand (168.84 Mg ha
-1),
Tectona grandis stand (163.64 Mg ha
-1),
Lagerstroemia parviflora stand (159.07 Mg ha
-1),
Anthocephalus cadamba +
Swietenia macrophylla plantation (111.86 Mg ha
-1), homegardens (97.38 Mg ha
-1), tea plantations (77.07 Mg ha
-1) and the least by
Citrus lemon orchard (6.28 Mg ha
-1).
In the agricultural landscape, the highest overall average total biomass was produced by forest tree plantations, agroforestry, commercial crop plantations and the least by orchards. In all the land use systems, the major contribution was the trees (61.20-99.23 %), followed by shrubs, herbs and litter. Among the forest tree plantations, the plantation of mixed tree species accumulated significantly more biomass than other sole forest tree plantations.
The amount of biomass estimated in this study for mixed species forest, pure tree species stands and homegardens was comparable with earlier studies reported from Terai zone of West Bengal [
20,
21,
41,
42,
43,
44,
74,
75]. Negligible contribution of understorey vegetation to the total biomass of the tree-based land uses were also reported in these earlier studies. Similar biomass accumulation of trees and its allocation to above and below ground parts in forest tree plantations, commercial crop plantation, agrisilvicultural plantations and fruit tree orchard were also abundantly reported [
76,
77,
78,
79,
80]. Biomass varies with differences in land use systems along with climate, species diversity, stem density, stem size distribution, edaphic conditions, topography site quality, age, density, structure, management practices and disturbance history along with variations in canopy height and wood density [
22,
81,
82]. Moreover, it would be inappropriate to draw quantitative comparisons among the studies because of significant differences in sample size, plot size and dimensions along with the differences in the environmental conditions and other site factors.
Biomass allocation and partitioning in different tree-based land use systems will be helpful to understand the plant life history strategies [
83,
84] as it influences the whole-plant net carbon gain and has a direct influence on future plant growth and reproduction [
85,
86]. This will improve the silvicultural techniques for efficient tree-based land use management along with identification of the productive tree-based land use systems through productivity of tree species [
87]. Biomass accumulation in tree-based land use systems can be conserved as carbon stock and cycling either regionally or globally for planning viable options to mitigate climate change. Quantifying the biomass stored in different tree-based land use systems will help to evaluate the contribution of tree species and its land use system to net carbon emissions and their potential for carbon sequestration [
88].
3.5. Biomass Carbon and Partitioning
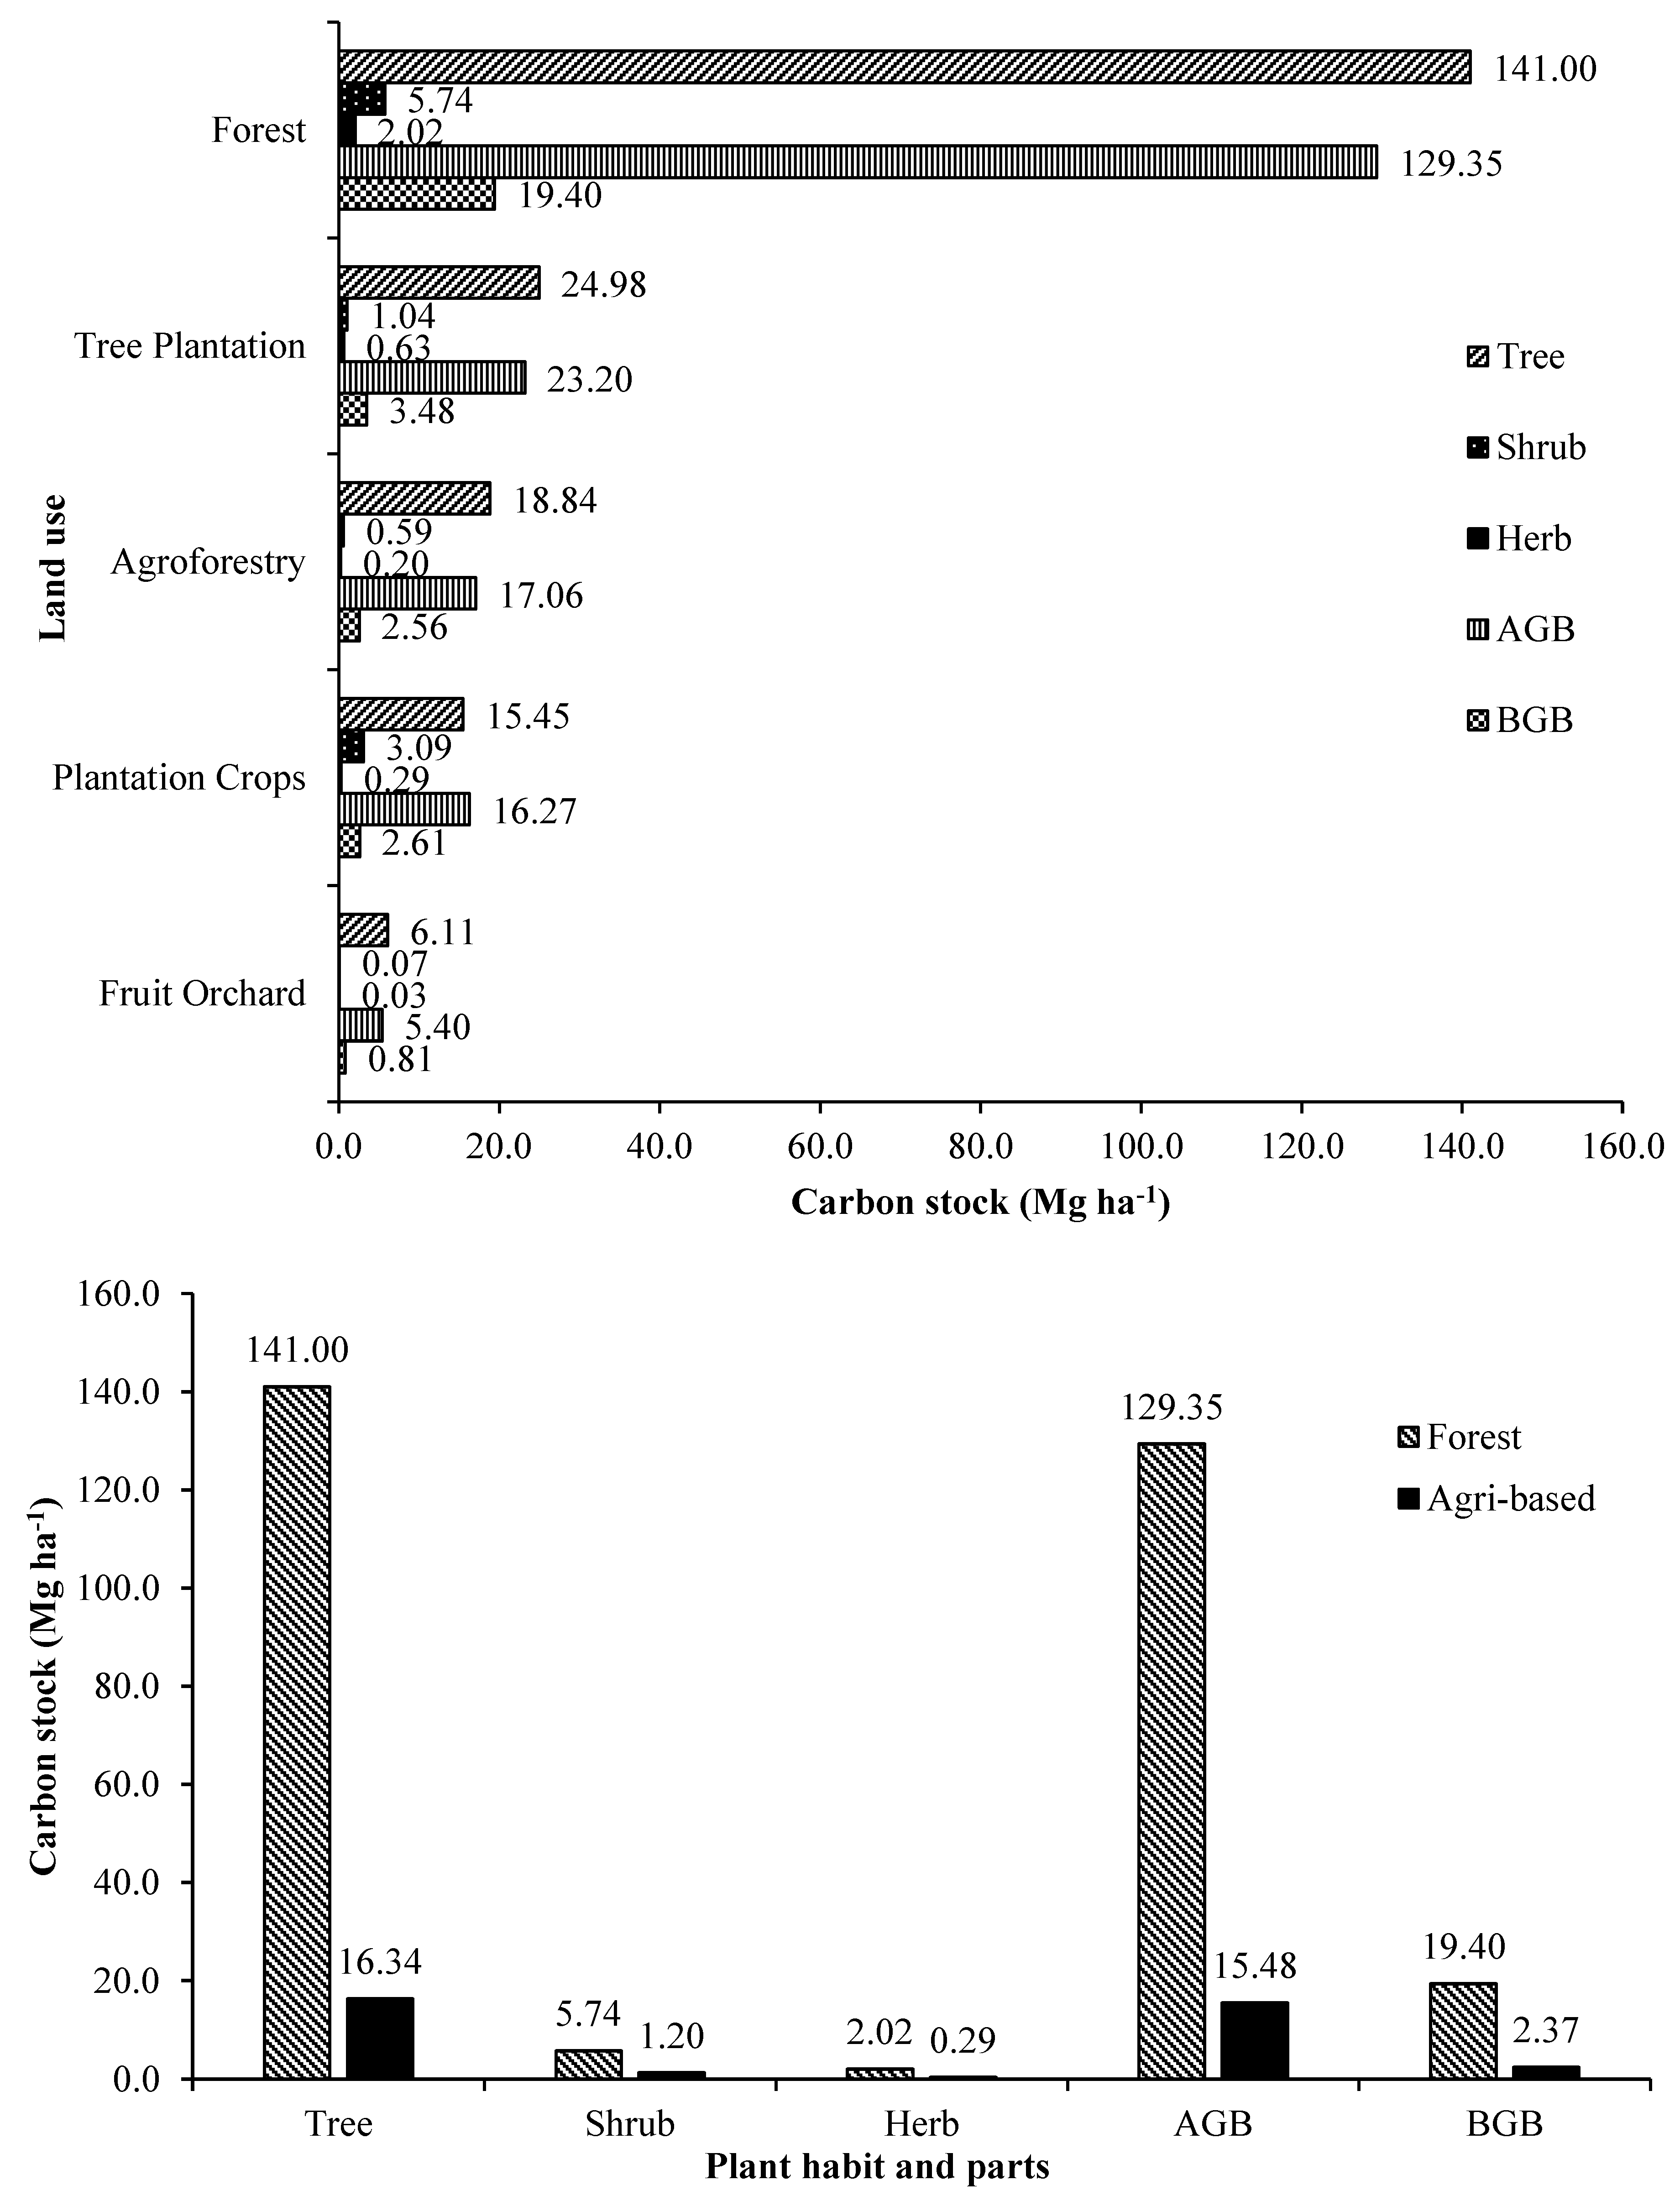
The standing plant biomass carbon and its partitioning are significantly influenced by tree-based land use systems (
Supplementary Table S10 and
Figure 10a,b). The trend is exactly the same as was observed for biomass accumulation because half of the biomass is its carbon [
9]. The overall average biomass carbon in the forest was significantly higher than the entire tree-based land use systems in the agricultural landscape. On an overall average, trees, shrubs and herbs in the forest landscapes stored highest carbon and were significantly higher than their counterparts in other tree-based land use systems of agricultural landscape.
Litter biomass carbon was also highest in the forest as litter production was also highest in it. Above ground and below ground biomass carbon was also highest in the forests and therefore, the total standing live plant biomass carbon in the forest was also highest. Consequently, the overall average total i.e., live and dead biomass carbon (155.15 Mg ha-1) was also highest in the land use systems of forest landscapes. In the forested landscapes mixed species forest accumulated the highest amount of biomass carbon 383.81 Mg ha-1, (tree 371.60 + shrub 8.90 + herb 3.31 Mg ha-1), above (333.75 Mg ha-1) and below (50.06 Mg ha-1) ground biomass carbon, litter carbon (6.8 Mg ha-1) and total carbon 390.61 Mg ha-1 (biomass + litter). The other best tree based land use systems in terms of biomass and total carbon were sole tree species stands in forest landscapes (72.49-133.13 & 79.54-139.35 Mg ha-1, respectively) followed by mixed species plantation of Anthocephalus cadamba + Swietenia macrophylla (55.78 & 55.93 Mg ha-1, respectively), homegardens (47.21 & 48.69 Mg ha-1, respectively), mixed plantation of Tectona grandis + Milvus migrans (42.12 & 42.99 Mg ha-1, respectively), Swietenia macrophylla based agroforestry plantation (40.41 & 41.91 Mg ha-1, respectively), tea plantations (38.41 & 38.54 Mg ha-1, respectively) and the least by Citrus lemon orchard (3.1 & 3.14 Mg ha-1, respectively).
In terms of overall average plant biomass carbon and total carbon stock, the order of the major tree-based land use systems is forest land use (148.75 & 155.15 Mg ha
-1, respectively) > forest tree plantations (26.65 & 27.82 Mg ha
-1, respectively) > agroforestry plantations (19.74 & 20.14 Mg ha
-1, respectively) > Commercial crop plantations (18.83 & 19.09 Mg ha
-1, respectively) > fruit orchards (6.22 & 6.38 Mg ha
-1, respectively). Carbon stock is intricately associated with site quality, nature of land use, choice of species and other silvicultural practices adopted [
89] which explains higher biomass of forest land uses and hence more carbon stock. Higher biomass of forest land uses was also due to efficient utilization of space due to presence of grasses/ferns, shrubs and trees on the same unit area of land. Higher SOC in forest soil increased the rate of plant growth increasing the biomass again. The tree-based land uses differed in terms of diversity and tree density. It was reported that there exists a potential functional relationship between plant diversity and carbon storage [
19,
20,
21] which is indicated through higher carbon storage of mixed species forest as compared to other tree-based land uses. Forest land uses are plant assemblages with high species diversity with more efficient resource use and greater net primary production than with tree-based land uses with one or few species. These plant assemblages sequester carbon with higher rates than those with lower species diversity [
90,
91].
3.6. Ecosystem Carbon in Tree Based Land Use Systems
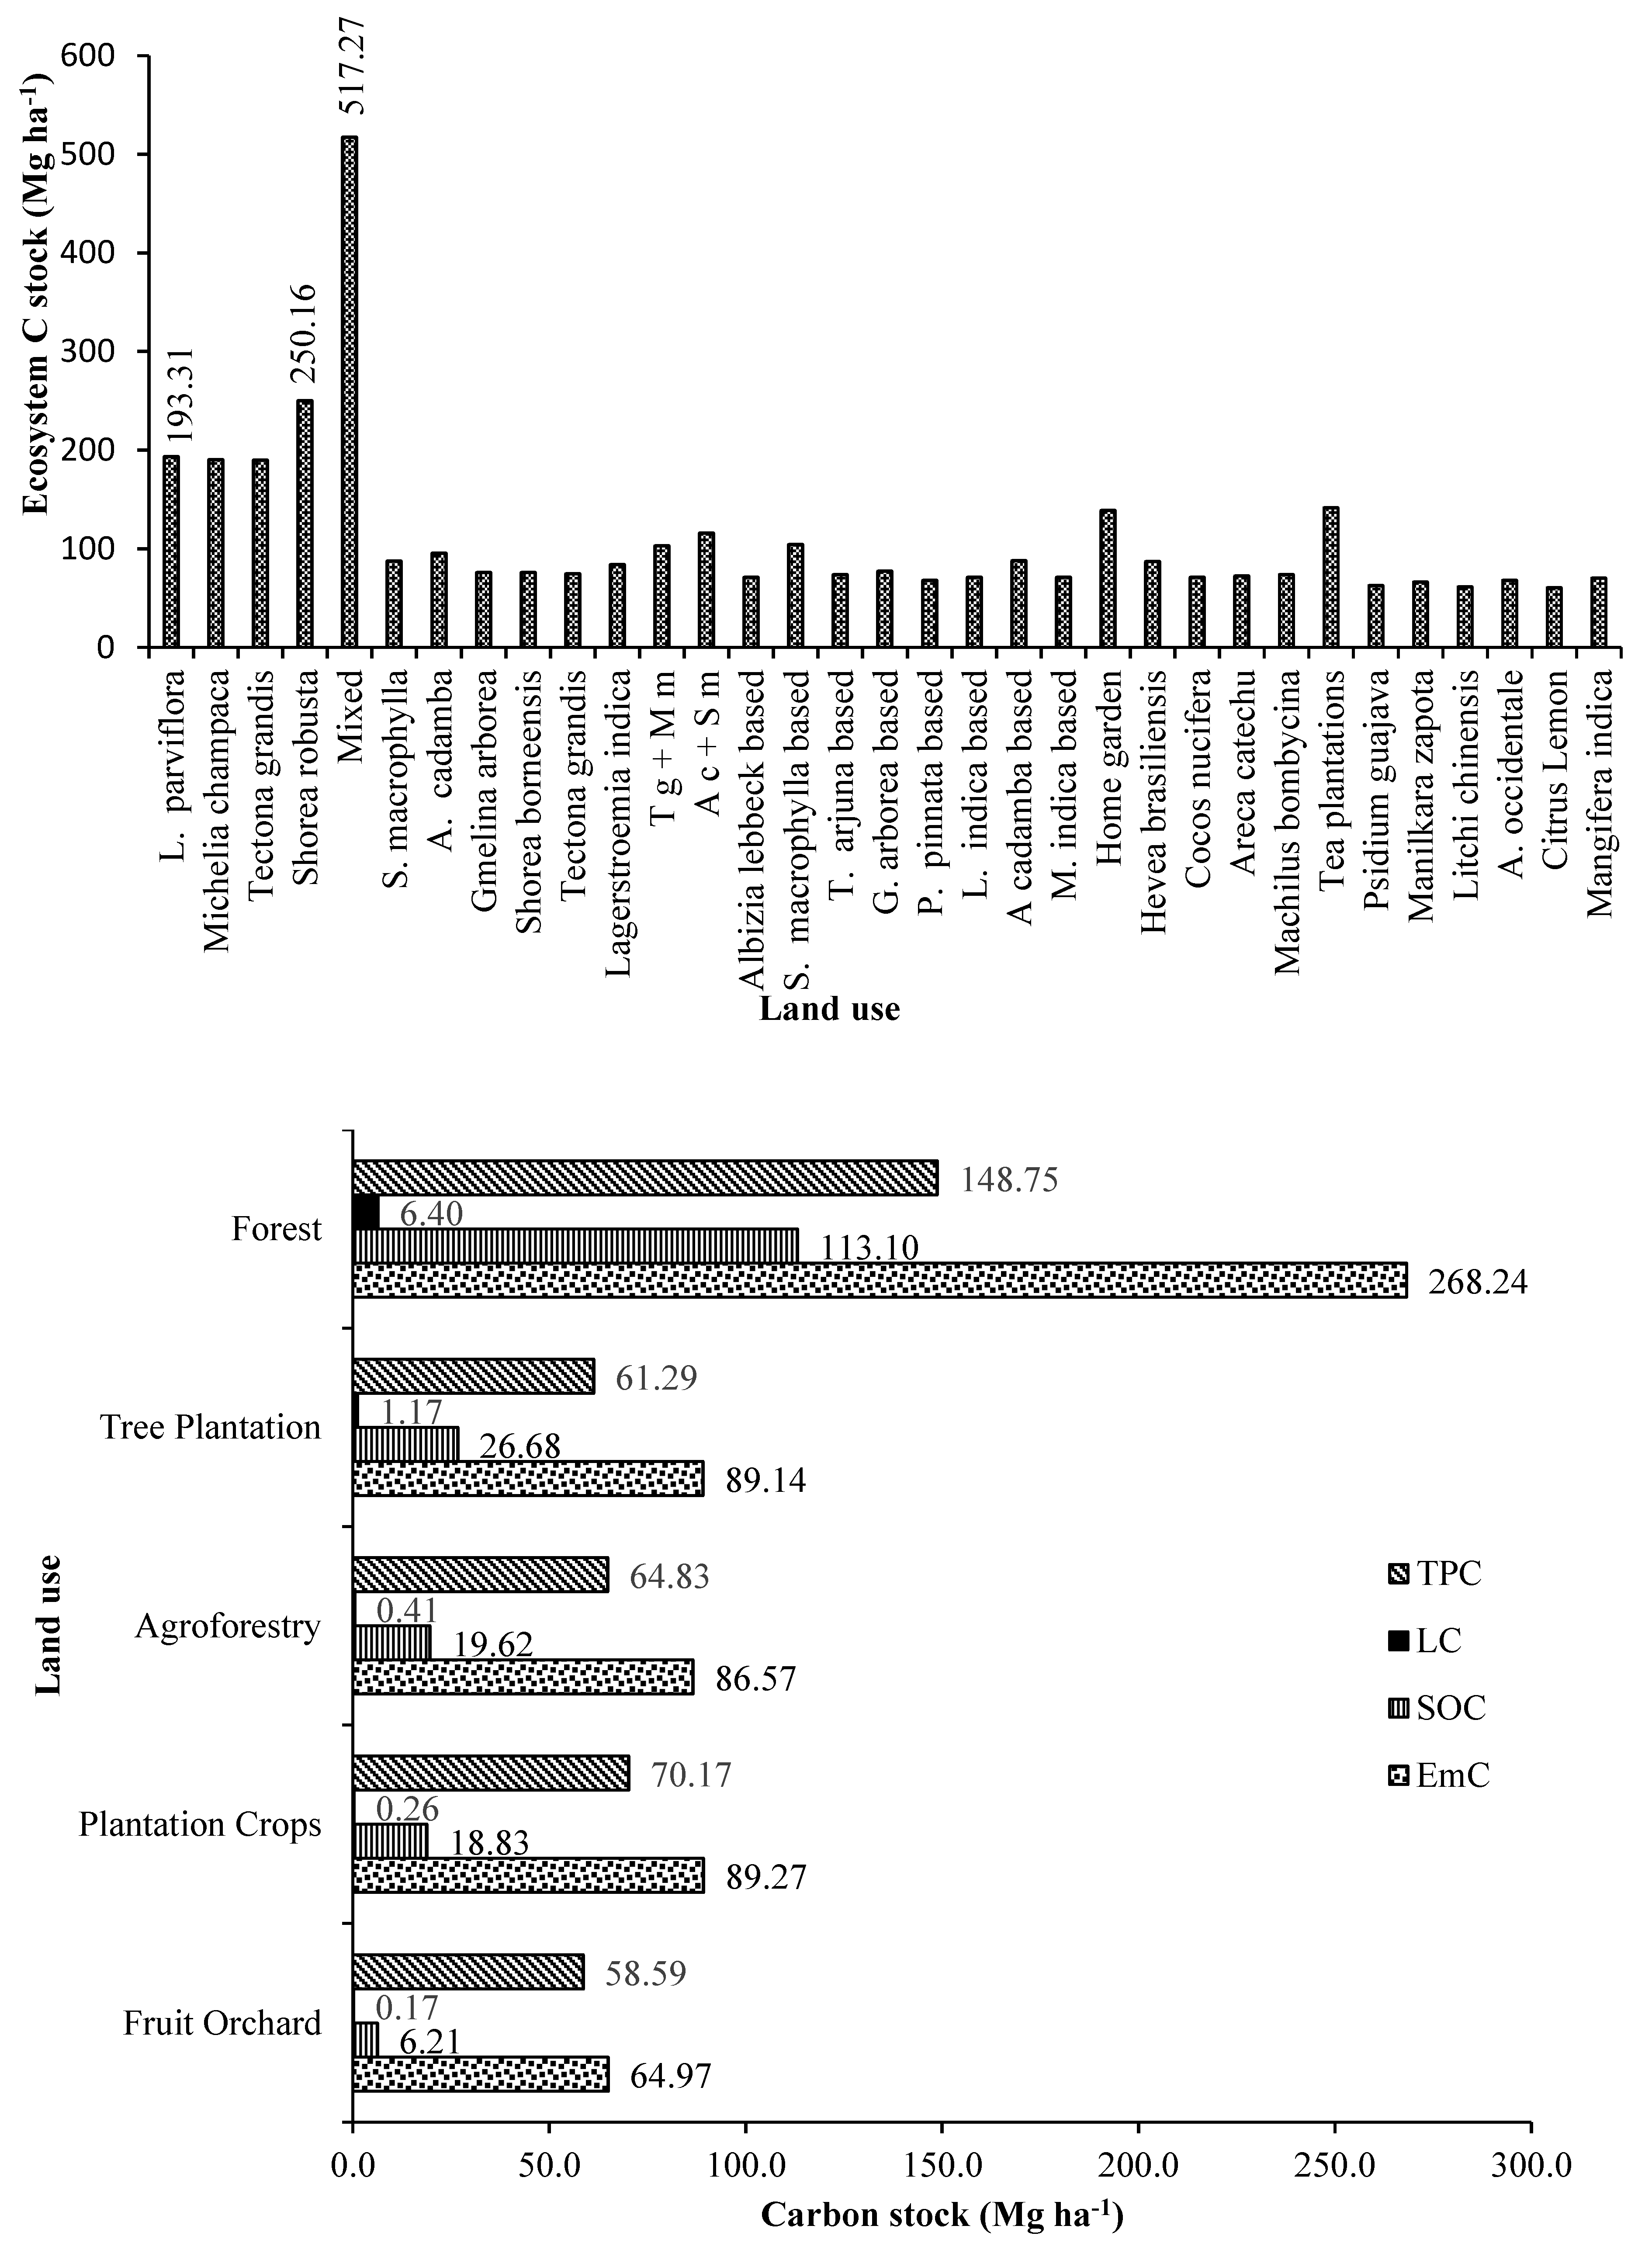
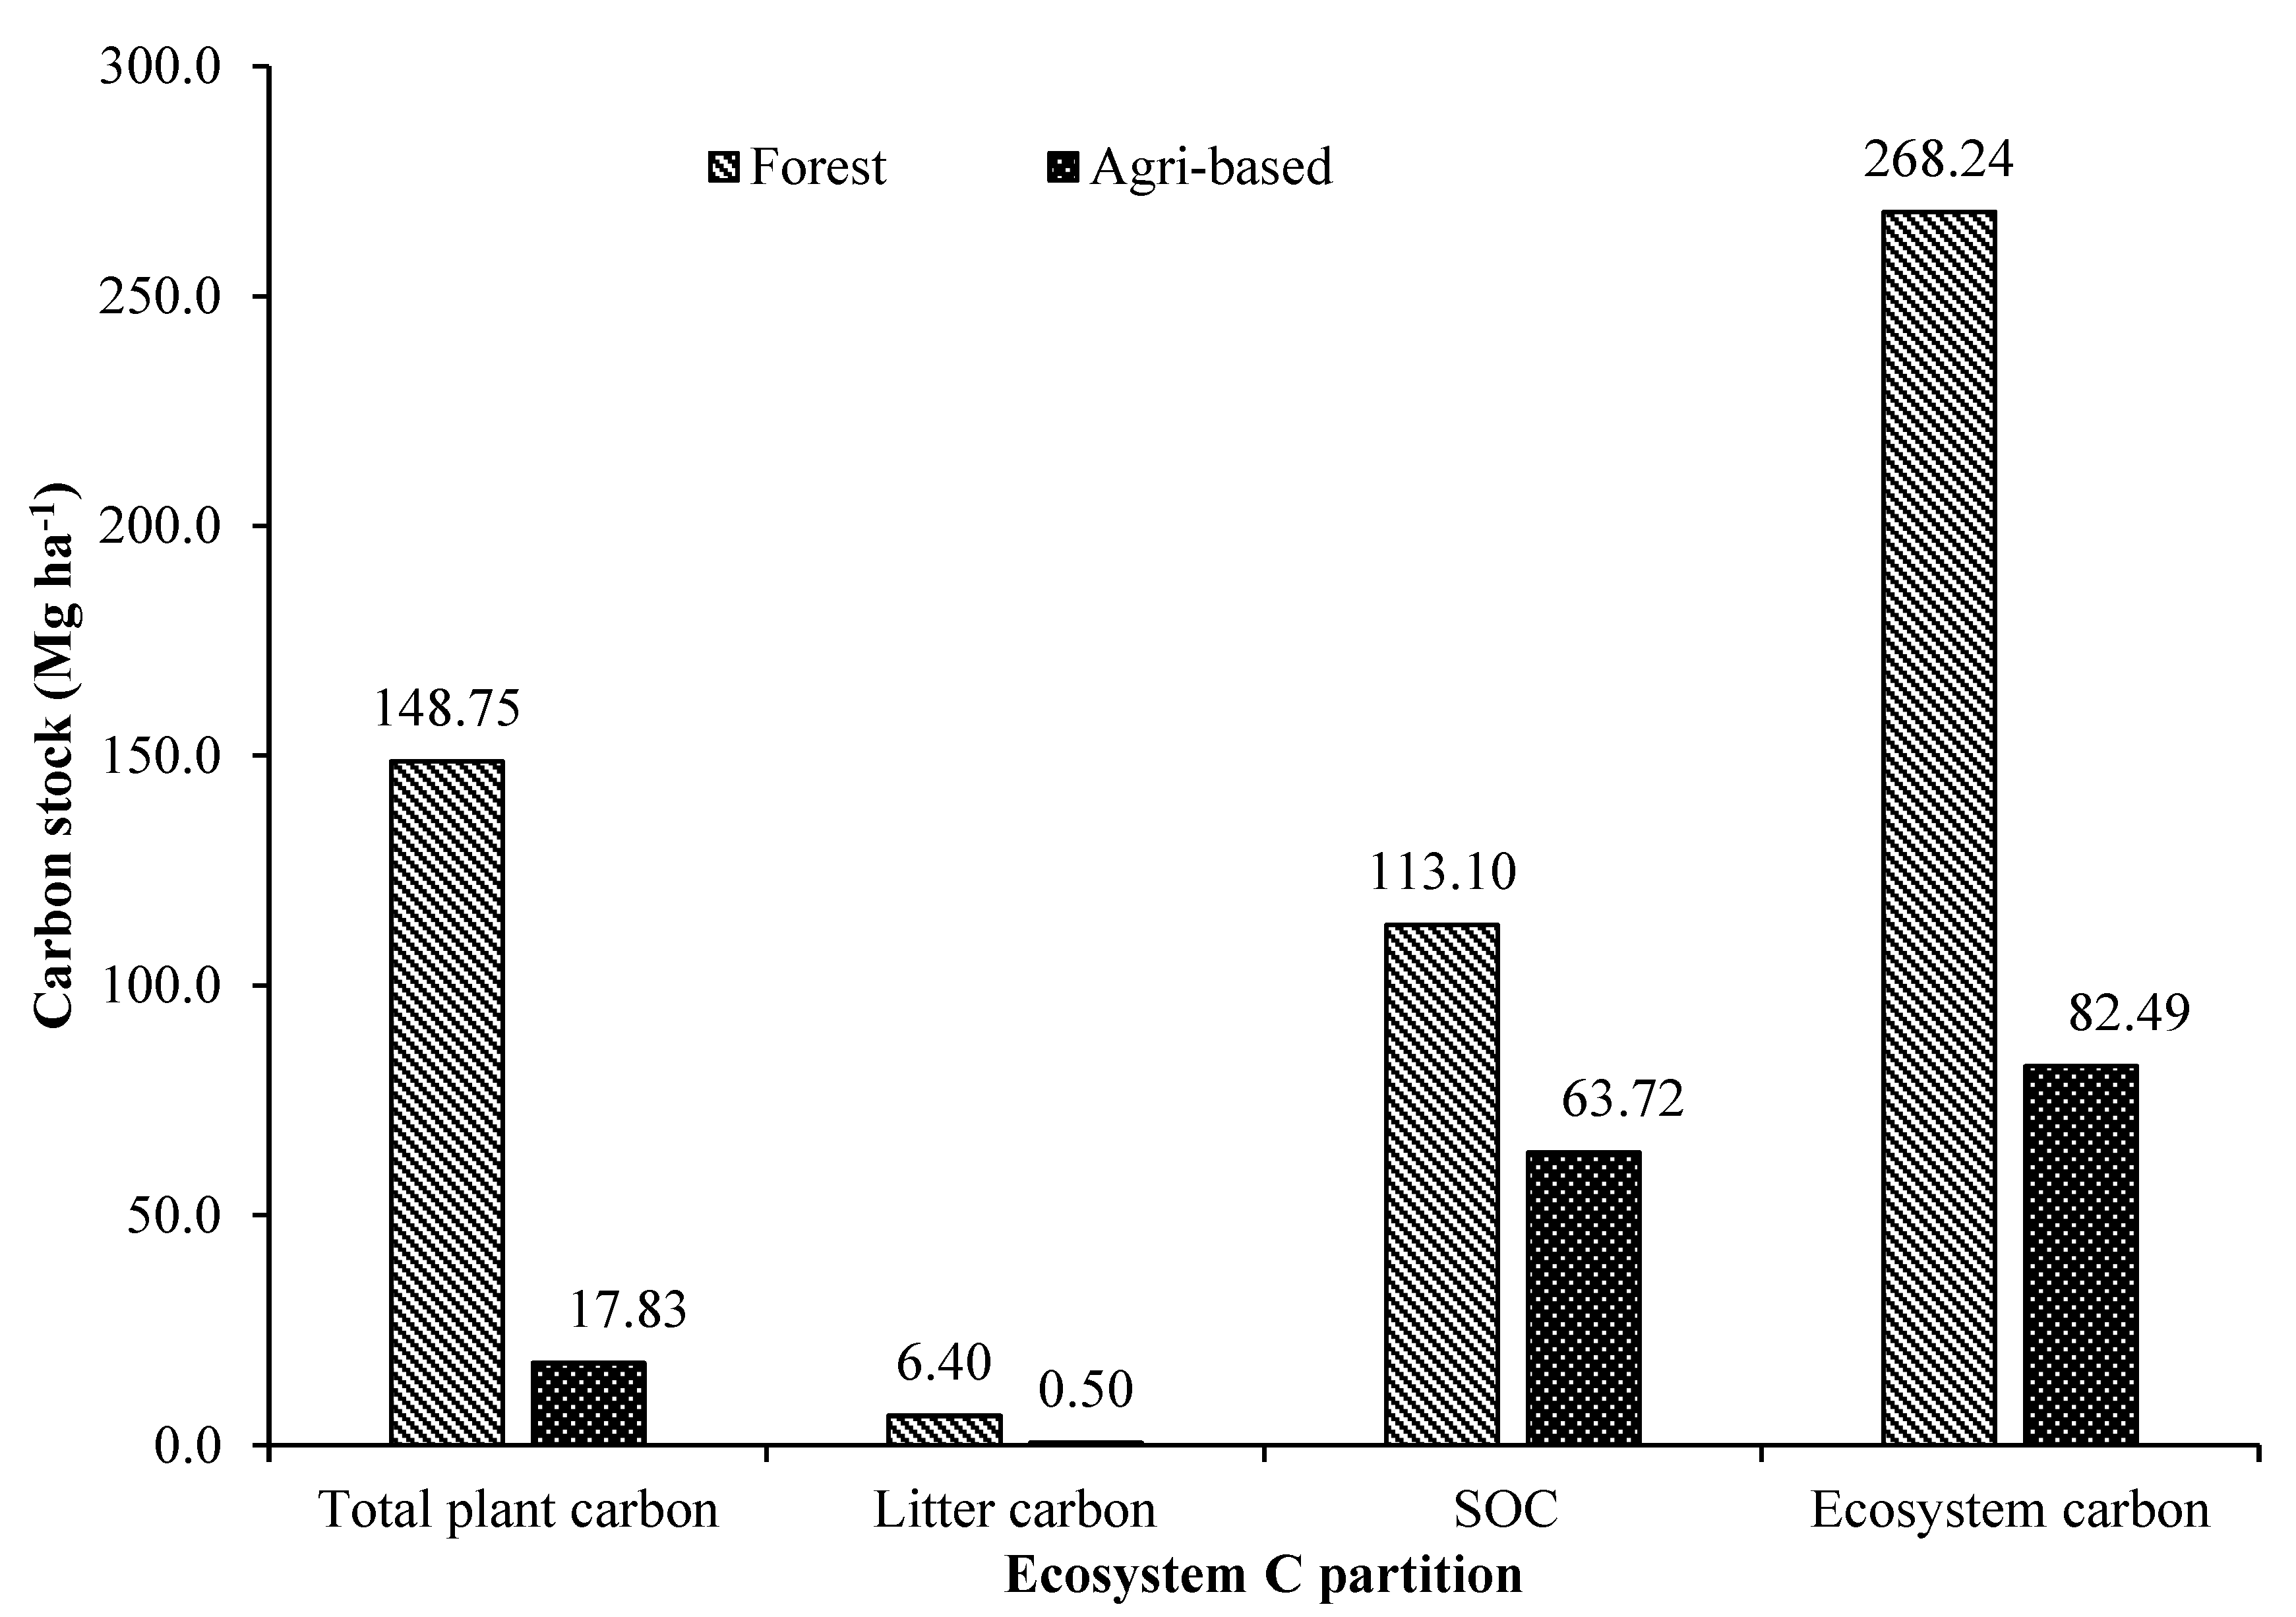
The ecosystem carbon accumulation in the tree-based land uses in both forest and agricultural landscape was highly variable and was significantly differing among the land uses. Consequent of highest total standing plant biomass carbon, litter production and total SOC of entire observed soil depth, the forest land uses were also estimated with highest overall average ecosystem carbon stock of 268.24 Mg ha-1. The order of forest base land uses in terms of ecosystem carbon accumulation was mixed species forest > Shorea robusta stand (250.16 Mg ha-1) > Lagerstroemia parviflora stand (193.31 Mg ha-1) > Michelia champaca stand (190.55 Mg ha-1) > Tectona grandis stand (189.93 Mg ha-1). Forest land uses were accumulating 3.24 times more carbon than the land uses in agricultural landscapes. The best tree-based land uses in agricultural landscape in terms of ecosystem carbon accumulation was tea plantations (141.74 Mg ha-1) > homegardens (139.02 Mg ha-1) > mixed plantation of Anthocephalus cadamba + Swietenia macrophylla (116.02 Mg ha-1) > Swietenia macrophylla based agroforestry (104.4 Mg ha-1) > Tectona grandis + Milvus migrans (102.99 Mg ha-1).
In terms of ecosystem carbon accumulation, the order of the major land uses is forests > commercial plantation crop land uses > forest tree plantations > agroforestry land uses > fruit orchards. In forest tree plantations, the best land use in terms of ecosystem carbon was mixed plantations followed by sole tree species plantations in the order
Anthocephalus cadamba +
Swietenia macrophylla plantations (116.02 Mg ha
-1) >
Tectona grandis +
Milvus migrans plantations 102.99 Mg ha
-1) >
Anthocephalus cadamba plantations (95.55 Mg ha
-1) >
Swietenia macrophylla plantations (87.44 Mg ha
-1) >
Lagerstroemia indica plantations (84.21 Mg ha
-1) >
Shorea borneensis plantations (76.12 Mg ha
-1) >
Gmelina arborea plantations (76.07 Mg ha
-1) >
Tectona grandis plantations (74.70 Mg ha
-1). The tree plantations in the agricultural landscape were between 10-15 years of age, dense and unmanaged with no silvicultural operations. This was evidenced from the growth conditions of the plantations i.e., with lesser diameter and height, resulting lesser biomass and carbon accumulation as compared to forest [
21].
Similarly, in agroforestry land uses, the order based on ecosystem carbon accumulation was homegardens (139.02 Mg ha-1) > Swietenia macrophylla based (104.40 Mg ha-1) > Anthocephalus cadamba based (87.90 Mg ha-1) > Gmelina arborea based (77.31 Mg ha-1) > Terminalia arjuna based (73.65 Mg ha-1) > Albizia lebbeck based (71.14 Mg ha-1), Lagerstroemia indica based (71.14 Mg ha-1) > Mangifera indica based (71.12 Mg ha-1) > Millettia pinnata based (68.03 Mg ha-1). Homegardens are prominent in the Terai region of West Bengal while, agrisilvicultural farming are not practiced in the region except maintained in the farms of Uttar Banga Krishi Vishwavidyalaya (UBKV), Pundibari and thus studied with very less sample size compared to forest land uses and homegardens. The age of all the agrisilvicultural systems was about 20-25 years and was intercropped with mainly paddy and winter vegetables. The biomass and carbon accumulation were comparatively very lesser in the agricultural systems as compared to other land uses which might be due to smaller sampling size. Further, during the time of observation the systems were in continuous fallow with some shrubs and herbs as weed.
In commercial plantation crop land use systems, the order in terms of ecosystem carbon is tea plantations (141.74 Mg ha-1) > Hevea brasiliensis plantation (87.10 Mg ha-1) > Machilus bombycina plantation (73.66 Mg ha-1) > Areca catechu plantation (72.19 Mg ha-1) > Cocos nucifera (71.24 Mg ha-1). Hevea brasiliensis, Cocos nucifera and Machilus bombycina are not commercially viable plantation crops of the region and thus, uncommon land use in Terai zone of West Bengal. The sampling size of these plantations were also very less as compared to other land uses. Areca nut and tea are commercial crop of the region and thus, a prominent land use of Terai zone of West Bengal. Psidium guajava, Manilkara zapota, Litchi chinensis, Anacardium occidentale, Citrus lemon, Mangifera indica are also not commercially grown in the Terai region of West Bengal and hence the sample size was small. However, in terms of ecosystem carbon accumulation these fruit tree land uses are in the order of Mangifera indica (70.16 Mg ha-1).> Anacardium occidentale (68.18 Mg ha-1) > Manilkara zapota (66.48 Mg ha-1) > Psidium guajava (62.74 Mg ha-1) > Litchi chinensis (61.48 Mg ha-1) > Citrus lemon (60.77 Mg ha-1)
Land use management is the major option for sequestering carbon in biomass and soil viably for efficient climate change mitigation by restricting carbon emission and capturing the atmospheric carbon as permanent storage in tree biomass and soil [
92,
93,
94]. The best land management for longer duration carbon storage in soil and biomass is conversion of less or unproductive and degraded land use through rehabilitation with afforestation by restoring its SOC [
95,
96,
97] which not only will enhance soil conditions but offsets greenhouse gas emissions as well [
52]. Land use conversion of inferior or degraded land through afforestation is the best climate change mitigation option because the sequestration rate through afforestation is highest (0.6 Mg C ha
-1 yr
-1) as compared to other mitigation options like conversion to pasture (0.5 Mg C ha
-1 yr
-1), organic amendments (0.5 Mg C ha
-1 yr
-1), residue incorporation (0.35 Mg C ha
-1 yr
-1), no or reduced tillage (0.3 Mg C ha
-1 yr
-1) and 0.2 Mg C ha
-1 yr
-1 for crop rotation [
94].
4. Conclusions
It was evidenced that forests had the highest SOC stock with the lowest pH, higher EC and soil moisture content, and the highest availability of primary soil nutrients. In terms of ecosystem carbon accumulation, the order of the major land uses was forests > commercial crop plantations > forest tree plantations > agroforestry > fruit orchards. Overall, the forests accumulated 3.24 times more carbon than the other tree-based land uses in agricultural landscapes. The results of the present study also indicated that land use and land cover change (LUCC) are crucial determinants for terrestrial carbon sources and sink in the region. Therefore, afforestation programs for rehabilitating degraded lands with Tectona grandis, Shorea robusta, Michelia champaca and Lagerstroemia parviflora are recommended as carbon farming initiatives on the degraded forested landscape or the agricultural landscape. The agroforestry models, including Areca catechu, Cocos nucifera, Machilus bombycina, Hevea brasiliensis and tree fruit crops, can also be tried for promoting carbon farming and enhancing rural socio-economy in the region. Additionally, short rotation tree plantations of Swietenia macrophylla, Anthocephalus cadamba, Gmelina arborea, Shorea borneensis and Milvus migrans can be an option to sequester carbon and to meet increasing industrial and domestic demands. Homegardens are a prominent landscape feature of the region but need more research and institutional support to make it more remunerative for small landowners. The results obtained from the present study can be used in future research for a detailed study of ecosystem carbon dynamics along LULC at any spatial level.
Supplementary Materials
The following supporting information can be downloaded at the website of this paper posted on Preprints.org.
Author Contributions
Conceptualization, S.C.; methodology, S.C., G.S. and A.J.N.; software, resources and formal analysis, S.C., T.D. and D.S.; data curation, T.D., M.S., A. A., M.T., S.N.N. and S.C.; writing- original draft preparation, S.C., and T.D.; writing- review and editing, S.C., G.S. and A.J.N.; supervision, S.C. and G.S.; project administration, S.C.; funding acquisition, S.C. All authors have read and agreed to the published version of the manuscript.
Funding
This research received no external funding.
Institutional Review Board Statement
Not applicable.
Informed Consent Statement
Not applicable.
Data Availability Statement
Data could be provided on reasonable request from the first author or corresponding author.
Acknowledgments
We would like to express our gratitude to all those who helped us during the writing of this article. The authors are thankful to the reviewers for their constructive comments to improve the quality of the paper.
Conflicts of Interest
The authors declare no conflict of interest.
References
- Foley, J.A.; Defries, R.; Asner, G.P.; Barford, C.; Bonan, G.; Carpenter, S.R.; Chapin, F.S.; Coe, M.T.; Daily, G.C.; Gibbs, H.K.; Kerlikowski, J.H.; Holloway, T.; Howard, E.A.; Kucharik, C.J.; Monfreda, C.; Patz, J.A.; Prentice, I.C.; Ramankutty, N.; Snyder, P.K. Global consequences of land use. Science 2005, 309, 570–574. [Google Scholar] [CrossRef]
- Marland, G.; Boden, T.A.; Andres, R.J. Global, regional, and national CO2 emissions. In Trends: A Compendium of data on global change. Carbon Dioxide Information Analysis Centre, Oak Ridge National Laboratory, U.S. Department of Energy Oak Ridge, Tenn, USA, 2007.
- Ciais, P.; Sabine, C.; Bala, G.; Bopp, L.; Brovkin, V.; Canadell, J.; Chhabra, A.; DeFries, R.; Galloway, J.; Heimann, M.; Jones, C.; Le Quéré, C.; Myneni, R.B.; Piao, S.; Thornton, P. Carbon and other biogeochemical cycles. In Climate Change 2013: The Physical Science Basis. Contribution of Working Group I to the Fifth Assessment Report of the Intergovernmental Panel on Climate Change; Stocker, T.F., Qin, D., Plattner, G.-K., Tignor, M., Allen, S.K., Boschung, J., Nauels, A., Xia, Y., Bex, V., Midgley, P.M., Eds.; Cambridge University Press, Cambridge, United Kingdom and New York, NY, USA, 2013.
- Achard, F.; Beuchle, R.; Mayaux, P.; Stibig, H.-J.; Bodart, C.; Brink, A.; Carbonic, S.; Desclée, B.; Donnay, F.; Eva, H.D.; Lupi, A.; Raši, R.; Seliger, R.; Simonetti, D. Determination of tropical deforestation rates and related carbon losses from 1990 to 2010. Global Change Biology 2014, 20, 2540–2554. [Google Scholar] [CrossRef]
- Le Quéré, C.; Moriarty, R.; Andrew, R.M.; Peters, G.P.; Ciais, P.; Friedlingstein, P.; Jones, S.D.; Sitch, S.; Tans, P.; Arneth, A.; Boden, T.A.; Bopp, L.; Bozec, Y.; Canadell, J.G.; Chini, L.P.; Chevallier, F.; Cosca, C.E.; Harris, I.; Hoppema, M.; Houghton, R.A.; House, J.I.; Jain, A.K.; Johannessen, T.; Kato, E.; Keeling, R.F.; Kitidis, V.; Klein, G.K.; Koven, C.; Landa, C.S.; Landschützer, P.; Lenton, A.; Lima, I.D.; Marland, G.; Mathis, J.T.; Metzl, N.; Nojiri, Y.; Olsen, A.; Ono, T.; Peng, S.; Peters, W.; Pfeil, B.; Poulter, B.; Raupach, M.R.; Regnier, P.; Rödenbeck, C.; Saito, S.; Salisbury, J.E.; Schuster, U.; Schwinger, J.; Séférian, R.; Segschneider, J.; Steinhoff, T.; Stocker, B.D.; Sutton, A.J.; Takahashi, T.; Tilbrook, B.; van der Werf, G.R.; Viovy, N.; Wang, Y.-P.; Wanninkhof, R.; Wiltshire, A.; Zeng, N. Global carbon budget. Earth System Science Data 2015, 7, 47–85. [Google Scholar] [CrossRef]
- Le Quéré, C.; Peters, G.P.; Andres, R.J.; Andrew, R.M.; Boden, T.A.; Ciais, P.; Friedlingstein, P.; Houghton, R.A.; Marland, G.; Moriarty, R.; Sitch, S.; Tans, P.; Arneth, A.; Arvanitis, A.; Bakker, D.C.E.; Bopp, L.; Canadell, J.G.; Chini, L.P.; Doney, S.C.; Harper, A.; Harris, I.; House, J.I.; Jain, A.K.; Jones, S.D.; Kato, E.; Keeling, R.F.; Klein, G.K.; Körtzinger, A.; Koven, C.; Lefèvre, N.; Maignan, F.; Omar, A.; Ono, T.; Park, G.-H.; Pfeil, B.; Poulter, B.; Raupach, M.R.; Regnier, P.; Rödenbeck, C.; Saito, S.; Schwinger, J.; Segschneider, J.; Stocker, B.D.; Takahashi, T.; Tilbrook, B.; van Heuven, S.; Viovy, N.; Wanninkhof, R.; Wiltshire, A.; Zaehle, S.(2014) Global carbon budget Earth System Science Data 2013, 6, 235-263. [CrossRef]
- Houghton, R.A. Revised estimates of the annual net flux of carbon to the atmosphere from changes in land use and land management 1850-2000. Tellus Series B Chemical and Physical Meteorology 2003, 55, 378–390. [Google Scholar]
- Houghton, R.A.; Goodale, C.L. Effects of land-use change on the carbon balance of terrestrial ecosystems. In Ecosystems and Land Use Change; DeFries, R.S., Asner, G.P., Houghton, R.A., Eds.; American Geophysical Union, Washington, DC., Eds.; Pp. 85-98.
- IPCC. Land use, Land use Change and Forestry- A special report of the Intergovernmental Panel on Climate Change (IPCC) Cambridge University Press, The Edinburgh Building, UK, 2000.
- Zhang, W.J.; Liu, C.H. Some thoughts on global climate change: will it get warmer and warmer? Environmental Skeptics and Critics 2012, 1, 1–7. [Google Scholar]
- Chakravarty, S.; Puri, A.; Vineeta; Dey, T.; Rai, P.; Pala, N.A.; Shukla, G. Climate Change Impacts vis-à-vis Biodiversity. In Forests, Climate Change and Biodiversity; Sood, K.K.; Mahajan, V., Eds.; Kalyani Publishers, New Delhi, 2018; Pp. 223-241.
- Heimann, M.; Reichstein, M. Terrestrial ecosystem carbon dynamics and climate feedbacks. Nature 2008, 451, 289–292. [Google Scholar] [CrossRef]
- McAlpine, C.A.; Ryan, J.G.; Seabrook, L.; Thomas, S.; Dargusch, P.J.; Syktus, J.I.; Pielke, R.A.; Etter, A.E.; Fearnside, P.M.; Laurance, W.F. More than CO2: a broader paradigm for managing climate change and variability to avoid ecosystem collapse. Current Opinion in Environmental Sustainability 2010, 2, 334–346. [Google Scholar] [CrossRef]
- Nath, A.J.; Sileshi, G.W.; Laskar, S.Y.; Pathak, K.; Reang, D.; Nath, A.; Das, A.K. Quantifying carbon stocks and sequestration potential in agroforestry systems under divergent management scenarios relevant to India’s Nationally Determined Contribution. Journal of Cleaner Production 2021, 281, 124831. [Google Scholar] [CrossRef]
- Reang, D.; Nath, A.J.; Sileshi, G.W.; Hazarika, A.; Das, A.K. Post-fire restoration of land under shifting cultivation: a case study of pineapple agroforestry in the Sub-Himalayan region. Journal of Environmental Management 2022, 305, 114372. [Google Scholar] [CrossRef]
- Lawler, J.J.; Lewis, D.; Nelson, E.; Plantinga, A.J.; Polasky, S.; Withey, C.J.; Helmers, A.P.; Martinuzzi, S.; Pennington, D.; Radeloff, V.C. Projected land-use change impacts on ecosystem services in the United States. Proceedings of the National Academy of Sciences 2014, 111, 7492–7497. [Google Scholar] [CrossRef]
- Zhang, M.; Huang, X.; Chuai, X.; Yang, H.; Lai, L.; Tan, J. Impacts of land use type conversion on carbon storage in terrestrial ecosystems of China: A spatial-temporal perspective. Scientific Reports 2015, 5, 10233. [Google Scholar] [CrossRef] [PubMed]
- Lai, L.; Huang, X.; Yang, H.; Chuai, X.; Zhang, M.; Zhong, T.; Chen, Z.; Chen, Y.; Wang, X.; Thompson, J.R. Carbon emissions from land-use change and management in China between 1990-2010. Environmental Sciences 2016, 2, e1601063. [Google Scholar] [CrossRef]
- Poorter, L.; Van der Sande, M.T.; Thompson, J.; Arets, E.J.M.M.; Alarcon, A.; Alvarez- Sanchez, J.; Ascarrunz, N.; Balvanera, P.; Barajas-Guzman, G.; Boit, A.; Bongers, F.; Carvalho, F.A.; Casanoves, F.; Cornejo-Tenorio, G.; Costa, F.R.C.; de Castilho, C.V.; Duivenvoorden, J.F.; Dutrieux, L.P.; Enquist, B.J.; Fernandez-Mendez, F.; Finegan, B.; Gormley, L.H.L.; Healey, J.R.; Hoosbeek, M.R.; Ibarra-Manriquez, G.; Junqueira, A.B.; Levis, C.; Licona, J.C.; Lisboa, L.S.; Magnusson, W.E.; Martinez-Ramos, M.; Martinez-Yrizar, A.; Martorano, L.G.; Maskell, L.C.; Mazzei, L.; Meave, J.A.; Mora, F.; Munoz, R.; Nytch, C.; Pansonato, M.P.; Parr, T.W.; Paz, H.; Perez-Garcia, E.A.; Renteria, L.Y.; Rodriguez-Velazquez, J.; Rozendaal, D.M.A.; Ruschel, A.R.; Sakschewski, B.; Salgado-Negret, B.; Schietti, J.; Simoes, M.; Sinclair, F.L.; Souza, P.F.; Souza, F.C.; Stropp, J.; Ter Steege, H.; Swenson, N.G.; Thonicke, K.; Toledo, M.; Uriarte, M.; Van der Hout, P.; Walker, P.; Zamora, N.; Pena-Claros, M. Diversity enhances carbon storage in tropical forests. Global Ecology and Biogeography 2015, 24, 1314–1328. [Google Scholar] [CrossRef]
- Rai, P.; Vineeta; Shukla, G.; K Manohar, A.; Bhat, J.A.; Kumar, A.; Kumar, M.; Cabral-Pinto, M.; Chakravarty, S. Carbon storage of single tree and mixed tree dominant species stands in a Reserve Forest- case study of the eastern sub-Himalayan region of India. Land 2021, 10, 435. [CrossRef]
- Tamang, M.; Chettri, R.; Vineeta; Shukla, G.; Bhat, J.A.; Kumar, A.; Kumar, M.; Suryawanshi, A.; Cabral-Pinto, M.; Chakravarty, S. Stand Structure, Biomass and Carbon Storage in Gmelina arborea Plantation at Agricultural Landscape in Foothills of Eastern Himalayas. Land 2021, 10, 387. [CrossRef]
- Kanime, N.; Kaushal, R.; Tewari, S.K.; Rivera, K.P.; Chaturvedi, S.; Chaturvedi, O.P. Biomass production and carbon sequestration in different tree-based systems of central Himalayan Terai region. Forest Trees Livelihoods 2013, 22, 38–50. [Google Scholar] [CrossRef]
- Brahma, B.; Pathak, K.; Lal, R.; Kurmi, B.; Das, M.; Nath, A.J.; Das, A.K. (2018) Ecosystem carbon sequestration through restoration of degraded lands in Northeast India. Land Degradation and Development 2018, 29(1), 15–25. [Google Scholar] [CrossRef]
- Wani, A.A.; Joshi, P.K.; Singh, O.; Pandey, R. Carbon sequestration potential of Indian forestry land use systems-a review. Natural Science 2012, 10, 78–85. [Google Scholar]
- Palm, C.; Tomich, T.; Van Noordwijk, M.; Vosti, S.; Alegre, J.; Gockowski, J.; Verchot, L. Mitigating GHG emissions in the humid tropics: case studies from the Alternatives to Slash-and-Burn Program (ASB). Environment Development and Sustainability 2004, 6, 145–162. [Google Scholar] [CrossRef]
- Nath, A.J.; Lal, R.; Sileshi, G.W.; Das, A.K. Managing India’s small landholder farms for food security and achieving the “4 per Thousand” target. Science of the Total Environment 2018, 634, 1024–1033. [Google Scholar] [CrossRef]
- Millard, P.; Sommerkorn, M.; Grelet, G. Environmental change and carbon limitation in trees: a biochemical, ecophysiological and ecosystem appraisal. New Phytologist 2007, 175, 11–28. [Google Scholar] [CrossRef] [PubMed]
- Kumar, P.S.; Shukla, G.; Nath, A.J.; Chakravarty, S. Soil properties, litter dynamics and biomass carbon storage in three-bamboo species of sub-Himalayan region of eastern India. Water Air and Soil Pollution 2022, 233, 12. [Google Scholar] [CrossRef]
- Panwar, P.; Mahalingappa, D.G.; Kaushal, R.; Bhardwaj, D.R.; Chakravarty, S.; Shukla, G.; Thakur, N.S.; Chavan, S.B.; Pal, S.; Nayak, B.G.; Srinivasaiah, H.T.; Dharmaraj, R.; Veerabhadraswamy, N.; Apshahana, K.; Suresh, C.P.; Kumar, D.; Sharma, P.; Kakade, V.; Nagaraja, M.S.; Singh, M.; Das, S.; Tamang, M.; Kanchan; Dutta Roy, A.; Gurung, T. Biomass production and carbon sequestration potential of different agroforestry systems in India: a critical review. Forests 2022, 13, 1274. [CrossRef]
- Pradhan, R.; Sarkar, B.C.; K Manohar, A.; Shukla, G.; Tamang, M.; Vineeta; Bhat, J.A.; Kumar, M.; Chakravarty, S. Biomass carbon and soil nutrient status in urban green sites at foothills of eastern Himalayas: Implication for carbon management. Current Research in Environmental Sustainability 2022, 4, 100168. [CrossRef]
- Pande, P.K. Litter production and decomposition, mineral release and biochemical diversity of four forest stands at FRI decomposition area. Ph. D. Thesis. Garhwal University, Srinagar (Garhwal), 1986.
- Jackson, M.L. Soil chemical analysis. Prentice Hall of India Pvt. Ltd., New Delhi, 1967.
- Piper, C. Soil and Plant Analysis: A Laboratory Manual of Methods for the Examination of Soils and the Determination of the Inorganic Constituents of Plants. Hans Publications, Bombay, 1966.
- Bray, R.M.; Kurtz, L.T. Determination of total, organic and available forms of phosphorus in soils. Soil Science 1945, 59, 39–45. [Google Scholar] [CrossRef]
- FAO. Assessing carbon stocks and modelling win-win scenarios of carbon sequestration through land use changes. FAO, Rome, 2004; 156p.
- Kumar, B.M. Species richness and above ground carbon stocks in the homegardens of central Kerala, India. Agriculture Ecosystem and Environment 2011, 140, 430–440. [Google Scholar] [CrossRef]
- Brown, S. Estimating biomass and biomass change of tropical forests: a primer. A forest resources assessment publication, FAO Forestry Paper 134; FAO, Rome, 1997.
- Kalita, R.M.; Das, A.K.; Nath, A.J. Allometric equations for estimating above and below ground biomass in tea [Camellia sinensis (L.) O. Kuntze] agroforestry system of Barak Valley, Assam, Northeast India. Biomass and Bioenergy 2015, 83, 42–49. [Google Scholar] [CrossRef]
- Kalita, R.M.; Das, A.K.; Nath, A.J. Role of smallholder tea growers in carbon sink management. Current Science 2019, 116, 1560–1566. [Google Scholar] [CrossRef]
- Thokchom, A.; Yadava, P.S. Biomass, carbon stock and sequestration potential of Schizostachyum pergracile bamboo forest of Manipur, north east India. Tropical Ecology 2017, 58, 23–32. [Google Scholar]
- Shukla, G.; Pala, N.A.; Chakravarty, S. Carbon, litter and nutrient status in teak stands of a foothill forest in Indian eastern Himalayas. Journal of Tree Sciences 2014, 33, 24–32. [Google Scholar]
- Shukla, G.; Pala, N.A.; Chakravarty, S. Quantification of organic carbon and primary nutrients in litter and soil in a foot hill forest plantation of eastern Himalayas. Journal of Forestry Research 2017. [Google Scholar] [CrossRef]
- Shukla, G.; Pala, N.A.; Moonis, M.; Chakravarty, S. Carbon accumulation and partitioning in sub-humid forest stands of West Bengal India. Indian Forester 2018, 144, 229–233. [Google Scholar]
- Shukla, G.; Chakravarty, S. Biomass, primary nutrient and carbon stock in a sub-Himalayan Forest of West Bengal, India. Journal of Forest and Environmental Science 2018, 34, 12–23. [Google Scholar]
- Koul, D.N.; Panwar, P. Prioritizing land-management options for carbon sequestration potential. Current Science 2008, 95, 658–663. [Google Scholar]
- Koul, D.N.; Panwar, P. Opting different land use for carbon build-up in soils and their bio-economics in humid subtropics of West Bengal, India. Annals of Forestry Research 2012, 55, 253–264. [Google Scholar]
- Koul, D.N.; Shukla, G.; Panwar, P.; Chakravarty, S. Status of soil carbon sequestration under different land use system in Terai Zone of West Bengal. Environment & We International Journal of Science and Technology 2011, 6, 95–100. [Google Scholar]
- Bhardwaj, D.R.; Sanneh, A.A.; Rajput, B.S.; Kumar, S. Status of soil organic carbon stocks under different land use systems in wet temperate north western Himalaya. Journal of Tree Science 2013, 32, 14–22. [Google Scholar]
- Naitham, R.; Bhattacharyya, T. Quasi-equilibrium of organic carbon in shrink–swell soils of the subhumid tropics in India under forest, horticultural, and agricultural systems. Australian Journal of Soil Research 2004, 42, 181–188. [Google Scholar] [CrossRef]
- Singh, G.; Rathod, T.R.; Chouhan, S. Growth, biomass production and the associated changes in soil properties in Acacia tortilis plantation in relation to plantation density in Indian arid zone. Indian Forester 2004, 130, 605–614. [Google Scholar]
- Chhabra, A.; Dadhwal, V.K. Forest soil organic carbon pool: An estimate and review of Indian studies. Indian Forester 2005, 131, 201–214. [Google Scholar]
- Sreenivas, K.; Dadhwal, V.K.; Kumar, S.; Harsha, G.S.; Mitran, T.; Sujatha, G.; Suresh, G.J.R.; Fyzee, M.A.; Ravisankar, T. Digital mapping of soil organic and inorganic carbon status in India. Geoderma 2016, 269, 160–173. [Google Scholar] [CrossRef]
- Sariyildiz, T.; Savaci, G.; Kravkaz, I.S. Effects of tree species, stand age and land-use change on soil carbon and nitrogen stock rates in north-western Turkey. iForest 2015, 9, 165–170. [Google Scholar] [CrossRef]
- Kimble, J.M.; Rice, C.W.; Reed, D.; Mooney, S.; Follett, R.F.; Lal, R. Soil Carbon Management: Economic, Environmental and Societal Benefits. CRC Press: Boca Raton, FL, USA, 2007.
- Jacobson, M.Z. Review of solutions to global warming, air pollution, and energy security. Energy and Environmental Science 2009, 2, 148–173. [Google Scholar] [CrossRef]
- Hombegowda, H.C.; van Straaten, O.; Köhler, M.; Hölscher, D. On the rebound: soil organic carbon stocks can bounce back to near forest levels when agroforests replace agriculture in southern India. Soil 2016, 2, 13–23. [Google Scholar] [CrossRef]
- Woomer, P.L.; Martin, A.; Albrecht, A.; Reseck, D.V.S.; Scharpenseel, H.W. The importance and management of soil organic matter in the tropics. In The Biological Management of Tropical Soil Fertility; Woomer, P.L., Swift, M.J., Eds.; Wiley Chichester, 1994.
- Gairola, S.; Sharma, C.M.; Ghildiyal, S.K.; Suyal, S. Chemical properties of soils in relation to forest composition in moist temperate valley slopes of Garhwal Himalaya, India. Environmentalist 2012. [CrossRef]
- Paudel, S.; Sah, J.P. Physiochemical characteristic of soil in Sal (Shorea robusta) forests in eastern Nepal. Himalayan Journal of Sciences 2003, 1, 107–110. [Google Scholar] [CrossRef]
- de Hann, S. Humus, its formation, its relation with the mineral part of the soil and its significance for soil productivity. In Organic Matter Studies, vol 1.; International Atomic Energy Agency, Vienna, 1977; Pp. 21-30.
- Weil, R.R.; Brady, N.C. The Nature and Properties of Soil. 15th edition. Pearson Education, 2017.
- Stevenson, F.J. Humus Chemistry: Genesis, Composition, Reactions. 2nd edition. Wiley Interscience, New York, USA, 1994; 512p.
- Sidhu, G.S.; Bhattacharyya, T.; Sarkar, D.; Ray, S.K.; Chandran, P.; Pal, D.K.; Mandal, D.K.; Prasad, J.; Nair, K.M.; Sahoo, A.K.; Das, T.H.; Singh, R.S.; Mandal, C.; Srivastava, R.; Sen, T.K.; Chatterji, S.; Patil, N.G.; Obireddy, G.P.; Mahapatra, S.K.; Anil Kumar, K.S.; Das, K.; Singh, A.K.; Reza, S.K.; Dutta, D.; Srinivas, S.; Tiwary, P.; Karthikeyan, K.; Venugopalan, M.V.; Velmourougane, K.; Srivastava, A.; Raychaudhuri, M.; Kundu, D.K.; Mandal, K.G.; Kar, G.; Durge, S.L.; Kamble, G.K.; Gaikwad, M.S.; Nimkar, A.M.; Bobade, S.V.; Anantwar, S.G.; Patil, S.; Sahu, V.T.; Gaikwad, K.M.; Bhondwe, H.; Dohtre, S.S.; Gharami, S.; Khapekar, S.G.; Koyal, A.; Sujatha, G.; Reddy, B.M.N.; Sreekumar, P.; Dutta, D.P.; Gogo, L.; Parhad, V.N.; Halder, A.S.; Basu, R.; Singh, R.; Jat, B.L.; Oad, D.L.; Ola, N.R.; Wadhai, K.; Lokhande, M.; Dongare, V.T.; Hukare, A.; Bansod, N.; Kolhe, A.; Khuspure, J.; Kuchankar, H.; Balbuddhe, D.; Sheikh, S.; Sunitha, B.P.; Mohanty, B.; Hazarika, D.; Majumdar, S.; Garhwal, R.S.; Sahu, A.; Mahapatra, S.; Puspamitra, S.; Kumar, A.; Gautam, N.; Telpande, B.A.; Nimje, A.M.; Likhar, C.; Thakre, S. Impact of management levels and land-use changes on soil properties in rice-wheat cropping system of the Indo-Gangetic plains. Current Science 2014, 107, 1487–1501. [Google Scholar]
- Singh, A.K.; Parsad, A.; Singh, B. Availability of phosphorus and potassium and its relationship with physicochemical properties of some forest soils of Pali-range (Shahodol, M.P.). Indian Forester 1986, 112, 1094–1104. [Google Scholar]
- Raij, B. Avaliacao da fertilidade do solo. Instituto da Potassa and Fosfato, Piracicaba, 1981; 142p.
- Jerabkova, L.; Prescott, C.E.; Kishchuk, B.E. Nitrogen availability in soil and forest floor of contrasting types of boreal mixed wood forests. Canadian Journal of Forestry Research 2006, 36, 112–122. [Google Scholar] [CrossRef]
- Shukla, G.; Chakravarty, S. Soil Carbon sequestration vis-à-vis soil management. Environment & We International Journal of Science and Technology 2012, 7, 107-122.
- Scotti, R.; Bonanomi, G.; Scelza, R.; Zoina, A.; Rao, M.A. Organic amendments as sustainable tool to recovery fertility in intensive agricultural systems. Journal of Soil Science and Plant Nutrition 2015, 15, 333–352. [Google Scholar] [CrossRef]
- Ruess, J.O.; Innis, G.S. A grassland nitrogen flow simulation mode. Ecology 1977, 58, 348–429. [Google Scholar]
- Binkly, D.; Vitousek, P.M. Soil Nutrient Availability. In Plant Physiological, Field Methods and Instrumentation; Pearey, R.W., Ehleringer, J., Mooney, N.A., Rundel, P.W., Eds.; Champan and Hall, London, 1989; Pp.75-96.
- Gupta, J.P.; Sharma, M.P.; Gupta, G.D. Characterization of Kandi belt soils of Jammu region as affected by different land use patterns. Journal Indian Society Soil Science 2001, 49, 770–773. [Google Scholar]
- Xiao-wen, D.; Ying, L.; Shi-jie, H. Carbon and nitrogen dynamics in early stages of forest litter decomposition as affected by nitrogen addition. Journal of Forestry Research 2009, 20, 111–116. [Google Scholar]
- da Gama-Rodrigues, A.C.; de Barros, N.F.; Comerford, N.B. Biomass and nutrient cycling in pure and mixed stands of native tree species in South-eastern Bahia, Brazil. Revista Brasileira de Ciência do Solo 2007, 31, 287–298. [Google Scholar] [CrossRef]
- Subba, M.; Pala, N.A.; Shukla, G.; Chakravarty, S. Study of the variability of homegardens influencing carbon stock under sub-humid tropical zone of West Bengal, India. Indian Forester 2018, 144, 66–72. [Google Scholar]
- Subba, M.; Pala. N.A.; Shukla, G.; Pradhan, K.; Chakravarty, S. Refocusing the correlates of carbon sequestration through maintaining the carbon stock in homegardens of West Bengal, India. In Natural Resources Management for Sustainable Development and Rural Livelihoods, Vol. 3; Sati, V.P., Lalmalsawmzauva, K.C., Eds.; Today & Tomorrow’s Printers and Publishers, New Delhi. 2017; Pp. 1139-1151.
- Behera, M.K.; Mohapatra, N.P. Biomass accumulation and carbon stocks in 13 different clones of teak (Tectona grandis Linn. F.) in Odisha, India. Current World Environment 2015, 10, 1011–1016. [Google Scholar] [CrossRef]
- Brahma, B.; Nath, A.J.; Das, A.K. Managing rubber plantations for advancing climate change mitigation strategy. Current Science 2016, 110, 2015–2019. [Google Scholar] [CrossRef]
- Selvaraj, A.; Jayachandran, S.; Thirunavukkarasu, D.P.; Jayaraman, A.; Karuppan, P. Carbon sequestration potential physicochemical and microbiological properties of selected trees Mangifera indica L., Manikara zapota L., Cocus nucifera L. and Tectona grandis L. Bioscience Discovery 2016, 7, 131–139. [Google Scholar]
- Chauhan, S.K.; Singh, S.; Sharma, S.; Sharma, R.; Saralch, H.S. Tree biomass and carbon sequestration in four short rotation tree plantations. Range management and Agroforestry 2019, 40, 77–82. [Google Scholar]
- Gupta, D.K.; Bhatt, R.K.; Keerthika, A.; Noor Mohamed, M.B.; Shukla, A.K.; Jangid, B.L. Carbon sequestration potential of Hardwickia binata Roxb. based agroforestry in hot semi-arid environment of India: an assessment of tree density impact. Current Science 2019, 116, 112–117. [Google Scholar] [CrossRef]
- Ngo, K.M.; Turner, B.L.; Muller-Landau, H.C.; Davies, S.J.; Larjavaara, M.; Hassan, N.; Fbin, N.; Lum, S. Carbon stocks in primary and secondary tropical forests in Singapore. Forest Ecology and Management 2013, 296, 81–89. [Google Scholar] [CrossRef]
- Slik, J.W.F.; Gary, P.; Krista, M.; Shin-Ichiro, A. Large trees drive forest aboveground biomass variation in moist lowland forests across the tropics. Global Ecology and Biogeography 2013, 22, 1261–1271. [Google Scholar] [CrossRef]
- Pickup, M.; Westoby, M.; Basden, A. Dry mass costs of developing leaf area in relation to leaf size. Functional Ecology 2005, 19, 88–97. [Google Scholar] [CrossRef]
- Niinemets, U.; Portsumuth, A.; Tobias, M. Leaf shape and venation pattern alter the support investments within leaf lamia in temperate species: neglected sources of leaf physiological differentiation. Functional Ecology 2007, 21, 28–40. [Google Scholar] [CrossRef]
- Silvertown, J.W.; Doust, J.L. Introduction to plant population biology. Blackwell, London, 1993.
- Bazzaz, F.A.; Grace, J. Plant Resources Allocation. Academic Press, London, 1997.
- Devi, L.S.; Yadava, P.S. Above ground biomass and net primary production of semi-evergreen tropical forest of Manipur, north-eastern India. Journal of Forestry Research 2009, 20, 151–55. [Google Scholar] [CrossRef]
- Chhabra, A.; Dadhwal, V.K. Assessment of major pools and fluxes of carbon in Indian forests. Climate Change 2004, 64, 341–360. [Google Scholar] [CrossRef]
- Swamy, S.L.; Puri, S.; Singh, A.K. Growth, biomass, carbon storage and nutrient distribution in Gmelina arborea Roxb. stands on red lateritic soils in central India. Bioresource Technology 2003, 90, 109–126. [Google Scholar] [CrossRef] [PubMed]
- Catovsky, S.; Bradford, M.A.; Hector, A. Biodiversity and ecosystem productivity: implications for carbon storage. Oikos 2002, 97, 443–448. [Google Scholar] [CrossRef]
- Kirby, K.R.; Potvin, C. Variation in carbon storage among tree species implications for the management of a small-scale carbon sink project. Forest Ecology and Management 2007, 246, 208–221. [Google Scholar] [CrossRef]
- Whitmore, A.P.; Kirk, G.J.D.; Rawlins, B.G. Technologies for increasing carbon storage in soil to mitigate climate change. Soil Use Management 2015, 31, 62–71. [Google Scholar] [CrossRef]
- Lal, R. Beyond COP 21: potential and challenges of the “4 per Thousand” initiative. Journal of Soil Water Conservation 2016, 71, 20A–25A. [Google Scholar] [CrossRef]
- Minasny, B.; Malone, B.P.; McBratney, A.B.; Angers, D.A.; Arrouays, D.; Chambers, A.; Chaplot, V.; Chen, Z.-S.; Cheng, K.; Das, B.S.; Field, D.; Gimona, A.; Hedley, C.B.; Hong, S.Y.; Mandal, B.; Marchant, B.P.; Martin, M.; McConkey, B.G.; Mulder, V.L.; O'Rourke, S.; Richer-de-Forges, A.C.; Odeh, I.; Padarian, J.; Paustian, K.; Pan, G.; Poggio, L.; Savin, I.; Stolbovoy, V.; Stockmann, U.; Sulaeman, Y.; Tsui, C.-C.; Vågen, T.-G.; van Wesemael, B.; Winowiecki, L. Soil carbon 4 per mile. Geoderma 2017, 292, 59–86. [Google Scholar] [CrossRef]
- Powlson, D.S.; Whitmore, A.P.; Goulding, K.W. Soil carbon sequestration to mitigate climate change: a critical re-examination to identify the true and the false. European Journal of Soil Science 2011, 62, 42–55. [Google Scholar] [CrossRef]
- Badgery, W.B.; Simmons, A.T.; Murphy, B.W.; Rawson, A.; Andersson, K.O.; Lonergan, V.E. The influence of land use and management on soil carbon levels for crop-pasture systems in Central New South Wales, Australia. Agriculture, Ecosystem and Environment 2014, 196, 147–157. [Google Scholar] [CrossRef]
- Paustian, K.; Andren, O.; Janzen, H.H.; Lal, R.; Smith, P.; Tian, G.; Tiessen, H.; Van Noordwijk, M.; Woomer, P.L. Agricultural soils as a sink to mitigate CO2 emissions. Soil Use and Management 2007, 13, 230–244. [Google Scholar] [CrossRef]
|
Disclaimer/Publisher’s Note: The statements, opinions and data contained in all publications are solely those of the individual author(s) and contributor(s) and not of MDPI and/or the editor(s). MDPI and/or the editor(s) disclaim responsibility for any injury to people or property resulting from any ideas, methods, instructions or products referred to in the content. |
© 2023 by the authors. Licensee MDPI, Basel, Switzerland. This article is an open access article distributed under the terms and conditions of the Creative Commons Attribution (CC BY) license (http://creativecommons.org/licenses/by/4.0/).
