
Submitted:
04 February 2023
Posted:
07 February 2023
You are already at the latest version
Abstract
Modern surface analysis techniques are expanding significantly possibilities in description and attribution of historical artifacts. The present study is aimed to compare analytical ability of the X-ray fluorescent analysis (XRF) typically applied for studies ceramic art items with novel surface analysis methods: time-of-flight secondary ions mass spectroscopy (SIMS) and X-ray photoelectron spectroscopy (XPS) that were applied on measurements of elemental compositions of powder raw materials for porcelain fabrication: pegmatite P-1, Vesco-prima clay, kaolin, bone earth, dolomite, and feldspar. It was shown that SIMS successfully measures light elements unnoticeable for XRF such as lithium, beryllium, boron and heavy impurities not found out by XRF such as cobalt, cerium, copper, rubidium, vanadium. XPS has found thorium in the kaolin sample that was not detected by SIMS and XRF. The paper provides also values of chemical shifts of some XPS lines observed in materials under examination. The obtained information on relations of basic and impurity elements revealed by XRF and SIMS together with XPS chemical shifts data could be used to expose contemporary falsifications of historical porcelain and to attribute porcelain items during conservation process.
Keywords:
X-ray fluorescent analysis (XRF)
; secondary ions mass spectroscopy (SIMS)
; X-ray photoelectron spectroscopy (XPS)
; porcelain
; pegmatite
; Vesco-prima clay
; kaolin
; bone earth
; dolomite
; feldspar
1. Introduction
Application of analytical chemistry methods to describe porcelains composition was started dynamically in the second half of the 19th century. So the monograph [1] presents chemical compositions of porcelain mixtures used in the Imperial Porcelain Manufacture at different historical periods from its establishing to the beginning of the 20th century. Also the book [2],(pp. 28 – 29) gives compositions of porcelains fabricated on various factories in France, Saxony, Bohemia, China, and Japan. But the key disadvantage of the solution chemistry is the need to dissolve objects under study so this approach seems to be inapplicable for art history expertise of historical and contemporary ceramic art items.
Development of physical methods for non-destructive analysis of structure and composition of solids such as fluoroscopy, X-ray diffraction, X-ray fluorescent analysis, etc. have become widely used in materials science including characterisation historical objects (archaeometry) [3] and attribution art history items. X-ray fluorescent analysis (XRF) is estimated now as a commonly used method for such tasks [4] including determination compositions of historical ceramic art items [5].
In last decades in addition to the above mentioned methods the new ones such as X-ray photoelectron spectroscopy (XPS), Auger electrons spectroscopy (AES) and secondary ions mass spectroscopy (SIMS) with high spatial and depth resolution are are starting to applyin archaeometric tasks for better identification of materials and understanding technologies and mastership of artefacts fabrication [6]. So SIMS was applied for investigation of historical tapestries [7] and parchments [8]. Recently, various research teams in the world [9,10,11,12] have demonstrated the advantages of complex studies of historical artefacts using sets of modern physical methods including ones using synchrotron sources [11].
So this research was aimed on the comparative estimation of analytical possibilities of the XRF as a commonly used technique with SIMS and XPS methods for ceramic art items studies: SIMS can detect elements in trace concentrations while XPS is able to resolve multiple oxidation degrees of elements. The powder samples of raw components for porcelain fabrication were selected as most favourable for XRF because their uniform composition eliminates typical XRF problem with difference in secondary X-rays emission depth for various elements that makes some difficulties in analysis of sintered ceramics especially with glaze and painting layers.
AES was also tested on these samples in the frame scanning mode to get analysis area comparable with SIMS and XPS but it did not demonstrate any preferences comparing to XPS in this case: AES sensitivity was about 0.2 %at., and its main advantage: the focused electron beam with high locality examination — was not useful in this case of homogeneous powder samples. So these results were not included in this paper. From other hand, AES could be very useful in studies such non-homogeneous objects as sintered ceramics [13] including painting layers [14] where various components of the ceramic mass and pigments differ by their composition.
2. Materials and Methods
There were selected following powder samples of raw materials for porcelain fabrication used currently in Joint Stock Co. “Imperial Porcelain Manufactory” (St.-Petersburg, Russia): pegmatite P-1, Vesco-prima clay, kaolin, bone earth, dolomite, and feldspar.
The generalised elemental composition of the powders was measured by XRF using X-ray fluorescence spectrometer AXIOSmax Advanced (PANalytical, Almelo, Netherlands).
Surface composition with high depth locality were performed by SIMS method on the time-of-flight mass spectrometer TOF.SIMS5-100 (IONTOF GmbH, Münster, Germany) equipped by Bi scanning ions source with spatial resolution 25 nm and Cs and O ions sources for depth profiling. This device has very high sensitivity and mass resolution: according to information placed on the IONTOF GmbH website [15] the sensitivity is in the ppm/ppb range and mass resolution M/dM = 30 000. The data on the powder samples compositions were obtained by the averaging of several spectra obtained from the squares 500х500 μm. The elements concentrations calculations were based on peaks intensities of singly charged positive ions as:
where Ij is the intensity of corresponding ions peak. When an element had several natural stable isotopes its intensity was taken as a sum of isotopes intensities.
Binding energies of elements were determined by XPS on ESCALAB Mk2 (VG, East Grinstead, UK) at a vacuum of 3 × 10⁻⁸ Pa. XPS measurements were fulfilled using an X-ray Al—Mg twin anode source in Al Kα primary radiation (hν = 1486.6 eV, Au 4f3/2–5/2 full width at half maximum (FWHM) = 0.9 eV, analysed region was a circle with diameter of 10 mm). The powders were placed on the special sample holder using a conducting carbon ribbon.
The charging of dielectric samples was neutralised by the low energy electrons beam with energy of 70 eV. No charge-discharge shifts of XPS lines on the spectra were observed during spectra acquisition.
The fine structure of XPS lines was analyzed using the UNIFIT2007 [16] software. Identification of XPS lines and determination of chemical shifts values was based on XRF and SIMS results and information from NIST XPS database [17] Prior to the studies the energy scale of the spectrometer was checked using Ag reference sample.
3. Results and discussion
3.1. Comparison of XRF and SIMS analytical capabilities
The XRF results on the substances compositions are presented in Table 1. In accordance with the traditions of analytical chemistry compositions of complex oxide systems such as ores, ceramics and so on is listed for most elements in terms of oxides where oxides of polyvalent metals are given in maximal oxidation degrees. So, XRF data for vanadium compounds in slags was given for V2O5 oxide while XPS has demonstrated that it was presented only in V2+ and V3+ states [18]. One can see from Table 1 that XRF is enough sensitive to detect small impurities with content down to 0.003 %mass.

Table 1.
Composition of raw materials for porcelain determined by XRF, % mass.
| Substance | Al2O3 | BaO | CaO | Cl | Cr2O3 | CuO | Fe2O3 | Ga2O3 | K2O | MgO | MnO | Na2O | Nb2O5 |
|---|---|---|---|---|---|---|---|---|---|---|---|---|---|
| Feldspar | 16.151 | 0.161 | 1.068 | 0.072 | 0.109 | 0.398 | 15.695 | 0.123 | 2.491 | ||||
| Pegmatite | 14.485 | 0.092 | 0.797 | 0.047 | 0.071 | 0.604 | 0.005 | 5.992 | 0.201 | 0.015 | 3.943 | ||
| Clay | 30.12 | 0.031 | 0.397 | 0.042 | 0.039 | 0.007 | 0.828 | 0.009 | 1.89 | 0.574 | 0.472 | 0.005 | |
| Kaolin | 37.466 | 0.016 | 0.253 | 0.038 | 0.016 | 0.531 | 0.009 | 0.465 | 0.297 | 0.182 | |||
| Dolomite | 0.475 | 31.274 | 0.049 | 0.134 | 0.08 | 21.312 | 0.107 | ||||||
| Bone earth | 0.501 | 0.472 | 53.729 | 0.04 | 0.045 | 0.145 | 0.103 | 1.605 | 0.909 |
Table 1.
Continued.
| Substance | NiO | P2O5 | PbO | Rb2O | S | SiO2 | SrO | TiO2 | V2O5 | Y2O3 | ZnO | ZrO2 |
|---|---|---|---|---|---|---|---|---|---|---|---|---|
| Feldspar | 0.018 | 0.203 | 0.016 | 0.098 | 0.096 | 62.344 | 0.024 | 0.1 | 0.12 | 0.002 | ||
| Pegmatite | 0.049 | 0.005 | 0.015 | 0.043 | 72.788 | 0.021 | 0.025 | 0.003 | ||||
| Clay | 0.009 | 0.109 | 0.012 | 0.014 | 0.131 | 52.644 | 0.017 | 1.225 | 0.005 | 0.003 | 0.035 | |
| Kaolin | 0.187 | 0.072 | 44.384 | 0.003 | 0.546 | 0.015 | ||||||
| Dolomite | 0.101 | 0.042 | 1.019 | 0.007 | ||||||||
| Bone earth | 0.019 | 37.463 | 0.115 | 2.016 | 0.022 | 0.09 | 0.036 |
One can see the elemental composition of these substances determined by SIMS in Table 2. The columns of elements not detected by XRF or found in more samples than by XRF are marked yellow. Apart from lithium, beryllium and boron not detected by XRF due to physical limitation we found impurities absent in Table 1: cobalt in practically all samples except pegmatite and dolomite in amounts from 0.0007 %at. to 0.05 %at.; cerium in kaolin (0.00085 %at.) and bone earth (0.0021 %at.); copper detected by XRF only in the Vesco-prima clay was found in comparable quantities also in the samples of feldspar, kaolin, dolomite, and bone earth; rubidium was presented in all samples excluding bone earth in amounts of a few hundredths of percent; vanadium was in all samples with the exception of pegmatite and bone earth.
Table 2.
Composition of raw materials for porcelain determined by SIMS, % at. The elements not detected by XRF or detected with strong discordance between XRF and SIMS are marked yellow.
Table 2.
Composition of raw materials for porcelain determined by SIMS, % at. The elements not detected by XRF or detected with strong discordance between XRF and SIMS are marked yellow.
| Substance | Al | Ba | Ca | Cl | Co | Cr | Cu | Fe | Ga | K | Mg | Mn |
|---|---|---|---|---|---|---|---|---|---|---|---|---|
| Feldspar | 14.30 | 0.032 | 7.464 | 0.000467 | 0.002939 | 1.058 | 0.019 | 4.902 | 0 | 30.69 | 1.469 | 0 |
| Pegmatite | 28.14 | 0.130 | 2.139 | 0 | 0 | 0.034 | 0 | 0.893 | 0.025 | 25.85 | 1.010 | 0.056 |
| Clay | 50.40 | 0.033 | 2.822 | 0.000437 | 0.050032 | 0.050 | 0.019 | 0.652 | 0.015 | 19.59 | 1.590 | 0 |
| Kaolin | 70.53 | 0.016 | 3.091 | 0.000499 | 0.001061 | 0.044 | 0.012 | 0.705 | 0.011 | 5.041 | 1.164 | 0 |
| Dolomite | 7.80 | 0.090 | 6.345 | 0.000687 | 0 | 0.240 | 0.011 | 1.491 | 0 | 10.71 | 63.049 | 0 |
| Bone earth | 1.95 | 0.365 | 63.70591 | 7.02E-05 | 0.000707 | 0.104 | 0.012 | 0.520 | 0 | 3.90 | 3.390 | 0 |
Table 2.
Continued.
| Substance | Na | Ni | P | Pb | Rb | S | Si | Sr | Ti | V | Y |
|---|---|---|---|---|---|---|---|---|---|---|---|
| Feldspar | 31.20 | 0.0403 | 0.0118 | 0.003511 | 0.0733 | 0.00104 | 6.671 | 0.0144 | 0.159944 | 1.6385 | 0.0019 |
| Pegmatite | 12.58 | 0 | 0 | 0.00135 | 0.0339 | 0 | 28.941 | 0.0459 | 0.025852 | 0 | 0 |
| Clay | 7.85 | 0.0095 | 0.0021 | 0.002662 | 0.0566 | 0.00067 | 16.267 | 0.0189 | 0.047445 | 0.0500 | 0.0007 |
| Kaolin | 2.51 | 0.0148 | 0.0028 | 0 | 0.0123 | 0.00038 | 16.436 | 0.0060 | 0.212195 | 0.0852 | 0 |
| Dolomite | 6.39 | 0.0154 | 0.0139 | 0 | 0.0166 | 0.00088 | 2.307 | 0.0254 | 0.476908 | 0.8367 | 0 |
| Bone earth | 24.66 | 0.0091 | 0.1052 | 0 | 0 | 0.00062 | 0.973 | 0.0168 | 0.200482 | 0 | 0 |
Table 2.
Continued.
| Substance | Zn | Zr | Li | B | Be | Ce |
|---|---|---|---|---|---|---|
| Feldspar | 0 | 0 | 0.121 | 0.0073 | 0.00044 | 0 |
| Pegmatite | 0.0066 | 0 | 0.029 | 0.0297 | 0.000843 | 0 |
| Clay | 0.0094 | 0.000661 | 0.365 | 0.0393 | 0.000834 | 0 |
| Kaolin | 0 | 0.001361 | 0.084 | 0 | 0 | 0.00085 |
| Dolomite | 0 | 0 | 0.123 | 0.0131 | 0 | 0 |
| Bone earth | 0.0633 | 0 | 0 | 0 | 0 | 0.002124 |
The method for calculations the main and impurity elements concentrations from SIMS data that was used in this research is, of course, semi-quantitative in nature but it is quite suitable to determine compositions of ceramic art items including porcelain and to answer questions about their origin time and location including raw materials for their fabrication. At least this approach has a much greater physical meaning than widely used in the art ceramics archaeometry [19,20,21]scatter plots of characteristic peaks intensities for various elements I(A) vs. I(B)without corrections on their yield cross-sections.
3.2. XPS studies
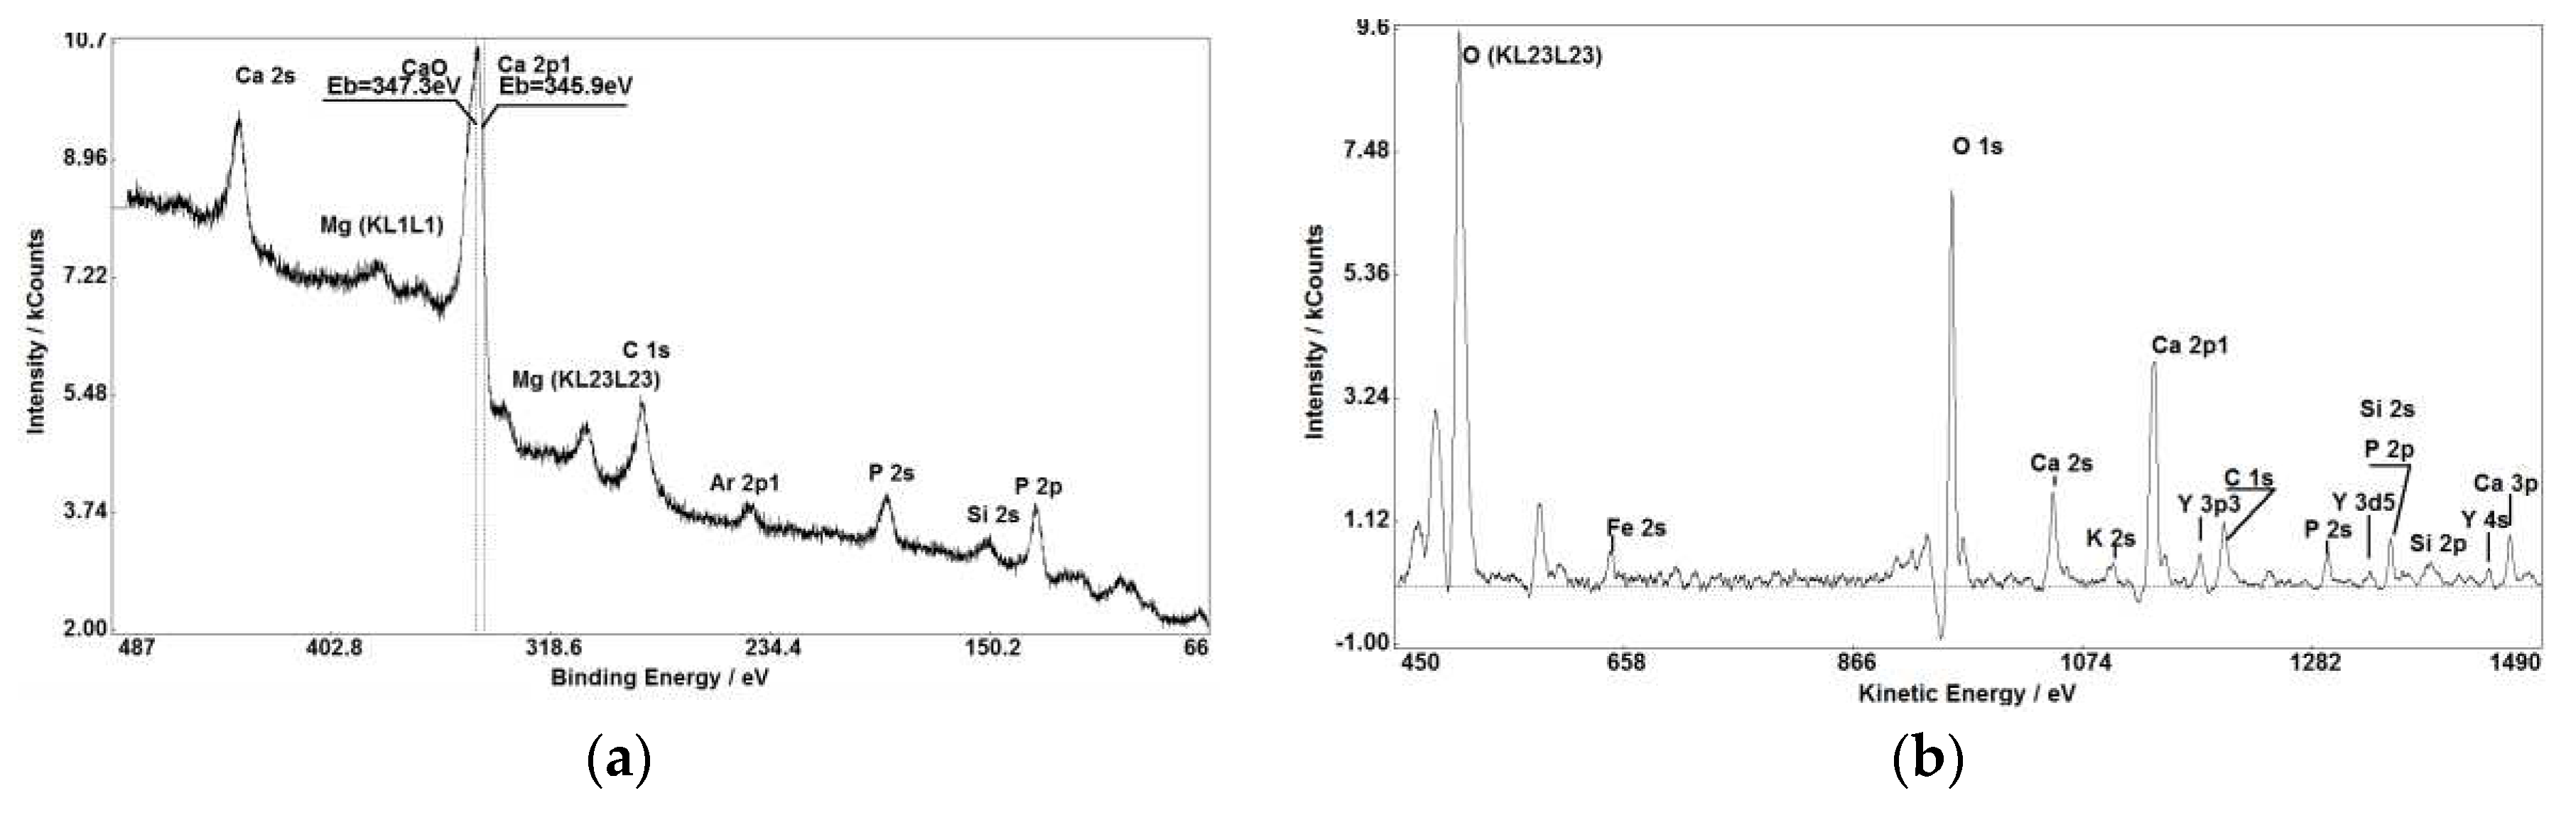
Figure 1, Figure 2, Figure 3, Figure 4, Figure 5 and Figure 6 are presenting some XPS spectra obtained from powders under study. It is necessary to emphasize that enough big escape cross-section of photoelectrons for several elements detected by XPS in the samples (see Figure 1(a, b), Figure 3 (a, b), Figure 7(a, b)) makes XPS partly comparable with SIMS in small impurities determination.
Also the subjects of high importance are oxidation degrees of elements in substances that can be revealed through analysis of chemical shifts of characteristic XPS lines. This information is critical to characterise solid objects including ceramics.
Figure 3 (c), Figure 4 and Figure 5 demonstrate that chemical shifts of photoelectron lines allow us to accurately determine oxidation states of various elements in raw materials used in porcelain fabrication. Intensities of XPS lines and their chemical shifts allow to establish presence of simple and multicomponent compounds with stoichiometric and non-stoichiometric relations between elements.
The combined application of SIMS and XPS surface analysis methods allows to determine the characteristic features of ceramic goods on their fabrication time, location, and technology that cannot be resolved by commonly used methods for composition and structure analysis. In this case the advantages of these methods such as high value of photoelectrons escape cross-section for heavy (Ba, La, Ce, Pr, Nd, Th, Tb, Gd, Sm, Eu, Bi, Pb) elements and possibility to measure oxidation degrees together with SIMS’s high sensitivity to small impurities and determination isotopes relations are fully realised. All these features allow to build the fingerprint of ceramic work-piece and to attribute the sample. It is very interesting that XPS with generally lower sensitivity than SIMS and XRF has detected thorium in the kaolin sample (see Figure 4 (b)) that was not detected by SIMS in spite of its very high sensitivity to small concentrations. Most probably it can be explained by high mass of Th atoms decreasing probability of Th+ secondary ions emission together with very high photoelectrons yield cross-section up to 23.94 [19]. So the combined application of several surface analysis methods is increasing the reliability of samples composition measurements. Namely, this is a necessary requirement for attribution art items in comparison with subjective visual and stylistic attribution by art history experts.
Meanwhile one can ask about the applicability of these surface analysis methods requiring ultrahigh vacuum equipment for studies art ceramics items that can have enough big dimensions when the most of electron and secondary ions spectrometers can study samples about several centimetres. First of all, art items coming to conservation labs are often fragmented, and it is possible to select samples with proper size as we already did studying Dutch tiles [23]. Secondly, there are no technical limitations to build a spectrometer combining the set of surface analysis methods with enough big work chamber and sample manipulation system, and such system could be built on demand when rather big array of information that can be used for ceramic art items expertise by surface analysis methods will be accumulated.
4. Conclusions
The combined application of SIMS and XPS surface analysis methods allows to determine the characteristic features of ceramic goods on their fabrication time, location, and technology that cannot be resolved by commonly used methods for composition and structure analysis. In this case the advantages of these methods such as high value of photoelectrons escape cross-section for heavy (Ba, La, Ce, Pr, Nd, Th, Tb, Gd, Sm, Eu, Bi, Pb) elements and possibility to measure oxidation degrees together with SIMS’s high sensitivity to small impurities are fully realised. All these features allow to build the fingerprint of ceramic work-piece and to attribute it.
It is evident that all elements found in raw stuff are transferred into the bulk of final porcelain goods so obtained data on relations of elements and their chemical state could be used for detection modern counterfeit of historical porcelain and for attribution art ceramic items at conservation efforts.
Author Contributions
conceptualization, D.W.; methodology, D.W., A.K., V.V., A.V.; investigation, V.V., A.V., E.K..; resources, M.S.; writing—original draft preparation, D.W., A.K.; writing—review and editing, D.W., V.V, A.K., A.V., M.S.; visualization, A.K., E.K.; project administration, D.W. All authors have read and agreed to the published version of the manuscript.
Funding
This research was funded by Russian Science Foundation grant number 21-19-00412.
Institutional Review Board Statement
Not applicable.
Informed Consent Statement
Not applicable.
Data Availability Statement
Raw experimental data will be available on reasonable request.
Conflicts of Interest
The authors declare no conflict of interest. The funders had no role in the design of the study; in the collection, analyses, or interpretation of data; in the writing of the manuscript; or in the decision to publish the results.
References
- The Imperial Porcelain Manufacture. 1744-1904. Historical sketch. The foreword and edition by bar. N.B. von Wolf. Administration of Imperial Factroies, St. Petersburg, Russia, 1906, 534 p. (russ.).
- F.Ya. Yakovlev The brief overview of the procelain production in Russia and explanation of the collection demonstrating composition and properties of porcelain dependent on materials. S.P. Arhipov & Co print-shop, Moscow, Russia, 1882, 46 p. (russ.).
- Liritzis, I. Archaeometry: an overview. Scientific Culture 2020, 6, 49–99. [Google Scholar] [CrossRef]
- Janssens, et al. Use of microscopic XRF for non-destructive analysis in art and archaeometry. X-Ray Spectrom. 2000, 29, 73–91. [Google Scholar] [CrossRef]
- The Encyclopedia of Archaeological Sciences, ed. Sandra L. López Varela, John Wiley & Sons, 2018.
- Adriaens, A. Non-destructive analysis and testing of museum objects: An overview of 5 years of research. Spectrochim. Acta Part B 2005, 60, 1503–1516. [Google Scholar] [CrossRef]
- Batcheller, J.; Hacke, A.M.; Mitchell, R.; Carr, C.M. Investigation into the nature of historical tapestries using time of flight secondary ion mass spectrometry (ToF-SIMS). App. Surf. Sci. 2006, 252, 7113–7116. [Google Scholar] [CrossRef]
- Vilde; Abel; M., -L.; Watts, J.F. A surface investigation of parchments using ToF-SIMS and PCA. Surf. Interface Anal. 2016, 48, 393–397. [Google Scholar] [CrossRef]
- Ricci, Giulia. Archaeometric studies of historical ceramic materials. PhD thesis Universita Ca' Foscari Venezia, 2017 (electronic source). Available online: http://dspace.unive.it/handle/10579/10321 (accessed on 18 November 2022).
- Shi, P.; Wang, F.; Zhu, J.; Zhang, B.; Zhao, T.; Wang, Y.; Qin, Y. Study on the Five dynasty sky-green glaze from Yaozhou kiln and its coloring mechanism. Ceram. Int. 2017, 43, 2943–2949. [Google Scholar] [CrossRef]
- Li, Y.; Zhang, B.; Cheng, H.; Zheng, J. Revealing the coloration mechanism in the earliest Chinese celadon glaze. Journ. Europ. Ceram. Soc. 2019, 39, 1675–1682. [Google Scholar] [CrossRef]
- Ingo, G.M.; Riccucci, C.; Pascucci, M.; Messina, E.; Giuliani, C.; Biocca, P.; Tortora, L.; Fierro, G., G. Di Carlo. Combined use of FE-SEM+EDS, ToF-SIMS, XPS, XRD and OM for the study of ancient gilded artefacts. Appl. Surf. Sci., 2018, 446, 168–176. [Google Scholar] [CrossRef]
- Watts, J.F. Analysis of ceramic materials by electron spectroscopy. Journ. Microsc., 1985, 140, 243–260. [Google Scholar] [CrossRef]
- Li, L.; Yan, L.; Sun, H.; Zhou, Y. , and Xiangqian Feng. Archaeometallomics as a Tool for Studying Ancient Ceramics. At. Spectrosc., 2021, 42, 247–253. [Google Scholar] [CrossRef]
- TOF-SIMS Technique (electronic source). Available online: https://www.iontof.com/tof-sims-secondary-ion-mass-spectrometry-leis-technique-low-energy-ion-scattering.html (accessed on 23 December 2022).
- UNIFIT for Windows Software. Unifit Scientific Software GmbH. Available online: http://www.unifit-software.de (accessed on 17 November 2022).
- NIST X-ray Photoelectron Spectroscopy Database. Data compiled and evaluated by A. V. Naumkin, A. Kraut-Vass, S.W. Gaarenstroom, and C. J. Powell (electronic source). Available online: https://srdata.nist.gov/xps/ (accessed on 17 November 2022).
- Kovalev, A.; Wainstein, D.; Vakhrushev, V., A. Volkov and U. Kologrieva. Features of the Microstructure and Chemical Compositions of Vanadium-Containing Slags Including Determination of Vanadium Oxidation Degrees. Materials 2019, 12, 3578. [Google Scholar] [CrossRef] [PubMed]
- van Lookeren Campagne, K. Een verkeerde loop in’t vuur: an initial investigation into what Dutch archival sources can tell us about techniques and problems in the production of 17th and 18th century Dutch tin-glaze tiles” In: GlazeArch2015: International Conference Glazed Ceramics in Architectural Heritage (electronic source). Available online: http://azulejos.lnec.pt/AzuRe/Glazearch2015/Communications/03%20Een%20verkeerde%20loop%20in%20het%20vuur.pdf (accessed on 17 November 2022).
- van Lookeren Campagne, K.; Megens, L.; van Bommel, M. Understanding 17th/18th century Dutch Tin-glaze Through the Interpretation and Reconstruction of Historical Recipe” (electronic source). Available online: https://www.researchgate.net/profile/Kate-Van-Lookeren-Campagne-2/publication/330713234_Understanding_17_th_18_th_century_Dutch_Tin_glaze_Through_the_Interpretation_and_Reconstruction_of_Historical_Recipes/links/5c506c18a6fdccd6b5d1c45a/Understanding-17-th-18-th-century-Dutch-Tin-glaze-Through-the-Interpretation-and-Reconstruction-of-Historical-Recipes.pdf (accessed on 17 November 2022).
- Chugunova, K.S.; Grigor’eva, I.A.; R. R.Rebrova, “Dutch tiles: experience in archaeometric research”. Conference on conservation of glass and ceramics. Day 2. Morning Section. I.E. Grabar’ conservation center (electronic source). Available online: https://youtu.be/oRRikSKcya4?t=4614 (accessed on 17 November 2022).
- Basic XPS Information Section. Thorium (Th). (electronic source). Available online: https://xpsdatabase.com/thorium-th-z90/ (accessed on 30 November 2022).
- Wainstein, D.; Vakhrushev, V.; et al. Features of Microstructure and Composition of 18th Century Dutch Tiles Revealed by SEM, XRF, XPS, and TOF-SIMS. AIP Conf. Proc., 2023, in press.
Figure 1.
XPS spectra obtained from feldspar: (a) Part of the survey spectrum; (b) Region with Cu, V, Mg, Na lines; (c) V 2p region.
Figure 1.
XPS spectra obtained from feldspar: (a) Part of the survey spectrum; (b) Region with Cu, V, Mg, Na lines; (c) V 2p region.
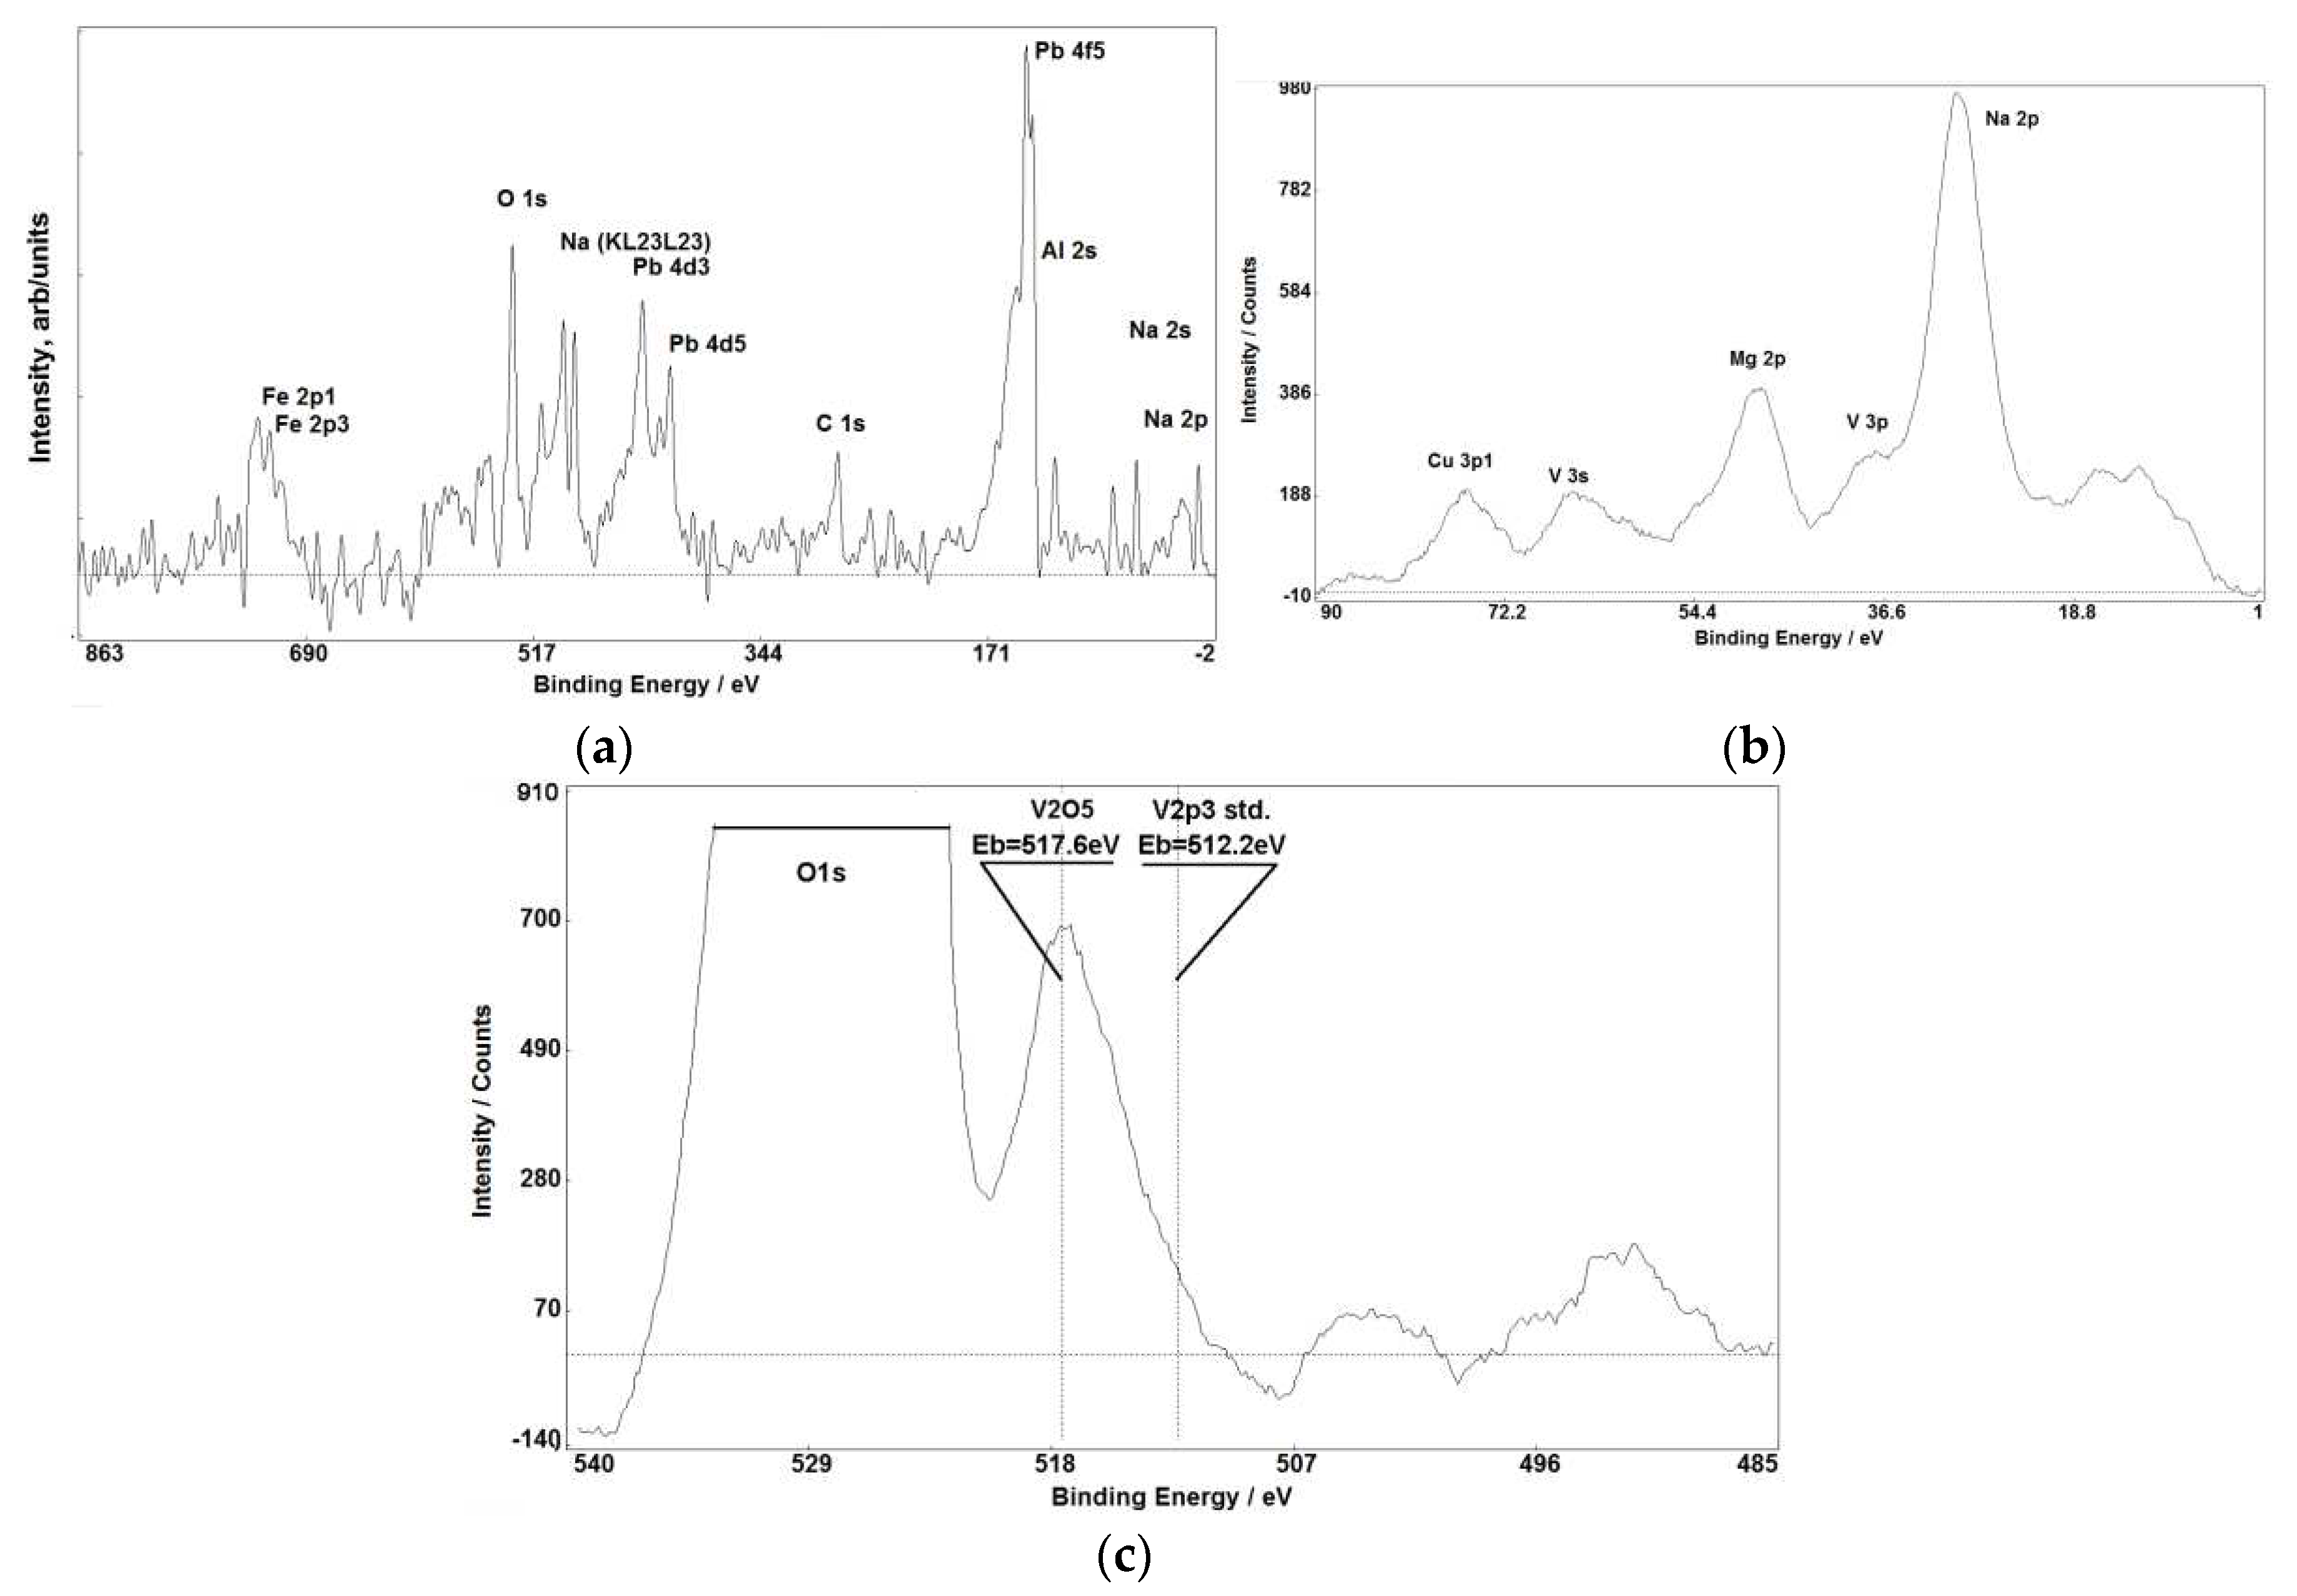
Figure 2.
XPS spectra obtained from pegmatite: (a) Survey spectrum with strong Fe and K lines; (b) Na 2s — Na 2p region.
Figure 2.
XPS spectra obtained from pegmatite: (a) Survey spectrum with strong Fe and K lines; (b) Na 2s — Na 2p region.
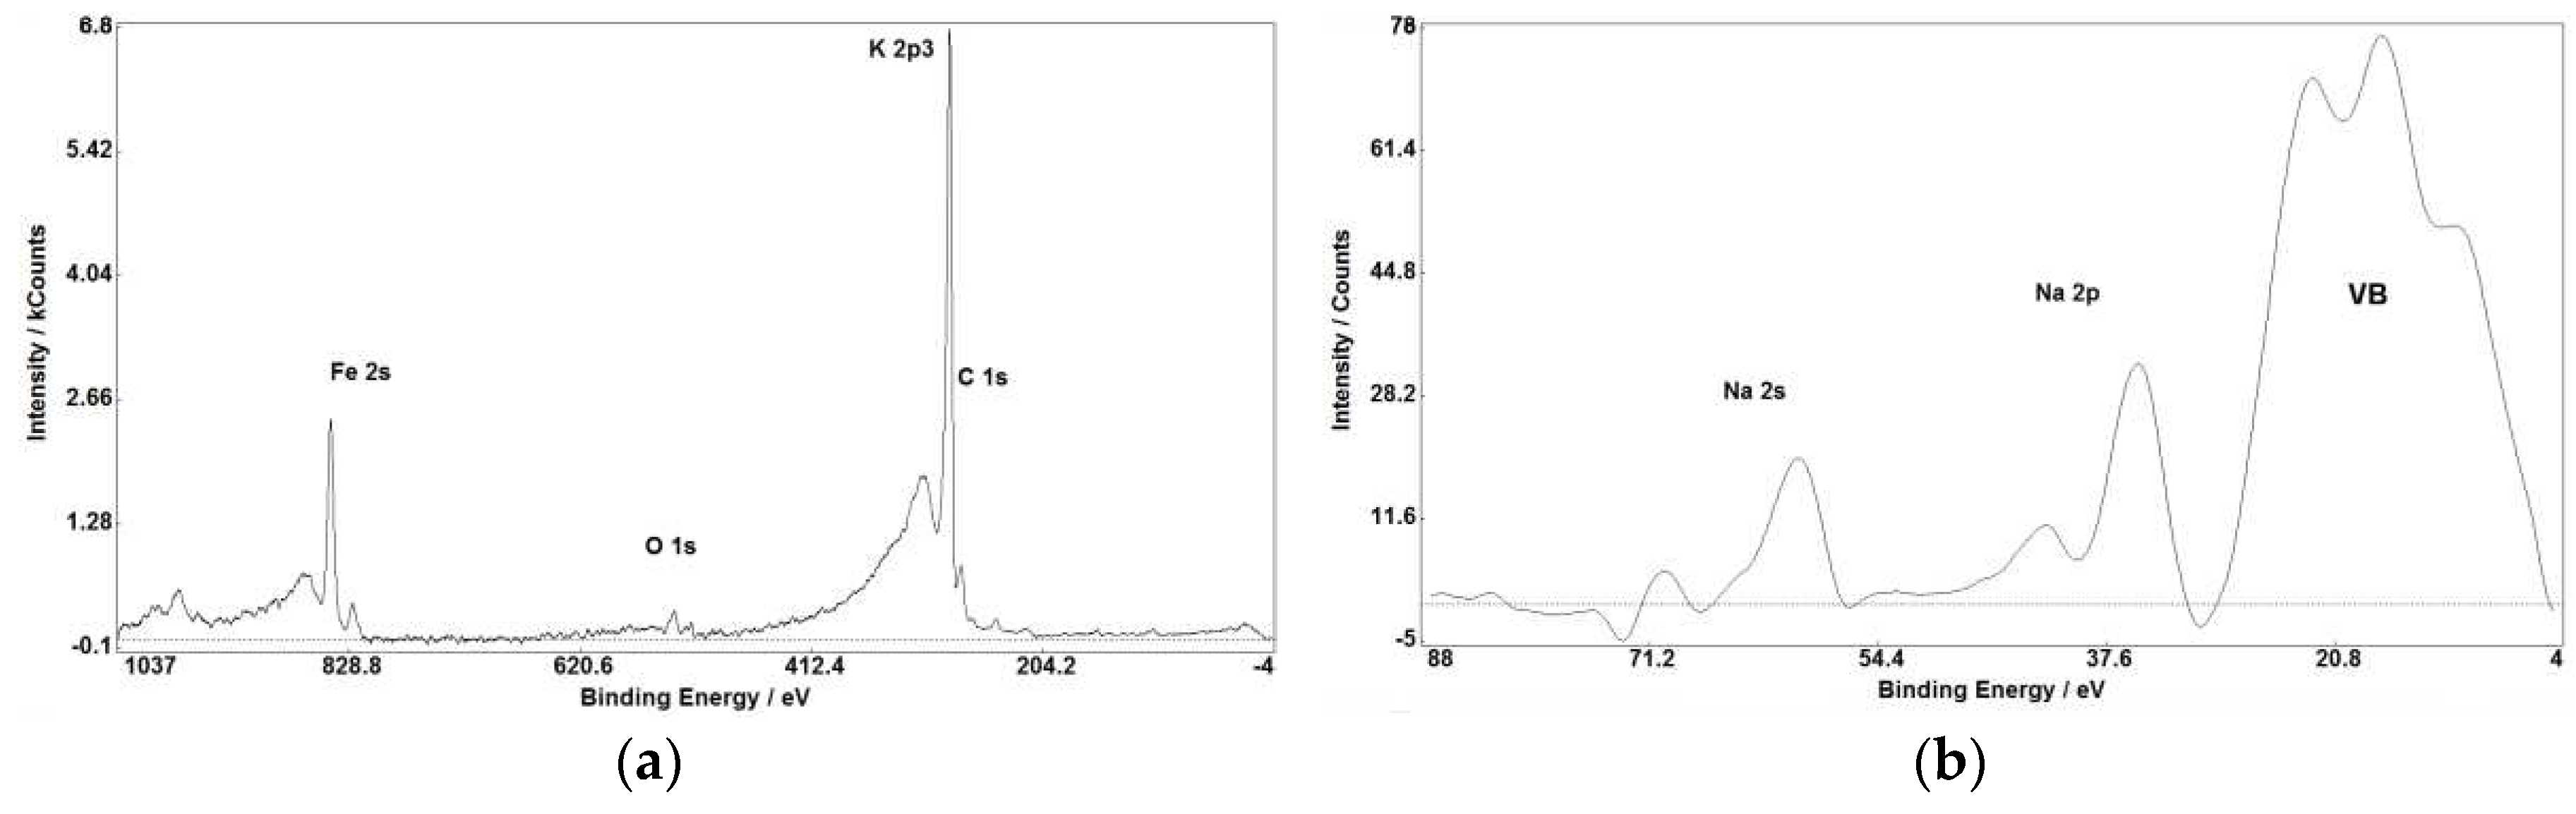
Figure 3.
XPS spectra obtained from Vesco-prima clay.
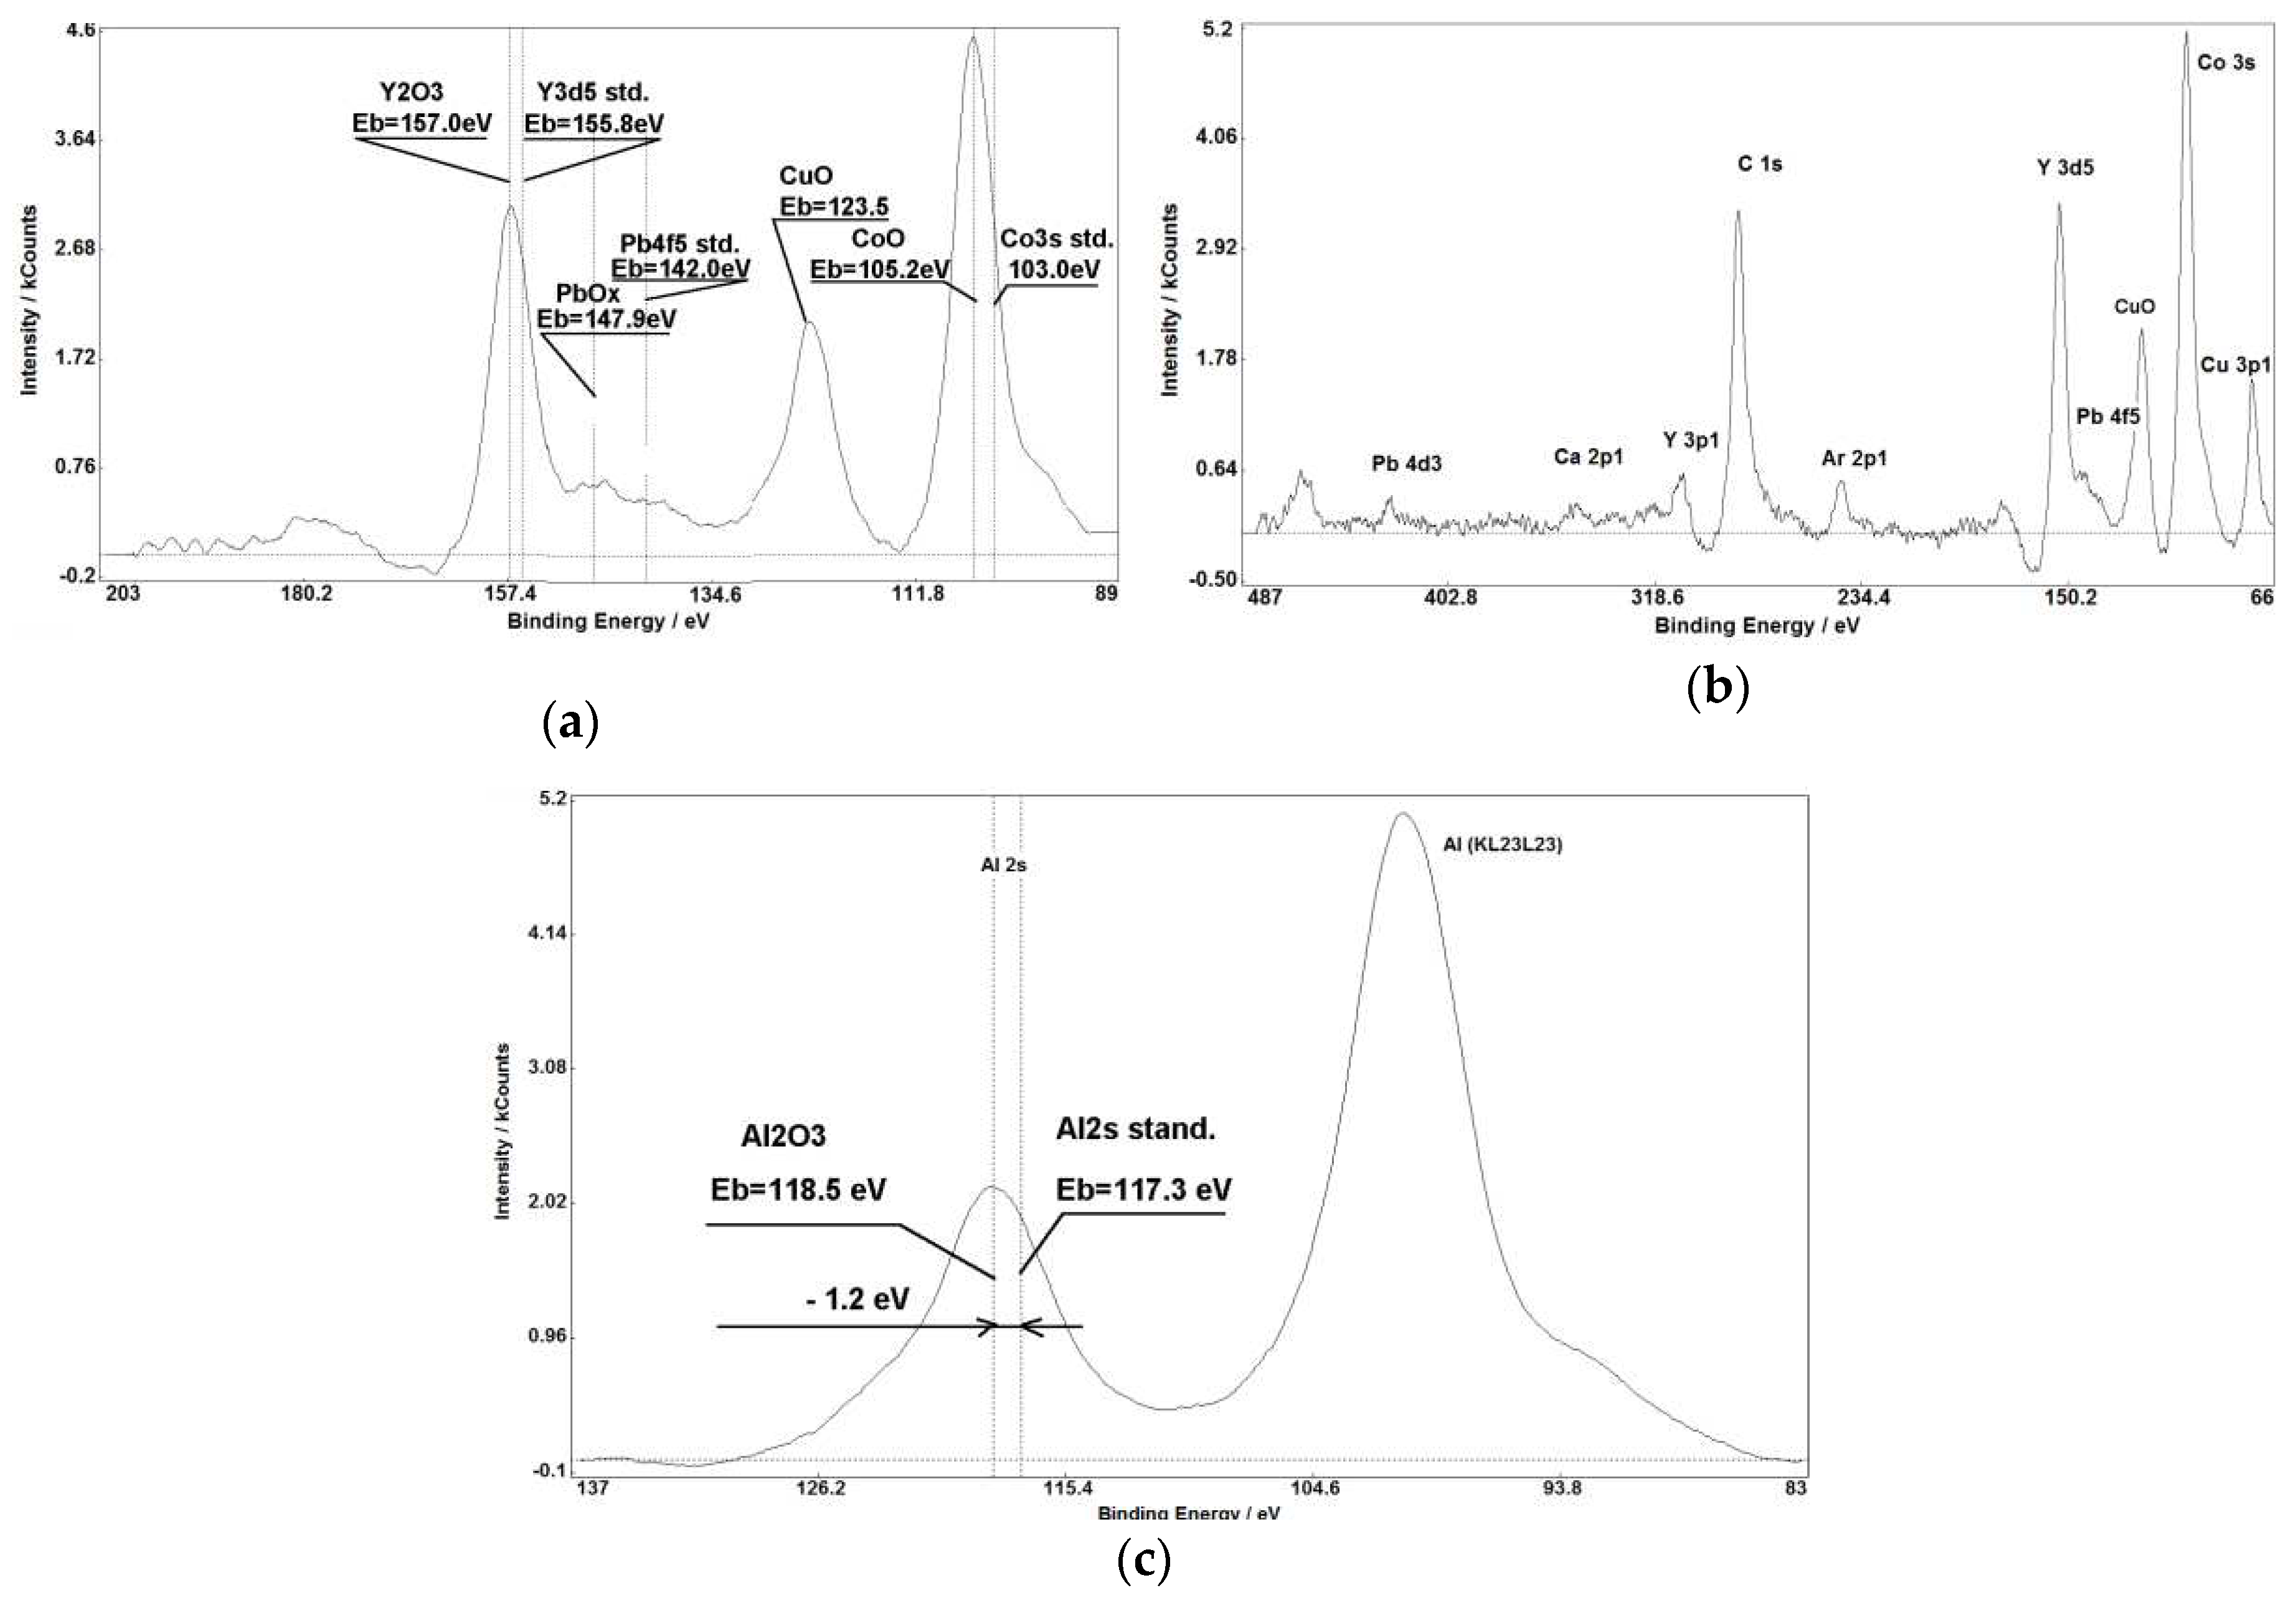
Figure 4.
XPS spectra obtained from kaolin.

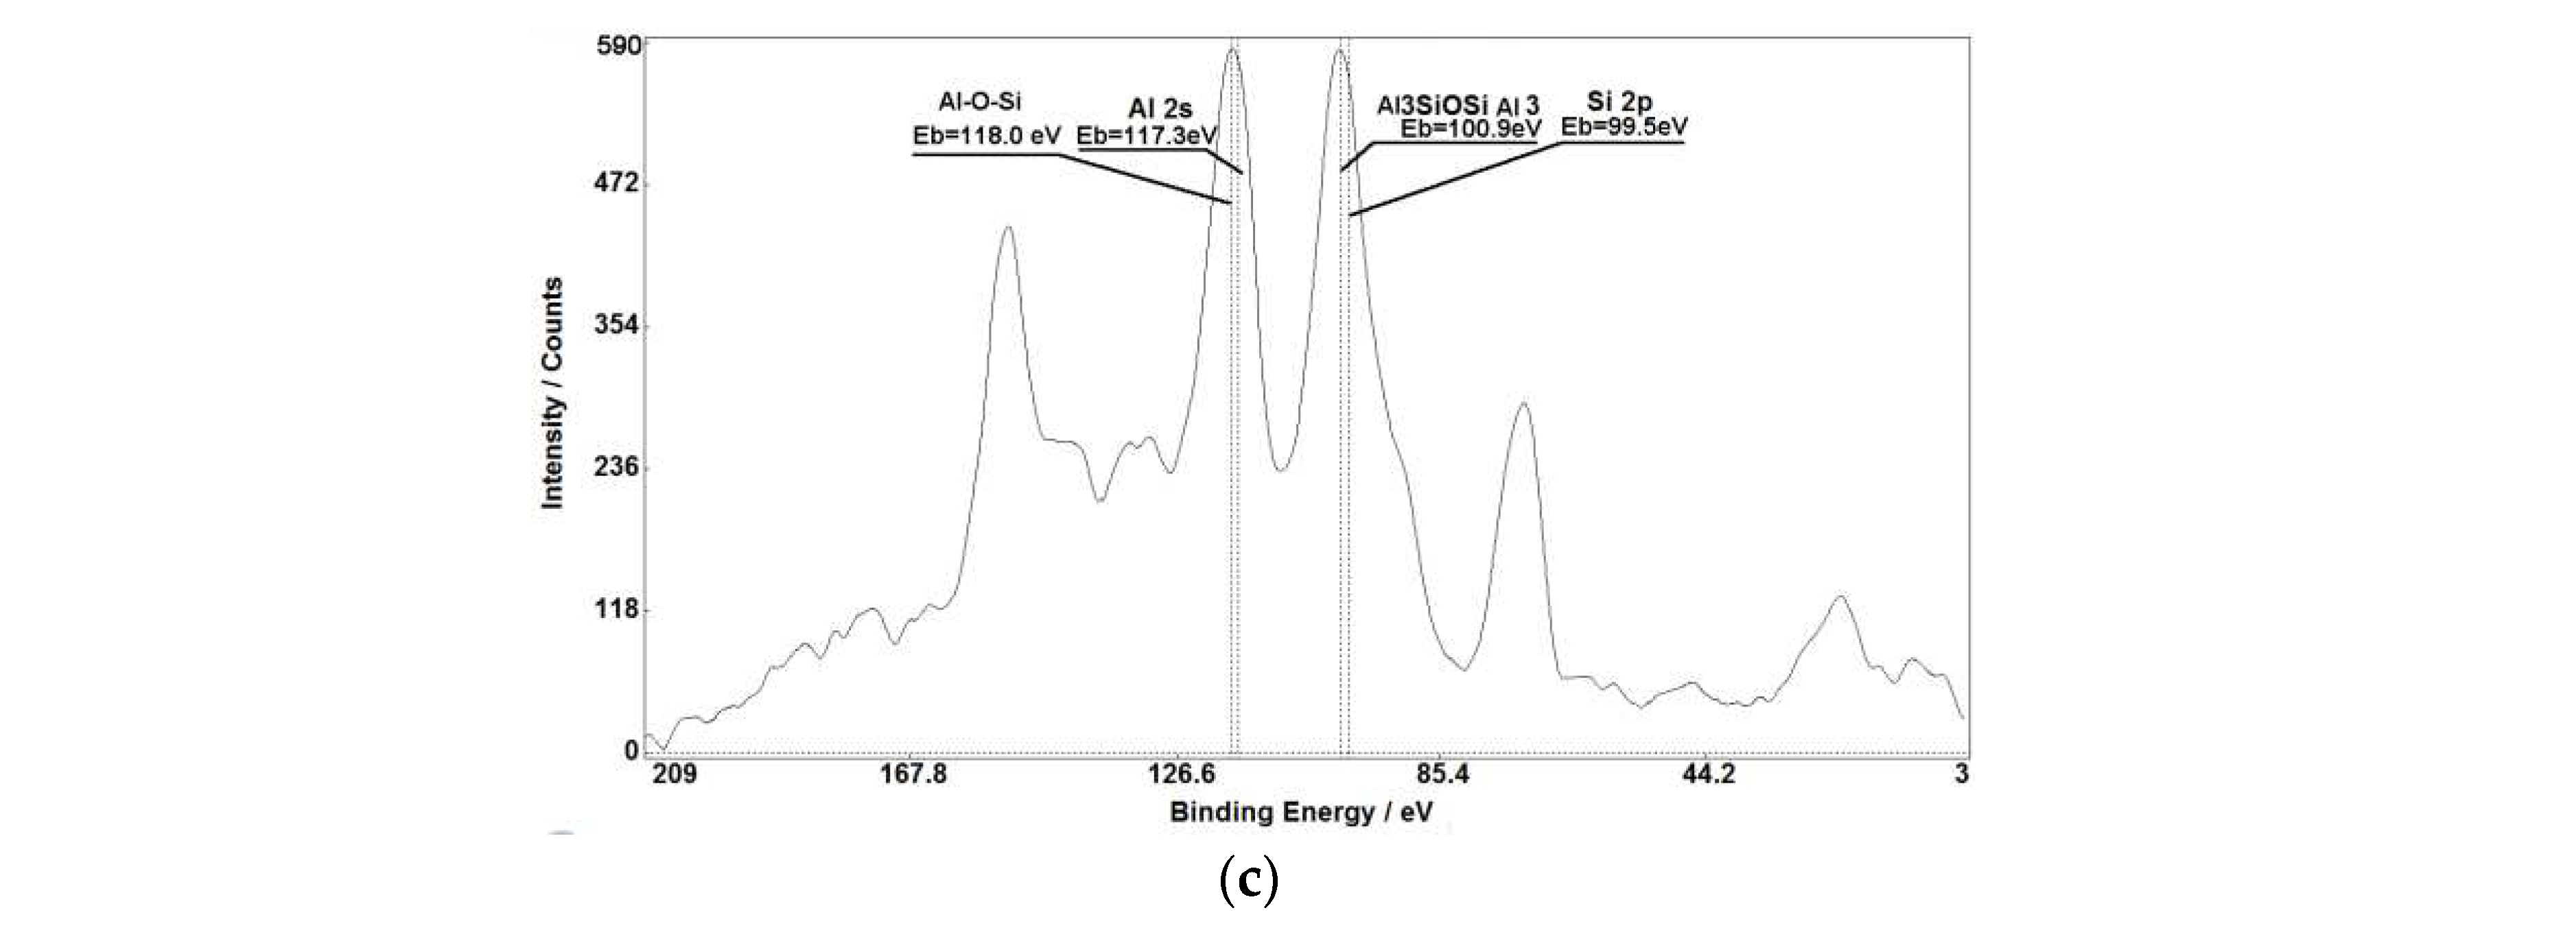
Figure 5.
XPS spectra obtained from dolomite.
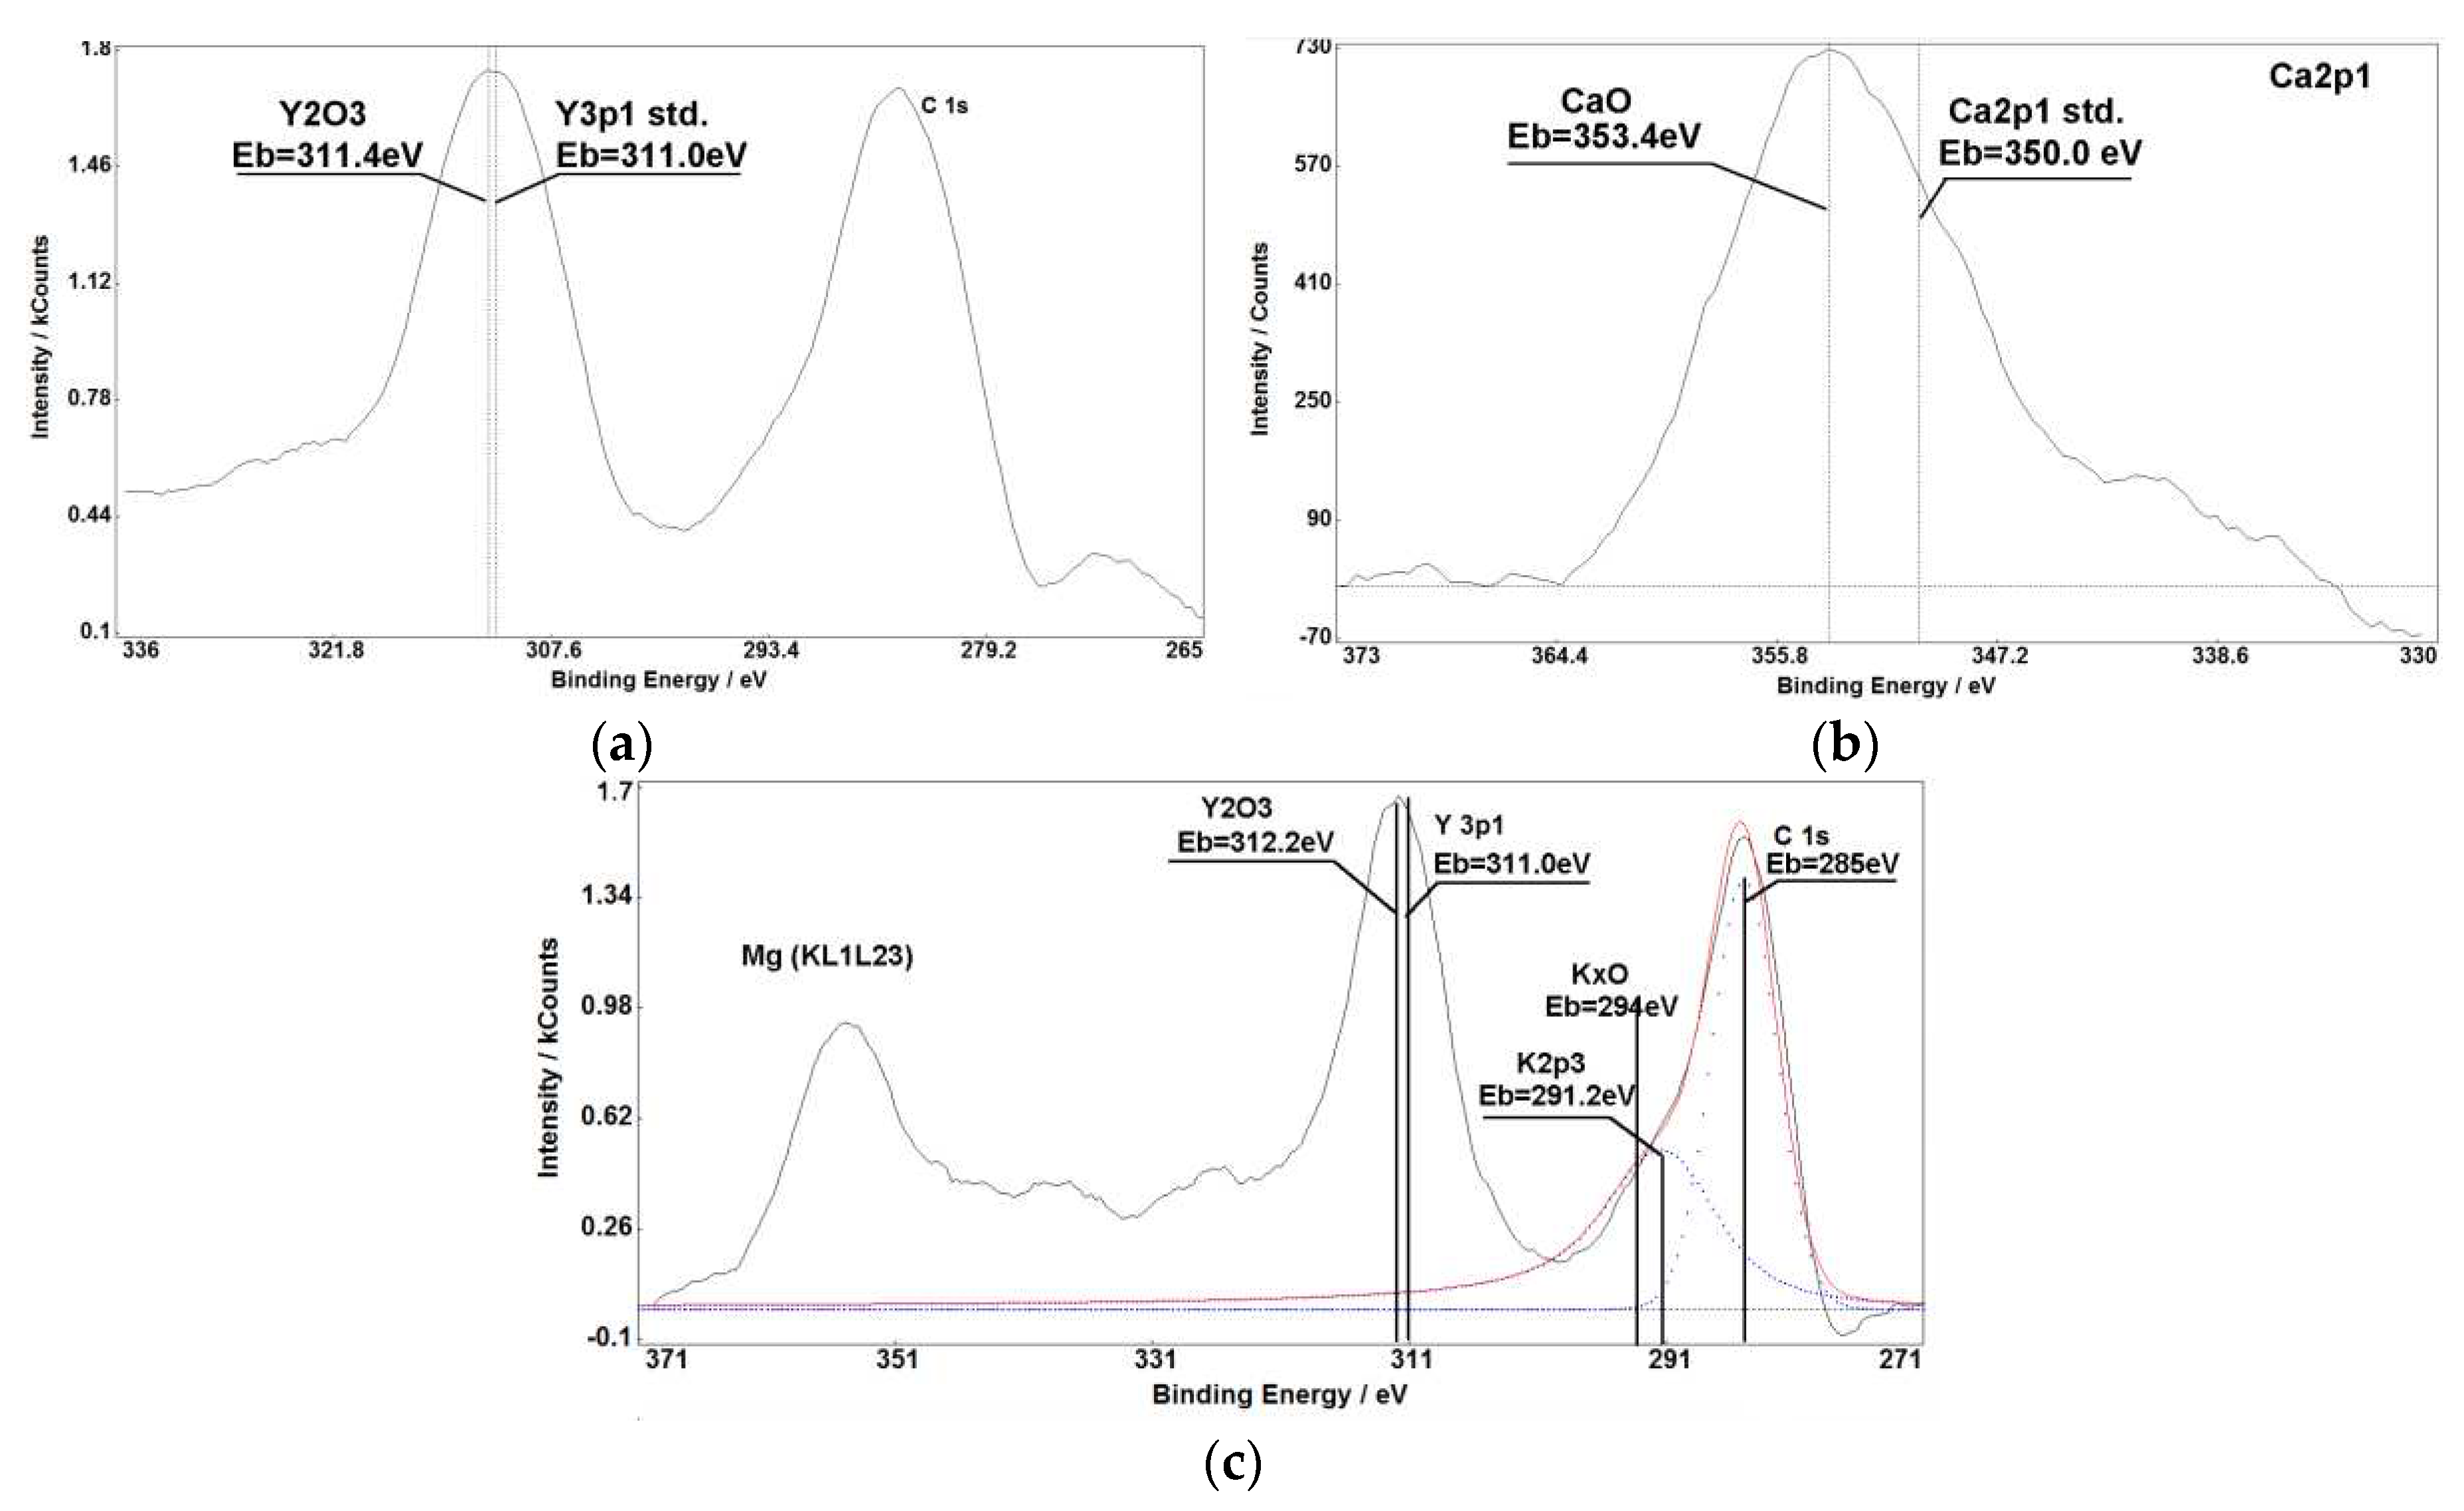
Figure 6.
XPS spectra obtained from bone earth.
Disclaimer/Publisher’s Note: The statements, opinions and data contained in all publications are solely those of the individual author(s) and contributor(s) and not of MDPI and/or the editor(s). MDPI and/or the editor(s) disclaim responsibility for any injury to people or property resulting from any ideas, methods, instructions or products referred to in the content. |
© 2023 by the authors. Licensee MDPI, Basel, Switzerland. This article is an open access article distributed under the terms and conditions of the Creative Commons Attribution (CC BY) license (http://creativecommons.org/licenses/by/4.0/).
Copyright: This open access article is published under a Creative Commons CC BY 4.0 license, which permit the free download, distribution, and reuse, provided that the author and preprint are cited in any reuse.


