
You are currently viewing a beta version of our website. If you spot anything unusual, kindly let us know.
Preprint
Article
Cascade CFAR & SLA Ship Detector for Multi-Frequency SAR Data
Altmetrics
Downloads
203
Views
69
Comments
0
A peer-reviewed article of this preprint also exists.


This version is not peer-reviewed
Abstract
In the framework of maritime surveillance, vessel detection techniques based on spaceborne Synthetic Aperture Radar (SAR) images have promoted extensive applications for the effective understanding of unlawful activities at sea. The paper deal with this topic presenting a novel approach exploiting a cascade application of a pre-screening, and discrimination phase. The latter leverage the SAR spectrum by means of sub-looks analysis. For the first time, the method has been validated with experiments on multi-frequency (C-, X-, and L-band) SAR images. For a future syngergic exploitation of more SAR missions, the developed dataset, composed of Sentinel-1, SAOCOM and COSMO-SkyMed images, is comprehensive of multiple images gathered over the same area with short time lag (below 15 minutes). Finally, the diversified processing chains and the results for each mission product and scenarios are discussed. Being the first dataset of SLC (Single Look Complex) SAR multi-frequency data, the present work intends to encourage additional research in this promising field of research.
Keywords:
Subject: Engineering - Marine Engineering
1. Introduction
The definition of Marine Domain Awareness (MDA) conceives the effective understanding of everything related to the maritime environment that may have an impact on the security, safety, economics, or environment [1,2]. In this framework, geolocating ships at sea, i.e. calculating their coordinates in a specific reference frame, is an issue that holds a critical role in improving MDA [3]. Such a problem is referred in the literature as "ship detection" and finds particular application both theoretically and practically in many coast guard tasks, from law enforcement to maritime safety, and from search and rescue to vessel traffic management services [4,5,6,7]. Notably, the detection of vessels can be attained both with airborne [8], spaceborne [9] and in-situ instrumentation [10].
Concerning this latter, the Automatic Identification System (AIS), a VHF (Very High Frequency) transceiver built originally for collision avoidance, is currently the major utilise for maritime monitoring by Vessel Traffic Services (VTS) [11]. The broadcasted messages contain useful information about vessel identity, position, speed, course, destination and other data that is critical for maritime control and navigational safeness [12]. These information are delivered both ship-to-ship and ship-to-shore AIS stations (Figure 1).
The initial worries regarding the efficacy of an AIS-based monitoring system can emerge when examining its coverage at sea, which is up to 20 nautical miles without repeaters. However, the major issue with the AIS lies in its "cooperative" tracking technology. The transmitter can be purposefully set off during unlawful activities. In such a circumstance, the ship becomes a "dark vessel", i.e., a vessel that operates without an AIS transponder or with it turned off [3]. Still, the AIS legislation retain its carrying obligation only for certain classes of vessels: as stated in the SOLAS regulation [13], all passenger ships (regardless of size), international voyaging ships of 300 gross tonnages (GT) or more, and 500 GT and greater cargo ships not embarked on international journeys are obliged by the International Maritime Organization (IMO) to be equipped with AIS [13]. Finally, situations of corrupted of incorrect AIS messages are prone to occur [14]. Therefore, while definitely contributing in vessel monitoring, the AIS is only one side of a valuable MDA solution. To be actually helpful, the AIS messages must be used in cooperation with other sensors, specifically non-cooperative and with extensive coverage [15]. Mainly for these reasons, satellite technologies are currently integrated into marine surveillance services and procedures because they provide cost-effective remote monitoring, worldwide scope, regular updates, and a large volume of data gathered [12,16,17]. Even if optical imagers started gaining attention [16], spaceborne Synthetic Aperture Radars (SARs) remain the most preferred choice because offering unique characteristics that make them particularly tailored for supporting AIS-based monitoring systems. Being active sensors do not face the disadvantage of operating only during the daytime. It is worth noting that most of the illegal activities take place at night. Secondly, the transmitted electromagnetic wave in the typical range of utilization (1-10Ghz) is not significantly affected by cloud cover or precipitations, thus making the imaging system able to penetrate clouds and detect vessels even when covered nighttime [18]. So, there is a wide corpus of literature dealing with ship detection in SAR images. The detection techniques in SAR imagery are influenced by several different key parameters but the research work on SAR ship detection can be divided into categories based on the physical property exploited. The backscatter-based methods [19,20] utilize the RCS (Radar Cross Section) [18] of the vessels, usually higher than the surroundings. They are fast and easy from a design point of view but with low performance since typically affected by ambiguities [21,22,23,24]. Polarization-based [24,25,26,27,28,29] approaches to leverage the polarimetric scattering mechanism to separate ships from clutter. This approach is generally more robust but usually time-consuming and computationally intensive. Besides, for the polarimetric scattering decomposition [30] a quad-pol SAR imagery is required. The geometry-based methods [31,32] search for specific geometric features such as length, width, aspect ratio, perimeter, area, or contour. They demand an adequate template library and high-resolution SAR imagery. Feature-based methods use local feature descriptors e.g., HOG (Histograms of Oriented Gradients) [33], SIFT (Scale Invariant Feature Transform) [34], Haar-like features [35] and so on. The methods show maturity in feature design but they are time-consuming and weak in migration. Very recently, thanks to the large availability of earth observation data, deep-learning methods [36,37,38,39,40,41,42] are insurged also in the ship detection community. These techniques learn not hand-engineered abstract features from large annotated data for extrapolating specific patterns during inference time. Great performance have been demonstrated even near coasts and reefs without the need for land separation [43]. The disadvantage of these methods stands in the supervised learning approach that demands large labeled datasets.
For achieving effective maritime surveillance, it is essential not only the utilization a non-cooperative approach but also the synergic exploitation of multi-frequency/multi-mission (MF/MM) data for taking advantage of higher revisit times. This aim is approached by the present work proposing a custom algorithm for ship detection adapted to three different SAR missions, i.e., Sentinel-1, SAOCOM, and COSMO-SkyMed. The algorithm embodies the fast and efficient CFAR (Constant False Alarm Rate) [44,45,46,47] with a SLA (Sub-look Analysis) [22,23,24,48] discrimination technique applied in cascade. In the framework of the COastal Area monitoring with SAR data and multimission/multifrequency Techniques (COAST) project, funded by Italian Space Agency (ASI), a novel dataset has been developed utilizing MF/MM imagery. The comprehensive dataset enables the testing of the effectiveness of several missions under comparable circumstances. To the knowledge of the authors, this constitutes the first SLC (Single Look Complex) MM/MF SAR dataset and a major novelty of this work. Another innovation lies in its specific attention to in-shore areas which are typically characterized by phenomena affecting the detection performance. The latter can include the fast dynamics of vessels’ motion near ports, ambiguities generated by land-strong scatterers, or saturation/anomalous side-lobe pattern effects.
The manuscript is structured as follows: Section 2 details the development of the MM/MF SAR dataset and its ancillary information. Section 3 details the methodology adopted in this work from the pre-processing of the data to the implementation of a novel detector. Then, Section 4 discusses the results achieved by means of a large-scale validation approach on the proposed dataset. Finally, Section 5 draws the conclusion of the present study also pointing out new future directions.
2. Multi-mission/Multi-frequency SAR Dataset
As stated above, for the construction of the MM/MF dataset three missions have been considered, i.e., the Italian COSMO-SkyMed (X-Band), the Argentinian SAOCOM (L-Band), and the European Sentinel-1 (C-Band). The characteristics of the selected products are briefly described in the Table 1 which demonstrates how the images differ not simply in the working frequency bands. Concerning Sentinel-1 images, all the products were gathered in the vertical polarization (VV + VH) of the IW mode. COSMO-SkyMed and SAOCOM were instead acquired in stripmap HH and VH polarization, respectively.
2.1. Selected Scenarios
Data collection starts from the selection and identification of region of interest. For the present study, three different scenarios have been selected purposely for maritime monitoring, i.e., a) Adriatic sea, b) Sardinia, and c) Egadi Islands (Figure 2).
It must be emphasized once more that the goal is to maximize the benefits of MF/MM SAR images for maritime surveillance. As a result, a short time gap between successive acquisitions over the same region is required. A tool that inspects the effective spatial and temporal couplings of the MF/MM products has been developed specifically for this purpose. The tool provides highlights of the various acquisition availability reporting useful insights about the three SAR missions under consideration. Finally, the value of the project’s supplementary AIS data is explored.
The Egadi Islands Marine Reserve, with its 53,992 hectares, is not only Europe’s largest, but it also has the peculiarity of being the initial point of arrival for several marine species whose migrations are frequently linked to the flow of the Atlantic current. In recent years, there have been several complaints about illegal activities in the Egadi Islands’ marine protected area, such as trawling in shallow waters or use of illegal nets longer than the 2.5 kilometers required by law for underwater fishing in prohibited areas [49]. Sardinia’s scenario concerns violations related to the “waste cycle”, and polluting discharge. In recent years there have also been several seizures of drugs and weapons in Sardinian ports and waters. Additionally, according to recent research [50,51], Sardinia has the absolute record of seized fish products. Finally, in the Adriatic in general there is a drastic decline in fish stocks due to intensive fishing, the effects of which have profoundly changed the marine environment. This is an area where excessive trawling has had a very strong impact, so much so that fish stocks in the Adriatic have been greatly reduced [52]. Illegal fishing is not the only unlawful activity, arms, drug trafficking and smuggling are also widespread.
2.2. Footprint Matching
The Footprint Matching Algorithm (FMA) is a novel contribution of the paper that oversees coupling different SAR products on the same spot and proceeds in two cascaded steps. In the first stage, SAR products are filtered on a temporal basis, considering two products as matched if their sensing period difference is below 15 minutes. This key value has been determined on a heuristic rationale whereby ships after that time difference could not be matched between the images. The algorithm serves as a pre-screening step and is followed by spatial matching to filter the product that covers the same area of interest (AOI). The spatial matching is carried out by exploiting the footprint data contained in the product metadata. The area of intersection is used to establish a correct spatial match between two footprints. Finally, to conclude the analysis a visual inspection is performed: the footprints are plotted in interactive *.html maps and the quality of the intersection is evaluated both in terms of area covered and area of interest, verifying that the intersections cover sea zones. An example of map realised for the scenario of the Egadi Island is reported in Figure 3 by which is possible to observe the Sentinel-1 & COSMO-SkyMed coupling.
The Table 2 shows the number of couplings in each scenario selected for COAST project, detailing separately the various SAR mission parings. Notably, in the Egadi Islands region, only COSMO-SkyMed and Sentinel-1 products have found matches. For major details regarding the coupled products, their relative geometries, orbit types and platforms can be found in [53]. For sake of brevity, the Table 2 only details the of couplings for each scenario of interest of the MM/MF dataset.
2.3. AIS Data
Ancillary AIS data are a useful resource included in the dataset to provide information on specific targets. The AIS messages can be categorized into three types: static, dynamic, and voyage-related information. Only the dynamic one is updated frequently (< 10 minutes), with a rate changing according to vessel speed and course variation, ranging from a few seconds for very fast ships to several minutes for sluggish or moored ships. When collaborative ships are available, their position contained in the SAR products have been stored in a database. Nonetheless, the storage policy of [54] save the messages with a temporal resolution of around 1 minute. Therefore, data has been priorly pre-processed with Hermite interpolation taking as reference time the central time of acquisition of each SAR image. Besides, when an insufficient number of points made it infeasible to execute an interpolation, an extrapolation technique was used. However, in many cases this approach resulted in a wrong placement of the ship location. The misleading is caused by wrong extrapolation, erroneous AIS messages, or sudden route changes of the ships. The real position of ships has been collected visually inspecting each SAR image, manually labelling each vessel.
3. Method
Targets that are not truthful vessels acting as powerful signature ghosts are labeled as ambiguities in SAR literature [48]. The method developed in this manuscript aims at filtering the latter. The causes of ambiguities may be traced back to the limited sampling of the SAR pulses, which affects the Doppler spectrum [23]. Generally, SAR ambiguities can be produced in two ways. In the first case, the ambiguities are brought on by large ships. In this scenario, the ship’s brightness creates ambiguity that may be stronger than the surrounding clutter, which might cause ghosts in the SAR picture to resemble the ship’s actual signature. In the second case, the ambiguities are caused by land targets. Due to the low backscattering from the water in this scenario, which is characteristic of coastal zones, the ambiguities produced by land targets show as bright targets over the sea surface. In the case of high-resolution SAR images, these artifacts become more prominent. In essence, as the spatial resolution grows, so does the compression gain in SAR image formation. As a result, the improvement of the dynamic range of SAR images increases the intensity of strong point scatterers. The following sections describe in detail the pre-processing chains for each SAR product and the CFAR+SLA detector.
3.1. Pre-processing Chains
A general understanding of the pre-processing chains implemented for the detection of visible ships in the MM/MF products is illustrated in the Table 3 where each pre-processing step applied to the different SAR products is detailed with a checkmark. Sea-land segmentation is a mandatory step that can greatly minimize false alarm rates and enhance follow-up processing efficiency.
As also exhibited in Table 3, apart from a Land-Masking (LM) processing, SAOCOM products do not require any further dispensation. The multilook operator, applied only on COSMO-SkyMed products, is not mandatory but suggested to reduce the computational burden. Significant concerns regard the LM operator which usually require a Digital Elevation Models to compute the coastline, whereas other researchers prefer to use specific extraction techniques [55]. In this paper, the land polygons are extracted from [56].
3.2. The CFAR+SLA detector
The methodology developed in proceeds in two steps in cascade, i.e., pre-screening and discrimination. Firstly, target proposals are generated with a traditional CFAR algorithm and then these ones are discriminated with a spectrum analysis technique, i.e., Sub-look Analysis (SLA).
The adaptive threshold applied uses the nested windows approach in which there are three windows around each pixel under test—a target window (TW), a guard window (GW), and a background window (BW). The adaptive threshold is the basis of the pre-screening process. The size of the target window should be approximately equal to the size of the smallest object to detect, the size of the guard window should be approximately equal to the size of the largest object, and the size of the background window should be sufficient to accurately estimate the local background statistics. Indeed, the algorithm leverages the statistical modeling of the background clutter [57,58,59,60] by which a probability density function can be associated. Thus, the design parameter T can be computed by the from user selected as:
Once prompted background mean and standard deviation using pixels in the background ring, and the mean value of the target window, a region is a candidate as a potential target if:
During this operation, the operator first groups contiguous detected pixels into a single cluster, then extracts the width and length information from the clusters. Finally, clusters that are too large or too small are excluded based on these measurements and user input discrimination criteria. This first level of filtering is called geometric discrimination. In conclusion, CFAR detection is designed to search for pixels that are unexpectedly bright in comparison to those in the surrounding sea, although SAR ambiguities or sea clutter may also fit this criteria.
To tackle this issue, the second level of discrimination employs the Sub-look analysis of the selected region of interest for the removal of the false alarms. The physical rationale is that the Doppler spectra of ambiguities and targets are distinguished. As shown in Figure 4, subsets and metadata are fed in input to the SLA algorithm. Typical metadata information required by the sub-look processor contains parameters such as the Pulse Repetition Frequency (PRF) or the bandwidth of processing in azimuth [48].
Sub-looks are generated starting from the SLC regions of interests detected at the previous steps. As detailed in [48], one-dimensional sub-look generation is conceived, which is the most common approach for ship detection. Therefore, sub-looks can be generated either in azimuth or in range. It is worth recalling that there is no significant difference in ship detection performance between range and azimuth sub-looks even when moving ships are imaged. The number of sub-looks, , the bandwidth of the sub-looks, , and the frequency separation between the centroids of two close looks, , constitute the relevant parameters that must be set. In general, is equally configured for all sub-looks. This ensures to deal with sub-looks having the same resolution, and thus allowing a fair comparison between them. Indeed, the fraction of covered by a sub-look is an index of the degradation of resolution with reference to the original resolution of the SLC data. Regarding the , for ship detection purposes usually only two sub-looks are considered. However, for estimating the Incoherent Entropy (IE) [48] a minimum of three sub-looks are used. Concerning the location of each sub-look, the common approach is to consider the sub-looks equally spaced along the available bandwidth. It is worth remembering that sub-looks are overlapped in frequency if . Recalling that the IE calculation is a boxcar algorithm [48], displays the bandwidth of the sub-looks, centroids frequency separations and windows sizes () estimated with a grid-search algorithm on known targets.

Table 4.
Parameters used for the sub-look analysis for Sentinel-1, COSMO-SkyMed and SAOCOM missions.
Table 4.
Parameters used for the sub-look analysis for Sentinel-1, COSMO-SkyMed and SAOCOM missions.
| Parameter / Mission | Sentinel-1 | COSMO-SkyMed | SAOCOM |
|---|---|---|---|
| 102.0 Hz | 466.6 Hz | 372.0 Hz | |
| 102.0 Hz | 466.6 Hz | 372.0 Hz | |
| 7,17 | 17,17 | 3,17 |
After the sub-look generation, IE relative to each region of interests is prompted . In the end, a threshold algorithm is applied by considering stable pixels in a nested windows fashion. In fact, considering a matrix of IE prompted for a subset, a statistical process analyzes the average values inside and outside the small 30 × 30 pixels region at the center of each subset (Figure 5). In the same way of the CFAR, a buffer window of 70 × 70 pixels is considered to reduce disturbances in the computations. Summarizing, the discrimination algorithm outputs a class for the target or ambiguity depending on the stability of the pixels of the target with reference to the pixel stability of the background. In conclusion, the CFAR+SLA detector can be considered an extension of the work of [48] where the IE is pertained only around the pre-screened targets and the thresholds are prompted in a nested fashion.
Some demonstrative examples of IE for COSMO-SkyMed, Sentinel-1 and SAOCOM ship targets and ambiguities are reported in the Figure 6, Figure 7 and Figure 8, respectively. These samples are very useful to show crucial behaviours of IE under different frequency bands, still not damaging the effectiveness of the discriminator.
4. Experimental Analysis
4.1. Performance Indicators
To monitor the overall performance of the detection algorithm, the detection probability, false alarm rate and consequently the ROC (Receiver Operating Characteristic) curves were defined. It should be noted that in the literature, the metrics of detection probability and false alarm probability are defined differently from author to author [61]. For example, some authors prefer to relate the false alarm rate to the area of the observation scenario [19]. In this study, such metrics were adopted as:
having denoted the number of target-coupled detections, the number of targets in the scene, the total number of detection algorithm outputs. Once defined the metrics, it is possible to measure the relative importance of the CFAR algorithm parameters on the detection performance. Noteworthy is that having defined the metrics in such way, the probability of detection and false alarm rate results decoupled. However, before calculating these curves, an attempt was made to solve one of the issues of this adaptive threshold approach. While the CFAR algorithm is a well-established and well accepted in the scientific community, it is not without faults: the multiple detections on the same target represent one of the most typical one. To address this issue and, consequently, minimize the false alarm rate, a detection suppression technique was developed combining nearby detections that are located less than 150 meters apart from each other. The new location is supposed to be placed in the middle of the two. Notably, the threshold was experimentally determined.
4.2. Local Analysis
A study of the CFAR+SLA algorithm’s performance on a COSMO-SkyMed product (Figure 9) is here presented.
This scene was chosen for its unique characteristics since it represents a very difficult case with intricate coasts, azimuth ambiguities, and ships in close proximity to one other and the coast. In fact, the image collects the port of Taranto, which is rich with potential sources of false alerts due to its geographical configuration. The presence of docks and other metal buildings adds to the sense of uncertainty. Finally, there is an artifact in the image, specifically a clear stripe, which is most likely the result of a radio signal emitted by one of the ships in port and captured by the X-band. The product was tested with a low threshold value (4.5) and the background, guard and target window sizes as given in Table 5.
This is the default option for running the algorithm in order to increase detection probability while decreasing false alarm rate. In any event, this permits the discrimination algorithm’s performance to be tested across a large number of detections. The overall accuracy of the CFAR+SLA algorithm was evaluated on ship and ambiguity detection, having defined the accuracy as the ratio between true positives and true positives plus false positives. Ultimately, pre and post application results of the discrimination chain have been evaluated in terms of detection probability and false alarm. The results were obtained and reported in Table 6.
4.3. Global Analysis
This section details the performance analysis to estimate the improvement achieved with the CFAR-SLA algorithm. For this purpose, MM/MF products coupled by spatio-temporal matching were analyzed with the CFAR-SLA algorithm in the different identified regions. In more detail, after labelling the products individually, performance was derived via ROC curves. What follows is a brief description of the curves obtained in each reference scenario. Since the AIS data is not fully usable, it should be noted that the goodness of the curves depends on the annotator’s recognition skill. ROC curves were calculated by varying the threshold parameters of the detection algorithm and keeping the other parameters fixed as in the basic configuration shown in Table 5. Specifically, the threshold was linearly sampled in the interval .
4.3.1. Egadi Islands
In the Egadi Islands region, the performance of the algorithm was highlighted by Figure 10. It should be taken into account that in this region the land portions are far smaller than the sea portions. This made it possible to reduce the false alarm rate generated by land ambiguities. As can be seen from the results, the performance of Cosmo-SkyMed and Sentinel-1 are remarkable with an area under the curve (AUC) of value of 0.91, increased to 0.95 after the application of the discrimination pipeline. Concerning Sentinel-1 products, the AUC improved by more than 15% between before and after the application of the discrimination algorithm, going from 0.60 to 0.70.
4.3.2. Sardinia
The evidence of Figure 11 shows how the performance achieved in the region of Sardinia is noteworthy, proving the effectiveness of the discrimination algorithm.
Indeed, the COSMO-SkyMed products clearly demonstrate performance improvements. As can be seen, although with a marginal loss of accuracy in the early part of the graph, the COSMO-SkyMed products experienced a performance increase from the already high 0.88 to 0.91 AUC value. By observing the (b) graph in Figure 11, the SAOCOM products show a small decay of the CFAR-SLA curve around the 0.7 value of Pf. However, as can be appreciated, the AUC is markedly increased from the value 0.78 to the value 0.82. Sentinel-1 products (Figure 11) demonstrated a good performance, increased again using sub-aperture algorithm. In fact, the performance enhancement increased the AUC from 0.72 to 0.77.
4.3.3. Adriatic Sea
Analyzing the products in the Adriatic Sea, it is again clear from the results obtained that there is an increase in performance after the removal of false alarms. The curves, shown by means of the graphs in Figure 12. In contrast to the previous case, the COSMO-SkyMed products showed a performance increase especially in the early part of the graph. The accuracies are also remarkable in this scenario going from a value of 0.78 to 0.87 AUC. The same observations can be repeated also to SAOCOM products (Figure 12), showing an increased AUC after the of application of the discriminator algorithm. As can be seen from the bottom graph in Figure 12, the AUC increases from a value of 0.73 to 0.77. Finally, despite a slightly lower accuracy values at the end of the graph, Sentinel-1 products showed an improvement in detection performance: the area under the curve improved from 0.83 to 0.88.
4.3.4. Area Under the Curve
In essence, the global performances of the COSMO-SkyMed & Sentinel-1 and COSMO-SkyMed & SAOCOM pairs were evaluated and reported by means of Figure 13. The latter reports the AUC before and after application of the sub-aperture analysis algorithm divided into the three scenarios of interest. As it can be seen from the graphs, COSMO-SkyMed performance is remarkable in every scenario and condition, especially in the Egadi Islands region where large portions of sea overlie the few areas of land. This again testifies to the importance of the correct execution of the land separation.
5. Conclusions
Withing the time-frame of 18 months, the present study has assessed the capability of a cascade detector for ship detection purposes on multiple SAR frequency bands (L-, C-, and X-band). The processing chains and the constructed dataset of MM/MF SLC SAR products constitutes an important contribution of the work. The results attained have confirmed the effectiveness of the developed approach, showing an increase of performance in terms of improvement of AUC and reduction of false alarms. Indeed, in a very congested scenario such as the port of Taranto the reduction of the false alarm rate has been estimated around the 40%.
While undoubtedly recognizing the ghost targets, it must be pointed out that solving an eigenvalue problem is computational intensive with an increase of the computational time that grows quadratically with the dimension of the considered tile. It should be taken into account how the time demanded by the discrimination phase matches the one from pre-selection. Therefore, to reduce the time required to process a panoramic SAR product, further research will analyze the capabilities offered by a deep learning-based technique on the developed dataset. Taking full advantage of the SAR spectrum is definitely a path that must be exploited with artificial intelligence.
Funding
This research was funded by Italian Space Agency (ASI) grant number N.2021-11-U.0.
Acknowledgments
This work has been developed in the framework of the Italian Space Agency’s ”Study of new methods and techniques based on the utilization of multimission/multifrequency SAR data”, project ”COastal Area monitoring with SAR data and multimission/multifrequency Techniques - COAST”, ASI Contract N. 2021-11-U.0.
Conflicts of Interest
The authors declare no conflict of interest.
References
- Nimmich, J.L.; Goward, D.A. Maritime domain awareness: the key to maritime security. International Law Studies 2007, 83, 6. [Google Scholar]
- Balci, M.; Pegg, R. Towards Global Maritime Domain Awareness-" Recent Developments and Challenges". 2006 9th international conference on information fusion. IEEE, 2006, pp. 1–5.
- Tetreault, B. Use of the Automatic Identification System (AIS) for maritime domain awareness (MDA). Proceedings of OCEANS 2005 MTS/IEEE, 2005, pp. 1590–1594 Vol. 2. [CrossRef]
- Graziano, M.D.; D’Errico, M.; Rufino, G. Wake component detection in X-band SAR images for ship heading and velocity estimation. Remote Sensing 2016, 8, 498. [Google Scholar] [CrossRef]
- Graziano, M.D.; D’Errico, M.; Rufino, G. Ship heading and velocity analysis by wake detection in SAR images. Acta astronautica 2016, 128, 72–82. [Google Scholar] [CrossRef]
- Graziano, M.D. Preliminary results of ship detection technique by wake pattern recognition in SAR images. Remote Sensing 2020, 12, 2869. [Google Scholar] [CrossRef]
- Del Prete, R.; Graziano, M.D.; Renga, A. First results on wake detection in SAR images by deep learning. Remote Sensing 2021, 13, 4573. [Google Scholar] [CrossRef]
- Joshi, S.K.; Baumgartner, S.V. Range-Doppler tracking of ships using single-channel airborne radar data. EUSAR 2021; 13th European Conference on Synthetic Aperture Radar. VDE, 2021, pp. 1–6.
- Eldhuset, K. An automatic ship and ship wake detection system for spaceborne SAR images in coastal regions. IEEE transactions on Geoscience and Remote Sensing 1996, 34, 1010–1019. [Google Scholar] [CrossRef]
- Shao, Z.; Wu, W.; Wang, Z.; Du, W.; Li, C. Seaships: A large-scale precisely annotated dataset for ship detection. IEEE transactions on multimedia 2018, 20, 2593–2604. [Google Scholar] [CrossRef]
- Young, W. What are vessel traffic services, and what can they really do? Navigation 1994, 41, 31–56. [Google Scholar] [CrossRef]
- Goudossis, A.; Katsikas, S.K. Towards a secure automatic identification system (AIS). Journal of Marine Science and Technology 2019, 24, 410–423. [Google Scholar] [CrossRef]
- International Maritime Organization. "AIS transponders", International Maritime Organization (2017) [Online]. Available:. https://www.imo.org/en/OurWork/Safety/Pages/AIS.aspx, 2019. Accessed: 2022-12-07.
- Zhang, D.; Li, J.; Wu, Q.; Liu, X.; Chu, X.; He, W. Enhance the AIS data availability by screening and interpolation. 2017 4th International Conference on Transportation Information and Safety (ICTIS). IEEE, 2017, pp. 981–986.
- Graziano, M.D.; Renga, A.; Moccia, A. Integration of Automatic Identification System (AIS) Data and Single-Channel Synthetic Aperture Radar (SAR) Images by SAR-Based Ship Velocity Estimation for Maritime Situational Awareness. Remote Sensing 2019, 11. [Google Scholar] [CrossRef]
- Kanjir, U.; Greidanus, H.; Oštir, K. Vessel detection and classification from spaceborne optical images: A literature survey. Remote sensing of environment 2018, 207, 1–26. [Google Scholar] [CrossRef] [PubMed]
- Iceye. Dark Vessel Detection for Maritime Security with SAR Data, 2021. [Online; accessed 19. May 2021].
- Curlander, J.C.; McDonough, R.N. Synthetic aperture radar; Vol. 11, Wiley, New York, 1991.
- Pelich, R.; Longépé, N.; Mercier, G.; Hajduch, G.; Garello, R. AIS-based evaluation of target detectors and SAR sensors characteristics for maritime surveillance. IEEE Journal of Selected Topics in Applied Earth Observations and Remote Sensing 2014, 8, 3892–3901. [Google Scholar] [CrossRef]
- Wang, C.; Bi, F.; Zhang, W.; Chen, L. An intensity-space domain CFAR method for ship detection in HR SAR images. IEEE Geoscience and Remote Sensing Letters 2017, 14, 529–533. [Google Scholar] [CrossRef]
- Raney, R.K.; Princz, G.J. Reconsideration of azimuth ambiguities in SAR. IEEE Transactions on Geoscience and Remote Sensing 1987, pp. 783–787. [Google Scholar] [CrossRef]
- Guarnieri, A.M. Adaptive removal of azimuth ambiguities in SAR images. IEEE Transactions on Geoscience and Remote Sensing 2005, 43, 625–633. [Google Scholar] [CrossRef]
- Choi, J.H.; Won, J.S. Efficient SAR Azimuth Ambiguity Reduction in Coastal Waters Using a Simple Rotation Matrix: The Case Study of the Northern Coast of Jeju Island. Remote Sensing 2021, 13, 4865. [Google Scholar] [CrossRef]
- Velotto, D.; Soccorsi, M.; Lehner, S. Azimuth ambiguities removal for ship detection using full polarimetric X-band SAR data. IEEE transactions on geoscience and remote sensing 2013, 52, 76–88. [Google Scholar] [CrossRef]
- Touzi, R.; Hurley, J.; Vachon, P.W. Optimization of the degree of polarization for enhanced ship detection using polarimetric RADARSAT-2. IEEE Transactions on Geoscience and Remote Sensing 2015, 53, 5403–5424. [Google Scholar] [CrossRef]
- Touzi, R. On the use of polarimetric SAR data for ship detection. IEEE 1999 International Geoscience and Remote Sensing Symposium. IGARSS’99 (Cat. No. 99CH36293). IEEE, 1999, Vol. 2, pp. 812–814.
- Brekke, C.; Anfinsen, S.N. Ship detection in ice-infested waters based on dual-polarization SAR imagery. IEEE Geoscience and Remote Sensing Letters 2010, 8, 391–395. [Google Scholar] [CrossRef]
- Marino, A.; Sanjuan-Ferrer, M.J.; Hajnsek, I.; Ouchi, K. Ship detection with spectral analysis of synthetic aperture radar: A comparison of new and well-known algorithms. Remote Sensing 2015, 7, 5416–5439. [Google Scholar] [CrossRef]
- Wang, W.; Ji, Y.; Lin, X. A novel fusion-based ship detection method from Pol-SAR images. Sensors 2015, 15, 25072–25089. [Google Scholar] [CrossRef] [PubMed]
- Xie, Q.; Ballester-Berman, J.D.; Lopez-Sanchez, J.M.; Zhu, J.; Wang, C. Quantitative analysis of polarimetric model-based decomposition methods. Remote Sensing 2016, 8, 977. [Google Scholar] [CrossRef]
- Zhu, J.; Qiu, X.; Pan, Z.; Zhang, Y.; Lei, B. Projection shape template-based ship target recognition in TerraSAR-X images. IEEE Geoscience and Remote Sensing Letters 2016, 14, 222–226. [Google Scholar] [CrossRef]
- Wang, C.; Bi, F.; Chen, L.; Chen, J. A novel threshold template algorithm for ship detection in high-resolution SAR images. 2016 IEEE International Geoscience and Remote Sensing Symposium (IGARSS). IEEE, 2016, pp. 100–103.
- Song, S.; Xu, B.; Yang, J. SAR target recognition via supervised discriminative dictionary learning and sparse representation of the SAR-HOG feature. Remote Sensing 2016, 8, 683. [Google Scholar] [CrossRef]
- Zhou, D.; Zeng, L.; Zhang, K. A novel SAR target detection algorithm via multi-scale SIFT features. J. Northwest. Polytech. Univ 2015, 33, 867–873. [Google Scholar]
- Ai, J.; Tian, R.; Luo, Q.; Jin, J.; Tang, B. Multi-scale rotation-invariant Haar-like feature integrated CNN-based ship detection algorithm of multiple-target environment in SAR imagery. IEEE Transactions on Geoscience and Remote Sensing 2019, 57, 10070–10087. [Google Scholar] [CrossRef]
- Zhang, T.; Zhang, X. High-speed ship detection in SAR images based on a grid convolutional neural network. Remote Sensing 2019, 11, 1206. [Google Scholar] [CrossRef]
- Chen, C.; He, C.; Hu, C.; Pei, H.; Jiao, L. A deep neural network based on an attention mechanism for SAR ship detection in multiscale and complex scenarios. IEEE Access 2019, 7, 104848–104863. [Google Scholar] [CrossRef]
- Zhang, T.; Zhang, X.; Shi, J.; Wei, S. Depthwise separable convolution neural network for high-speed SAR ship detection. Remote Sensing 2019, 11, 2483. [Google Scholar] [CrossRef]
- Wang, Y.; Wang, C.; Zhang, H.; Dong, Y.; Wei, S. A SAR dataset of ship detection for deep learning under complex backgrounds. remote sensing 2019, 11, 765. [Google Scholar] [CrossRef]
- Chang, Y.L.; Anagaw, A.; Chang, L.; Wang, Y.C.; Hsiao, C.Y.; Lee, W.H. Ship detection based on YOLOv2 for SAR imagery. Remote Sensing 2019, 11, 786. [Google Scholar] [CrossRef]
- Jiao, J.; Zhang, Y.; Sun, H.; Yang, X.; Gao, X.; Hong, W.; Fu, K.; Sun, X. A densely connected end-to-end neural network for multiscale and multiscene SAR ship detection. IEEE Access 2018, 6, 20881–20892. [Google Scholar] [CrossRef]
- Li, J.; Qu, C.; Shao, J. Ship detection in SAR images based on an improved faster R-CNN. 2017 SAR in Big Data Era: Models, Methods and Applications (BIGSARDATA). IEEE, 2017, pp. 1–6.
- Wei, S.; Zeng, X.; Qu, Q.; Wang, M.; Su, H.; Shi, J. HRSID: A high-resolution SAR images dataset for ship detection and instance segmentation. Ieee Access 2020, 8, 120234–120254. [Google Scholar] [CrossRef]
- Wackerman, C.C.; Friedman, K.S.; Pichel, W.G.; Clemente-Colón, P.; Li, X. Automatic detection of ships in RADARSAT-1 SAR imagery. Canadian journal of remote sensing 2001, 27, 568–577. [Google Scholar] [CrossRef]
- Friedman, K.; Wackerman, C.; Funk, F.; Rowell, K.; Pichel, W.; Clemente-Colón, P.; Li, X. Validation of an automatic vessel detection algorithm using SAR data and known vessel fleet distributions. IGARSS 2000. IEEE 2000 International Geoscience and Remote Sensing Symposium. Taking the Pulse of the Planet: The Role of Remote Sensing in Managing the Environment. Proceedings (Cat. No. 00CH37120). IEEE, 2000, Vol. 5, pp. 2071–2073.
- Friedman, K.S.; Wackerman, C.; Funk, F.; Schwenzfeier, M.; Pichel, W.G.; Colon-Clemente, P.; Li, X. Analyzing the dependence between RADARSAT-1 vessel detection and vessel heading using CFAR algorithm for use on fishery management. Oceans 2003. Celebrating the Past... Teaming Toward the Future (IEEE Cat. No. 03CH37492). IEEE, 2003, Vol. 5, pp. P2819–P2823.
- Friedman, K.S.; Wackerman, C.; Funk, F.; Pichel, W.G.; Clemente-Colón, P.; Li, X. Validation of a CFAR vessel detection algorithm using known vessel locations. IGARSS 2001. Scanning the Present and Resolving the Future. Proceedings. IEEE 2001 International Geoscience and Remote Sensing Symposium (Cat. No. 01CH37217). IEEE, 2001, Vol. 4, pp. 1804–1806.
- Renga, A.; Graziano, M.D.; Moccia, A. Segmentation of marine SAR images by sublook analysis and application to sea traffic monitoring. IEEE Transactions on Geoscience and Remote Sensing 2018, 57, 1463–1477. [Google Scholar] [CrossRef]
- Biffia, A.; Dodaro, L.; Morabito, F.; Pergolizzi, A. Mare Monstrum. https://www.legambiente.it/wp-content/uploads/Dossier-Mare-Monstrum-2019.pdf, 2020. Accessed: 2022-12-13.
- Biffia, A.; Dodaro, L.; Morabito, F.; Pergolizzi, A. Mare Monstrum. https://www.legambiente.it/wp-content/uploads/2020/06/MareMonstrum2020.pdf, 2019. Accessed: 2022-12-13.
- Furesi, R.; Madau, F.; Pulina, P.; Sai, R.; Pinna, M.; Pais, A. Profitability and sustainability of edible sea urchin fishery in Sardinia (Italy). Journal of coastal conservation 2016, 20, 299–306. [Google Scholar] [CrossRef]
- Spera, G.; Monaco, P. RAPPORTO ANNUALE SUL CONTROLLO DELLA PESCA IN ITALIA. https://www.guardiacostiera.gov.it/stampa/Documents/RAPPORTO%20ANNUALE%202020%20-%20DOWNLOAD.pdf, 2019. Accessed: 2022-12-13.
- Graziano, M.D.; Prete, R.D.; Grasso, M. A NEW DATASET OF MULTI-MISSION/MULTI-FREQUENCY SAR DATA FOR MARITIME MONITORING: FIRST RESULTS AND CRITICAL ANALYSIS. 2022.
- Miler, R.K. The Exactearth Satelite-AIS Benefits for the Maritime Transport. Prace Naukowe Wyższej Szkoły Bankowej w Gdańsku 2013, 28, 71–86. [Google Scholar]
- Dellepiane, S.; De Laurentiis, R.; Giordano, F. Coastline extraction from SAR images and a method for the evaluation of the coastline precision. Pattern Recognition Letters 2004, 25, 1461–1470, Pattern Recognition for Remote Sensing (PRRS 2002). [Google Scholar] [CrossRef]
- Open Street Map. "Data Derived from OpenStreetMap for Download", Open Street Map [Online]. Available:. https://osmdata.openstreetmap.de/data/land-polygons.html, 2022. Accessed: 2022-12-07.
- Benachenhou, K.; Taleb-Ahmed, A.; Hamadouche, M. Performances evaluation of GNSS ALTBOC acquisition with CFAR detection in Rayleigh fading channel. 2013 Saudi International Electronics, Communications and Photonics Conference. IEEE, 2013, pp. 1–7.
- Guida, M.; Longo, M.; Lops, M. Biparametric CFAR procedures for lognormal clutter. IEEE Transactions on Aerospace and Electronic Systems 1993, 29, 798–809. [Google Scholar] [CrossRef]
- Anastassopoulos, V.; Lampropoulos, G.A. Optimal CFAR detection in Weibull clutter. IEEE Transactions on Aerospace and Electronic systems 1995, 31, 52–64. [Google Scholar] [CrossRef]
- Erfanian, S.; Vakili, V.T. Introducing excision switching-CFAR in K distributed sea clutter. Signal Processing 2009, 89, 1023–1031. [Google Scholar] [CrossRef]
- Leng, X.; Ji, K.; Yang, K.; Zou, H. A Bilateral CFAR Algorithm for Ship Detection in SAR Images. IEEE Geoscience and Remote Sensing Letters 2015, 12, 1536–1540. [Google Scholar] [CrossRef]
Figure 1.
Pictorial view of a spaceborne SAR gathering an image over a gulf and AIS network.
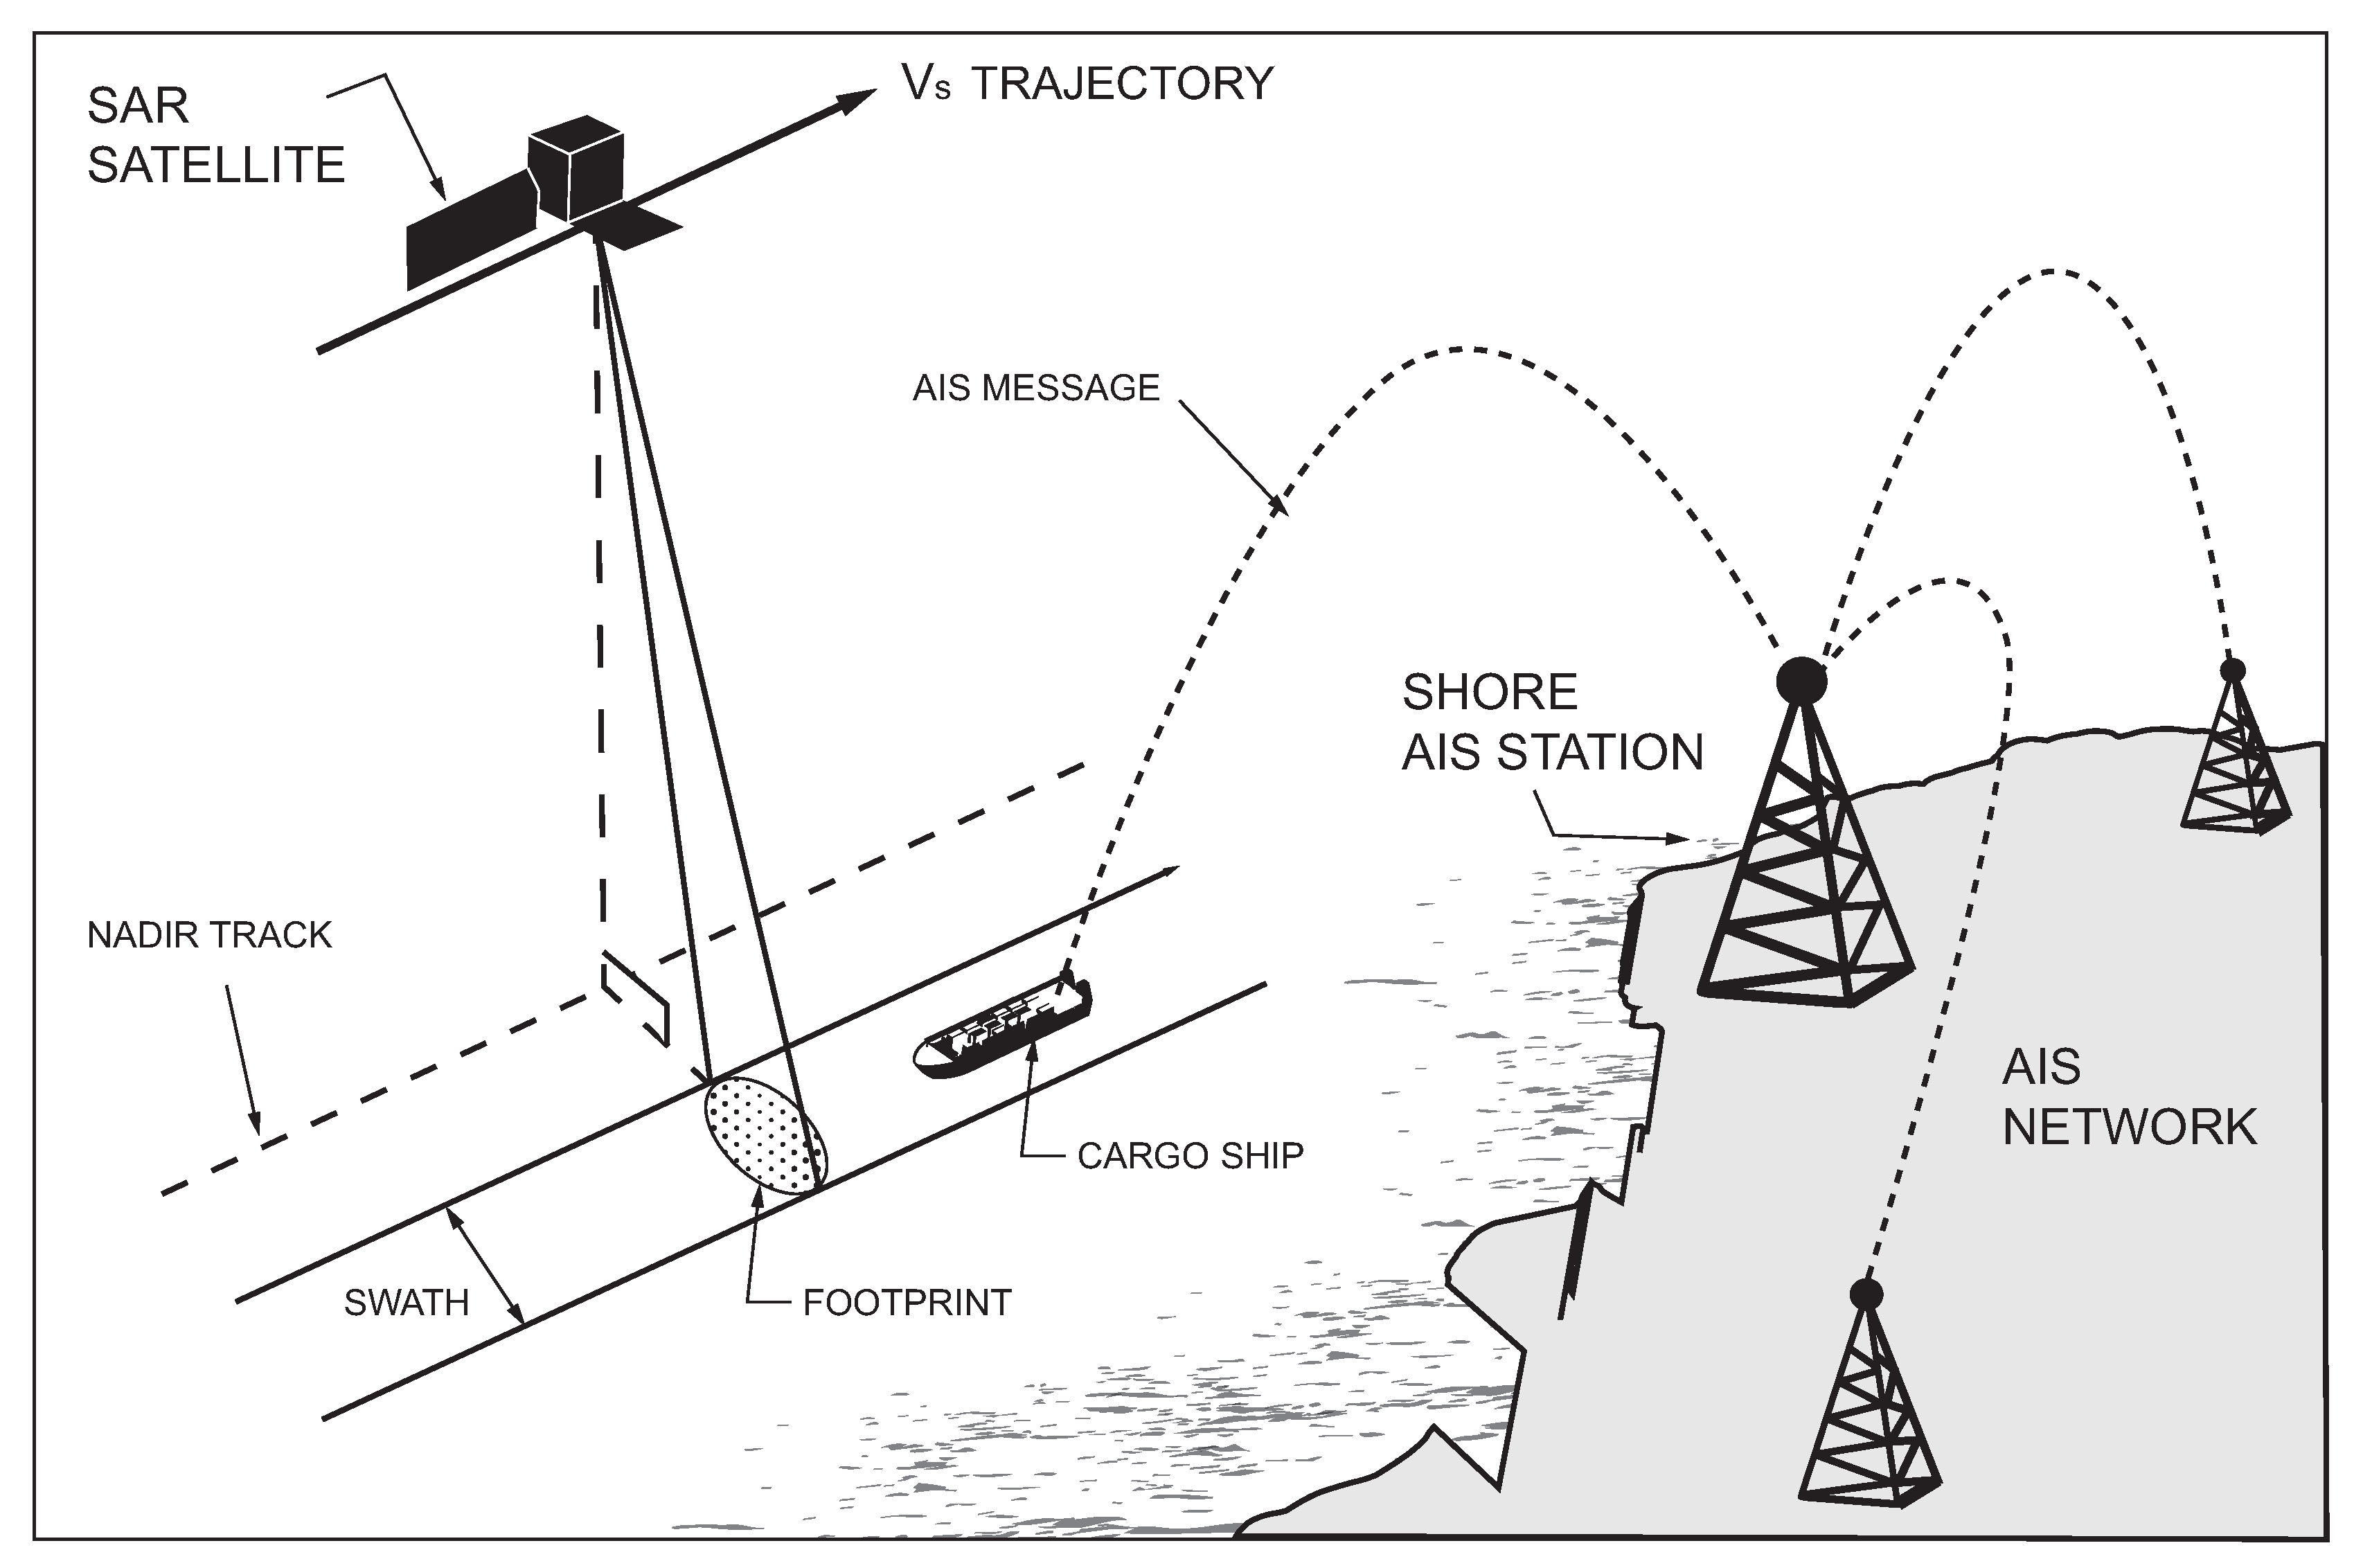
Figure 2.
Selected scenarios of interest for the realisation of the MM/MF dataset: a) Adriatic sea, b) Sardinia, and c) Egadi Islands.
Figure 2.
Selected scenarios of interest for the realisation of the MM/MF dataset: a) Adriatic sea, b) Sardinia, and c) Egadi Islands.
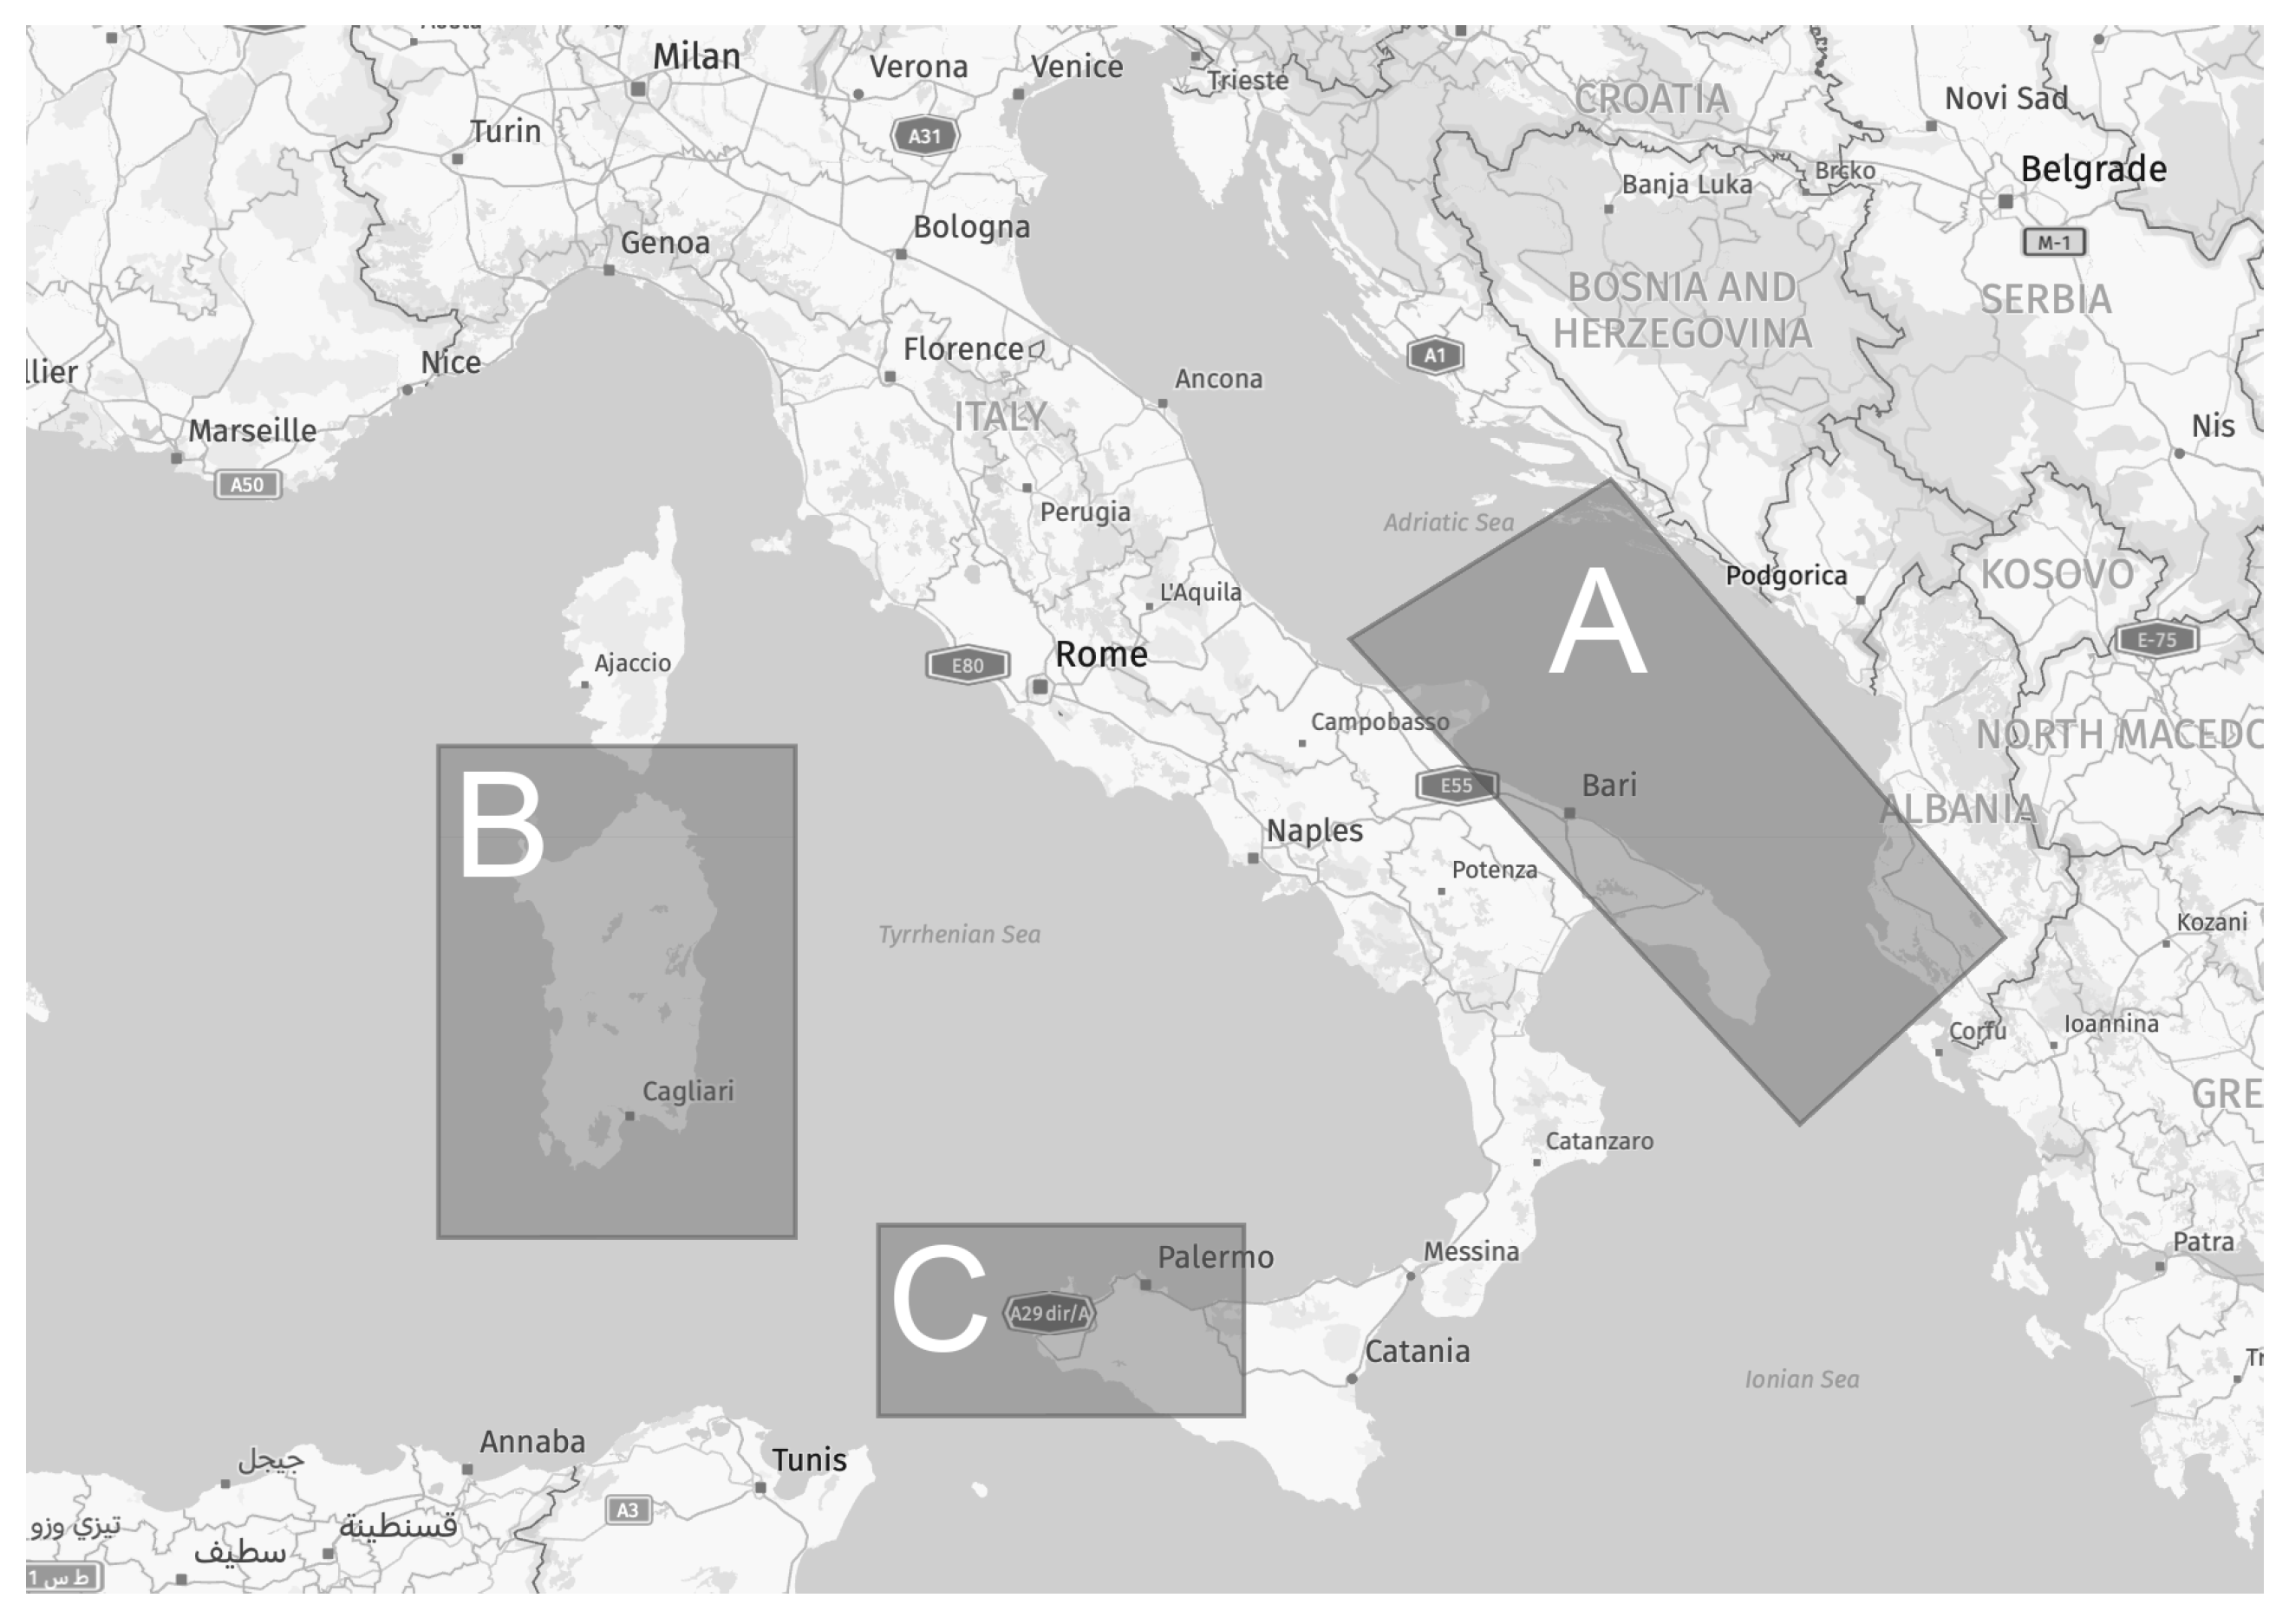
Figure 3.
Sentinel-1 (Prod ID: S1A_IW_SLC__1SDV_20200706T171255_20200706T171322_033337_ 03DCC6_FC45) and COSMO-SkyMed (Prod ID: 1377380) products pairing map on the Egadi Islands scenario.
Figure 3.
Sentinel-1 (Prod ID: S1A_IW_SLC__1SDV_20200706T171255_20200706T171322_033337_ 03DCC6_FC45) and COSMO-SkyMed (Prod ID: 1377380) products pairing map on the Egadi Islands scenario.
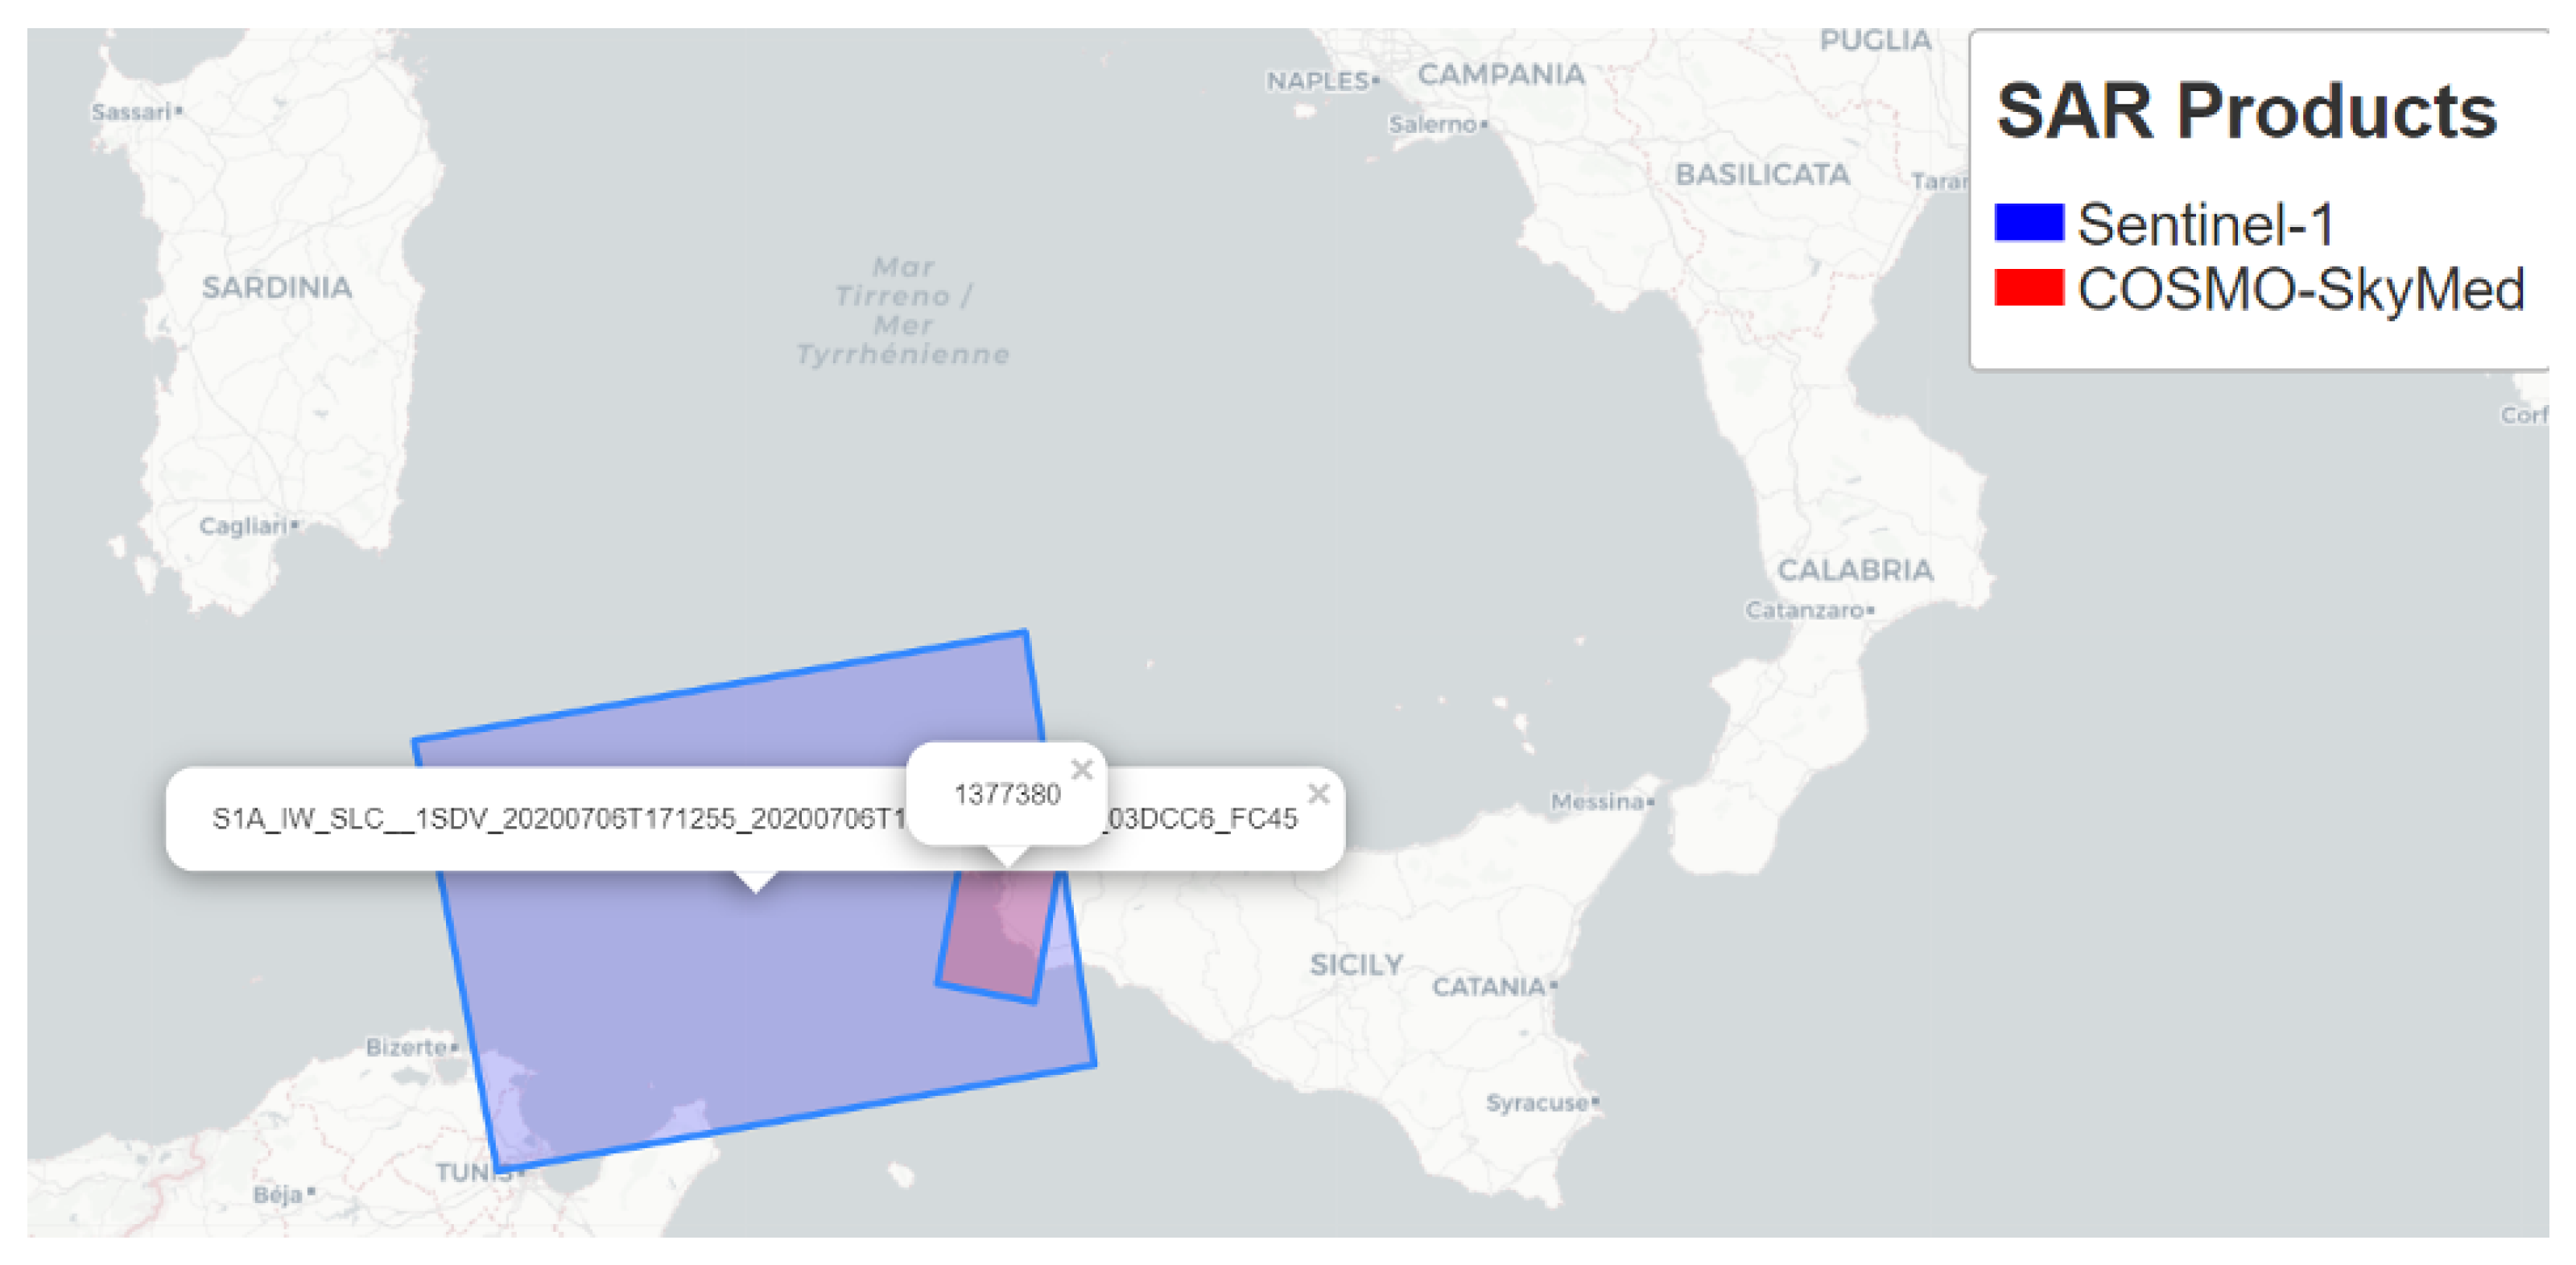
Figure 4.
Relational diagram reporting the inputs passed to the discriminator algorithm based on the analysis of the sub-looks.
Figure 4.
Relational diagram reporting the inputs passed to the discriminator algorithm based on the analysis of the sub-looks.
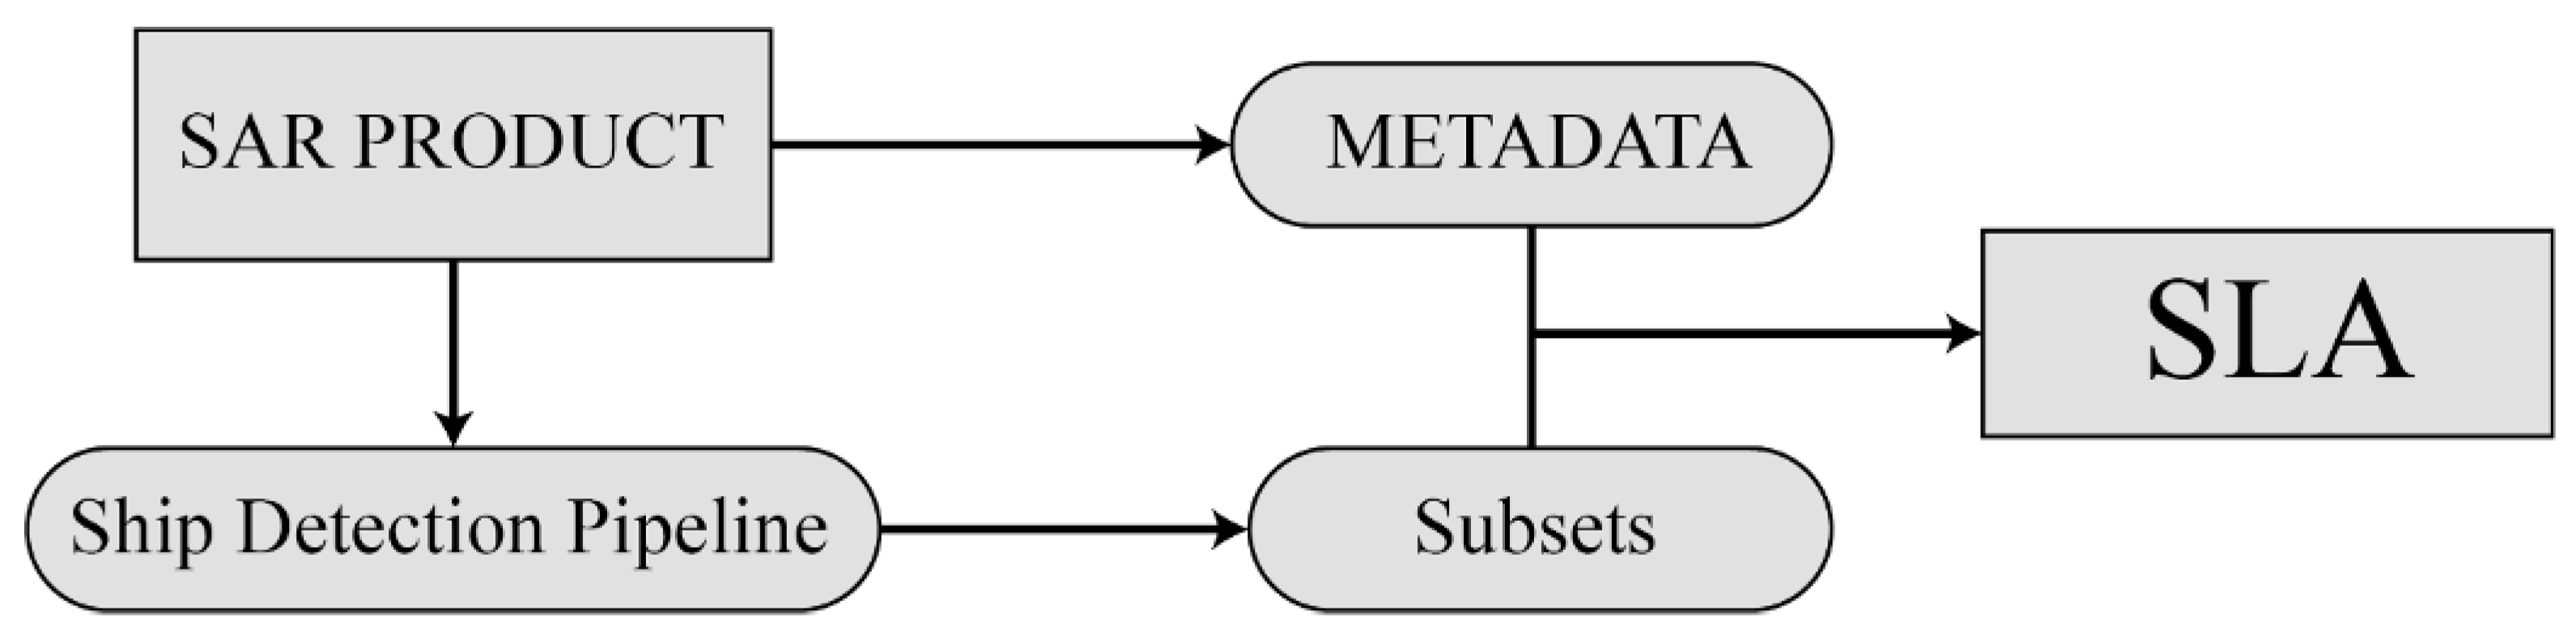
Figure 5.
Visual representation of IE generation from three sub-looks (left) and its calculation for a Sentinel-1 product (right) in which a target and its ambiguity are highlighted.
Figure 5.
Visual representation of IE generation from three sub-looks (left) and its calculation for a Sentinel-1 product (right) in which a target and its ambiguity are highlighted.
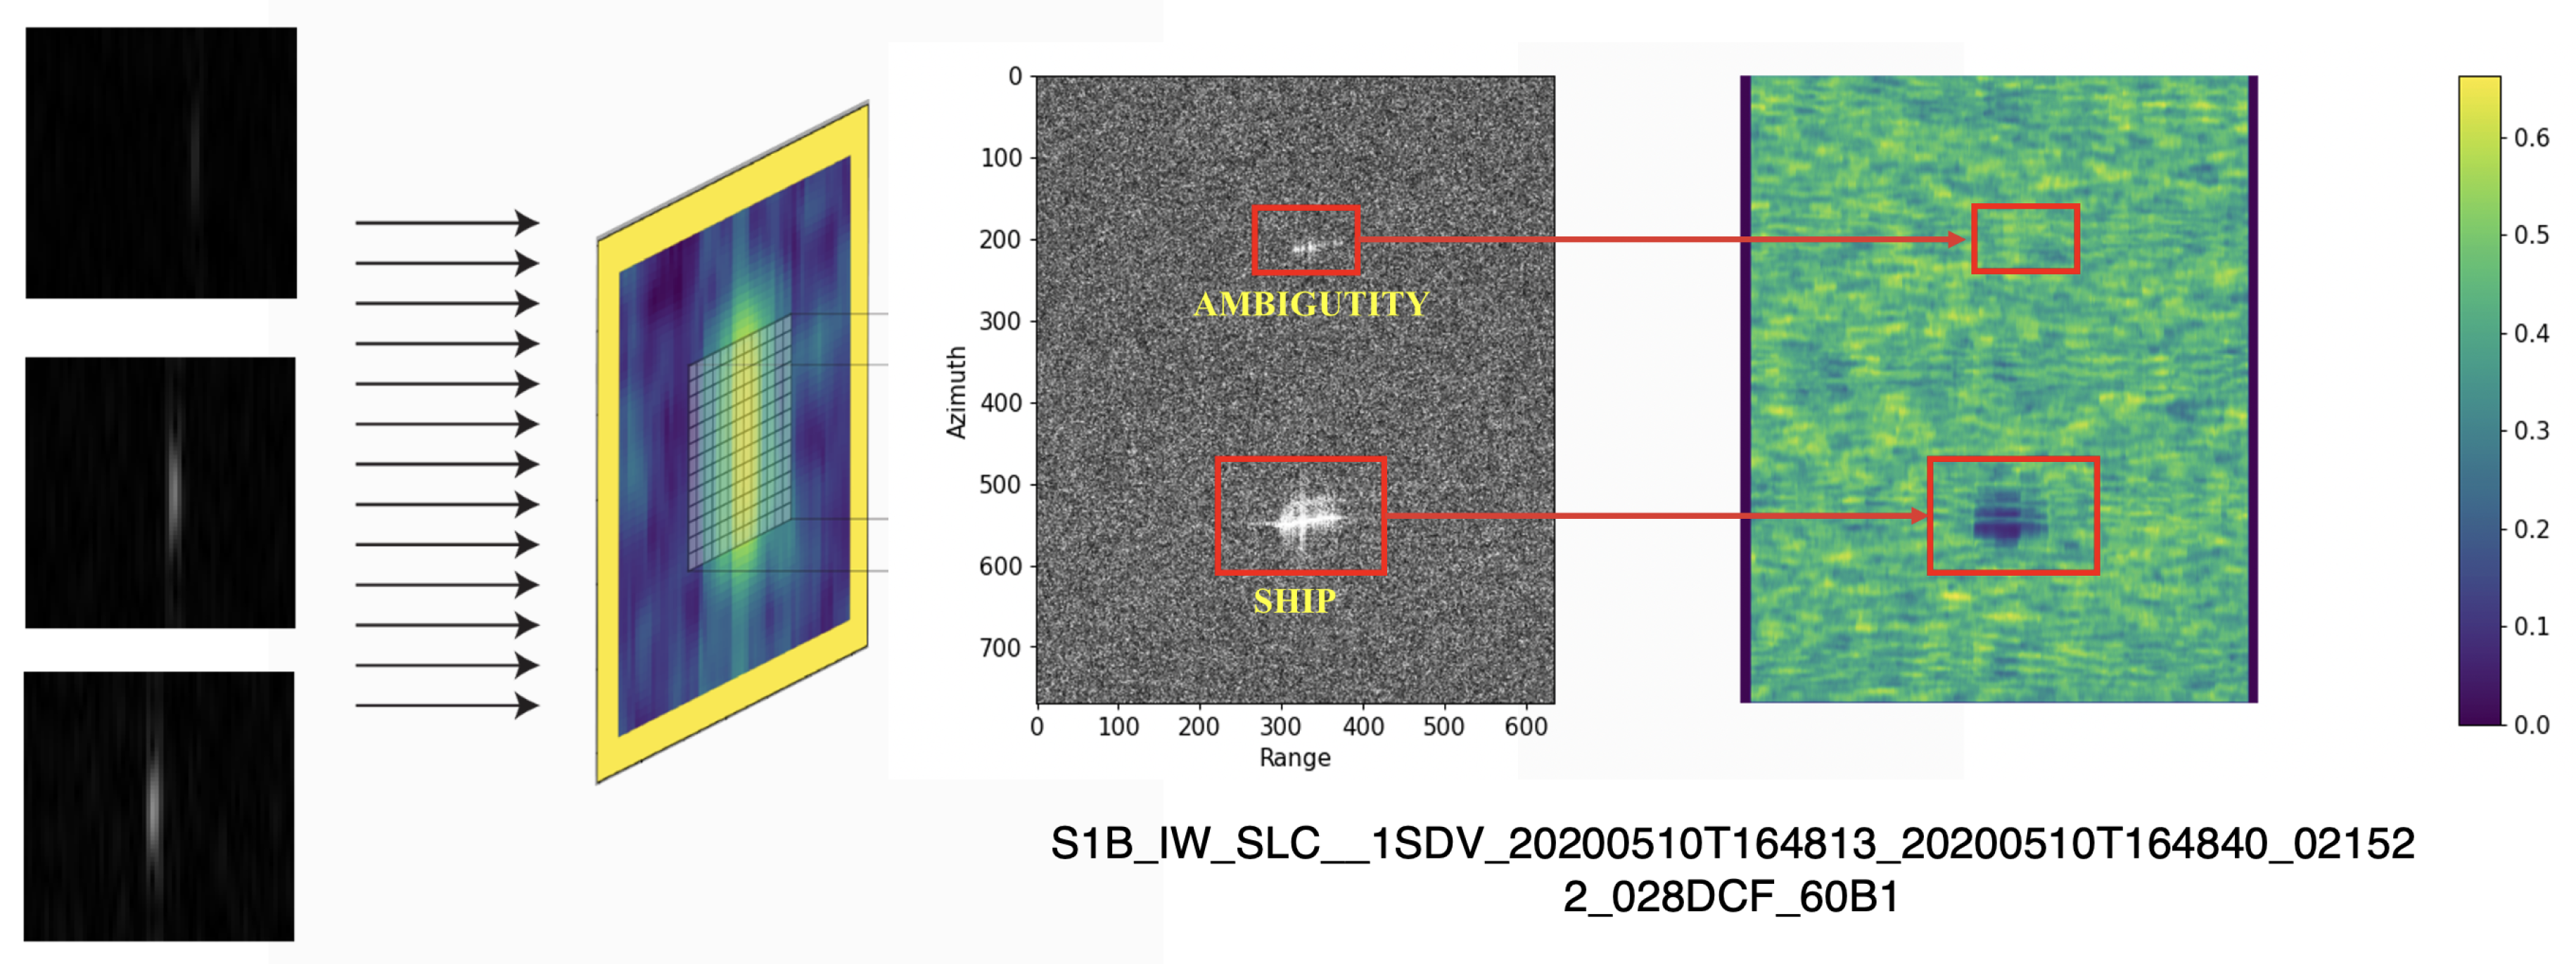
Figure 6.
IE calculated for ship target (left) and ambiguity (right) [Product ID: ]
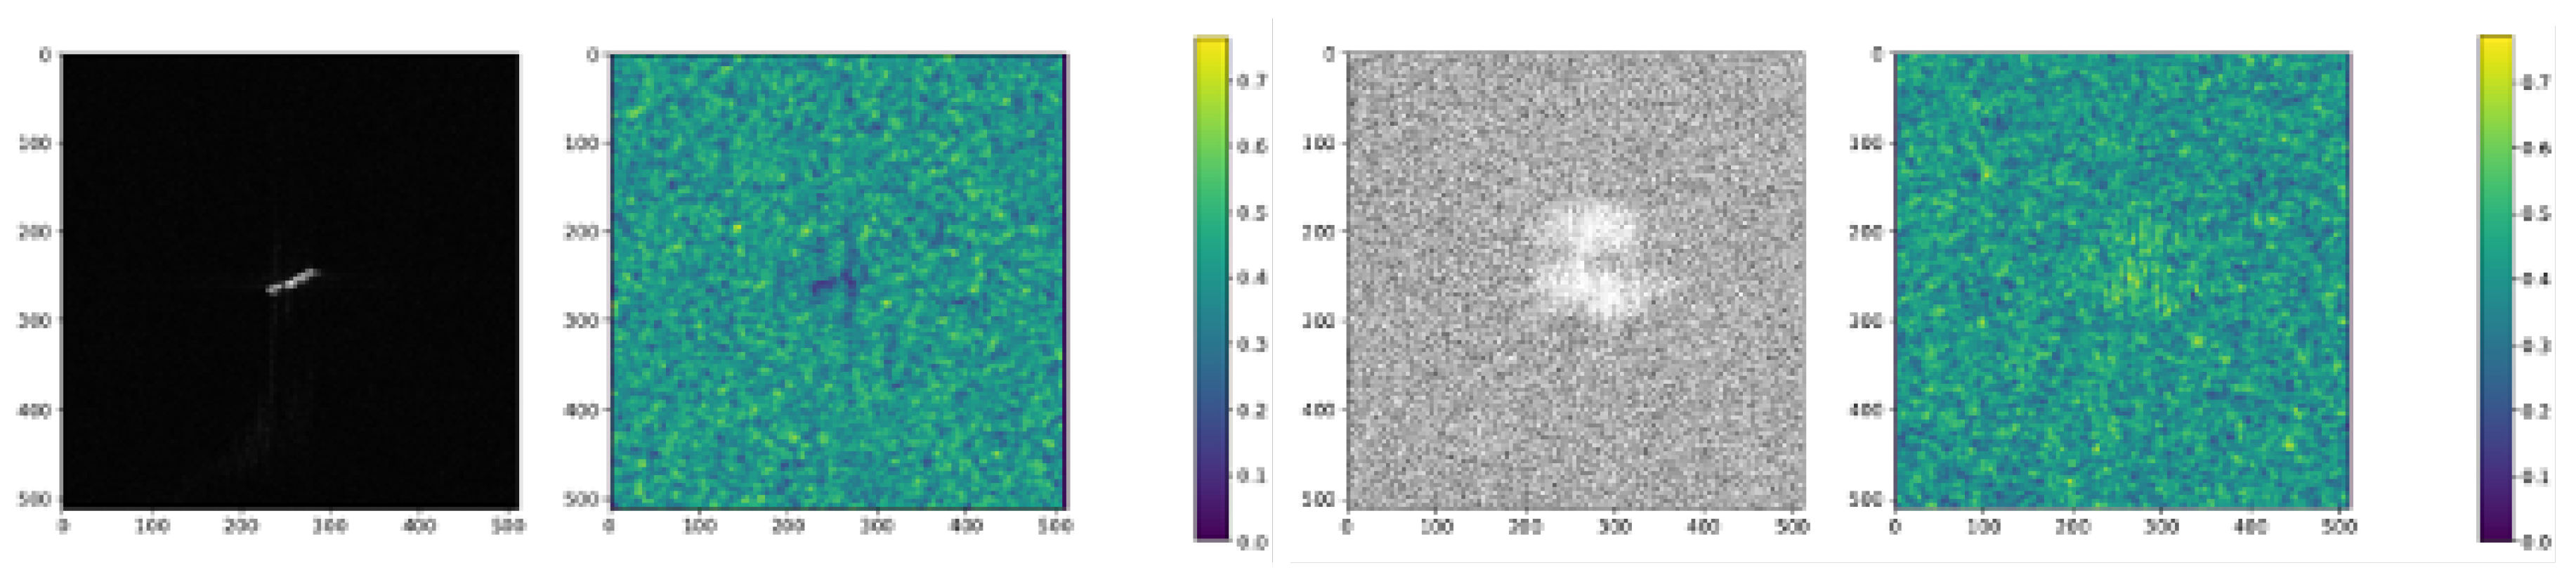
Figure 7.
IE calculated for ship target (left) and ambiguity (right) [Product ID: ]
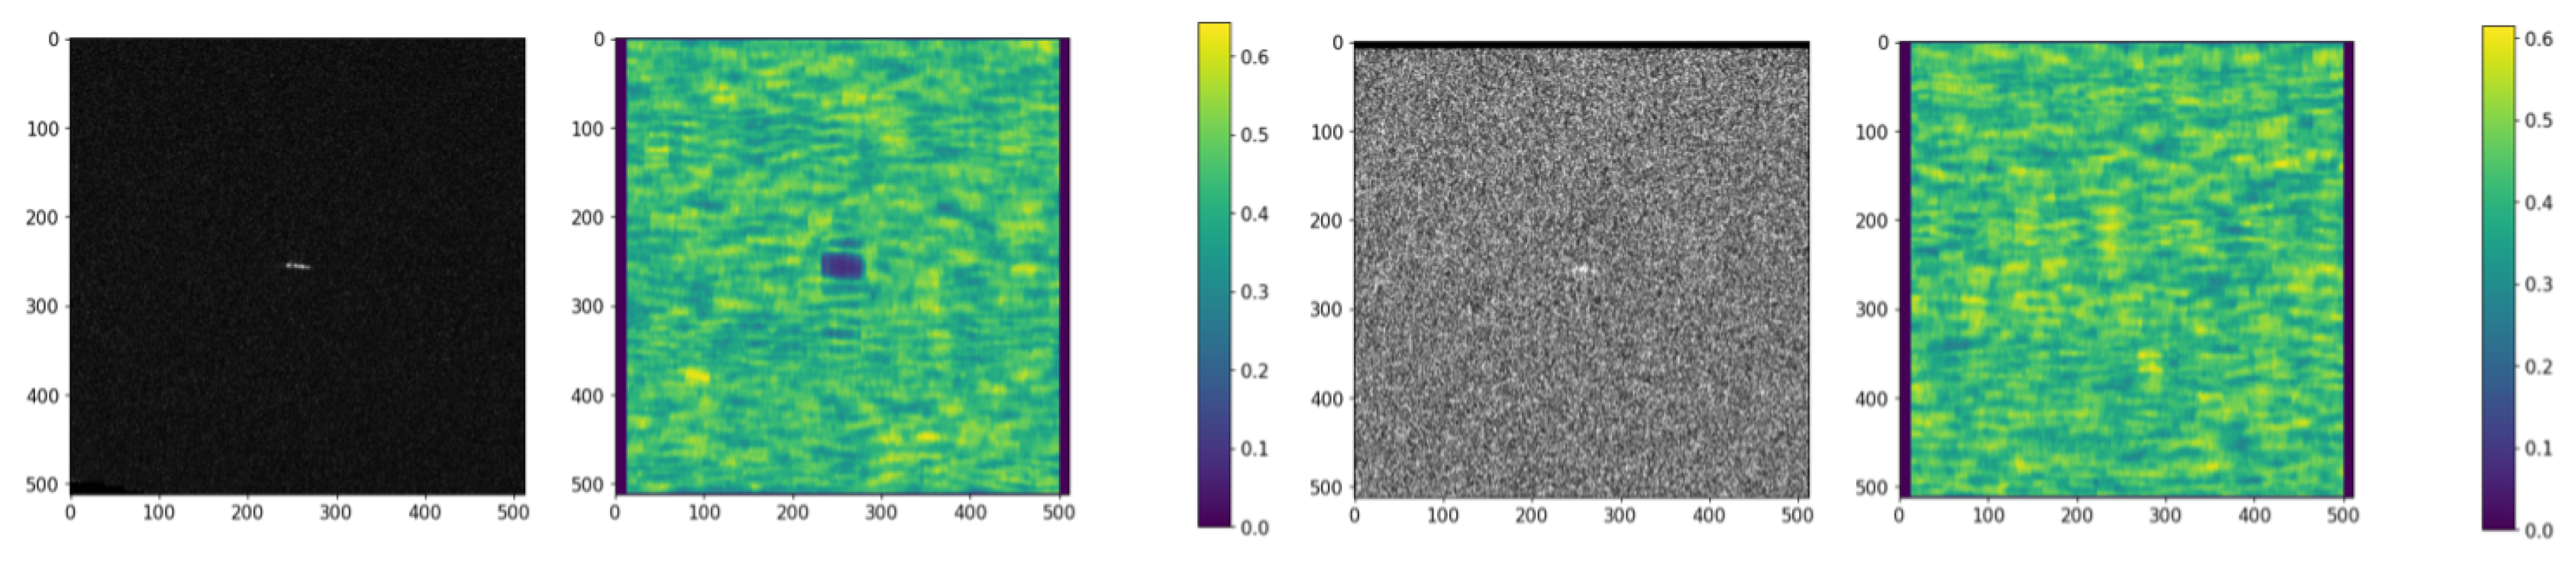
Figure 8.
IE calculated for ship target (left) and ambiguity (right) [Product ID: ]
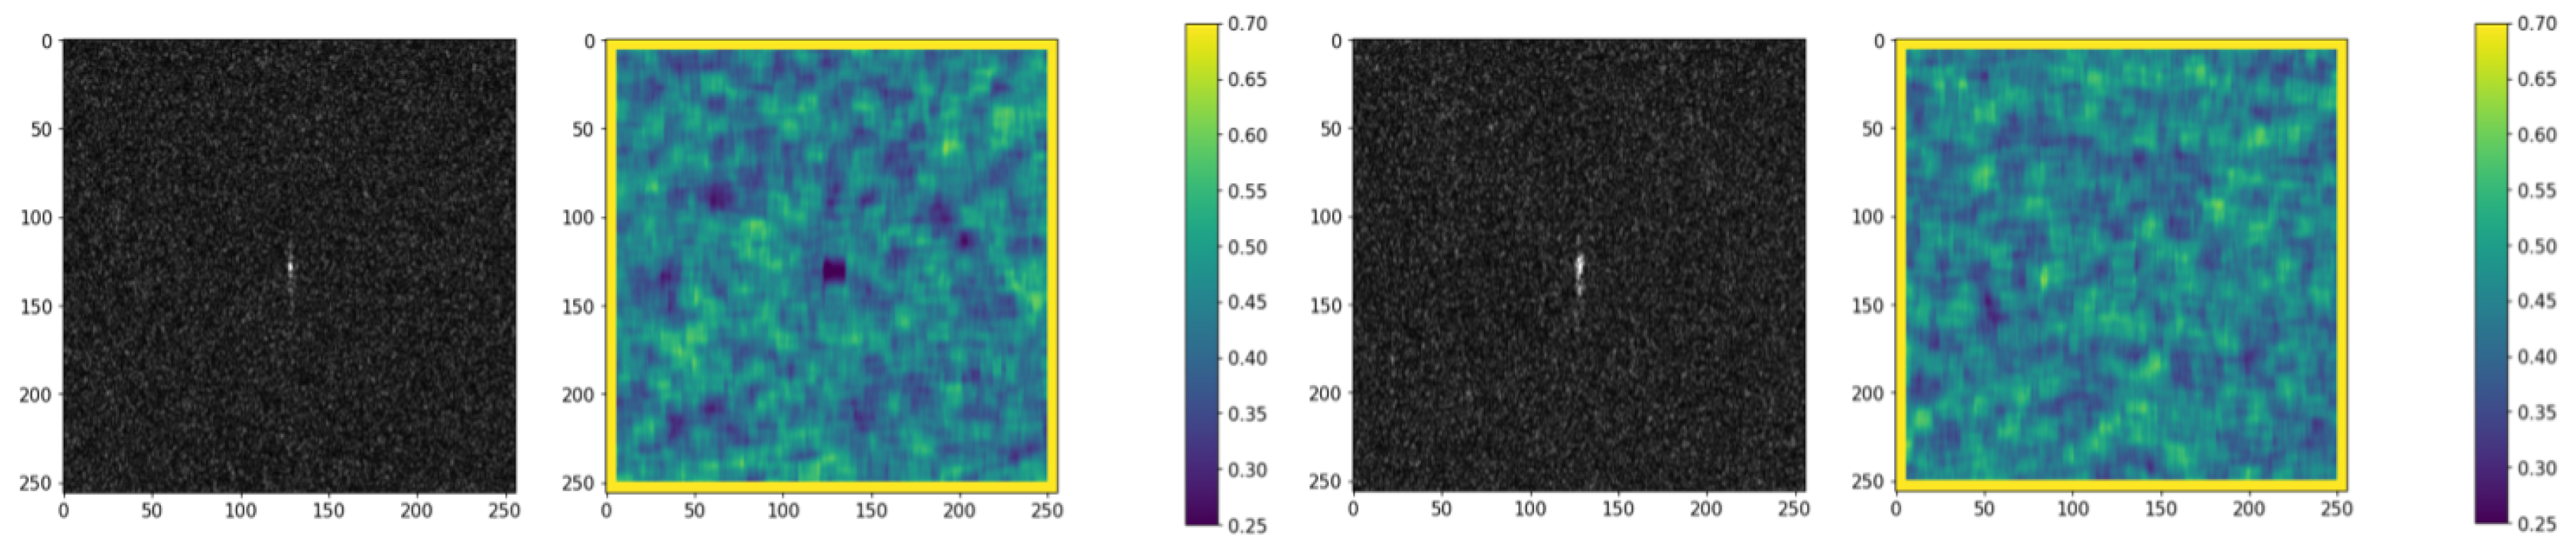
Figure 9.
Test case of the CFAR+SLA algorithm over the port of Taranto. Highlighted detail: a probable radio signal transmitted from a ship and captured by X-band. [Product ID: processed by University of Naples Federico II under the COAST license of the Italian Space Agency (ASI); Original COSMO-SkyMed Product - ©ASI - (2020).
Figure 10.
Evaluation of Cosmo-SkyMed (a) [89 targets labelled] and Sentinel-1 (b) [290 targets labelled] products in the Egadi Islands region.
Figure 10.
Evaluation of Cosmo-SkyMed (a) [89 targets labelled] and Sentinel-1 (b) [290 targets labelled] products in the Egadi Islands region.
Figure 11.
Evaluation of COSMO-SkyMed (a) [121 targets labelled], SAOCOM (b) [36 targets labelled] and Sentinel-1 (c) [333 targets labelled] products in the Sardinia region.
Figure 11.
Evaluation of COSMO-SkyMed (a) [121 targets labelled], SAOCOM (b) [36 targets labelled] and Sentinel-1 (c) [333 targets labelled] products in the Sardinia region.
Figure 12.
Evaluation of Cosmo-SkyMed (a) [108 targets labelled], SAOCOM (b) [113 targets labelled] and Sentinel-1 (c) [331 targets labelled] products in the Adriatic region.
Figure 12.
Evaluation of Cosmo-SkyMed (a) [108 targets labelled], SAOCOM (b) [113 targets labelled] and Sentinel-1 (c) [331 targets labelled] products in the Adriatic region.
Figure 13.
Comparative analysis of improved performance in terms of AUC.
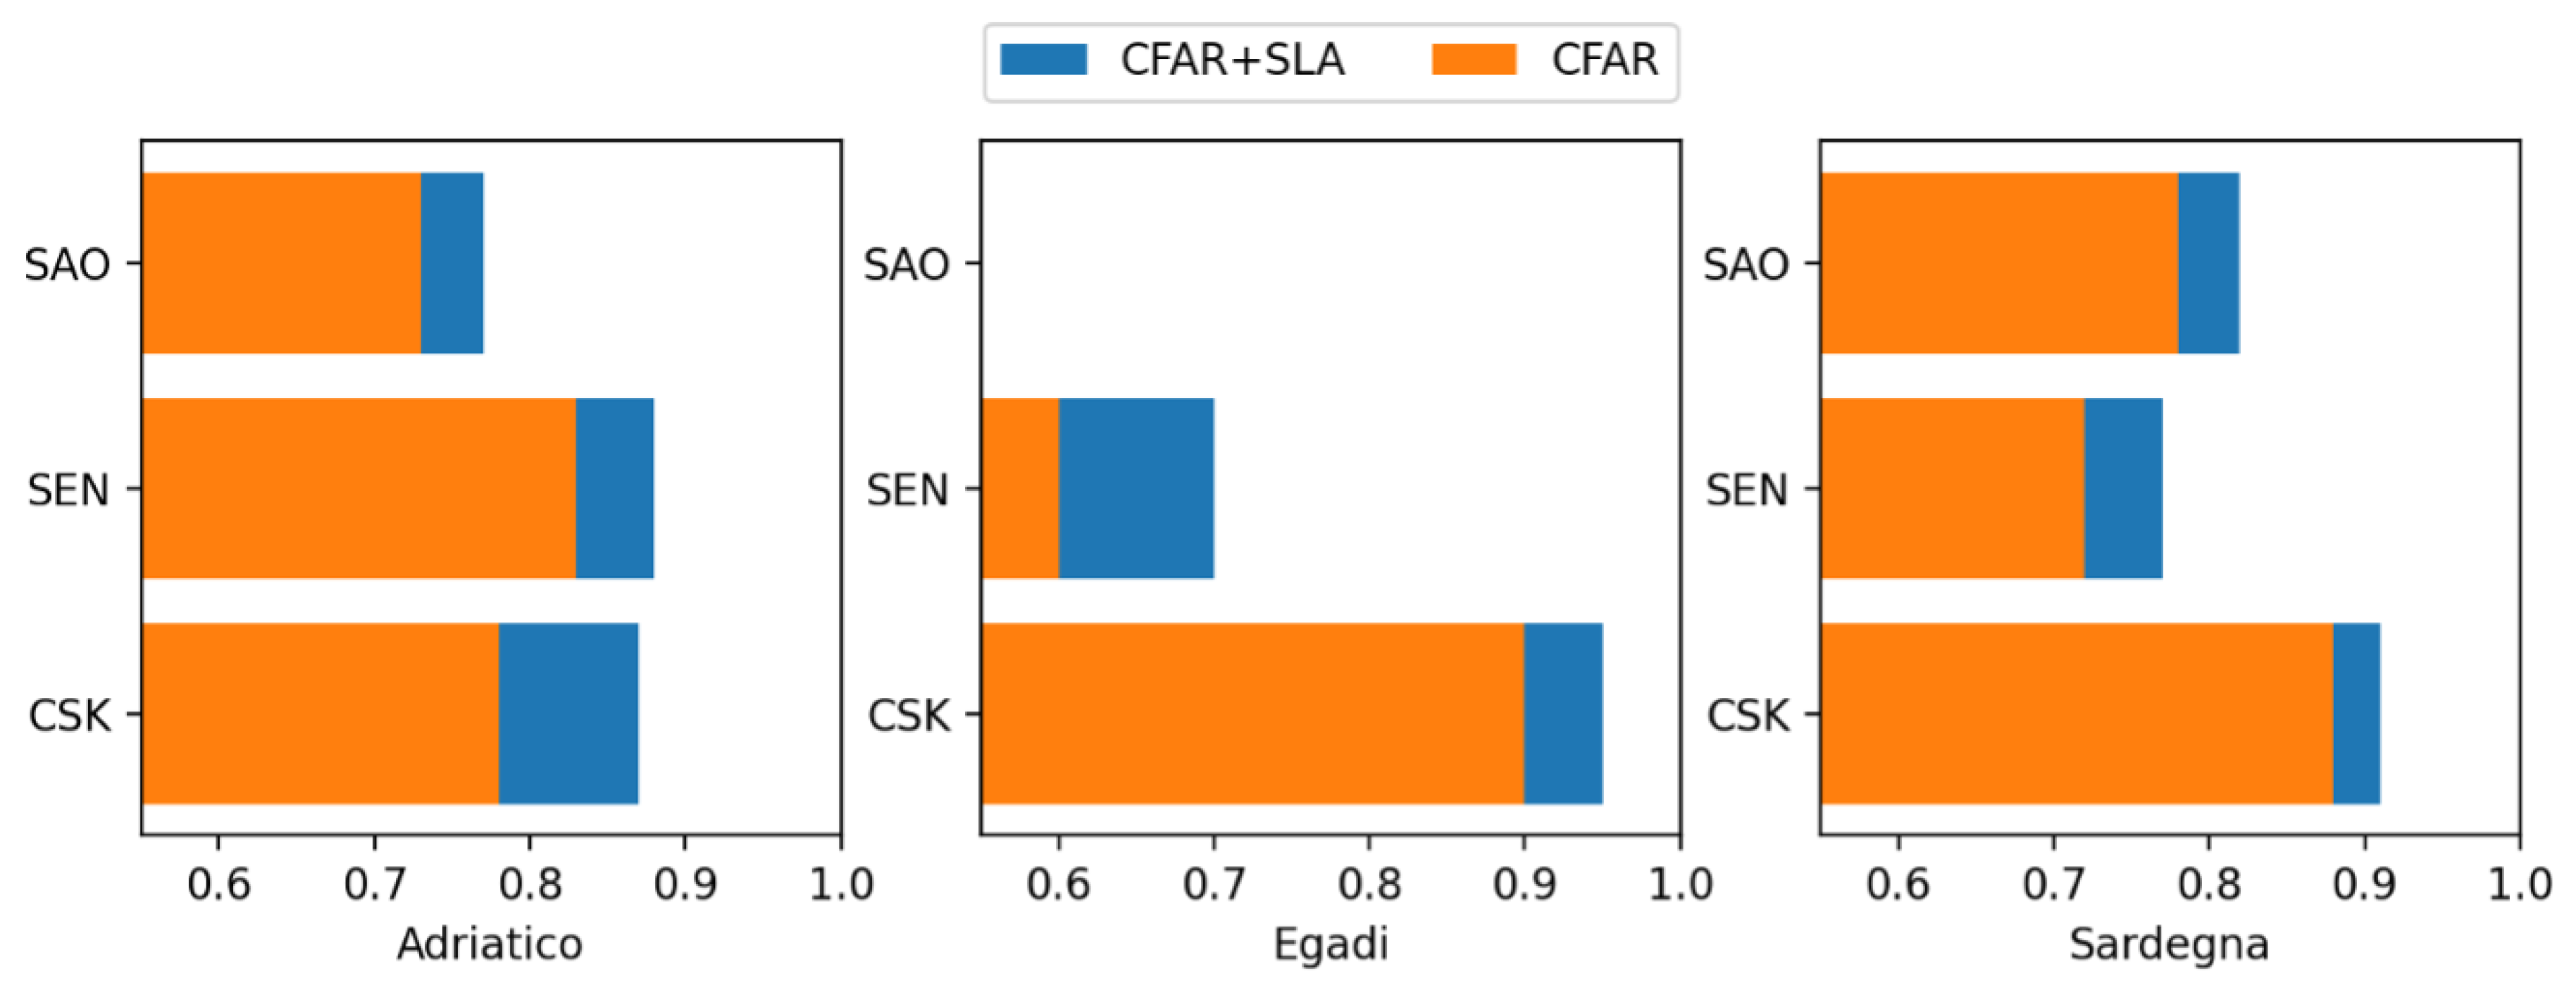
Table 1.
MM/MF products specifications in terms of acquisition mode, spatial resolution, pixel spacing, and polarization.
Table 1.
MM/MF products specifications in terms of acquisition mode, spatial resolution, pixel spacing, and polarization.
| Mission | Acquisition Mode | Resolution (range x azi) (m) | Pixel spacing (range x azi) (m) | Polarization | Swath (km) |
|---|---|---|---|---|---|
| COSMO-SkyMed | StripMap | 3 x 3 | 2.35 × 4.14 | HH | 40 |
| Sentinel-1 | IW (Interferometric Wide Swath) | 20 x 5 | 2.3 x 13.9 | VH | 250 |
| SAOCOM | StripMap | 10 x 10 | 10 x 10 | VH | 65 |
Table 2.
Number of couplings for each scenario of interest of the MM/MF dataset.
| Region / Pairing | Adriatic Sea | Egadi Islands | Sardinia |
|---|---|---|---|
| COSMO-SkyMed & Sentinel-1 | 15 | 32 | 55 |
| COSMO-SkyMed & SAOCOM | 5 | NA | 23 |
| Sentinel-1 & SAOCOM | 12 | NA | 10 |
Table 3.
Pre-processing operators used to each SAR product
| Operator / Product | COSMO-SkyMed | SAOCOM | Sentinel-1 |
|---|---|---|---|
| Multilook | ✓ | ||
| Thermal noise removal | ✓ | ||
| TOPSAR Deburst | ✓ | ✓ | |
| Land-Masking | ✓ | ✓ | ✓ |
| Calibration | ✓ |
Table 5.
Configuration of the paramaters of the CFAR algorithm.
| BW | GW | TW | PFA ( ) | Min Target Size | Max Target Size |
|---|---|---|---|---|---|
| 800 m | 400 m | 30 m | 4.5 | 30 m | 800 m |
Table 6.
Accuracy of the CFAR+SLA algorithm and performance in terms of probability of detection and false alarm pre and post application of the discrimination pipeline
Table 6.
Accuracy of the CFAR+SLA algorithm and performance in terms of probability of detection and false alarm pre and post application of the discrimination pipeline
| Accuracy | CFAR | CFAR+SLA | |||||
|---|---|---|---|---|---|---|---|
| Vessels | 92.3% | ||||||
| Ambiguities | 100% | ||||||
| Global | 95.6% | 100% | 47.8% | 100% | 7.6% | ||
Disclaimer/Publisher’s Note: The statements, opinions and data contained in all publications are solely those of the individual author(s) and contributor(s) and not of MDPI and/or the editor(s). MDPI and/or the editor(s) disclaim responsibility for any injury to people or property resulting from any ideas, methods, instructions or products referred to in the content. |
© 2023 by the authors. Licensee MDPI, Basel, Switzerland. This article is an open access article distributed under the terms and conditions of the Creative Commons Attribution (CC BY) license (http://creativecommons.org/licenses/by/4.0/).
Copyright: This open access article is published under a Creative Commons CC BY 4.0 license, which permit the free download, distribution, and reuse, provided that the author and preprint are cited in any reuse.
Submitted:
07 February 2023
Posted:
08 February 2023
You are already at the latest version
Alerts
A peer-reviewed article of this preprint also exists.
This version is not peer-reviewed
Submitted:
07 February 2023
Posted:
08 February 2023
You are already at the latest version
Alerts
Abstract
In the framework of maritime surveillance, vessel detection techniques based on spaceborne Synthetic Aperture Radar (SAR) images have promoted extensive applications for the effective understanding of unlawful activities at sea. The paper deal with this topic presenting a novel approach exploiting a cascade application of a pre-screening, and discrimination phase. The latter leverage the SAR spectrum by means of sub-looks analysis. For the first time, the method has been validated with experiments on multi-frequency (C-, X-, and L-band) SAR images. For a future syngergic exploitation of more SAR missions, the developed dataset, composed of Sentinel-1, SAOCOM and COSMO-SkyMed images, is comprehensive of multiple images gathered over the same area with short time lag (below 15 minutes). Finally, the diversified processing chains and the results for each mission product and scenarios are discussed. Being the first dataset of SLC (Single Look Complex) SAR multi-frequency data, the present work intends to encourage additional research in this promising field of research.
Keywords:
Subject: Engineering - Marine Engineering
1. Introduction
The definition of Marine Domain Awareness (MDA) conceives the effective understanding of everything related to the maritime environment that may have an impact on the security, safety, economics, or environment [1,2]. In this framework, geolocating ships at sea, i.e. calculating their coordinates in a specific reference frame, is an issue that holds a critical role in improving MDA [3]. Such a problem is referred in the literature as "ship detection" and finds particular application both theoretically and practically in many coast guard tasks, from law enforcement to maritime safety, and from search and rescue to vessel traffic management services [4,5,6,7]. Notably, the detection of vessels can be attained both with airborne [8], spaceborne [9] and in-situ instrumentation [10].
Concerning this latter, the Automatic Identification System (AIS), a VHF (Very High Frequency) transceiver built originally for collision avoidance, is currently the major utilise for maritime monitoring by Vessel Traffic Services (VTS) [11]. The broadcasted messages contain useful information about vessel identity, position, speed, course, destination and other data that is critical for maritime control and navigational safeness [12]. These information are delivered both ship-to-ship and ship-to-shore AIS stations (Figure 1).
The initial worries regarding the efficacy of an AIS-based monitoring system can emerge when examining its coverage at sea, which is up to 20 nautical miles without repeaters. However, the major issue with the AIS lies in its "cooperative" tracking technology. The transmitter can be purposefully set off during unlawful activities. In such a circumstance, the ship becomes a "dark vessel", i.e., a vessel that operates without an AIS transponder or with it turned off [3]. Still, the AIS legislation retain its carrying obligation only for certain classes of vessels: as stated in the SOLAS regulation [13], all passenger ships (regardless of size), international voyaging ships of 300 gross tonnages (GT) or more, and 500 GT and greater cargo ships not embarked on international journeys are obliged by the International Maritime Organization (IMO) to be equipped with AIS [13]. Finally, situations of corrupted of incorrect AIS messages are prone to occur [14]. Therefore, while definitely contributing in vessel monitoring, the AIS is only one side of a valuable MDA solution. To be actually helpful, the AIS messages must be used in cooperation with other sensors, specifically non-cooperative and with extensive coverage [15]. Mainly for these reasons, satellite technologies are currently integrated into marine surveillance services and procedures because they provide cost-effective remote monitoring, worldwide scope, regular updates, and a large volume of data gathered [12,16,17]. Even if optical imagers started gaining attention [16], spaceborne Synthetic Aperture Radars (SARs) remain the most preferred choice because offering unique characteristics that make them particularly tailored for supporting AIS-based monitoring systems. Being active sensors do not face the disadvantage of operating only during the daytime. It is worth noting that most of the illegal activities take place at night. Secondly, the transmitted electromagnetic wave in the typical range of utilization (1-10Ghz) is not significantly affected by cloud cover or precipitations, thus making the imaging system able to penetrate clouds and detect vessels even when covered nighttime [18]. So, there is a wide corpus of literature dealing with ship detection in SAR images. The detection techniques in SAR imagery are influenced by several different key parameters but the research work on SAR ship detection can be divided into categories based on the physical property exploited. The backscatter-based methods [19,20] utilize the RCS (Radar Cross Section) [18] of the vessels, usually higher than the surroundings. They are fast and easy from a design point of view but with low performance since typically affected by ambiguities [21,22,23,24]. Polarization-based [24,25,26,27,28,29] approaches to leverage the polarimetric scattering mechanism to separate ships from clutter. This approach is generally more robust but usually time-consuming and computationally intensive. Besides, for the polarimetric scattering decomposition [30] a quad-pol SAR imagery is required. The geometry-based methods [31,32] search for specific geometric features such as length, width, aspect ratio, perimeter, area, or contour. They demand an adequate template library and high-resolution SAR imagery. Feature-based methods use local feature descriptors e.g., HOG (Histograms of Oriented Gradients) [33], SIFT (Scale Invariant Feature Transform) [34], Haar-like features [35] and so on. The methods show maturity in feature design but they are time-consuming and weak in migration. Very recently, thanks to the large availability of earth observation data, deep-learning methods [36,37,38,39,40,41,42] are insurged also in the ship detection community. These techniques learn not hand-engineered abstract features from large annotated data for extrapolating specific patterns during inference time. Great performance have been demonstrated even near coasts and reefs without the need for land separation [43]. The disadvantage of these methods stands in the supervised learning approach that demands large labeled datasets.
For achieving effective maritime surveillance, it is essential not only the utilization a non-cooperative approach but also the synergic exploitation of multi-frequency/multi-mission (MF/MM) data for taking advantage of higher revisit times. This aim is approached by the present work proposing a custom algorithm for ship detection adapted to three different SAR missions, i.e., Sentinel-1, SAOCOM, and COSMO-SkyMed. The algorithm embodies the fast and efficient CFAR (Constant False Alarm Rate) [44,45,46,47] with a SLA (Sub-look Analysis) [22,23,24,48] discrimination technique applied in cascade. In the framework of the COastal Area monitoring with SAR data and multimission/multifrequency Techniques (COAST) project, funded by Italian Space Agency (ASI), a novel dataset has been developed utilizing MF/MM imagery. The comprehensive dataset enables the testing of the effectiveness of several missions under comparable circumstances. To the knowledge of the authors, this constitutes the first SLC (Single Look Complex) MM/MF SAR dataset and a major novelty of this work. Another innovation lies in its specific attention to in-shore areas which are typically characterized by phenomena affecting the detection performance. The latter can include the fast dynamics of vessels’ motion near ports, ambiguities generated by land-strong scatterers, or saturation/anomalous side-lobe pattern effects.
The manuscript is structured as follows: Section 2 details the development of the MM/MF SAR dataset and its ancillary information. Section 3 details the methodology adopted in this work from the pre-processing of the data to the implementation of a novel detector. Then, Section 4 discusses the results achieved by means of a large-scale validation approach on the proposed dataset. Finally, Section 5 draws the conclusion of the present study also pointing out new future directions.
2. Multi-mission/Multi-frequency SAR Dataset
As stated above, for the construction of the MM/MF dataset three missions have been considered, i.e., the Italian COSMO-SkyMed (X-Band), the Argentinian SAOCOM (L-Band), and the European Sentinel-1 (C-Band). The characteristics of the selected products are briefly described in the Table 1 which demonstrates how the images differ not simply in the working frequency bands. Concerning Sentinel-1 images, all the products were gathered in the vertical polarization (VV + VH) of the IW mode. COSMO-SkyMed and SAOCOM were instead acquired in stripmap HH and VH polarization, respectively.
2.1. Selected Scenarios
Data collection starts from the selection and identification of region of interest. For the present study, three different scenarios have been selected purposely for maritime monitoring, i.e., a) Adriatic sea, b) Sardinia, and c) Egadi Islands (Figure 2).
It must be emphasized once more that the goal is to maximize the benefits of MF/MM SAR images for maritime surveillance. As a result, a short time gap between successive acquisitions over the same region is required. A tool that inspects the effective spatial and temporal couplings of the MF/MM products has been developed specifically for this purpose. The tool provides highlights of the various acquisition availability reporting useful insights about the three SAR missions under consideration. Finally, the value of the project’s supplementary AIS data is explored.
The Egadi Islands Marine Reserve, with its 53,992 hectares, is not only Europe’s largest, but it also has the peculiarity of being the initial point of arrival for several marine species whose migrations are frequently linked to the flow of the Atlantic current. In recent years, there have been several complaints about illegal activities in the Egadi Islands’ marine protected area, such as trawling in shallow waters or use of illegal nets longer than the 2.5 kilometers required by law for underwater fishing in prohibited areas [49]. Sardinia’s scenario concerns violations related to the “waste cycle”, and polluting discharge. In recent years there have also been several seizures of drugs and weapons in Sardinian ports and waters. Additionally, according to recent research [50,51], Sardinia has the absolute record of seized fish products. Finally, in the Adriatic in general there is a drastic decline in fish stocks due to intensive fishing, the effects of which have profoundly changed the marine environment. This is an area where excessive trawling has had a very strong impact, so much so that fish stocks in the Adriatic have been greatly reduced [52]. Illegal fishing is not the only unlawful activity, arms, drug trafficking and smuggling are also widespread.
2.2. Footprint Matching
The Footprint Matching Algorithm (FMA) is a novel contribution of the paper that oversees coupling different SAR products on the same spot and proceeds in two cascaded steps. In the first stage, SAR products are filtered on a temporal basis, considering two products as matched if their sensing period difference is below 15 minutes. This key value has been determined on a heuristic rationale whereby ships after that time difference could not be matched between the images. The algorithm serves as a pre-screening step and is followed by spatial matching to filter the product that covers the same area of interest (AOI). The spatial matching is carried out by exploiting the footprint data contained in the product metadata. The area of intersection is used to establish a correct spatial match between two footprints. Finally, to conclude the analysis a visual inspection is performed: the footprints are plotted in interactive *.html maps and the quality of the intersection is evaluated both in terms of area covered and area of interest, verifying that the intersections cover sea zones. An example of map realised for the scenario of the Egadi Island is reported in Figure 3 by which is possible to observe the Sentinel-1 & COSMO-SkyMed coupling.
The Table 2 shows the number of couplings in each scenario selected for COAST project, detailing separately the various SAR mission parings. Notably, in the Egadi Islands region, only COSMO-SkyMed and Sentinel-1 products have found matches. For major details regarding the coupled products, their relative geometries, orbit types and platforms can be found in [53]. For sake of brevity, the Table 2 only details the of couplings for each scenario of interest of the MM/MF dataset.
2.3. AIS Data
Ancillary AIS data are a useful resource included in the dataset to provide information on specific targets. The AIS messages can be categorized into three types: static, dynamic, and voyage-related information. Only the dynamic one is updated frequently (< 10 minutes), with a rate changing according to vessel speed and course variation, ranging from a few seconds for very fast ships to several minutes for sluggish or moored ships. When collaborative ships are available, their position contained in the SAR products have been stored in a database. Nonetheless, the storage policy of [54] save the messages with a temporal resolution of around 1 minute. Therefore, data has been priorly pre-processed with Hermite interpolation taking as reference time the central time of acquisition of each SAR image. Besides, when an insufficient number of points made it infeasible to execute an interpolation, an extrapolation technique was used. However, in many cases this approach resulted in a wrong placement of the ship location. The misleading is caused by wrong extrapolation, erroneous AIS messages, or sudden route changes of the ships. The real position of ships has been collected visually inspecting each SAR image, manually labelling each vessel.
3. Method
Targets that are not truthful vessels acting as powerful signature ghosts are labeled as ambiguities in SAR literature [48]. The method developed in this manuscript aims at filtering the latter. The causes of ambiguities may be traced back to the limited sampling of the SAR pulses, which affects the Doppler spectrum [23]. Generally, SAR ambiguities can be produced in two ways. In the first case, the ambiguities are brought on by large ships. In this scenario, the ship’s brightness creates ambiguity that may be stronger than the surrounding clutter, which might cause ghosts in the SAR picture to resemble the ship’s actual signature. In the second case, the ambiguities are caused by land targets. Due to the low backscattering from the water in this scenario, which is characteristic of coastal zones, the ambiguities produced by land targets show as bright targets over the sea surface. In the case of high-resolution SAR images, these artifacts become more prominent. In essence, as the spatial resolution grows, so does the compression gain in SAR image formation. As a result, the improvement of the dynamic range of SAR images increases the intensity of strong point scatterers. The following sections describe in detail the pre-processing chains for each SAR product and the CFAR+SLA detector.
3.1. Pre-processing Chains
A general understanding of the pre-processing chains implemented for the detection of visible ships in the MM/MF products is illustrated in the Table 3 where each pre-processing step applied to the different SAR products is detailed with a checkmark. Sea-land segmentation is a mandatory step that can greatly minimize false alarm rates and enhance follow-up processing efficiency.
As also exhibited in Table 3, apart from a Land-Masking (LM) processing, SAOCOM products do not require any further dispensation. The multilook operator, applied only on COSMO-SkyMed products, is not mandatory but suggested to reduce the computational burden. Significant concerns regard the LM operator which usually require a Digital Elevation Models to compute the coastline, whereas other researchers prefer to use specific extraction techniques [55]. In this paper, the land polygons are extracted from [56].
3.2. The CFAR+SLA detector
The methodology developed in proceeds in two steps in cascade, i.e., pre-screening and discrimination. Firstly, target proposals are generated with a traditional CFAR algorithm and then these ones are discriminated with a spectrum analysis technique, i.e., Sub-look Analysis (SLA).
The adaptive threshold applied uses the nested windows approach in which there are three windows around each pixel under test—a target window (TW), a guard window (GW), and a background window (BW). The adaptive threshold is the basis of the pre-screening process. The size of the target window should be approximately equal to the size of the smallest object to detect, the size of the guard window should be approximately equal to the size of the largest object, and the size of the background window should be sufficient to accurately estimate the local background statistics. Indeed, the algorithm leverages the statistical modeling of the background clutter [57,58,59,60] by which a probability density function can be associated. Thus, the design parameter T can be computed by the from user selected as:
Once prompted background mean and standard deviation using pixels in the background ring, and the mean value of the target window, a region is a candidate as a potential target if:
During this operation, the operator first groups contiguous detected pixels into a single cluster, then extracts the width and length information from the clusters. Finally, clusters that are too large or too small are excluded based on these measurements and user input discrimination criteria. This first level of filtering is called geometric discrimination. In conclusion, CFAR detection is designed to search for pixels that are unexpectedly bright in comparison to those in the surrounding sea, although SAR ambiguities or sea clutter may also fit this criteria.
To tackle this issue, the second level of discrimination employs the Sub-look analysis of the selected region of interest for the removal of the false alarms. The physical rationale is that the Doppler spectra of ambiguities and targets are distinguished. As shown in Figure 4, subsets and metadata are fed in input to the SLA algorithm. Typical metadata information required by the sub-look processor contains parameters such as the Pulse Repetition Frequency (PRF) or the bandwidth of processing in azimuth [48].
Sub-looks are generated starting from the SLC regions of interests detected at the previous steps. As detailed in [48], one-dimensional sub-look generation is conceived, which is the most common approach for ship detection. Therefore, sub-looks can be generated either in azimuth or in range. It is worth recalling that there is no significant difference in ship detection performance between range and azimuth sub-looks even when moving ships are imaged. The number of sub-looks, , the bandwidth of the sub-looks, , and the frequency separation between the centroids of two close looks, , constitute the relevant parameters that must be set. In general, is equally configured for all sub-looks. This ensures to deal with sub-looks having the same resolution, and thus allowing a fair comparison between them. Indeed, the fraction of covered by a sub-look is an index of the degradation of resolution with reference to the original resolution of the SLC data. Regarding the , for ship detection purposes usually only two sub-looks are considered. However, for estimating the Incoherent Entropy (IE) [48] a minimum of three sub-looks are used. Concerning the location of each sub-look, the common approach is to consider the sub-looks equally spaced along the available bandwidth. It is worth remembering that sub-looks are overlapped in frequency if . Recalling that the IE calculation is a boxcar algorithm [48], displays the bandwidth of the sub-looks, centroids frequency separations and windows sizes () estimated with a grid-search algorithm on known targets.
Table 4.
Parameters used for the sub-look analysis for Sentinel-1, COSMO-SkyMed and SAOCOM missions.
Table 4.
Parameters used for the sub-look analysis for Sentinel-1, COSMO-SkyMed and SAOCOM missions.
| Parameter / Mission | Sentinel-1 | COSMO-SkyMed | SAOCOM |
|---|---|---|---|
| 102.0 Hz | 466.6 Hz | 372.0 Hz | |
| 102.0 Hz | 466.6 Hz | 372.0 Hz | |
| 7,17 | 17,17 | 3,17 |
After the sub-look generation, IE relative to each region of interests is prompted . In the end, a threshold algorithm is applied by considering stable pixels in a nested windows fashion. In fact, considering a matrix of IE prompted for a subset, a statistical process analyzes the average values inside and outside the small 30 × 30 pixels region at the center of each subset (Figure 5). In the same way of the CFAR, a buffer window of 70 × 70 pixels is considered to reduce disturbances in the computations. Summarizing, the discrimination algorithm outputs a class for the target or ambiguity depending on the stability of the pixels of the target with reference to the pixel stability of the background. In conclusion, the CFAR+SLA detector can be considered an extension of the work of [48] where the IE is pertained only around the pre-screened targets and the thresholds are prompted in a nested fashion.
Some demonstrative examples of IE for COSMO-SkyMed, Sentinel-1 and SAOCOM ship targets and ambiguities are reported in the Figure 6, Figure 7 and Figure 8, respectively. These samples are very useful to show crucial behaviours of IE under different frequency bands, still not damaging the effectiveness of the discriminator.
4. Experimental Analysis
4.1. Performance Indicators
To monitor the overall performance of the detection algorithm, the detection probability, false alarm rate and consequently the ROC (Receiver Operating Characteristic) curves were defined. It should be noted that in the literature, the metrics of detection probability and false alarm probability are defined differently from author to author [61]. For example, some authors prefer to relate the false alarm rate to the area of the observation scenario [19]. In this study, such metrics were adopted as:
having denoted the number of target-coupled detections, the number of targets in the scene, the total number of detection algorithm outputs. Once defined the metrics, it is possible to measure the relative importance of the CFAR algorithm parameters on the detection performance. Noteworthy is that having defined the metrics in such way, the probability of detection and false alarm rate results decoupled. However, before calculating these curves, an attempt was made to solve one of the issues of this adaptive threshold approach. While the CFAR algorithm is a well-established and well accepted in the scientific community, it is not without faults: the multiple detections on the same target represent one of the most typical one. To address this issue and, consequently, minimize the false alarm rate, a detection suppression technique was developed combining nearby detections that are located less than 150 meters apart from each other. The new location is supposed to be placed in the middle of the two. Notably, the threshold was experimentally determined.
4.2. Local Analysis
A study of the CFAR+SLA algorithm’s performance on a COSMO-SkyMed product (Figure 9) is here presented.
This scene was chosen for its unique characteristics since it represents a very difficult case with intricate coasts, azimuth ambiguities, and ships in close proximity to one other and the coast. In fact, the image collects the port of Taranto, which is rich with potential sources of false alerts due to its geographical configuration. The presence of docks and other metal buildings adds to the sense of uncertainty. Finally, there is an artifact in the image, specifically a clear stripe, which is most likely the result of a radio signal emitted by one of the ships in port and captured by the X-band. The product was tested with a low threshold value (4.5) and the background, guard and target window sizes as given in Table 5.
This is the default option for running the algorithm in order to increase detection probability while decreasing false alarm rate. In any event, this permits the discrimination algorithm’s performance to be tested across a large number of detections. The overall accuracy of the CFAR+SLA algorithm was evaluated on ship and ambiguity detection, having defined the accuracy as the ratio between true positives and true positives plus false positives. Ultimately, pre and post application results of the discrimination chain have been evaluated in terms of detection probability and false alarm. The results were obtained and reported in Table 6.
4.3. Global Analysis
This section details the performance analysis to estimate the improvement achieved with the CFAR-SLA algorithm. For this purpose, MM/MF products coupled by spatio-temporal matching were analyzed with the CFAR-SLA algorithm in the different identified regions. In more detail, after labelling the products individually, performance was derived via ROC curves. What follows is a brief description of the curves obtained in each reference scenario. Since the AIS data is not fully usable, it should be noted that the goodness of the curves depends on the annotator’s recognition skill. ROC curves were calculated by varying the threshold parameters of the detection algorithm and keeping the other parameters fixed as in the basic configuration shown in Table 5. Specifically, the threshold was linearly sampled in the interval .
4.3.1. Egadi Islands
In the Egadi Islands region, the performance of the algorithm was highlighted by Figure 10. It should be taken into account that in this region the land portions are far smaller than the sea portions. This made it possible to reduce the false alarm rate generated by land ambiguities. As can be seen from the results, the performance of Cosmo-SkyMed and Sentinel-1 are remarkable with an area under the curve (AUC) of value of 0.91, increased to 0.95 after the application of the discrimination pipeline. Concerning Sentinel-1 products, the AUC improved by more than 15% between before and after the application of the discrimination algorithm, going from 0.60 to 0.70.
4.3.2. Sardinia
The evidence of Figure 11 shows how the performance achieved in the region of Sardinia is noteworthy, proving the effectiveness of the discrimination algorithm.
Indeed, the COSMO-SkyMed products clearly demonstrate performance improvements. As can be seen, although with a marginal loss of accuracy in the early part of the graph, the COSMO-SkyMed products experienced a performance increase from the already high 0.88 to 0.91 AUC value. By observing the (b) graph in Figure 11, the SAOCOM products show a small decay of the CFAR-SLA curve around the 0.7 value of Pf. However, as can be appreciated, the AUC is markedly increased from the value 0.78 to the value 0.82. Sentinel-1 products (Figure 11) demonstrated a good performance, increased again using sub-aperture algorithm. In fact, the performance enhancement increased the AUC from 0.72 to 0.77.
4.3.3. Adriatic Sea
Analyzing the products in the Adriatic Sea, it is again clear from the results obtained that there is an increase in performance after the removal of false alarms. The curves, shown by means of the graphs in Figure 12. In contrast to the previous case, the COSMO-SkyMed products showed a performance increase especially in the early part of the graph. The accuracies are also remarkable in this scenario going from a value of 0.78 to 0.87 AUC. The same observations can be repeated also to SAOCOM products (Figure 12), showing an increased AUC after the of application of the discriminator algorithm. As can be seen from the bottom graph in Figure 12, the AUC increases from a value of 0.73 to 0.77. Finally, despite a slightly lower accuracy values at the end of the graph, Sentinel-1 products showed an improvement in detection performance: the area under the curve improved from 0.83 to 0.88.
4.3.4. Area Under the Curve
In essence, the global performances of the COSMO-SkyMed & Sentinel-1 and COSMO-SkyMed & SAOCOM pairs were evaluated and reported by means of Figure 13. The latter reports the AUC before and after application of the sub-aperture analysis algorithm divided into the three scenarios of interest. As it can be seen from the graphs, COSMO-SkyMed performance is remarkable in every scenario and condition, especially in the Egadi Islands region where large portions of sea overlie the few areas of land. This again testifies to the importance of the correct execution of the land separation.
5. Conclusions
Withing the time-frame of 18 months, the present study has assessed the capability of a cascade detector for ship detection purposes on multiple SAR frequency bands (L-, C-, and X-band). The processing chains and the constructed dataset of MM/MF SLC SAR products constitutes an important contribution of the work. The results attained have confirmed the effectiveness of the developed approach, showing an increase of performance in terms of improvement of AUC and reduction of false alarms. Indeed, in a very congested scenario such as the port of Taranto the reduction of the false alarm rate has been estimated around the 40%.
While undoubtedly recognizing the ghost targets, it must be pointed out that solving an eigenvalue problem is computational intensive with an increase of the computational time that grows quadratically with the dimension of the considered tile. It should be taken into account how the time demanded by the discrimination phase matches the one from pre-selection. Therefore, to reduce the time required to process a panoramic SAR product, further research will analyze the capabilities offered by a deep learning-based technique on the developed dataset. Taking full advantage of the SAR spectrum is definitely a path that must be exploited with artificial intelligence.
Funding
This research was funded by Italian Space Agency (ASI) grant number N.2021-11-U.0.
Acknowledgments
This work has been developed in the framework of the Italian Space Agency’s ”Study of new methods and techniques based on the utilization of multimission/multifrequency SAR data”, project ”COastal Area monitoring with SAR data and multimission/multifrequency Techniques - COAST”, ASI Contract N. 2021-11-U.0.
Conflicts of Interest
The authors declare no conflict of interest.
References
- Nimmich, J.L.; Goward, D.A. Maritime domain awareness: the key to maritime security. International Law Studies 2007, 83, 6. [Google Scholar]
- Balci, M.; Pegg, R. Towards Global Maritime Domain Awareness-" Recent Developments and Challenges". 2006 9th international conference on information fusion. IEEE, 2006, pp. 1–5.
- Tetreault, B. Use of the Automatic Identification System (AIS) for maritime domain awareness (MDA). Proceedings of OCEANS 2005 MTS/IEEE, 2005, pp. 1590–1594 Vol. 2. [CrossRef]
- Graziano, M.D.; D’Errico, M.; Rufino, G. Wake component detection in X-band SAR images for ship heading and velocity estimation. Remote Sensing 2016, 8, 498. [Google Scholar] [CrossRef]
- Graziano, M.D.; D’Errico, M.; Rufino, G. Ship heading and velocity analysis by wake detection in SAR images. Acta astronautica 2016, 128, 72–82. [Google Scholar] [CrossRef]
- Graziano, M.D. Preliminary results of ship detection technique by wake pattern recognition in SAR images. Remote Sensing 2020, 12, 2869. [Google Scholar] [CrossRef]
- Del Prete, R.; Graziano, M.D.; Renga, A. First results on wake detection in SAR images by deep learning. Remote Sensing 2021, 13, 4573. [Google Scholar] [CrossRef]
- Joshi, S.K.; Baumgartner, S.V. Range-Doppler tracking of ships using single-channel airborne radar data. EUSAR 2021; 13th European Conference on Synthetic Aperture Radar. VDE, 2021, pp. 1–6.
- Eldhuset, K. An automatic ship and ship wake detection system for spaceborne SAR images in coastal regions. IEEE transactions on Geoscience and Remote Sensing 1996, 34, 1010–1019. [Google Scholar] [CrossRef]
- Shao, Z.; Wu, W.; Wang, Z.; Du, W.; Li, C. Seaships: A large-scale precisely annotated dataset for ship detection. IEEE transactions on multimedia 2018, 20, 2593–2604. [Google Scholar] [CrossRef]
- Young, W. What are vessel traffic services, and what can they really do? Navigation 1994, 41, 31–56. [Google Scholar] [CrossRef]
- Goudossis, A.; Katsikas, S.K. Towards a secure automatic identification system (AIS). Journal of Marine Science and Technology 2019, 24, 410–423. [Google Scholar] [CrossRef]
- International Maritime Organization. "AIS transponders", International Maritime Organization (2017) [Online]. Available:. https://www.imo.org/en/OurWork/Safety/Pages/AIS.aspx, 2019. Accessed: 2022-12-07.
- Zhang, D.; Li, J.; Wu, Q.; Liu, X.; Chu, X.; He, W. Enhance the AIS data availability by screening and interpolation. 2017 4th International Conference on Transportation Information and Safety (ICTIS). IEEE, 2017, pp. 981–986.
- Graziano, M.D.; Renga, A.; Moccia, A. Integration of Automatic Identification System (AIS) Data and Single-Channel Synthetic Aperture Radar (SAR) Images by SAR-Based Ship Velocity Estimation for Maritime Situational Awareness. Remote Sensing 2019, 11. [Google Scholar] [CrossRef]
- Kanjir, U.; Greidanus, H.; Oštir, K. Vessel detection and classification from spaceborne optical images: A literature survey. Remote sensing of environment 2018, 207, 1–26. [Google Scholar] [CrossRef] [PubMed]
- Iceye. Dark Vessel Detection for Maritime Security with SAR Data, 2021. [Online; accessed 19. May 2021].
- Curlander, J.C.; McDonough, R.N. Synthetic aperture radar; Vol. 11, Wiley, New York, 1991.
- Pelich, R.; Longépé, N.; Mercier, G.; Hajduch, G.; Garello, R. AIS-based evaluation of target detectors and SAR sensors characteristics for maritime surveillance. IEEE Journal of Selected Topics in Applied Earth Observations and Remote Sensing 2014, 8, 3892–3901. [Google Scholar] [CrossRef]
- Wang, C.; Bi, F.; Zhang, W.; Chen, L. An intensity-space domain CFAR method for ship detection in HR SAR images. IEEE Geoscience and Remote Sensing Letters 2017, 14, 529–533. [Google Scholar] [CrossRef]
- Raney, R.K.; Princz, G.J. Reconsideration of azimuth ambiguities in SAR. IEEE Transactions on Geoscience and Remote Sensing 1987, pp. 783–787. [Google Scholar] [CrossRef]
- Guarnieri, A.M. Adaptive removal of azimuth ambiguities in SAR images. IEEE Transactions on Geoscience and Remote Sensing 2005, 43, 625–633. [Google Scholar] [CrossRef]
- Choi, J.H.; Won, J.S. Efficient SAR Azimuth Ambiguity Reduction in Coastal Waters Using a Simple Rotation Matrix: The Case Study of the Northern Coast of Jeju Island. Remote Sensing 2021, 13, 4865. [Google Scholar] [CrossRef]
- Velotto, D.; Soccorsi, M.; Lehner, S. Azimuth ambiguities removal for ship detection using full polarimetric X-band SAR data. IEEE transactions on geoscience and remote sensing 2013, 52, 76–88. [Google Scholar] [CrossRef]
- Touzi, R.; Hurley, J.; Vachon, P.W. Optimization of the degree of polarization for enhanced ship detection using polarimetric RADARSAT-2. IEEE Transactions on Geoscience and Remote Sensing 2015, 53, 5403–5424. [Google Scholar] [CrossRef]
- Touzi, R. On the use of polarimetric SAR data for ship detection. IEEE 1999 International Geoscience and Remote Sensing Symposium. IGARSS’99 (Cat. No. 99CH36293). IEEE, 1999, Vol. 2, pp. 812–814.
- Brekke, C.; Anfinsen, S.N. Ship detection in ice-infested waters based on dual-polarization SAR imagery. IEEE Geoscience and Remote Sensing Letters 2010, 8, 391–395. [Google Scholar] [CrossRef]
- Marino, A.; Sanjuan-Ferrer, M.J.; Hajnsek, I.; Ouchi, K. Ship detection with spectral analysis of synthetic aperture radar: A comparison of new and well-known algorithms. Remote Sensing 2015, 7, 5416–5439. [Google Scholar] [CrossRef]
- Wang, W.; Ji, Y.; Lin, X. A novel fusion-based ship detection method from Pol-SAR images. Sensors 2015, 15, 25072–25089. [Google Scholar] [CrossRef] [PubMed]
- Xie, Q.; Ballester-Berman, J.D.; Lopez-Sanchez, J.M.; Zhu, J.; Wang, C. Quantitative analysis of polarimetric model-based decomposition methods. Remote Sensing 2016, 8, 977. [Google Scholar] [CrossRef]
- Zhu, J.; Qiu, X.; Pan, Z.; Zhang, Y.; Lei, B. Projection shape template-based ship target recognition in TerraSAR-X images. IEEE Geoscience and Remote Sensing Letters 2016, 14, 222–226. [Google Scholar] [CrossRef]
- Wang, C.; Bi, F.; Chen, L.; Chen, J. A novel threshold template algorithm for ship detection in high-resolution SAR images. 2016 IEEE International Geoscience and Remote Sensing Symposium (IGARSS). IEEE, 2016, pp. 100–103.
- Song, S.; Xu, B.; Yang, J. SAR target recognition via supervised discriminative dictionary learning and sparse representation of the SAR-HOG feature. Remote Sensing 2016, 8, 683. [Google Scholar] [CrossRef]
- Zhou, D.; Zeng, L.; Zhang, K. A novel SAR target detection algorithm via multi-scale SIFT features. J. Northwest. Polytech. Univ 2015, 33, 867–873. [Google Scholar]
- Ai, J.; Tian, R.; Luo, Q.; Jin, J.; Tang, B. Multi-scale rotation-invariant Haar-like feature integrated CNN-based ship detection algorithm of multiple-target environment in SAR imagery. IEEE Transactions on Geoscience and Remote Sensing 2019, 57, 10070–10087. [Google Scholar] [CrossRef]
- Zhang, T.; Zhang, X. High-speed ship detection in SAR images based on a grid convolutional neural network. Remote Sensing 2019, 11, 1206. [Google Scholar] [CrossRef]
- Chen, C.; He, C.; Hu, C.; Pei, H.; Jiao, L. A deep neural network based on an attention mechanism for SAR ship detection in multiscale and complex scenarios. IEEE Access 2019, 7, 104848–104863. [Google Scholar] [CrossRef]
- Zhang, T.; Zhang, X.; Shi, J.; Wei, S. Depthwise separable convolution neural network for high-speed SAR ship detection. Remote Sensing 2019, 11, 2483. [Google Scholar] [CrossRef]
- Wang, Y.; Wang, C.; Zhang, H.; Dong, Y.; Wei, S. A SAR dataset of ship detection for deep learning under complex backgrounds. remote sensing 2019, 11, 765. [Google Scholar] [CrossRef]
- Chang, Y.L.; Anagaw, A.; Chang, L.; Wang, Y.C.; Hsiao, C.Y.; Lee, W.H. Ship detection based on YOLOv2 for SAR imagery. Remote Sensing 2019, 11, 786. [Google Scholar] [CrossRef]
- Jiao, J.; Zhang, Y.; Sun, H.; Yang, X.; Gao, X.; Hong, W.; Fu, K.; Sun, X. A densely connected end-to-end neural network for multiscale and multiscene SAR ship detection. IEEE Access 2018, 6, 20881–20892. [Google Scholar] [CrossRef]
- Li, J.; Qu, C.; Shao, J. Ship detection in SAR images based on an improved faster R-CNN. 2017 SAR in Big Data Era: Models, Methods and Applications (BIGSARDATA). IEEE, 2017, pp. 1–6.
- Wei, S.; Zeng, X.; Qu, Q.; Wang, M.; Su, H.; Shi, J. HRSID: A high-resolution SAR images dataset for ship detection and instance segmentation. Ieee Access 2020, 8, 120234–120254. [Google Scholar] [CrossRef]
- Wackerman, C.C.; Friedman, K.S.; Pichel, W.G.; Clemente-Colón, P.; Li, X. Automatic detection of ships in RADARSAT-1 SAR imagery. Canadian journal of remote sensing 2001, 27, 568–577. [Google Scholar] [CrossRef]
- Friedman, K.; Wackerman, C.; Funk, F.; Rowell, K.; Pichel, W.; Clemente-Colón, P.; Li, X. Validation of an automatic vessel detection algorithm using SAR data and known vessel fleet distributions. IGARSS 2000. IEEE 2000 International Geoscience and Remote Sensing Symposium. Taking the Pulse of the Planet: The Role of Remote Sensing in Managing the Environment. Proceedings (Cat. No. 00CH37120). IEEE, 2000, Vol. 5, pp. 2071–2073.
- Friedman, K.S.; Wackerman, C.; Funk, F.; Schwenzfeier, M.; Pichel, W.G.; Colon-Clemente, P.; Li, X. Analyzing the dependence between RADARSAT-1 vessel detection and vessel heading using CFAR algorithm for use on fishery management. Oceans 2003. Celebrating the Past... Teaming Toward the Future (IEEE Cat. No. 03CH37492). IEEE, 2003, Vol. 5, pp. P2819–P2823.
- Friedman, K.S.; Wackerman, C.; Funk, F.; Pichel, W.G.; Clemente-Colón, P.; Li, X. Validation of a CFAR vessel detection algorithm using known vessel locations. IGARSS 2001. Scanning the Present and Resolving the Future. Proceedings. IEEE 2001 International Geoscience and Remote Sensing Symposium (Cat. No. 01CH37217). IEEE, 2001, Vol. 4, pp. 1804–1806.
- Renga, A.; Graziano, M.D.; Moccia, A. Segmentation of marine SAR images by sublook analysis and application to sea traffic monitoring. IEEE Transactions on Geoscience and Remote Sensing 2018, 57, 1463–1477. [Google Scholar] [CrossRef]
- Biffia, A.; Dodaro, L.; Morabito, F.; Pergolizzi, A. Mare Monstrum. https://www.legambiente.it/wp-content/uploads/Dossier-Mare-Monstrum-2019.pdf, 2020. Accessed: 2022-12-13.
- Biffia, A.; Dodaro, L.; Morabito, F.; Pergolizzi, A. Mare Monstrum. https://www.legambiente.it/wp-content/uploads/2020/06/MareMonstrum2020.pdf, 2019. Accessed: 2022-12-13.
- Furesi, R.; Madau, F.; Pulina, P.; Sai, R.; Pinna, M.; Pais, A. Profitability and sustainability of edible sea urchin fishery in Sardinia (Italy). Journal of coastal conservation 2016, 20, 299–306. [Google Scholar] [CrossRef]
- Spera, G.; Monaco, P. RAPPORTO ANNUALE SUL CONTROLLO DELLA PESCA IN ITALIA. https://www.guardiacostiera.gov.it/stampa/Documents/RAPPORTO%20ANNUALE%202020%20-%20DOWNLOAD.pdf, 2019. Accessed: 2022-12-13.
- Graziano, M.D.; Prete, R.D.; Grasso, M. A NEW DATASET OF MULTI-MISSION/MULTI-FREQUENCY SAR DATA FOR MARITIME MONITORING: FIRST RESULTS AND CRITICAL ANALYSIS. 2022.
- Miler, R.K. The Exactearth Satelite-AIS Benefits for the Maritime Transport. Prace Naukowe Wyższej Szkoły Bankowej w Gdańsku 2013, 28, 71–86. [Google Scholar]
- Dellepiane, S.; De Laurentiis, R.; Giordano, F. Coastline extraction from SAR images and a method for the evaluation of the coastline precision. Pattern Recognition Letters 2004, 25, 1461–1470, Pattern Recognition for Remote Sensing (PRRS 2002). [Google Scholar] [CrossRef]
- Open Street Map. "Data Derived from OpenStreetMap for Download", Open Street Map [Online]. Available:. https://osmdata.openstreetmap.de/data/land-polygons.html, 2022. Accessed: 2022-12-07.
- Benachenhou, K.; Taleb-Ahmed, A.; Hamadouche, M. Performances evaluation of GNSS ALTBOC acquisition with CFAR detection in Rayleigh fading channel. 2013 Saudi International Electronics, Communications and Photonics Conference. IEEE, 2013, pp. 1–7.
- Guida, M.; Longo, M.; Lops, M. Biparametric CFAR procedures for lognormal clutter. IEEE Transactions on Aerospace and Electronic Systems 1993, 29, 798–809. [Google Scholar] [CrossRef]
- Anastassopoulos, V.; Lampropoulos, G.A. Optimal CFAR detection in Weibull clutter. IEEE Transactions on Aerospace and Electronic systems 1995, 31, 52–64. [Google Scholar] [CrossRef]
- Erfanian, S.; Vakili, V.T. Introducing excision switching-CFAR in K distributed sea clutter. Signal Processing 2009, 89, 1023–1031. [Google Scholar] [CrossRef]
- Leng, X.; Ji, K.; Yang, K.; Zou, H. A Bilateral CFAR Algorithm for Ship Detection in SAR Images. IEEE Geoscience and Remote Sensing Letters 2015, 12, 1536–1540. [Google Scholar] [CrossRef]
Figure 1.
Pictorial view of a spaceborne SAR gathering an image over a gulf and AIS network.
Figure 2.
Selected scenarios of interest for the realisation of the MM/MF dataset: a) Adriatic sea, b) Sardinia, and c) Egadi Islands.
Figure 2.
Selected scenarios of interest for the realisation of the MM/MF dataset: a) Adriatic sea, b) Sardinia, and c) Egadi Islands.
Figure 3.
Sentinel-1 (Prod ID: S1A_IW_SLC__1SDV_20200706T171255_20200706T171322_033337_ 03DCC6_FC45) and COSMO-SkyMed (Prod ID: 1377380) products pairing map on the Egadi Islands scenario.
Figure 3.
Sentinel-1 (Prod ID: S1A_IW_SLC__1SDV_20200706T171255_20200706T171322_033337_ 03DCC6_FC45) and COSMO-SkyMed (Prod ID: 1377380) products pairing map on the Egadi Islands scenario.
Figure 4.
Relational diagram reporting the inputs passed to the discriminator algorithm based on the analysis of the sub-looks.
Figure 4.
Relational diagram reporting the inputs passed to the discriminator algorithm based on the analysis of the sub-looks.
Figure 5.
Visual representation of IE generation from three sub-looks (left) and its calculation for a Sentinel-1 product (right) in which a target and its ambiguity are highlighted.
Figure 5.
Visual representation of IE generation from three sub-looks (left) and its calculation for a Sentinel-1 product (right) in which a target and its ambiguity are highlighted.
Figure 6.
IE calculated for ship target (left) and ambiguity (right) [Product ID: ]
Figure 7.
IE calculated for ship target (left) and ambiguity (right) [Product ID: ]
Figure 8.
IE calculated for ship target (left) and ambiguity (right) [Product ID: ]
Figure 9.
Test case of the CFAR+SLA algorithm over the port of Taranto. Highlighted detail: a probable radio signal transmitted from a ship and captured by X-band. [Product ID: processed by University of Naples Federico II under the COAST license of the Italian Space Agency (ASI); Original COSMO-SkyMed Product - ©ASI - (2020).
Figure 10.
Evaluation of Cosmo-SkyMed (a) [89 targets labelled] and Sentinel-1 (b) [290 targets labelled] products in the Egadi Islands region.
Figure 10.
Evaluation of Cosmo-SkyMed (a) [89 targets labelled] and Sentinel-1 (b) [290 targets labelled] products in the Egadi Islands region.
Figure 11.
Evaluation of COSMO-SkyMed (a) [121 targets labelled], SAOCOM (b) [36 targets labelled] and Sentinel-1 (c) [333 targets labelled] products in the Sardinia region.
Figure 11.
Evaluation of COSMO-SkyMed (a) [121 targets labelled], SAOCOM (b) [36 targets labelled] and Sentinel-1 (c) [333 targets labelled] products in the Sardinia region.
Figure 12.
Evaluation of Cosmo-SkyMed (a) [108 targets labelled], SAOCOM (b) [113 targets labelled] and Sentinel-1 (c) [331 targets labelled] products in the Adriatic region.
Figure 12.
Evaluation of Cosmo-SkyMed (a) [108 targets labelled], SAOCOM (b) [113 targets labelled] and Sentinel-1 (c) [331 targets labelled] products in the Adriatic region.
Figure 13.
Comparative analysis of improved performance in terms of AUC.
Table 1.
MM/MF products specifications in terms of acquisition mode, spatial resolution, pixel spacing, and polarization.
Table 1.
MM/MF products specifications in terms of acquisition mode, spatial resolution, pixel spacing, and polarization.
| Mission | Acquisition Mode | Resolution (range x azi) (m) | Pixel spacing (range x azi) (m) | Polarization | Swath (km) |
|---|---|---|---|---|---|
| COSMO-SkyMed | StripMap | 3 x 3 | 2.35 × 4.14 | HH | 40 |
| Sentinel-1 | IW (Interferometric Wide Swath) | 20 x 5 | 2.3 x 13.9 | VH | 250 |
| SAOCOM | StripMap | 10 x 10 | 10 x 10 | VH | 65 |
Table 2.
Number of couplings for each scenario of interest of the MM/MF dataset.
| Region / Pairing | Adriatic Sea | Egadi Islands | Sardinia |
|---|---|---|---|
| COSMO-SkyMed & Sentinel-1 | 15 | 32 | 55 |
| COSMO-SkyMed & SAOCOM | 5 | NA | 23 |
| Sentinel-1 & SAOCOM | 12 | NA | 10 |
Table 3.
Pre-processing operators used to each SAR product
| Operator / Product | COSMO-SkyMed | SAOCOM | Sentinel-1 |
|---|---|---|---|
| Multilook | ✓ | ||
| Thermal noise removal | ✓ | ||
| TOPSAR Deburst | ✓ | ✓ | |
| Land-Masking | ✓ | ✓ | ✓ |
| Calibration | ✓ |
Table 5.
Configuration of the paramaters of the CFAR algorithm.
| BW | GW | TW | PFA ( ) | Min Target Size | Max Target Size |
|---|---|---|---|---|---|
| 800 m | 400 m | 30 m | 4.5 | 30 m | 800 m |
Table 6.
Accuracy of the CFAR+SLA algorithm and performance in terms of probability of detection and false alarm pre and post application of the discrimination pipeline
Table 6.
Accuracy of the CFAR+SLA algorithm and performance in terms of probability of detection and false alarm pre and post application of the discrimination pipeline
| Accuracy | CFAR | CFAR+SLA | |||||
|---|---|---|---|---|---|---|---|
| Vessels | 92.3% | ||||||
| Ambiguities | 100% | ||||||
| Global | 95.6% | 100% | 47.8% | 100% | 7.6% | ||
Disclaimer/Publisher’s Note: The statements, opinions and data contained in all publications are solely those of the individual author(s) and contributor(s) and not of MDPI and/or the editor(s). MDPI and/or the editor(s) disclaim responsibility for any injury to people or property resulting from any ideas, methods, instructions or products referred to in the content. |
© 2023 by the authors. Licensee MDPI, Basel, Switzerland. This article is an open access article distributed under the terms and conditions of the Creative Commons Attribution (CC BY) license (http://creativecommons.org/licenses/by/4.0/).
Copyright: This open access article is published under a Creative Commons CC BY 4.0 license, which permit the free download, distribution, and reuse, provided that the author and preprint are cited in any reuse.


MDPI Initiatives
Important Links
© 2024 MDPI (Basel, Switzerland) unless otherwise stated