1. Introduction
Rivers are an organism to a certain extent in which the combined action of biocoenosis and physical environment promotes the systematic development. Therein, the hydraulic geometry characteristics and water inflow play a major role in sustaining the ecology health of river basin like the organs and blood and driving the diversified river landscape. In nature, overall meandering rivers usually exhibit width fluctuations both in time and space, varying with the river discharge; some composite indicators thus were combined to assess the stability of river system within a reach or at station, such as the deterministic hydraulic width-depth ratio and stream power, and their stochastic expressions (Song et al., 2019). Zolezzi et al. (2012) could use a perturbation approach to explain the process mechanism of the nonlinear interaction between curvature and width factor in initially equivalent-width meanders, as an example, when focusing on meandering evolution close to the transition with braiding; yet if we just seek to maintain the stable and predictable meandering evolution for guaranteeing the stimulation of biotic activity in river basin (Zalewski, 2015), the long-term and large-scale planform evolution of meandering rivers has been believed to be less affected by nonconstant width (Camporeale et al., 2007; Crosato, 2008; Posner and Duan, 2012), the channel centerline variation can represent adequately the meander planform.
Since Ikeda et al. (1981) contributed to the instabilities of river meander in the views of bend and alternate-bar instability, many linearized meander evolution models continuously upgraded the deep understandings and revealed more detailed quantitative behaviors of meander migration at large spatial and temporal scales (Bolla Pittaluga et al., 2009; Camporeale et al., 2007; Camporeale and Ridolfi, 2006; Hooke, 2003; Johannesson and Parker, 1989a, 1989b; Seminara and Tubino, 1992), in which a straight channel was usually selected as the initial geometrical morphology in the early days (Howard and Knutson, 1984). As one of the most outstanding ones, the Johannesson and Parker model (J&P model) includes the secondary flow effects relative to the Ikeda et al. (1981) model, and has been conducted various promotion and application. For example, Posner and Duan (2012) treated the bank erosion coefficient as a stochastic variable that varies physical properties of the bank and proved that such stochastic model in general could yield more realistic predictions of meandering planform evolutions; Xu et al. (2011) coupled a conceptual depositional model from Howard (1992), and developed a new bank erosion model to take into the nonlinearity of near-bank velocity and the out-bank height account for investigating the long-term meandering dynamics; Matsubara and Howard (2014) applied the model in simulating planform evolution of a mud-dominated meandering river, Quinn River in USA, and demonstrated the bank asymmetry and the velocity perturbation have high correlation at close to zero spatial lag.
Based on the J&P model, this study designs a series of simulation tests on stable meandering evolution, especially the principal features are as follows: (1) starting from an initially sine-generated meandering channel in the ideal aspect, and a relatively narrow, nearly constant-width meander, Jiyun River in China in the practical aspect respectively; (2) distinguishing the long-term trends of channel centerlines under the different mean annual value conditions of width-depth ratio and flow discharge.
2. Methodology
2.1. Governing Equations
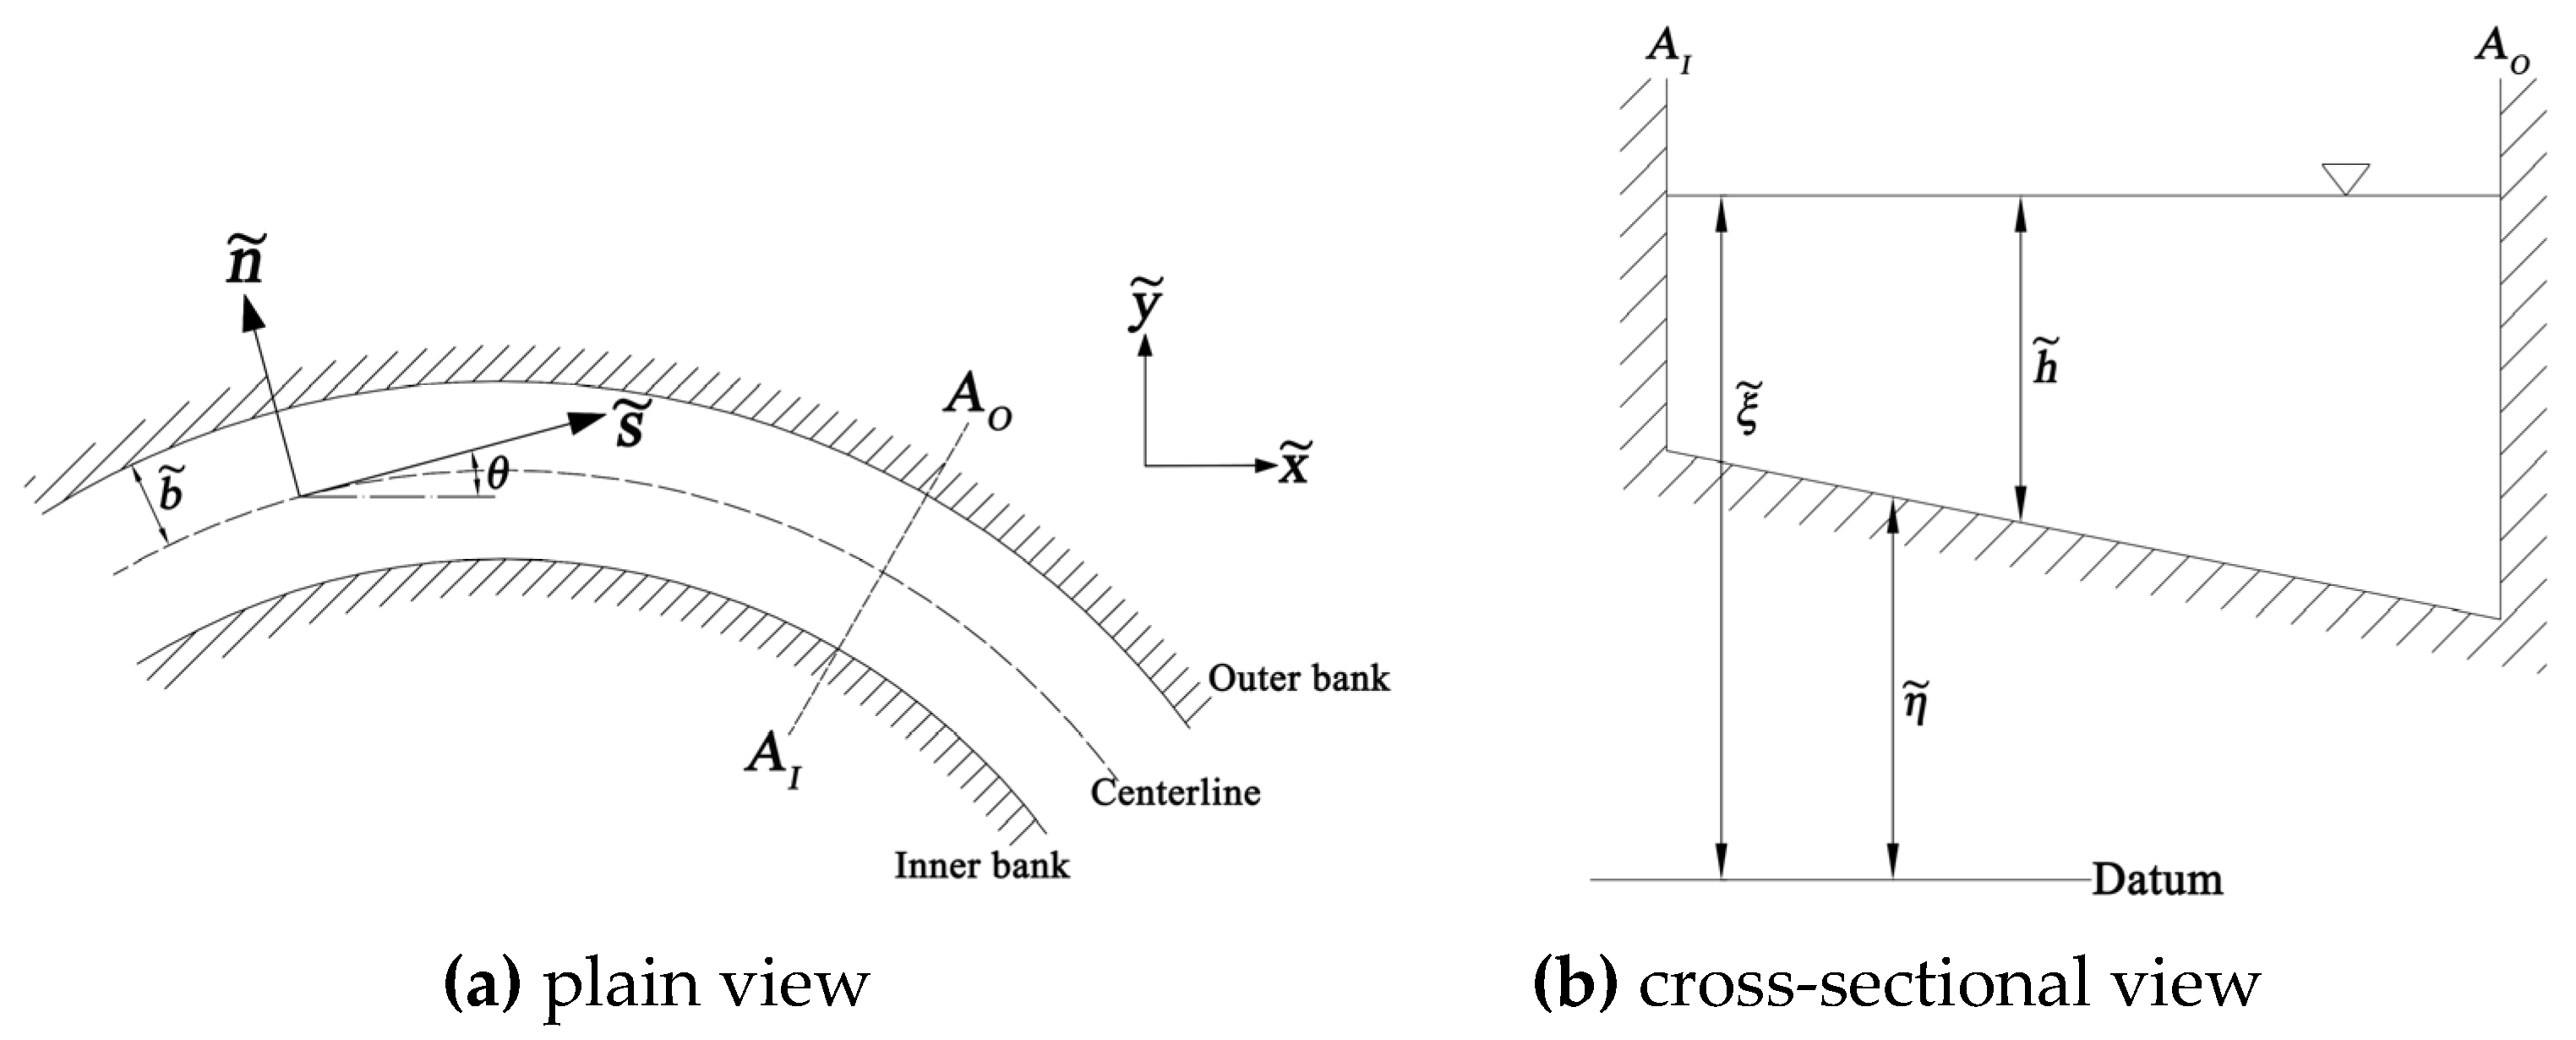
The governing equations based on the orthogonal curvilinear coordinate system under the mean annual geometrical conditions in a meandering channel reach, are given below.
Figure 1 shows the coordinate system and underlying variables; here, the tilde denotes a dimensional variable (the same below).
Depth-averaged flow continuity and streamwise momentum equations:
Transverse momentum equation:
Sediment continuity equation:
Streamwise and transverse equations of sediment transport rate:
Herein,
Firstly for flow (Johannesson and Parker, 1989a, 1989b) in Eqs. (1-3),
and
denote the depth-averaged value of flow velocities (
) in the
and
directions, respectively;
is the transverse secondary flow;
represent a dimensionless velocity shape function,
, averaging to unity;
,
is the upward normal distance from the bed,
is the upward normal flow depth;
is the water surface elevation;
is the curvature of the channel centerline,
;
is a constant eddy viscosity;
is the bed shear stress in the
direction; g is the gravitational acceleration;
ρ is water density. The velocity terms follow that
Secondly for sediment in Eqs. (4-6), t is the time variable; is the bed elevation; and denote the sediment transport rate per unit width in the and directions, respectively; p denotes the sediment porosity; β is a cross-sectional shape parameter; and M is an exponent relating velocity to bedload transport rate.
Thirdly for bank in Eq. (7),
is the displacement distance of bank-line per unit of time in the
direction;
is the nominal erosion rate;
is the local bank erodibility;
is the total sinuosity correction (average velocity is assumed to decrease as sinuosity increases with constant valley gradient);
denotes the excess velocity of near-bank velocity (
) relative to the reach-averaged streamwise velocity (
);
is the assumed value of bank erosion rate dependence upon
;
is the local bank erosional resistance, which may be temporally and spatially varying resulted from riparian vegetation and human activity effects. The combination of the five parameters is named the combinative erosion modulus. The near-bank velocity perturbation follows that (Howard, 1992)
2.2. Nondimensionalization and Simplification
Major variables are nondimensionalized as follows:
where
b is the reach-averaged channel half-width as shown in
Figure 1;
H is the reach-averaged depth;
is the median bed-material sediment size;
is the specific weight of subaqueous sediment;
is a bed friction factor for the zeroth-order primary flows, given by (Engelund, 1974)
where
I is the average down-channel water surface slope.
The dimensionless velocity shape function,
takes the form (Engelund, 1974)
The constant eddy viscosity (
) is obtained by
Assuming the channel centerline to be a sinuous shape, which follows
where
is the minimum value of the centerline curvature radius (
);
is the intersection angle of down-channel direction and the
-axis as shown in
Figure 1;
σ is an order-one dimensionless curvature;
is the characteristic meander wave number dependence upon
.
A ratio of half-width to minimum centerline curvature radius is defined as
Then the dimensionless equation of
C can be rewritten as
where
, denotes phase, it follows that
k and
are rescaled with
respectively
The main governing equations are reduced with the aid of Eqs. (11-19)
where
;
;
;
denotes the reach-averaged value of
.
Considering small curvature as an expansion in
, the major variables can be expanded as follows
where
and
are the dimensionless reference elevations corresponding to
.
Substituting Eqs. 26-27 into the Eqs. 20-25, the zeroth order results in straight channel are obtained
At
, the flow and bed topography components linearly forced by curvature yield
In the equation formation process, the small and terms have been dropped. The superelevation and associated secondary flow are then solved by incorporating the linearized theoretical results of Johannesson and Parker (1989b).
Finally, the boundary conditions include
The fourth order Runge-Kutta method is used for solving the differential equations.
3. Case CalculatioN
The J&P flow model contribute directly the channel centerline changes in plane and has been validated using field data (Matsubara and Howard, 2014). In particular, there are mainly 5 key input parameters worth noting, including Froude number (F), channel width-depth ratio (2δ), bed friction factor (Cf), and the empirical parameters M, β in the model.
3.1. Sine-Generated Meandering Channel
Natural rivers are mainly categorized into three patterns: stable single-thread channel, quasi-stable anabranching channel, and unstable braided channel based on river activity and resistance characteristics (Eaton et al., 2010; Song and Bai, 2015; Xin et al., 2018). When the width-depth ratio is at some super-critical value states (e.g., exceeding 50 (Bridge, 1993)), the meandering pattern is commonly prone to degenerate into multi-thread pattern with the increase of internal instability (Eaton et al., 2010; Song et al., 2016) and the response uncertainty of river system to flow will enlarge continuously (Song et al., 2019; Song et al., 2020) during the evolution process. Therefore, to avoid the unstable situations, under the premise of maintaining meandering pattern and guaranteeing model validity, we evaluated the temporal trend of centerline of a sine-generated channel reach (see Eq. 34 for the theorical representation) at the different subcritical mean annual value states of width-depth ratio and Froude number using the model introduced above.
Table 1 shows the details of the initial scenarios of channels.
where
is the maximum deflection angle,
is the streamwise wavelength in the sine-generated meandering channel.
3.1.1. Spatio-Temporal Evolution
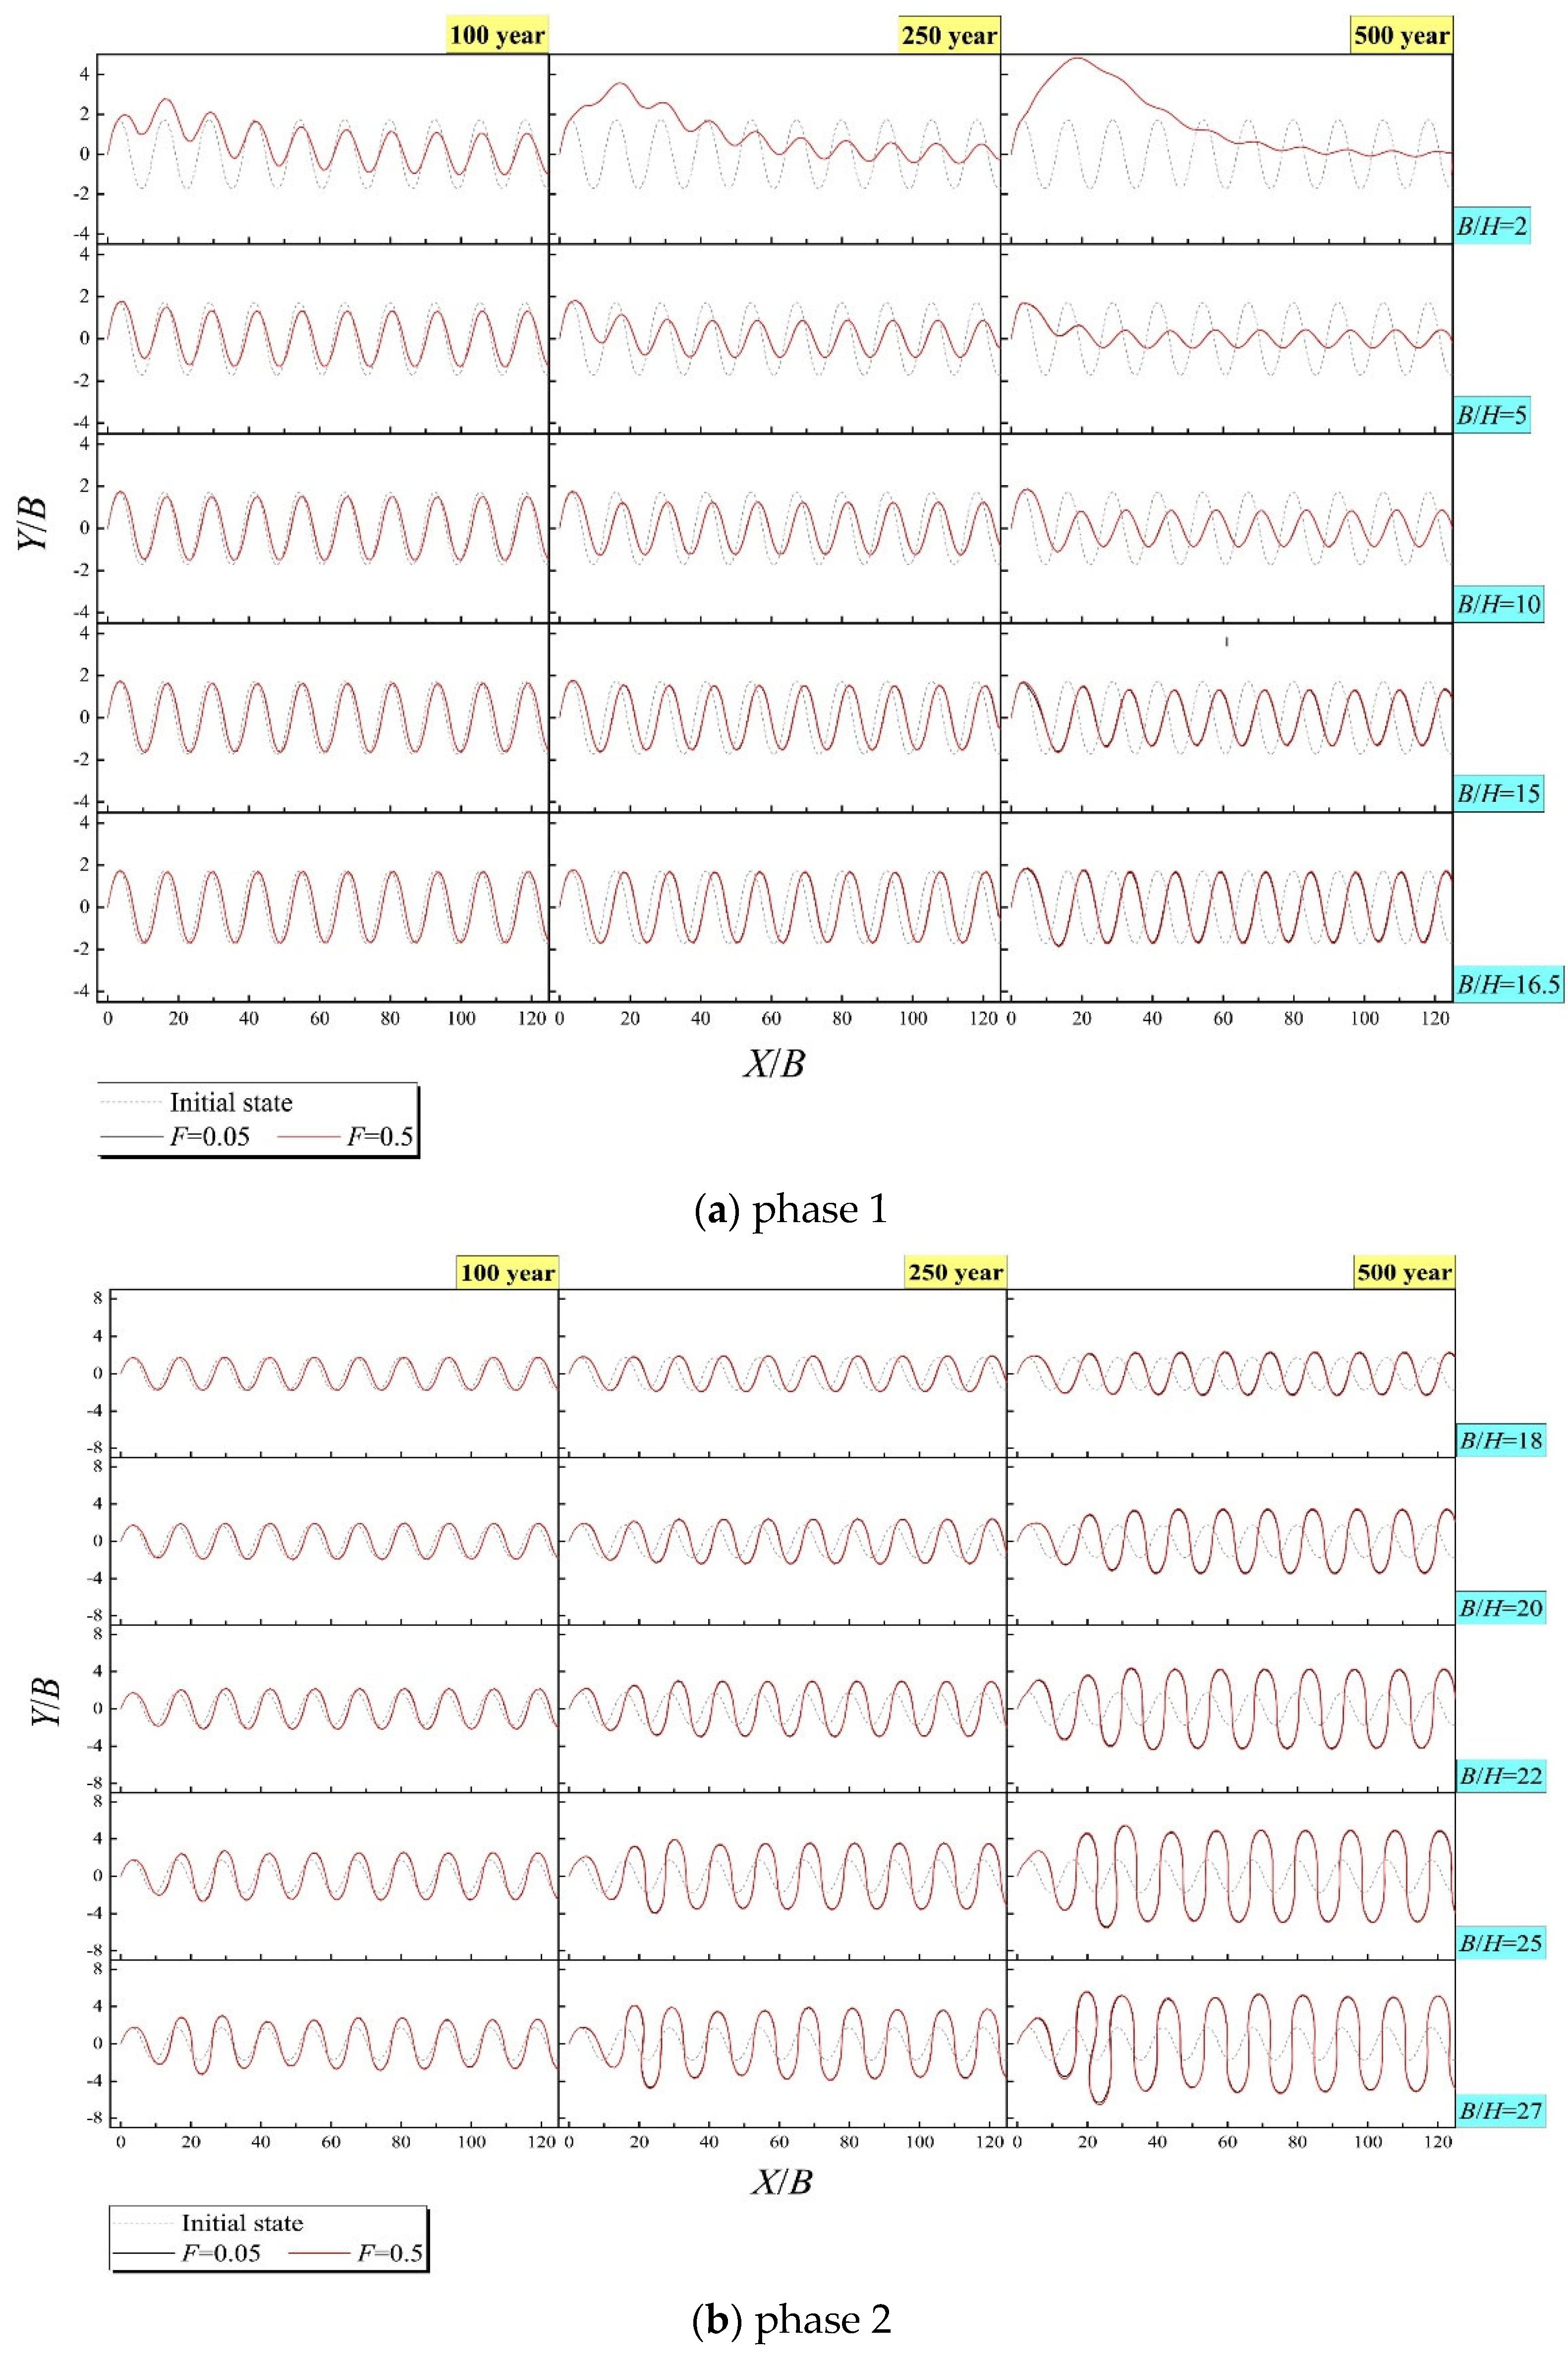
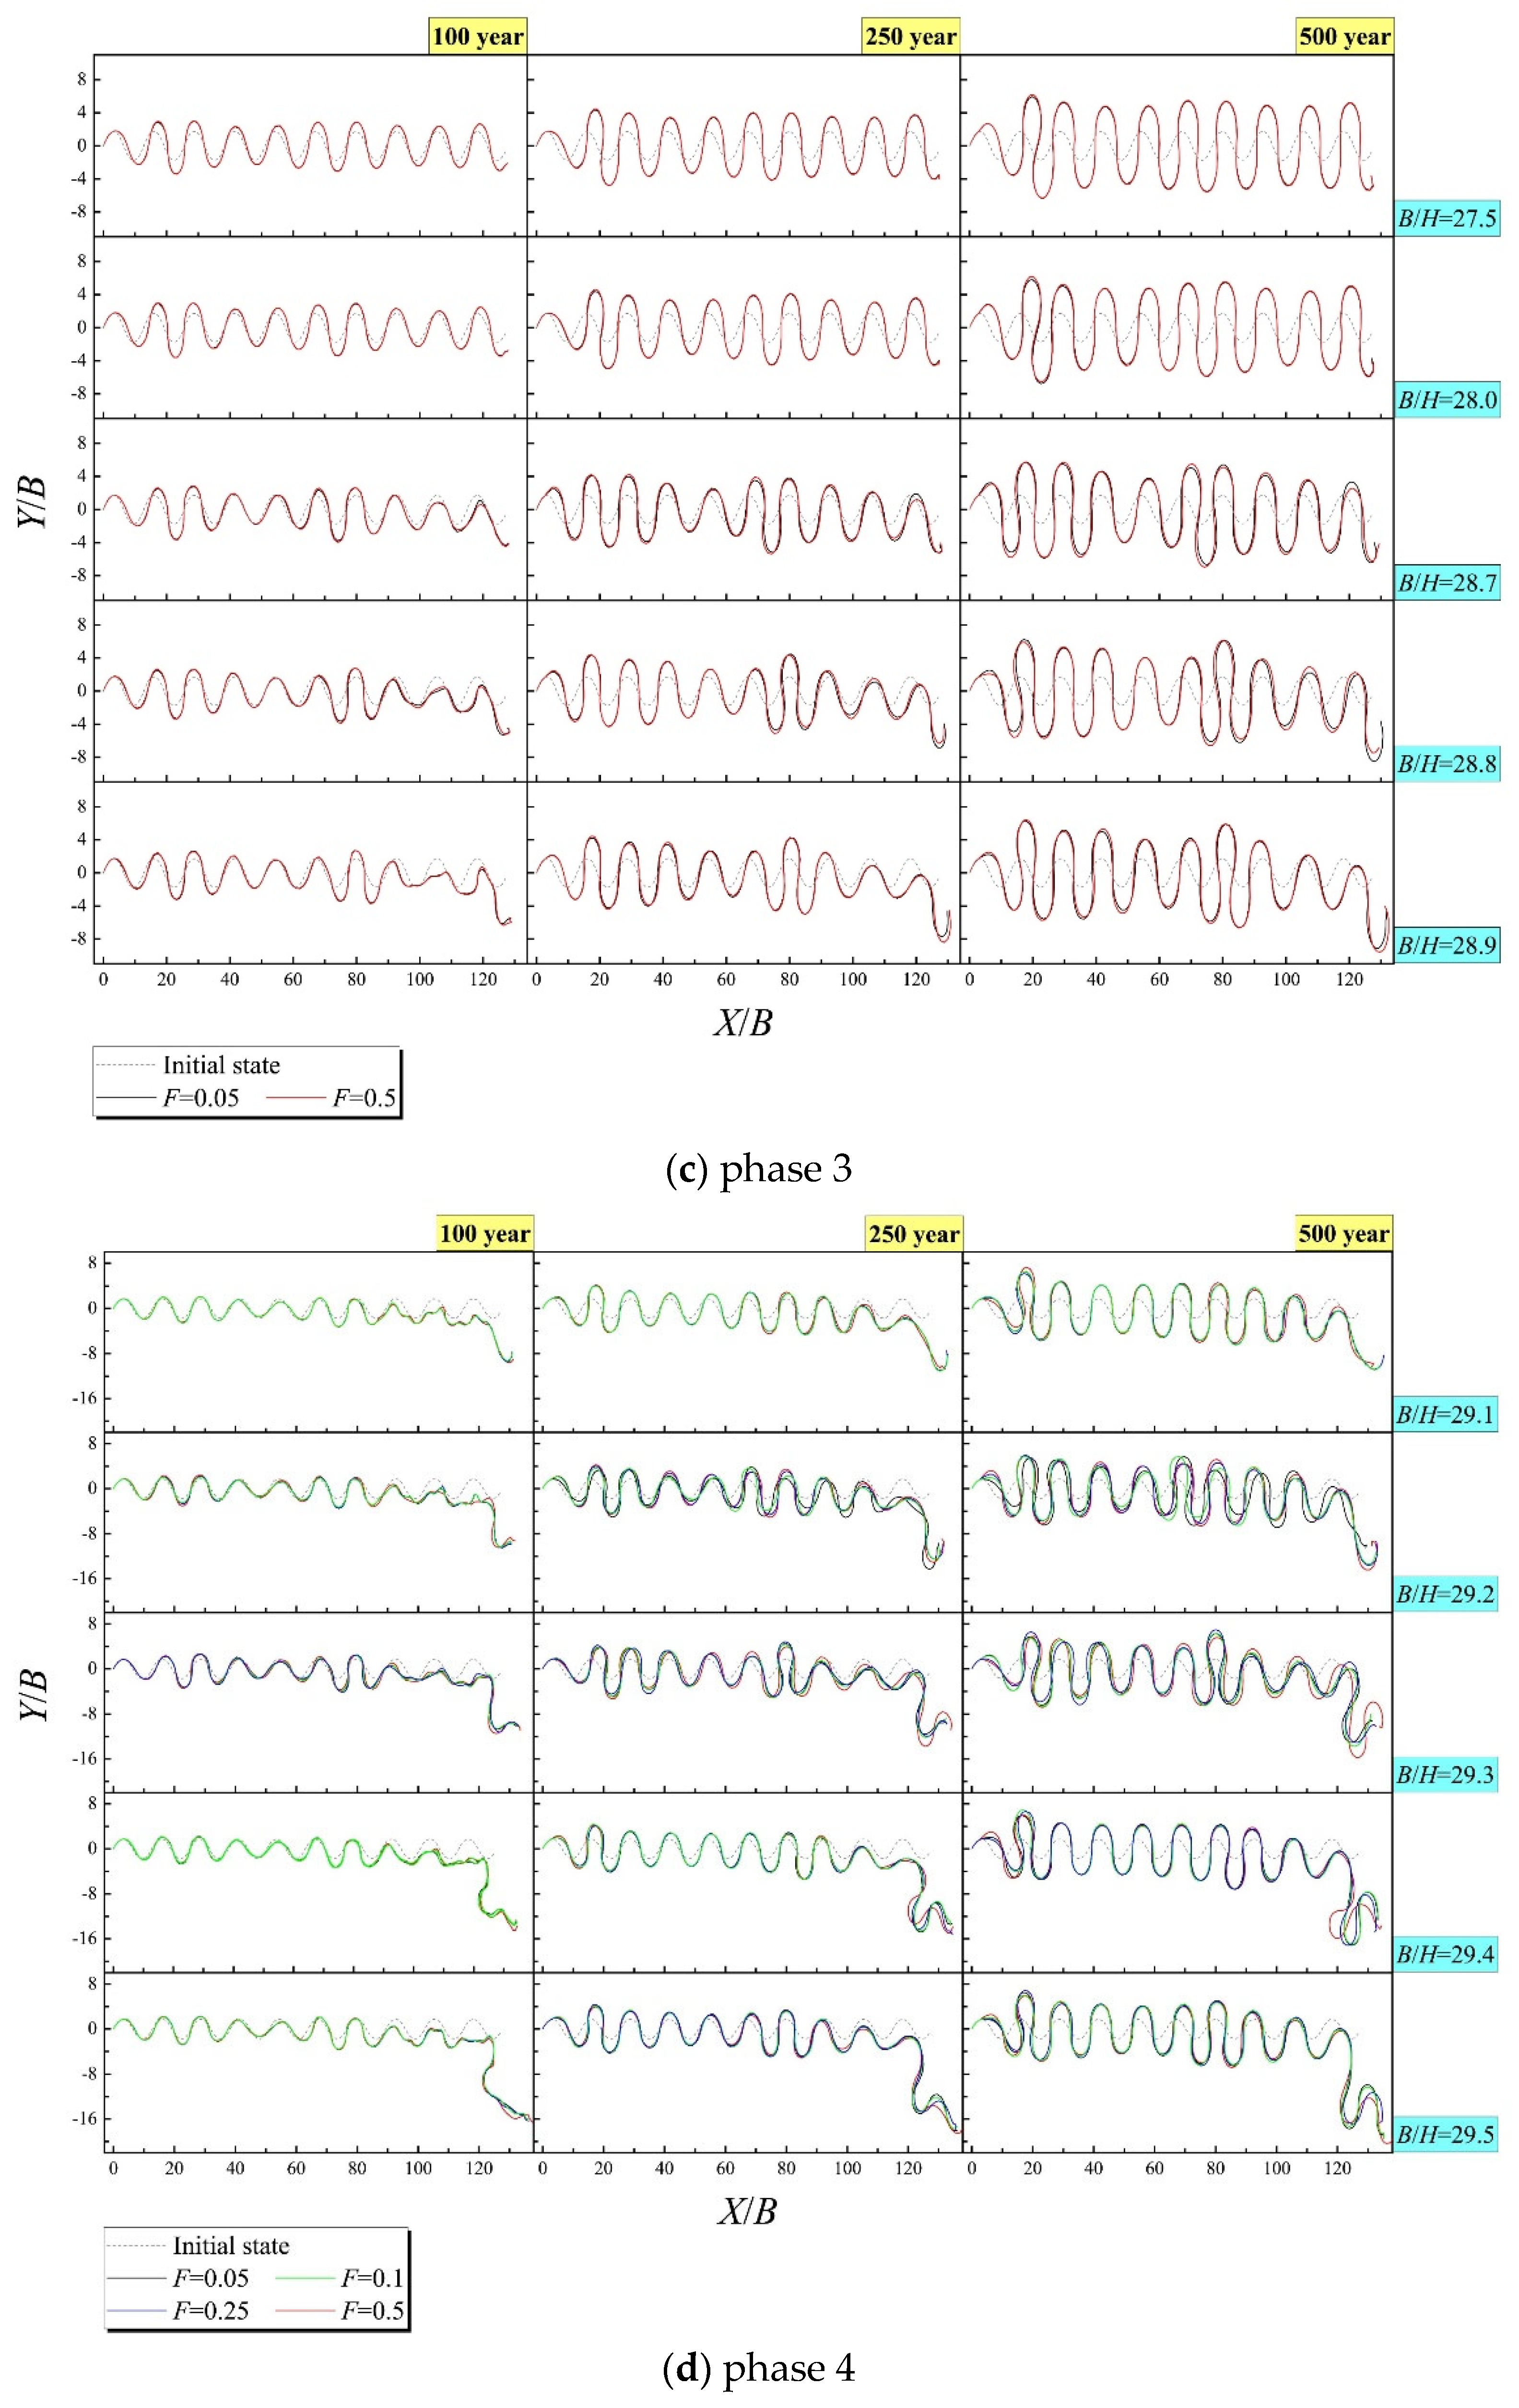
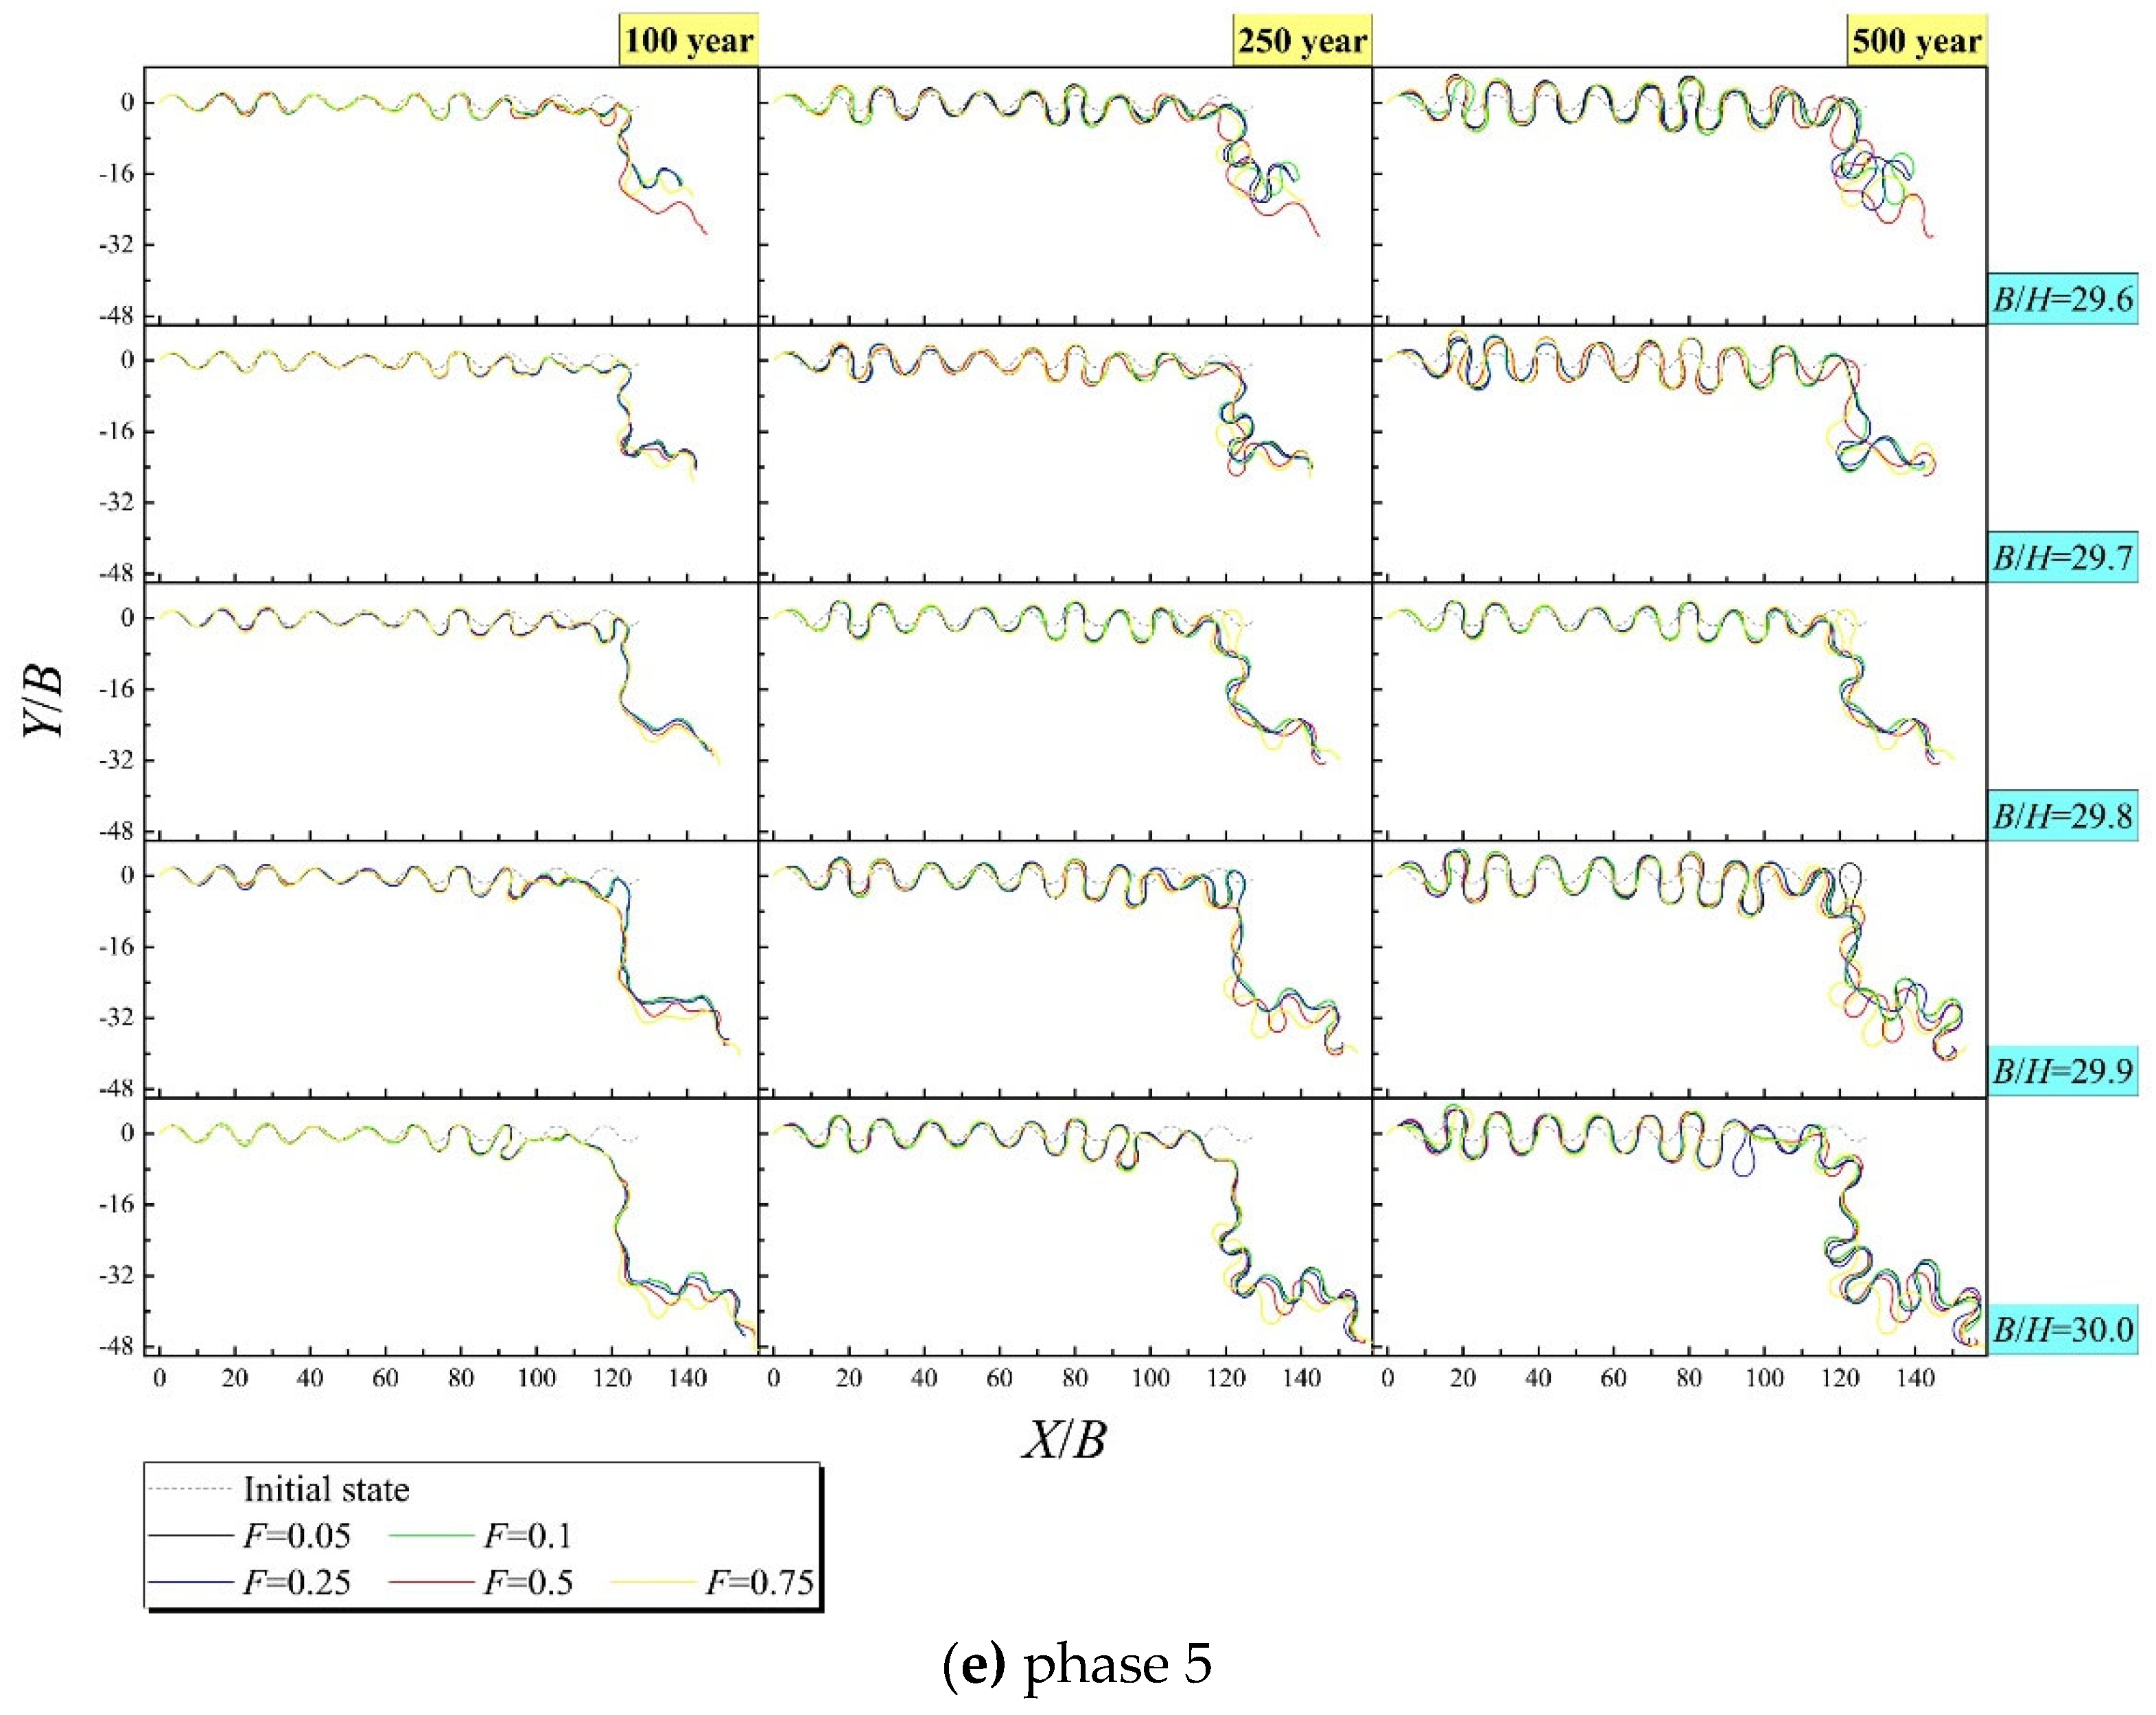
Figure 2 shows a variety of nondimensionalized calculation results of the channel centerline through 500 years of evolution. Some phase characteristics through comparison are given below.
In phase 1 (
Figure 2a), relative to the initial geometric state, no matter what the mean annual discharge, the long-term trend of wave centerline was to be weakening in average amplitude along the flow average path and the degree of that weakening was negatively correlated with the mean annual value of
B/
H. But the upstream reach would significantly deviate towards left in flow average path when the channel was quite narrow deep (see the case of
B/
H=2).
In phase 2 (
Figure 2b), the long-term trend of wave centerline turned to be intensifying in average amplitude along the flow average path and the degree of that intensifying became positively correlated with the mean annual value of
B/
H. The wave form always kept the approximative symmetry in transverse direction perpendicular to the flow average path. Still, the mean annual discharge had little effects.
In phase 3 (
Figure 2c), the long-term trend of the centerline was still intensifying in average amplitude along the flow average path, yet the wave form became asymmetrical and meantime its sensitivity to flow discharge was gradually highlighted, starting from the most downstream reach when the mean annual
B/
H was larger than an approximately critical value of 28.0.
In phase 4 (
Figure 2d) and phase 5 (
Figure 2e), similarly and continuously, the long-term trend of the centerline was always the intensification of average amplitude along the flow average path; the larger value state
B/
H was at, the more remarkably the downstream reach swung right, and the local response sensitivity to flow grew spurt when there appeared the concurrences of the mean annual indicators of
B/
H exceeding 29.3 and
F approaching (in phase 4) or exceeding (in phase 5) 0.5; in particular, the development sensitivity responding to flow was raised abruptly at the tiny value state of
F (around 0.05) when the selected constant
B/
H come close to such critical value of 29.3 in phase 4.
3.1.2. Parametric Variation
During each calculation case, we gathered temporal statistics of different group levels of the ratio of curvature radius to channel width (
r/
B), and their relative frequency (
f) and average migration rate (
K) in the channel. Herein, a composite curvature ratio indicator-(
rw/
B) was calculated by averaging the weighted
f of each group level based on multi-peak Gauss fitting results between
r/
B and
f, and another composite migration rate indicator-(
Kw) was obtained by averaging the weighted
r/
B of each group level based on multi-peak Gauss fitting results between
K and
r/
B, respectively. See
Figure 3 for the latter multi-peak-type variable relationship as an example, through which the composite indicator-(
Kw) can be represented as:
where
n is the number of decomposed single-peak Gauss curves,
σi and
Hki represent the half-breadth and height indicator of the
i-th single-peak curve, respectively.
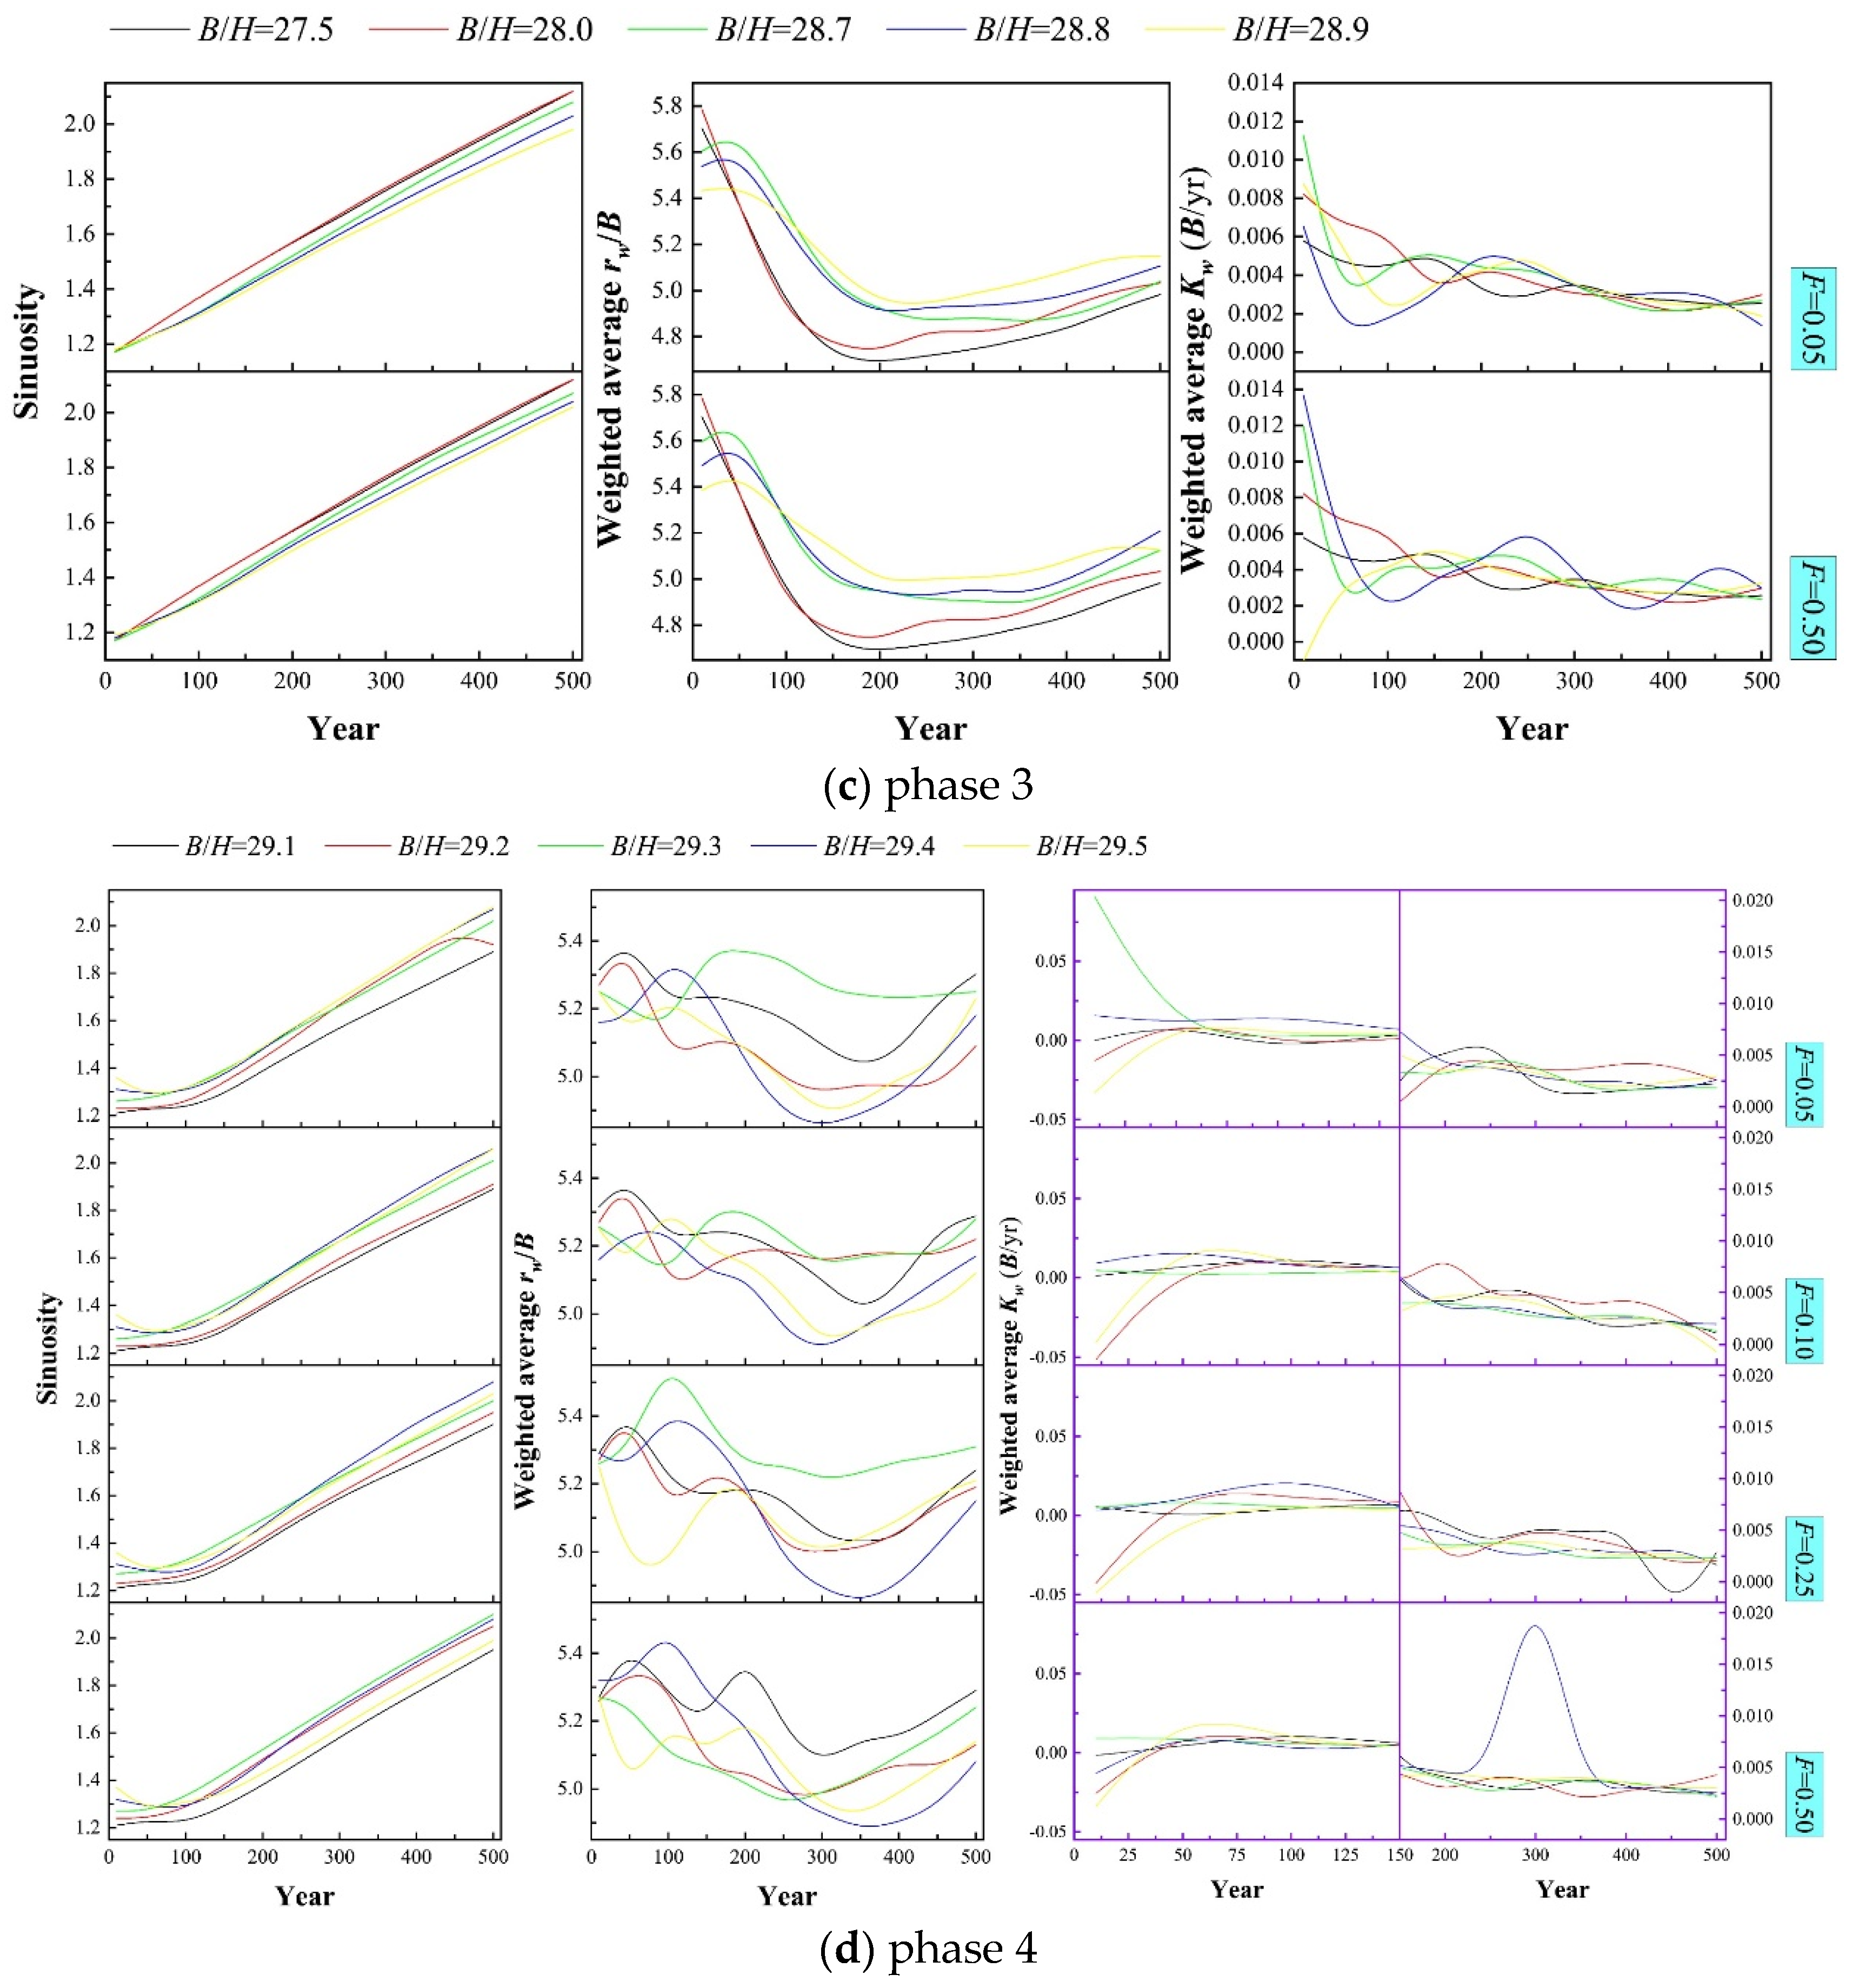
Figure 4 shows the long-term variations in characteristic parameters of the sine-generated channel Runs-1, including the well-known indicator of sinuosity, and the above two customized composite indicators of curvature ratio (
rw/
B) and migration rate (
Kw). Along with the morphological evolutions of centerline as described in section 3.1.1, it followed that:
In phase 1 (
Figure 4a), as the mean annual value of
B/
H became larger, the long-term trends were to be decreasing in positive (time-dependent-) slope for sinuosity, to be increasing in negative slope for indicator-(
rw/
B), and to be rising from negative form to positive form with fluctuation in slope for indicator-(
Kw). The whole developing trend was consistent with the so-called meandering straightness mode (Nagata et al., 2000) in this phase.
In phase 2 (
Figure 4b), continued with the phase 1, the long-term parametric trends turned to be decreasing in negative slope for sinuosity, to be increasing in positive slope for indicator-(
rw/
B), and to be rising with fluctuation in the overall form of positive slope for indicator-(
Kw). The whole trend followed the meander developing mode (Nagata et al., 2000). Especially noteworthy is that these change trends slowed down when the mean annual
B/
H exceeded 25.
In phase 3 (
Figure 4c), all reversing again starting from the critical mean annual value of
B/
H=28.0 for both two flow cases, the long-term trends were to be increasing in negative slope for sinuosity, to be decreasing in positive slope for indicator-(
rw/
B), and to be decreasing in positive slope for indicator-(
Kw) in general. The flow discharge condition accompanied to affect the indicator-(
Kw) obviously. And there always existed a local minimum for indicator-(
rw/
B) around the 200-year moment in theses meander developing phases.
In phase 4 (
Figure 4d), there appeared an early stable period before the critical 100-year moment in the temporal variation of sinuosity, the more frequent overall fluctuation and the disappearance of the above local minimum (200-year) moment in the temporal variation of indicator-(
rw/
B), and the more significant sensitivity responding to flow in the temporal variation of indicator-(
Kw). Also, when the mean annual values of
B/
H crossed 29.3 and
F approached 0.5, the sensitivities of long-term trend of indicator-(
rw/
B) and indicator-(
Kw) to flow were highlighted by the sharp drop of green line of the former and the sharp rise of blue line of the latter at
F=0.50 in comparison with the above respectively. Henceforward the channel system became more chaotic, the deterministic laws are difficult to be acquired straightforwardly.
3.2. Natural Meandering River
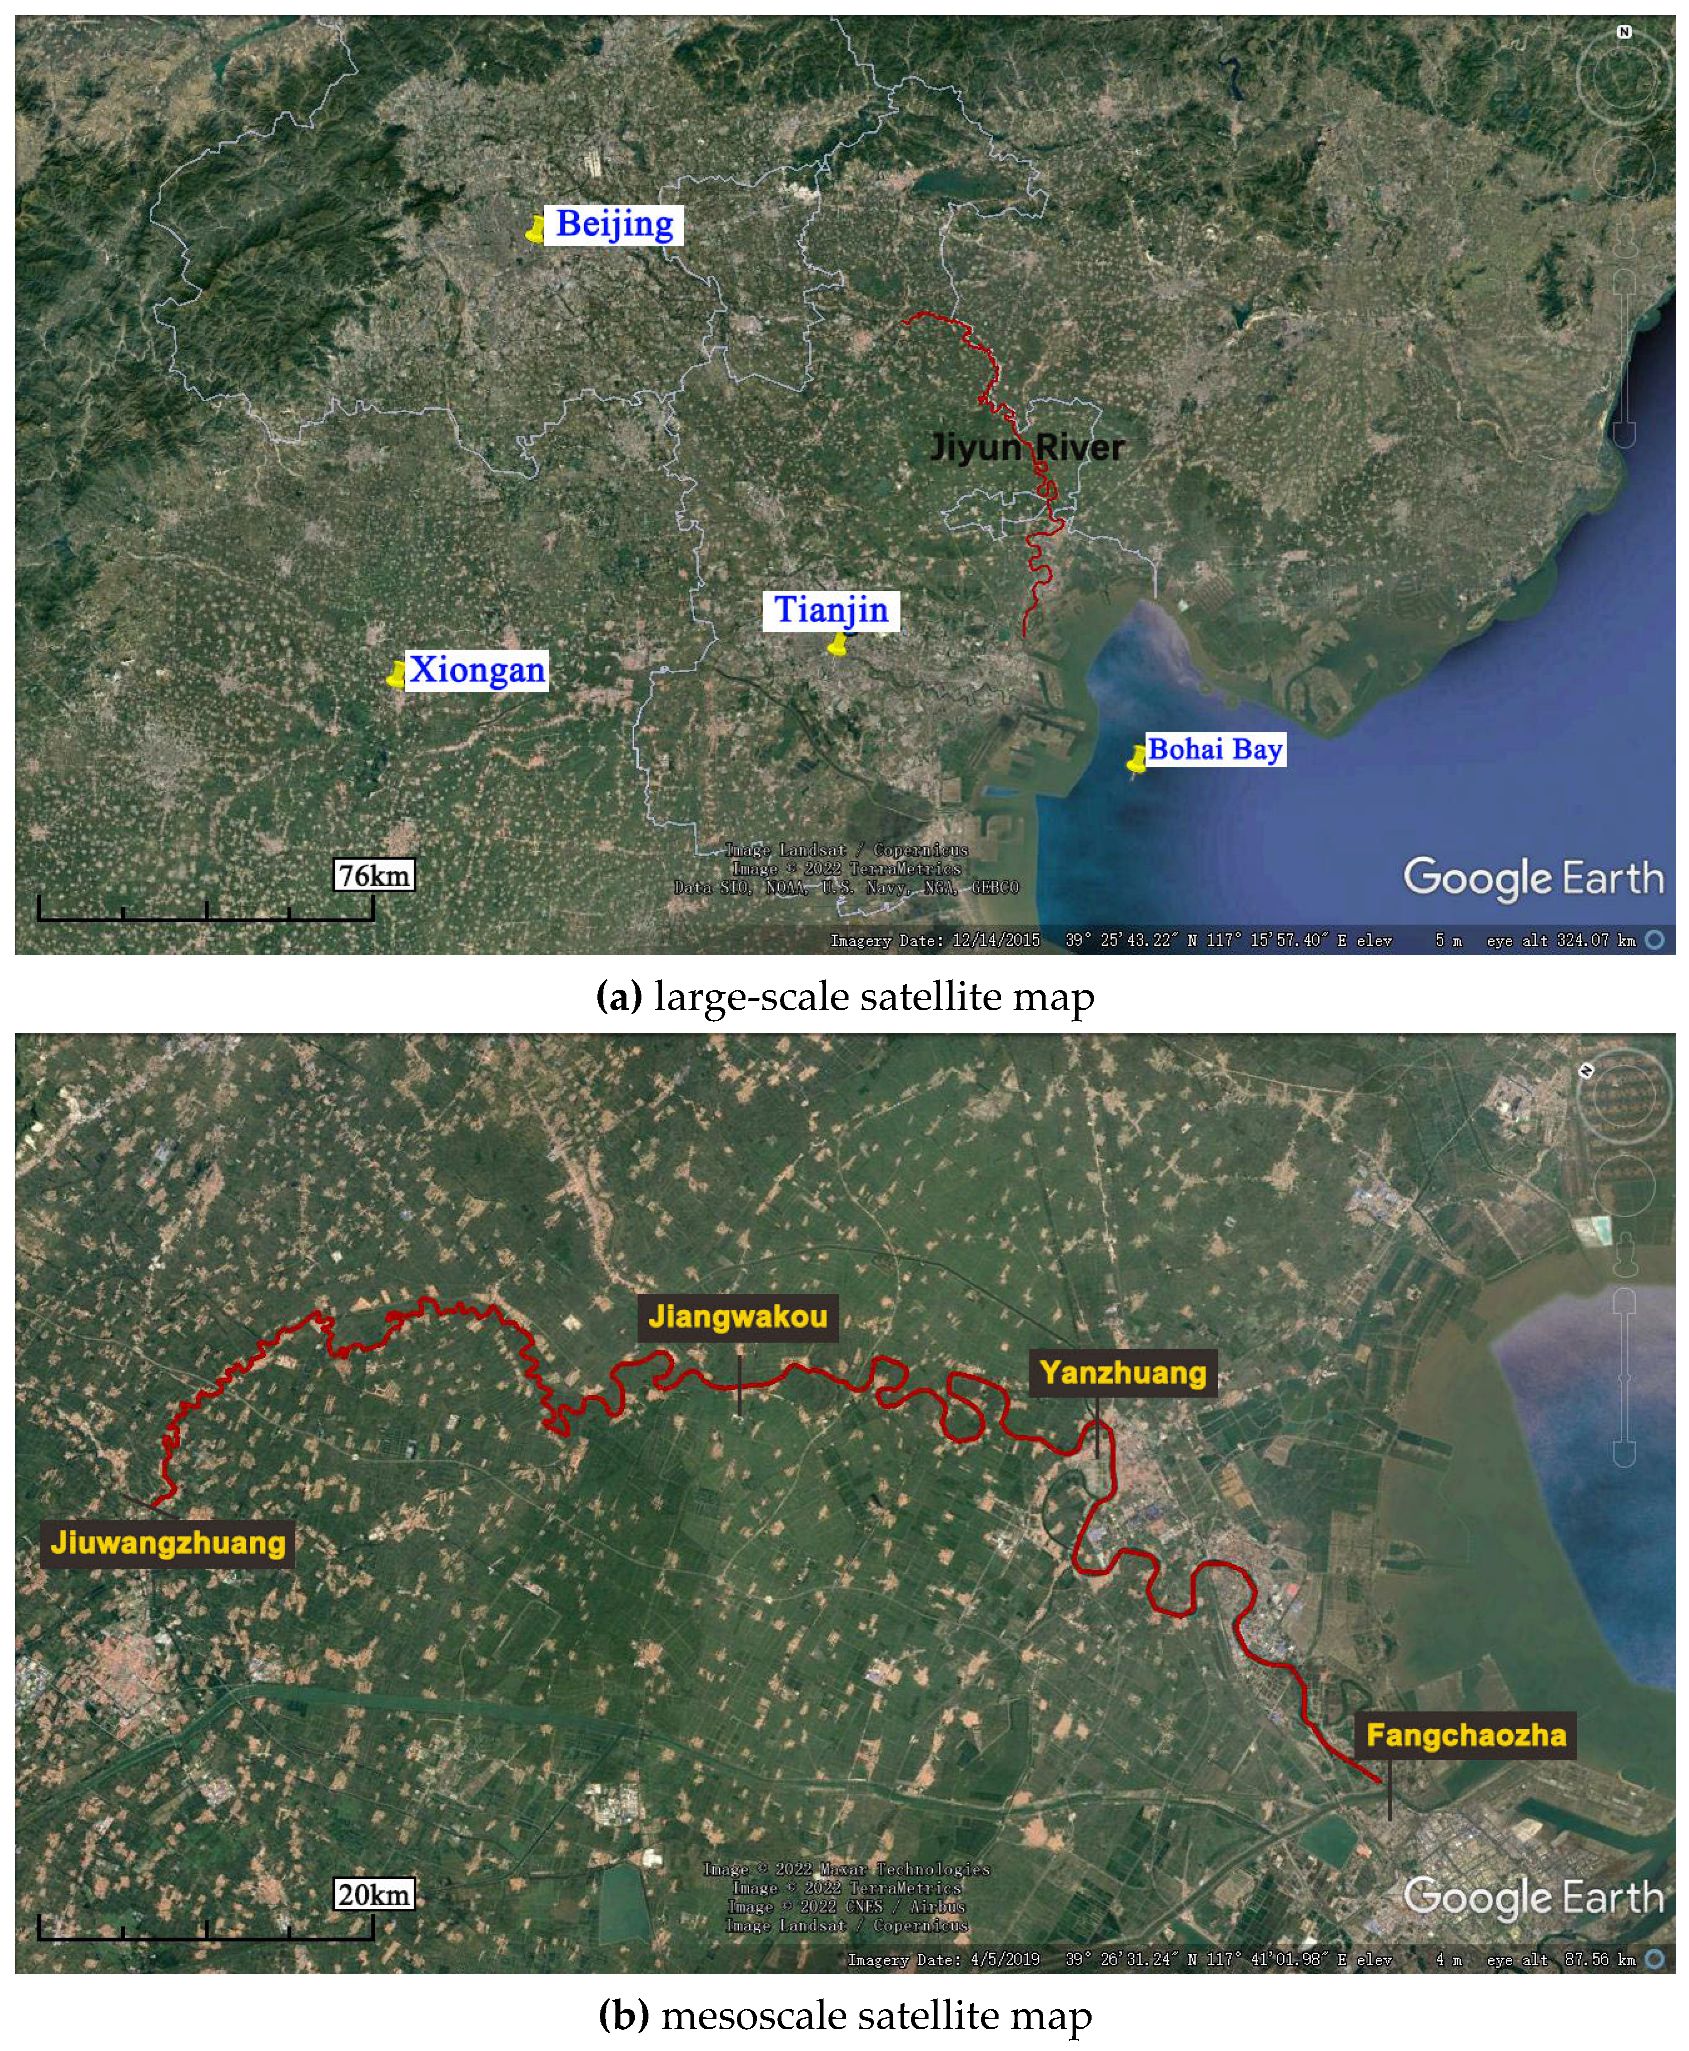
The Jiyun River is one of main rivers in Haihe River Basin within the Beijing-Tianjin-Xiongan region of China, a typical meandering river, as shown in
Figure 5. It has a well-preserved riparian ecological system that guaranteed a steady uniform vegetation cover along the river. The upstream reach (Jiuwangzhuang – Jiangwakou reach) and middle reach (Jiangwakou – Yanzhuang reach) are designed to be used as the local development and utilization zone, the downstream reach (Yanzhuang – Fangchaozha station) is slated to be the flood-discharging zone; the designed discharge of the former zone ranges from 400 to 550 m
3/s, while the latter one can reach 1300 m
3/s in maximum. Based on the overall stability of riparian environment resistances and mean annual geometric characteristics of the river in history, we designed a series of numerical evolution tests under the different level of mean annual discharge conditions at subcritical flow, with consideration of no intense human impacts but climatic change impacts on future runoff.
Table 2 shows the details of the initial scenarios of Jiyun River.
The initial geometrical state of Jiyun River was inferred to approximatively match with the evolutionary state of the previous sine-generated meandering channel that possesses the similar mean annual value of
B/
H through the 800-years’ evolution, based on the possible extension of green sinuosity-curve in
Figure 4(b) and the interpolation of the sinuosity of 2.2 here. And due to its greater environmental resistances than Runs-1, we simulated a longer-term evolution process of Jiyun River for 1000 years and recorded the chute cutoffs according to Howard (1992).
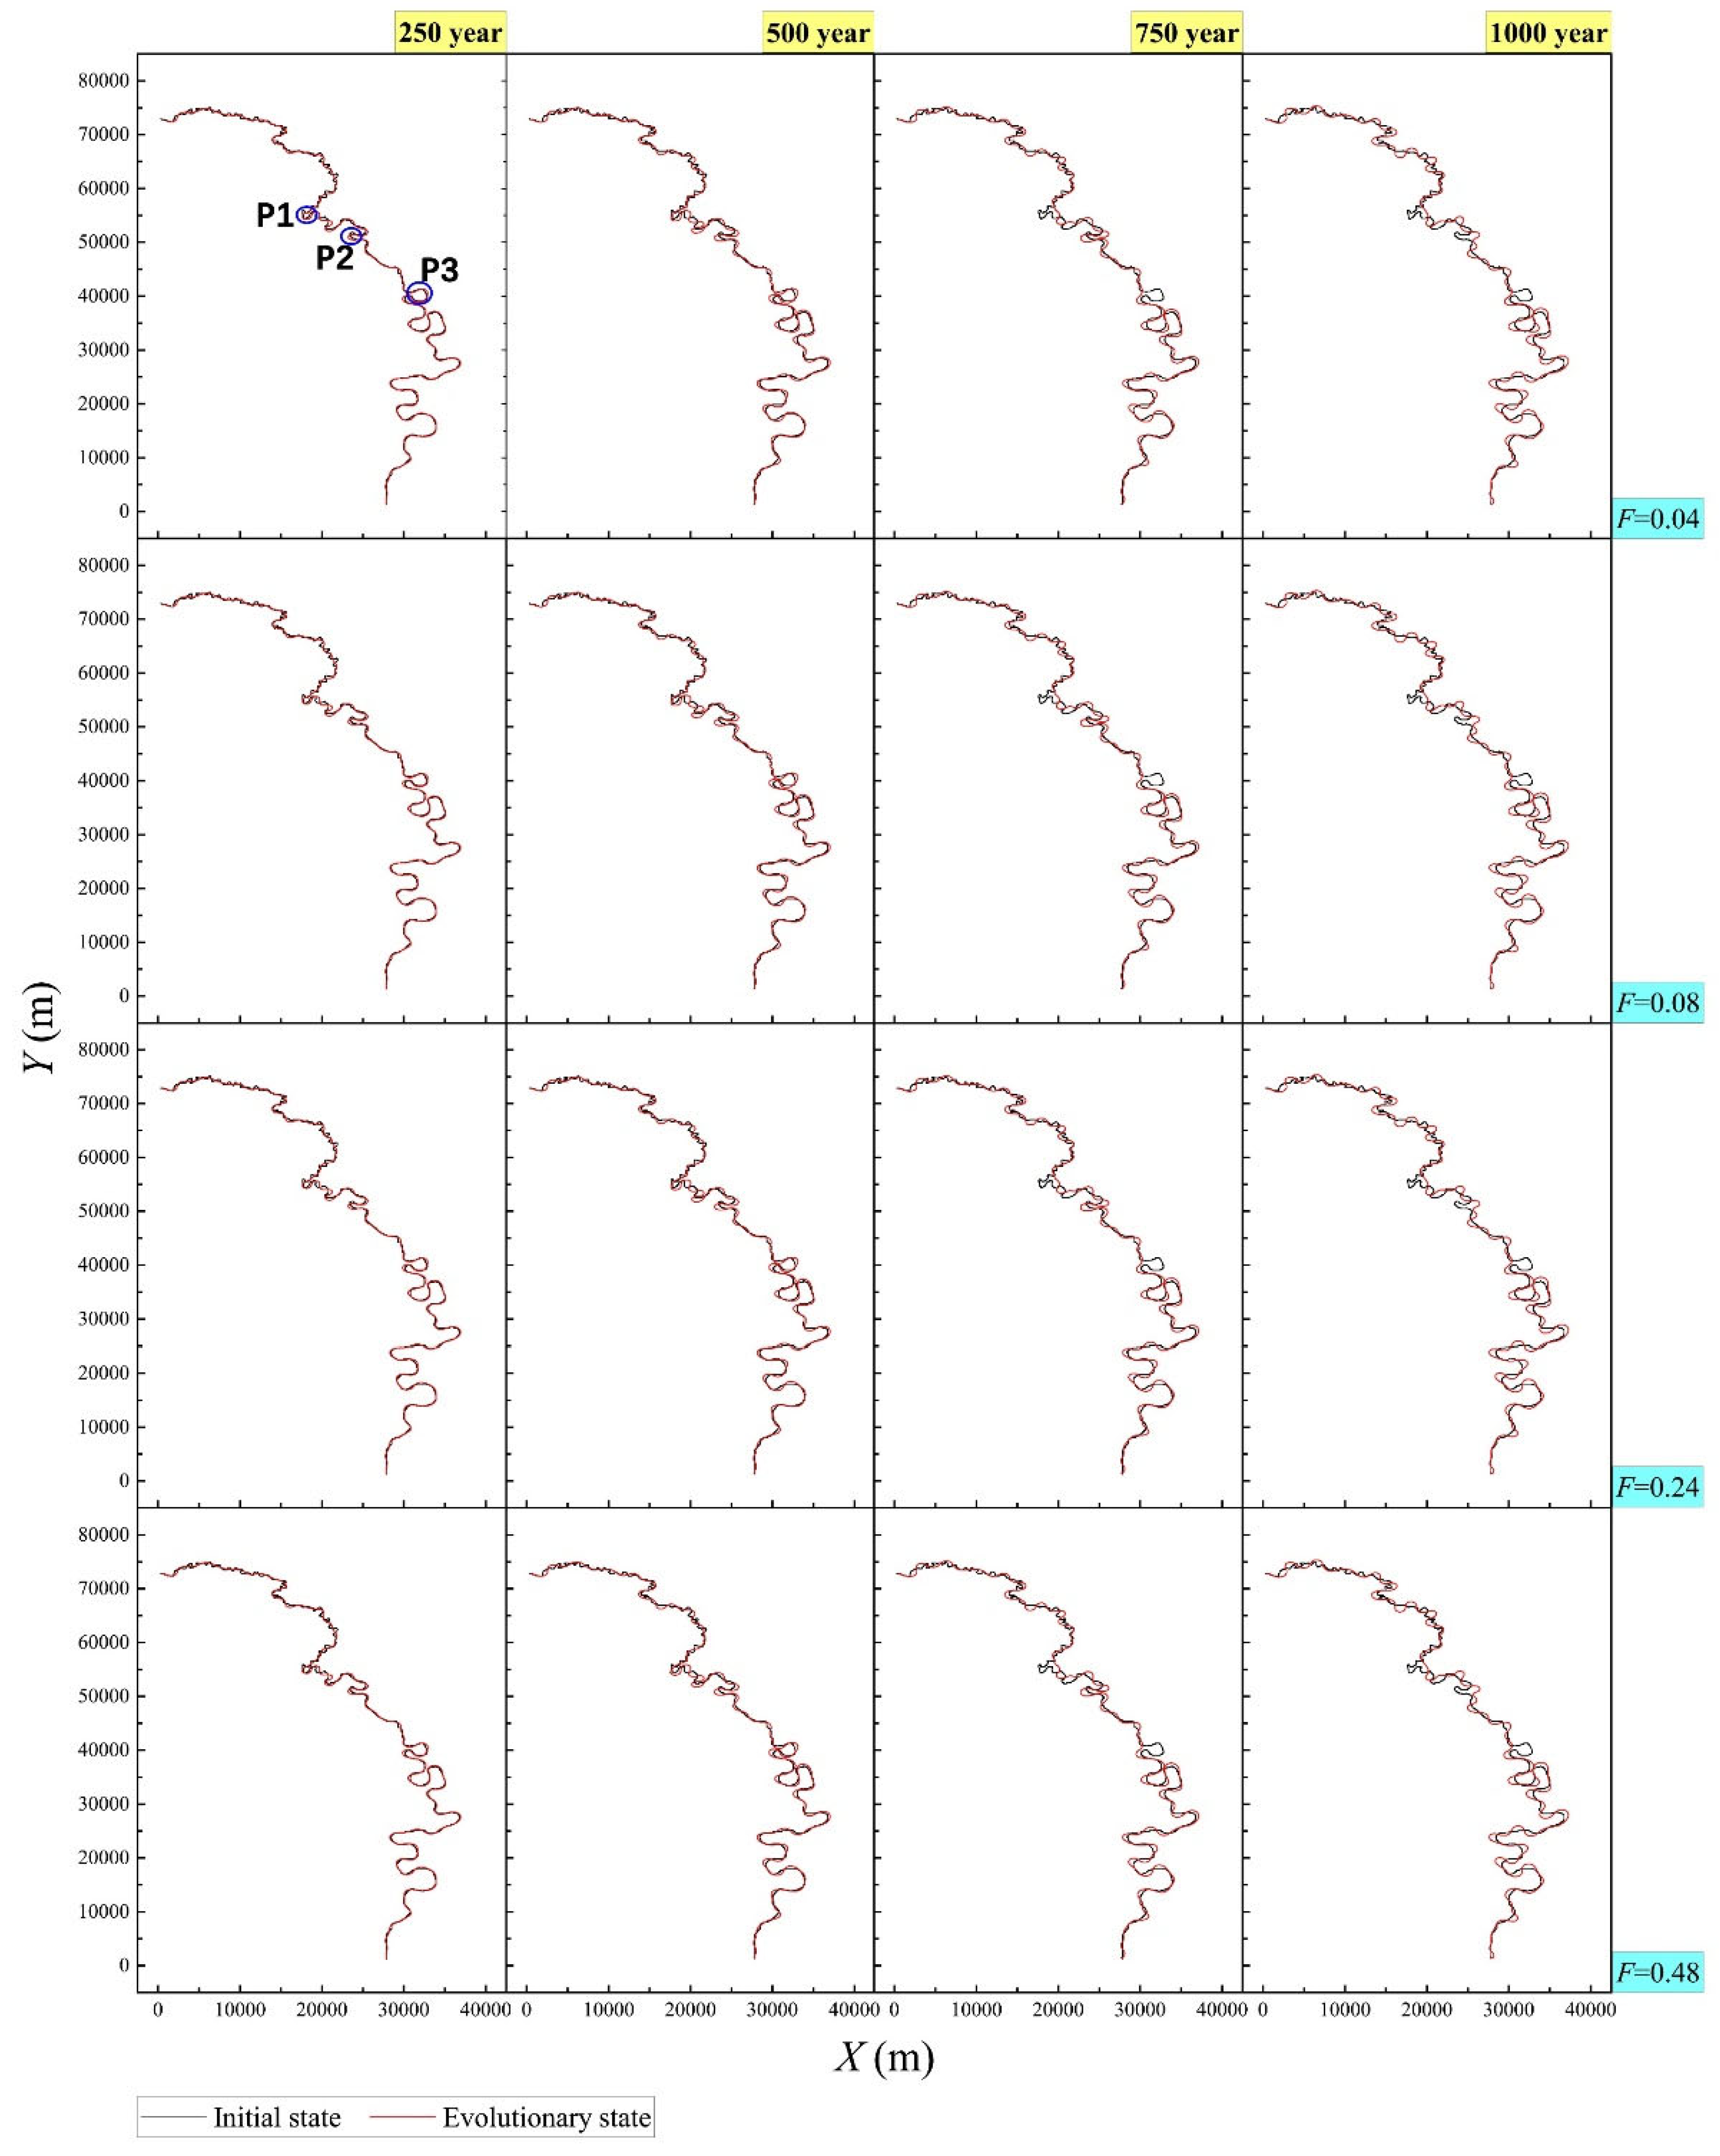
Figure 6 displays the spatio-temporal evolution processes of centerline of Jiyun River under the different mean annual flow conditions, which included the mean case of the group of upper-middle-lower designed discharges (Fr=0.04), the maximum designed discharge case (Fr=0.08), the threefold maximum designed discharge case (Fr=0.24), and the sixfold maximum designed discharge case (Fr=0.48) altogether. The results show that the long-term trend of this river was extremely insensitive to the mean annual flow magnitude, which was consistent with the previously fundamental analysis of sine-generated meandering channel in the classified phase 2. And, this river certainly would undergo the meander cut-offs in the P1 & P3 circle zones after 500~750 years of evolution and the P2 circle zone after 750 years of evolution respectively, near the Jiangwakou station. During such critically historical processes, see
Figure 7 for the time-varying performances of selected characteristic parameters driven by
F=0.08 as an example, it is worth noting that:
(1) In the first 500 years, sinuosity dropped to the trough during the periods between 50 and 100-year moment and then had fully-continuous development at a constant speed, like the phase 4 of the previous sine-generated meander development, merely starting at a relatively higher sinuosity value here; the indicator-(rw/B) had been rising continuously until the critical 200-year moment and then decreased slowly, which differed much from the curve forms of the previous sine-generated meander under the conditions of the significantly larger initial curvature ratio here; the indicator-(Kw) coincided with sinuosity in the general trend, yet its growth has been decelerating over time with fluctuations before the peak of the 500-year moment.
(2) During the transition of 500~750 years, in the meantime of channel cut-offs at the two neighboring curves of P1 circle zone (near the Jinchangzhuang village and Guanfengdui village in reality) and P3 circle zone (near the Ninghe town), both the sinuosity and indicator-(Kw) went through three sharp drops; the former shrunk only an average of 3% each drop, yet such value of the latter was enlarged to 75%. Comparatively, the indicator-(rw/B) changed little.
(3) After the 750 years, the chute cut-off at the P2 circle zone (near the Zhangtouwo village) brought the sharp drops in sinuosity and indicator-(Kw) once again, especially, sinuosity would always return to the same development speed after dropping like before the 500-year moment, in combination with the changing curve before and after the above three cut-offs (P1 & P3); and similarly, the indicator-(Kw) also would return to the wavelike rising state when without cut-off impacts; still, the indicator-(rw/B) maintained the stable changes.
4. Discussions
According to subject frontiers, at some great value states of mean annual width-depth ratio (B/H), meanders may turn into the multi-thread river pattern within the smooth external edges of the river floodplain in the mode of “introverted development” under the weakly resistant environments (Eaton et al., 2010) or evolve forward into the systematic out-branching river pattern in the mode of “extroverted development” under the strongly resistant environments (Song et al., 2022b; Song et al., 2022a), when the ratio of curvature radius to width (r/B) approximates the critical value of 3.0. If actual conditions are right to keep away from these two extremely branching trends, meanders can maintain stability in the following two temporal changing patterns in the planform: “meander straightening” or “meander developing”, as Nagata et al. (2000) classified. For the mechanisms of stable meandering evolution, there have been some studies exploring the characteristics of the neutral curve, the critical Reynolds number, and the response range of laminar flow to the disturbance of wave number in meandering channels based on Flow Stability Theories (Bai et al., 2012; Bai and Yang, 2011; Xu and Bai, 2015), while in which both the oversimplified assumption on the tiny width-depth ratio conditions and the limited focus on laminar flow instability have not been fully liberated until now. Continuing with their research logic, based on the most classical assumption of B/H >>1 in the J&P flow model, our numerical evaluation of the long-term trend in meandering channel centerline at different levels of mean annual width-depth ratio and flow discharge, opens up fresh-new space for research on stable river development mechanisms by asymptotical methods.
In terms of fully meandering state, herein, under the different value states of the selected mean annual
B/
H, the revelations of its various critical values in distinguishing temporal trend features of channel centerline at different phases have important practical significance. Based on phase 1, the meander straightening mode will be able to get more reasonable discussions in a rich range of
B/
H<16.5 with the traits of insensitivity responding to subcritical flow discharge, and especially this phenomenon is closely related to the loss of hydraulic complexity, which usually provides important riverine habitat for biodiversity protection in nature (Liao et al., 2003; Zhou and Endreny, 2020). In phases 2 and 3, the developing meander will successively encounter with the slowing down of increase of temporal rate of change in sinuosity when the selected constant
B/
H reached 25 from small to large, and the emergence of asymmetric disturbances starting from the downstream reach when the selected
B/
H reached 28; these can be verified by some parts of experiments without cut-offs (see
Figure 8 for the channel pattern evolution starting at
B/
H=20 by Van Dijk et al. (2012) as an example) and also can help to uncover key incomplete information that are difficult to be measured in reality. In phase 4, during the crossing process of the selected
B/
H at around 29.3, just like the transition from the laminar flow to the turbulent flow state, there continuously occurred the incipience (see the case of
B/
H=29.2 when
F=0.05 in
Figure 2d) and jumps (see the cases of
B/
H=29.3 and 29.4 when
F=0.5 in
Figure 2d and
Figure 4d) of the channel sensitivity to flow magnitude. After phase 4, there were more and more significant increase of chaos in the system, the model validity declined as well because meandering channel pattern may begin to evolve towards anabranching pattern in fact. It is presumed that flow stability theory will have great potential application for deeply exploring the intrinsic mechanisms of meander instability process within these scope of constant indicator
B/
H in the future (not surpassing phase 4).
Moreover, the complex effects of initial sinuosity and average curvature radius were highlighted in the Jiyun River case. The disturbance characteristics of mean annual flow discharge to channel system were still subject to the mean annual
B/
H, but the higher level of sinuosity and indicator-(
rw/
B) here contributed to the transcendence of the parametric behaviours compared with the previous sine-generated meander in the classified phase 4, as reflected in the same turning moment for sinuosity (around the 100-year moment) and the delayed extremum moment for indicator-(
rw/
B) (around the 200-year moment) respectively (see the comparison between the left and middle subfigures in both
Figure 4d and
Figure 7), despite the different bed friction factor and combinative erosion modulus in the two calculations. Every different sinuosity has its own convective flow pattern, and the bed geometry in an evolutionary state is strongly related to the convective behavior of the initially depth-averaged flow, according to da Silva Ana Maria et al. (2006); based on the max-deflection angle (Ω), the sine-generated meander of this study just belongs to the intermediate state between the ingoing (Ω≦30°) and outgoing (Ω≧70°) meanders as da Silva Ana Maria et al. (2006)’s categorization indicated, which reminds us of the need to improve the basic research part by taking more various initially idealized meanders into account in the following research.
5. Conclusions
In this study, numerical evaluation of long-term trend of channel centerline on a sine-generated meander (an intermediate meandering state between ingoing and outgoing channel patterns) and a typical natural meandering Jiyun River (in China) help to identify some special stage characteristics of meandering channel planform during the overall stable evolution at mean annual value states of width-depth ratio (B/H) and flow discharge. The main findings include:
(1) weakening trend of average amplitude in phase 1 (B/H≤16.5), or say, meander straightening trend, and its negative relationship with the selected constant B/H;
(2) strengthening trend of average amplitude after phase 1, or say, meander developing trend, and its positive relationship with the selected constant B/H;
(3) broken of symmetric development mode (along the transverse direction) with the inception of channel sensitivity to flow magnitude in phase 3 (B/H≤28.9);
(4) observable continuous process from highlighting to jumping for the channel sensitivity to flow magnitude, when the mean annual B/H approached a critical value of 29.3 from small to large in phase 4 (B/H≤29.5).
The maintenance of stable meandering evolution requires strict conditions which must be guaranteed to be far away from the too big or too small value states of mean annual B/H, therefore the full mechanism explanation on stable river developments by asymptotical methods will benefit enormously from the qualified parameter spaces provided herein, and in the longer term, will improve the riparian management effectively.
Acknowledgments
This research is supported by the Science and Technology Planning Program of Tianjin, China (Grant No. 21JCQNJC00480); the National Natural Science Foundation of China (Grant Nos. 51879182 and 51979185); the Independent Innovation Fund (Advanced Technology) Project of Tianjin University (Grant No. 220627).
References
- Bai, Y.C., Ji, Z.Q., Xu, H.J., 2012. Stability and self-adaption character of turbulence coherent structure in narrow-deep river bend. Science China Technological Sciences 55, 2990-2999. [CrossRef]
- Bai, Y.C., Yang, Y.H., 2011. The dynamic stability of the flow in a meander channel. Science China Technological Sciences 54, 931-940. [CrossRef]
- Bolla Pittaluga, M., Nobile, G., Seminara, G., 2009. A nonlinear model for river meandering. Water Resources Research 45. [CrossRef]
- Bridge, J.S., 1993. The interaction between channel geometry, water flow, sediment transport and deposition in braided rivers. Geological Society, London, Special Publications 75, 13-71. [CrossRef]
- Camporeale, C., Perona, P., Porporato, A., Ridolfi, L., 2007. Hierarchy of models for meandering rivers and related morphodynamic processes. Reviews of Geophysics 45. [CrossRef]
- Camporeale, C., Ridolfi, L., 2006. Convective nature of the planimetric instability in meandering river dynamics. Physical Review E 73, 026311. [CrossRef]
- Crosato, A., 2008. Analysis and modelling of river meandering. IOS press.
- da Silva Ana Maria, F., El-Tahawy, T., Tape William, D., 2006. Variation of Flow Pattern with Sinuosity in Sine-Generated Meandering Streams. Journal of Hydraulic Engineering 132, 1003-1014.
- Eaton, B., Millar, R.G., Davidson, S., 2010. Channel patterns: Braided, anabranching, and single-thread. Geomorphology 120, 353-364. [CrossRef]
- Engelund, F., 1974. Flow and Bed Topography in Channel Bends. Journal of the Hydraulic Division ASCE 100, 1631-1648.
- Hooke, J., 2003. River meander behaviour and instability: a framework for analysis. Transactions of the Institute of British Geographers 28, 238-253. [CrossRef]
- Howard, A.D., 1992. Modeling channel migration and floodplain sedimentation in meandering streams, in: Carling, P.A., Petts, G.E. (Ed.), Lowland Floodplain Rivers: Geomorphological Perspectives. John Wiley and Sons, Chichester, pp. 1-41.
- Howard, A.D., Knutson, T.R., 1984. Sufficient conditions for river meandering: A simulation approach. Water Resources Research 20, 1659-1667. [CrossRef]
- Ikeda, S., Parker, G., Sawai, K., 1981. Bend theory of river meanders. Part 1. Linear development. Journal of Fluid Mechanics 112, 363-377.
- Johannesson, H., Parker, G., 1989a. Velocity Redistribution in Meandering Rivers. Journal of Hydraulic Engineering 115, 1019-1039. [CrossRef]
- Johannesson, H., Parker, G., 1989b. Secondary Flow in Mildly Sinuous Channel. Journal of Hydraulic Engineering 115, 289-308. [CrossRef]
- Liao, J.C., Beal, D.N., Lauder, G.V., Triantafyllou, M.S., 2003. Fish exploiting vortices decrease muscle activity. Science 302, 1566-1569. [CrossRef]
- Matsubara, Y., Howard, A.D., 2014. Modeling planform evolution of a mud-dominated meandering river: Quinn River, Nevada, USA. Earth Surface Processes and Landforms 39, 1365-1377.
- Nagata, N., Hosoda, T., Muramoto, Y., 2000. Numerical Analysis of River Channel Processes with Bank Erosion. Journal of Hydraulic Engineering 126, 243-252. [CrossRef]
- Posner, A.J., Duan, J.G., 2012. Simulating river meandering processes using stochastic bank erosion coefficient. Geomorphology 163, 26-36. [CrossRef]
- Seminara, G., Tubino, M., 1992. Weakly nonlinear theory of regular meanders. Journal of Fluid Mechanics 244, 257-288. [CrossRef]
- Song, X.L., Bai, Y.C., 2015. A new empirical river pattern discriminant method based on flow resistance characteristics. Catena 135, 163-172. [CrossRef]
- Song, X.L., Huang, H., Chen, Y.J., Xu, H.J., Bai, Y.C., 2022b. Effective simulation of flow in a moderately curved bend with a single short branch to support the design optimization of river-branch–plant configurations. Engineering Applications of Computational Fluid Mechanics 16, 1420-1443. [CrossRef]
- Song, X.L., Xu, G.Q., Bai, Y.C., Xu, D., 2016. Experiments on the short-term development of sine-generated meandering rivers. Journal of Hydro-environment Research 11, 42-58. [CrossRef]
- Song, X.L., Xu, H.J., Bai, Y.C., 2022a. The systematic out-branching (Dragon style) rivers under the perspective of connection between river morphology and ecology. Ecohydrology & Hydrobiology 22, 505-510. [CrossRef]
- Song, X.L., Zhong, D.Y., Wang, G.Q., 2019. A study of the stochastic evolution of hydraulic geometry relationships. River Research and Applications 35, 867-880. [CrossRef]
- Song, X.L., Zhong, D.Y., Wang, G.Q., Li, X.N., 2020. Stochastic evolution of hydraulic geometry relations in the lower Yellow River of China under environmental uncertainties. International Journal of Sediment Research 35, 328-346. [CrossRef]
- Van Dijk, W., Van de Lageweg, W., Kleinhans, M., 2012. Experimental meandering river with chute cutoffs. Journal of Geophysical Research: Earth Surface 117.
- Xin, W., Xu, H., Bai, Y., 2018. River pattern discriminant method based on resistance parameter and activity indicators. Geomorphology 303, 210-228. [CrossRef]
- Xu, D., Bai, Y.C., Ma, J.M., Tan, Y., 2011. Numerical investigation of long-term planform dynamics and stability of river meandering on fluvial floodplains. Geomorphology 132, 195-207. [CrossRef]
- Xu, H.J., Bai, Y.C., 2015. Theoretical analyses on hydrodynamic instability in narrow deep river with variable curvature. Applied Mathematics and Mechanics 36, 1147-1168. [CrossRef]
- Zalewski, M., 2015. Ecohydrology and hydrologic engineering: regulation of hydrology-biota interactions for sustainability. Journal of Hydrologic Engineering 20, A4014012. [CrossRef]
- Zhou, T., Endreny, T., 2020. The straightening of a river meander leads to extensive losses in flow complexity and ecosystem services. Water 12, 1680. [CrossRef]
- Zolezzi, G., Luchi, R., Tubino, M., 2012. Modeling morphodynamic processes in meandering rivers with spatial width variations. Reviews of Geophysics 50. [CrossRef]
|
Disclaimer/Publisher’s Note: The statements, opinions and data contained in all publications are solely those of the individual author(s) and contributor(s) and not of MDPI and/or the editor(s). MDPI and/or the editor(s) disclaim responsibility for any injury to people or property resulting from any ideas, methods, instructions or products referred to in the content. |
© 2023 by the authors. Licensee MDPI, Basel, Switzerland. This article is an open access article distributed under the terms and conditions of the Creative Commons Attribution (CC BY) license (http://creativecommons.org/licenses/by/4.0/).
