1. Introduction
Sport climbing in the Combined Olympic Format (leading, bouldering, and speed climbing) debuted at the 2020 Tokyo Olympics, delayed to 2021 due to the Covid19 pandemic. At the 2024 Olympics in Paris, speed climbing will be a separate competition with two sets of medals, while the bouldering and lead competitions will be held as a new combined (duathlon) format event.
The climbing wall is constructed as a standard panel world record speed wall with a total height of 15.00 m with a continuous 5° overhang incline equipped with official speed timers and official master hold provided by the IFSC (International Federation of Sport Climbing) for 20 identical "red colour" handholds and 11 identical "red colour" footholds [
1]. To increase the attractiveness of the competition − during the Youth Olympic Games − Buenos Aires 2018, the three handholds (
Figure 1) numbers 7, 18, and 29: were different − "black" in colour with additional split timing [
2,
3]. During the IO in Tokyo, these holds of a different colour (black) were positioned elsewhere – hold numbers: 9, 19, and 29 (
Figure 1).
Before the Tokyo Olympics, the female world record was 6.964 s (Julia Kaplina, Russia, 2020). During the Tokyo Olympics Games Aleksandra Mirosław (Poland) improved the world record to 6.84 s. Interval times on the specified "black" hold were also presented [
4]. At the moment the world record is: women’s - 6.53 s (Aleksandra Mirosław, Poland) and men’s – 5.00 s (Kiromal Katibin, Indonesia) achieved in 2022 [
5].
2. Review
A review of the scientific literature in the field of kinematic analysis of athlete climbing performance identified several relevant reports in which climber performance was measured using video devices. The first report, by the team of Legreneur et al. [
6] included a kinematic analysis of climbing runs during the finals of the 2018 Youth Olympic Games in Rio de Janeiro. These authors, using video footage (Sony RX10 III camera, with a frame rate of 30 fps – frames per second), presented an analysis of BMC (Body Mass Centre) velocity changes in the following parts of the run: 1) the acceleration zone (holds nr 01−09), 2) from hold nr 09 to the first dyno (hold nr 18), 3) from hold nr 18 to the second dyno (hold nr 29), and 4) the final part of the road (
Figure 2).
These authors found differences between boys and girls in terms of total running time, times needed to reach holds 9, 18 and 29 and geometric entropy index. These authors (Legreneur et al. [
6]) also indicated that the efficiency of athletes may depend on the ability to limit lateral BMC movements, maintain high speeds during acceleration and minimize speed loss during acceleration after the dyno moves.
In the context of the development of this competition, it seems reasonable that the above analyses should be continued and extended in terms of the use of more accurate devices (higher fps) and in terms of quantitative movement parameters that can be helpful when analysing the qualitative parameters of a climber's time trial run. An analysis of the literature on this topic indicates a growing interest in developing effective methods to measure a climber's time running [
6,
7,
8,
9]. Different approaches are presented.
Another study, by Reveret et al. [
8], used two video recorders (with a sampling rate of 30 fps) attempted to analyse the climbing run in three dimensions (3D) by Direct Linear Transformation (DLT) [
8]. Legreneur et al. [
6] conducted a study of the changes in the level of mechanical energy generated by the hip joint during speed−climbing. A video recorder (frame rate 30 fps) was used as a measurement tool. These authors presented the changes of potential, kinetic, and total energy in the following parts of the route (but with customised holds numbering): part 1 - the start (holds nr 1−6), part 2 - the turn (holds nr 6−7), part 3 - the first acceleration phase (holds nr 7−13), part 4 - the first dyno (holds nr 13−16), part 5 - the second acceleration phase (holds nr 16−23), part 6 - the second dyno (holds nr 23−25), part 7 - the last three holds (holds nr 25−27), and part 8 - the finish (holds nr 27−28). F. Guo's et al. research team [
7] studying members of the Chinese national team also used a video recorder in assessing climbing speed. However, these authors did not report the video frame rate of the recorder. Voronov et al. [
9], when studying the climbers of the Russian national team, used a video recorder with a higher frame rate of 50 fps to assess climbing time.
The above considerations imply that video tools (various types of cameras) are important measurement tools in this discipline. The use of cameras can have research as well as a practical dimension. Verification of the results and their analysis, especially against the background of previous reports (based on video recorders), may open a new area of research in this discipline of climbing competition. It should be noted that for coaches of speed climbers, the device in the future may be a valuable tool to diagnose the level of kinematic parameters of the run and may also have applications in scientific research.
Furthermore, previous studies have tended to analyse the movement of athletes presenting a high sport level and with senior status (with the exception of the work by Legreneur et al [
6]). So, there is a lack of studies in which the subjects were players of youth sports categories.
Therefore, the aim of the present study is to attempt to analyse the time-climbers' runs performed under championship competition conditions in terms of previously studied quantitative parameters (entropy index) and to extend the scope of these parameters with new ones (e.g.: convex hull, the ratio of the horizontal component to the BMC total velocity - the climber has to avoid lateral movements), which may be useful for qualitative analyses of time-climbers' movement activities. The second aim of the study was to analyse the correlation of the parameters with running time, the aim of which may be to provide a theoretical rationale for sports training and further scientific research in this area.
There are projects like Dartfish[
10,
11], American The Beta Angel Project [
11], applications, and tools: open software Kinovea [
12] or V1 home software [
13] which are used in video analysis in climbing disputes, but our project aims to propose a dedicated accurate tool for video analysis.
Figure 1.
The standard format of foot and handholds with marked key points
Figure 1.
The standard format of foot and handholds with marked key points
The study was based on computer-automated analysis of video recordings. The obtained data were used to compare the tested methods of recording motor data. The method of measurement was "non−invasive", i.e., the athlete performed climbing activities without the direct participation of the researcher. Therefore, his/her motor activity during climbing was not disturbed by external factors (related to the measurement procedure), which enabled the collection of reliable research data (possible application under any conditions: during training and competition).
The implemented method of measurement: a video recording with a camera positioned at a short distance (10 m) from the wall. The analysis itself takes place after the run based on the video recording.
Motor data analysis consisted of measuring and interpreting the following variables, e.g.: speed of movement, power of movement, time of movement (climbing interceptions), time and intervals of the climbing run, recording and archiving the climbing run (path of movement of the body's centre of mass BMC also called Center of Gravity COG), recording and interpreting the kinematics of performative, and exploratory movements during climbing. The research material was recordings of competitors/climbers presenting a high level of sporting ability, all participants were members of the national team of the Polish Mountaineering Association PZA (member of International Federation of Sport Climbing IFSC).
3. Equipment selection and digital measurements methodology
Due to the hall, in which the gym wall is located, being used by athletes of other disciplines (like volleyball), the distance of 10 m was chosen and located on a tripod at a height of 1.7 m for ease of use, centred in front of the wall. The distance was measured using a laser distance meter Parkside H606276.
Recording of a climber requires a high number of frames and high image resolution, which affects the accuracy of the analysis. A high-speed RGB camera (like FLIR Blackfly S) allows one to make a recording of very high-speed videos (up to 170 fps), but at a middle of the range resolution (1280×1024), colour depth, and sensitivity. This type of video camera requires the use of additional strong light sources.
For the first tests, a Sony A7 III camera with a 35 mm full-frame CMOS sensor and a set of fixed focal length lenses were used. The camera allows one to record videos in Full-HD resolution and 100 fps. After the tests, video recorder − Sony A7 III (ILCE−7M3) [
14]with camera lens SIGMA Art 24mm F1.4 DG HSM [
15], was used for measurements:
Orange colour stickers (as well as kinesio/duck tape) were mounted to a harness and a T−shirt was chosen to identify reference points for video analysis (
Figure 2).
Figure 2.
Markers (two orange rectangles) and software detection (red cross)
Figure 2.
Markers (two orange rectangles) and software detection (red cross)
The marker was positioned closest to the centre of mass (gravity) BMC. Any other part of the body is uncharacteristic of running efficiency and rather serves to move the BMC as fast and as high as possible.
3. Video recording and parameters obtained from computer video analysis
Wall lighting influences the quality of the recorded video. Too much light on the wall with ceiling lamps (i.e., light from above the wall) causes overexposure of the recording.
The wall illumination was tested and it was concluded that the wall illumination for the recording equipment used should be approximately 375 lux under the climbing wall and 175 lux at the camera position. A Sonel LXP−2 (LP−1 probe) lux meter was used to determine sufficient illumination.
Thanks to the use of a camera with high sensitivity (ISO parameter) optical sensor, it is possible to record video materials with reduced lighting (lamp away from the wall). As a result, it obtains a more even illumination of the wall without reducing the quality of the collected data.
Figure 3.
Video data visualisation: BMC trajectory, maximum velocity (star), coloured velocity and area convex hull, (a) 5.96 s, (b) 22.42 s, (c) run with fault, (d) hypothetical ideal running line and area, (e) the analysed part of the course with potential "straightening" sites.
Figure 3.
Video data visualisation: BMC trajectory, maximum velocity (star), coloured velocity and area convex hull, (a) 5.96 s, (b) 22.42 s, (c) run with fault, (d) hypothetical ideal running line and area, (e) the analysed part of the course with potential "straightening" sites.
Initially, detection of an object (a climber with a marker attached to his climbing harness) was based on colour detection: conversion to greyscale, analysis in RGB (Red, Green, Blue) colour space, and HSV (Hue, Saturation, Value) colour space proved to be insufficient, not very accurate and did not allow for marker recognition in all frames of an image recorded at 100 fps. In the analysed cases, the recognition of round or rectangular objects in the image proved to be insufficient. It became necessary to use the geometric Kanade-Lucas-Tomasi (KLT) algorithm (with two markers) [
16]. The choice of marker size and colour also proved to be a problem. After troubleshooting an orange colour marker was finally chosen. One of the additional possible options in this type of task is to use the Kalman filter for object tracking.
The selected camera parameters were a frame rate 100 fps, file format of mp4, picture (frame) resolution of Full HD 1920 x 1080 pixels, and ISO depending on the illumination of the climbing wall (for example ISO 4000, F 3.4 s 1/250 for average illumination 375 lux under the climbing wall and 175 lux at the camera position).
To video analyse the parameters of the climbing run, a custom program was written in the Matlab (R2020b and 2022a) framework containing the following 2D parameters and functions:
automatic calculation of running time − detection of the start and end video frame,
automatic location of two reference markers (orange colour),
the trajectory of the centre of mass (gravity) BMC (drawn on the picture) with the marker located on the climbing harness,
analysis of positions BMC x(t) (
Figure 7 ) and y(t), de−noising information (smoothening), and averaging, i.e., every 10 frames (0.1 s),
total length of marker (BMC) trajectory ,
total and two−axis component velocity: , , and ,
set picture the total speed of the marker at a given point,
maximum and minimum climbing velocity: , ,
colour marking of the running route with different velocities,
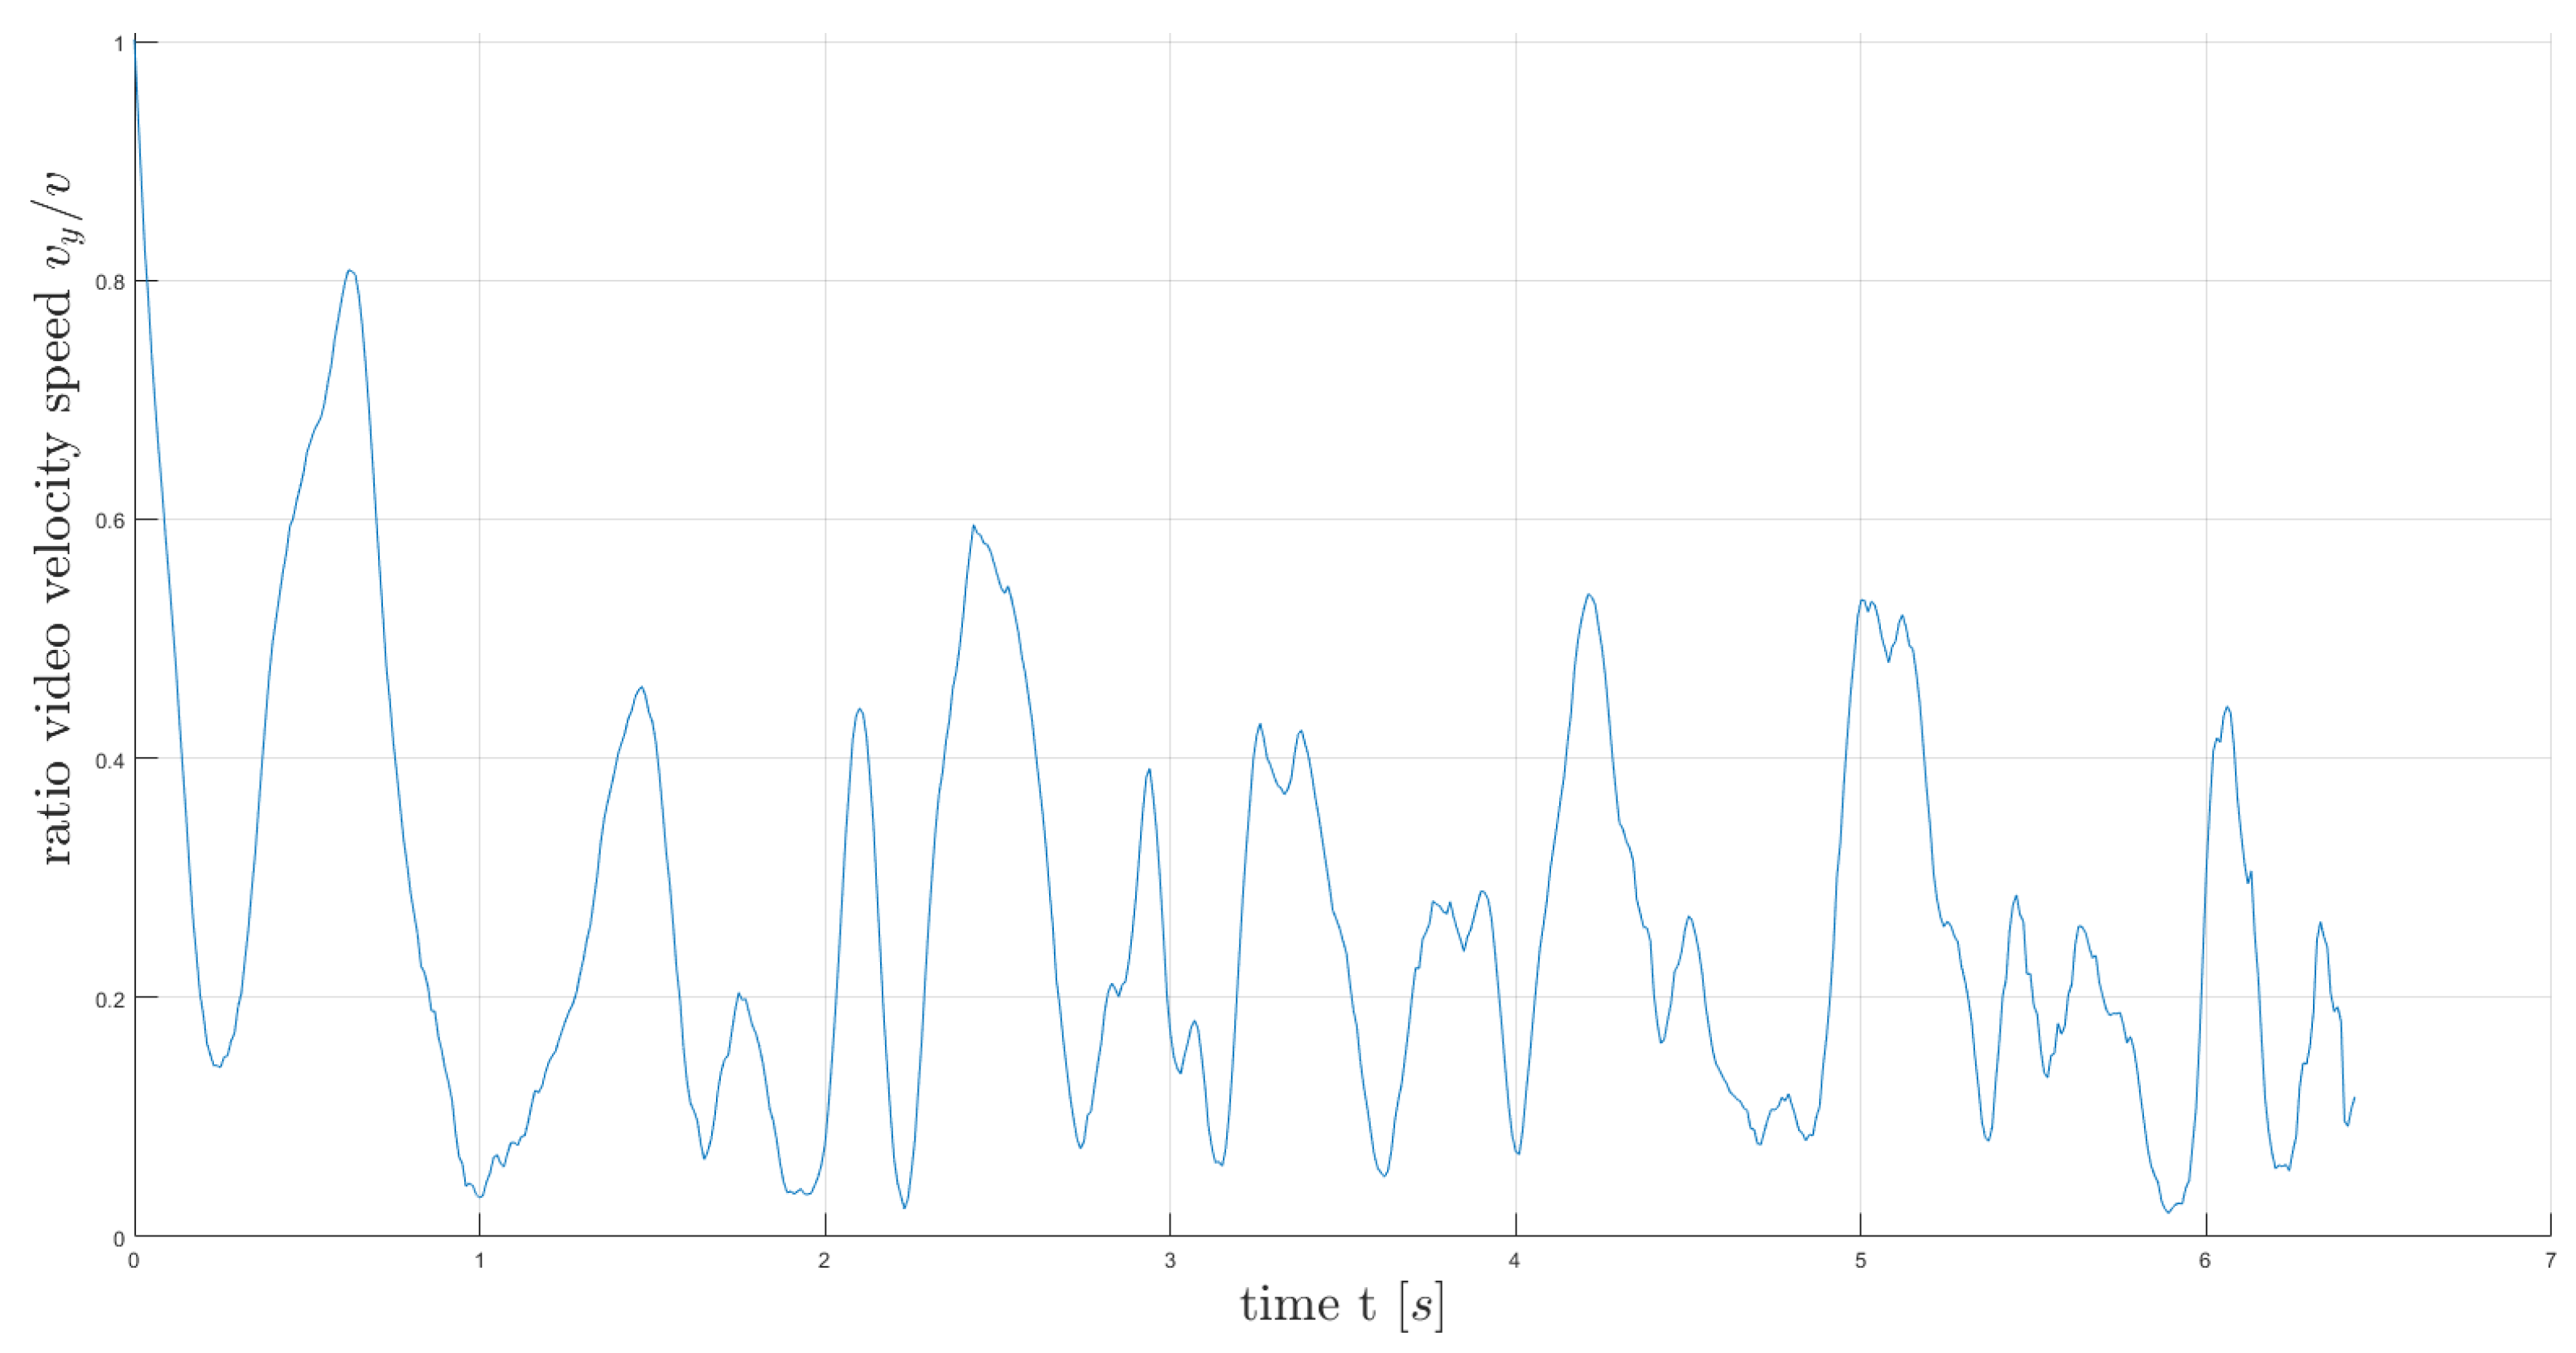
the ratio of the horizontal component to the total velocity:
and
,
Figure 4.
The ratio of the horizontal component to the BMC total velocity
Figure 4.
The ratio of the horizontal component to the BMC total velocity
accelerations (total, and two-axis) obtained from video analysis: , , , tangential acceleration , and centripetal acceleration (normal) ,
minimum and maximum values of all calculated accelerations,
the radius of curvature ρ,
convex hull C(s) (area) of the climbing run s(the road travelled by the marker BMC),
entropy [
17] calculated as Global Index Entropy GIE (1):
geometric index of entropy (2):
decrease at velocity (linear regression velocity
– parameters regression a and b), i.e., as shown in figures:
Figure 5,and Figure 10.
Figure 5.
Example of linear regression of speed (video data BMC).
Figure 5.
Example of linear regression of speed (video data BMC).
time to achieve maximum velocity and position (in
Figure 3) when achieving maximum speed,
drawn on the picture (video frame) parameters of velocity and acceleration,
location (spatial) of the maximum value of velocities/accelerations or radius of curvature ρ,
the potential (scaled height position/ location X
Figure 6), kinetic, and total energy of running,
analysis of a fragment of the route taken (
Figure 7),
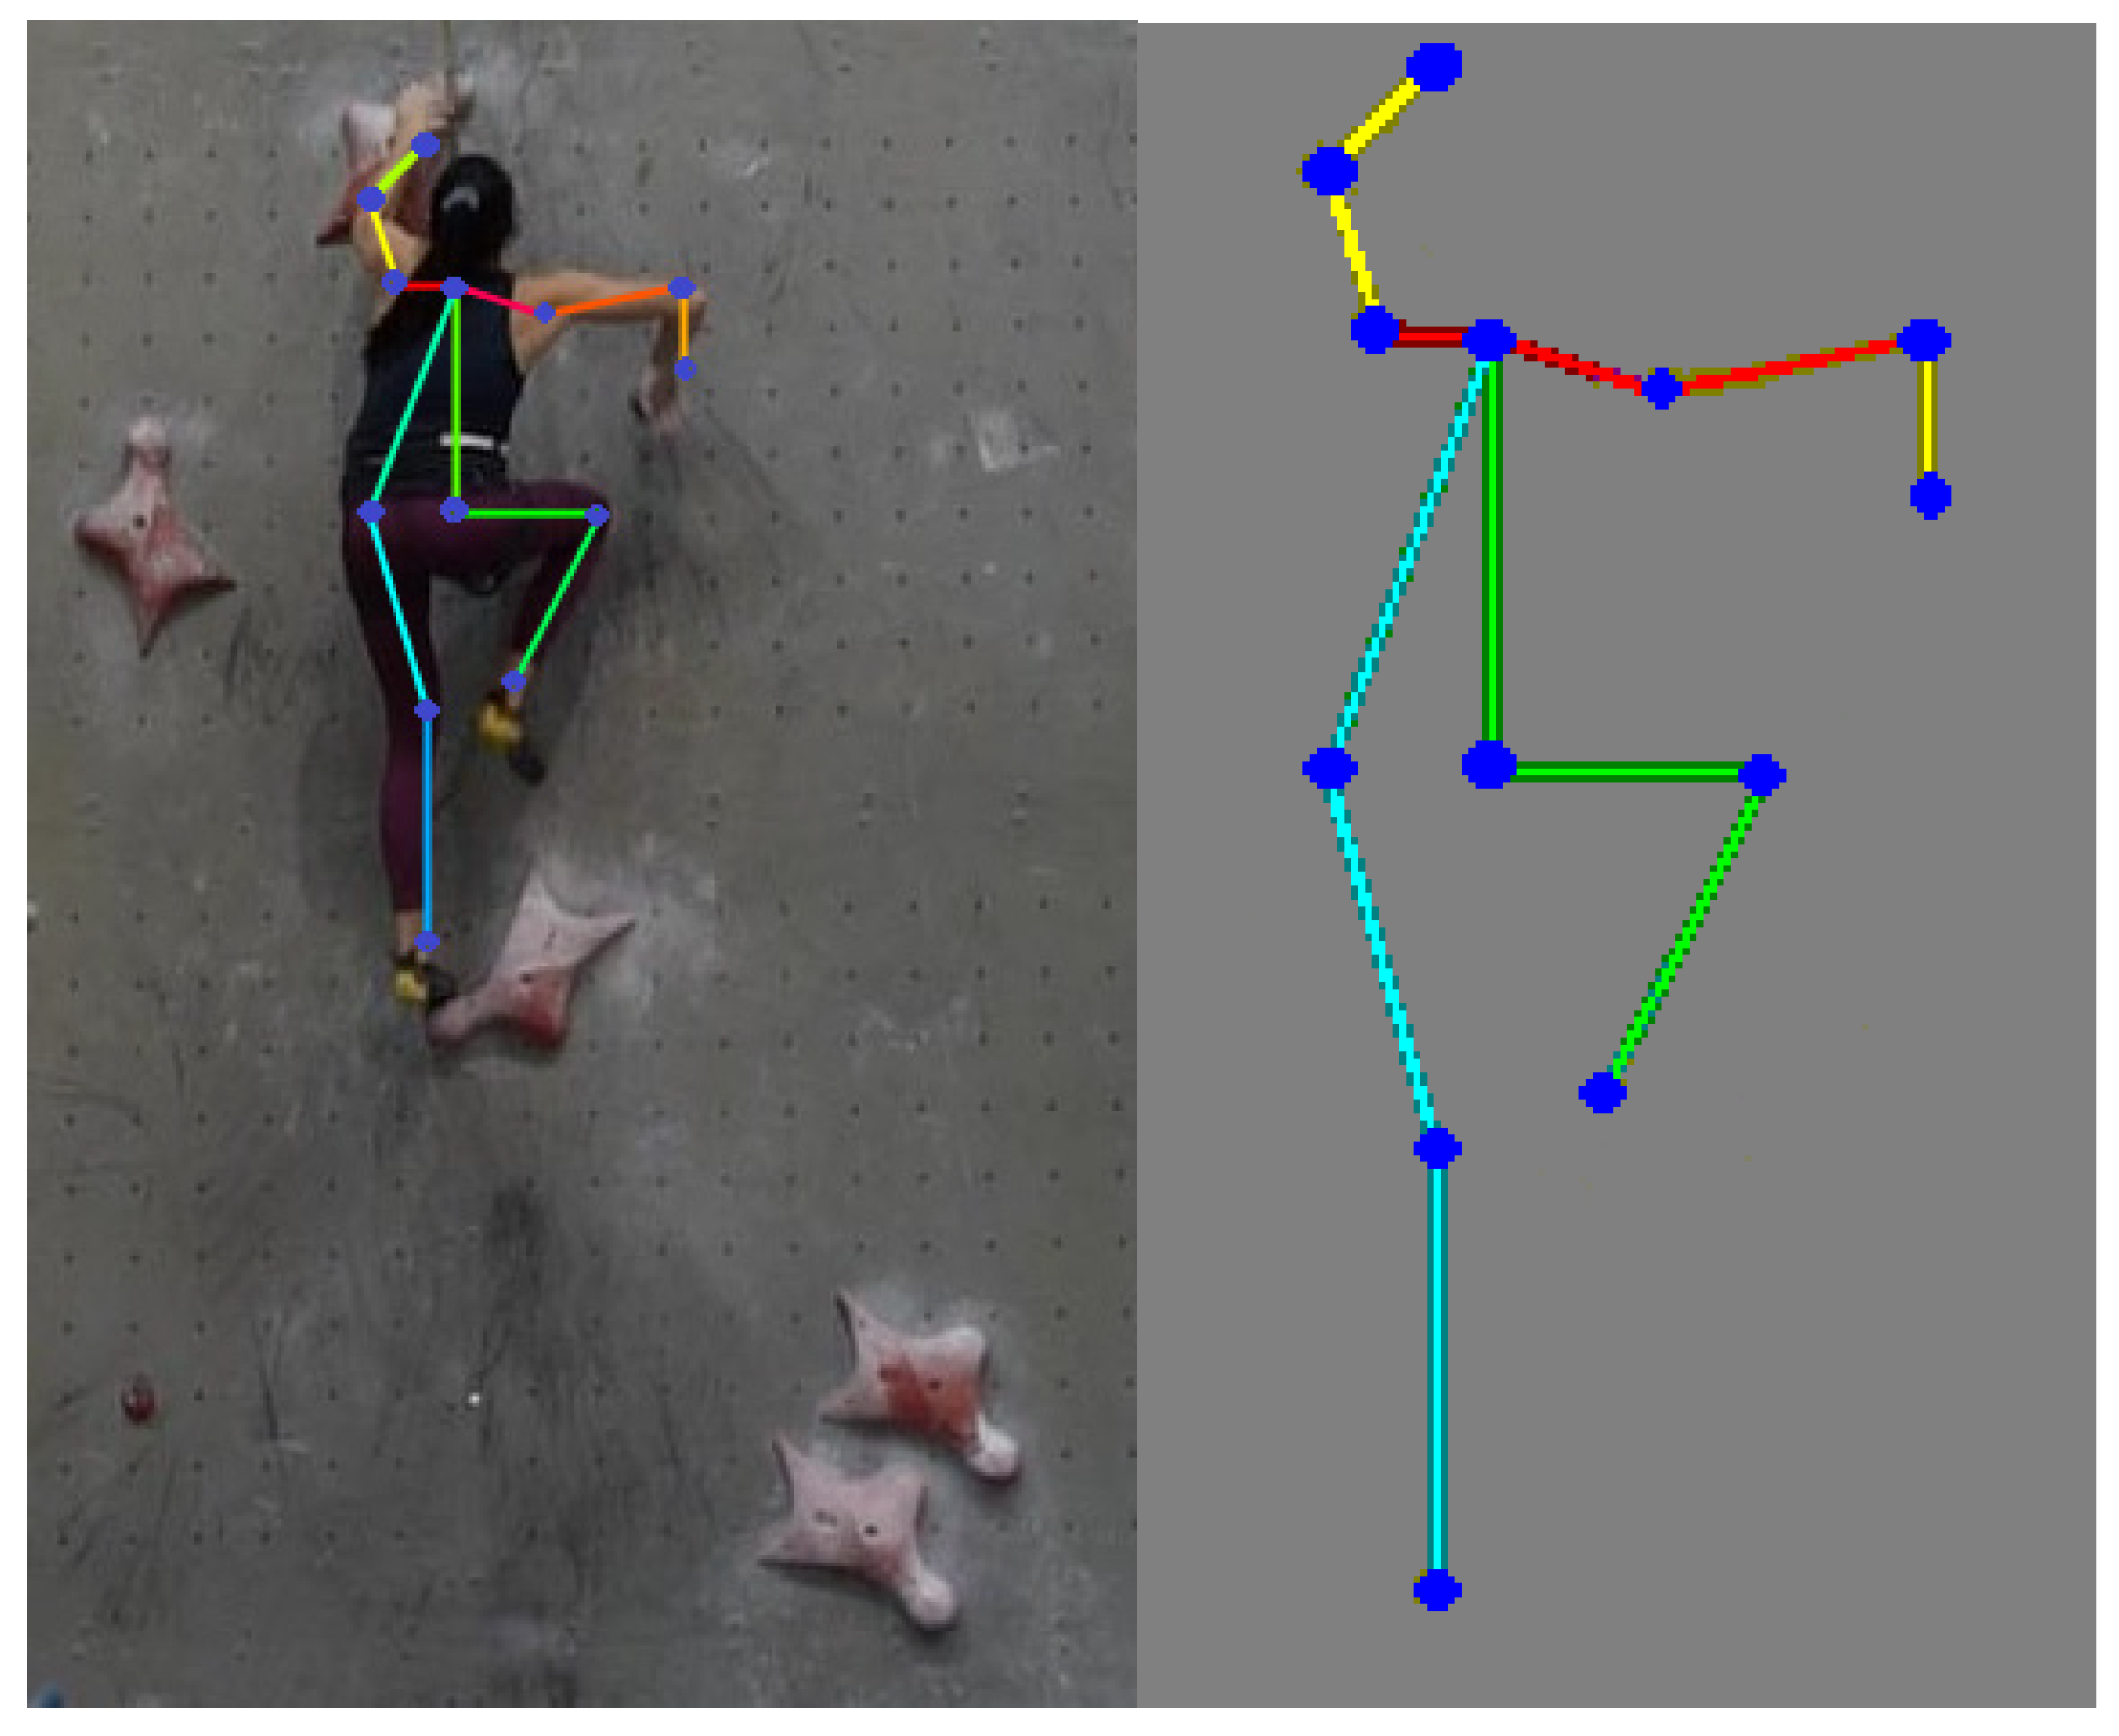
extraction of keypoint detection human body skeleton by CNN OpenPose (
Figure 8) with angles at the elbow, knee (
Figure 9) or hip joints.
Figure 6.
Comparison position (by video) of the picture BMC component for Athlete A “fast” and Athlete B “slow” run
Figure 6.
Comparison position (by video) of the picture BMC component for Athlete A “fast” and Athlete B “slow” run
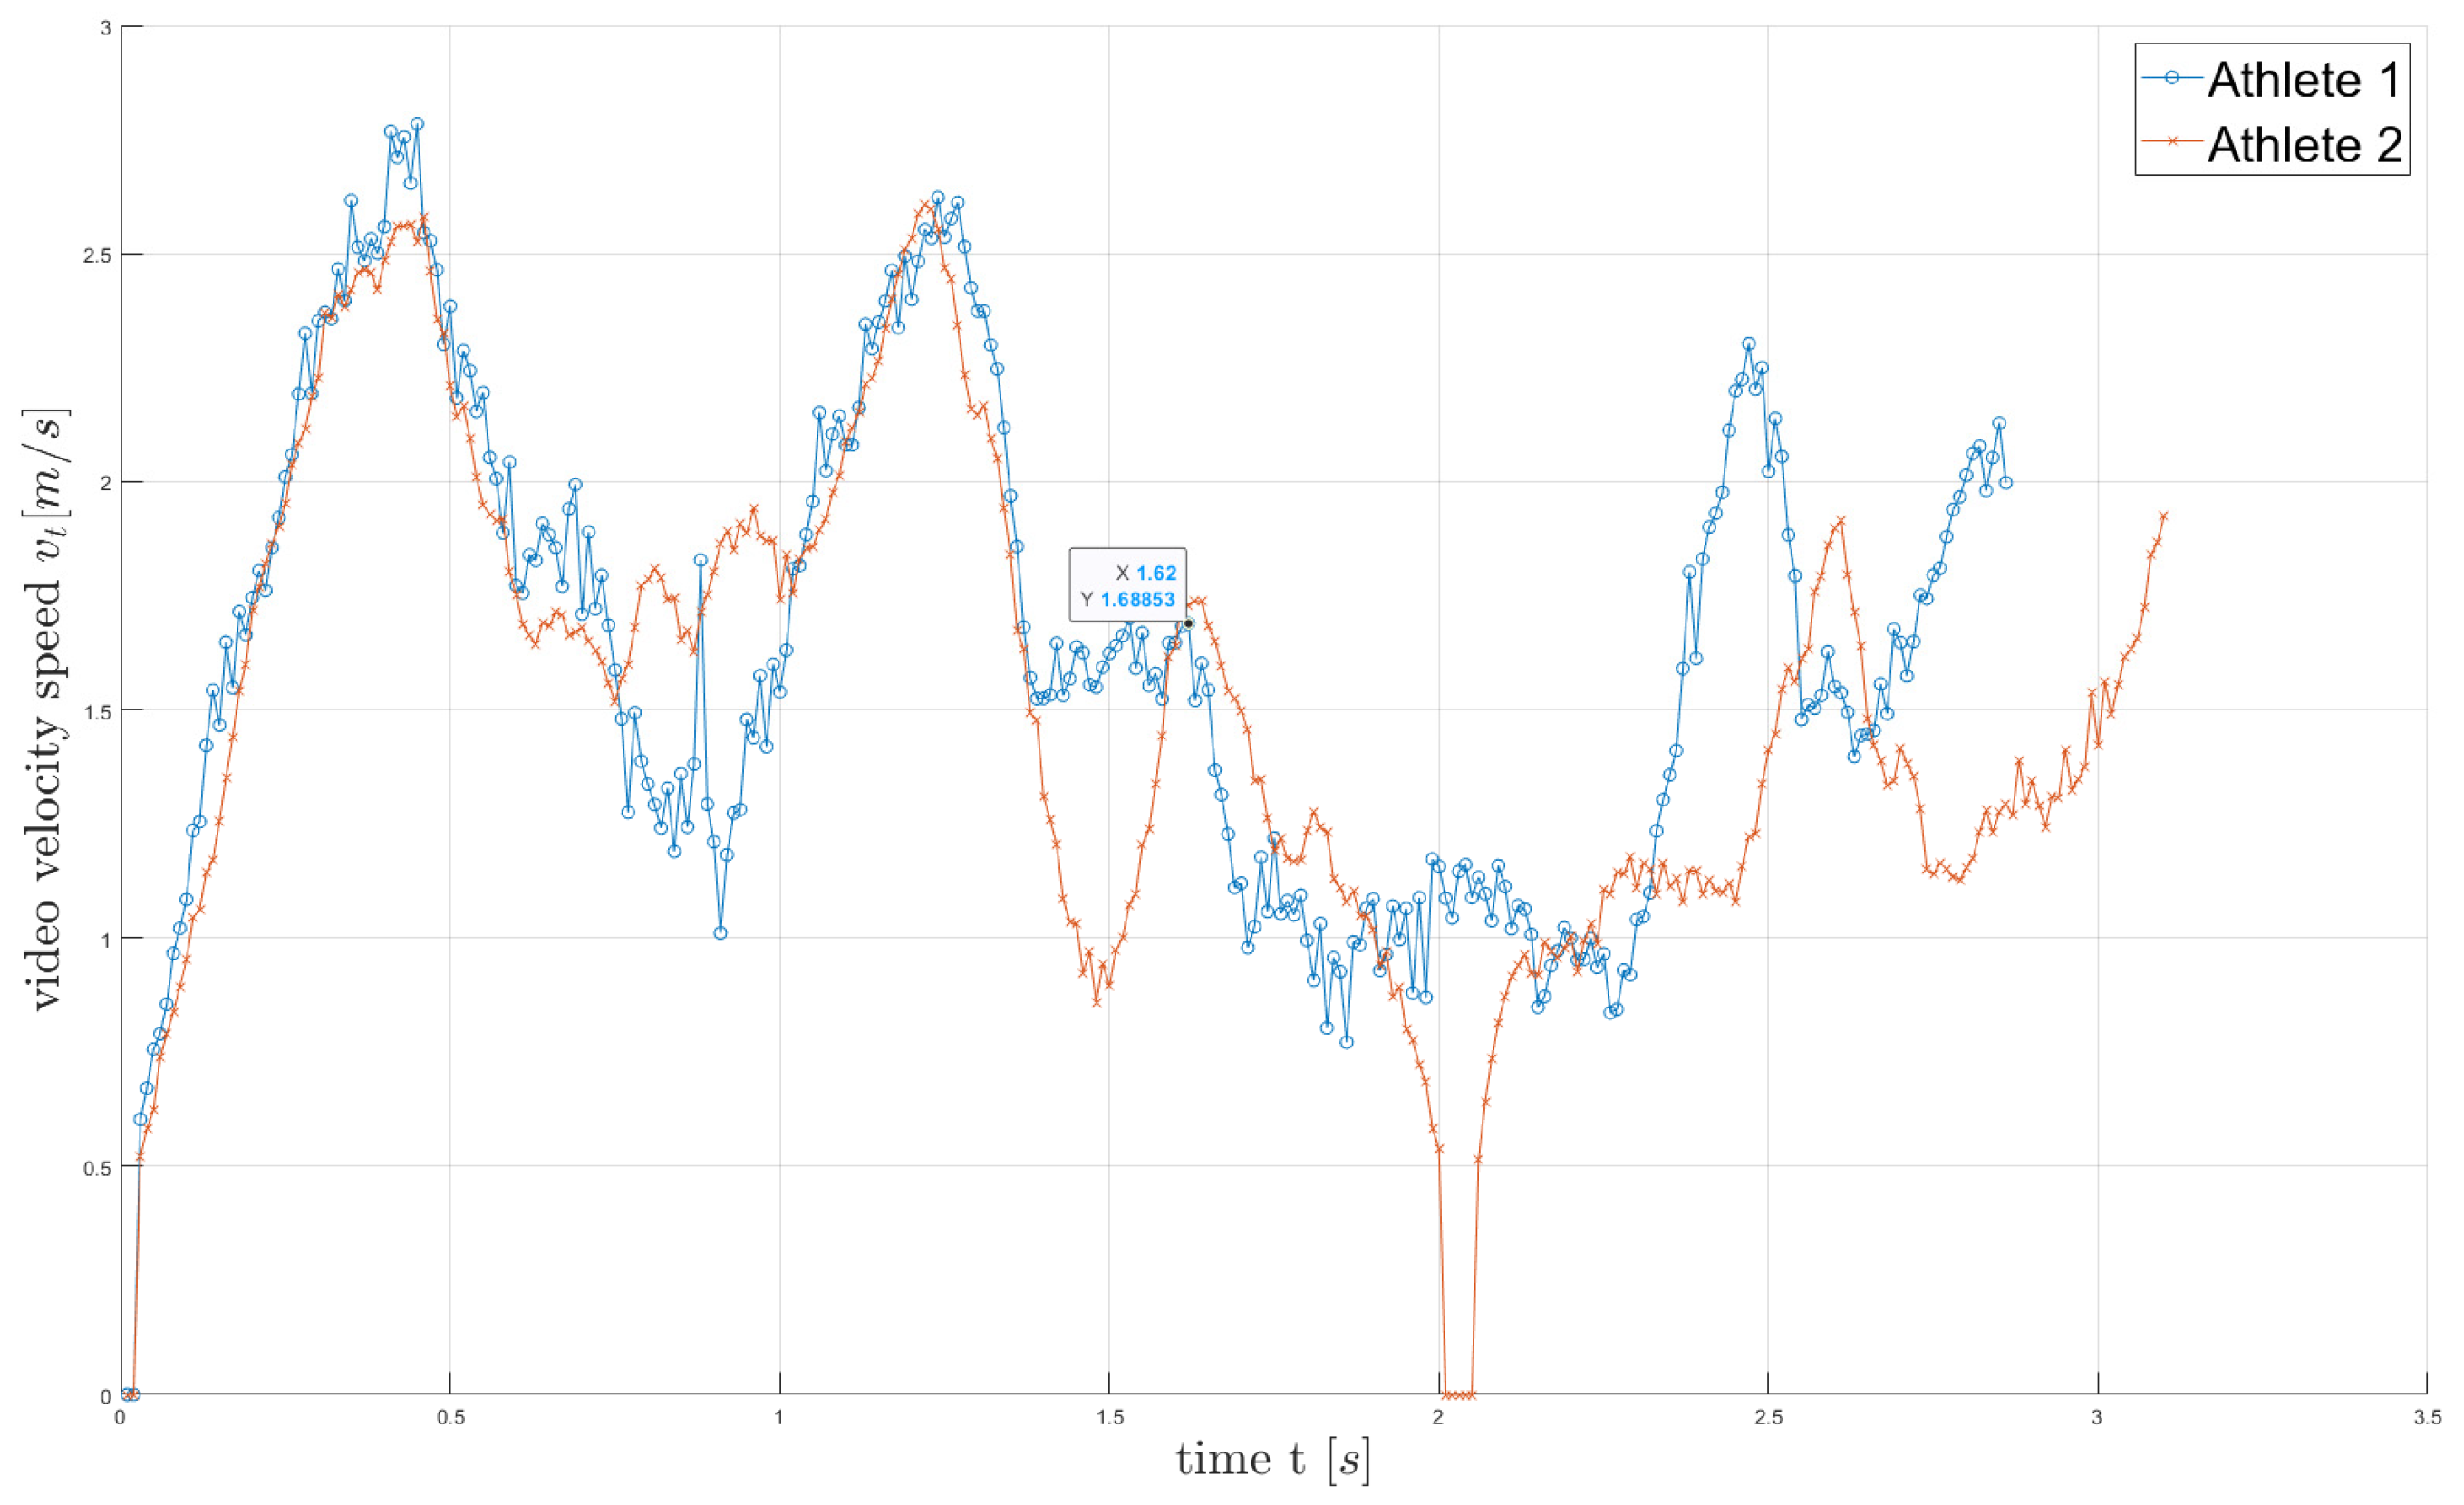
Figure 7.
A comparison velocity of the BMC speed two climbers for first 11 foot and handholds (
Figure 1).
Figure 7.
A comparison velocity of the BMC speed two climbers for first 11 foot and handholds (
Figure 1).
There are various solutions of (pretrained - Deep Learning) neural networks that identify body key points of the human. Among the best known are: Darkpose [
18], AlphaPose [
19], OpenPose [
20], PosePipe [
21] or other Human Pose Estimation (HPE) based e.g. on MPII Human Pose or Coco [
22] photo dataset. The OpenPose model was chosen for its satisfactory performance and ease of implementation in the Matlab environment [
23,
24]. Access to such information provides the possibility of obtaining additional parameters useful for analyzing the climber's movement [
25] in the biomechanical aspect or achieving joint mobility [
26].
Figure 8.
Video frame analysis of the climber's dyno movement to foot/handhold no. 9 by OpenPose CNN network (annotation time X=1.62 s at fig.8 Athlete 1).
Figure 8.
Video frame analysis of the climber's dyno movement to foot/handhold no. 9 by OpenPose CNN network (annotation time X=1.62 s at fig.8 Athlete 1).
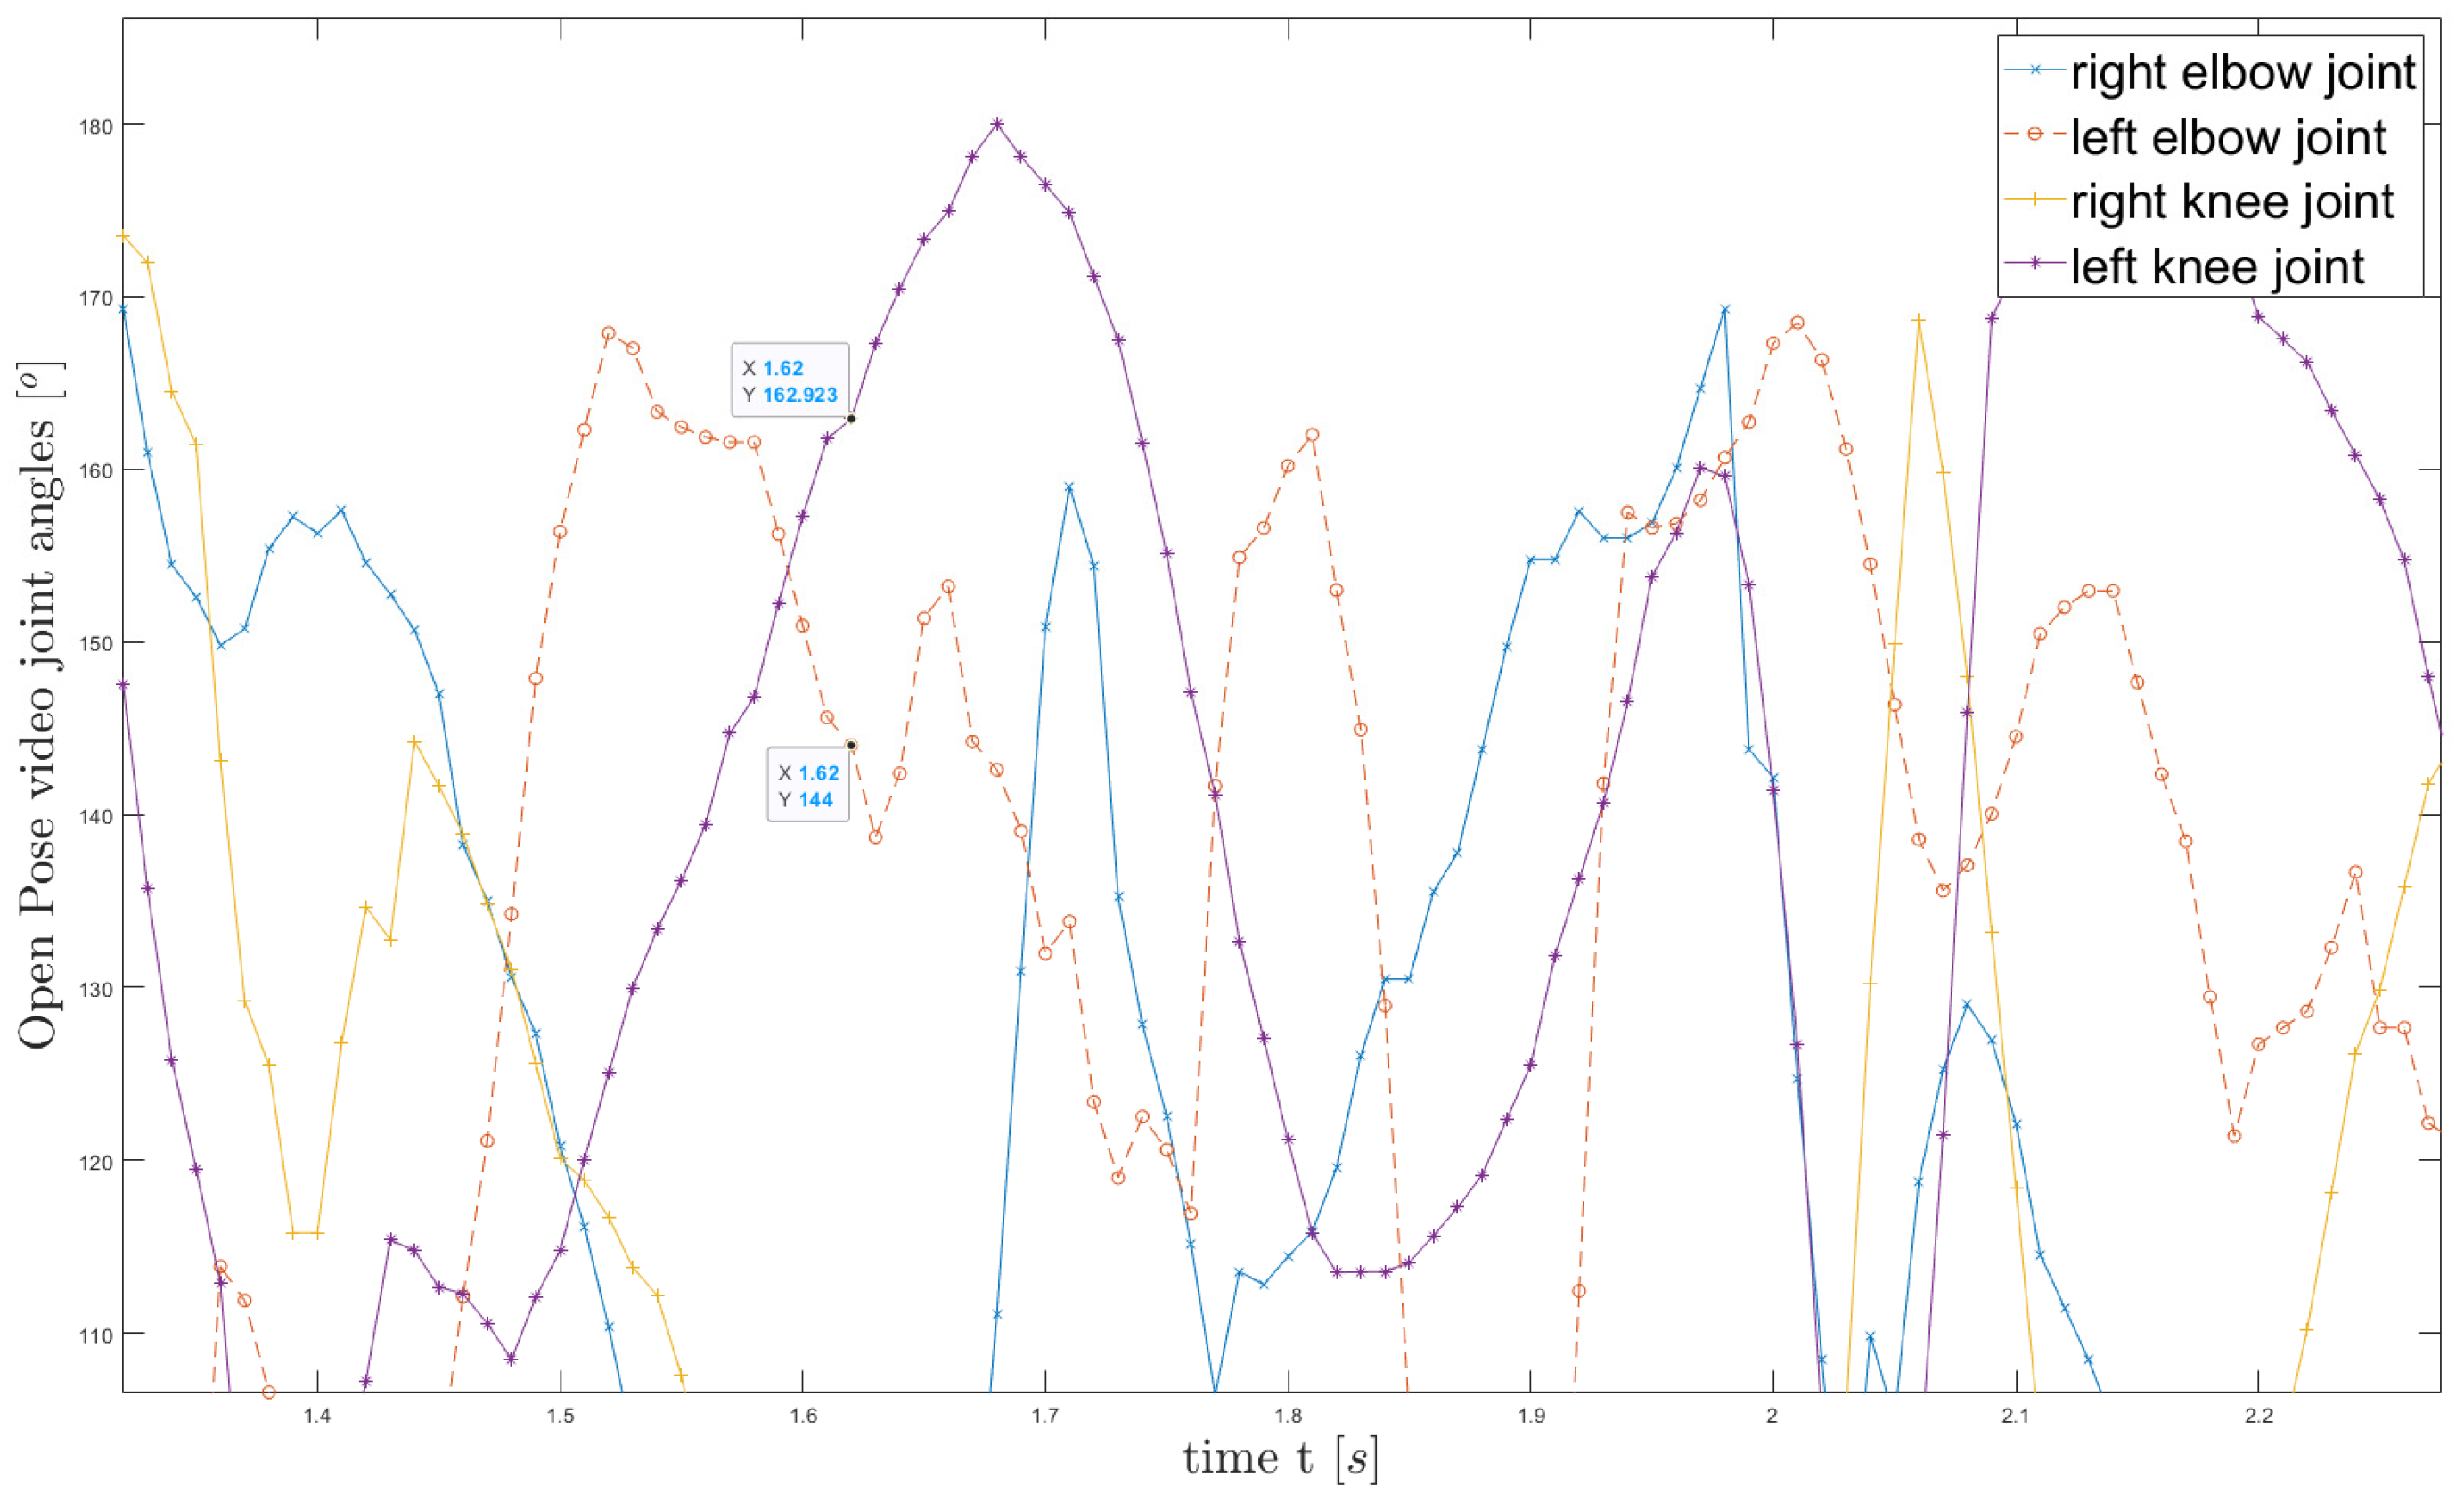
Figure 9.
Open Pose Video analysis joint angles of the climber's (annotation time X=1.62 s at fig.8 Athlete 1).
Figure 9.
Open Pose Video analysis joint angles of the climber's (annotation time X=1.62 s at fig.8 Athlete 1).
9. Statistical analysis of selected parameters
In the statistical analysis, correlation coefficients were used between: 1) running time measured by the measurement system used during the competition; and 2) running time measured by the video recorder and the other parameters measured by the devices used. R Pearson linear correlation coefficients were used in the analysis, the interpretation of which was based on indications [
25]: ≤ 0.1 = trivial, 0.1- 0.3 = small, 0.3 - 0.5 = moderate, 0.5 - 0.7 = large, 0.7 - 0.9 = very large, > 0.9 = almost perfect. Statistical significance of individual coefficients was assumed at p < 0.05.
Primary, analysed the number of movies and the total number of athletes 21 climbers (males group consisted of 9 athletes, females group consisted 12 athletes). Analysis of data from the system under development was also carried out on world speed climbing champions.
Table 1 and
Table 2 contains the statistical characteristics of the analysed variables. The analysis of the correlation coefficients indicates that most of the studied parameters are correlated with time-climbing running time. The strength of the correlation varied, nevertheless these results indicate that the prototype system may have a high diagnostic value. In this context, two parameters deserve special attention: Regression a (m/s
2) and Regression b (m/s) (
Table 1,
Table 2). The first one can be defined as an indicator of the possibility of an unavoidable reduction in the decrease of acceleration capabilities during the run as the finish line is approached. The second, on the other hand, can be characterised as a measurement of the upward-facing initial running speed at the start of a climbing sprint. Both of these parameters are statistically significantly correlated with running time, with a stronger correlation recorded for the parameter Regression b. This indicates the high importance of one’s ability to limit the decline in the ability to generate acceleration during a run.
Analysis of the curve showing the BMC velocity of the athlete under study indicates that it changes in successive parts of the road. The general tendency of the changes is downward, with significant decreases in speed at the turnaround (after the start), the first dyno, and the second dyno.
Our results showed that the data measured is largely consistent with previous data describing speed−climbing runs (
Table 1 and
Table 2). Previous studies [
6,
8,
26] that used video recorders indicated that there are three locations during the run where the climber loses speed: around holds 7−9 (after the start), holds 13−18 (first dyno), and holds 23−29 (second dyno). After passing each of these locations, the climber must generate large amounts of force in a short period to regain speed. Analysis of the changes in running speed of the climber tested in this study show similar changes in kinematic parameters. Peaks of speed reduction were noted after the take−off phase and at the first and second dyno. In addition, a clear acceleration of running speed was noted each time after passing these locations. Our results indicate that the tested device may have high diagnostic value in speed−climbing, both in the field of scientific research and in coaching practice. At this point, in light of the promising results, it should be postulated to continue the research on a larger group of athlete−climbers.
Analyzing the variation in the level of measured variables, no significant differences were found between female and male athletes. In both groups, high correlation coefficients were recorded between the time recorded via the camera (video time) and the measurement system (time) used during the competition. In addition, high correlation values were recorded in both groups between the parameter regression velocity b and running time. The analysis of the correlation results also showed that in the males group there was a higher strength and number of relationships between parameters such as: Entropy
, GIE, tot. distance of run
av and the parameters regresion velocity a and regresion velocity b. Detailed results are shown in
Table 1 and
Table 2.
10. Conclusions
The present study is the second attempt of its kind to analyse a time-climbing run under natural conditions for climbers (during a competition). The aim of the study was, among other things: to try to extend the number of parameters (GIE, H,
, max
, time to
,
, regression velocity a and regression velocity b) describing a climber's run compared to previous work that analysed the runs of youth category athletes [
6].
The results of the present study showed that: 1) there were no differences in the numerical values of the analysed parameters between male and female athletes participating in the competition, indicating that, regardless of gender in this age category (and in this particular population), the motor performance of the athletes may be similar; 2) that the two indices of regression velocity a and regression velocity b are strongly correlated with running time in both genders, and that: 3) indicated a potential intersexual variation in the correlation of these indices with the other parameters, which may provide an important rationale for differentiating the training process in this discipline in female and male speed climbers.
Regression velocity a and regression velocity b describe changes in running speed in the initial phase of the run (regression velocity a) and in the later phase of the run, as further metres of the run are covered (regression velocity b). The former, was positively related to running time in both groups, with the coefficient being statistically significant in male climbers. This indicates that the higher the initial velocity, the greater the chance of a worse result at the end of the distance. From the point of view of the characteristics of this competition (where a better time rewards victory), the potential significance of this parameter should be approached with caution. The second parameter that seems to be more important (significantly correlated with time in both groups) regression velocity b (which can be defined as the ability to maintain speed over distance) seems to be of greater significance. This may be an indicator of minimizing the climber's loss of speed during the run, which is consistent with the findings of previous studies in this category [
6]. The question that arises here is whether there are other indicators that can be correlated with or have an influence on this parameter. This knowledge may allow for a theoretical basis for training in this discipline.
In this context, as mentioned in the introduction, the starting point for planning the present study was the work by Legreneur et al. [
6] ,which investigated the entropy index (H) in addition to times. In our study, several new indices (which had not been used in previous work) were presented, being, as it were, an extension of the work cited above. In addition, an analysis of the correlation between these indices, running time and regression velocity b index was carried out taking gender into account. It turned out that in the females' group, the indices H, GIE, max
, time to
,
, were not correlated with running time or the regression velocity b parameter (compared to the males' group). This may indicate that, in male climbers, indicators related to climbing fluency will be of high importance for maintaining speed and achieving short running times. In contrast, these indicators appear to be of lesser importance in female speed climbers. The differences in the correlation coefficients analysed may also be a picture of the differences in the way the climbing route in this competition is completed between males and females. In other words, the running of female athlete is simply less smooth than that of males and this difference is due to somatomotoritions (gender differences). This can be confirmed by the results obtained by Legreneur et al. [
6], who reported significant differences in entropy index (H) when examining athletes at the Youth Olympic Games. A cross-sectional variation in the correlation results between times obtained on different road sections and time was also obtained by the team of Chen et al. [
27]. This may support the thesis that running in this climbing competition, despite the similarities in spatial-temporal movement parameters women's running may be influenced by different coordination processes.
The proposed devices used separately and/or simultaneously enable one to obtain valuable data in terms of the specific preparation needs of a speed climber (via in vivo measurement). The obtained results were from previous research in this field. Appropriate use of those devices during diagnostic procedures, especially when other parameters will be involved (anthropometric data, results of common performance tests, such as vertical jumps, etc.), could provide comprehensive data for coaches and strength and conditioning staff.
Future perspectives
Future scientific explorations in this field should involve:
Development and evaluation of concurrent validity (association performance test vs competition performance) a new set of parameters (based on those presented in this study) with bigger sample size. It seems that it should be applied to the climbing time. It will allow us to investigate relationships between internal variables (e.g., GIE, variability of climbing velocity, joint angles) with climbing time.
Evaluation of intra- and between-day reliability. It will allow us to investigate the typical error and sensitivity of measurements. This may be crucial information for practitioners in terms of evaluation of training process.
Author Contributions
Conceptualization, A.P. and T.M.; methodology, A.P. and R.R. software, A.P.; validation, A.P., M.W. and M.K.; formal analysis, T.M.; investigation, A.P.; resources, M.W.; data curation, M. K.; writing—original draft preparation, A. P. and M. K.; writing—review and editing, A.P., T.M., M.K., D.K., M.W., and R.R.; visualization, A.P.; supervision, A.P.; project administration, D.K and M.W.; funding acquisition, D.K and M. W. All authors have read and agreed to the published version of the manuscript.
Funding
This work was supported by the University of Applied Sciences in Tarnow internal grant no. BAD/08/2020PWSZ/PRWRs/0700−7/PNU/2020 and BAD−008/2021PWSZ/PRNR−s/0700−7/PN−U/2021.
Institutional Review Board Statement
The research protocol was approved of by the local Bioethics Committee pursuant to Resolution 6/0177/2019, and all research procedures were carried out in compliance with the Helsinki Declaration.
Informed Consent Statement
Not applicable.
Data Availability Statement
Not applicable.
Acknowledgments
The authors are grateful to Przemysław Kościk and Łukasz Chlastawa for their fruitful suggestions, questions, and assistance during video recording.
Conflicts of Interest
The authors declare no conflict of interest.
References
- IFSC. Speed License Rules. 2022. Available online: https://cdn.ifsc-climbing.org/images/ifsc/Footer/Manufacturers/Speed_Licence_Rules_Walls.pdf (accessed on 15 March 2022).
- IFSC. Photo special holds - Twitter. 2020. Available online: https://twitter.com/IFSClimbing/status/1265669896706424832 (accessed on 15 March 2022).
- Luxov. Touch Speed. 2021. Available online: https://www.luxov-connect.com/en/technology/touch (accessed on 15 March 2022).
- Luxov - Facebook. 2021. Available online: https://www.facebook.com/luxovconnect/photos/pcb.2312371765562044/2312369095562311/ (accessed on 15 March 2022).
- IFSC Speed Records. Available online: https://www.ifsc-climbing.org/index.php/world-competition/speed-records (accessed on 29 January 2023).
- Legreneur, P.; Rogowski, I.; Durif, T. Kinematic analysis of the speed climbing event at the 2018 Youth Olympic Games. Comput. Methods Biomech. Biomed. Eng. 2019, 22, 264–266. [Google Scholar] [CrossRef]
- Guo, F.; Wang, Q.; Liu, Y.; Hanson, N.J. Changes in blood lactate and muscle activation in elite rock climbers during a 15-m speed climb. Eur. J. Appl. Physiol. 2019, 119, 791–800. [Google Scholar] [CrossRef] [PubMed]
- Reveret, L.; Chapelle, S.; Quaine, F.; Legreneur, P. 3D Visualization of Body Motion in Speed Climbing. Front. Psychol. 2020, 11. [Google Scholar] [CrossRef] [PubMed]
- Voronov, A.V.; Kvashuk, P.V.; Voronova, A.A.; Krasnoperova, T.V. Electromyographic methods to determine muscle groups to affect sports results in speed climbing. Theory Pract. Phys. Cult. 2019, 12. [Google Scholar]
- Dartfish. Dartfish - Dartfish |Video Performance and Data Analysis Solutions. Dartfish, 2022. Available online: https://www.dartfish.com/ (accessed on 19 December 2021).
- PROJECT, T.B.A.; “Eyeballing” vs. a Computer in Analysis of a Speed Climber – The Beta Angel Project. 2022. Available online: https://beta-angel.com/research/personal-research/eyeballing-vs-a-computer-in-analysis-of-a-speed-climber/ (accessed on 19 December 2021).
- Kinovea. 2021. Available online: https://www.kinovea.org/features.html (accessed on 19 December 2021).
- Sports, V. V1 Home Studio - V1 Sports. 2021. Available online: https://v1sports.com/athletes/v1-home-studio/ (accessed on 19 December 2021).
- Sony Alpha 7 III Full-frame mirrorless Digital Camera | ILCE-7M3. 2021. Available online: https://electronics.sony.com/imaging/interchangeable-lens-cameras/full-frame/p/ilce7m3-b.
- SIGMA. SIGMA Corporation | Lenses | Art | 24mm F1.4 DG HSM. 2021. Available online: https://www.sigma-global.com/en/lenses/a015_24_14/.
- Matlab. Face Detection and Tracking Using the KLT Algorithm - Matlab. 2021. Available online: https://www.mathworks.com/help/vision/ug/face-detection-and-tracking-using-the-klt-algorithm.html (accessed on 19 December 2021).
- Watts, P.; Drum, S.; Kilgas, M.A.; Phillips, K.C. Geometric Entropy for Lead vs Top−Rope Rock Climbing. Int. J. Exerc. Sci. 2016, 9. [Google Scholar]
- Xiao, B.; Wu, H.; Wei, Y. Simple Baselines for Human Pose Estimation and Tracking. in Computer Vision -- ECCV 2018, Cham, Switzerland, 2018.
- Fang, H.S.; Xie, S.; Tai, Y.W.; Lu, C. RMPE: Regional Multi-person Pose Estimation. In Proceedings of the International Conferenceon Computer Vision (ICCV), Venice, Italy; 2017. [Google Scholar]
- Cao, Z.; Hidalgo, G.; Simon, T.; Wei, S.E.; Sheik, Y. OpenPose: Realtime Multi-Person 2D Pose Estimation Using Part AffinityFields. IEEE Trans. Pattern Anal. Mach. Intell. 2021, 43, 172–186. [Google Scholar] [CrossRef] [PubMed]
- Cotton, R.J. PosePipe: Open-Source Human Pose Estimation Pipeline for Clinical Research, arXiv, 2022.
- Lin, T.-Y.; Maire, M.; Belongie, C.; Bourdev, L.; Girshick, R.; Hays, J.; Perona, P.; Ramanan, D.; Zitnick, C.L.; Dollár, P. Microsoft COCO: Common Objects in Context, arXiv, 2015.
- Pieprzycki, A. AI CNN OpenPose for first 11 foot/handholds. RG, Tarnów, 2022.
- Pandurevic, D.; Draga, P.; Sutor, A.; Hochradel, K. Analysis of Competition and Training Videos of Speed Climbing Athletes Using Feature and Human Body Keypoint Detection Algorithms. Sensors 2022, 22, 6. [Google Scholar] [CrossRef] [PubMed]
- Rokowski, R.; Ręgwelski, T. Naukowe podstawy treningu we wspinaczce sportowej (Scientific basis for sport climbing training), Kraków: AWF Kraków, 2019.
- Draga, P.; Ozimek, M.; Krawczyk, M.; Rokowski, R.; Nowakowska, M.; Ochwat, P.; Jurczak, A.; Stanula, A. Importance and Diagnosis of Flexibility Preparation. Int. J. Environ. Res. Public Health 2020, 7, 2512. [Google Scholar] [CrossRef] [PubMed]
- Hopkins, W.G.; Marshall, S.W.; Batterham, A.M.; Hanin, J. Progressive Statistics for Studies. Sports Med. Exerc. Sci. 2009, 41, 3–12. [Google Scholar] [CrossRef] [PubMed]
- Legreneur, P.; Quaine, F.; Chapelle, S.; Reveret, L. Interpretation of hip mechanical energy in official speed climbing route. in 4th IRCRA International Congress, Chamonix, 2018.
- Chen, R.; Liu, Z.; Yuan, L.; Gao, J. A Time-Motion and Error Analysis of Speed Climbing in the 2019 IFSC Speed Climbing World Cup Final Rounds. Int. J. Environ. Res. Public Health 2022, 19, 6003. [Google Scholar] [CrossRef] [PubMed]
|
Disclaimer/Publisher’s Note: The statements, opinions and data contained in all publications are solely those of the individual author(s) and contributor(s) and not of MDPI and/or the editor(s). MDPI and/or the editor(s) disclaim responsibility for any injury to people or property resulting from any ideas, methods, instructions or products referred to in the content. |
© 2023 by the authors. Licensee MDPI, Basel, Switzerland. This article is an open access article distributed under the terms and conditions of the Creative Commons Attribution (CC BY) license (http://creativecommons.org/licenses/by/4.0/).
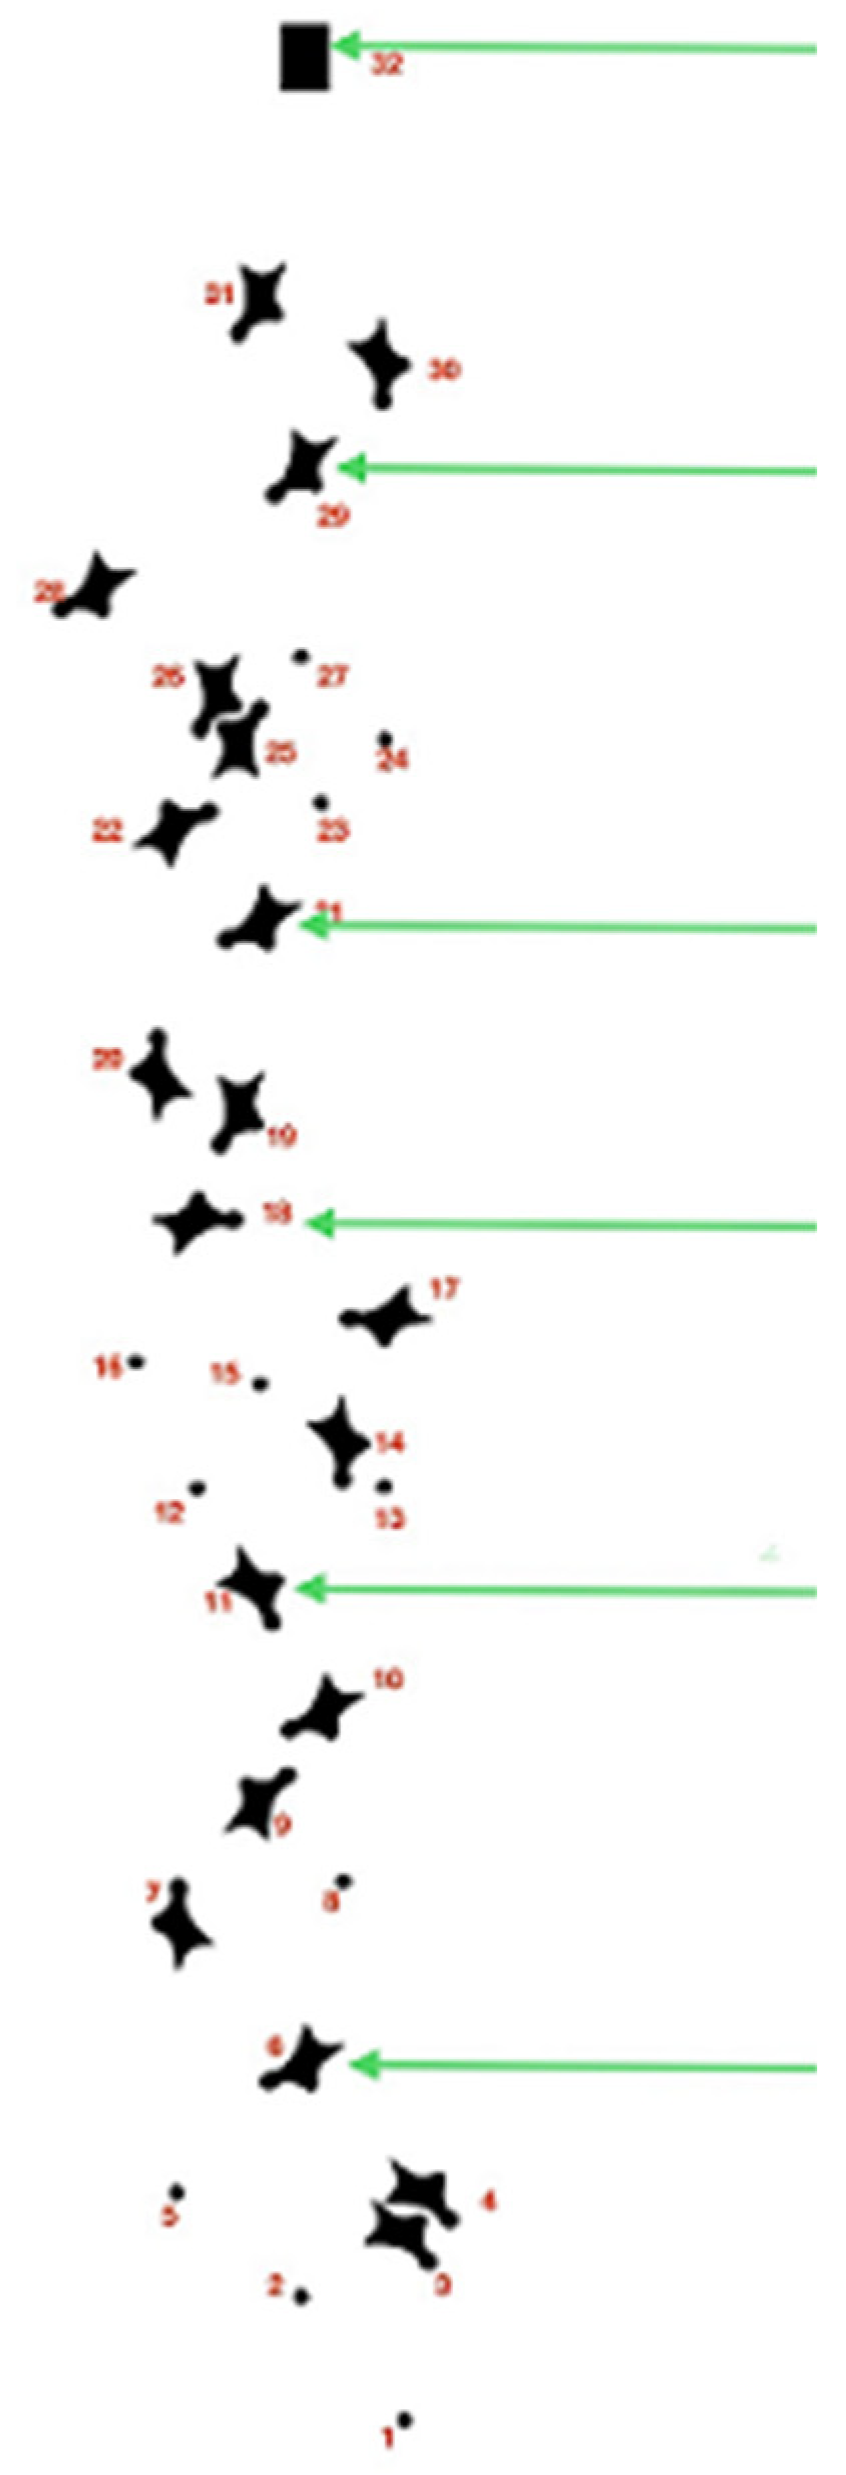
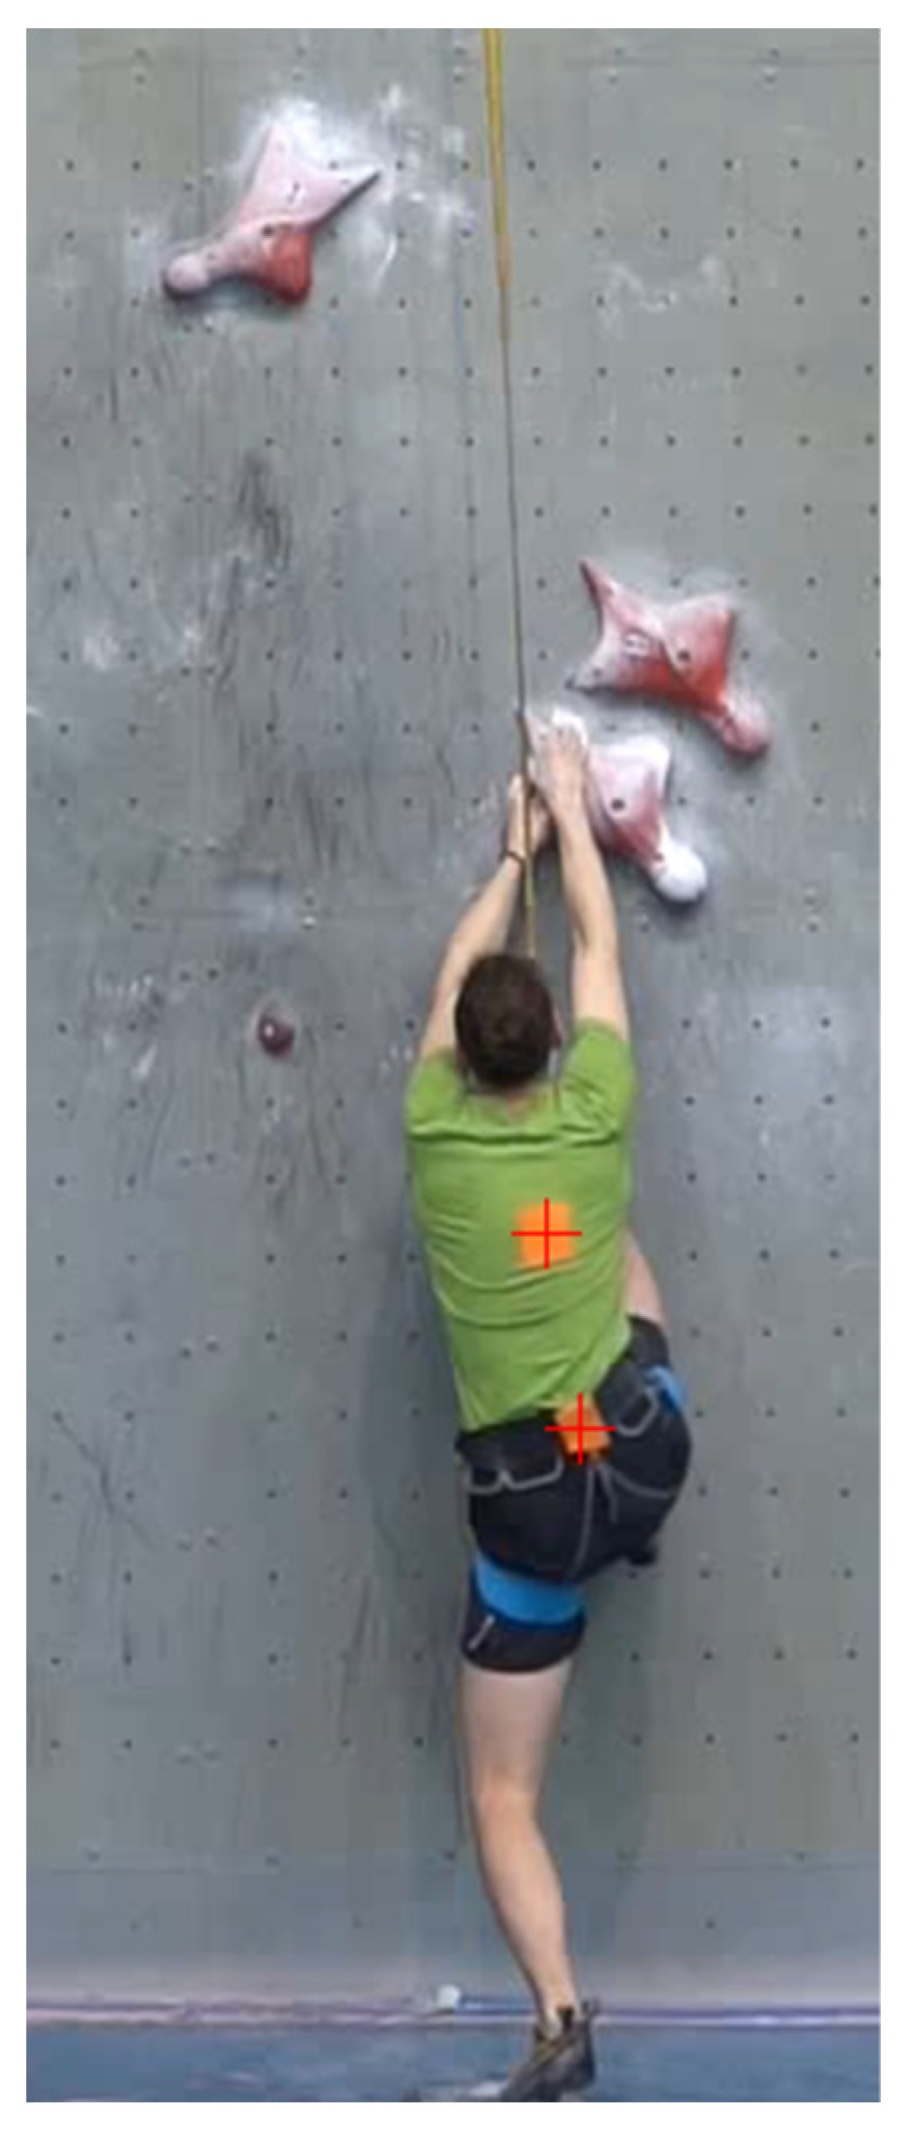
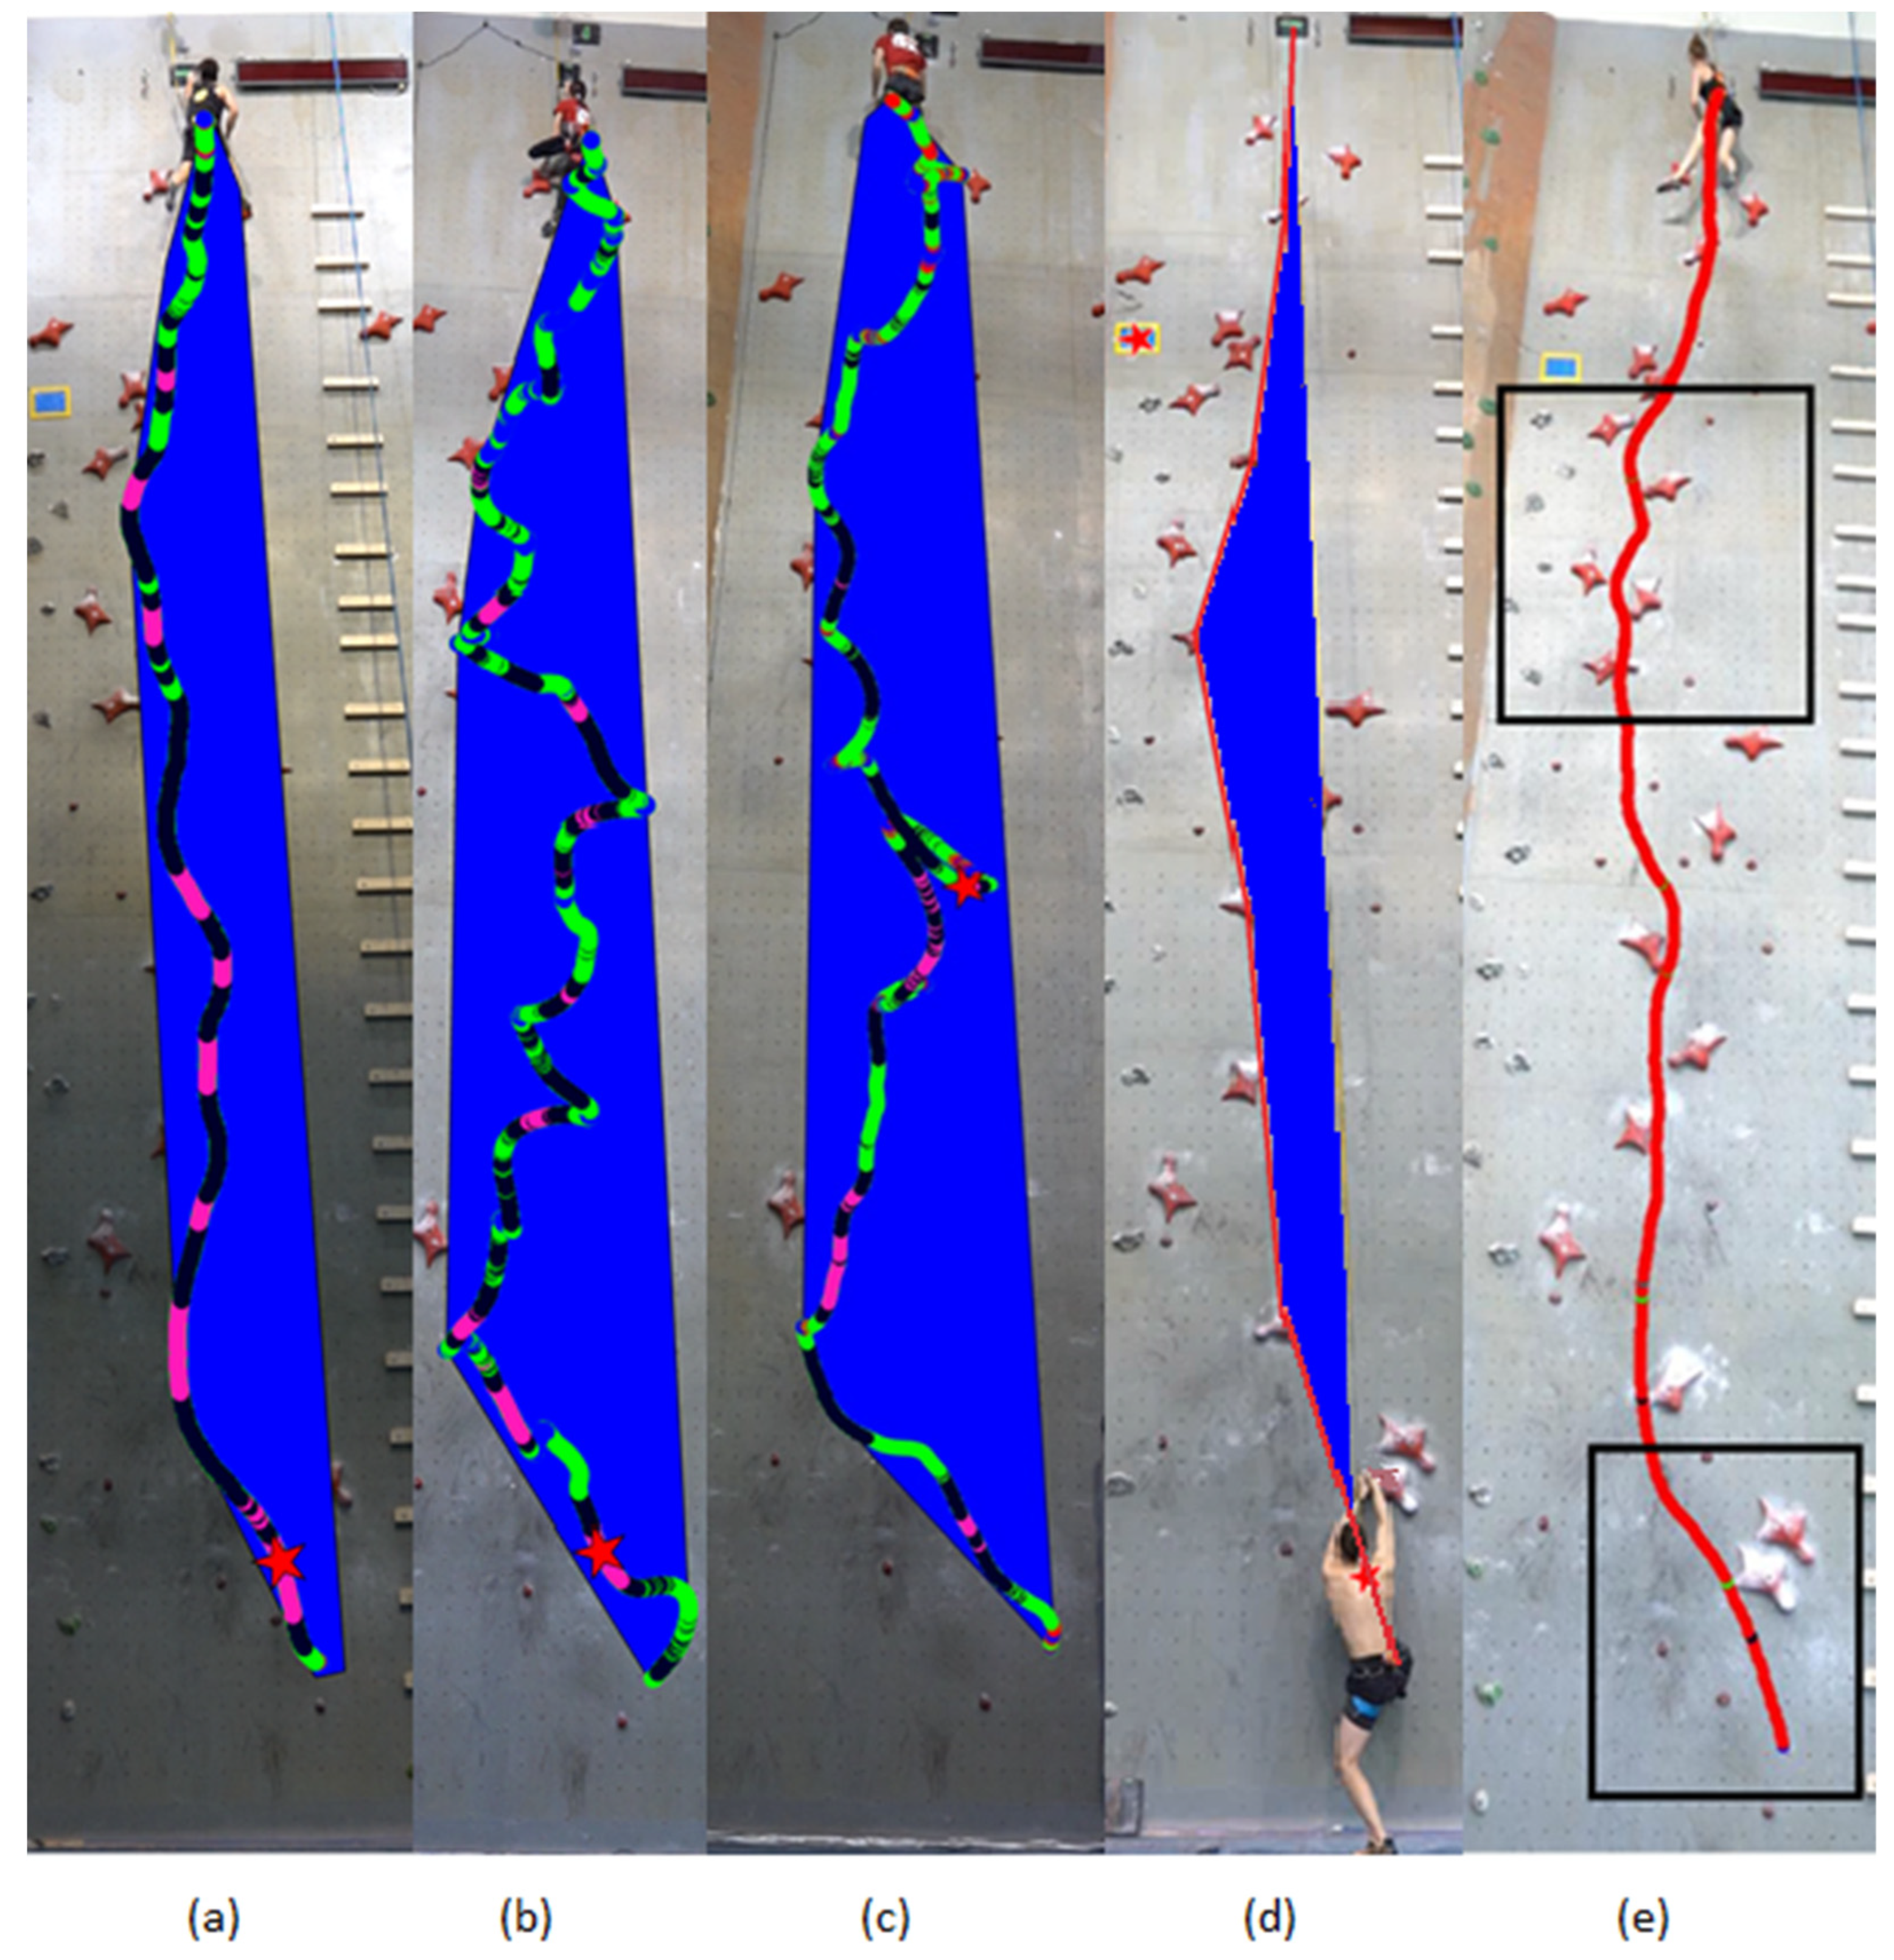
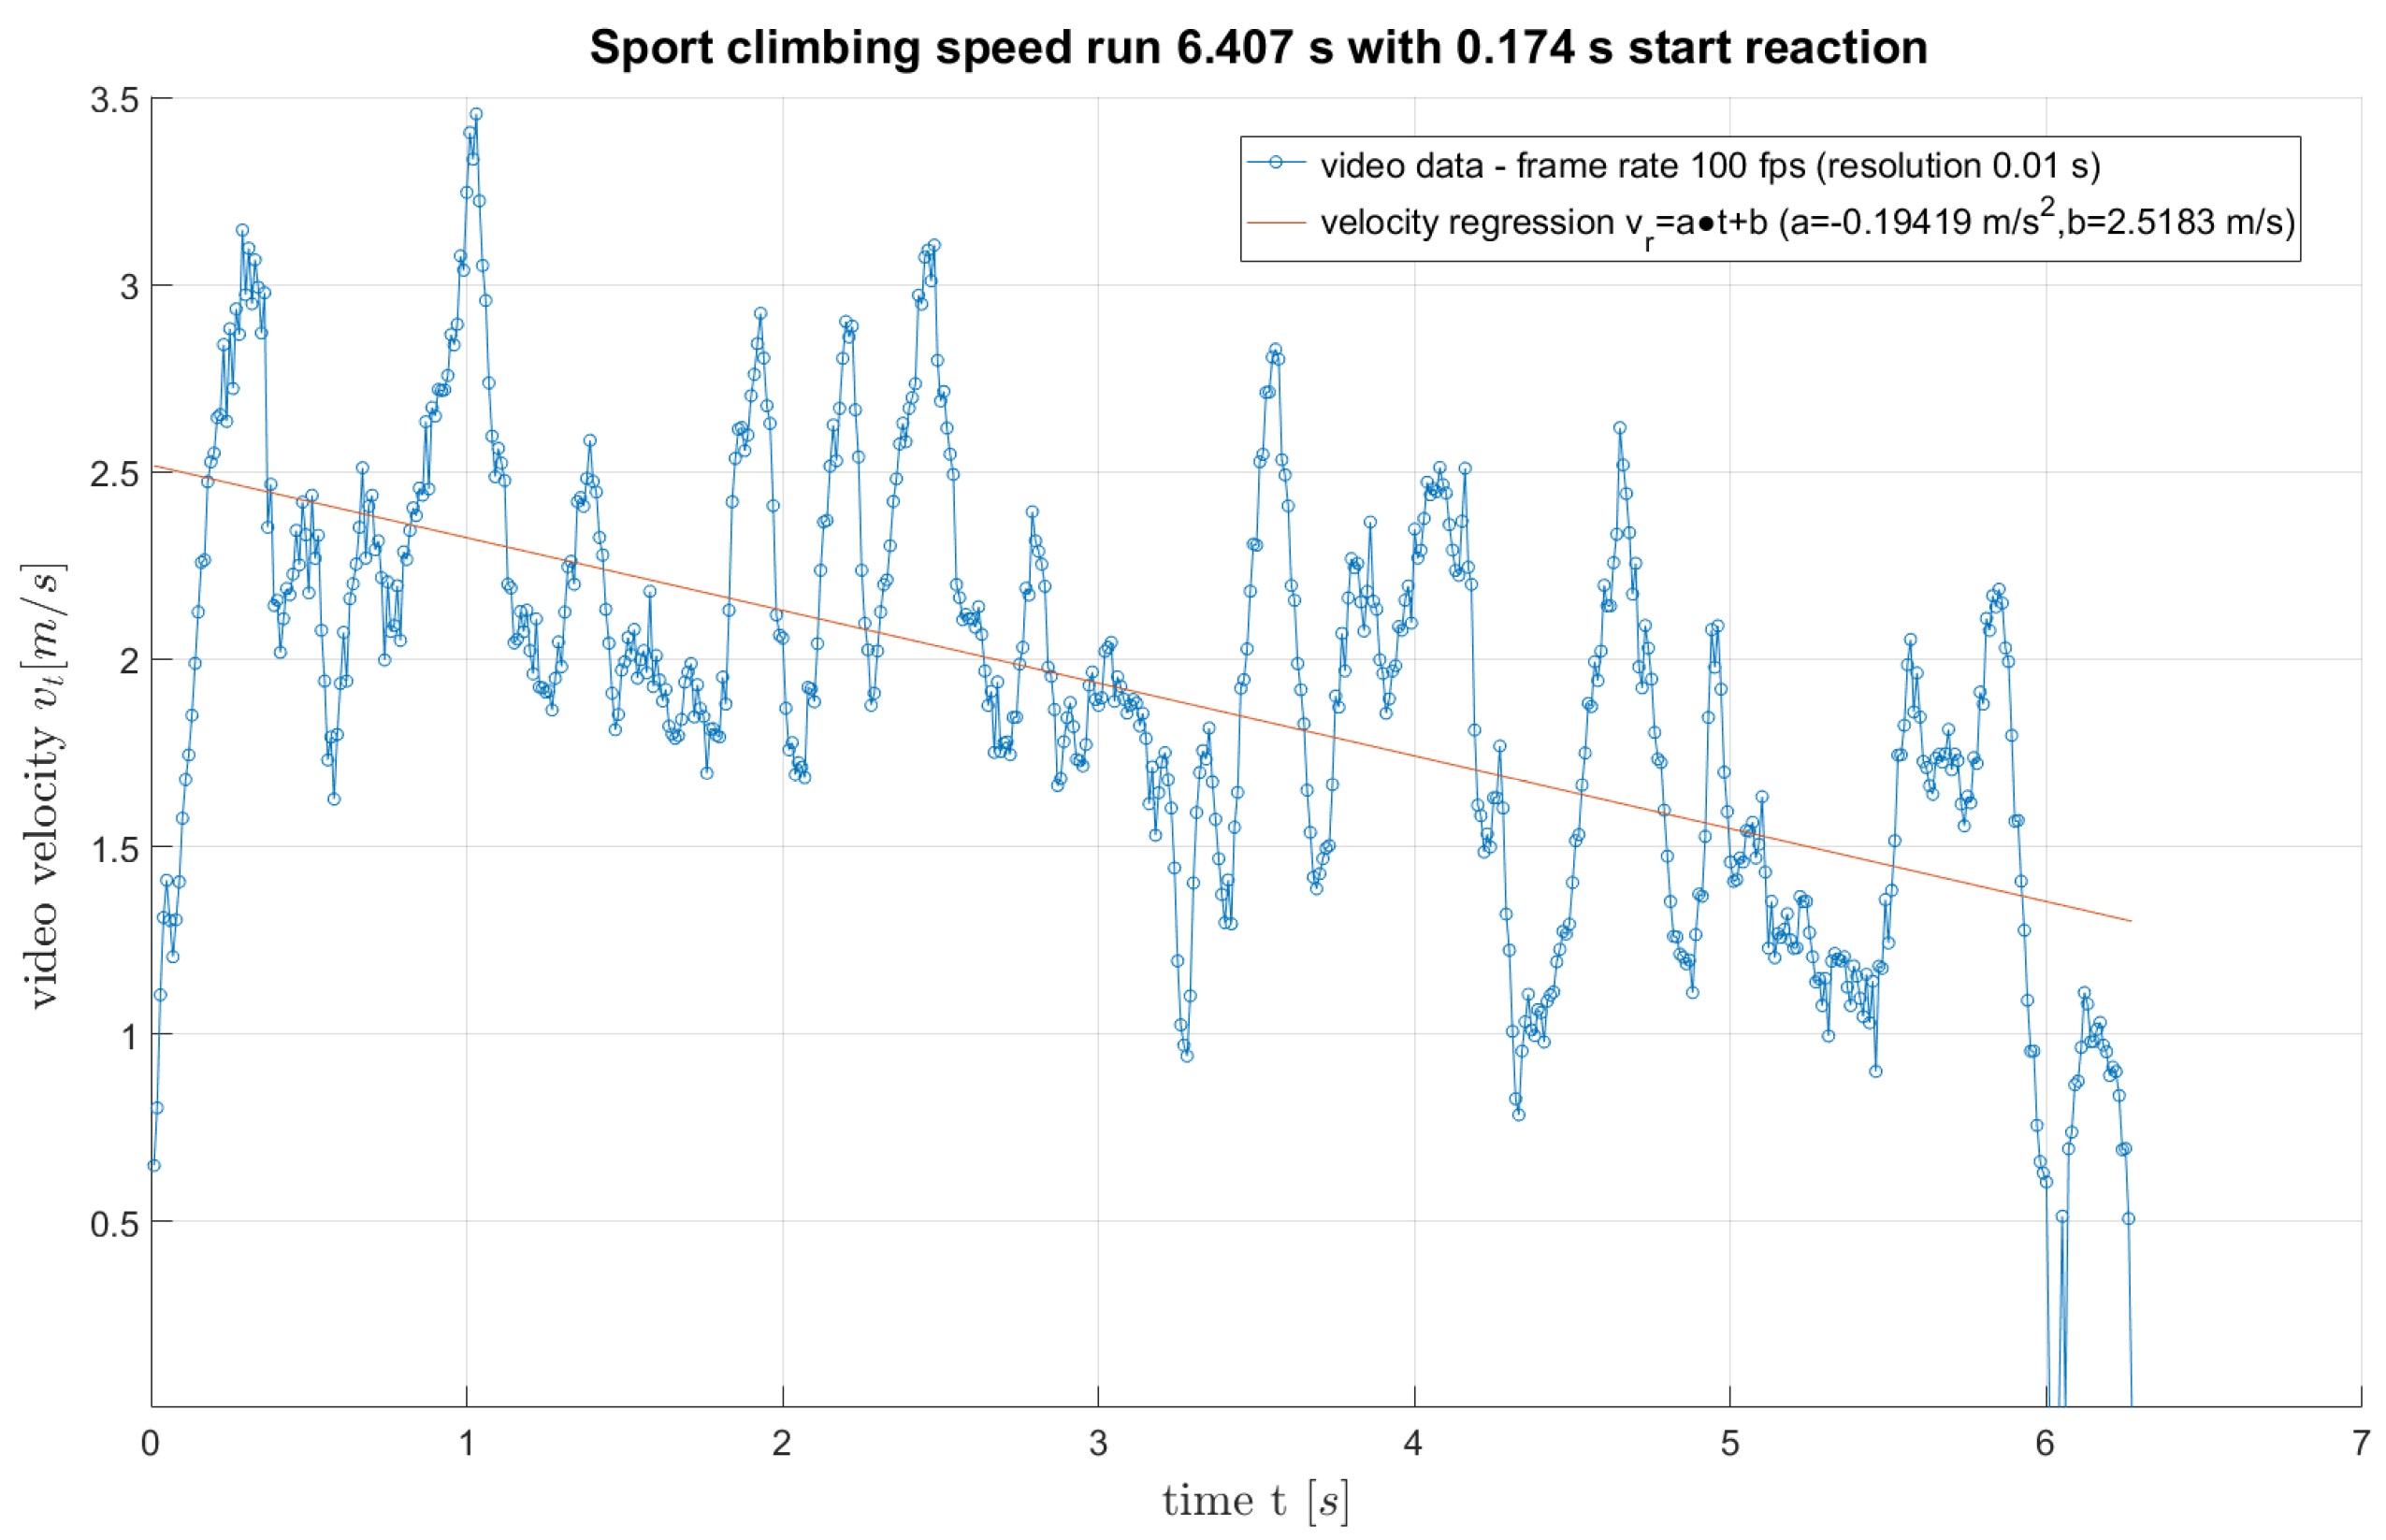
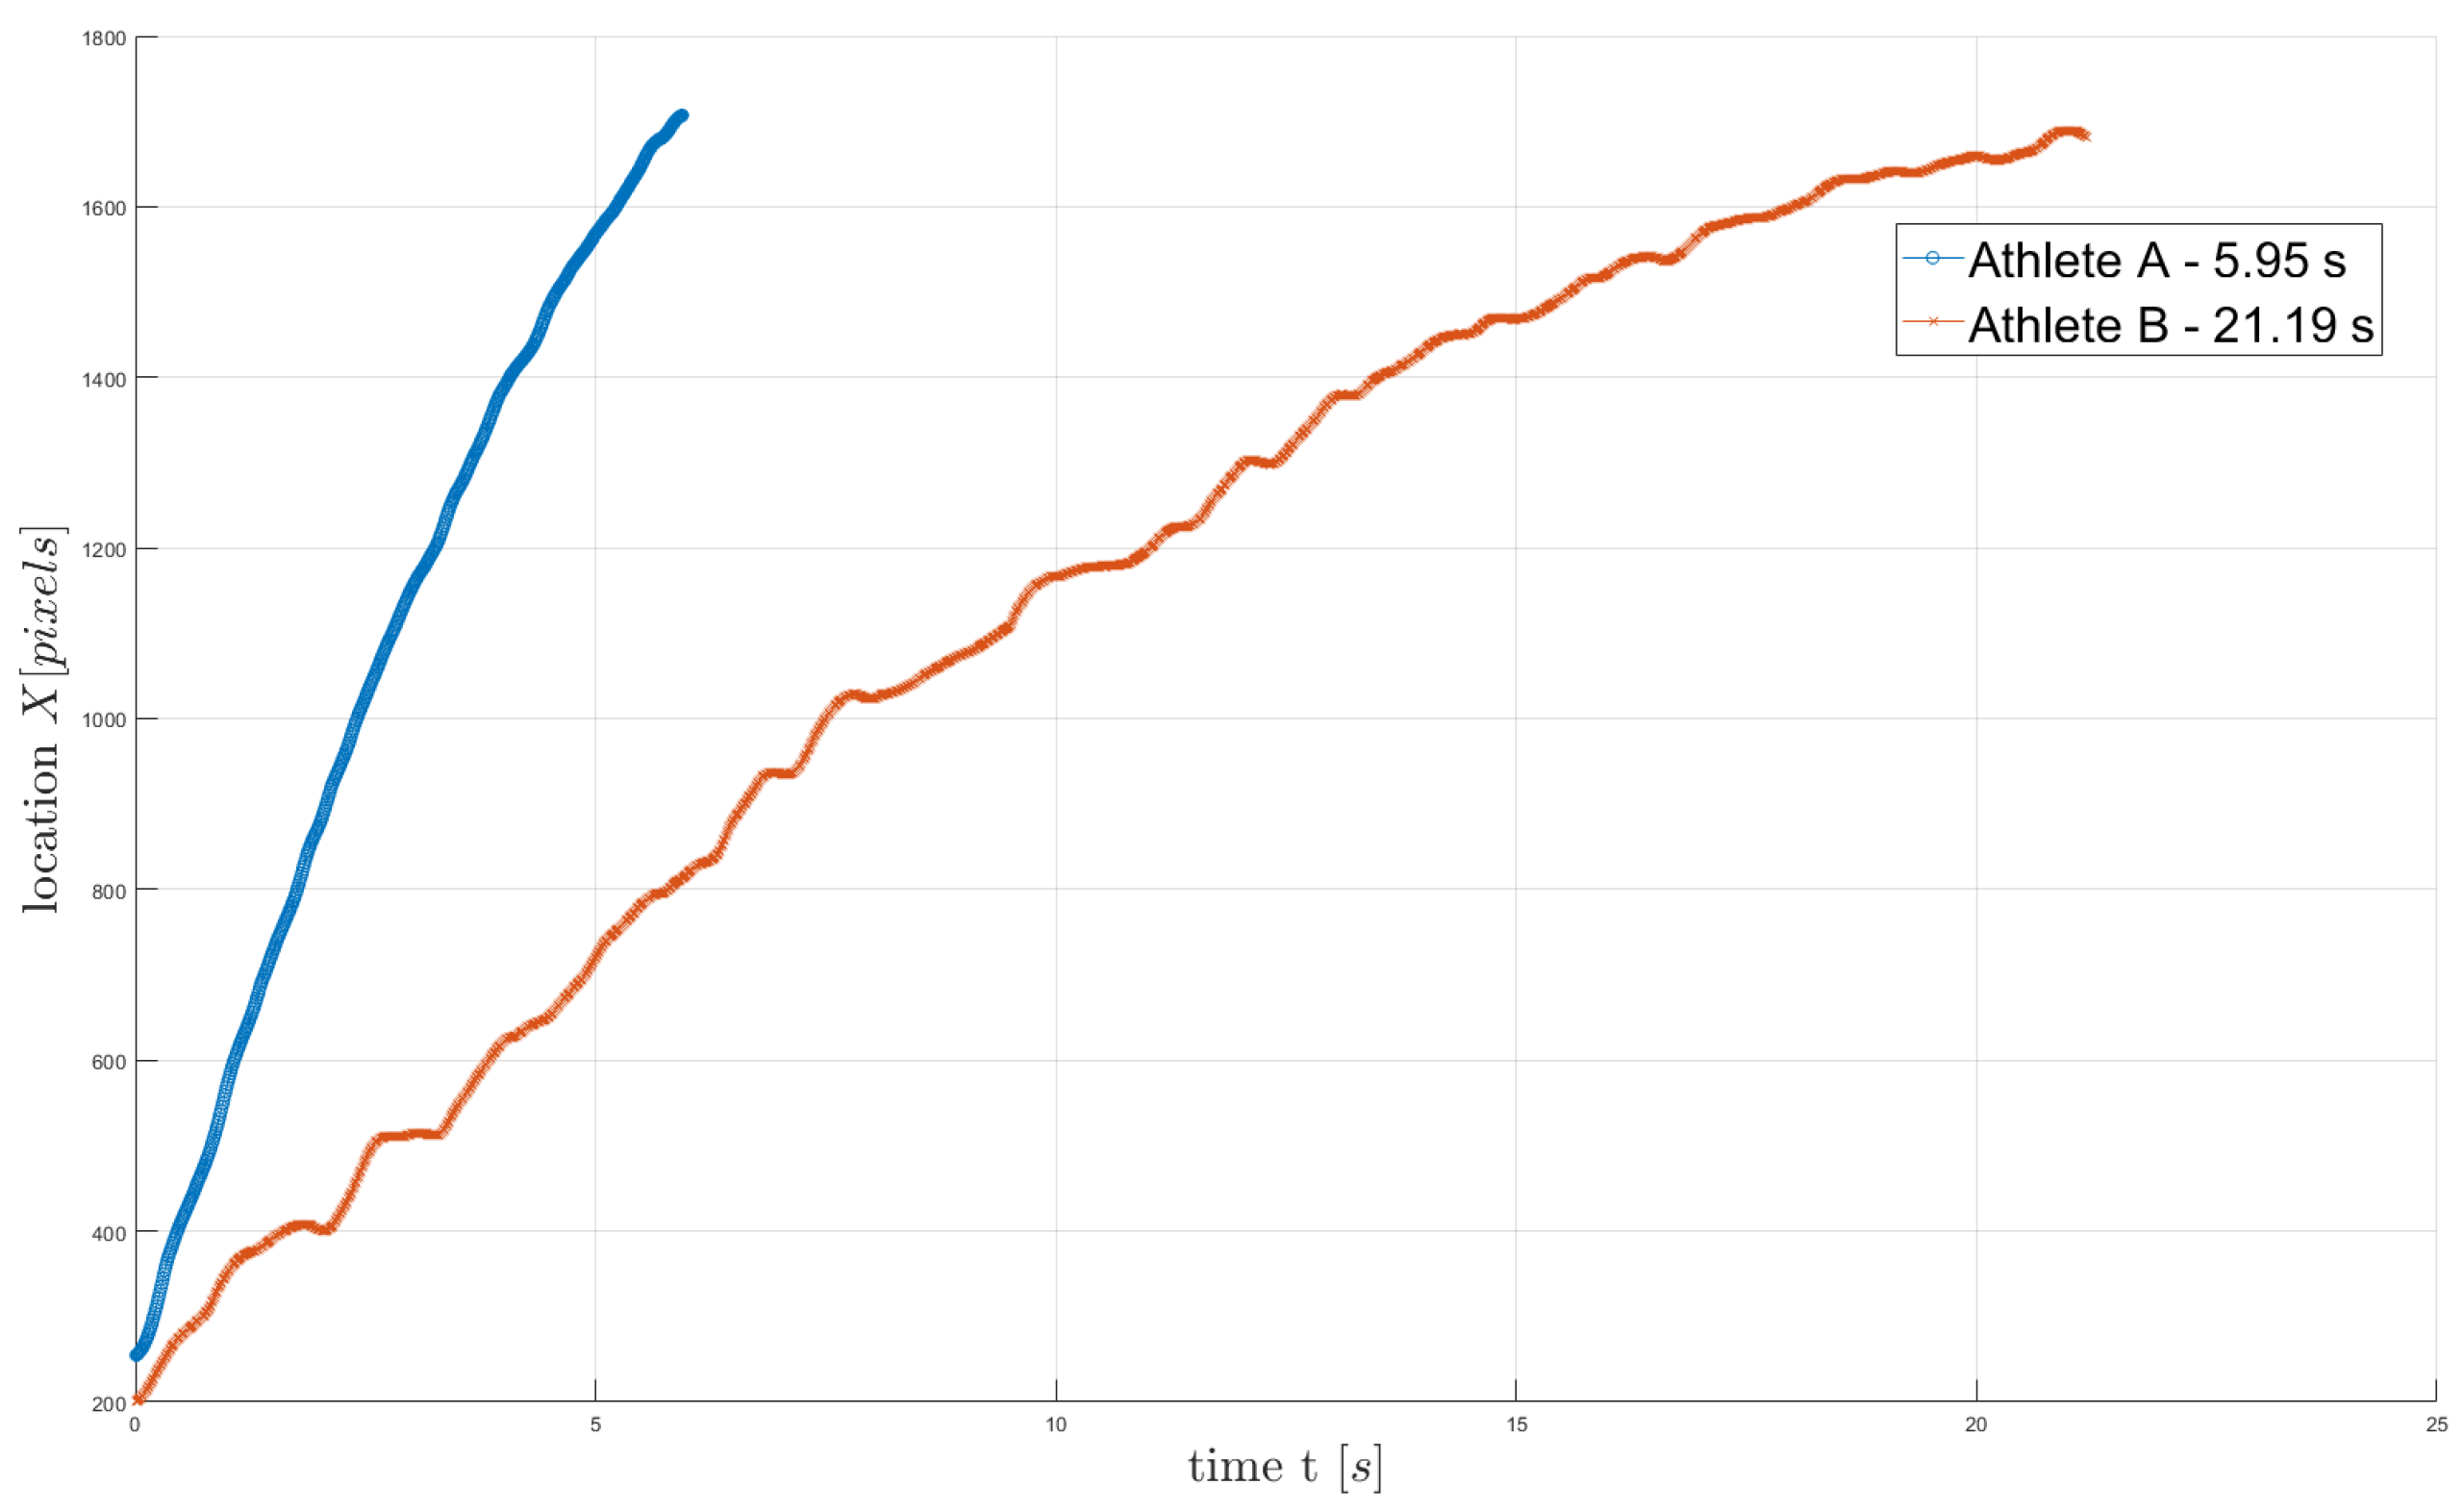 Figure 7. A comparison velocity of the BMC speed two climbers for first 11 foot and handholds (Figure 1).Figure 7. A comparison velocity of the BMC speed two climbers for first 11 foot and handholds (Figure 1).