Submitted:
25 January 2023
Posted:
10 February 2023
You are already at the latest version
Abstract
Keywords:
1. Introduction
2. Membrane separation unit simulation
3. Design of the technological scheme for CO2 capture
3. Result and discussion
3.1. Influence of membrane selectivity on CO2 capture efficiency
3.2. The effect of the membrane area
3.3. Feasibility study for a membrane cascade type of «Continuous Membrane Column» for carbon dioxide capture from CHPP flue gases
4. Conclusions
Acknowledgments
References
- Https://www.epa.gov/ghgemissions/overview-greenhouse-gases, No Title, (n.d.).
- https://www.weforum.org/agenda/2020/07/climate-change-increased-carbon-dioxide-emissions-scientists/, (n.d.).
- P.A. Smithson, The united states national climate assessment reports, International Journal of Climatology. 1147 (2002) 2002. [CrossRef]
- https://www.iea.org/reports/net-zero-by-2050, (n.d.)., (n.d.).
- G.T. Rochelle, G.T. Rochelle, Amine Scrubbing for CO2 Capture, 1652 (2012). [CrossRef]
- M.M.F. Hasan, R.C. Baliban, J.A. Elia, C.A. Floudas, Modeling , Simulation , and Optimization of Postcombustion CO2 Capture for Variable Feed Concentration and Flow Rate . 2 . Pressure Swing Adsorption and Vacuum Swing Adsorption Processes, (2012).
- X. Zhang, B. Singh, X. He, T. Gundersen, International Journal of Greenhouse Gas Control Post-combustion carbon capture technologies : Energetic analysis and life cycle assessment, International Journal of Greenhouse Gas Control. 27 (2014) 289–298. [CrossRef]
- D. Figueroa, T. Fout, S. Plasynski, H. Mcilvried, R.D. Srivastava, Advances in CO2 capture technology — The U . S . Department of Energy ’ s Carbon Sequestration Program §, 2 (2008) 9–20. [CrossRef]
- COST AND PERFORMANCE BASELINE FOR FOSSIL ENERGY PLANTS VOLUME 1 : BITUMINOUS COAL AND, 1 (2019).
- T.C. Merkel, H. Lin, X. Wei, R. Baker, Power plant post-combustion carbon dioxide capture : An opportunity for membranes, J Memb Sci. 359 (2010) 126–139. [CrossRef]
- X. Zhang, B. Singh, X. He, T. Gundersen, L. Deng, S. Zhang, Post-combustion carbon capture technologies: Energetic analysis and life cycle assessment, International Journal of Greenhouse Gas Control. 27 (2014) 289–298. [CrossRef]
- A.N. Petukhov, A.A. Atlaskin, M.S. Kudryavtseva, S.S. Kryuchkov, D.N. Shablykin, E.A. Stepanova, K.A. Smorodin, O. v. Kazarina, M.M. Trubyanov, M.E. Atlaskina, A.N. Petukhova, A.N. Markov, A. v. Vorotyntsev, L.A. Mochalov, I. v. Vorotynstev, CO2 capture process through hybrid gas hydrate-membrane technology: Complex approach for the transition from theory to practice, J Environ Chem Eng. 10 (2022) 108104. [CrossRef]
- A.N. Petukhov, D.N. Shablykin, M.M. Trubyanov, A.A. Atlaskin, D.M. Zarubin, A. v. Vorotyntsev, E.A. Stepanova, K.A. Smorodin, O. v. Kazarina, A.N. Petukhova, V.M. Vorotyntsev, I. v. Vorotynstev, A hybrid batch distillation/membrane process for high purification part 2: Removing of heavy impurities from xenon extracted from natural gas, Sep Purif Technol. 294 (2022) 121230. [CrossRef]
- A.N. Petukhov, A.A. Atlaskin, S.S. Kryuchkov, K.A. Smorodin, D.M. Zarubin, A.N. Petukhova, M.E. Atlaskina, A. v. Nyuchev, A. v. Vorotyntsev, M.M. Trubyanov, I. v. Vorotyntsev, V.M. Vorotynstev, A highly-efficient hybrid technique – Membrane-assisted gas absorption for ammonia recovery after the Haber-Bosch process, Chemical Engineering Journal. 421 (2021) 127726. [CrossRef]
- B. Membrane Separation Processes for Post-Combustion Carbon Dioxide Capture : State of the Art and Critical Overview-Bouchra, F. Eric, Membrane Separation Processes for Post-Combustion Carbon Dioxide Capture : State of the Art and Critical Overview, 69 (2014). [CrossRef]
- A. Skorek-osikowska, J. Kotowicz, K. Janusz-szyman, Comparison of the Energy Intensity of the Selected CO2 -Capture Methods Applied in the Ultra-supercritical Coal Power Plants, (2012).
- A.I. Akhmetshina, A.N. Petukhov, O.R. Gumerova, A.V. Vorotyntsev, A.V. Nyuchev, I.V. Vorotyntsev, Solubility of H2S and CO2 in imidazolium-based ionic liquids with bis(2-ethylhexyl) sulfosuccinate anion, Journal of Chemical Thermodynamics. 130 (2019) 173–182. [CrossRef]
- L. Zhao, E. Riensche, R. Menzer, L. Blum, D. Stolten, A parametric study of CO2 / N2 gas separation membrane processes for post-combustion capture, 325 (2008) 284–294. [CrossRef]
- E. Riensche, Cascaded Membrane Processes for Post-Combustion CO2 Capture, (2012) 489–496. [CrossRef]
- O. Mirgaux, R. Bounaceur, Simulation of Post-Combustion CO2 Capture , a Comparison among Absorption , Adsorption and Membranes, (2019) 797–804. [CrossRef]
- M. Pfister, B. Belaissaoui, E. Favre, wet post combustion flue gases : physical vs chemically reactive membranes Membrane gas separation processes from wet post combustion flue gases for carbon capture and use ( CCU ): a critical reassessment, (2016). [CrossRef]
- L. Zhao, E. Riensche, L. Blum, D. Stolten, Multi-stage gas separation membrane processes used in post-combustion capture : Energetic and economic analyses, J Memb Sci. 359 (2010) 160–172. [CrossRef]
- L. Zhao, R. Menzer, E. Riensche, L. Blum, D. Stolten, Energy Procedia Concepts and investment cost analyses of multi-stage membrane systems used in post-combustion processes, Energy Procedia. 1 (2009) 269–278. [CrossRef]
- GitHub - CCSI-Toolset/membrane_model: Membrane Separation Model: Updated hollow fiber membrane model and system example for carbon capture., (n.d.). https://github.com/CCSI-Toolset/membrane_model (accessed November 11, 2019).]., (n.d.).
- V.M. Vorotyntsev, P.N. Drozdov, I.V. Vorotyntsev, D.V. Murav’Ev, Fine gas purification to remove slightly penetrating impurities using a membrane module with a feed reservoir, Doklady Chemistry. 411 (2006) 243–245. [CrossRef]
- M.M. Trubyanov, S.Y. Kirillov, A.V. Vorotyntsev, T.S. Sazanova, A.A. Atlaskin, A.N. Petukhov, Y.P. Kirillov, I.V. Vorotyntsev, Dynamic behavior of unsteady-state membrane gas separation: Modelling of a closed-mode operation for a membrane module, J Memb Sci. 587 (2019). [CrossRef]
- I.V. Vorotyntsev, P.N. Drozdov, D.N. Shablikin, T.V. Gamajunova, Ammonia separation and purification by absorbing pervaporation, Desalination. 200 (2006) 379–380. [CrossRef]
- V.M. Vorotyntsev, G.M. Mochalov, A.K. Matveev, A.V. Malyshev, I.V. Vorotyntsev, Determination of Trace Impurities of H2, O2, Ar, N2, CO, CO2, and Hydrocarbons in High-Purity Monosilane by Gas Chromatography, Journal of Analytical Chemistry. 58 (2003) 156–159. [CrossRef]
- A.A. Atlaskin, A.N. Petukhov, N.R. Yanbikov, M.E. Salnikova, M.S. Sergeeva, V.M. Vorotyntsev, I.V. Vorotyntsev, Evaluation of the absorbing pervaporation technique for ammonia recovery after the Haber process, Chemical and Process Engineering - Inzynieria Chemiczna i Procesowa. 39 (2018) 323–333. [CrossRef]
- GitHub - CCSI-Toolset/membrane_model: Membrane Separation Model: Updated hollow fiber membrane model and system example for carbon capture., (n.d.). https://github.com/CCSI-Toolset/membrane_model (accessed November 11, 2019).]., (n.d.).
- C.F. Martins, L.A. Neves, R. Chagas, L.M. Ferreira, I.M. Coelhoso, J.G. Crespo, Removing CO2 from Xenon anaesthesia circuits using an amino-acid ionic liquid solution in a membrane contactor, Sep Purif Technol. 275 (2021) 119190. [CrossRef]
- A.A. Atlaskin, M.M. Trubyanov, N.R. Yanbikov, S.S. Kryuchkov, A.A. Chadov, K.A. Smorodin, P.N. Drozdov, V.M. Vorotyntsev, I.V. Vorotyntsev, Experimental Evaluation of the Efficiency of Membrane Cascades Type of “Continuous Membrane Column” in the Carbon Dioxide Capture Applications, Membranes and Membrane Technologies. 2 (2020) 35–44. [CrossRef]
- A.A. Atlaskin, M.M. Trubyanov, N.R. Yanbikov, A.V. Vorotyntsev, P.N. Drozdov, V.M. Vorotyntsev, I.V. Vorotyntsev, Comprehensive experimental study of membrane cascades type of “continuous membrane column” for gases high-purification, J Memb Sci. 572 (2019) 92–101. [CrossRef]
- T.C. Merkel, H. Lin, X. Wei, R. Baker, Power plant post-combustion carbon dioxide capture: An opportunity for membranes, J Memb Sci. 359 (2010) 126–139. [CrossRef]


| Parameter | Value |
|---|---|
| Gas mixture inlet flow, kmol h-1 | 976 154 |
| Pressure, MPa | 0.1 |
| Composition, mol.% N2 CO2 |
83 17 |
| Parameter. | Value | Units |
|---|---|---|
| Pressure in the feed side, MPa | 0.15 | MPa |
| Pressure in the permeate side, MPa | 0.02 | MPa |
| Membrane area, m2 | ||
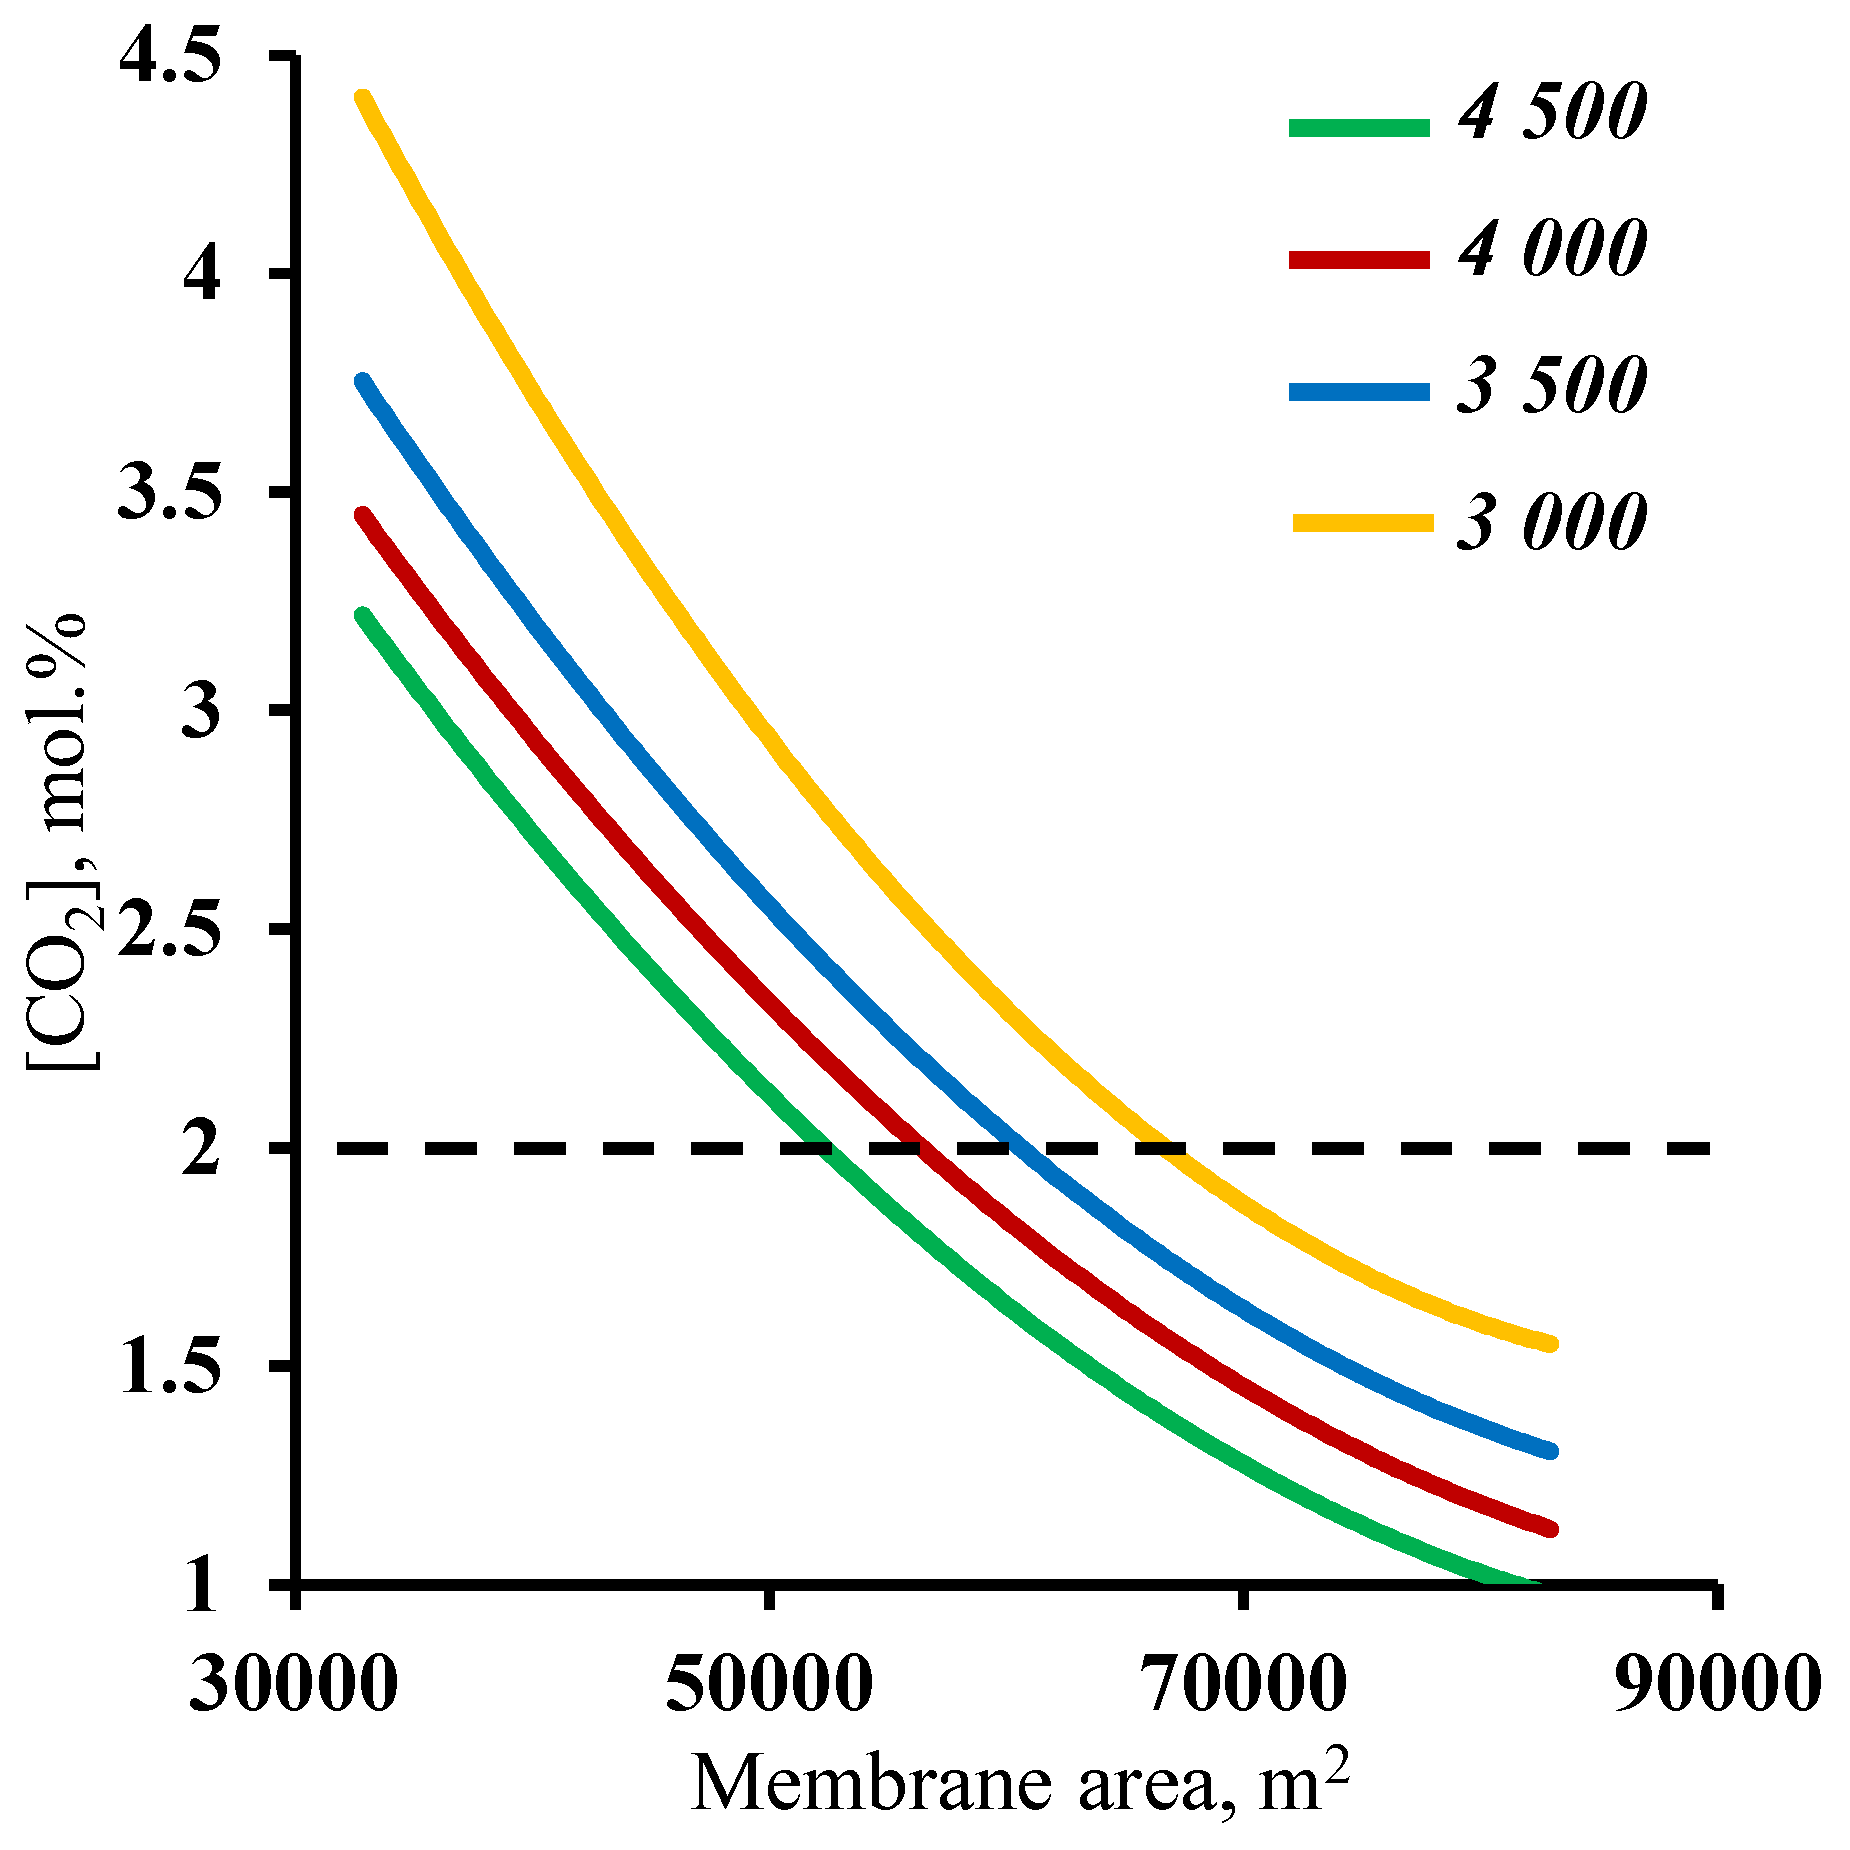
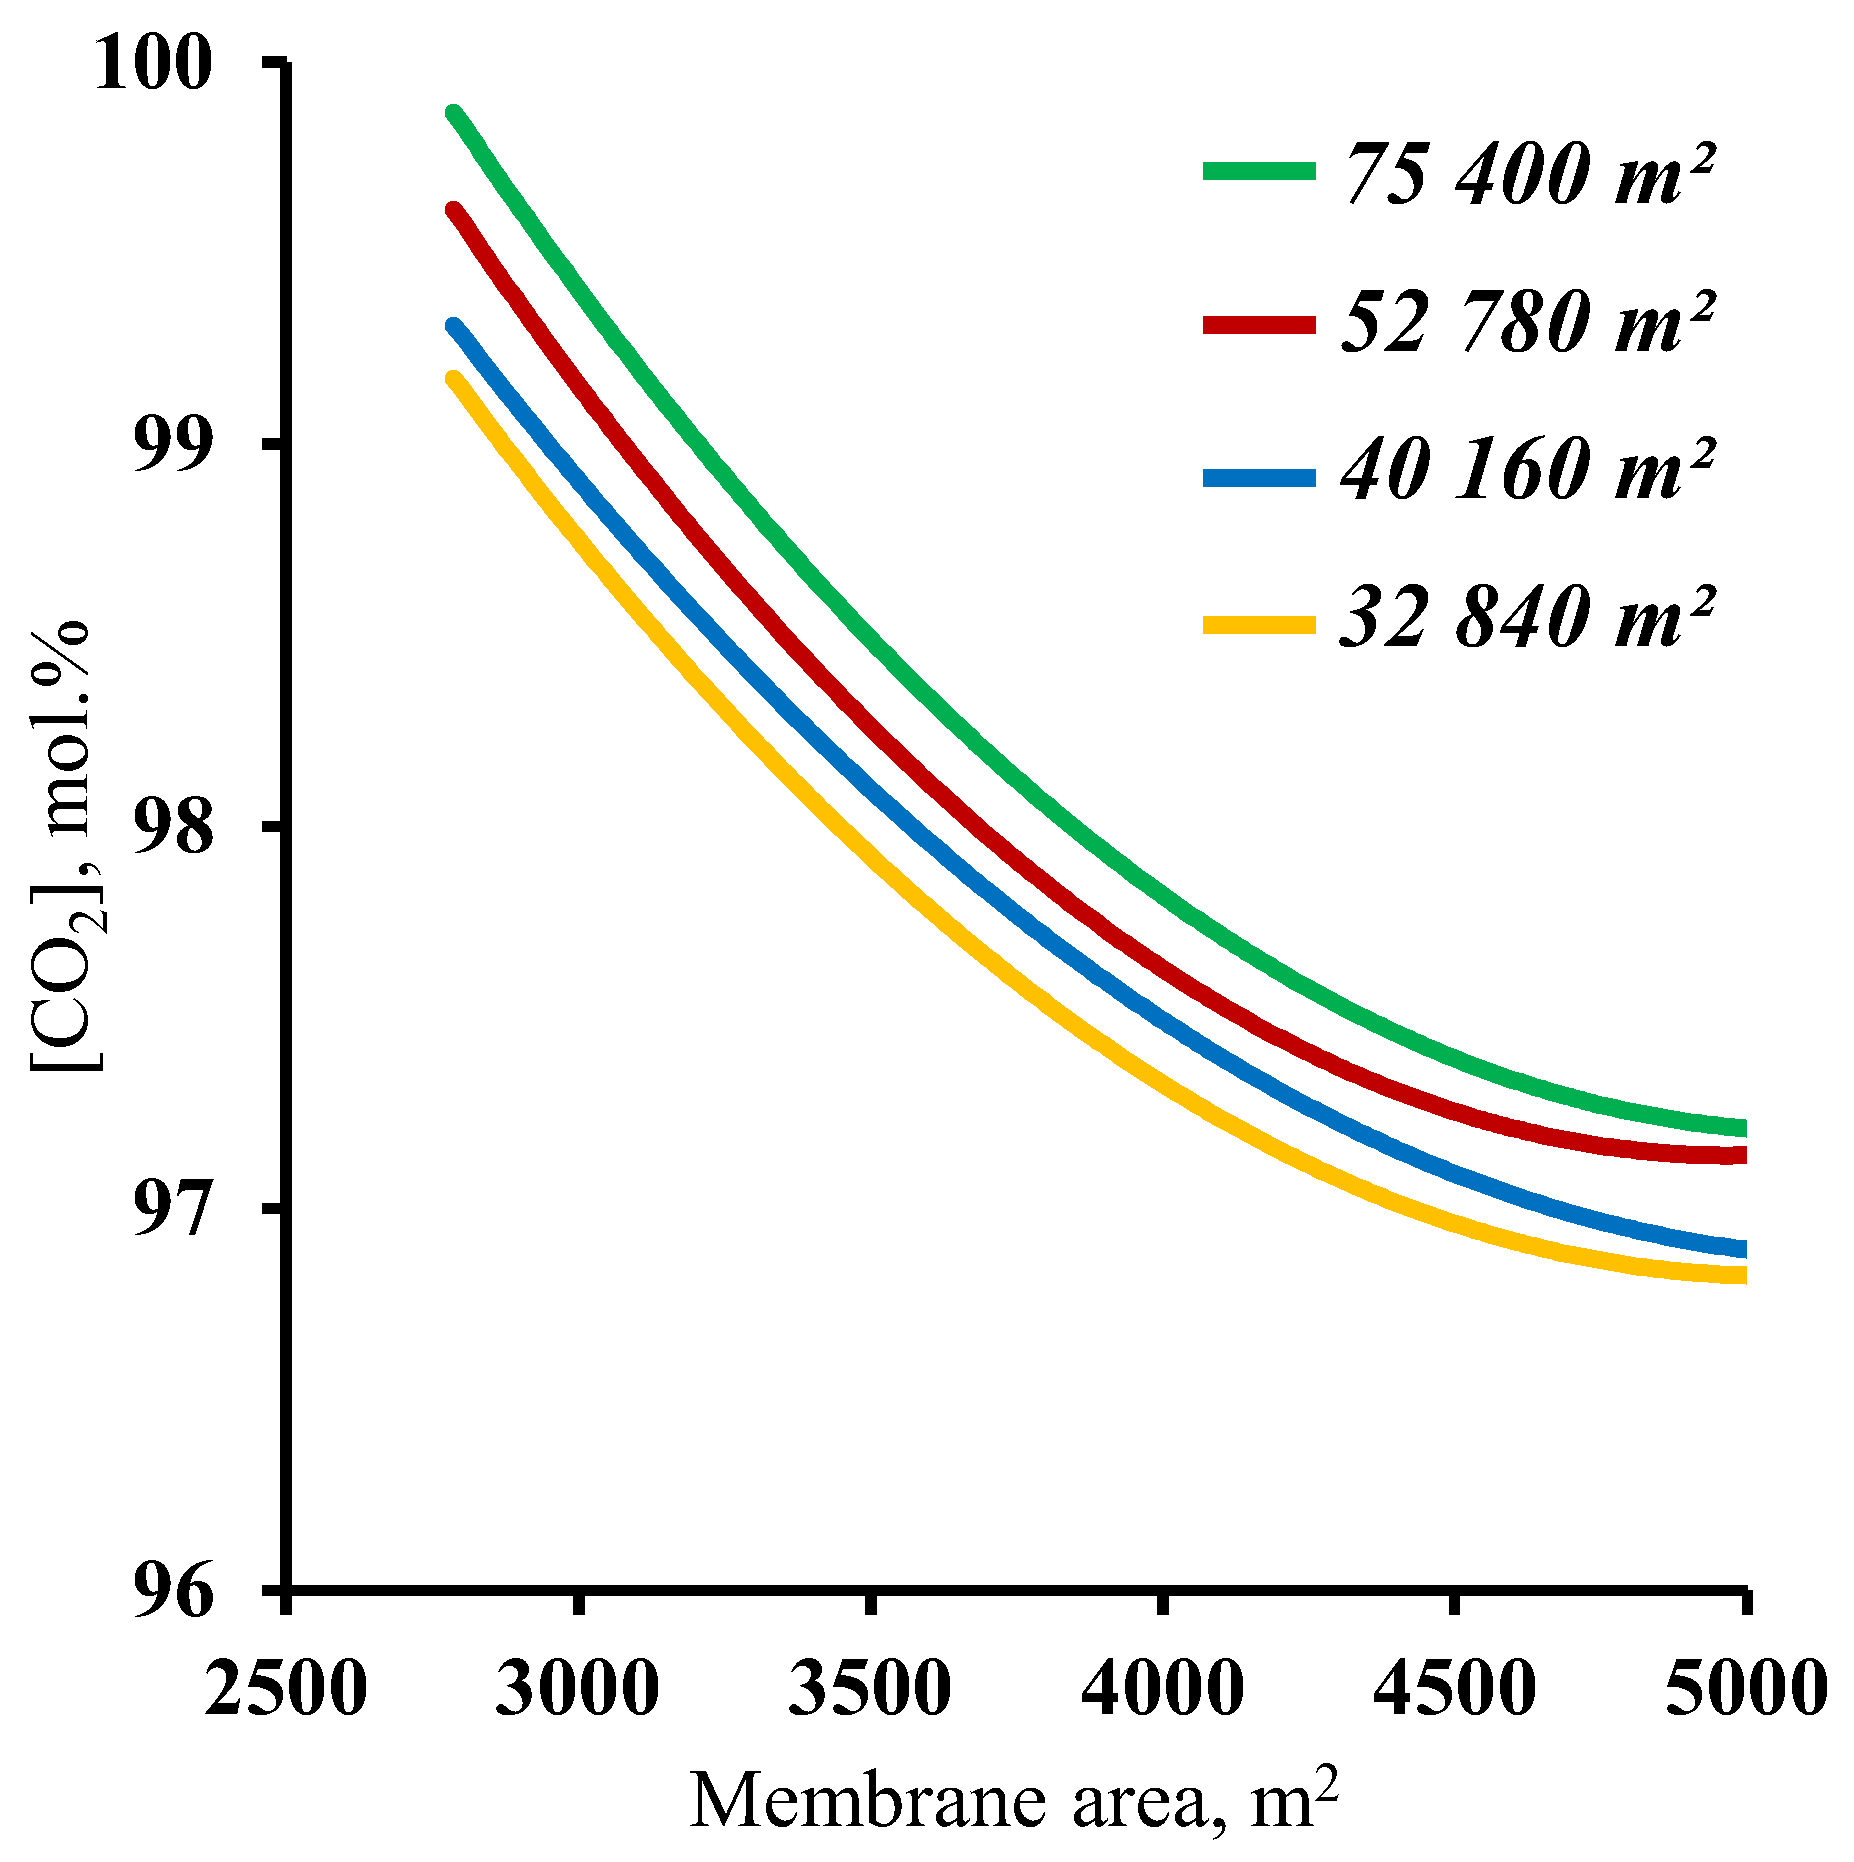
| Stripping section | 52 780 | m2 |
| Enrichment section | 4 500 | m2 |
| Membrane permeance, GPU | 1 000 | GPU |
| Membrane selectivity for CO2/N2 | 50 | |
| CO2 content, mol.% | ||
| Product flow | 97.2 | mol.% |
| Residual flow | 1.87 | mol.% |
Disclaimer/Publisher’s Note: The statements, opinions and data contained in all publications are solely those of the individual author(s) and contributor(s) and not of MDPI and/or the editor(s). MDPI and/or the editor(s) disclaim responsibility for any injury to people or property resulting from any ideas, methods, instructions or products referred to in the content. |
© 2023 by the authors. Licensee MDPI, Basel, Switzerland. This article is an open access article distributed under the terms and conditions of the Creative Commons Attribution (CC BY) license (http://creativecommons.org/licenses/by/4.0/).


