1. Introduction
Cichorium intybus L., or chicory (2
x=2
n=18), is a perennial leafy vegetable belonging to the Asteraceae family. This species, cultivated worldwide for its adaptability to various environmental conditions, has been domesticated into the current vegetable products. It is an economically important European horticultural crop, and it is one of the most important among those cultivated in the Veneto region, north-eastern Italy, where it is differentiated into multiple different biotypes. The phenotypic variability observable in this species is well-represented by the local varieties of
C. intybus originally from the Veneto region, where this crop took the traditional name “radicchio” [
1,
2,
3,
4,
5]. Multiple chicory varieties are cultivated in this area, where their common ancestral biotype was first introduced during the 17th century, the “Late Red of Treviso”. During the following centuries, other biotypes differentiated by selection or due to interspecific mating with its related interfertile species, namely,
Cichorium endivia L. (endive) [
3,
5]. Within the
Cichorium genus, the compatible and crossable species
C. endivia (2
x=2
n=18) is present, which is characterized by having a completely different mating habit from
C. intybus. In the case of chicory, sporophytic self-incompatibility (SSI) causes an obligate allogamous mating system that makes the development of highly homozygous inbred lines difficult to achieve [
4,
6]; while in the case of endive, a prevalently autogamous species, cross-pollination is more difficult than in chicory, thus inhibiting the easy obtainment of F1 hybrids. Despite this, and as previously mentioned, it is possible to cross these two
Cichorium species for the development of interspecific hybrids. In the past, by crossing these two species, biotypes of radicchio appeared, such as the “Red of Chioggia”, which now has economic importance and traditional value and can become a genetic variability resource for future breeding improvement plans in this crop [
3,
5,
7,
8]. Moreover, nuclear male-sterility (NMS) was found to be another efficient reproductive barrier observed in chicory, particularly in “Red of Chioggia” biotype varieties [
9,
10], capable of enhancing cross-pollination. NMS in Red of Chioggia is the result of a 4nt insertion (5’-AATT-3’) within the second exon of the
myb80-like gene that, in the recessive homozygous state (
msms), is responsible for the lack of pollen liberation from anthers[
11]. The insertion causes a frameshift of the coding sequences, which, as a consequence, produces a shorter and nonfunctional MYB80-like protein due to the insurgence of a “stop” codon in between the second exon of the gene. Consequently, when in the recessive homozygous state, the male-sterile phenotype appears.
These two reproductive barriers (SSI and NMS), known for reducing self-pollination and enhancing heterozygosity in natural populations, can be useful or inhibitory in crop breeding depending on the aim. In fact, as they force out-breeding, thus reducing the frequency of homozygous progenies, these two reproductive barriers negatively influence the development of inbred parental lines, but they can be positively adopted to direct pair-wise crossings for the constitution of F1 hybrids. In particular, SSI in chicory, which is reported to be incompletely functional allowing low ratios of inbreeding [
12,
13,
14,
15], normally inhibits self-pollination and the constitution of inbred lines; while MS, also preventing self-pollination, can be exploited to direct cross-pollination between two genetically differentiated parental lines using one as pollen parent (male-fertile;
Ms/-) and the other as seed parent (male-sterile;
msms), paternal and maternal genotypes, respectively. Adopting this breeding strategy, highly heterozygous F1 hybrid progenies can be obtained by avoiding the harvesting of selfing-derived seeds from the male-sterile maternal line. Given the characteristics and possible implications of these two reproductive barriers, the adoption of molecular tools for screening breeding populations to select the desired genotypes would improve the breeding strategies of
Cichorium crops by reducing the time and costs needed to obtain the target plant.
While the first biotypes of radicchio were selected by phenotypic mass selection, the current breeding strategies are supported by genotypic selection assisted by molecular markers and genomics as the main analytical tools. Currently, the newly released varieties of pure
C. intybus as well as its interspecific biotypes with
C. endivia are mainly F1 hybrids developed by Italian or European seed firms through large-scale single crosses between inbred lines selected according to their specific combining ability [
5,
16]. Thus, to maximize the heterosis phenomenon [
17]), breeding programs of radicchio have significantly improved in recent years thanks to the use of more efficient molecular tools and analytical platforms [
16,
18,
19,
20,
21]. To date in chicory, several linkage maps saturated with DNA markers and spanning the entire genome size have been produced and are available [
18,
19,
21,
22]. In particular, 29 selected simple sequence repeat (SSR) markers have demonstrated their potential in determining genetic similarities and differences in chicory populations for distinctiveness, uniformity and stability (DUS) testing and plant variety protection (PVP) [
16]. In addition to SSR markers, one phenotype-related molecular marker associated with NMS in chicory has been recently developed that is based on allele-specific PCR (AS-PCR) for
Myb80-like gene genotyping [
11].
Breeding projects assisted by molecular markers require informative and reliable genotyping approaches, and the possibility of predicting a specific phenotype by characterizing the genotype of one specific locus can greatly help and speed the development of new varieties or the preservation or implementation of specific phenotypes. Currently, multiple genomic tools can be used [
23], and the cost-effective aspect has become fundamental in the choice of which method to adopt for genotyping analyses. Among the various approaches that can be chosen, strategies based on genotyping-by-sequencing (GBS) demonstrated their suitability for the practical applications previously mentioned. There are many GBS-related techniques that differ in the sequencing platform, the chemistry they are based on, the type of output, data throughput and other aspects [
24,
25,
26,
27,
28,
29]. Among the available GBS approaches, restriction-site associated DNA sequencing (RADseq) [
30] has demonstrated its potential use in different crop species for breeding, PVP and traceability purposes [
16,
31,
32]. Among the several advantages provided by the adoption of this approach is the unnecessity of an already sequenced genome because a comparative analysis between the sequenced reads can be made even without mapping them onto chromosomes. This certainly makes RADseq a suitable method for partially or poorly unstudied species, even if the availability of a representative genome remains key helpful information for sequencing-based approaches.
Starting from these purposes, the final goal of this study is to provide a screening protocol for genotyping these crops and their interspecific hybrids for breeding purposes by providing a faster, cheaper, and more informative approach than the already available PCR-based markers for genotyping. Taking advantage of the recently published genomes of both chicory and endive [
33], in this study, we evaluated the technical potential and robustness of a RADseq approach as a strategy for GBS-related analysis. In this framework, RAD sequencing has been adopted for the molecular characterization of four populations of the interspecific biotype “Red of Chioggia” of radicchio that derives from an ancestral crossing of
C. intybus and
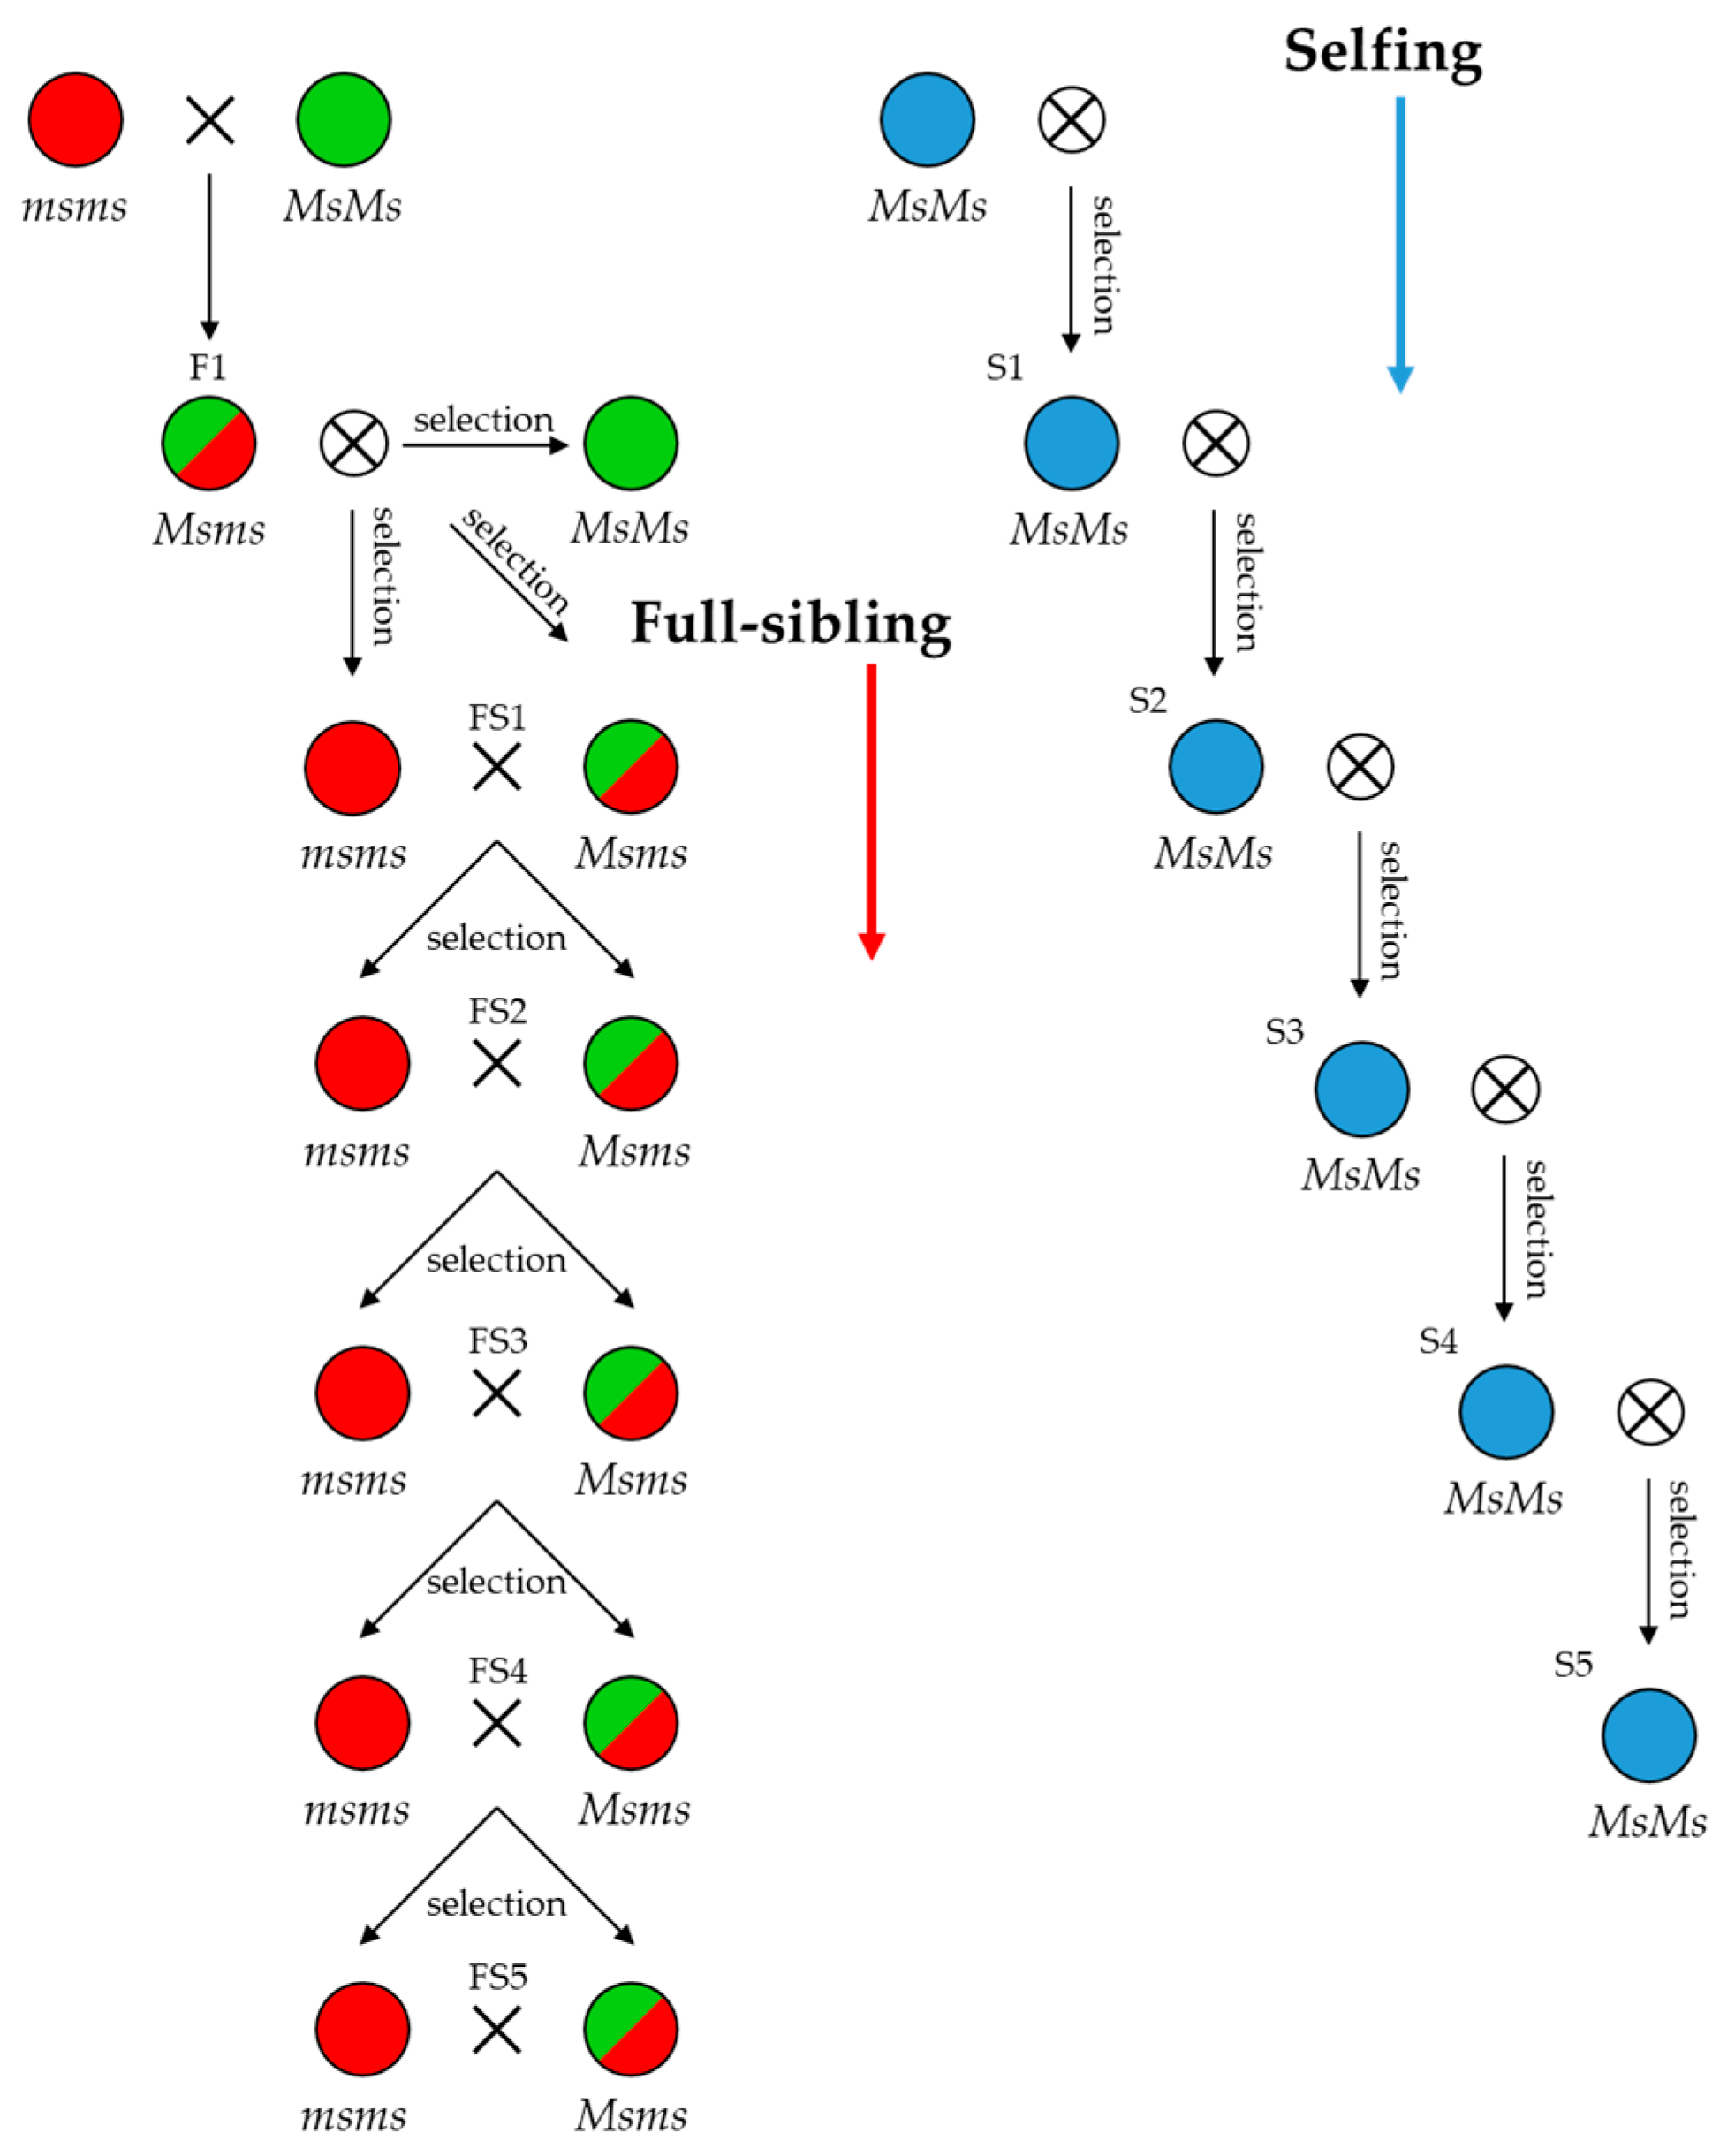
C. endivia. In detail, the aims were to verify the suitability of the RADseq method for genotyping this crop, to establish its ability to determine the genetic distinctiveness and uniformity of four full-sibling (FS) lines and to hypothesize the average heterozygosity and genetic similarity obtainable in the progenies derived from specific crosses or self-pollination in future breeding plans. A representation of the canonical breeding schemes exploiting the NMS locus for breeding full-sibling and selfing-derived inbred lines is available in
Figure 1. Highly homozygous lines can be subsequently used in pair-wise crossing systems between highly dissimilar inbred lines to produce F1 hybrid seeds.
In addition, parallel to the GBS approach and given the nucleotide sequence of the 4nt insertion (AATT) within the previously mentioned myb80-like male-sterile genotype, the adoption of a restriction enzyme that cuts depending on its exact sequence would provide a fast and reliable method for predicting male-fertile and male-sterile phenotypes before anthesis and even before flower development. With this aim, the Tru1I restriction enzyme was considered for its adoption in a CAPS marker essay able to distinguish the 3 possible genotypes and the related phenotypes (2 fertile: MsMs and Msms; 1 sterile: msms). Consequently, the investigation of associations between the GBS-derived RADtags and the CAPS results has been performed concerning male-sterility identification, aiming for future GBS-based marker-assisted selection (MAS) protocols without the need for further experiments.
3. Discussion
The analysis performed in this study confirmed the suitability of the GBS method used. As supported by previous research [
31,
32,
34,
35], the restriction site-associated DNA sequencing method is a reliable tool for genotyping crop species. Genotyping-by-sequencing through RADseq and SNP markers has many possible applications for breeders in MAB, MAS, or PVP purposes. In comparison to other molecular PCR-based approaches, the advantages of RADseq consist of having not only the genotype information but also the availability of nucleotide sequences for each of the marker loci analysed, which can then be mapped in the respective or related crop’s genome. This can be made by requiring less time and with higher precision than using canonical PCR-based approaches, thus allowing the development of more reliable and informative screening assays. Moreover, given the high data throughput of the method adopted (1.8 million raw reads per sample; 9,351 SNVs and over 8 thousand RADtags), the identification of multiple discriminant alleles for different phenotypes would improve MAS approaches by combining multiple information in a single experiment [
27]. These aspects, combined with the reduction in the analysis cost per sample and compared to PCR-based assays [
36], make RADseq a suitable and effective analytical tool for both breeding and basic research applications.
In this study, we successfully analysed 94 individuals belonging to 4 distinct populations of chicory. The genetic statistics, based on almost three thousand SNP markers, demonstrated the good informativeness of the provided method. The ne, which is slightly lower than na, as expected, reflects a relevant variability (Total ne = 1.32; Total na = 1.46) within the observed populations and overall. In agreement with these findings, the F value was close to or below zero among the four populations, thus indicating random mating within them, which is consistent with the full-sibling nature of the analysed populations. Moreover, PL% indicates a relevant variability of both the molecular markers used in the analysis and the analysed populations. Notably, the observed number of private alleles (%PA
max = 8.79% in Pop3 and %PA
total = 16.00%) reflects variable distinctiveness within and among the four populations analysed, which is important information that can be used for PVP and traceability purposes. Other findings that indicated the genetic variability within populations are the observed heterozygosity (Ho
tot = 17.89%) and the F-statistics reported in
Table 2. Noteworthy, gene flow (Nm = 0.631) indicates a tendency of the population to inbreed, in agreement with the full-sibling nature of the populations analysed. Another result, obtained through the AMOVA analysis, reports that almost 75% of the total molecular variation occurs among populations (
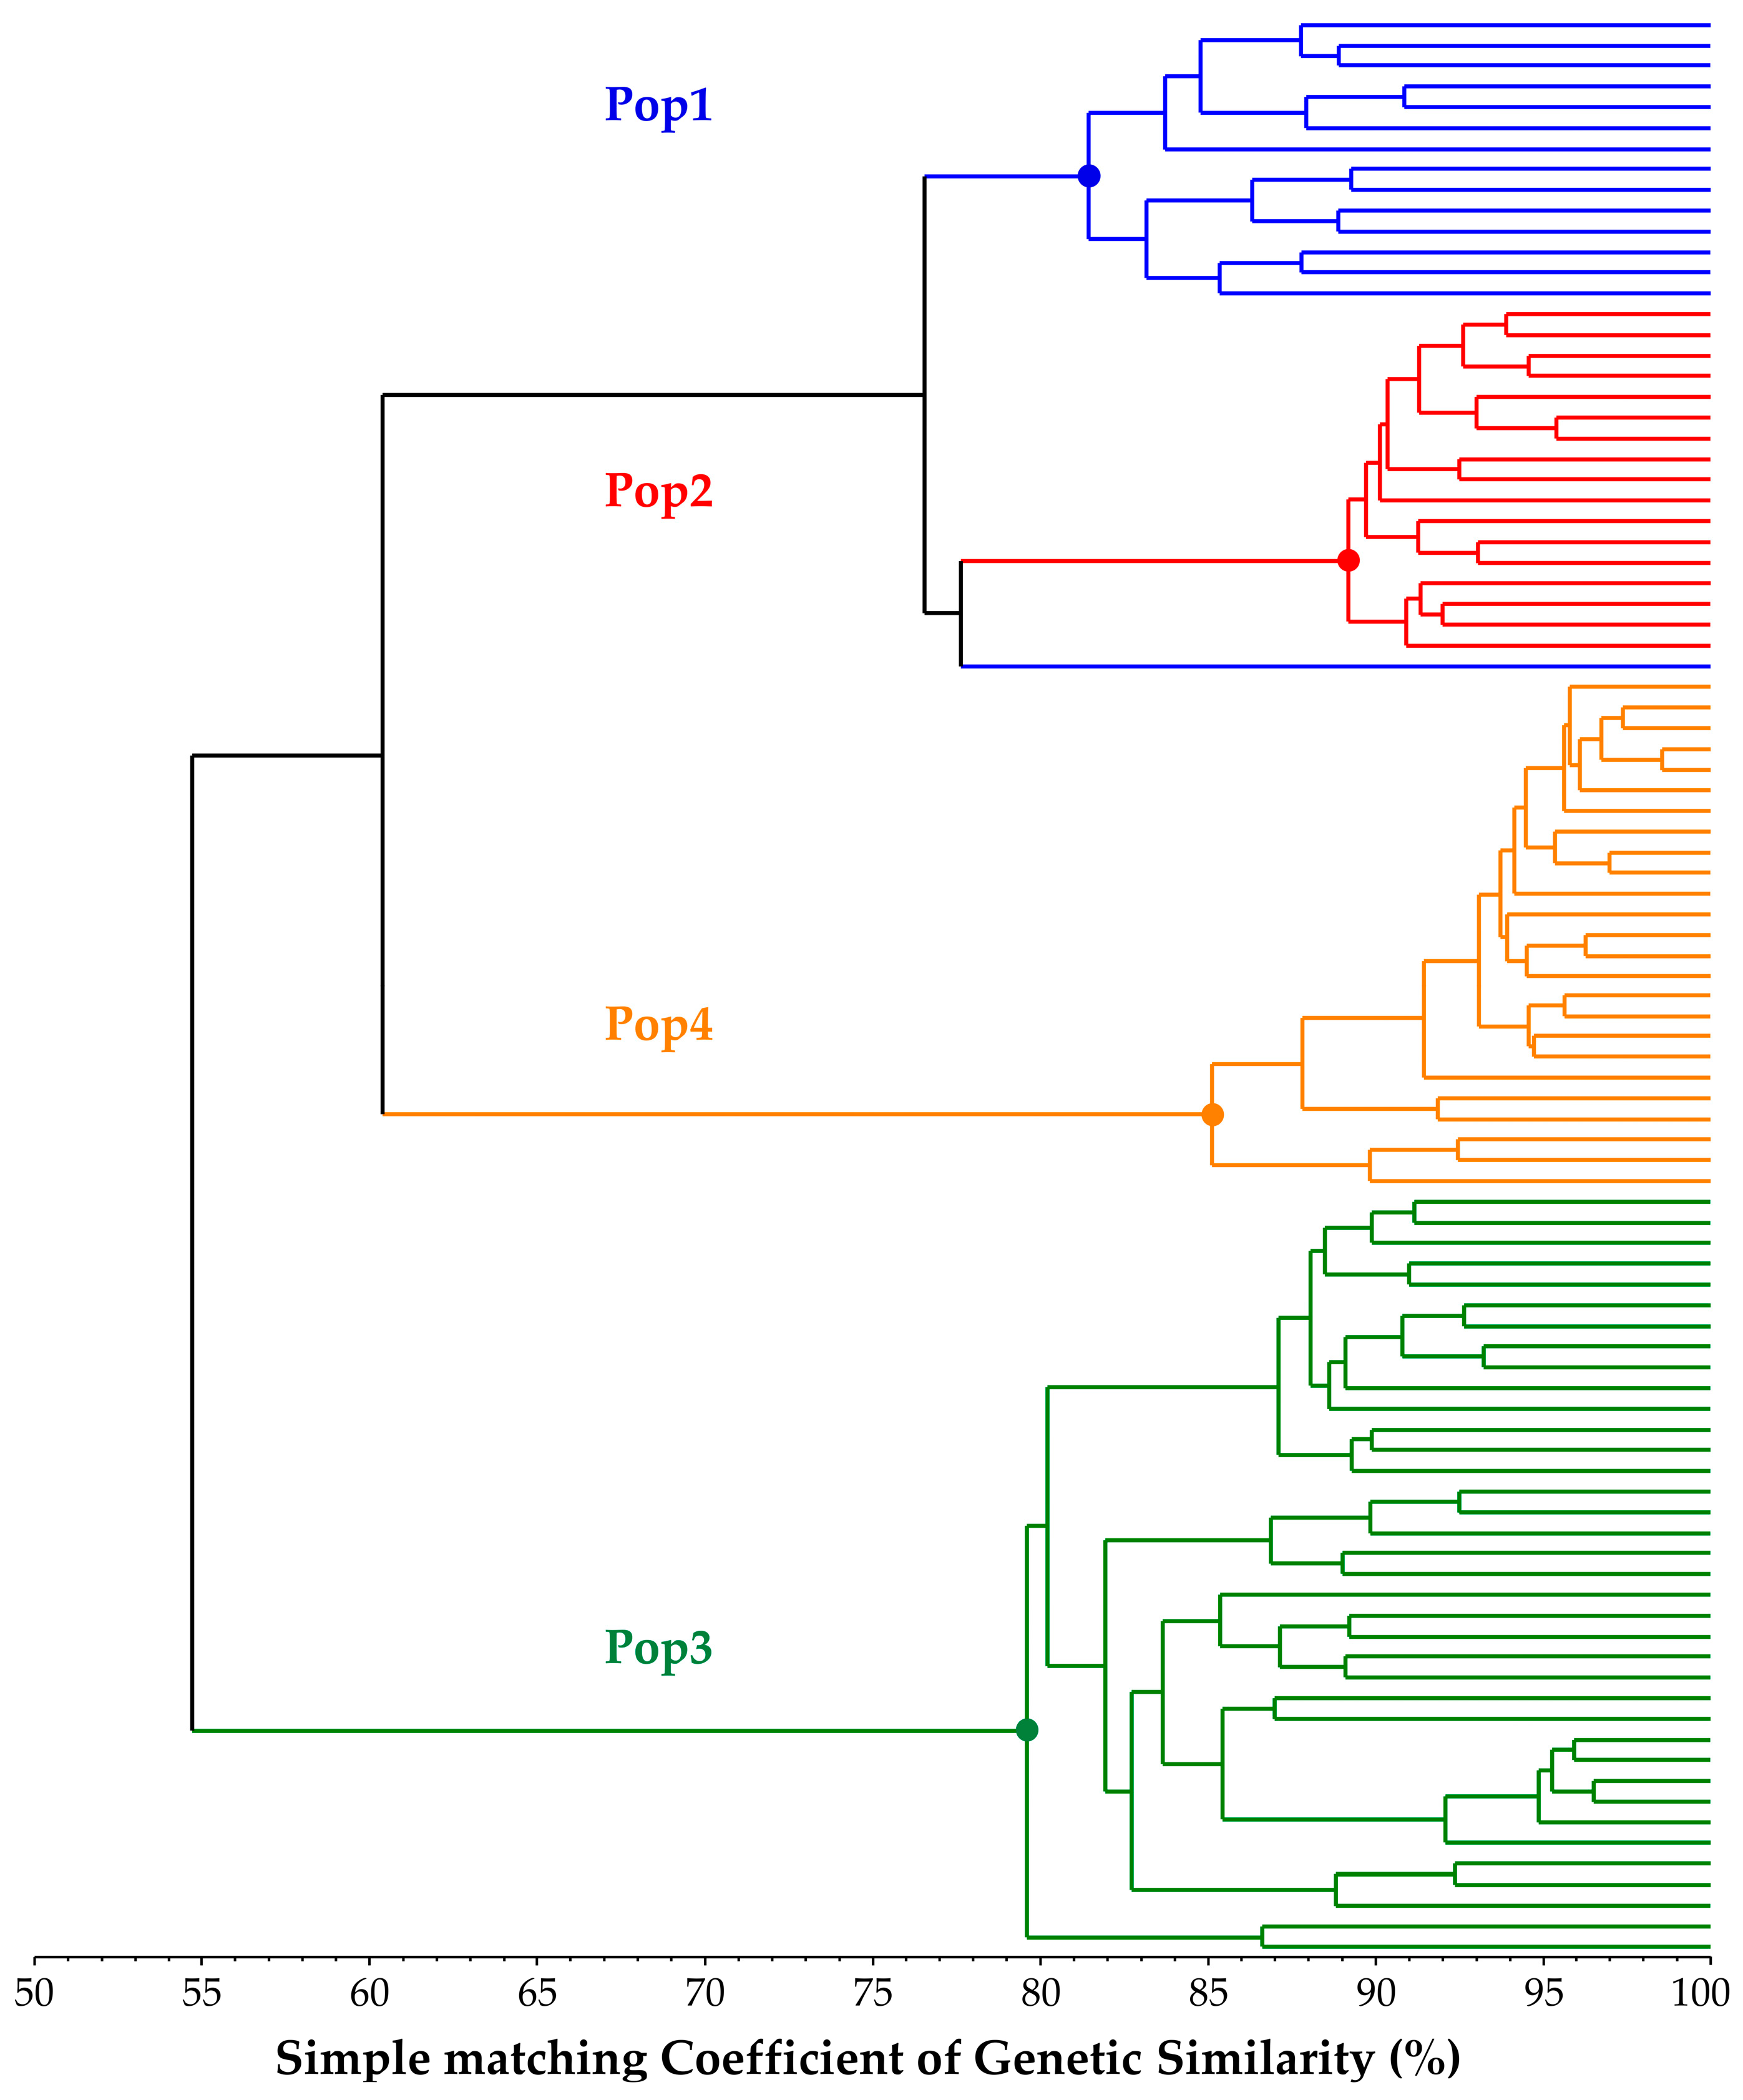
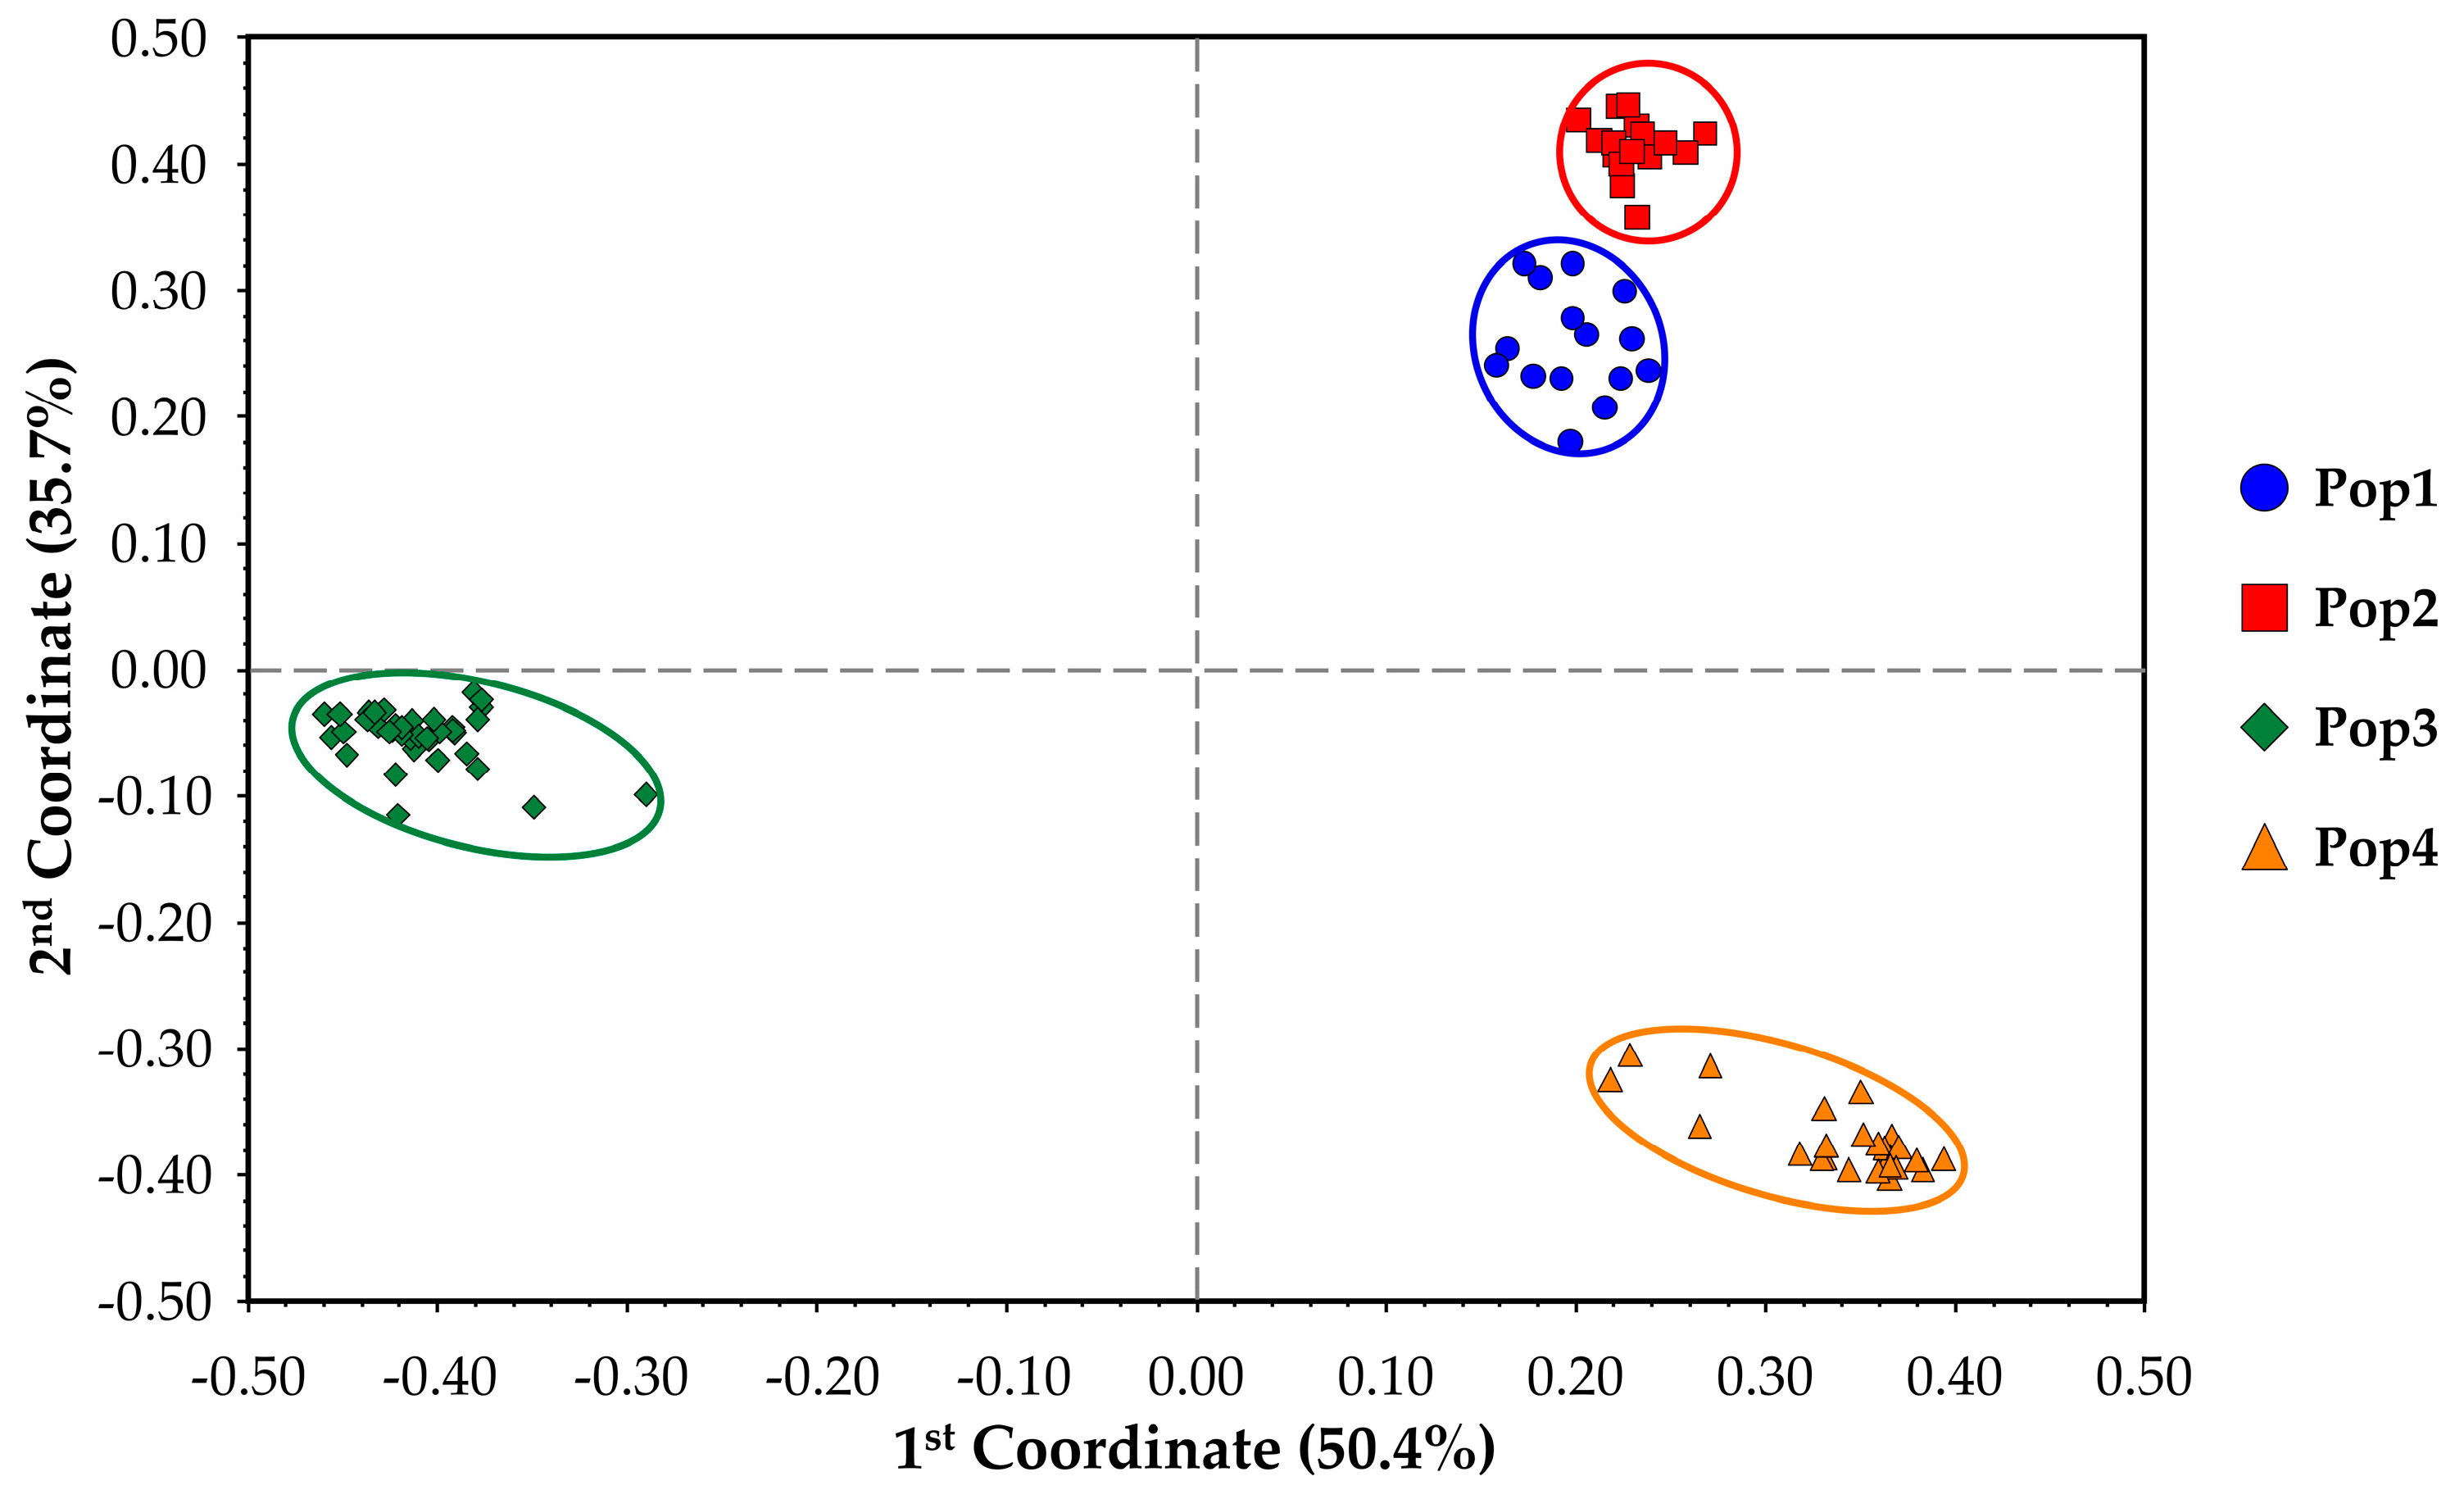
Table 3), which, combined with PA values and the other statistics already discussed, suggests a good distinctiveness of the four single FS lines used in this study, as well as a relatively high genetic uniformity of each population (82.33% < within GS < 91.05%). Moreover, as a confirmation of this hypothesis, both the results of the among-population GS and genetic structure separate individuals into four distinct clusters reflecting the core collection division into the four populations. Each of the individuals of the core collection is associated with its original population, but, as suggested by the UPGMA dendrogram (
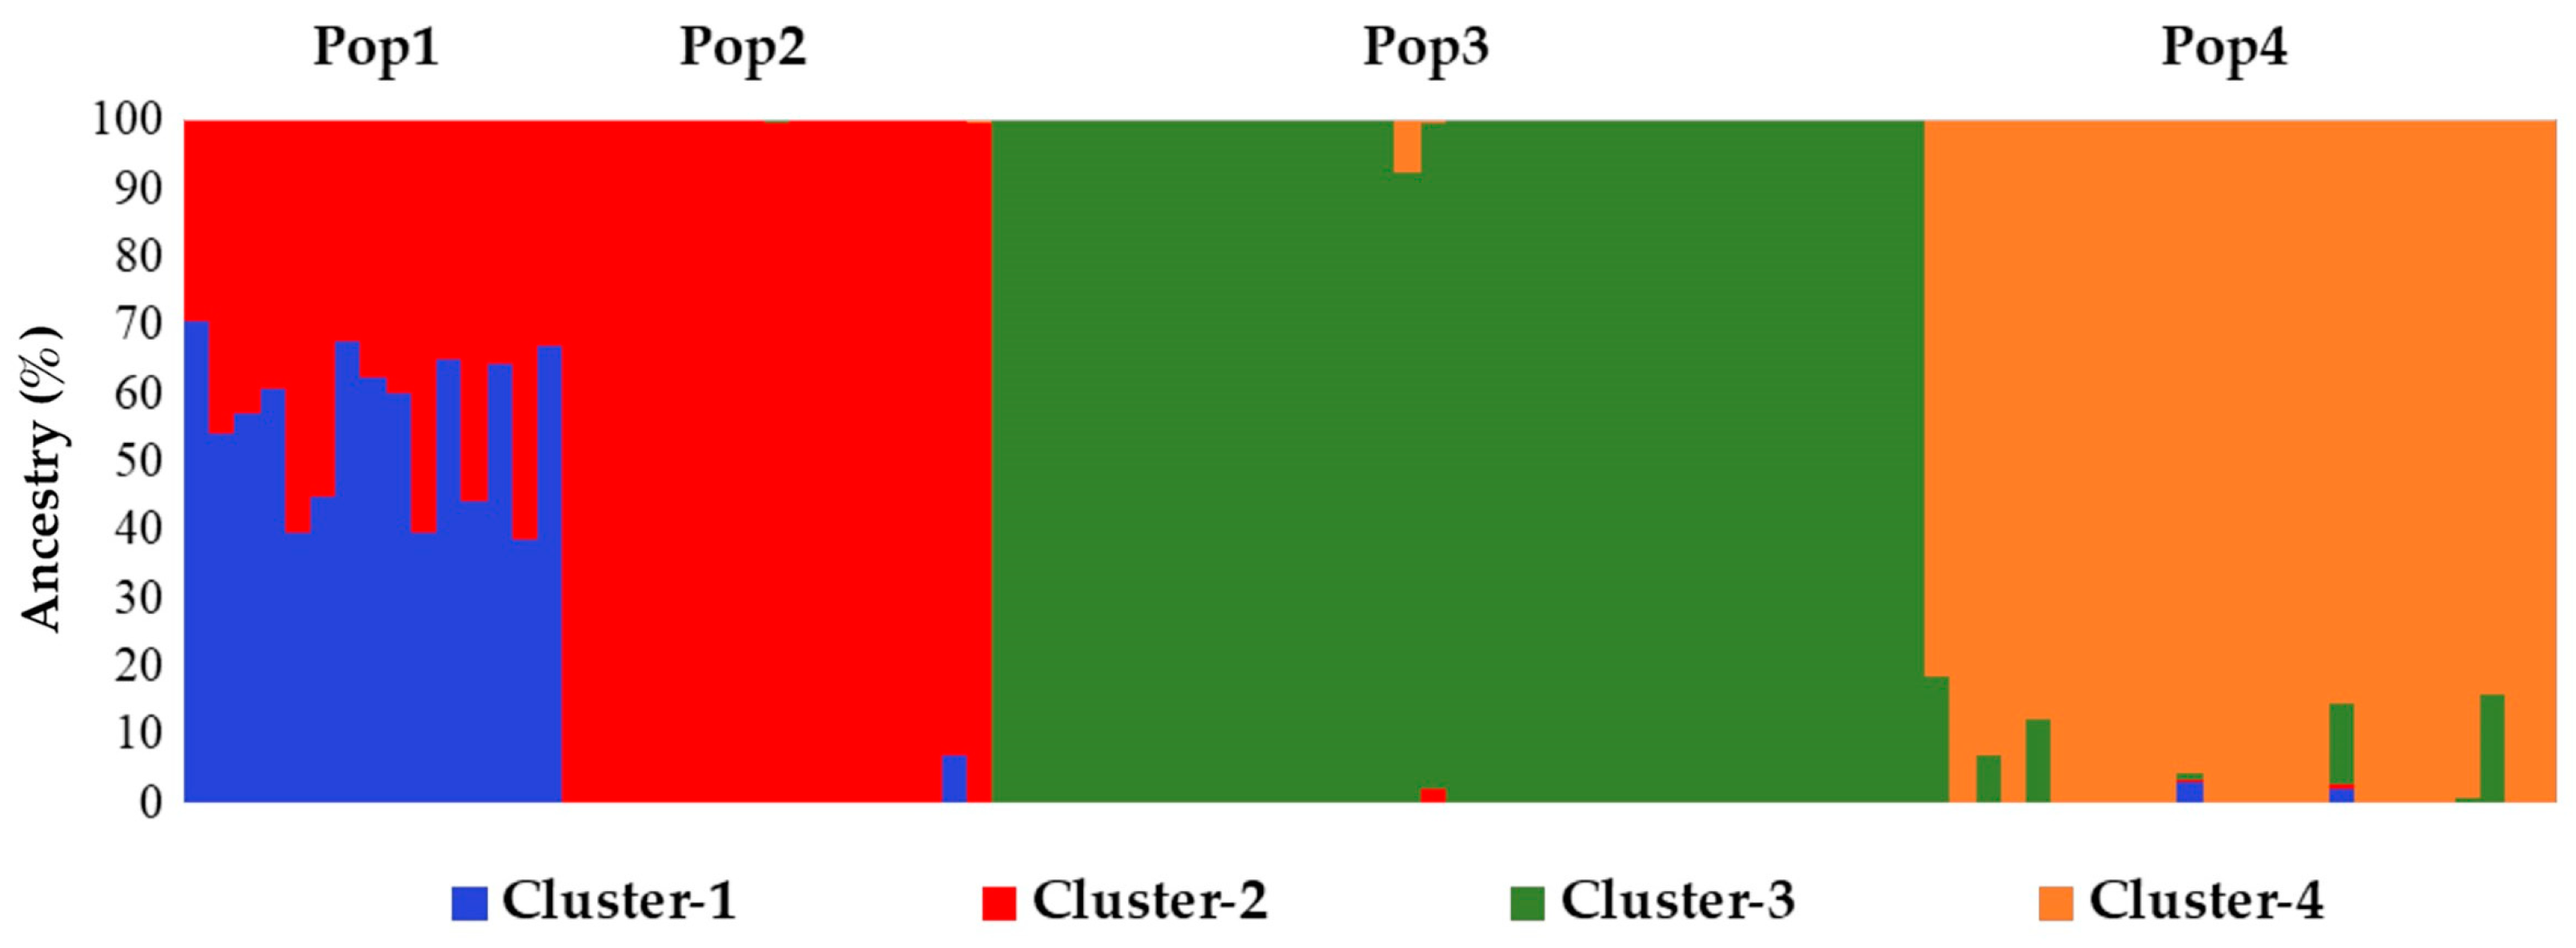
Figure 1), individuals from Pop1 and Pop2 are closely related. Additional information sustaining these findings was obtained from the STRUCTURE analysis, in which Pop1 was admixed with a 50% membership on average with Pop2’s Cluster-2 (
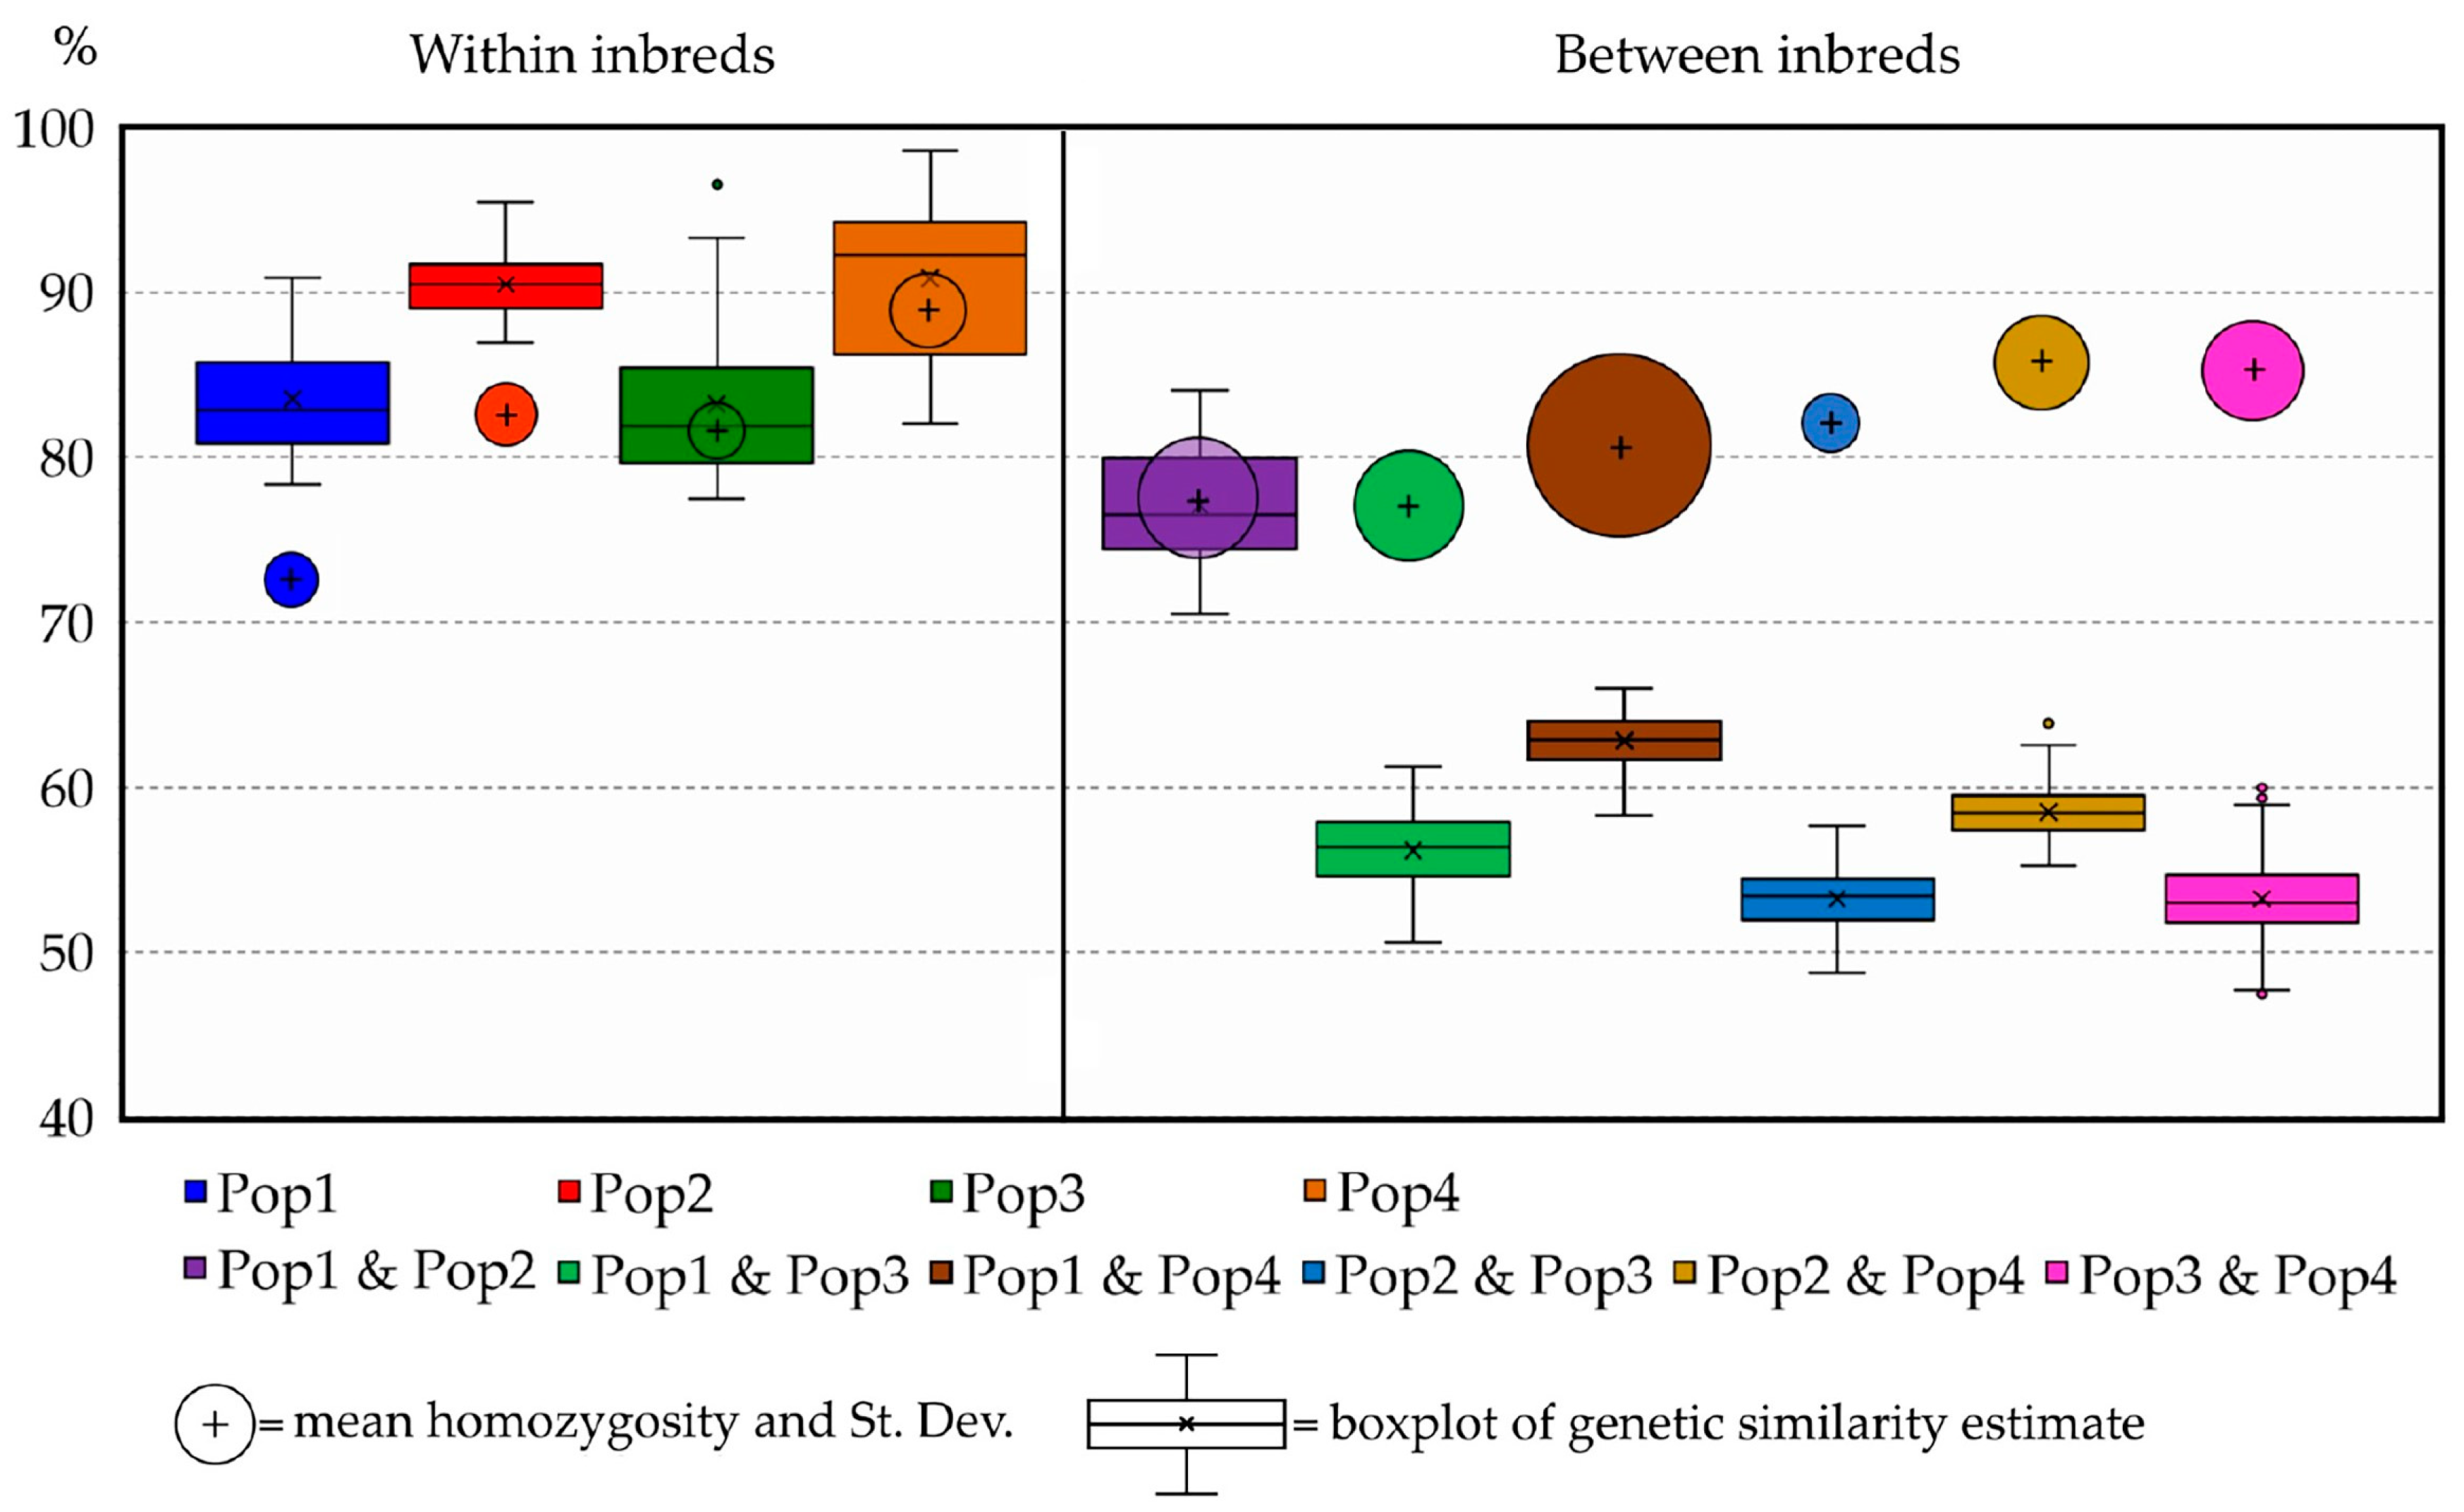
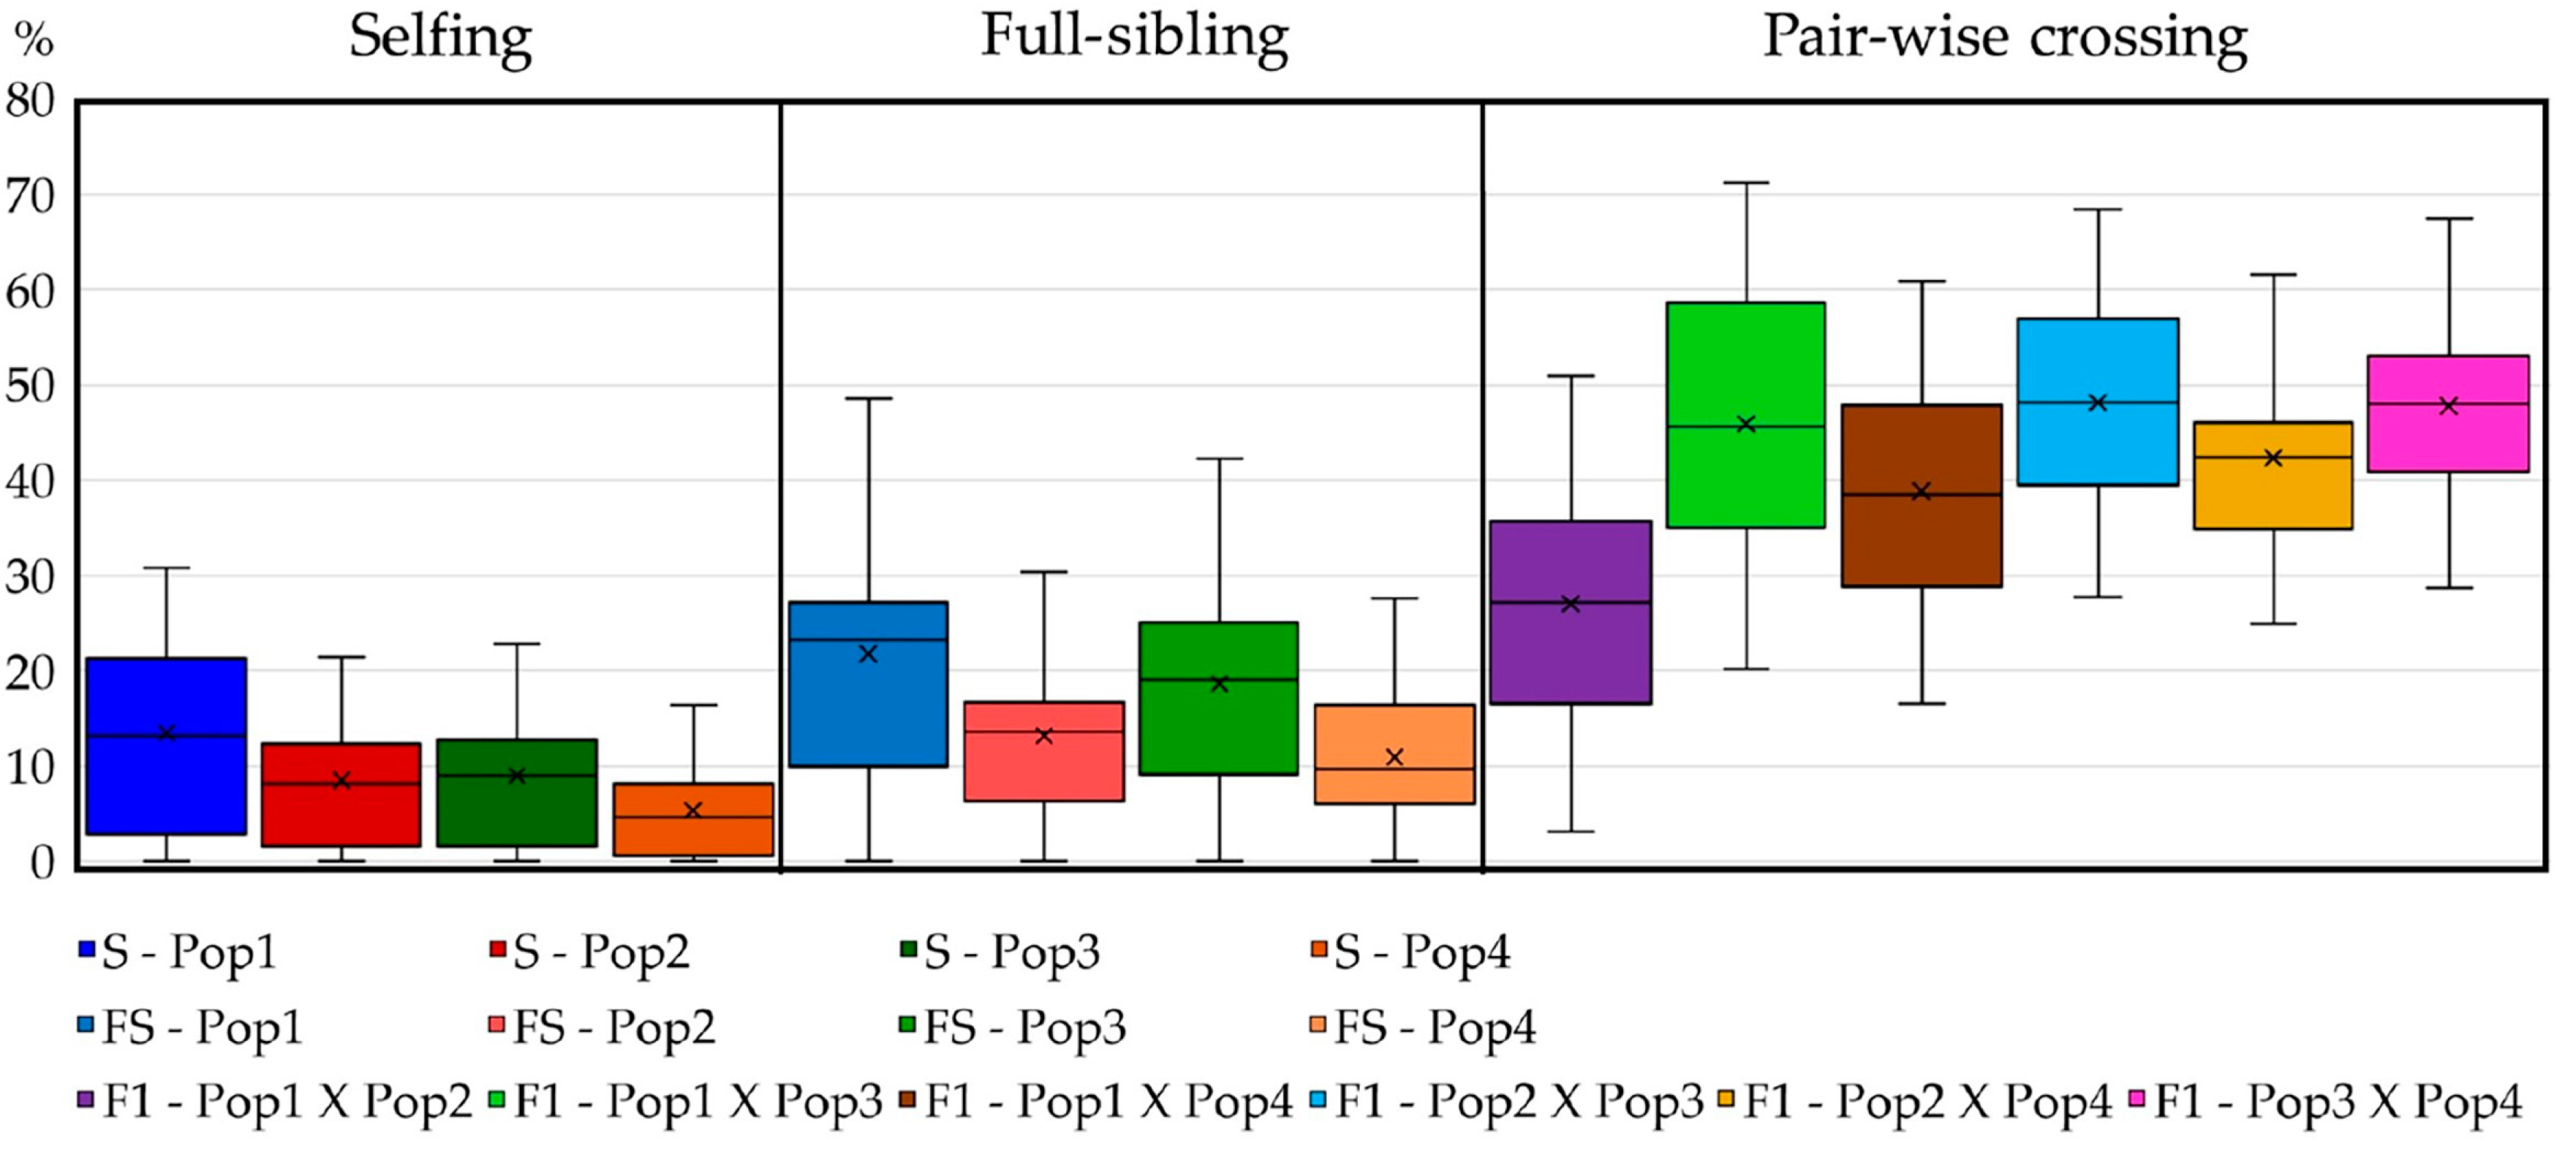
Figure 4), thus suggesting that Pop1 is probably derived from Pop2. Moreover, the homozygosity results, combined with the within GS calculated for each population, highlighted different uniformity degrees, from highly uniform and homozygous populations (Pop4) to less uniform and heterozygous ones (Pop1). In this regard, the predictive analysis of the potentially obtainable progenies from selfing, full-sibling or pairwise crossing the best parental individuals selected from each population starting from the RADseq characterization highlights that parentals presenting high levels of homozygosity and within GS can be preferentially adopted for the constitution of F1 hybrid lines (e.g., Pop3 × Pop4), while those that do not match these requirements are more indicated for homozygosity increments, though self- or sibling mating strategies (e.g., Pop1). Moreover, highly related parentals, even those belonging to different populations, make cross-pollinations undesirable for constituting F1 hybrids due to the low obtainable heterozygosity, as demonstrated by the expected He (e.g., Pop1× Pop2) (
Figure 7 and
Figure 8).
As this study aims to provide a pipeline suitable for MAB, MAS and PVP, not only the possibility of overall genotypic characterization based on genome-wide platforms but also the locus-specific characterization of molecular markers related to specific traits is important. In this regard, the locus association between the RADtag_2329 and
Myb80-like genomic regions is a possible example. Male-sterility predictive information can be adopted in future screening analyses aimed at the development of F1 hybrid cultivars by means of pair-wise crosses with highly differentiated pollen donors in order to maximize hybridity and heterozygosity, and so to exploit the potential manifestation of heterosis. In fact, from the identification of the
msms genotypes, seed parental lines or clones can be selected to be crossed using fertile genotypes (
MsMs) as pollinators. This strategy prevents maternal plants from developing inbred seeds, characterized by higher homozygosity, thus favouring the production of only F1 hybrid seeds derived from cross-pollination strategies, which have higher heterozygosity and potential heterotic vigour [
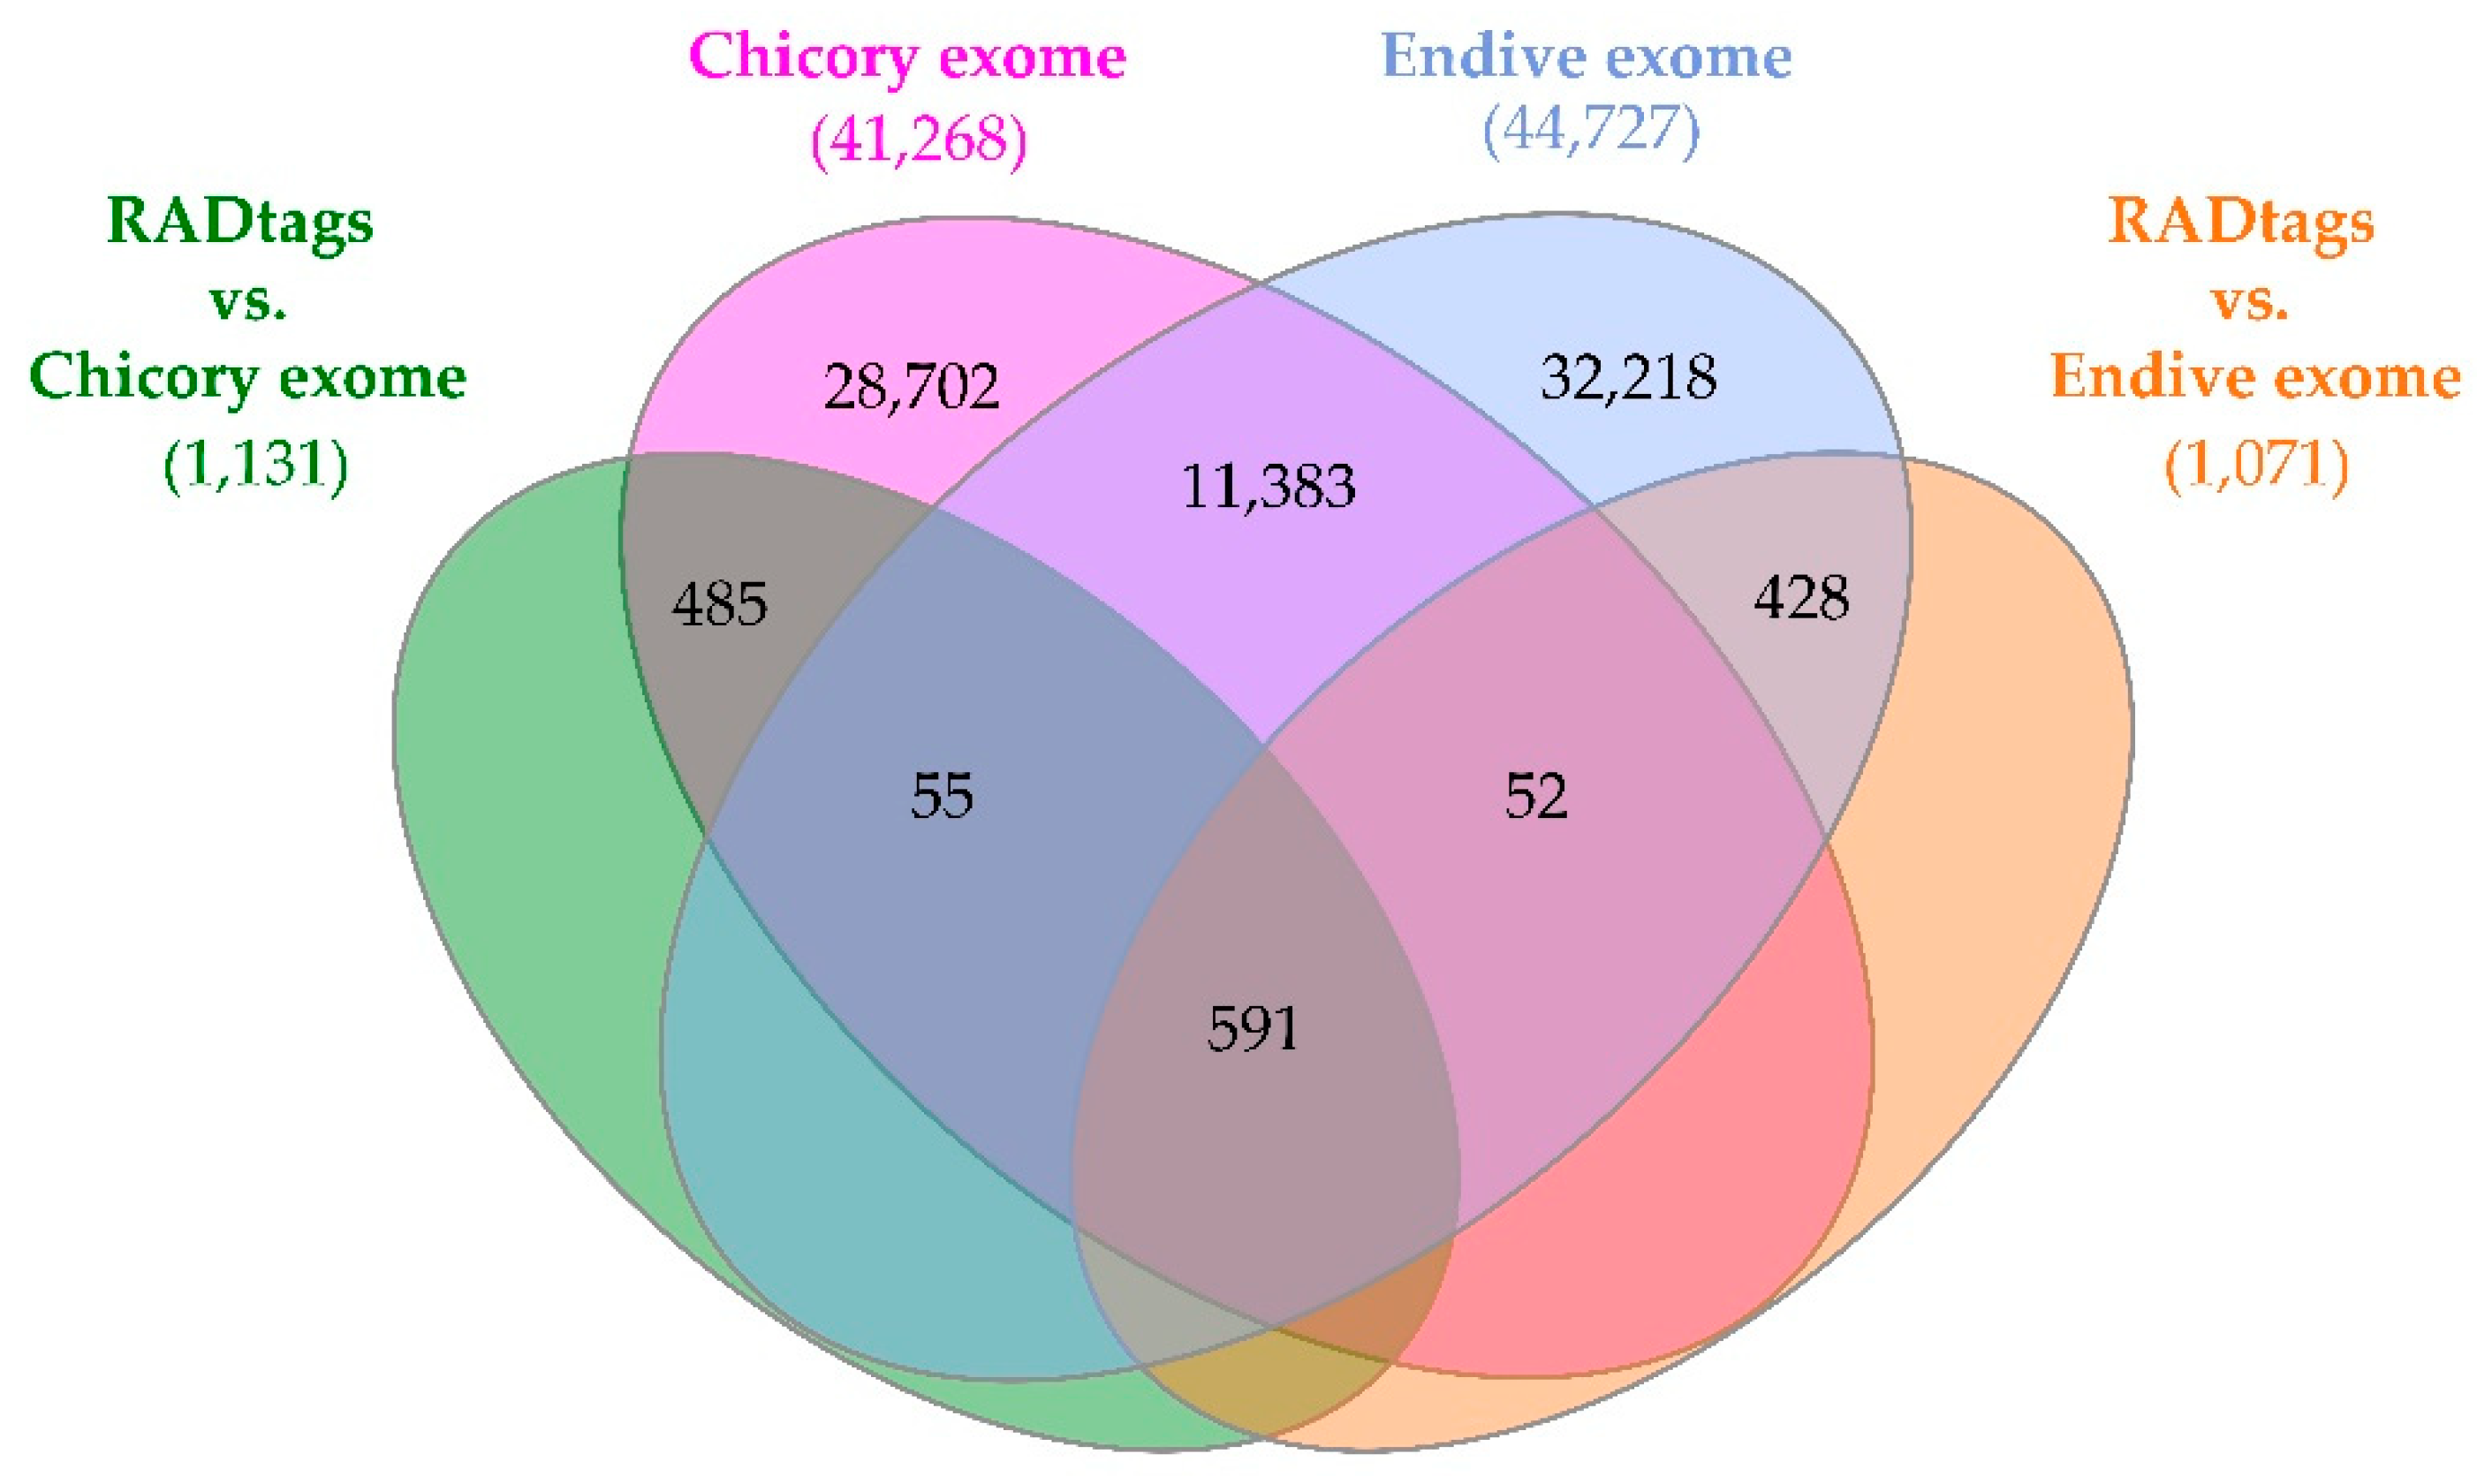
17]. Parallel to this first promising result, the same goal can be achieved for other RADtags. The potential of RADseq methodology in identifying molecular markers associated with specific genes involved in phenotypic traits of agronomic interest has been highlighted by the RADtag mapping analysis results, consisting of 1,084 matches with both
C. intybus and
C. endivia exomes, which can be investigated in future studies for the validation of suitable molecular markers for MAS approaches. A further insight related to these results is that the BLASTn analysis against the newly available genomes of chicory and endive reported 5,110 RADtags (also considering those with missing values among one or more samples) shared among the two genomes, while 740 and 294 were specific for
C. intybus and
C. endivia, thus supporting the relatedness to these two species and the interspecific nature of the “Red of Chioggia” biotype to which all tested samples belong. This latter information provides useful knowledge for several purposes: interspecific hybrid identification, and phylogenesis and evolution studies of these two related crop species. Moreover, the possibility of investigating which of the identified SNPs were contained in expressed genomic regions (1,308 and 1,255 in chicory and endive, respectively) could provide a suitable starting point to develop future screening tools for MAS strategies in both C
ichorium species, as well as genetic traceability tools for protecting cultivars from frauds or mislabelling (PVP). Another application in which this information can be used is the identification of suitable genetic resources to be introduced or genetic traits to be introgressed by specific breeding programs for each of these two crop plants, aimed at improving their environmental adaptability, resistance or tolerance to pests, and morphological characteristics of agronomic and commercial value.
In conclusion, combining a genome-wide characterization (i.e. MAB strategy) with genotype-specific information (e.g. MAS for male-sterility) allowed us to precisely assess the genetic value-added of parental inbreds and to design tailored pair-wise cross combinations for the development of true and highly heterozygous F1 hybrids in leaf chicory.
4. Materials and Methods
Plant Materials
Four full-sibling (FS) populations of Italian red chicory, biotype “Red of Chioggia”, for a total number of 96 individuals, were used in this study for RADseq-based genotyping. Populations belonging to separated inbred lines were selected to verify the homozygosity and genetic similarity within and among them, respectively. Genomic DNA was extracted for each sample using 100 mg of fresh leaf tissue using the DNeasy® 96 Plant Kit (Qiagen, Valencia, CA, USA) and following the protocols provided by the manufacturer. After DNA extraction and purification, DNA quality, quantity and integrity were evaluated using a NanoDrop 2000c UV‒Vis spectrophotometer (Thermo Fisher Scientific Inc., Pittsburgh, PA, USA), and agarose gel electrophoresis was prepared as a 1% agarose/1× TAE gel containing 1× Sybr Safe DNA stain (Life Technologies, Carlsbad, CA, USA). Moreover, the genomic DNA purification, quantification and quality evaluation protocols described above were also adopted to isolate the gDNA of 12 samples of known fertile/sterile phenotypes derived from three different segregating populations to be used for CAPS assay validation. Regarding the origin of these samples, four individuals belonging to a BC1 line with only heterozygous (Msms) and sterile homozygous (msms) individuals, four individuals from an F2 line with all three possible genotypes represented, and four individuals from a fertile BC1 population with heterozygous and fertile homozygous (MsMs) genotypes were adopted.
RADseq analysis and data analysis
Among the 96 gDNA samples obtained, 94 were successfully sequenced through the restriction site-associated DNA sequencing (RADseq) approach, while due to the high number of missing data, two samples were not considered in the analyses. RADseq analysis was performed using 1 μg of gDNA per sample and restricted using
MseI enzyme (New England Biolabs, Ipswich, MA, USA); the procedure is described by Stevanato et al. [
31]. For library preparation, digested DNA samples were diluted to a concentration of 3 ng/μL, and indexing, library preparation, sequencing, and bioinformatic analyses of the raw reads were performed according to the protocol described by Stevanato et al. [
31]. Raw reads obtained through an Ion S5 sequencer (Thermo Fisher Scientific Inc., Waltham, MA, USA) were trimmed according to the restriction enzyme recognition motif. After quality assessment, all artefacts and Ns-containing reads were removed, and nucleotide variants were assessed using Stacks v2.41 software. [
37]. SNPs with a sequence depth <4× and with more than two allelic variants were filtered out. Only biallelic SNPs were considered in this study.
Data analysis and genetic statistics
The obtained biallelic molecular marker data were analysed to calculate genetic statistics. The genetic similarity (GS) was computed using Rohlf’s simple matching coefficient in all pairwise comparisons, and the resulting GS matrix was used for the construction of an unweighted pair group method with arithmetic mean (UPGMA) dendrogram and a principal coordinate analysis (PCoA) using NTSys software v2.21 [
38]. Moreover, the GenAlEx 6.5 [
39] Excel macro was used to calculate the number of observed and effective alleles, the observed and expected heterozygosity estimates, the fixation index, the percentage of polymorphic loci, the number and percentage of private alleles of each population and identified overall, Wright’s F statistics, heterozygosity estimates and gene flow. AMOVA was also computed using GenAlEx software. Alongside the genetic statistics and similarity estimates, a Bayesian clustering algorithm implemented in STRUCTURE v.2.2 [
40] was used to reconstruct the genetic structure of the core collection. The parameters adopted in this analysis consisted of numbers of founding groups ranging from 1 to 20, and 10 replicate simulations were conducted for each value of K based on a burn-in of 200,000 and a final run of 1,000,000 Markov Chain Monte Carlo (MCMC) steps. STRUCTURE HARVESTER [
41] was used to estimate the most likely value of K based on the STRUCTURE software analysis results, and the estimates of membership were plotted as a histogram using an Excel spreadsheet.
BLASTn analysis and RADtag mapping
After the genetic statistics analysis, a further investigation was performed to verify which identified SNPs belonged to coding regions of the chicory genome.
Considering the newly published genomic assembly for both chicory (
C. intybus L.) and endive (
C. endivia L.), we considered these two datasets for the following BLASTn analysis (BLAST+ 2.11.0 package). The two assemblies were retrieved from NCBI using the accession numbers GCA_023525715.1 (chicory) and GCA_023376185.1 (endive). Although the two assemblies presented putative coding sequence (CDS) annotations (51,881 and 43,721 for endive and chicory, respectively), these were only reported as “hypothetical proteins” with no information about their genic function or gene ontology with other species. For this reason, and because our intention was the identification of the CDS-matching RADtags with possible phenotypic interaction/effect, further analysis was needed to putatively assess the nature of the CDS annotations. For this purpose, the translated exome of lettuce (
Lactuca sativa L.; NCBI accession number: GCF_002870075.3) was adopted in a preliminary BLASTx analysis to annotate the two
Cichorium CDSs using their translation as queries. For this analysis, UseGalaxy [
42] implementing BLASTx (BLAST+ 2.11.0 package) software was used in two parallel computations for the two species considered.
After the
Cichorium species genome annotation, two parallel BLASTn analyses were conducted to map the RADtags presenting no missing information among the core collection against the newly annotated CDSs. All obtained RADtags, both the completely shared and those missing in at least one genotype, were used in two BLASTn analyses against the entire genomic sequences (intra- and extragenic). In detail, the parameters adopted in these steps followed those described in Scariolo et al. [
43], in which the following parameters were used: an E-value threshold ≤1.0 × 10
−10 and a percentage of identity ≥80%, plus a minimum query coverage of 80%.
RADtag mapping and BLASTn analysis results were plotted in a Venn diagram using InteractiVenn web software [
44] to highlight the shared CDSs annotated through
L. sativa exome support, the CDSs shared between two exomes of the
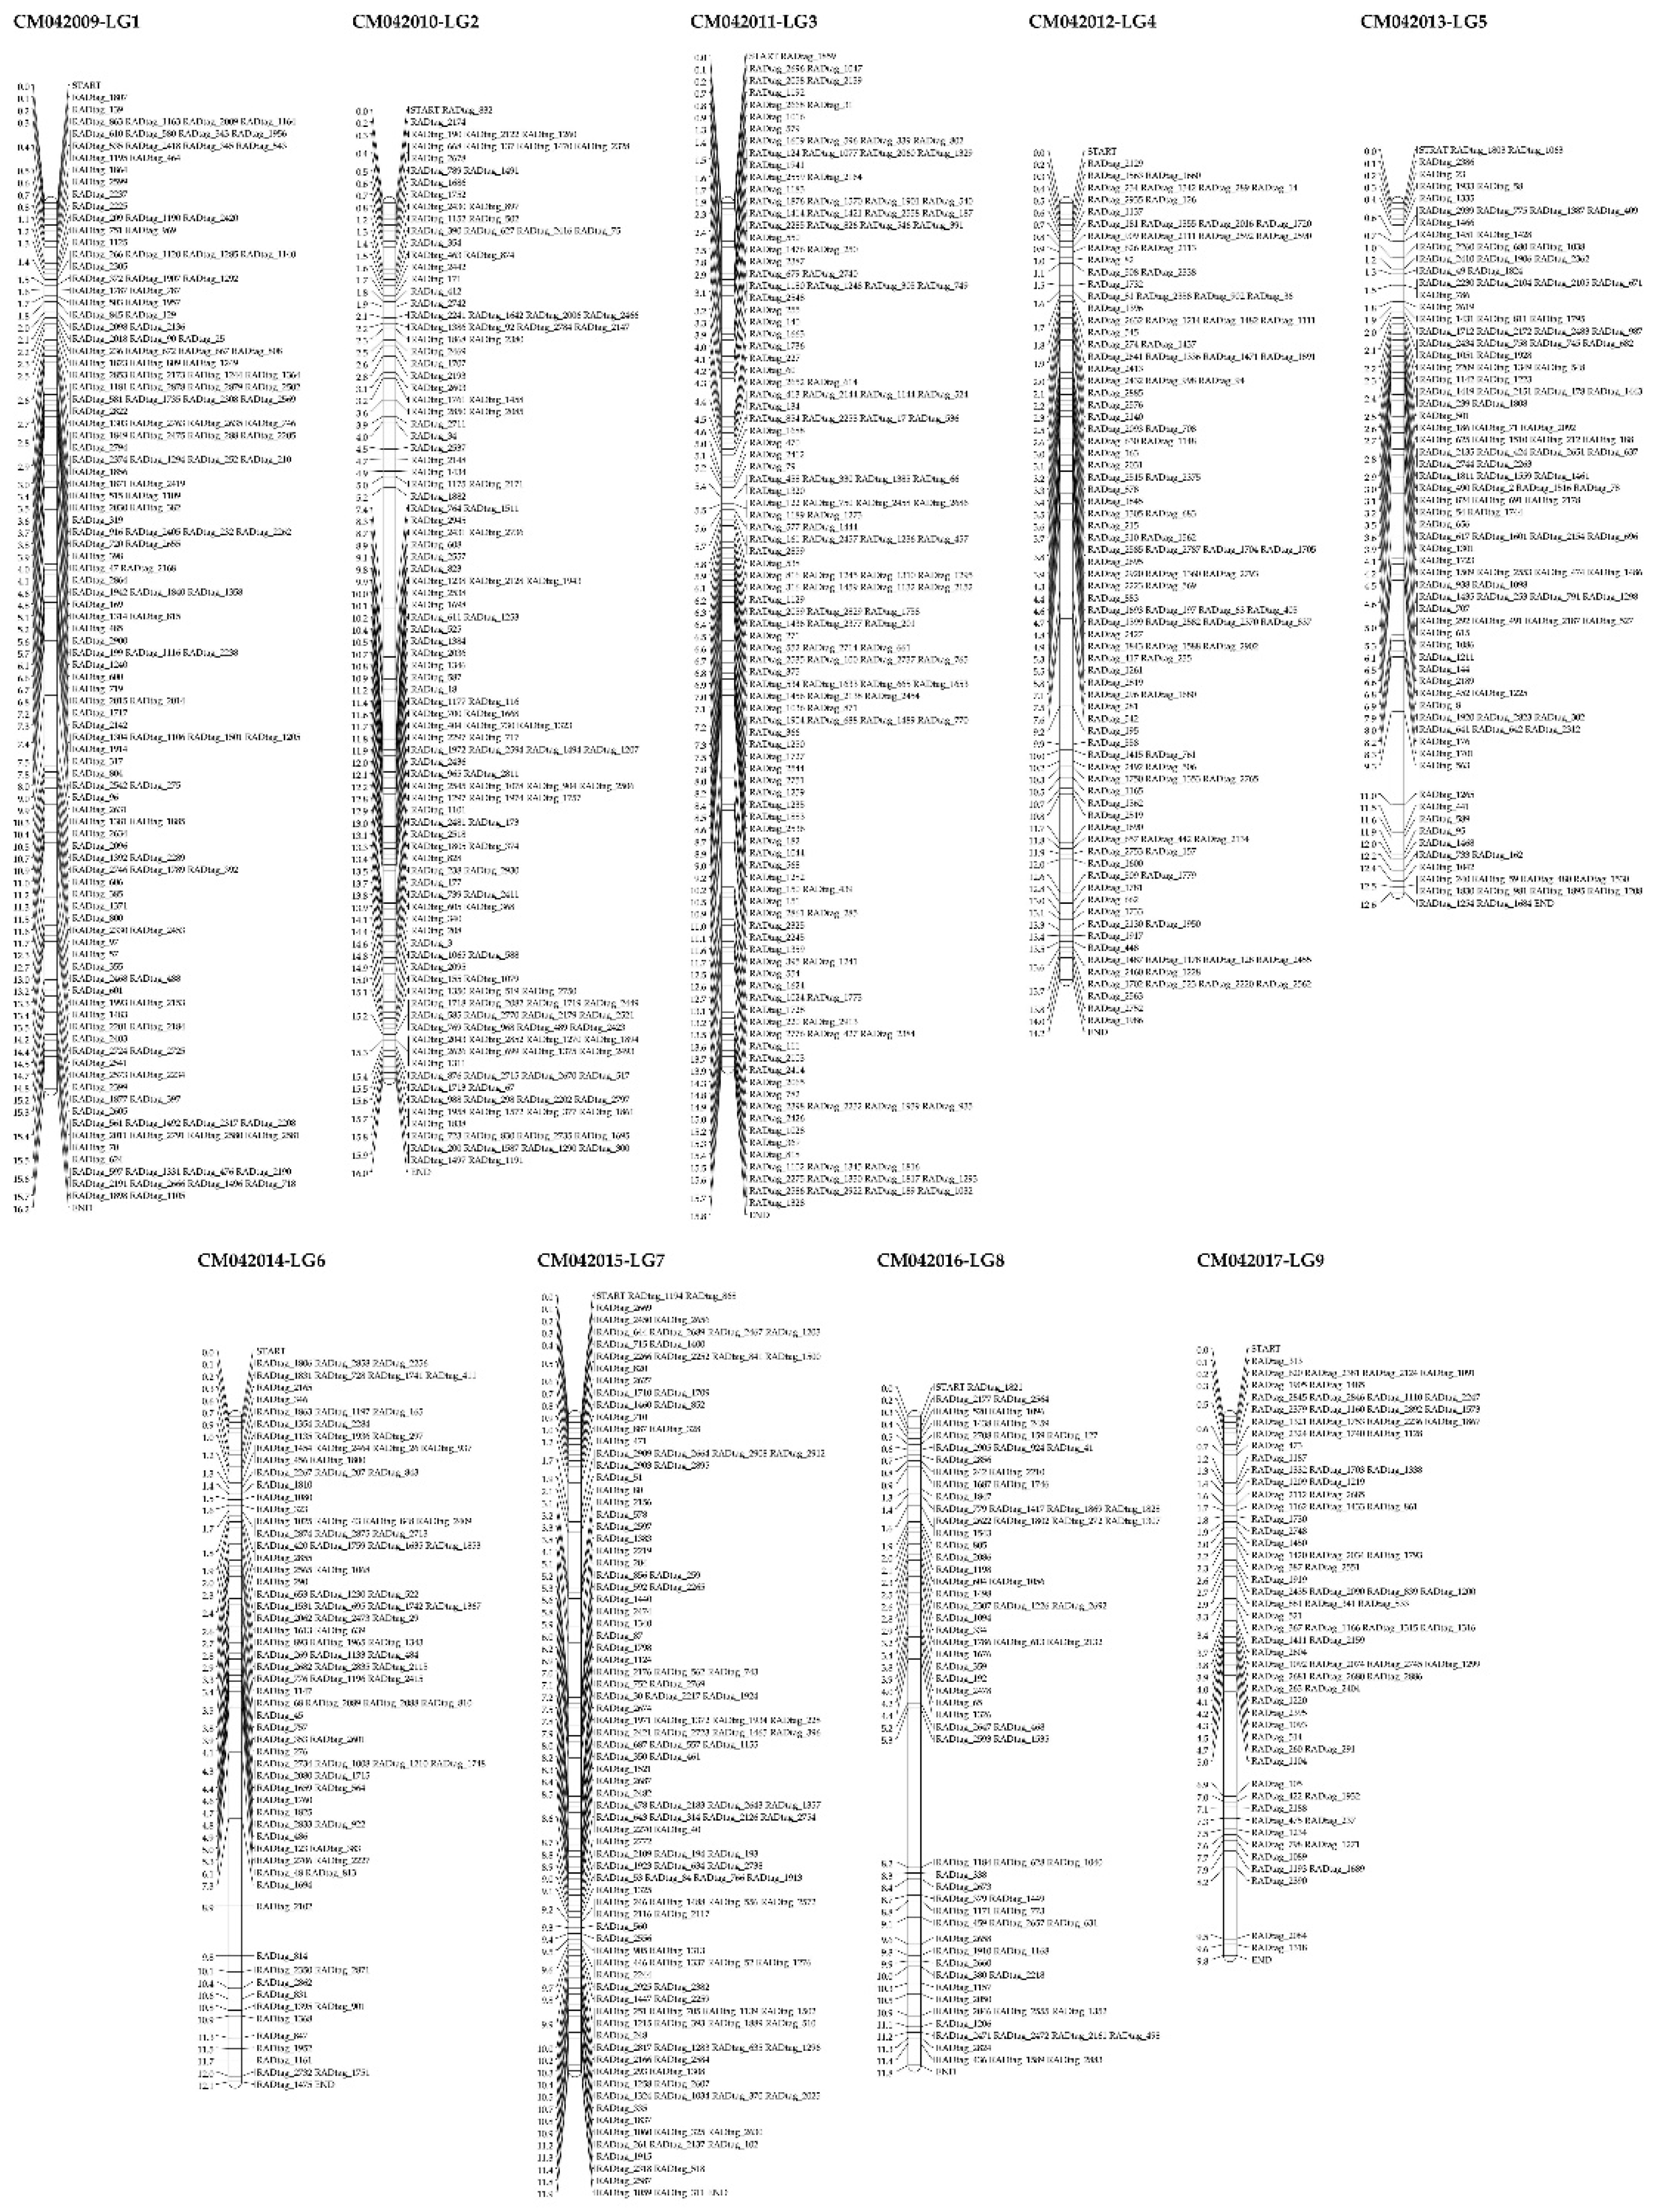
Cichorium species, plus the RADtag matches that were shared between the two reference exomes and those that were specific for one or the other. Moreover, two linkage maps have been created presenting
C. intybus and
C. endivia linkage groups that report the mapping region of the RADtags matching CDS in the exomes of the two species. Linkage maps were created using MapChart 2.32 [
45]
Cross-strategy planning for breeding purposes
Considering the genotypes characterized through the RADseq approach, the GS estimates in all pairwise comparisons among the 94 samples successfully sequenced and analysed, as well as their observed homozygosity values, a further investigation of the most suitable crosses for different breeding purposes was performed. Specifically, the genotype information of the 10 selected individuals for each of the four populations was used to hypothesize the genetic estimates obtainable in putative progenies derived from selfing, full-sibling (within the population) and pairwise crossing (between different populations) breeding strategies. In particular, the possible application and aims of this investigation could be the obtainment of highly heterozygous and uniform F1 hybrids or the increment of homozygosity and uniformity within the populations considered in this study. To investigate the possible application of the GBS-derived information, the 40 selected genotypes were chosen for presenting high GS with individuals from the same population (within GS>90%, when possible) and the highest homozygosity. This was made to simulate the mating scenarios of inbreeding, aimed at obtaining highly uniform and homozygous putative parental lines, and out-breeding for developing F1 hybrids. Considering that the molecular markers analysed in this study are biallelic SNPs, the canonical Mendelian gene recombination expected frequencies were adopted for this computation, although the loci association was not considered as no information is available yet about the most common regions of crossing-over in chicory.
In
Table 6, the expected heterozygosity frequency values associated with each genotype × genotype crossing combination are reported. By adopting the information reported in
Table 6, the He of all pairwise crossing combinations was computed for each locus in the case of selfing, full-sibling or pairwise crossing breeding strategies.
Author Contributions
Conceptualization, F.S. and G.B.; methodology, F.S.; software, F.S.; validation, F.S., S.F. and F.P.; formal analysis, F.S.; investigation, F.S.; resources, G.B.; data curation, F.S.; writing—original draft preparation, F.S.; writing—review and editing, F.P., S.F. and G.B.; visualization, F.S., F.P., S.F. and G.B.; supervision, G.B. and F.P.; project administration, G.B.; funding acquisition, G.B. All authors have read and agreed to the published version of the manuscript.
Figure 1.
Breeding schemes exploiting male-sterile (msms) and male-fertile (Ms/-) genotypes in full-sibling and selfing strategies for inbred line development. FS: full sibling; S: selfing.
Figure 1.
Breeding schemes exploiting male-sterile (msms) and male-fertile (Ms/-) genotypes in full-sibling and selfing strategies for inbred line development. FS: full sibling; S: selfing.
Figure 2.
UPGMA dendrogram based on Rohlf’s simple matching coefficient of genetic similarity. Colours indicate the four different populations analysed in the core collection.
Figure 2.
UPGMA dendrogram based on Rohlf’s simple matching coefficient of genetic similarity. Colours indicate the four different populations analysed in the core collection.
Figure 3.
Principal coordinate analysis grouping the four chicory populations of the core collection into 4 distinct clusters according to samples belonging to populations and the clusters identified in the UPGMA dendrogram. Colour labelling is maintained from the dendrogram illustrated in
Figure 2.
Figure 4.
Histogram representing the STRUCTURE software computed results for K=4. Different colour bars indicate the membership of each individual to a specifically labelled cluster, according to the same labelling adopted in the previous figures.
Figure 4.
Histogram representing the STRUCTURE software computed results for K=4. Different colour bars indicate the membership of each individual to a specifically labelled cluster, according to the same labelling adopted in the previous figures.
Figure 5.
Venn diagram representing the BLASTn and BLASTx results of the matched CDSs of chicory and endive exomes and the congruences between these results and the CDS annotations obtained using the L. sativa exome as a reference.
Figure 5.
Venn diagram representing the BLASTn and BLASTx results of the matched CDSs of chicory and endive exomes and the congruences between these results and the CDS annotations obtained using the L. sativa exome as a reference.
Figure 6.
Chromosome representation of C. intybus L. RADtags matching CDSs among the 9 assembled linkage groups (LG1 to LG9) are reported. Units on the left of each LG indicate 10,000,000 bps.
Figure 6.
Chromosome representation of C. intybus L. RADtags matching CDSs among the 9 assembled linkage groups (LG1 to LG9) are reported. Units on the left of each LG indicate 10,000,000 bps.
Figure 7.
Agarose gel of the male-sterility characterization CAPS marker representing the obtainable bands (white arrows) in the case of the three different observable genotypes at the Myb80-like gene (phenotypes): MsMs (fertile), Msms (fertile), and msms (sterile). (L: molecular weight ladder; white arrows indicate the expected band sizes of 300, 230 and 70 bp, top to bottom)
Figure 8.
Graphic representation of RADtag_2329 in the C. intybus genome with the closest AAP7-like and unpredicted genes. Starting and ending positions for each annotation and the RADtag are reported following the sequence direction. Genotype numbers for Myb80-like and RADtag_2329 are reported in the respective tables below the annotation.
Figure 9.
Boxplot of the mean genetic similarity among the 40 selected suitable parental individuals calculated within populations (left side) and among populations (right side). Bubbles position in the chart indicates mean homozygosity, while their size reflects the respective standard deviation.
Figure 9.
Boxplot of the mean genetic similarity among the 40 selected suitable parental individuals calculated within populations (left side) and among populations (right side). Bubbles position in the chart indicates mean homozygosity, while their size reflects the respective standard deviation.
Figure 10.
Boxplot of the obtainable progenies’ heterozygosity (right scale) and homozygosity (left scale) in the case of selfing, full-sibling and pairwise crossing strategies. Maximum, minimum, and average computed values were considered in each grouping computation.
Figure 10.
Boxplot of the obtainable progenies’ heterozygosity (right scale) and homozygosity (left scale) in the case of selfing, full-sibling and pairwise crossing strategies. Maximum, minimum, and average computed values were considered in each grouping computation.
Table 1.
Genetic statistics calculated for each population and mean overall. Reported information is the number of individuals (N), number of observed (na) and expected (ne) alleles, observed (Ho) and expected (He) heterozygosity percentages, fixation index (F), and percentage of polymorphic loci (PL).
| Pop ID |
N |
na |
ne |
Ho (%) |
He (%) |
F |
PL (%) |
| Pop1 |
15.00 |
1.56 |
1.43 |
25.96 |
23.43 |
-0.10 |
56.48 |
| Pop2 |
17.00 |
1.36 |
1.27 |
16.33 |
14.02 |
-0.14 |
36.23 |
| Pop3 |
37.00 |
1.54 |
1.38 |
17.17 |
20.77 |
0.17 |
54.01 |
| Pop4 |
25.00 |
1.37 |
1.21 |
12.09 |
11.93 |
0.07 |
37.45 |
| Mean |
23.50 |
1.46 |
1.32 |
17.89 |
17.54 |
0.01 |
46.05 |
Table 2.
Mean within-population expected heterozygosity (Hs), total heterozygosity (Ht), Wright’s F-statistics (Fis; Fit; Fst) and gene flow (Nm) calculated among the core collection. Standard errors (SEs) are also reported for each value.
Table 2.
Mean within-population expected heterozygosity (Hs), total heterozygosity (Ht), Wright’s F-statistics (Fis; Fit; Fst) and gene flow (Nm) calculated among the core collection. Standard errors (SEs) are also reported for each value.
| |
Hs |
Ht |
Fis |
Fit |
Fst |
Nm |
| Total |
0.18 |
0.36 |
0.03 |
0.48 |
0.48 |
0.63 |
| SE |
0.00 |
0.00 |
0.01 |
0.01 |
0.01 |
0.03 |
Table 3.
AMOVA results. Degrees of freedom (df), sum of squares (SS), means squares (MS), and estimated variance (Est. Var.) with the respective percentage (%) are reported.
Table 3.
AMOVA results. Degrees of freedom (df), sum of squares (SS), means squares (MS), and estimated variance (Est. Var.) with the respective percentage (%) are reported.
| Source |
df |
SS |
MS |
Est. Var. |
% |
| Among Pops |
3 |
104,231 |
34,743 |
1,523 |
73.10 |
| Within Pops |
90 |
50,439 |
560 |
560 |
26.90 |
| Total |
93 |
154,671 |
|
2,083 |
100.00 |
Table 4.
Observed homozygosity (%) and mean pairwise genetic similarity matrix calculated within and among the four radicchio populations; standard errors are also reported.
Table 4.
Observed homozygosity (%) and mean pairwise genetic similarity matrix calculated within and among the four radicchio populations; standard errors are also reported.
| Obs. Homozygosity (%) |
Population ID |
Mean Genetic Similarity (%) |
| 74.04 ± 0.31 |
Pop1 |
82.33 ± 0.04 |
|
|
|
| 83.67 ± 0.15 |
Pop2 |
76.60 ± 0.01 |
90.12 ± 0.01 |
|
|
| 82.83 ± 0.13 |
Pop3 |
56.46 ± 0.00 |
54.13 ± 0.00 |
82.50 ± 0.01 |
|
| 87.91 ± 0.13 |
Pop4 |
62.59 ± 0.01 |
58.46 ± 0.00 |
54.08 ± 0.00 |
91.05 ± 0.01 |
| |
|
Pop1 |
Pop2 |
Pop3 |
Pop4 |
Table 5.
BLASTn analysis results of the no-missing data containing RADtags against the C. intybus and C. endivia exomes. Numbers of matching RADtags, CDSs, average mismatches (Avg. mis), average identical positions (Avg. ident) and exome-specific RADtags (Ex. Spec.) are reported alongside the percentages of average identity (Avg. ident), the average length of the alignments (Avg. length), exome-specific RADtags (Ex. Spec. %) and shared RADtags. The supporting statistics, such as E-value, bit score (Bs) and score (score), are also reported as average values for both analyses.
BLASTn
results |
RADtags (n) |
CDS (n) |
Avg.
ident (%) |
Avg. ident (n) |
Avg. length (bp) |
Avg.
mis (n) |
Avg.
E-value |
Avg. Bs |
Avg. score |
Ex. Spec. (n) |
Ex. Spec. (%) |
Shared
(n/%) |
C. intybus
exome |
1,308 |
1,131 |
98.00 |
62.22 |
63.50 |
1.26 |
9.04E-13 |
109.60 |
120.55 |
224 |
15.15 |
1,084
/
73.29% |
C. endive
exome |
1,255 |
1,071 |
97.23 |
61.91 |
63.70 |
1.74 |
4.24E-13 |
107.73 |
118.43 |
171 |
11.56 |
Table 6.
Parental genotype × genotype crossing combination and relative expected average heterozygosity (He) in the progeny
Table 6.
Parental genotype × genotype crossing combination and relative expected average heterozygosity (He) in the progeny
| P1 genotype* |
P2 genotype* |
P1×P2
avg. He |
| 0 |
0 |
0 |
| 1 |
1 |
0 |
| 0 |
1 |
1 |
| 1 |
0 |
1 |
| 0/1 |
2 |
0.5 |
| 2 |
0/1 |
0.5 |
| 2 |
2 |
0.5 |
