
Submitted:
10 February 2023
Posted:
14 February 2023
You are already at the latest version
Abstract
The integration of bacteriophages, a particular class of viruses that specifically infect bacteria and archaea, in biosensors for the monitoring of pathogens in foods and beverages is highly desirable. To this end, an increasing focus has been set on the exploration of covalent and physical methods for the immobilization of phages on solid surfaces. This work investigates the electrostatic assembly of tailed phages, specifically anti-Listeria monocytogenes P100 phages, on an ultrathin self-assembled monolayer (SAM) of 11-amino-1-undecanethiol (AUT). The cationic properties of AUT may allow for the electrostatic capture of P100 in a capsid-down fashion, thus, exposing the specific receptor-binding proteins on their tails to the corresponding pathogens in analytical samples. The physical properties of immobilized phages have been studied using AFM, SEM, and electrochemical techniques, providing insight into the orientation of the phages and revealing that the pH plays a remarkable role in the morphology and charge transfer behavior of the adsorbed films. Overall, this research portrays SAMs of amino-akylthiols as a valid platform for the oriented immobilization of bacteriophages on surfaces for electroanalytical purposes.
Keywords:
Bacteriophages
; P100
; Electrostatic Assembly
; Colloids
; Thin films
; AFM
; SEM
; Charge-Transfer Studies
; Food-borne Pathogens
; Listeria monocytogenes
1. Introduction
Herelleviruses (HVs) are a class of tailed bacteriophages known for their exceptional ability to lyse Firmicutes bacteria [1,2]. These typically consist of a non-enveloped icosahedral capsid housing the genome (aka the “head”) and a “tail” terminated in folded thin fibers (Scheme 1A). P100 phages are dsDNA HVs from the Pecentumvirus genus (Jasinkavirinae subfamily) with a genome size of 131 Kbp. These phages selectively infect Listeria monocytogenes (LMS), a dangerous bacterium that thrives in ready-to-eat foods like meats, vegetables, and seafood. LMS and other foodborne zoonoses pose significant risks to human health and place heavy economic burdens on healthcare systems worldwide. Conventional microbiological assays, while accurate, can be tedious due to their complexity and need for skilled personnel and sophisticated equipment. Immunological and nucleic acid amplification techniques, like PCR, offer faster results and improved sensitivities but also present limitations such as the cross-reactivity of polyclonal antibodies (ABs) [3] or the inability to discern viable pathogens [4]. Therefore, there is a pressing need to develop a new generation of fast-response, affordable analytical tools for the monitoring of food products at processing and storage facilities. Electrochemical biosensors (EBs) have proven their exceptional feasibility in the detection of pathogens from food matrices due to their capability to handle small samples sizes (microliters), high sensitivity, simple integration with portable readers or smartphones, quick prototyping of parts by 3D printing [5], and the availability of affordable electrode chips.
Phage-based EBs offer a distinct advantage compared to the prevalent immuno- [6,7] and geno-sensors [8]. The high specificity of phages towards their host bacterial strains makes them a highly desirable choice for incorporation into biosensors designed for the detection of food-borne pathogens in field analysis. As a result, the immobilization of naturally occurring and genetically engineered phages (NOPs and EPs) on different surface materials, has garnered increasing attention in recent years. The use of isolated bacteriophage receptor-binding proteins (RBPs) presents advantages over ABs, NOPs, and EPs, because of their enhanced stability against ambient changes (NOPs are inactivated at mild temperatures and pHs out of the window 5-9 [9]), ability to recognize specific targets at the host cell wall, high binding efficiencies [10], and their possible engineering with molecular tags (e.g. peptides with high affinity for a particular protein or carbohydrate) for oriented immobilization. However, the laborious and expensive production of RBPs and EPs is a major drawback for the construction of affordable devices. To this end, the use of wild NOPs seems a more promising avenue but it comes with its own challenges. To ensure high specificity and sensitivity, it is crucial to immobilize the NOPs in a way that maximizes the exposure of the RBPs to the bacterial species in the samples, thus, promoting the occurrence of pathogen recognition events and high infectivity. Unfortunately, unlike EPs [11], NOPs lack unique molecular tags in their capsids to promote an oriented assembly.
To overcome this issue, researchers have aimed to target amino acids (AAs) on capsid proteins (e.g. lysines, glutamic acid, etc) for the implementation of covalent attachment schemes [12,13]. This approach has proven to successfully improve the density of immobilized species [14,15] but it cannot provide orientation control as the target AAs are dispersed throughout the entire structure of the phages. Furthermore, covalently attached NOPs exhibit limited mobility and functionality [11]. This stands in contrast to the high-affinity constants (Kd) measured for physically adsorbed NOPs, which top those reported for monoclonal ABs [17]. Consequently, when the main priority is preserving the bioactivity of NOPs, physical immobilization methods may be more appropriate than covalent schemes, despite the former´s inclination to produce random orientations [16]. Different approaches including the preparation of Langmuir-Blodgett (LB) films (Guntupalli et al [18]), the fabrication of capsid-imprinted templates (Tawil et al. [19]), or the use of “immobilization layers” (ILs); have been described in the literature to provide better orientation control in physisorbed phages. Unfortunately, the ordered arrangements (with tails mostly oriented to the gas phase) obtained in LB films formed from concentrated phage dispersions, are disrupted as soon as these are transferred to a solid support. Tawil demonstrated the ability of different HVs to fit the capsid-imprinted sites in their templates which led to their immobilization in capsid-down configuration, as confirmed by the registration of enhanced infectivities [19].
However, the preparation of imprinted materials is laborious, time-consuming, and requires specialized conditions, often resulting in lower selectivity and binding efficiency compared to biological receptors. On the other hand, the IL-coating methods offer versatility, cost-effectiveness, and the ability to tailor surface properties. These rely on the establishment of interactions between the coated layer and specific regions (or residues) in the phage to guide their assembly in an oriented fashion. The use of ILs for the electrostatic capture of phages has been shown to be an effective approach in assembling films of EPs (e.g. biotin- and histidine-modified phages [20,21]) and NOPs on a variety of surfaces with great control over their orientation. This method takes advantage of the electric dipole constituted by phage capsids (negatively charged at pH higher than the capsid isoelectric point pICAP [22]) and tails (positively charged due to the presence of Fe ions in fiber protein Gp37 [23]). To foster their adsorption with the specific capsid-down configuration, ILs must be chosen to endow the substrate with a positive net charge at the working pH. Species containing ionizable cationic groups with pKA > pICAP (which typically falls in the range 3-5 [24]), e.g. –NH2, are excellent candidates for these purposes.
Accordingly, cationic polyelectrolytes such as polyvinyl acid (PVA) [23,25], polyethyleneimine (PEI) [26,27], or polydiallyldimethylammonium chloride (PolyDADMAC) [28], have been applied to coat cellulose, carbon nanotubes, and other substrates, with properly oriented phages. However, the potential of other ionizable species, including conducting polymers, biopolymers, or self-assembled monolayers; SAMs [30,31], which have been widely applied as biocompatible supports for proteins, enzymes, or ABs, in the physical immobilization of oriented phage films has yet to be explored. This work aims to fill this gap by investigating the electrostatic assembly of P100 phages on SAM-modified electrodes from a commercially available product. P100 formulations are recognized as safe by the US food and drug administration and the European Food Safety Agency for the control of LMC in processed foods [32]. In an attempt to maximize the uptake of P100 and promote the capsid-down orientation, gold electrodes were pre-coated with a SAM of 11-amino-1-undecanethiol (AUT) which acts like an IL. The structure and morphology of the films were investigated using a combination of electrochemical and microscopy methods. The effect of the pH on the morphology and electrochemical response of the films was also studied. Charge transfer studies allowed us to correlate the structural characteristics of the films to their electroactivity and, in a broader sense, to derive information about the orientation of the phages. The findings discussed in this study bring crucial insights into the design of bacteriophage-based EBs for pathogen detection.
2. Materials and Methods
2.1. Chemicals and Solutions
11-Amino-1-undecanethiol hydrochloride (AUT), disodium hydrogen phosphate dihydrate, potassium dihydrogen phosphate, sodium chloride, glacial acetic acid, and hexaamineruthenium trichloride ([Ru(NH3)6]Cl3) were supplied by Sigma Aldrich. Potassium hexacyanoferrate(II) trihydrate (K4[Fe(CN)6]·3H2O) and potassium hexacyanoferrate (III) (K3[Fe(CN)6]), from Fluka and sodium acetate trihydrate, from Merck, were also purchased and used without further purification. Ethanol and N2 were supplied by Aga and Air Liquide, respectively. Commercial aqueous dispersions of anti-LMS P100 phages (ListexTM) were acquired from Micreos Food Safety B V (Wageningen, NL). The titer of the as-received phage product was determined in double agar overlay plaque assays [33,34] as 7.2x10¹⁰ PFU·mL-1. Other components include potassium lactate (17-20%) and residual amounts of metals (ppm), yeast, and coliforms (<10 CFU·g-1). Aliquots of the Listex solution were submitted to syringe filtration using sterile single-use cellulose filters of 0.2 µm pore size (purified dispersion PG1). All the materials used in the handling of phage dispersions (pipette tips, Eppendorf tubes, etc) were previously sterilized with ethanol. A 1 mM solution of AUT in ethanol was prepared for the modification of the Au substrates. Acetate- and phosphate-buffered saline media containing 150 mM NaCl were prepared at pH 4 & 5 (ABS 0.05 M) and 6, 7, & 8 (PBS 0.05 M) in ultrapure water (UPW) from a Milli-RO3 Plus system (resistivity: 18.2 MΩ·cm). The ionic strength (I) was kept at around 0.2 M in all these buffers. When not in use, all the solutions were stored at 4 ○C.
2.2. Methods and Sample Preparation
All the electrochemical measurements were run at room temperature using a three-electrode cell and a Voltalab PGZ301 potentiostat (Radiometer Analytical). As for the reference and auxiliary electrodes, we used wires of silver (pseudo-reference) and platinum. A bulky rod of polycrystalline gold (surface area: 0.06 cm2) served as the working electrode. It was annealed in a butane-air flame and modified by 24 h immersion in 1 mM AUT. After thorough washing in ethanol and UPW, the resulting Au/AUT electrode was immersed in a diluted dispersion of P100 (PG2) prepared by 1:100 (v/v) dilution of PG1 in 0.05 M PBS pH 7 (phage titer: 7.2x10⁸ PFU·mL-1). Au/P100 electrodes were also prepared for comparison purposes. A variety of electrolytes were prepared by adding the proper amounts of [Fe(CN)6]3-/4- or [Ru(NH3)6]3+/2+ species to 0.05M ABS/PBS (Table 1). Before measurements, these were purged with N2 (10 min). The contact between the electrode surface and electrolyte was made using the hanging meniscus configuration. Cyclic voltammograms (CVs) were recorded between -0.3 and +0.6 V (electrolytes containing [Fe(CN)6]3-/4-) and -0.6 to +0.1 V ([Ru(NH3)6]3+/2+) using a scan rate (SR) of 0.05 V·s-1. Impedance spectra were taken at the half-wave potential (+0.15 and -0.32 V for the Fe- and Ru-based complexes, respectively, as determined from the CVs), with an amplitude of 10 mV and frequencies in the range 104-10-1 Hz.
The impedance data were analyzed using the equivalent circuit approach with the EcoChemie NOVA Frequency Response Analyzer (FRA) 1.8 software. The recorded plots exhibit a semicircle at medium-high frequencies (representing the contribution of the electron transfer, ET, to the total impedance) and a straight line at lower frequencies (indicating mass transport control). A variation of the Randles circuit including contributions from the electrolyte resistance (RS), double-layer charging (constant phase element, Q), mass transport (Warburg impedance, W), and an apparent charge transfer resistance (R2), was used to fit the data (see Section S1†). The diameter of the semicircle is related to R2, with a larger diameter corresponding to a higher magnitude of R2 (and vice versa) [33]. In addition to these measurements, atomic force microscopy (AFM) images were taken in tapping mode using a Nano-Observer instrument (Concept Scientific Instruments, France). Borosilicate glass slides of 11 x 11 mm2 finished with a 250 nm layer of Au (Arrandee Metal GmbH, Germany) were used as substrates.
The slides were sonicated in ethanol, acetone, and UPW (15 min each) prior to its modification. The Au/AUT samples were prepared by dip-coating of a freshly cleaned slide in AUT 1 mM. The Au/AUT/P100 slides were created by casting 60 µL of PG2 (diluted with the different buffers described in 2.1) onto Au/AUT for 12 h. It was followed by gentle removal of the phage dispersion with soft laboratory paper and thorough rinsing with UPW to prevent salt crystallization. Different regions (80 x 80, 25 x 25, and 10 x 10 µm2) on the surface of the bare Au, Au/AUT/P100, and Au/P100 slides were mapped in topography, amplitude, and phase using ACT-50 cantilevers from APP Nano (200-400 kHz; 13-77 N·m-1). Raw images were processed using the Gwyddion 2.57 software. To maintain the integrity of the samples, the slides were cast with the corresponding buffer and stored at 4 ºC when not in use. Field effect scanning electron microscopy (FE-SEM) images were recorded in secondary electrons mode using a high resolution (Schottky) Environmental Scanning Electron Microscope with X-Ray Microanalysis (FEI Quanta 400 FEG ESEM/EDAX Genesis X4M) at the Centro de Materiais da Universidade do Porto (CEMUP). Before measurements, the slides were coated with a thin Au/Pd film using a sputter coater from SPI (15 mA for 80 sec). The images were captured under a high vacuum (5 kV) at working distances of ≈10 mm.
3. Results
3.1. Electrochemistry
3.1.1. Electrode Characterization
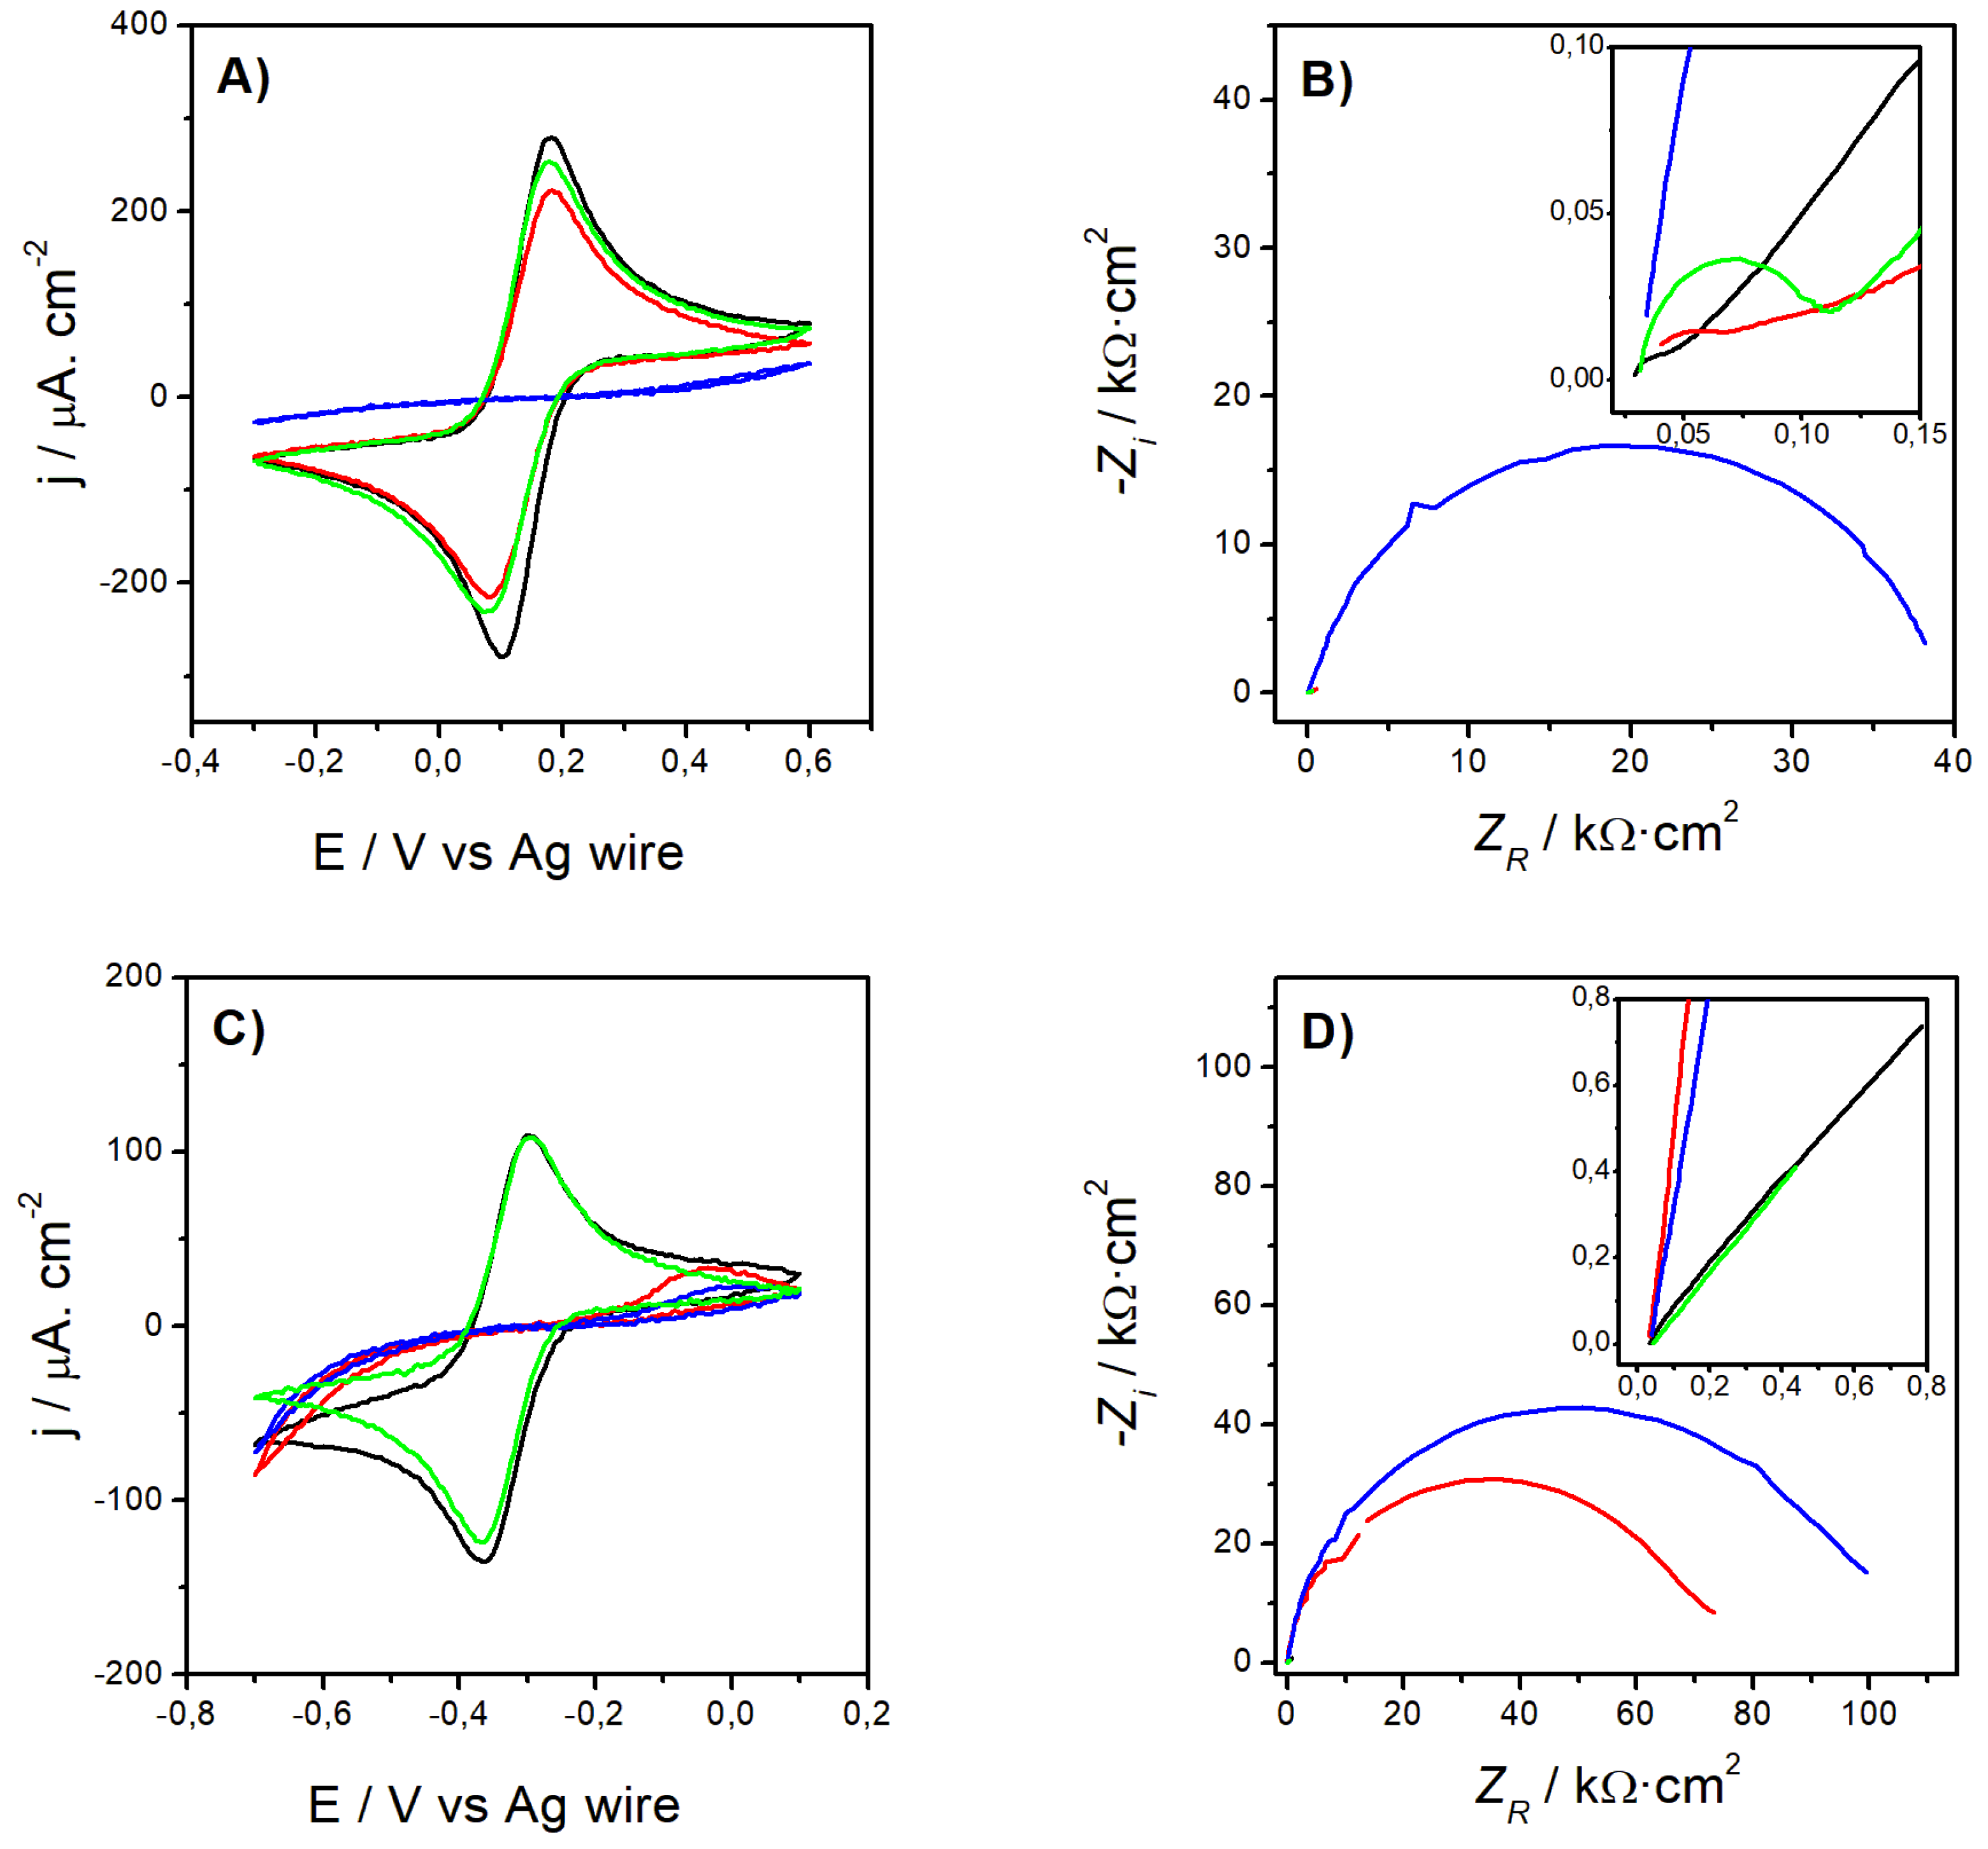
Figure 1A & 1B compare the CVs and Nyquist plots recorded for the bare Au (solid black line), Au/AUT (red), Au/AUT/P100 (blue), and Au/P100 electrodes (green) in PBS pH 8 containing 2 mM [Fe(CN)6]3-/4- (FE8 in Table 1). The data gathered in RU8 is presented in Figure 1C & 1D. The parameters derived from these experiments are summarized in Table 2 and Table 3. Starting with FE8, the highest peak current densities (anodic, jPA, and cathodic, jPC) and the lowest peak-to-peak potential distance (∆EP) were found for bare Au (Table 2). As shown in the inset of Figure 1B, its Nyquist plot also exhibits the smallest semicircle in the mid-to-high frequency region. The value derived for R2, as described in Section 2.2, was also the lowest in the series (460 Ω). The further deposition of a SAM of AUT on top of the Au surface slightly hindered the electrochemical response as indicated by the small decline in the peak currents, from 310 (bare Au) to 240 µA·cm-2 (Au/AUT), and by the 20 mV increase in their separation. The slight growth in the semicircle´s diameter and the higher value obtained for R2 (857 Ω) agree with this view.
The subsequent deposition of P100 phages onto Au/AUT resulted in a strong blockage of the response of the reversible probes in the same medium. This is evidenced by the absence of Faradaic peaks in the voltammogram and by the drastic increase in the size of the semicircle in the Nyquist plot. Consistent with these findings, R2 grew by about 750-fold. On the other hand, the reference experiments run for the Au/P100 electrode unveil an electrochemical response much closer to those exhibited by bare Au and Au/AUT. An analogous interpretation can be made from the electrochemical data collected in the presence of the [Ru(NH3)6]3+/2+ pair:
- Excellent Probe Reversibility at Bare Au. As found in FE8, the CV recorded for bare Au (Figure 1C) featured the most intense Faradaic peaks (|jPA| & |jPC| both around 130 µA·cm2, Table 3) and a low ∆EP of only 64 mV (very close to the 59 mV expected for an ideal reversible pair). Its Nyquist plot (Figure 1D) also exhibited the smallest semicircle in the series and the calculated R2 was almost negligible.
- Partially Hindered Response at Au/AUT. Unlike registered in FE8, the CV recorded in RU8 exhibited very weak peaks (only the anodic can be truly discerned) and the impedance data revealed a massive growth of both the semicircle´s diameter and R2 (up to 1186 kΩ).
- Strongly Blocked Response for Au/AUT/P100. The further deposition of P100 phages led
Au/Ato a yet more blocked voltammetric profile. This is confirmed by the lower intensity of the anodic peak, the larger semicircle, and the higher R2 (1697 kΩ, significantly higher than the 647 kΩ measured in FE8; see Table 2).
3.1.2. Role of the Electrolyte pH
The CVs and EIS measured for the same electrodes in electrolytes FE7, FE6, FE5, and FE4 can be found in the Supporting Information (Figure S1†). The parameters extracted from these curves are presented in Table S1†. Figure 2 shows the evolution of jPA (A), ∆EP (B), and R2 (C), with the decrease of the electrolyte pH from 8 to 4. It is important to note that the response of the Au/P100 electrode (solid red lines and empty circles) remained virtually identical to that of bare Au (black). The three parameters reached similar values for both electrodes in FE8 and showed minimal changes upon decreasing the pH. However, in the case of Au/AUT/P100 (blue), jPA underwent a significant increase reaching a magnitude of 160 µA·cm-2 at pH 4 (with a maximum of 316 µA·cm-2 at pH 5 that even exceeds the current recorded with bare Au). Analogous trends were observed for ∆EP (which decreased by 68%) and R2 (-97%). The large oscillations observed in the data suggest that the underlying phenomena might be complex or kinetically slow. Similar results were obtained in the RU electrolytes (Figure 2D–F). Within the range 5-8, the observed trends are nearly identical to those evidenced in the FE electrolytes. However, at pH 4, the electrochemical response was strongly hindered as evidenced by 1) the steep decline in jPA to 16 µA·cm-2, 2) the dramatic increase in ∆EP (from 90 to over 700 mV), and 3) the growth of R2 to 200 kΩ (from values below 1 Ω).
3.2. AFM Studies
3.2.1. Film Morphology
Figure 3 shows the AFM images obtained for the Au/P100 and Au/AUT/P100 slides prepared from the PG2 dispersion buffered at pH 6 (I=200 mM). A bare Au slide was also examined for comparison purposes. Its topographic image reveals a clean and granulated background with a reduced number of small particles (Figure 3A). The uniformity of the microstructure is better seen in the amplitude image (Figure 3D). Such a grainy morphology is consistent with previous images reported in the literature [33]. The average statistical parameters derived from the analysis of all the representative topographic images recorded for this sample were the lowest among all the slides investigated. Accordingly, the root-mean-square surface roughness (RMS), average peak height (HAV), and maximum peak height (HMP) achieved values of 1.56, 11, and 101 nm, respectively (Table 4). A height profile was extracted along the blue straight line in panel 3A (Figure S3†) unveiling the presence of particles with sizes and heights of around 1 and 0.1 µm, respectively, (metal clusters or defects likely formed in the slide fabrication process). The topographies registered for Au/P100 only show minor differences compared to the bare Au slide (Figure 3A,B). This is reminiscent of the similar electrochemical responses registered for the bare Au and Au/P100 electrodes in Section 3.1.1 and 3.1.2. The similarities are yet more evident in the amplitude images (Figure 3D,E).
Compared to bare Au, the Au/P100 surface (3B) only presents a slightly higher number of particles apparently distributed within a wider range of sizes. Most of these particles are between 200 and 400 nm in size, with just a few larger particles over 2 µm. This small change in morphology is reflected in the statistical parameters. In this regard, the values of RMS, HAV, and HPM, increased to 2.26, 30, and 125 nm, respectively (Table 4). In great contrast, the Au/AUT/P100 slide (panels 3C and 3F) exhibits a much higher density of particles homogenously distributed on the surface. Consistent with this view, the parameters derived from the statistical analysis increased by approximately 3-fold, 4-fold, and 2-fold, respectively. Resolving the head-tail structure of HVs using AFM is a challenging task that was not met in our measurements. Size measurements conducted from the higher magnification images presented in Figure 4A,D revealed that the particles are between 150 and 400 nm. Maximum heights of 200-230 nm, close to the value of HPM derived from the analysis of the image (282 nm), were measured from a second profile extracted along the red line in 3C (Figure S4†). Diameter measurements performed from such data confirmed that the major part of the particles were well below 1 µm.
3.2.2. Precursor Dispersion pH
The effect of the pH of the precursor dispersion on the morphology of the adsorbed films was also studied in the range 6-8. To this end, PG1 was diluted with the corresponding buffer (Section 2.1). Figure 4 presents the images of three Au/AUT/P100 slides panels prepared from dispersions buffered at increasing pH. A visual examination of 4A-4C shows surfaces that are fully covered with the biomaterial in all cases. The topography in 4A, taken for the same slide in Figure 3C,F (pH 6), depicts a surface coated with a relatively homogeneous distribution of oval particles. As discussed in Section 3.2.1, the size distribution derived from these images goes from 150 nm to a maximum of 400 nm. As pH was increased, significant changes in the morphology of the films were observed. Larger and amorphous particulates appear in panels 4B/4E (pH 7) and 4C/4F (pH 8). The statistical parameters derived from the topographies confirmed this observation (Table 5). The data shows a significant increase in RMS (from 5.5 at pH 6 to 7.0, pH 7, and 7.2 nm, pH 8) and HPM (from 22 to 40 and 57 nm, respectively).
3.3. FE-SEM Studies
The films were also investigated under the electron microscope. Images were taken in random surface locations of the Au/AUT/P100 slide prepared at pH 6. Before discussing the most representative shots, let us describe the results obtained in one particular region. Figure 5 shows a top view of such locations. On it, the surface looks well-covered with a bright, smooth, and relatively flat film. In the bottom left quadrant of the figure, we discovered what appears to be a set of bacteria lying on top of such film. Even though the commercial Listex preparation was pre-purified (PG1) and further diluted in buffer (PG2) before its use, the evidence suggests the presence of residual amounts of bacteria in the latter. The image also reveals a cracked hole in the thin film, which allows for the observation of underlying polyhedral nanostructures. These nanoparticles were found to have a regular size of 180-200 nm and some appear attached to the bacterial walls, as indicated by the red arrows in the higher magnification image (figure inset). Additionally, the zoomed image also unveiled a grainy morphology for the bright coating. EDX spectra acquired on top of the intact film showed a strong signal of Na (not shown). These intriguing findings are critical for understanding the physical characteristics and internal structure of the films.
However, the most representative images collected for Au/AUT/P100, as illustrated in Figure 6A, not only depict the bright background shown in Figure 5 but also the presence of dark particles on top of it. The size distribution in panel 6B (calculated as outlined in the experimental section), reveals the co-existence of a minor fraction of large bodies (300-500 nm diameter) and a vast majority of smaller particles (100-150 nm). The average size (dAV) fell around 200 nm. The examination of the Au/AUT/P100 slides prepared at pH 7 and 8, shows no remarkable differences in morphology (top views presented in panels 6C & 6E). However, as supported by the data in panels 6D & 6F, the size distributions were significantly impacted. As the pH increased, the counts’ peak shifted towards larger particle sizes (200-300 nm at pH 7 and 400-500 at pH 8). Moreover, dAV did also increase to approximately 400 and 600 nm, respectively. These findings confirm that raising the pH within the investigated window triggers an increase in the surface density of deposited particles and their average size.
4. Discussion
The analysis of the electrochemical results confirmed, in the first place, the exceptional reversibility of the redox pairs at Au electrodes (as previously established in the literature [35]). Secondly, the data obtained in FE8 with the Au/AUT electrode only evidenced a very slight decline in electroactivity compared to bare Au. This contradicts the behavior that should be expected for the assembly of a complete monolayer of AUT on the gold electrode, as the adsorption of alkylthiol molecules on the electroactive Au sites would block the ET processes through it. To explain the results obtained for the Au/AUT electrode, we must necessarily admit other phenomenologies, beyond the physical blockage of surface sites, affecting its redox response. It is worth reminding that despite the proximity of the pKa of AUT (7-8 [35]) to the working pH, a significant fraction of –NH2 endgroups in the SAM must remain protonated as –NH3+, conferring the surface with positive net charge (σAUT >0) and the ability to establish electrostatic interactions with the probes. In FE8, attractive endgroup-probe forces may drive the diffusion of the [Fe(CN)6]3-/4- anions through the SAM, thus, increasing their concentration near the Au surface to boost the ET kinetics [35]. Indeed, this phenomenon seems to govern the overall electrochemical response of Au/AUT.
In RU8, the positively charged probes establish repulsive interactions with the SAM, thus, hampering their diffusion through it and resulting in the strongly blocked CV and large semicircle observed in Figure 1C,D. Most phage capsids are known to bear negative overall charge density (σCAP<0) for pH>5 (i.e. for pH>pICAP) [24]. The attractive electrostatic interactions established between the -NH3+ groups at AUT and the P100 capsids are expected to drive the deposition of the phages with a preferential capsid-down orientation in Au/AUT/P100 (Scheme 2A). Under such a configuration, the positively charged fiber tails and RBPs are exposed to the solution resulting, again, in a positive net surface charge density (σ P100). Hence, the electroactivity of Au/AUT/P100 must be also determined by the balance between steric and electrostatic factors. In FE8, the establishment of attractive interactions with the negatively charged probes may facilitate the ET processes (just as indicated in Scheme 2A). However, the physical blockage of probe diffusion pathways through the SAM by massive virion particles (and, possibly, their still larger aggregates) seems to rule the electrochemical response of Au/AUT/P100. In RU8, both factors are detrimental to the ET rates and this explains the higher impedance registered compared to FE8. The repulsive interactions between the Au/AUT/P100 surface and the RU probes provide another strong barrier for the ET processes to occur (purple probes in Scheme 2A).
These results indicate that steric effects are the dominant factor, which provides a first confirmation of the large-scale deposition of phages onto Au/AUT. In contrast, the results obtained for the Au/P100 electrode do not suggest the existence of strong barriers for the ET processes and indicate negligible adsorption of P100 onto Au (at pH 8). In good agreement, the AFM and SEM images obtained for Au/P100 and Au/AUT/P100 show dramatic differences in the load of material successfully immobilized on both surfaces. While the data in Figures 3A/3D, 3B/3E, and Table 4 are consistent with a very minor deposition of phages taking place on Au, as indicated by the minor changes in surface morphology and statistical parameters, Figures 3C/3F, 4, & 6, prove that a much larger amount of particles are loaded onto the Au/AUT slide. The wild differences in electrochemical response and morphology found for both surfaces underscore the importance of the positive charge introduced by AUT for the successful immobilization of the phages. Additionally, all the electrochemical results discussed above are consistent with the electrostatic regimens expected to be established by a layer of P100 mostly oriented in capsid-down configuration. With regards to the effect of the electrolyte pH, the decrease in R2 and ∆EP, and the increase in |jP|, indicate that the ET processes become increasingly facilitated as the pH decreases in the interval 8-4.
These results are consistent with a gradual decrease in the amount of P100 deposited onto Au/AUT as the electrolyte gets more acidic. As previously noted in the introduction, most NOPs are unstable at pH<5. Any partial disassembly/unfolding of pre-adsorbed phages under these conditions would reduce the density of virions settled on the electrode surface, and that explains the results observed in FE4. However, the changes that occurred within the stability range of the phages (FE8-FE5) seem to be likely influenced by specific characteristics of the deposits at the working pH. In this regard, the positive σAUT is expected to increase and the negative σCAP to be slightly reduced as the pH decreases from 8 to 5. These changes may result in the weakening of the attractive capsid-endgroup electrostatic interactions involved in the formation of the P100 film, thus, causing a gradual decrease in the density of virions immobilized on Au/AUT. This phenomenon would turn ET processes increasingly easier just as indicated by the experimental results. The oscillations found in the data may be due to either the slow equilibration of the surface pH from the bulk pH or to slow re-arrangements occurring in the films. Electrostatic effects established between the probes and the immobilized phages have been left aside because, in the FE electrolytes, these always contribute in the sense of favoring mass transport and improving the ET rates.
In general, similar trends were observed in RU electrolytes but with a couple of main differences. Firstly, the blockage of the ET processes in RU8 was stronger compared to FE8, consistent with the electrostatic repulsion likely established between the adsorbed phages and the redox probes (Scheme 2A). Secondly, the electrochemical response in RU4 was strongly blocked (instead of going significantly easier as found in FE4). This can be also attributed to the disassembly of the adsorbed phages at the acidic pH, but it is worth noting that, in this case, the detachment of phages exposes the positive charge of the underlying AUT layer (which is even higher at pH 4). Hence, the stronger repulsion established with the positively charged probes must determine the stronger blockage exhibited by the Au/AUT/P100 electrode in RU4. Although the characteristic shape of HVs (Scheme 1A) could not be resolved in our microscopic images, it can be concluded that the largest fraction of the particles spotted in Figures 3C,FFigures 4A,D and Figure 6A correspond to isolated P100 phages immobilized on Au/AUT. This is supported by the dimensions reported in the literature for isolated active HVs (200-300 nm [37,38,39]), which are consistent with the measurements from our AFM/SEM data, but also by the perfect match between the shape and size of the particles found in our images and those reported for the mica/PEI/T4 slides prepared by Szermer-Olearnik et al [36].
They demonstrated that T4 phages can undergo reversible dispersion/aggregation transitions in aqueous media triggered by changes in salt content. Accordingly, the AFM topographies reported for the surfaces prepared with high salt content (I=150 mM) showed isolated phages with their recognizable head-tail morphology (size: 100-200 nm). On the other hand, much larger amorphous clusters (300-800 nm) were observed in the images of the films prepared from low I<20 mM. SEM images were also provided in that study revealing that the clusters are formed upon aggregation of individual virions. As for the small fraction of particles over 300 nm observed in our images, these may be due to residual self-aggregation taking place in the aqueous phase or to the effects of common issues in AFM imaging such as tip-dragging phenomena or low lateral resolution (leading both to the overestimation of particle sizes). Regarding the polyhedral nanostructures observed in Figure 5, the evidence strongly suggests that these may correspond to isolated capsids of P100. Not only do their sizes match the expectations, but their presence on the bacterial walls suggests possible infection processes going on. These results indicate that: 1) P100 species successfully adsorb on top of the Au/AUT surface, 2) despite the samples being thoroughly rinsed in UPW after phage modification, a thin layer of NaCl seems to cover the phages on certain regions of the surface (as suggested by Figure 5 and Figure 6 and the EDX analysis), 3) although residual amounts of coliforms are contained in the commercial product, the presence of the polyhedral particles stuck to the walls of the spotted bacteria strongly suggests that these are LMC.
These results confirm the presence of the surface-immobilized virions and are very important to understand the layered structure of the Au/AUT/P100 film. On the other hand, increasing the precursor´s pH from 6 to 8 induced dramatic changes in the morphology of the films. This is reflected qualitatively in the recorded images (Figure 4 and Figure 6) and quantitatively through the increase followed by RMS, HAV, and dAV. Therefore, one can infer that the degree of aggregation of the deposited phages rises significantly with the increase in the precursor´s pH (a behavior analogous to that reported for T4 when the precursor´s salt content was reduced). While the SEM images recorded by Szermer-Olearnik et al were able to display individual T4 phages as being the fundamental components of the aggregates, the fine structure of the clusters could not be resolved in our measurements. This is most likely due to the Au/Pd coating applied to the samples giving the clusters the dark and amorphous appearance shown in Figure 6. Additionally, Szermer-Olearnik et al applied laborious phage fixation and dehydration treatments originally developed for the characterization of isolated phages. Despite the limitations, the results presented in this work suggest that regular SEM/AFM sample preparation protocols can be still a valid approach for a reliable description of the morphological and structural characteristics of the collective structures formed by solid-supported phages. At this point, it is important to note that our results go beyond the work of Szermer-Olearnik by demonstrating that phage aggregation phenomena in the aqueous phase are not only controlled by salt content but also by pH.
While Szermer-Olearnik´s model highlighted I as the main parameter triggering the reversible aggregation (decreasing salt concentration) and redispersion (increasing salt concentration) of T4 virions, their dynamic light scattering experiments already suggested a relevant role for the pH. These investigated the kinetics of aggregation after diluting a T4 dispersion (I=150 mM) with PBS at pH 5.80, 7.00, and 8.64 (final I=10 mM in all cases). At pH 5.80, no change was observed in the most frequent hydrodynamic radius after dilution (RH≈140 nm). This finding evidenced a negligible role of the salt concentration in the aggregation behavior at that particular pH. On the other hand, the experiments at pH 7.0 and 8.6 showed a pronounced increase in RH to 800 nm and faster aggregation kinetics at pH 8.6. Szermer-Olearnik’s analysis focused on the latter finding and did not emphasize sufficiently the surprising behavior recorded at pH 5.8. However, this was a key finding supporting that, as also backed by the complete body of results presented in this work, pH is more important than salt content in determining the self-aggregation behavior of HVs. Our results at I=200 mM replicate the trends observed by Szermer-Olearnik et al. at I=10 mM within a very similar range of pH: i.e. negligible aggregation for pH≤6 and its increasing role for pH>6.
If the electrostatics ruling phage aggregation was determined by the isoelectric point of the whole phage (e.g. pIT4=4 [40]), we should expect the opposite trend. As the pH increases from 6 to 8 the negative charge density at the phage should grow, fostering an increasing electrostatic repulsion among phages and lower degrees of aggregation. To propose a valid model that explains the obtained results, we must regard phages as electrical head-tail dipoles (Scheme 2B). Considering the typical range of pICAP for most viral capsids in the range of 3-5 [24], we should expect σCAP to be negative within the range of pHs investigated. In addition, its absolute value should increase from pH 6 to 8 (top right corner of Scheme 2A). Islam et al. have recently reported that the terminal needle part of Gp37 proteins in the tail fibers of T4 is an interwoven trimer containing three domains (knob, stem, and tip) [41]. While the tip contains the RBPs, the stem is a long, six-stranded, antiparallel β-barrel formed by residues from three polypeptides which complete one and a half turns around the fiber axis. Central to the interwoven strands, Fe2+ ions help to hold the strands together and confer the fiber tails with a positive charge [41,42] (Scheme 1A).
Therefore, tail-to-head electrostatic aggregation of HVs in solution is a possibility. Szermer-Olearnik et al. not only demonstrated tail-to-head aggregation of T4 but correlated the size of the aggregates with the magnitude of I (which proves that the phenomenon is governed by electrostatic) [36]. As σCAP grows with increasing the pH, a stronger attraction towards the positive tails leads to a higher number of phages attracted per every single capsid (check the art model in Scheme 2B). Hence, larger particles will deposit on the positively charged surfaces leaving amorphous patterns as those observed in the AFM and SEM images reported in this work. Such an effect is expected to be stronger in low I media because of the reduced impact of ion-mediated charge screening phenomena. However, the results presented in this work demonstrate that pH-induced aggregation of P100 phages in solution still operates at I >150 mM and governs the morphology of the films deposited onto Au/AUT. Contrary to the viewpoint put forth by Szermer-Olearnik et al., which depicted phage aggregation/dispersion of phages as an evolutionary adaptative mechanism that allows for their collective survival outside the host, our study suggests that the behavior of HVs is purely governed by their physicochemical phenomena. This perspective aligns with the current understanding of the behavior of colloidal matter and provides a more comprehensive understanding of the behavior of HVs in aqueous media.
5. Conclusions
This research aimed to investigate the adsorption of anti-LMC P100 phages on a C11 amino-substituted alkylthiol SAM such as AUT. The distinct electrochemical behavior observed for the redox probes at the Au/AUT/P100 (blocked response) and Au/P100 electrodes (high reversibility and low impedance) emphasizes the crucial role of the positive charge introduced by AUT in the successful immobilization of phages at large scale as high-density films. SEM images confirmed that P100 virions are deposited in the outermost layer of the Au/AUT/P100 construct (even though capped with an ultrathin layer of salt). The AFM and SEM results demonstrate the aggregation of P100 phages triggered by the increase in the precursor´s pH over 6. Furthemore, we have proposed an electrostatic head-to-tail mechanism of self-aggregation for P100 that explains the increasingly larger and amorphous particles found in the microscopic evidence (and the increasingly hindered electrochemical response found in electrolytes buffered at pH in the range 5-8). This research has established the ability of amino-terminated SAMs for the physical immobilization of bacteriophages in an oriented manner, which opens the door to potential applications in biotechnology, pathogen detection, and food safety. In a more general vein, our results confirm the validity of the IL approach as a simple and elegant way to support properly oriented films of HVs.
Supplementary Materials
The following supporting information can be downloaded at the website of this paper posted on Preprints.org., Scheme S1: Randles-type circuit used to fit the impedance data acquired in this work; Figure S1: CVs and Nyquist plots acquired for the bare Au, Au/AUT, Au/AUT/P100, and Au/P100 electrodes in electrolytes FE7-FE4; Figure S2: CVs and Nyquist plots acquired for the bare Au, Au/AUT, Au/AUT/P100, and Au/P100 electrodes in electrolytes RU7-RU4; Table S1: Anodic and cathodic peak current densities, potentials, peak-to-peak potential difference, and apparent charge transfer resistances derived from Figure S1; Table S2: Anodic and cathodic peak current densities, potentials, peak-to-peak potential difference, and apparent charge transfer resistances derived from Figure S2; Figure S3: Height profile extracted along the blue line in Figure 3A; Figure S4: Height profile extracted along the blue line in Figure 3C
Author Contributions
Conceptualization, J.M.C. and C.M.P.; methodology, J.M.C,; software, J.M.C.; validation, P.M.V.F.; formal analysis, J.M.C.; investigation, P.M.V.F.; resources, C.M.P and J.M.C..; data curation, J.M.C; writing—original draft preparation, J.M.C.; writing—review and editing, J.M.C.; visualization, P.M.V.F. and J.M.C.; supervision, J.M.C. and C.M.P.; project administration, J. M. C.; funding acquisition, C.M.P. All authors have read and agreed to the published version of the manuscript.
Funding
This work was supported by the European Union and Portuguese national funds (FEDER through NORTE2020 – Programa Operacional Regional do Norte; Ref. NORTE-01-0145-031968) The funding was allocated by the Fundacão para a Ciência e a Tecnologia de Portugal (FCT) through the projects with reference UIDB/00081/2020 & PTDC/NAN-MAT/31698 (CIQUP-Faculty of Sciences-University of Porto) and LA/P/0056/2020 (IMS-Institute of Molecular Sciences). P.M.V.F. also acknowledges the FCT for the concession of a doctoral grant (SFRH/BD/111274/2015).
Acknowledgments
We are grateful to Dr. Júlia Magalhães for her invaluable support and guidance in various aspects of this research, and for her unwavering dedication as the principal investigator of the RapidPhageSensing project. We would also like to express our sincere gratitude to Dr. Paula Teixeira and his team from Universidade Catolica Portuguesa for their generosity in performing the microbiological assays for phage tittering.
Conflicts of Interest
The authors declare no conflict of interest. The funders had no role in the design of the study; in the collection, analyses, or interpretation of data; in the writing of the manuscript; or in the decision to publish the results.
References
- Klumpp, J.; Dorscht, J.; Lurz, R.; Bielmann, R.; Wieland, M.; Zimmer, M.; Calendar, R.; Loessner, M.J. The Terminally Redundant, Nonpermuted Genome of Listeria Bacteriophage A511: a Model for the SPO1-Like Myoviruses of Gram-Positive Bacteria. J. Bacteriol. 2008, 190, 5753–5765. [Google Scholar] [CrossRef] [PubMed]
- Barylski, J.; Kropinski, A.M.; Alikhan, N.F.; Adriaenssens, E.M. ICTV Virus Taxonomy Profile: Herelleviridae. J. Gen. Virol. 2020, 101, 362–363. [Google Scholar] [CrossRef] [PubMed]
- Li, B.; Li, X.; Dong, Y.; Wang, B.; Li, D.; Shi, Y.; Wu, Y. Colorimetric Sensor Array Based on Gold Nanoparticles with Diverse Surface Charges for Microorganisms Identification. Anal. Chem. 2017, 89, 10639–10643. [Google Scholar] [CrossRef] [PubMed]
- Robinson-McCarthy, L.R; Mijalis, A.J.; Filsinger, G.T.; de Puig, H.; Donghia, N.M.; Schaus, T.E.; Rasmusen, R.A.; Ferreira, R.; Lunshof, J.E.; Chao, G.; Ter-Ovanesyan, D.; Dodd, O.; Kuru, E.; Sesay, A.M.; Rainbow, J.; Pawlowski, A.C.; Wannier, T.M.; Yin, P.; Collins, J.J.; Ingber, D.E.; Church, G.M.; Tam, J. M. Anomalous COVID-19 Tests Hinder Researchers. Science 2021, 371, 244–245. [Google Scholar] [CrossRef] [PubMed]
- Castiaux, A.D.; Pinger, C.W.; Hayter, E.A.; Bunn, M.E.; Martin, R.S.; Spence, D.M. PolyJet 3D-Printed Enclosed Microfluidic Channels without Photocurable Supports. Anal. Chem. 2019, 91, 6910–6917. [Google Scholar] [CrossRef] [PubMed]
- Silva, N.F.; Almeida, C.M.; Magalhães, J.M.; Gonçalves, M.P.; Freire, C.; Delerue-Matos, C. Development of a disposable paper-based potentiometric immunosensor for real-time detection of a foodborne pathogen. Biosens. Bioelectron. 2019, 141, 111317. [Google Scholar] [CrossRef] [PubMed]
- Luo, Y. Functional Nucleic Acid Based Biosensor for Microorganism Detection. In Functional Nucleic Acid Based Biosensors for Food Safety Detection. Springer: Singapore, China, 2018. [CrossRef]
- Malekzad, H.; Jouyban, A.; Hasanzadeh, M.; Shadjou, N.; de la Guardia, M. Ensuring Food Safety Using Aptamer Based Assays: Electroanalytical Approach. Trends Analyt. Chem. 2017, 94, 77–94. [Google Scholar] [CrossRef] [PubMed]
- Jonczyk, E.; Klak, M.; Miedzybrodzki, R.; Gorski, A. (2011). The Influence of External Factors on Bacteriophages-Review. Folia Microbiol. 2011, 56, 191–200. [Google Scholar] [CrossRef] [PubMed]
- Singh, A.; Arya, S.K.; Glass, N.; Hanifi-Moghaddam, P.; Naidoo, R.; Szymanski, C.M.; Tanha, J.; Evoy, S. Bacteriophage Tailspike Proteins as Molecular Probes for Sensitive and Selective Bacterial Detection. Biosens. Bioelectron. 2010, 26, 131–138. [Google Scholar] [CrossRef]
- Tolba, M.; Minikh, O.; Brovko, L.Y.; Evoy, S.; Griffiths, M.W. Oriented Immobilization of Bacteriophages for Biosensor Applications. Appl. Environ. Microbiol. 2010, 76, 528–535. [Google Scholar] [CrossRef]
- Lee, L.A.; Wang, Q. Adaptations of Nanoscale Viruses and other Protein Cages for Medical Applications. Nanomedicine 2006, 2, 137–149. [Google Scholar] [CrossRef]
- Lee, L.A; Niu, Z.; Wang, Q. Viruses and Virus-like Protein Assemblies-Chemically Programmable Nanoscale Building Blocks. Nano. Res. 2009, 2, 349–364. [Google Scholar] [CrossRef]
- Arya, S.K.; Singh, A.; Naidoo, R.; Wu, P.; McDermott, M.T.; Evoy, S. Chemically Immobilized T4-bacteriophage for Specific Escherichia coli Detection Using Surface Plasmon Resonance. Anal. The 2011, 136, 486–492. [Google Scholar] [CrossRef] [PubMed]
- Handa, H.; Gurczynski, S.; Jackson, M.P.; Mao, G. Immobilization and Molecular Interactions between Bacteriophage and Lipopolysaccharide Bilayers. Langmuir 2010, 26, 12095–12103. [Google Scholar] [CrossRef] [PubMed]
- Singh, A.; Poshtiban, S.; Evoy, S. Recent Advances in Bacteriophage Based Biosensors for Food-Borne Pathogen Detection. Sensors 2013, 13, 1763–1786. [Google Scholar] [CrossRef]
- Nanduri, V.; Sorokulova, I.B.; Samoylov, A.M.; Simonian, A.L.; Petrenko, V.A.; Vodyanoy, V. Phage as a Molecular Recognition Element in Biosensors Immobilized by Physical Adsorption. Biosens. Bioelectron. 2007, 22, 986–992. [Google Scholar] [CrossRef]
- Guntupalli, R.; Sorokulova, I.; Long, R.; Olsen, E.; Neely, W.; Vodyanoy, V. Phage Langmuir Monolayers and Langmuir–Blodgett Films. Colloids Surf. B 2011, 82, 182–189. [Google Scholar] [CrossRef]
- Tawil, N.; Sacher, E.; Mandeville, R.; Meunier, M. Strategies for the Immobilization of Bacteriophages on Gold Surfaces Monitored by Surface Plasmon Resonance and Surface Morphology. J. Phys. Chem. C 2013, 117, 6686–6691. [Google Scholar] [CrossRef]
- Wang, Z.; Wang, D.; Chen, J.; Sela, D.A.; Nugen, S.R. Development of a Novel Bacteriophage based Biomagnetic Separation Method as an Aid for Sensitive Detection of Viable Escherichia coli. Anal. The 2016, 141, 1009–1016. [Google Scholar] [CrossRef]
- Kim, W.G.; Song, H.; Kim, C.; Moon, J.S.; Kim, K.; Lee, S.W.; Oh, J.W. Biomimetic Self-templating Optical Structures Fabricated by Genetically Engineered M13 Bacteriophage. Biosens. Bioelectron. 2016, 85, 853–859. [Google Scholar] [CrossRef]
- Serwer, P. Agarose Gel Electrophoresis of Bacteriophages and Related Particles. J. Chromatogr. B Biomed. Sci. Appl. 1987, 418, 345–357. [Google Scholar] [CrossRef] [PubMed]
- Anany, H.; Chen, W.; Pelton, R.; Griffiths, M.W. Biocontrol of Listeria monocytogenes and Escherichia coli O157:H7 in Meat by Using Phages Immobilized on Modified Cellulose Membranes. Appl. Environ. Microbiol. 2011, 77, 6379–6387. [Google Scholar] [CrossRef] [PubMed]
- Nap, R.; Božič, A.; Szleifer, I.; Podgornik, R. The Role of Solution Conditions in the Bacteriophage PP7 Capsid Charge Regulation. Biophys. J. 2014, 107, 1970–1979. [Google Scholar] [CrossRef] [PubMed]
- Lone, A.; Anany, H.; Hakeem, M.; Aguis, L.; Avdjian, A.C.; Bouget, M.; Atashi, A.; Brovko, L.; Rochefort, D.; Griffiths, M.W. Development of Prototypes of Bioactive Packaging Materials Based on Immobilized Bacteriophages for Control of Growth of Bacterial Pathogens in Foods. Int. J. Food Microbiol. 2016, 217, 49–58. [Google Scholar] [CrossRef] [PubMed]
- Vonasek, E.; Lu, P.; Hsieh, Y.L.; Nitin, N. Bacteriophages Immobilized on Electrospun Cellulose Microfibers by Non-specific Adsorption, Protein–Ligand Binding, and Electrostatic Interactions. Cellulose 2017, 24, 4581–4589. [Google Scholar] [CrossRef]
- Farooq, U.; Ullah, M.W.; Yang, Q.; Aziz, A.; Xu, J.; Zhou, L.; Wang, S. High-Density Phage Particles Immobilization in Surface-Modified Bacterial Cellulose for Ultra-Sensitive and Selective Electrochemical Detection of Staphylococcus Aureus. Biosens. Bioelectron. 2020, 157, 112163. [Google Scholar] [CrossRef] [PubMed]
- Imai, M.; Mine, K.; Tomonari, H.; Uchiyama, J.; Matuzaki, S.; Niko, Y.; Hadano, S.; Watanabe, S. Dark-Field Microscopic Detection of Bacteria using Bacteriophage-Immobilized SiO2@AuNP Core–Shell Nanoparticles. Anal. Chem. 2019, 91, 12352–12357. [Google Scholar] [CrossRef] [PubMed]
- Richter, U.; Matuła, K.; Leśniewski, A.; Kwaśnicka, K.; Łoś, J.; Łoś, M.; Paczesny, J.; Hołyst, R. Ordering of Bacteriophages in the Electric Field: Application for Bacteria Detection. Sens. Actuators B Chem. 2016, 224, 233–240. [Google Scholar] [CrossRef]
- Campiña, J. M.; Souza, H. K.; Borges, J.; Martins, A.; Gonçalves, M. P.; Silva, F. (2010). Studies on the Interactions between Bovine β-lactoglobulin and Chitosan at the Solid–Liquid Interface. Electrochim. Acta 2010, 55, 8779–8790. [Google Scholar] [CrossRef]
- Borges, J.; Campiña, J.M.; Silva, A.F. Chitosan Biopolymer–F(ab′)2 Immunoconjugate Films for Enhanced Antigen Recognition. J. Mater. Chem. B 2013, 1, 500–511. [Google Scholar] [CrossRef]
- PhageGuard Listex GRAS approved for 10 years! – PhageGuard.com. Available online: https://phageguard.com/phageguard-listex-gras-approved-for-10-years/ (accessed on 9 January 2023).
- Plaque Assay: A Method To Determine Viral Titer As Plaque Forming Units (PFU) – JoVE Science Education Database. Available online: https://www.jove.com/v/10514/plaque-assay-a-method-to-determine-viral-titer-as-plaque-forming-units-(pfu) (accessed on 9 January 2023).
- Kropinski, A.M.; Mazzocco, A.; Waddell, T.E.; Lingohr, E.; Johnson, R.P. (2009). Enumeration of Bacteriophages by Double Agar Overlay Plaque Assay. Methods Mol. Biol. 2009, 501, 69–76. [Google Scholar] [CrossRef] [PubMed]
- Campiña, J.M.; Martins, A.; Silva, F. Selective Permeation of a Liquidlike Self-Assembled Monolayer of 11-Amino-1-undecanethiol on Polycrystalline Gold by Highly Charged Electroactive Probes. J. Phys. Chem. C 2007, 111, 5351–5362. [Google Scholar] [CrossRef]
- Szermer-Olearnik, B.; Drab, M.; Mąkosa, M.; Zembala, M.; Barbasz, J.; Dąbrowska, K.; Boratyński, J. Aggregation/Dispersion Transitions of T4 Phage Triggered by Environmental Ion Availability. J. Nanobiotechnology 2017, 15. [Google Scholar] [CrossRef] [PubMed]
- Parker, M.L.; Ralston, E.J.; Eiserling, F.A. Bacteriophage SPO1 Structure and Morphogenesis. II. Head Structure and DNA Size. J. Virol. 1983, 46, 250–259. [Google Scholar] [CrossRef] [PubMed]
- López de Dicastillo, C.; Settier-Ramírez, L.; Gavara, R.; Hernández-Muñoz, P.; López Carballo, G. Development of Biodegradable Films Loaded with Phages with Antilisterial Properties. Polymers 2021, 13, 327. [Google Scholar] [CrossRef] [PubMed]
- Fister, S., Mester, P., Sommer, J., Witte, A. K., Kalb, R., Wagner, M., Rossmanith, P. Virucidal Influence of Ionic Liquids on Phages P100 and MS2. Front. Microbiol. 2017, 8. [CrossRef]
- Lakshmanan, R. S., Guntupalli, R., Hu, J., Kim, D. J., Petrenko, V. A., Barbaree, J. M., Chin, B. A. Phage Immobilized Magnetoelastic Sensor for the Detection of Salmonella typhimurium. J. Microbiol. Methods 2007, 71(1), 55–60. [CrossRef]
- Islam, M. Z. Fokine, A., Mahalingam, M., Zhang, Z., Garcia-Doval, C., van Raaij, M. J., Rossmann, M. G., Rao, V. B. Molecular Anatomy of the Receptor Binding Module of a Bacteriophage Long Tail Fiber. PLOS Pathog. 2019, 15. [Google Scholar] [CrossRef] [PubMed]
- Bartual, S. G., Otero, J. M., Garcia-Doval, C., Llamas-Saiz, A. L., Kahn, R., Fox, G. C., van Raaij, M. J. Structure of the Bacteriophage T4 Long Tail Fiber Receptor-Binding Tip. Proc. Natl. Acad. Sci. U. S. A. 2010, 107(47), 20287–20292. [CrossRef]
- Randles, J. E. B. Kinetics of Rapid Electrode Reactions. Discuss. Faraday Soc. 1947, 1, 11–19. [Google Scholar] [CrossRef]
Scheme 1.
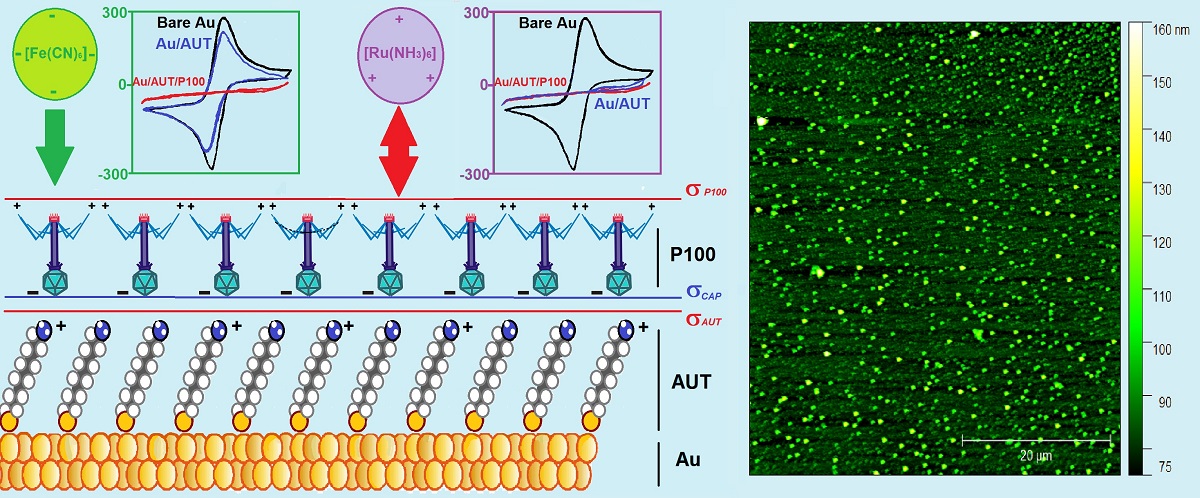
– A) Art model depicting the typical morphology of herelleviruses (or SPO1-like viruses, as previously known). The protein structure of long fiber tails is shown. The proximal and distal halves are displayed in red and orange colors (Gp34 and Gp37 proteins, respectively). Receptor binding proteins (RBPs) and Fe (II) ions (small yellow balls) are located on the tip of Gp37. B) Capsid-down (or end-on) orientation of tailed phages adsorbed onto a positively charged surface.
Scheme 1.
– A) Art model depicting the typical morphology of herelleviruses (or SPO1-like viruses, as previously known). The protein structure of long fiber tails is shown. The proximal and distal halves are displayed in red and orange colors (Gp34 and Gp37 proteins, respectively). Receptor binding proteins (RBPs) and Fe (II) ions (small yellow balls) are located on the tip of Gp37. B) Capsid-down (or end-on) orientation of tailed phages adsorbed onto a positively charged surface.
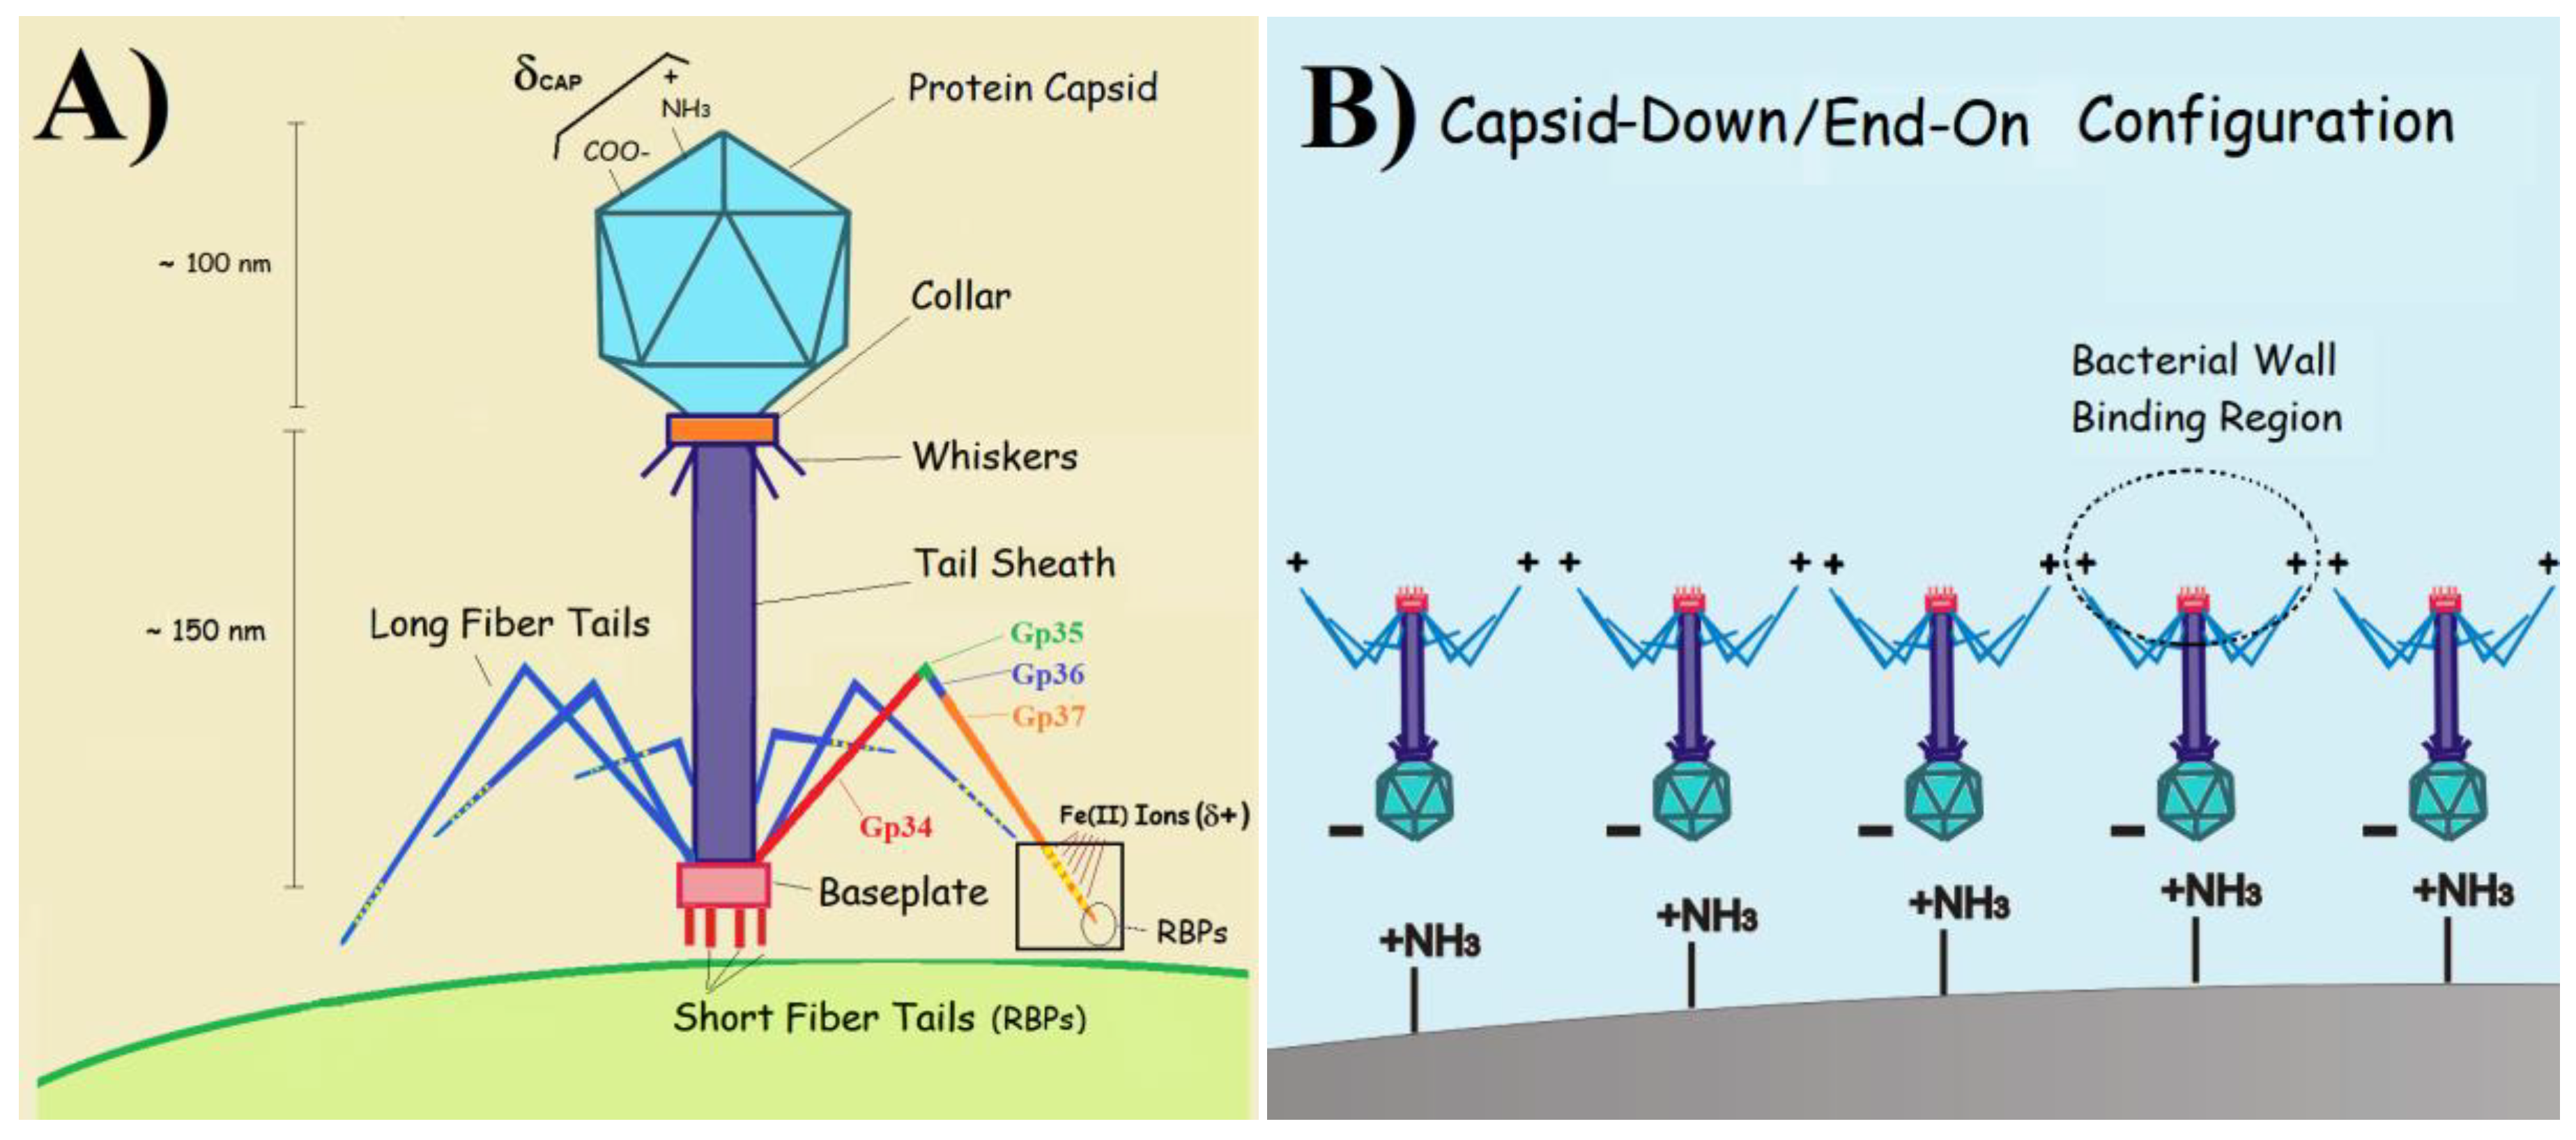
Figure 1.
CVs (A, C) and Nyquist plots (B, D) acquired for the bare Au (black), Au/AUT (red), Au/AUT/P100 (blue), and Au/P100 electrodes (green) in electrolytes FE8 (A & B) and RU8 (C & D). The scan rate was 0.05 V·s-1. The oscillating amplitude used to record the impedance spectra was 0.01 V.
Figure 1.
CVs (A, C) and Nyquist plots (B, D) acquired for the bare Au (black), Au/AUT (red), Au/AUT/P100 (blue), and Au/P100 electrodes (green) in electrolytes FE8 (A & B) and RU8 (C & D). The scan rate was 0.05 V·s-1. The oscillating amplitude used to record the impedance spectra was 0.01 V.
Scheme 2.
Art models illustrating: A) the adsorption of P100 phages onto the NH2-terminated surface of Au/AUT electrodes. The charge densities at Au/AUT (σAUT) and phage capsid (σCAP) are expected to change slightly within the range of pH investigated (as indicated in the top right part of the chart). Electrostatics dictates a capsid-down (end-on) orientation that exposes the positively charged tails to the solution resulting in an external charge density (σP100). B) the potential evolution of electrostatic head-to-tail aggregation of P100 phages in solutions upon increasing the pH.
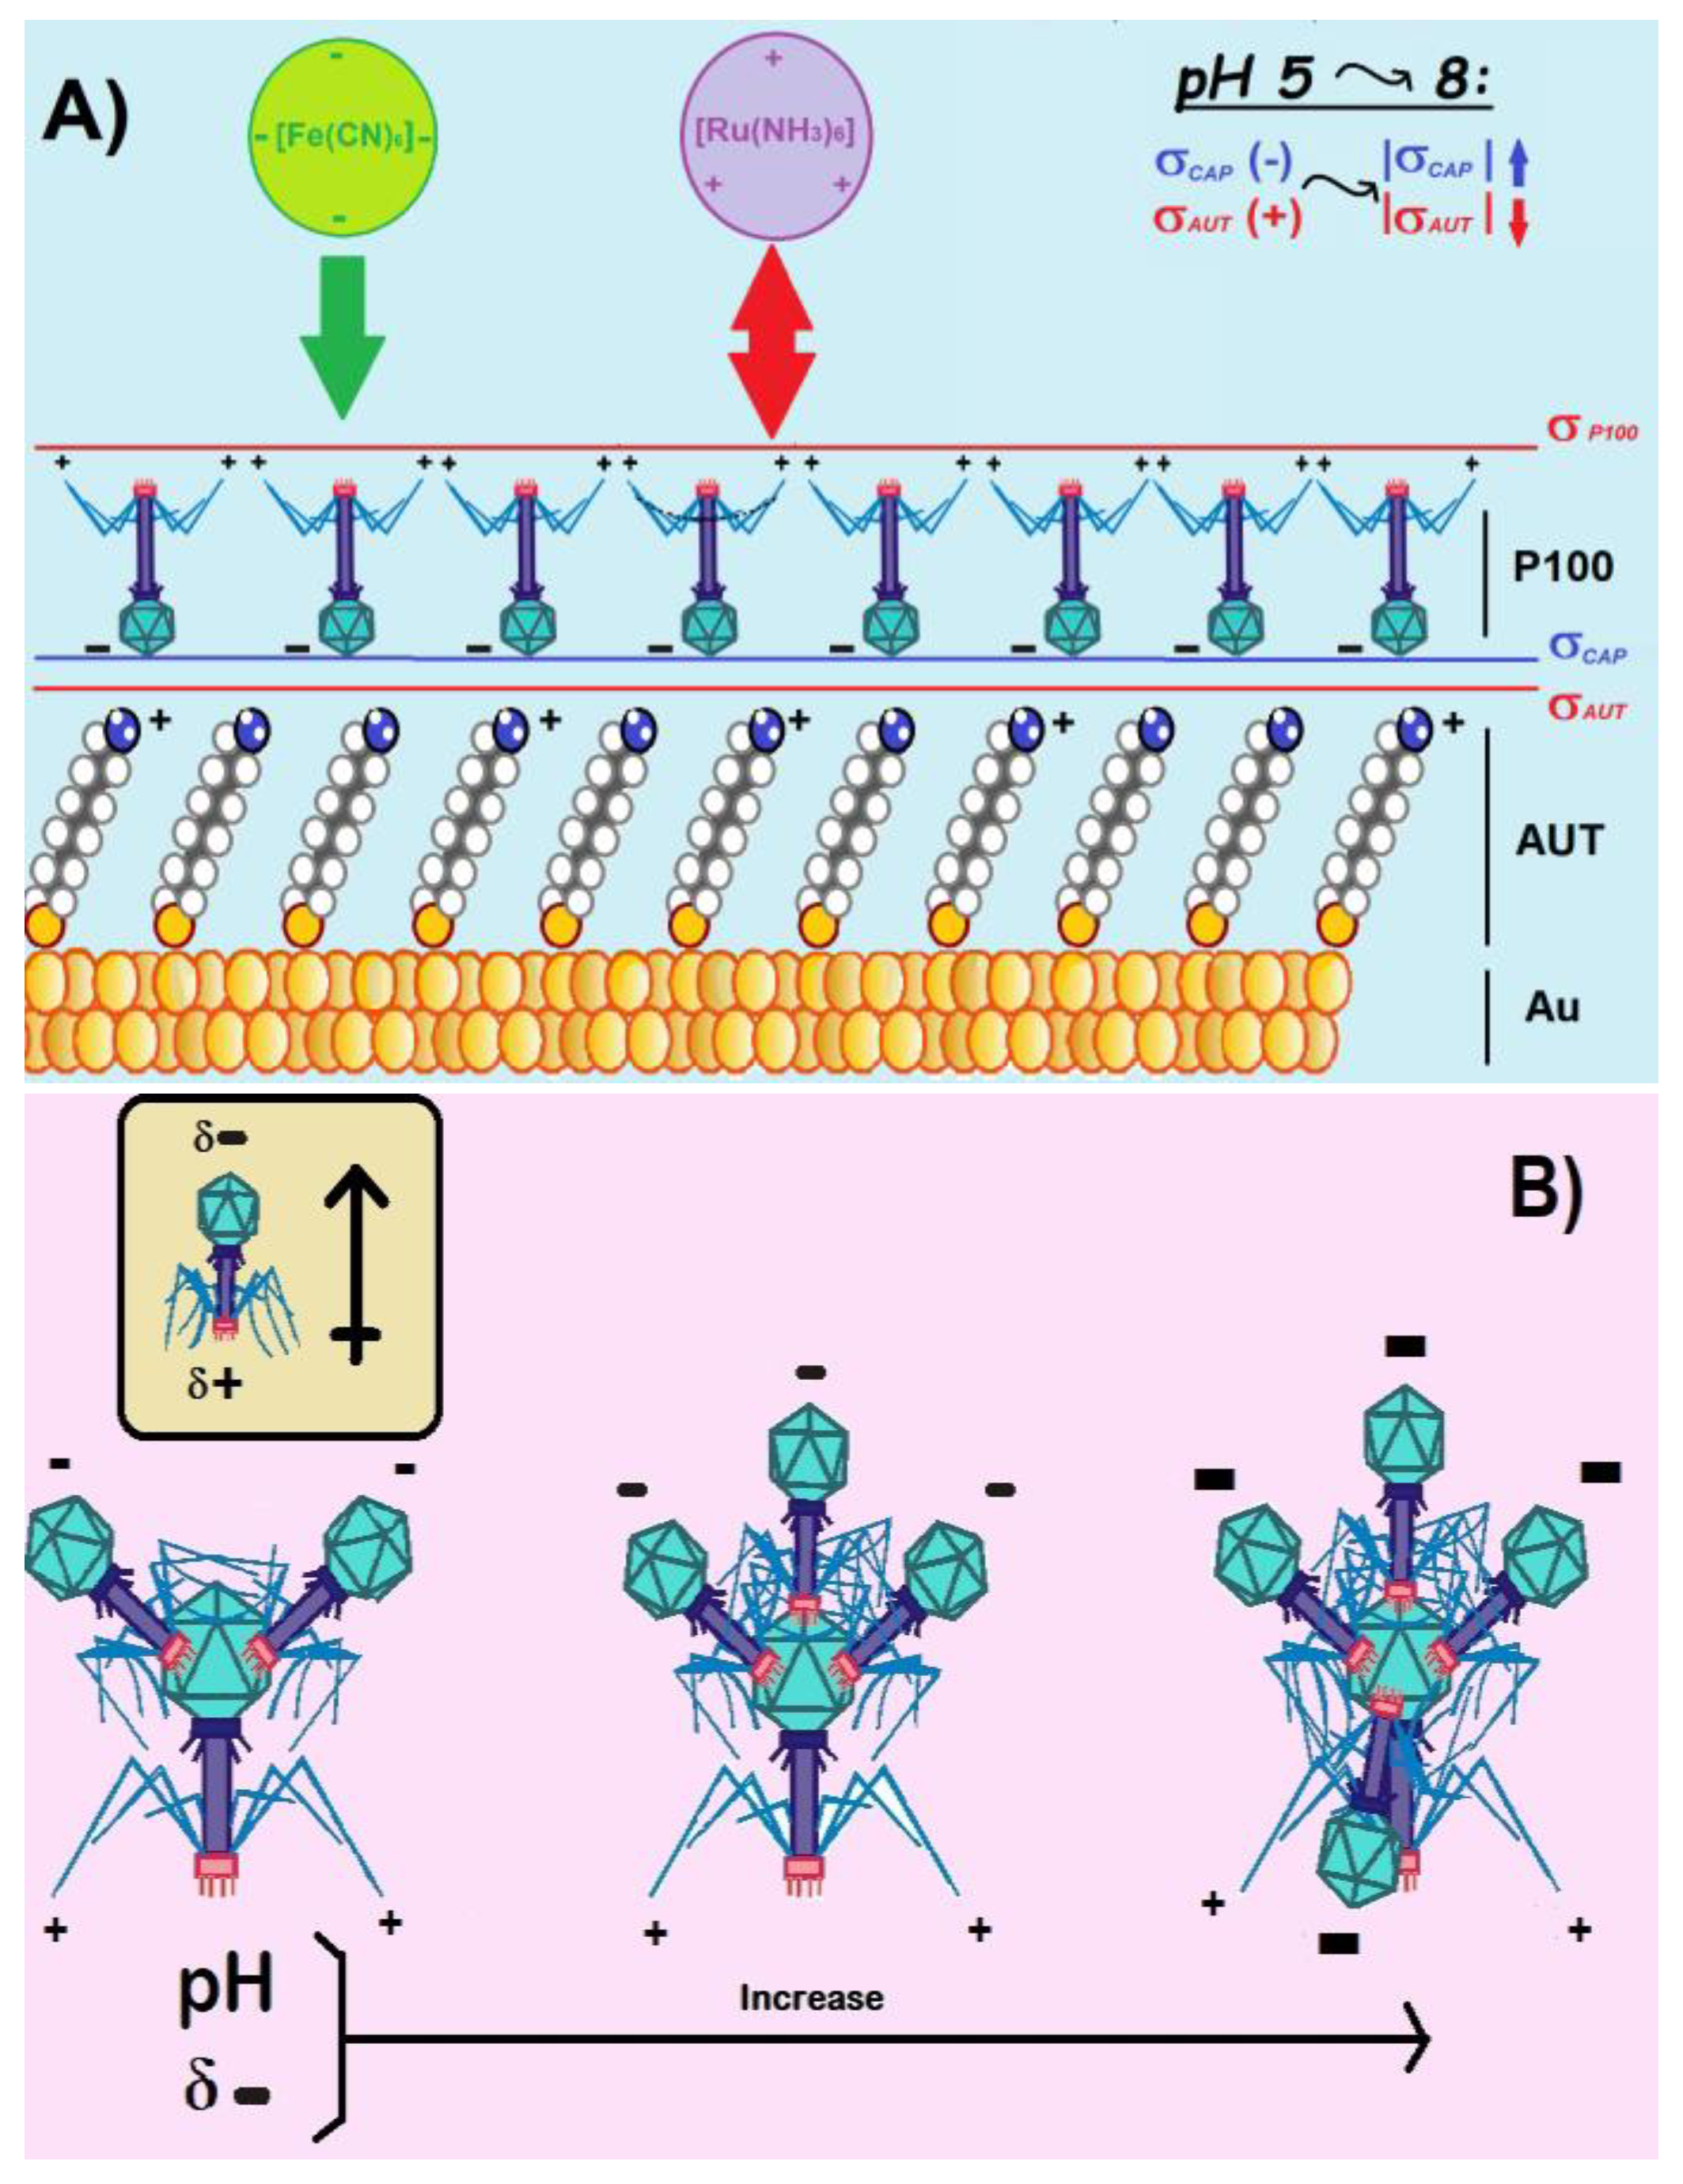
Figure 2.
Evolution of jPA (A & D), ∆EP (B & E), and R2 (C & F) for bare Au (black solid line and empty circles), Au/AUT/P100 (blue), and Au/P100 (red) as a function of the electrolyte pH: FE8-FE4 (A-C) and RU8-RU4 (D-F). The data was extracted from the CVs and impedance spectra shown in Table S1†.
Figure 2.
Evolution of jPA (A & D), ∆EP (B & E), and R2 (C & F) for bare Au (black solid line and empty circles), Au/AUT/P100 (blue), and Au/P100 (red) as a function of the electrolyte pH: FE8-FE4 (A-C) and RU8-RU4 (D-F). The data was extracted from the CVs and impedance spectra shown in Table S1†.
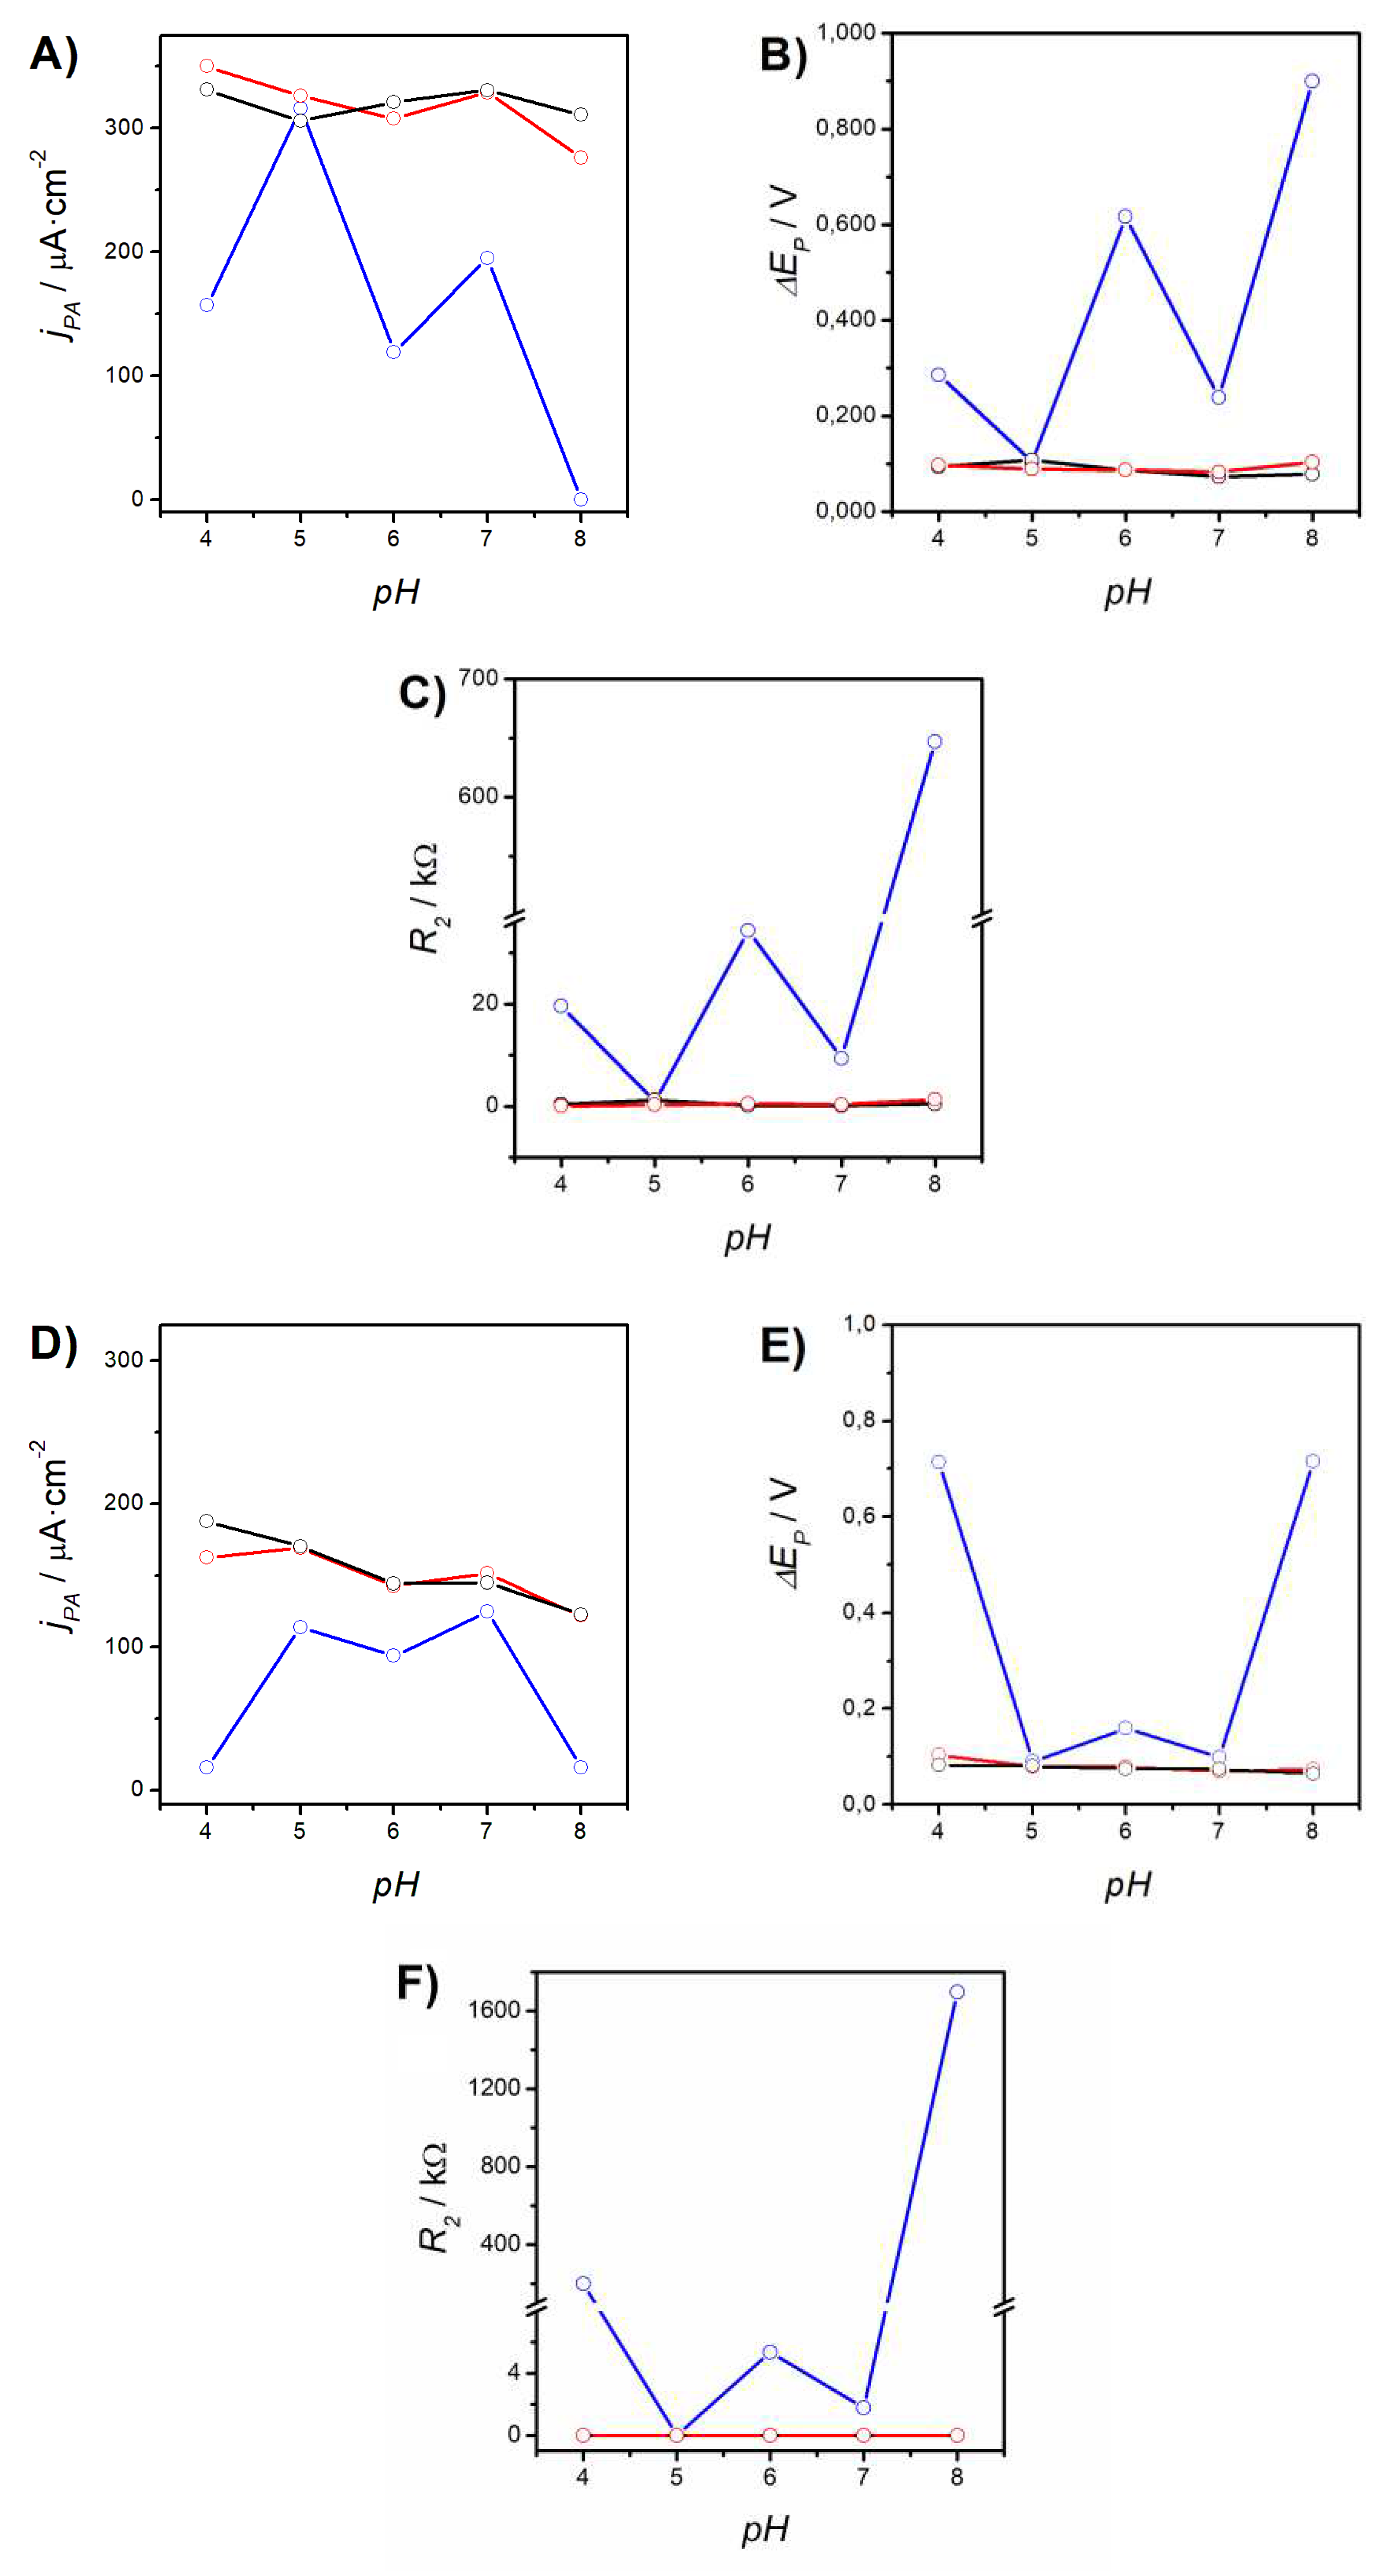
Figure 3.
Topography (A-C) and amplitude (D-F) AFM images registered in tapping mode over 80 x 80 µm2 regions of the bare Au (A & D), Au/P100 (B & E), and Au/AUT/P100 slides (C & F). The latter two were prepared from P100 dispersions buffered at pH 6 (I≈200 mM). The blue and red lines correspond to the extracted height profiles. Scale bars are 20 µm.
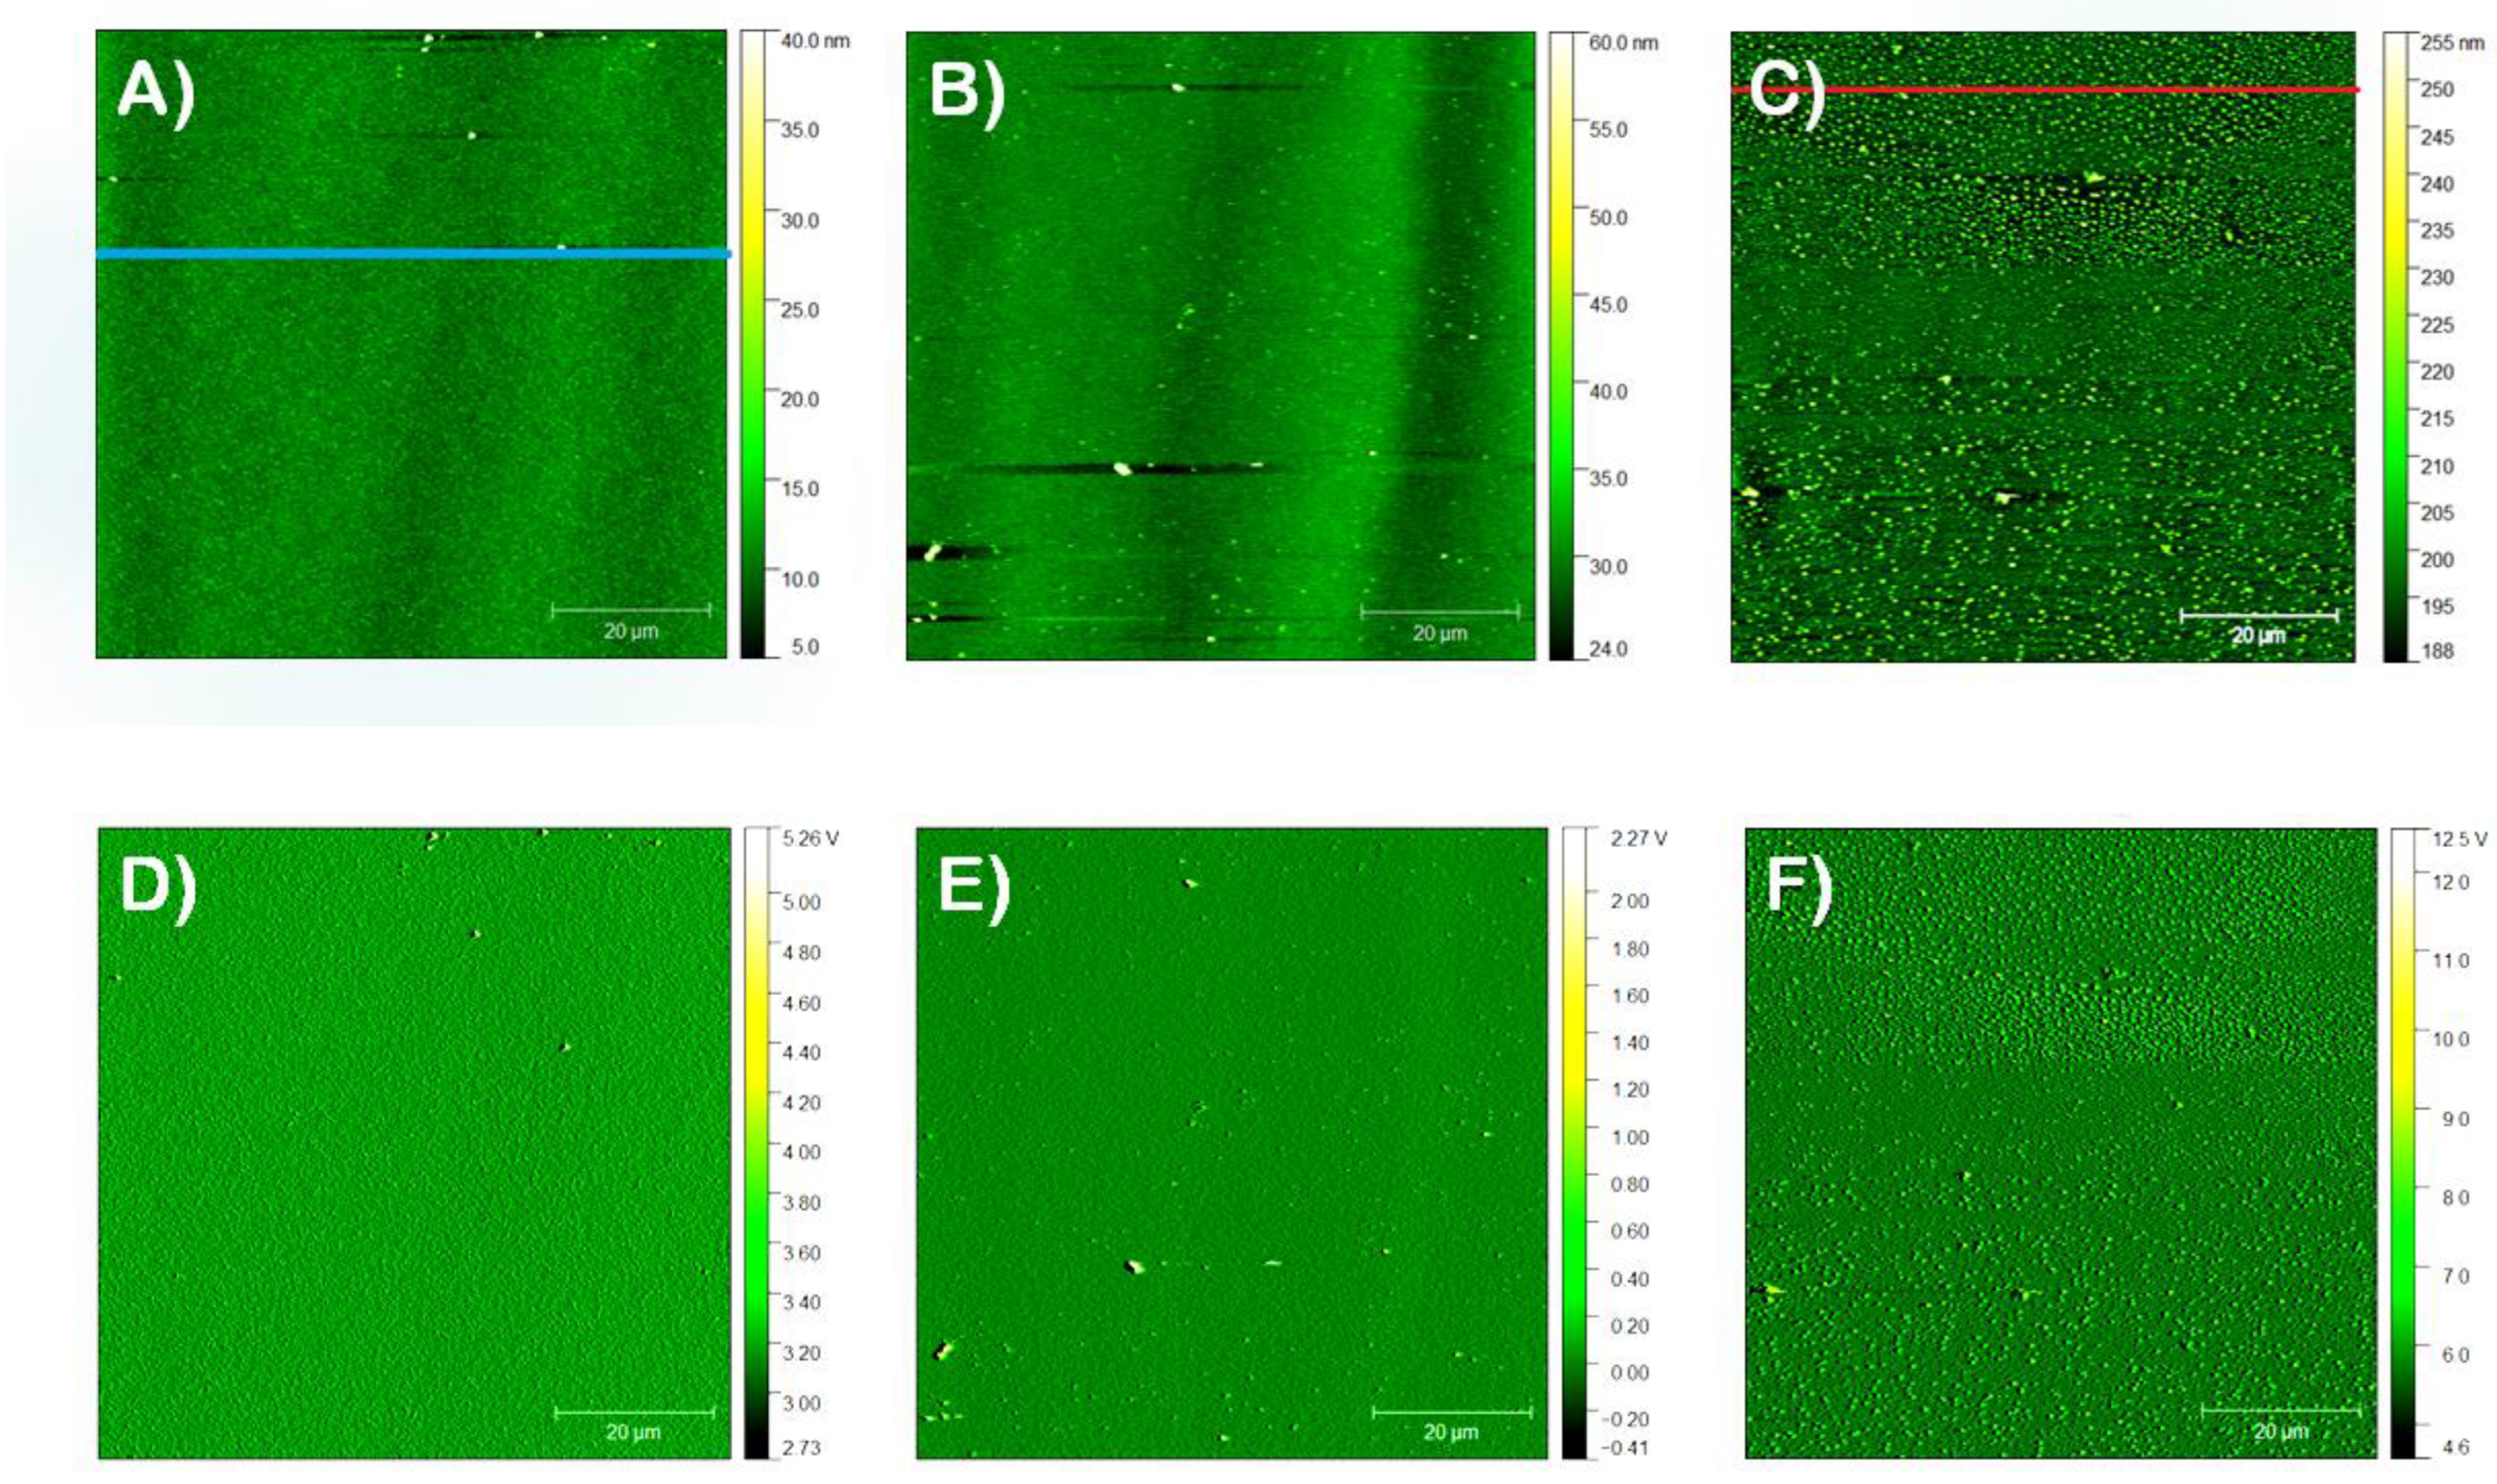
Figure 4.
Topography (A-C) and amplitude (D-F) AFM images registered in tapping mode over 80 x 80 µm2 regions of the Au/AUT/P100 slides prepared from the P100 dispersions (salt content around 200 mM in all cases) buffered at pH 6 (A & D), 7 (B & E), and 8 (C & F). Scale bars are 2 µm.
Figure 4.
Topography (A-C) and amplitude (D-F) AFM images registered in tapping mode over 80 x 80 µm2 regions of the Au/AUT/P100 slides prepared from the P100 dispersions (salt content around 200 mM in all cases) buffered at pH 6 (A & D), 7 (B & E), and 8 (C & F). Scale bars are 2 µm.
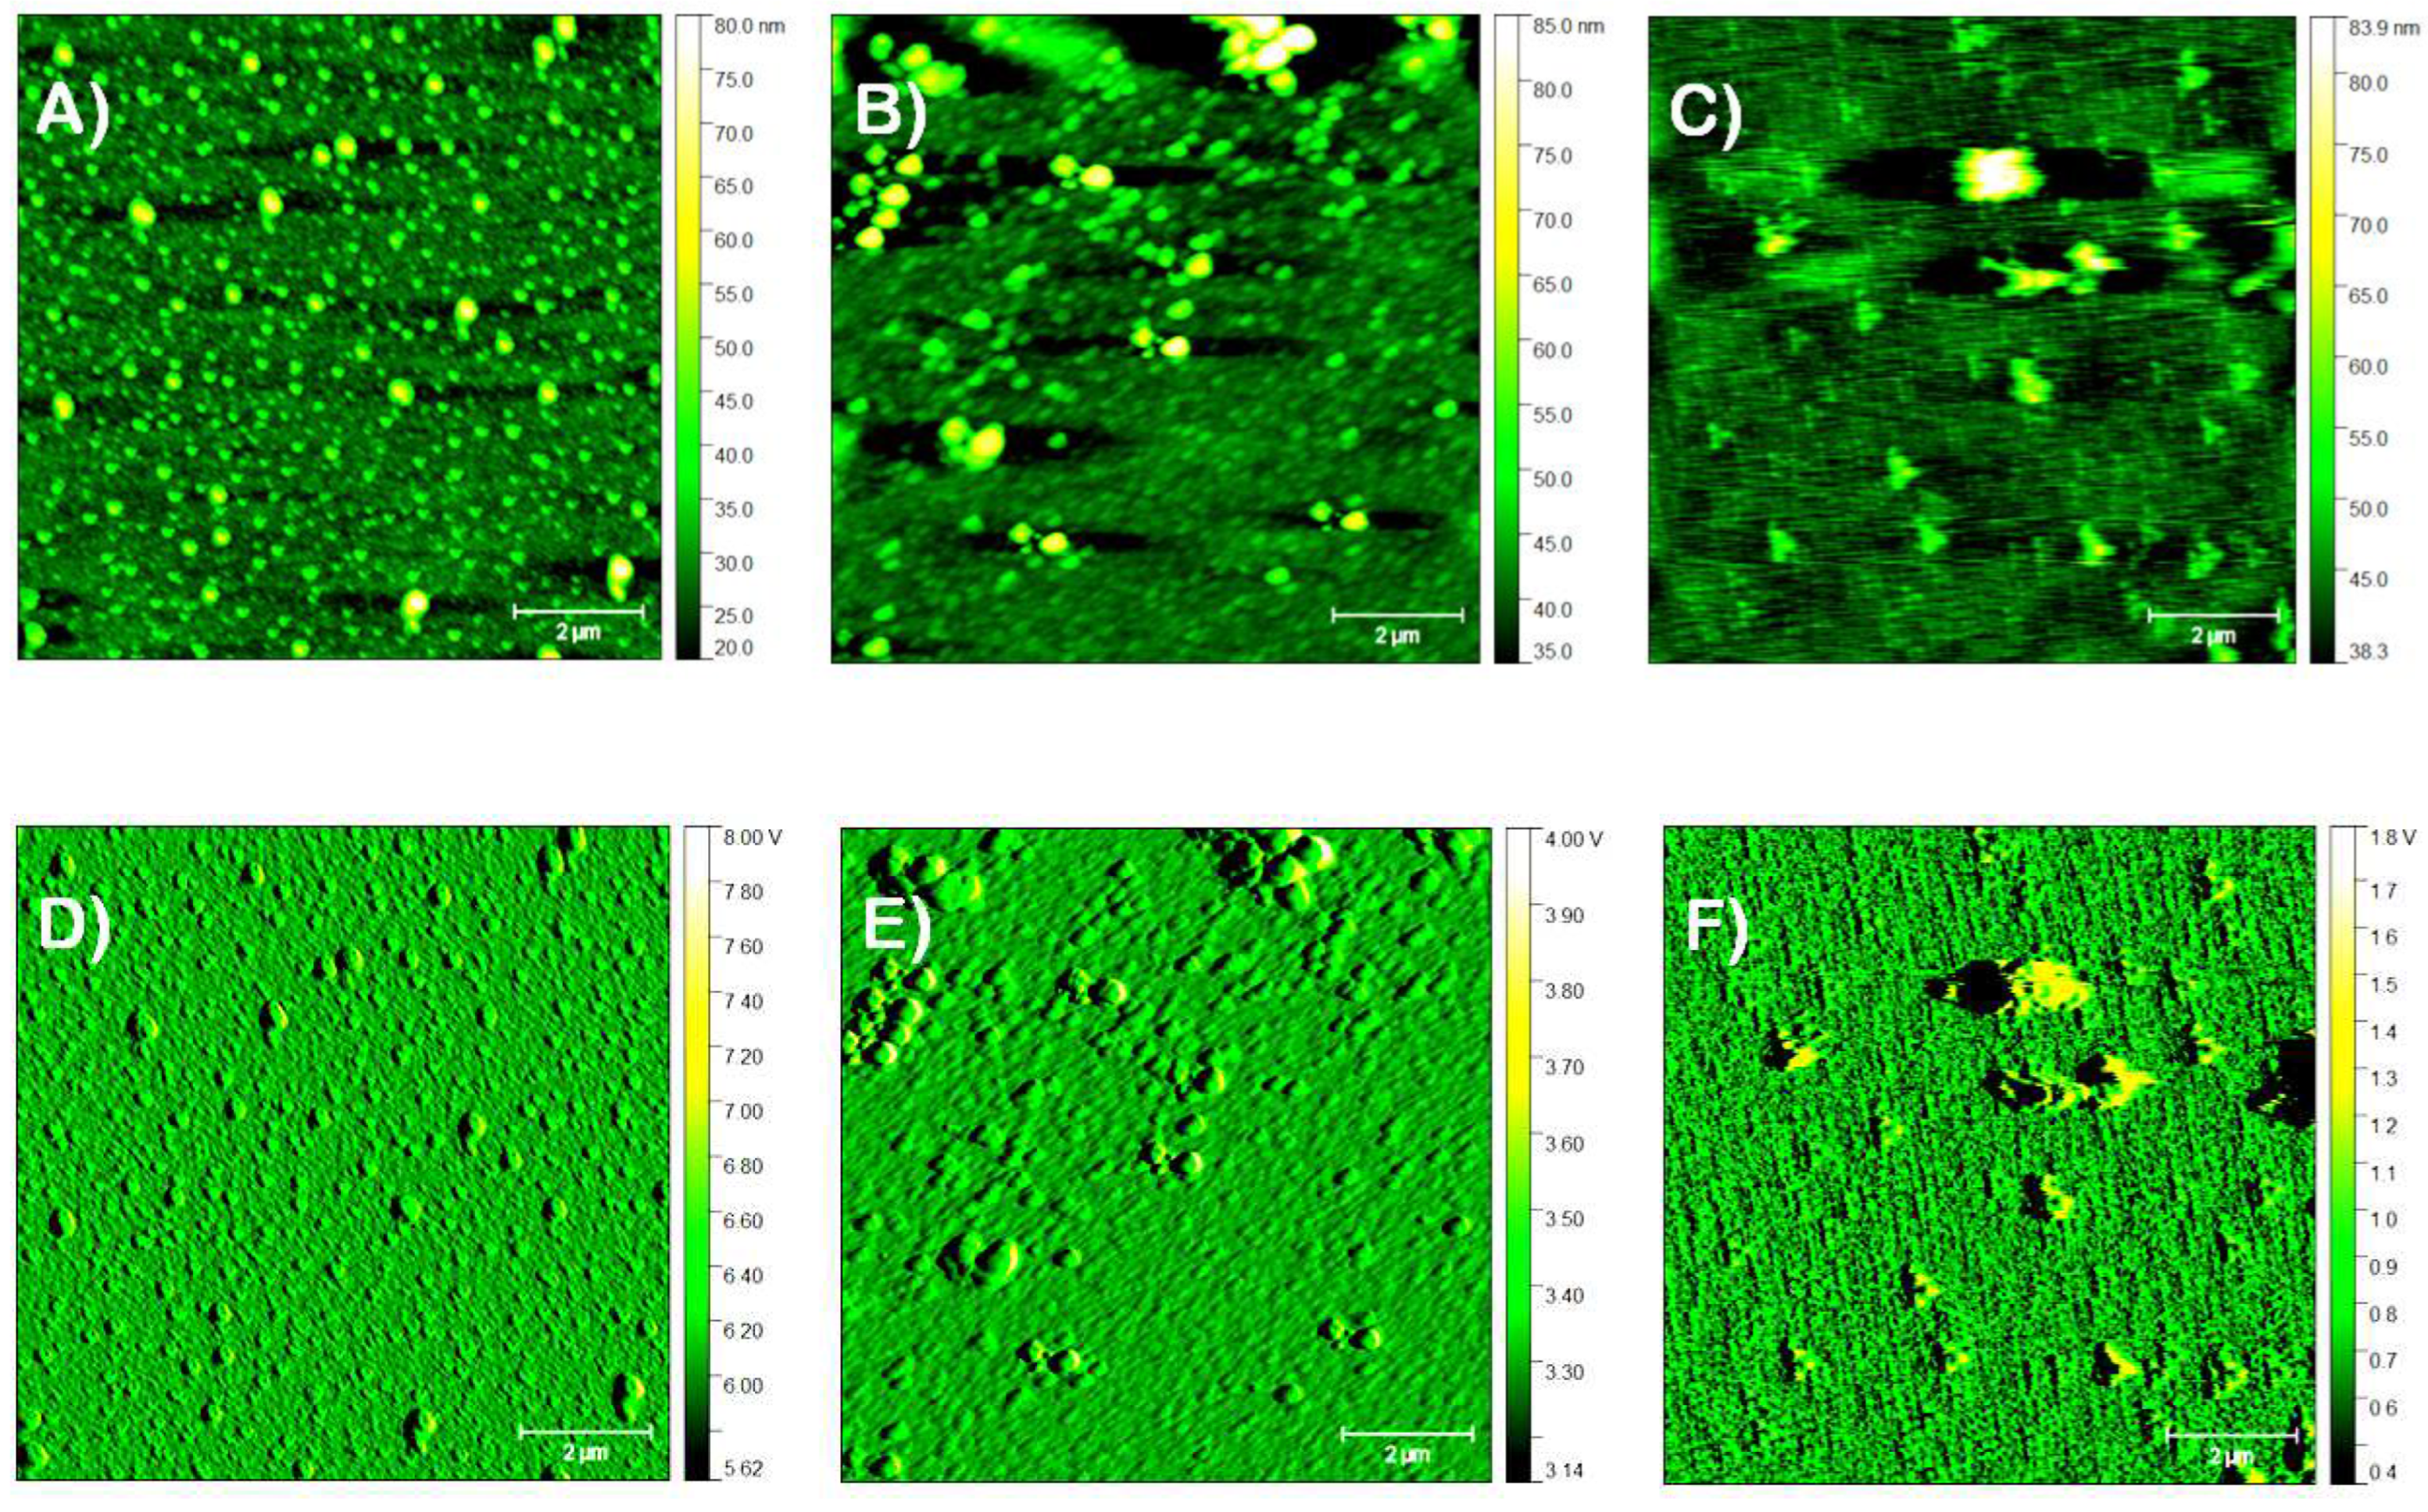
Figure 5.
SEM image taken at a particular location of the surface of Au/AUT/P100 showing the rare presence of a residual amount of bacteria. The red inset enlarges this area. Red arrows point towards a series of geometric particles that appear both on the surface and attached to bacterial walls.
Figure 5.
SEM image taken at a particular location of the surface of Au/AUT/P100 showing the rare presence of a residual amount of bacteria. The red inset enlarges this area. Red arrows point towards a series of geometric particles that appear both on the surface and attached to bacterial walls.
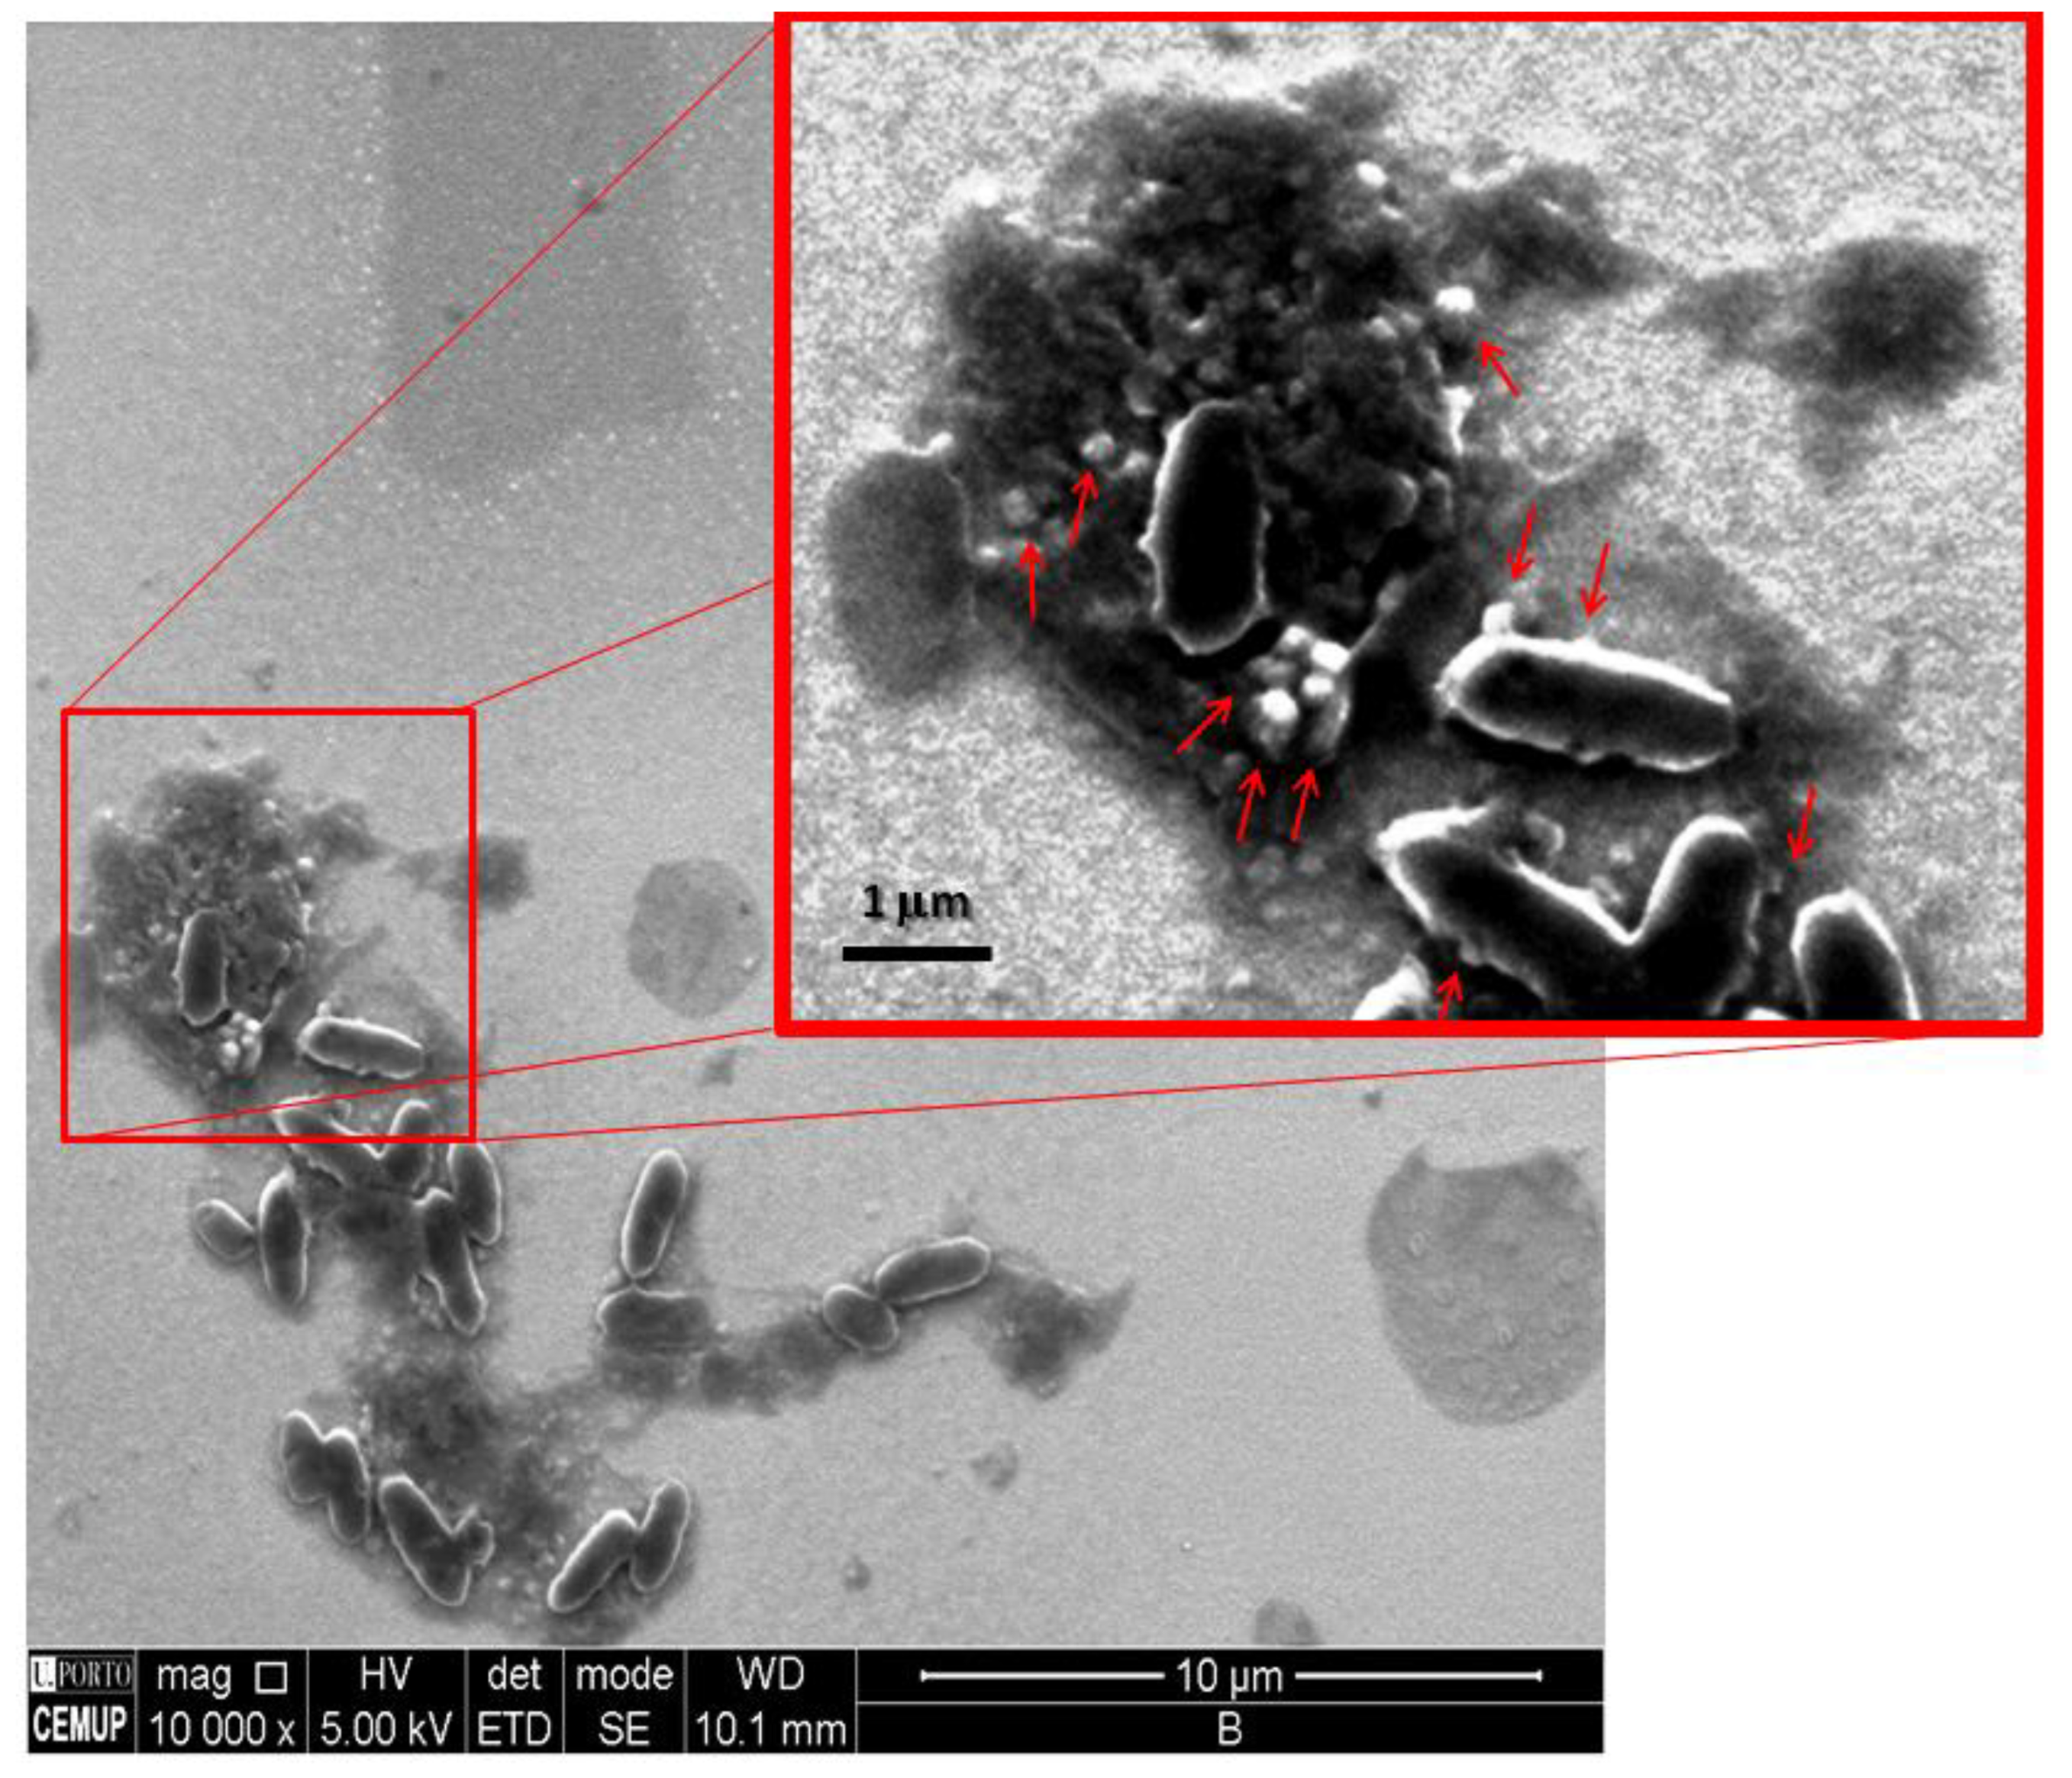
Figure 6.
SEM images captured for the Au/AUT/P100 slides prepared from P100 precursor dispersions buffered at pH 6 (A), 7 (C), and 8 (E). (B, D, F) Particle counts vs. size plots derived from images A, D, & F, respectively.
Figure 6.
SEM images captured for the Au/AUT/P100 slides prepared from P100 precursor dispersions buffered at pH 6 (A), 7 (C), and 8 (E). (B, D, F) Particle counts vs. size plots derived from images A, D, & F, respectively.
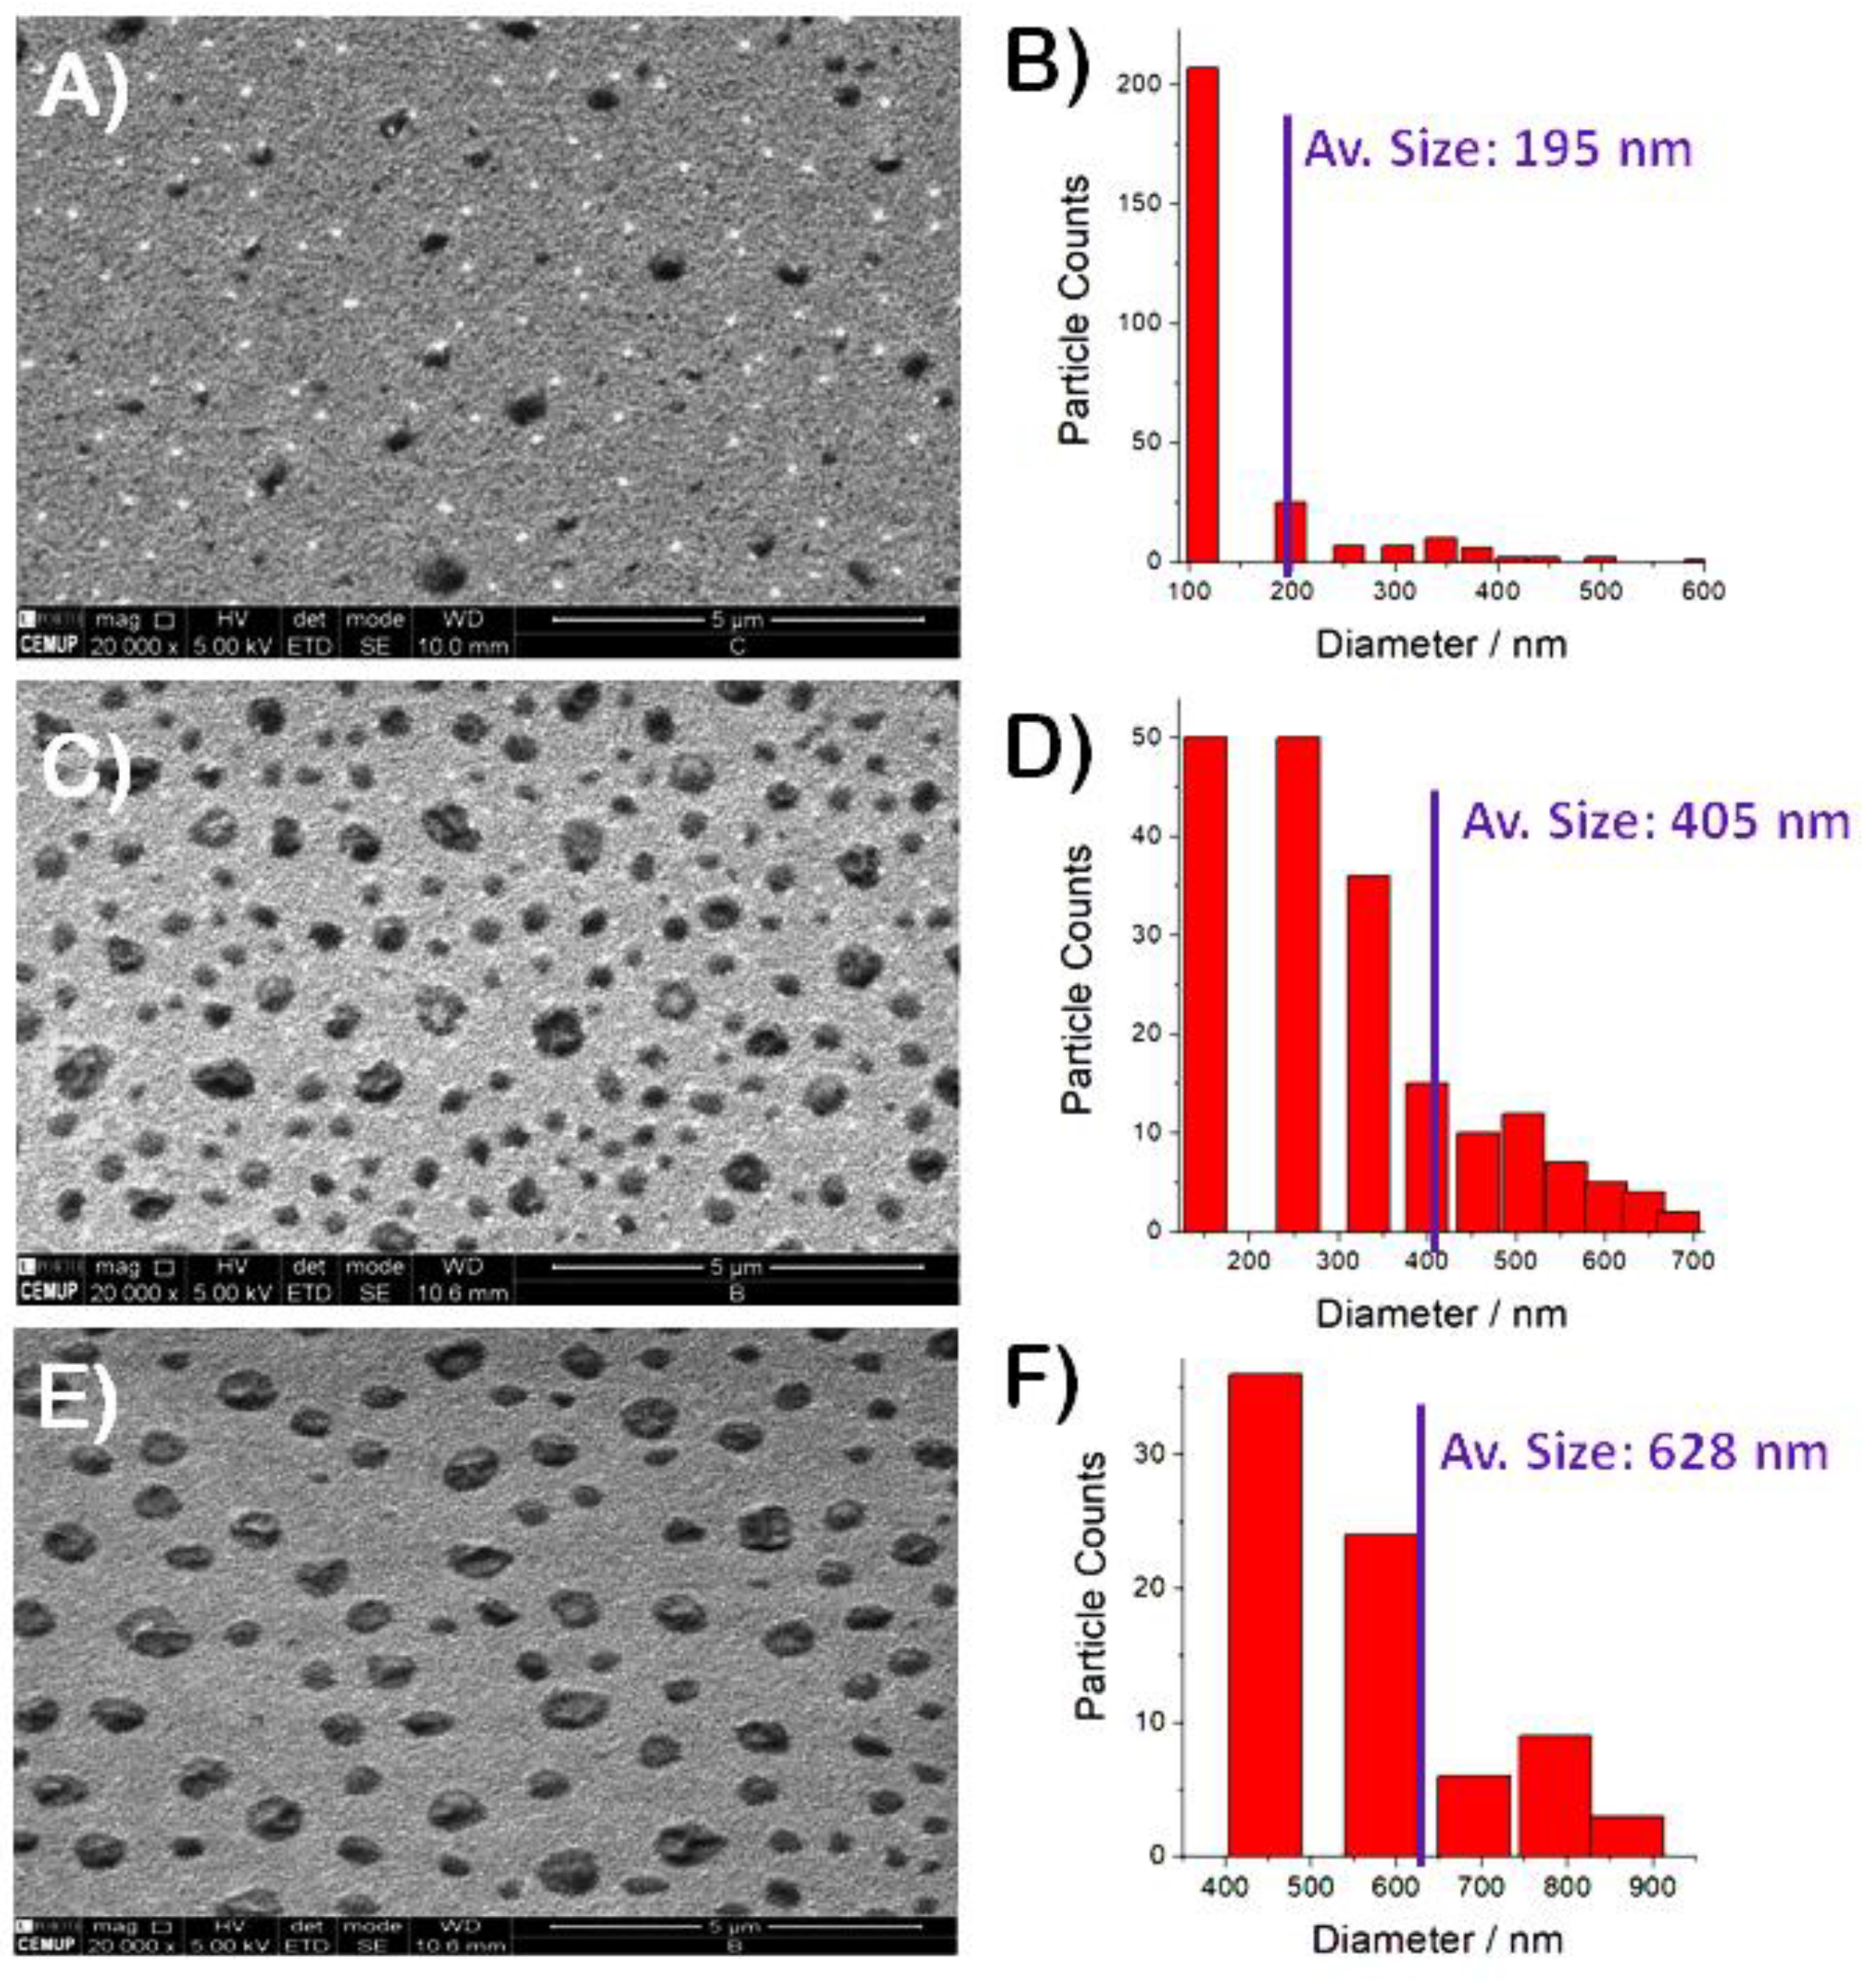

Table 1.
Composition and abbreviated name for the electrolytes used in the electrochemical experiments.
Table 1.
Composition and abbreviated name for the electrolytes used in the electrochemical experiments.
| Electrolyte | Solvent | pH | Redox Probe | Concentration |
|---|---|---|---|---|
| FE4 | AB 0.05 M | 4 | [Fe(CN)6]3-/4- | 2 mM |
| RU4 | AB 0.05 M | 4 | [Ru(NH3)6]3+/2+ | 2 mM |
| FE5 | AB 0.05 M | 5 | [Fe(CN)6]3-/4- | 2 mM |
| RU5 | AB 0.05 M | 5 | [Ru(NH3)6]3+/2+ | 2 mM |
| FE6 | PBS 0.05 M | 6 | [Fe(CN)6]3-/4- | 2 mM |
| RU6 | PBS 0.05 M | 6 | [Ru(NH3)6]3+/2+ | 2 mM |
| FE7 | PBS 0.05 M | 7 | [Fe(CN)6]3-/4- | 2 mM |
| RU7 | PBS 0.05 M | 7 | [Ru(NH3)6]3+/2+ | 2 mM |
| FE8 | PBS 0.05 M | 8 | [Fe(CN)6]3-/4- | 2 mM |
| RU8 | PBS 0.05 M | 8 | [Ru(NH3)6]3+/2+ | 2 mM |
Table 2.
Anodic and cathodic peak current densities (jPA and jPC), potentials (EPA and EPC), and peak-to-peak potential difference (∆EP) measured from the CVs in Figure 1A. The apparent charge transfer resistances (R2) derived from the fittings of the Nyquist plots in Figure 1B are also included.
| Electrode | jPA / µA·cm2 | EPA / mV | jPC / uA·cm2 | EPC / mV | ∆EP / mV | R2 / kΩ |
|---|---|---|---|---|---|---|
| Au | 311 | 179 | -315 | 101 | 79 | 0.460 |
| Au/AUT | 246 | 179 | -241 | 81 | 99 | 0.857 |
| Au/AUT/P100 | - | - | - | - | >900 | 647.0 |
| Au/P100 | 276 | 179 | -255 | 76 | 104 | 1.324 |
Table 3.
Anodic and cathodic peak current densities (jPA and jPC), potentials (EPA and EPC), and peak-to-peak potential difference (∆EP) measured from the CVs in Figure 1C. The apparent charge transfer resistances (R2) derived from the fittings of the Nyquist plots in Figure 1D are also included.
| Electrode | jPA / µA·cm2 | EPA / mV | jPC / uA·cm2 | EPC / mV | ∆EP / mV | R2 / kΩ |
|---|---|---|---|---|---|---|
| Au | 123 | -295 | -135 | -365 | 64 | ≈0 |
| Au/AUT | 20 | -36 | - | - | >664 | 1186 |
| Au/AUT/P100 | 16 | 15 | - | - | >715 | 1697 |
| Au/P100 | 122 | -295 | -128 | -370 | 74 | ≈0 |
Table 4.
Root-mean-square surface roughness (RMS), average height (HAV), and maximum height (HMP), measured for each of the slides inspected in Figure 4. Parameters reflect the average values calculated from the different 80 x 80 µm2 topographies recorded for each slide.
Table 4.
Root-mean-square surface roughness (RMS), average height (HAV), and maximum height (HMP), measured for each of the slides inspected in Figure 4. Parameters reflect the average values calculated from the different 80 x 80 µm2 topographies recorded for each slide.
| Slide | RMS / nm | HAV / nm | HMP / nm |
|---|---|---|---|
| Bare Au | 1.56 | 11 | 101 |
| Au/AUT/P100 | 8.52 | 145 | 282 |
| Au/P100 | 2.26 | 30 | 125 |
Disclaimer/Publisher’s Note: The statements, opinions and data contained in all publications are solely those of the individual author(s) and contributor(s) and not of MDPI and/or the editor(s). MDPI and/or the editor(s) disclaim responsibility for any injury to people or property resulting from any ideas, methods, instructions or products referred to in the content. |
© 2023 by the authors. Licensee MDPI, Basel, Switzerland. This article is an open access article distributed under the terms and conditions of the Creative Commons Attribution (CC BY) license (http://creativecommons.org/licenses/by/4.0/).
Copyright: This open access article is published under a Creative Commons CC BY 4.0 license, which permit the free download, distribution, and reuse, provided that the author and preprint are cited in any reuse.


