1. Introduction
The background seismicity of active volcanoes is often composed of sequences of earthquakes known as seismic swarms, which occur in a small volume over a short time frame and with no typical mainshock. The Campi Flegrei volcanic area near Naples in Southern Italy is characterized by low-magnitude earthquakes and frequent seismic swarms. The area is monitored by a dense seismic network consisting of 33 stations, including broad-band seismometers, short-period sensors, and accelerometers. While this network typically provides accurate hypocenters and other seismic source parameters, the overlapping recordings during seismic swarms make interpretation difficult. Since The Campi Flegrei area is partially submerged forming the Gulf of Pozzuoli, we experimented the use of hydrophones to record the local seismicity.
When record an earthquake the hydrophone produces a simpler and shorter trace than a seismometer, as it is only sensitive to longitudinal (P-wave) waves and does not register shear waves or most surface waves. Thus, during swarms, a hydrophone is more effective than a seismometer. In seismology, hydrophones with a frequency response extending below 100 Hz are required, as low-magnitude earthquakes producing background seismicity in active volcanic areas mainly emit high-frequency seismic body waves, unlike strong earthquakes that produce seismic waves with periods of tens to hundreds of seconds. For example, seismic events with magnitude M < 4 produce elastic waves in the 1 to 70 Hz frequency band that are typically recorded at a distance of no more than a few hundred kilometers.
Piezoelectric ceramic hydrophones (PZTs) are widely used and considered the gold standard of underwater pressure sensing due to their excellent performance and ease of manufacture, but they require a power supply and preamplifier at the sensor location. In recent years, research has shifted towards developing new hydrophones based on optical fiber technology (FOH, fiber optics hydrophone), which offer advantages such as small size, light weight, environmental ruggedness, and the ability to act as a transmission medium. The performance of a FOH is comparable to the one of the piezoelectric hydrophones on a wide range of applications, including underwater target detection [
1], oil and natural gas prospecting [
2] and active earthquake monitoring [
3].
In the framework of the OPTIMA project, funded by local authorities of the Regione Campania in Southern Italy, we developed a new hydrophone using interferometry for wave modulation. This hydrophone is capable of measuring weak hydro-acoustic pressure perturbations with high sensitivity in a frequency range of interest in seismology (<100 Hz).
In this paper, we describe the design and development of the new FOH and the seven-day field test performed in the marine sector of the Campi Flegrei volcanic area. We also present the analysis of 33 local earthquakes recorded simultaneously by the new FOH hydrophone and a well-calibrated PZT hydrophone used as a reference. Finally, we discuss the results of the analysis in terms of frequency band and responsivity, and potential fields of application.
It should define the purpose of the work and its significance. The current state of the research field should be carefully reviewed and key publications cited. Please highlight controversial and diverging hypotheses when necessary. Finally, briefly mention the main aim of the work and highlight the principal conclusions. As far as possible, please keep the introduction comprehensible to scientists outside your particular field of research.
2. Materials and Methods
2.1. The Fiber Optic Hydrophone
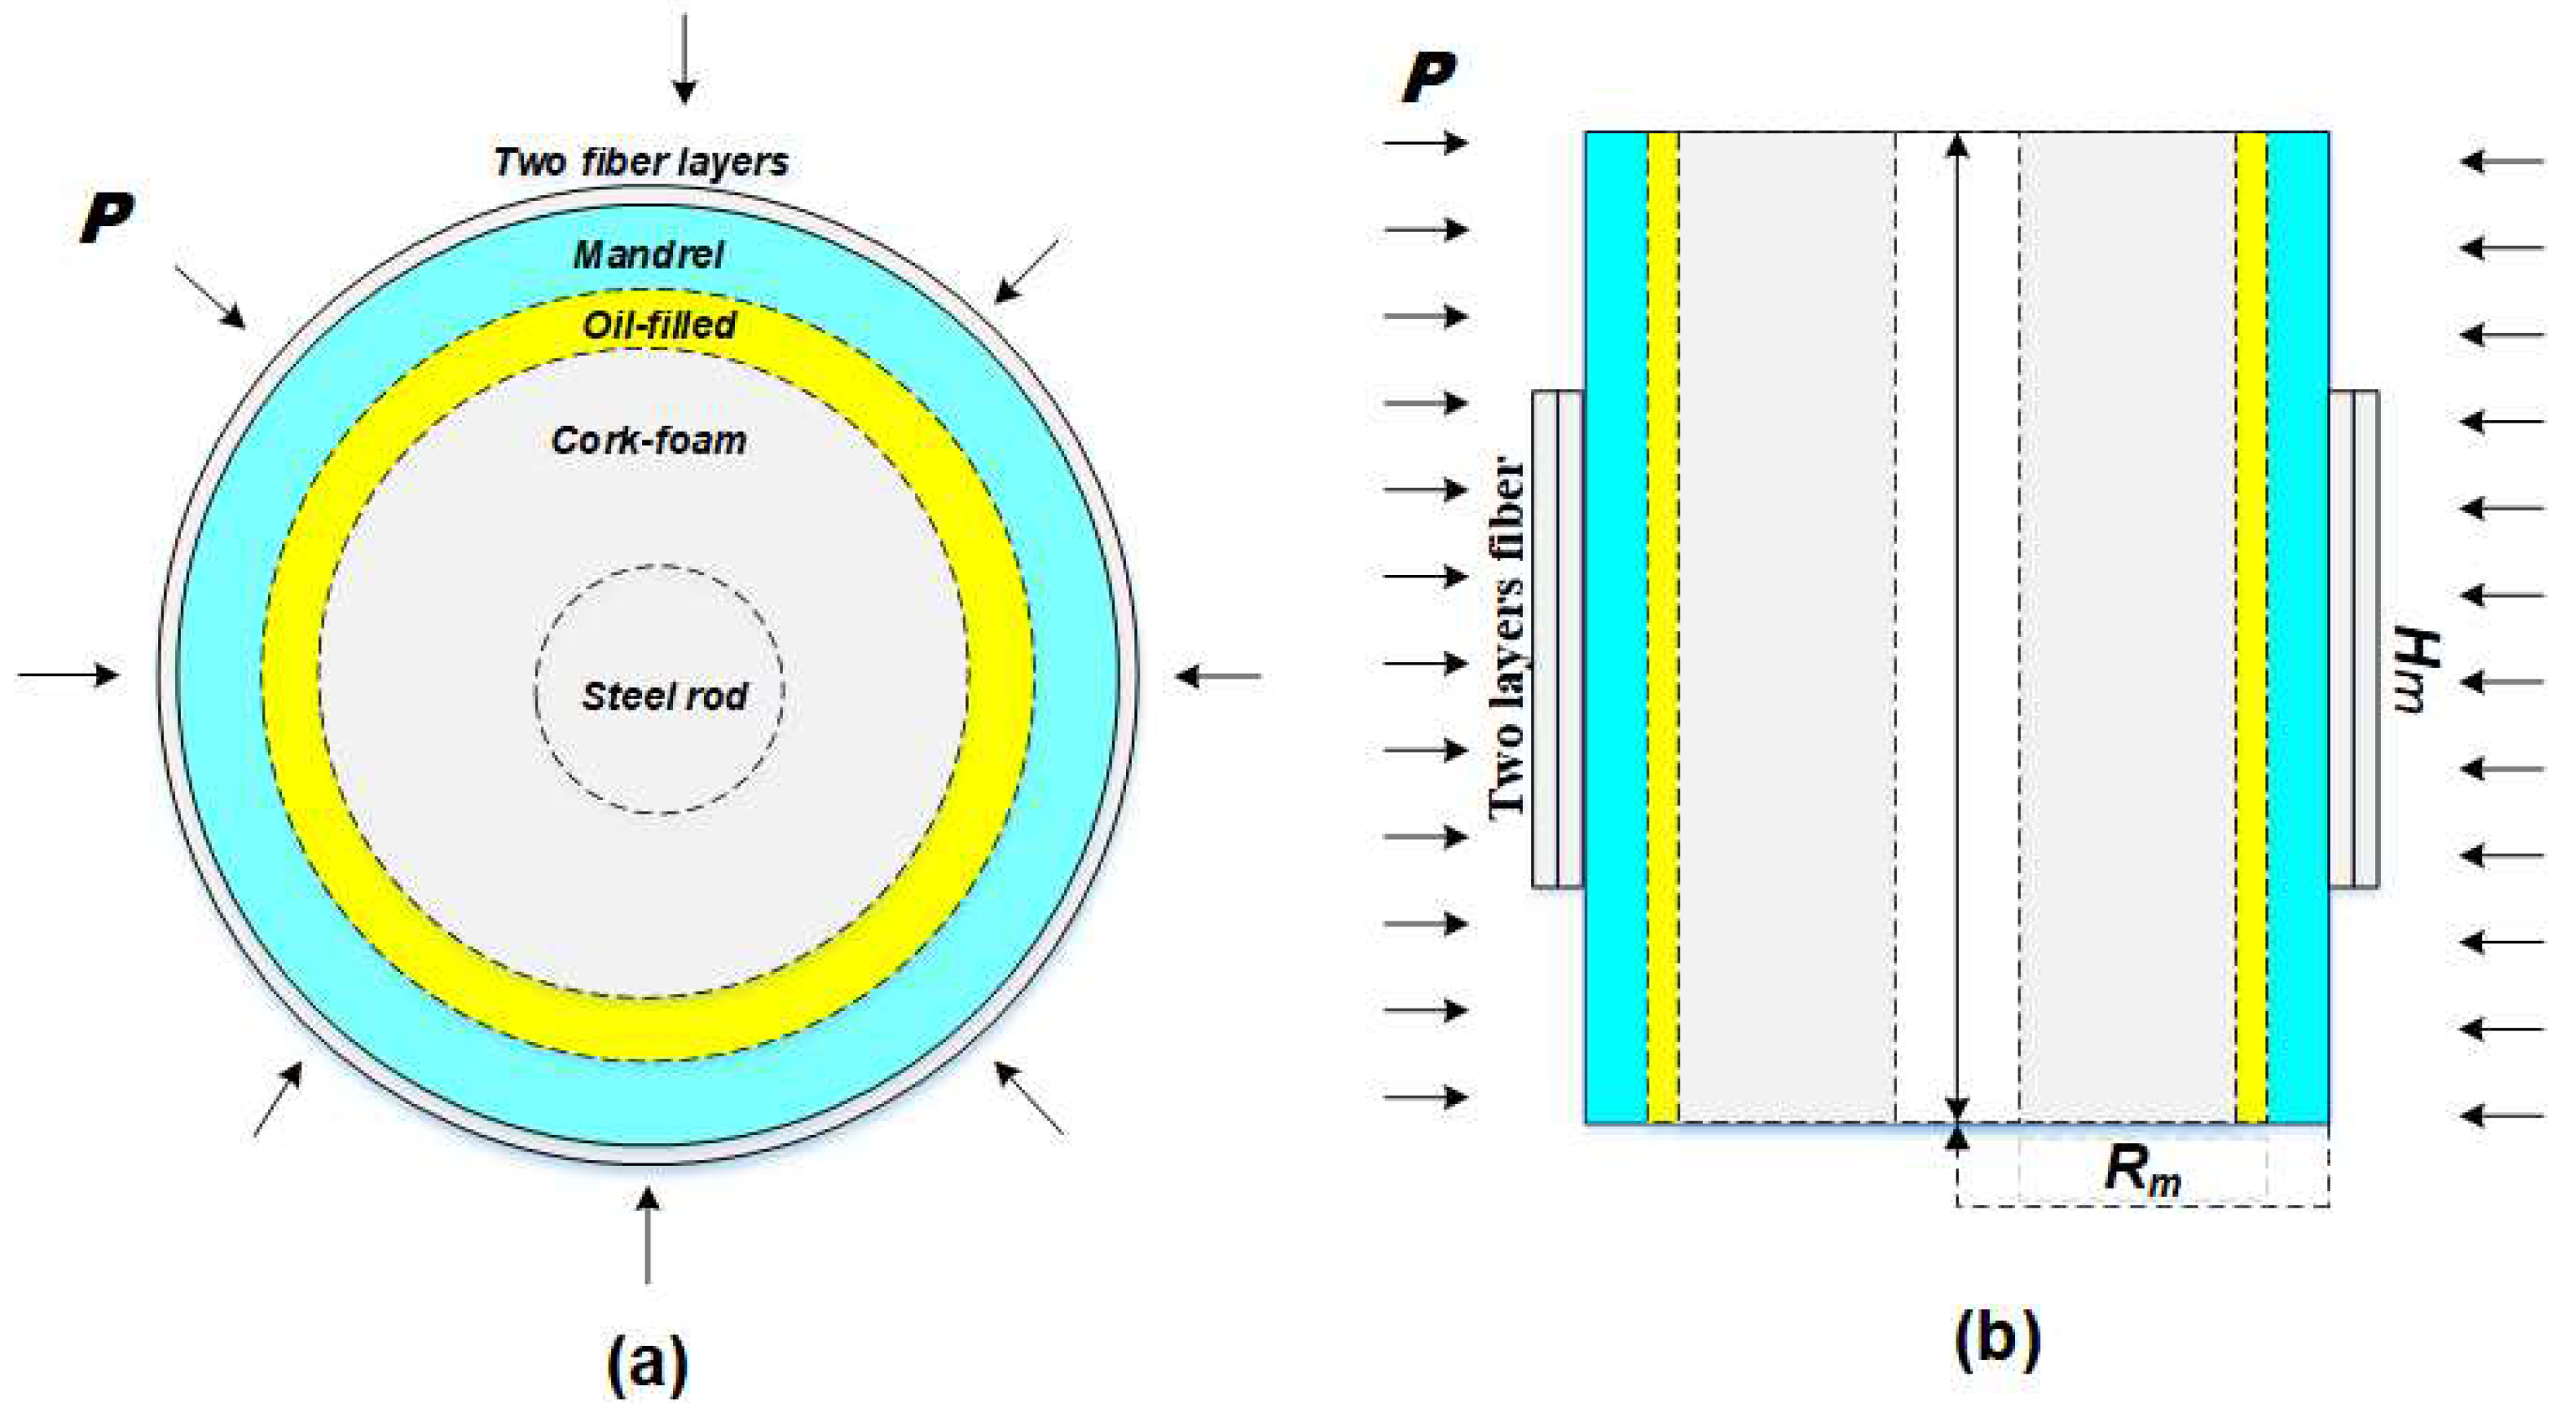
The developed fiber optics hydrophone is one in which two layers of optical fiber are wound around a composite cylinder to create a transfer of strain. The schematic representation of the sectional and lateral view of the FOH are shown in
Figure 1.
The composite cylinder consists of compliant layers (mandrel, oil-filled, and cork) and a supporting steel rod; the optical fiber runs all around the cylinder. When the FOH is subjected to an acoustic pressure (P) with wavelength much longer than the FOH size, like the ones of a converted wave generated by a local earthquake, a uniform force is exerted on the external boundaries of the FOH cylindrical structure leading to a radial deformation of the complaint mandrel layer. The expansion (or compression) of the cylindrical mandrel induces a strain in the optical fiber wrapped around it. This fiber deformation can be determined using a Michelson interferometric scheme, which comprises of a sensing arm of the optical fiber wrapped around the FOH of length and a reference arm “dummy” FOH insensitive to pressure. Two Fiber Bragg Gratings (FBGs), operating at different wavelengths, are used to mark the beginning and the end of the fiber wrapped around the mandrel. The FBGs, acting as reflectors, are useful to detect with an interferometric technique the elongation of the fiber coil. A commercial interrogator system (MultiZonaSens, Optics11) then provides an output signal directly proportional to the fractional length changes versus time.
The responsivity
of the FOH under the applied pressure can be expressed in terms of fractional change in fiber length
with respect to the applied pressure
as follows:
The responsivity evidently depends on the combination of the elastic and geometric properties of the FOH. The novel FOH was designed [
4] to operate at low frequencies (below 100Hz) and was fabricated in a rugged fashion, equipped with pressure hydraulic compensation mechanics for underwater operation. Depending from consideration about the environmental and the self-noise of the interrogation system (intrinsic to system composed by the optical fiber and the electronics that convert the light in an electric voltage signal followed by an ADC), a target responsivity of 346 · 10
6 nm/µPa has been estimated (see ‘Results and Discussion’ section).
The final configuration of the fiber optic system consisted of a FOH used as the main (sensitive) gauge and a dummy-hydrophone acting as optical reference (DOH).
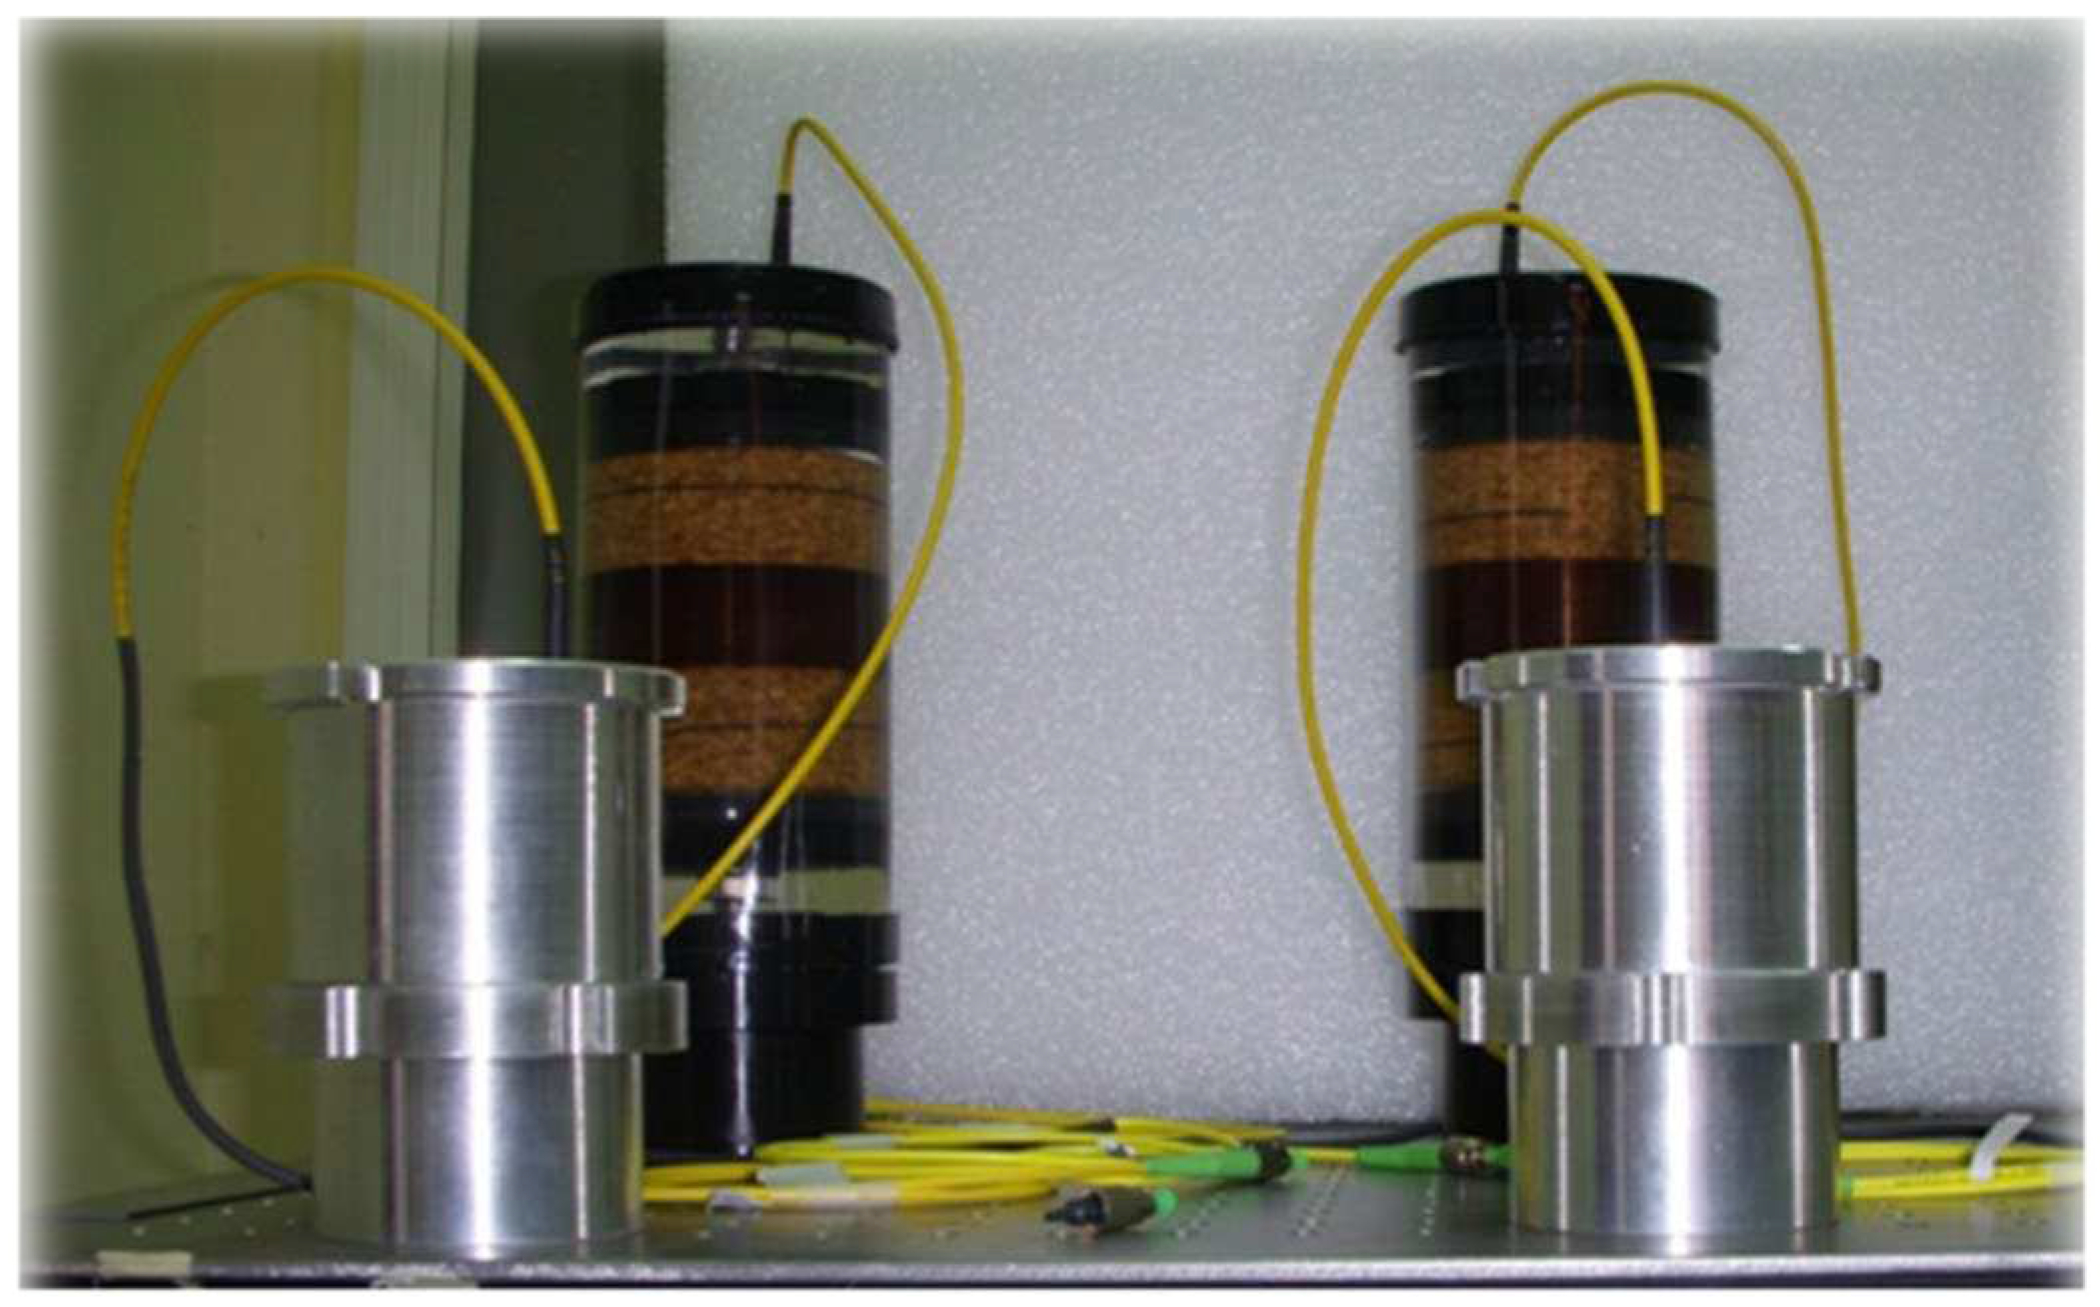
Figure 2 shows the fabricated sensing (brown color) and reference dummy (silver color) FOHs, respectively. The optical reference hydrophone consists of a solid mandrel on which the optical fiber is wound. A hollow cylindrical metal shell surrounds the solid mandrel providing further protection of the optical fiber from mechanical damage and incoming acoustic pressure waves. The rigid supports on both sides also provide fiber passages. Two nuts are used on both sides of the rod to lock the reference hydrophone. A clamped region has been created in this case too. The size of the reference hydrophone is smaller than the sensitive hydrophone. Indeed, the reference hydrophone has a diameter of 8.9 · 10
-2 m and a height of 12.1 · 10
-2 m, while the main hydrophone height is 25.4 · 10
-2 m. Essentially, the overall structure does not allow transfer of strain resulting from an incoming pressure wave to the reference optical fiber, because there are no sensitive parts. We deployed the reference hydrophone in the same operative conditions of the optical hydrophone.
For redundancy and multiplexing proof, two pairs composed by the sensitive and dummy hydrophones are then installed and integrated on the seafloor multi-parametric module used in our final system architecture, and fixed into it on the sea-bed.
2.2. The PZT Reference Hydrophone
The hydrophone used as a reference (RH) is a passive ultra-low frequency sensor hydrophone with response function between 0.01 Hz and 8 kHz, HTI-04-PCA/ULF model of High Tech Inc. (
http://www.hightechincusa.com/products/hydrophones/hti04pcaulf.html), coupled with an external transconductance pre-amplifier with a gain of 26 dB. The HTI-04 featuring an oil-filled pressure compensated design capable of operating at full ocean depth (6,000 meters) and is used in anti-submarine warfare (ASW) industry and for noise measurements with a receiving sensitivity of -194 dBV regard a sound pressure level (SPL) of 1µPa (@ T = 20 °C) at 1-meter distance.
The hydrophone is provided with bulkhead cable on the body (butyl rubber boots encapsulated material) and a wet mate connector, in a total size of 17.3 · 10-2 m length per 5.1 · 10-2 m in diameter.
The HTI-04 hydrophone is based upon the piezoelectric effect (PZT) acting over the piezoelectric ceramic cylinders which form the hydrophone active acoustic element. The ceramic cylinders are radially polarized (omnidirectional sensitivity for frequency <8,000 Hz), and with end caps, the enclosed cylinder forms a small pressure vessel. The HTI-04 is a passive sensor with a single-ended output signal connected to at an external preamplifier, designed around the AD795J operational amplifier, a low-power and low-noise precision FET op-amp used in the non-inverting second-order Sallen-Key low-pass active filter configuration with a –3 dB point at about 120 Hz. The preamplifier itself is a transconductance amplifier design which eliminates the need for separate power and signal conductors. Preamplifier power consumption is less than 33 mW using a 12 V dc dual-output power supply. Finally, the output signal is acquired by a Quanterra-Kinemetrics Q330 data logger at a sample-rate of 200 sps, with no input gain.
The sensitivity of the RH was provided by the manufacturer as a unique value valid within the sensor’s frequency range from 0.01 Hz to 8 kHz. It is worth remarking that the calibration of a hydrophone below 100 Hz is known to be a difficult task, which requires complex procedures and facilities not always available [
5,
6]. To verify the validity of the calibration value of our RH at low frequencies, we developed an innovative in-situ comparative procedure using a calibrated broad-band seismometer (Trillium Compact-OBS, Nanometrics). In a previous paper [
7], we demonstrated the equivalence of the waveforms of the earthquake-induced ground acceleration and the water-pressure in the case of co-location of a hydrophone and a seafloor seismometer in shallow water. We used recordings of a set of local earthquakes with epicenter distances of a few tens of kilometers, and regional earthquakes with a wide range of magnitude (2.7 < M < 6.8), recorded by the seismometer and by the RH installed in the same site and used for the present paper. In particular, we performed the derivative of the vertical component of the seismometer recordings to obtain the acceleration signal used as a reference with the RH recordings, in terms of pressure variation according to the sensitivity value provided by the manufacturer. The similarity of amplitudes and frequency content at low frequencies (down up to 0.1 Hz) of the signals recorded by the two instruments for all the analyzed earthquake records measured by a high value of the correlation coefficient, demonstrates the validity of the calibration value used for the RH.
2.3. Sea Trial and Experimental Setup
The tests of the FOH operation and performance were developed at the marine MEDUSA infrastructure, which is part of the geophysical monitoring system of the Campi Flegrei volcanic area [
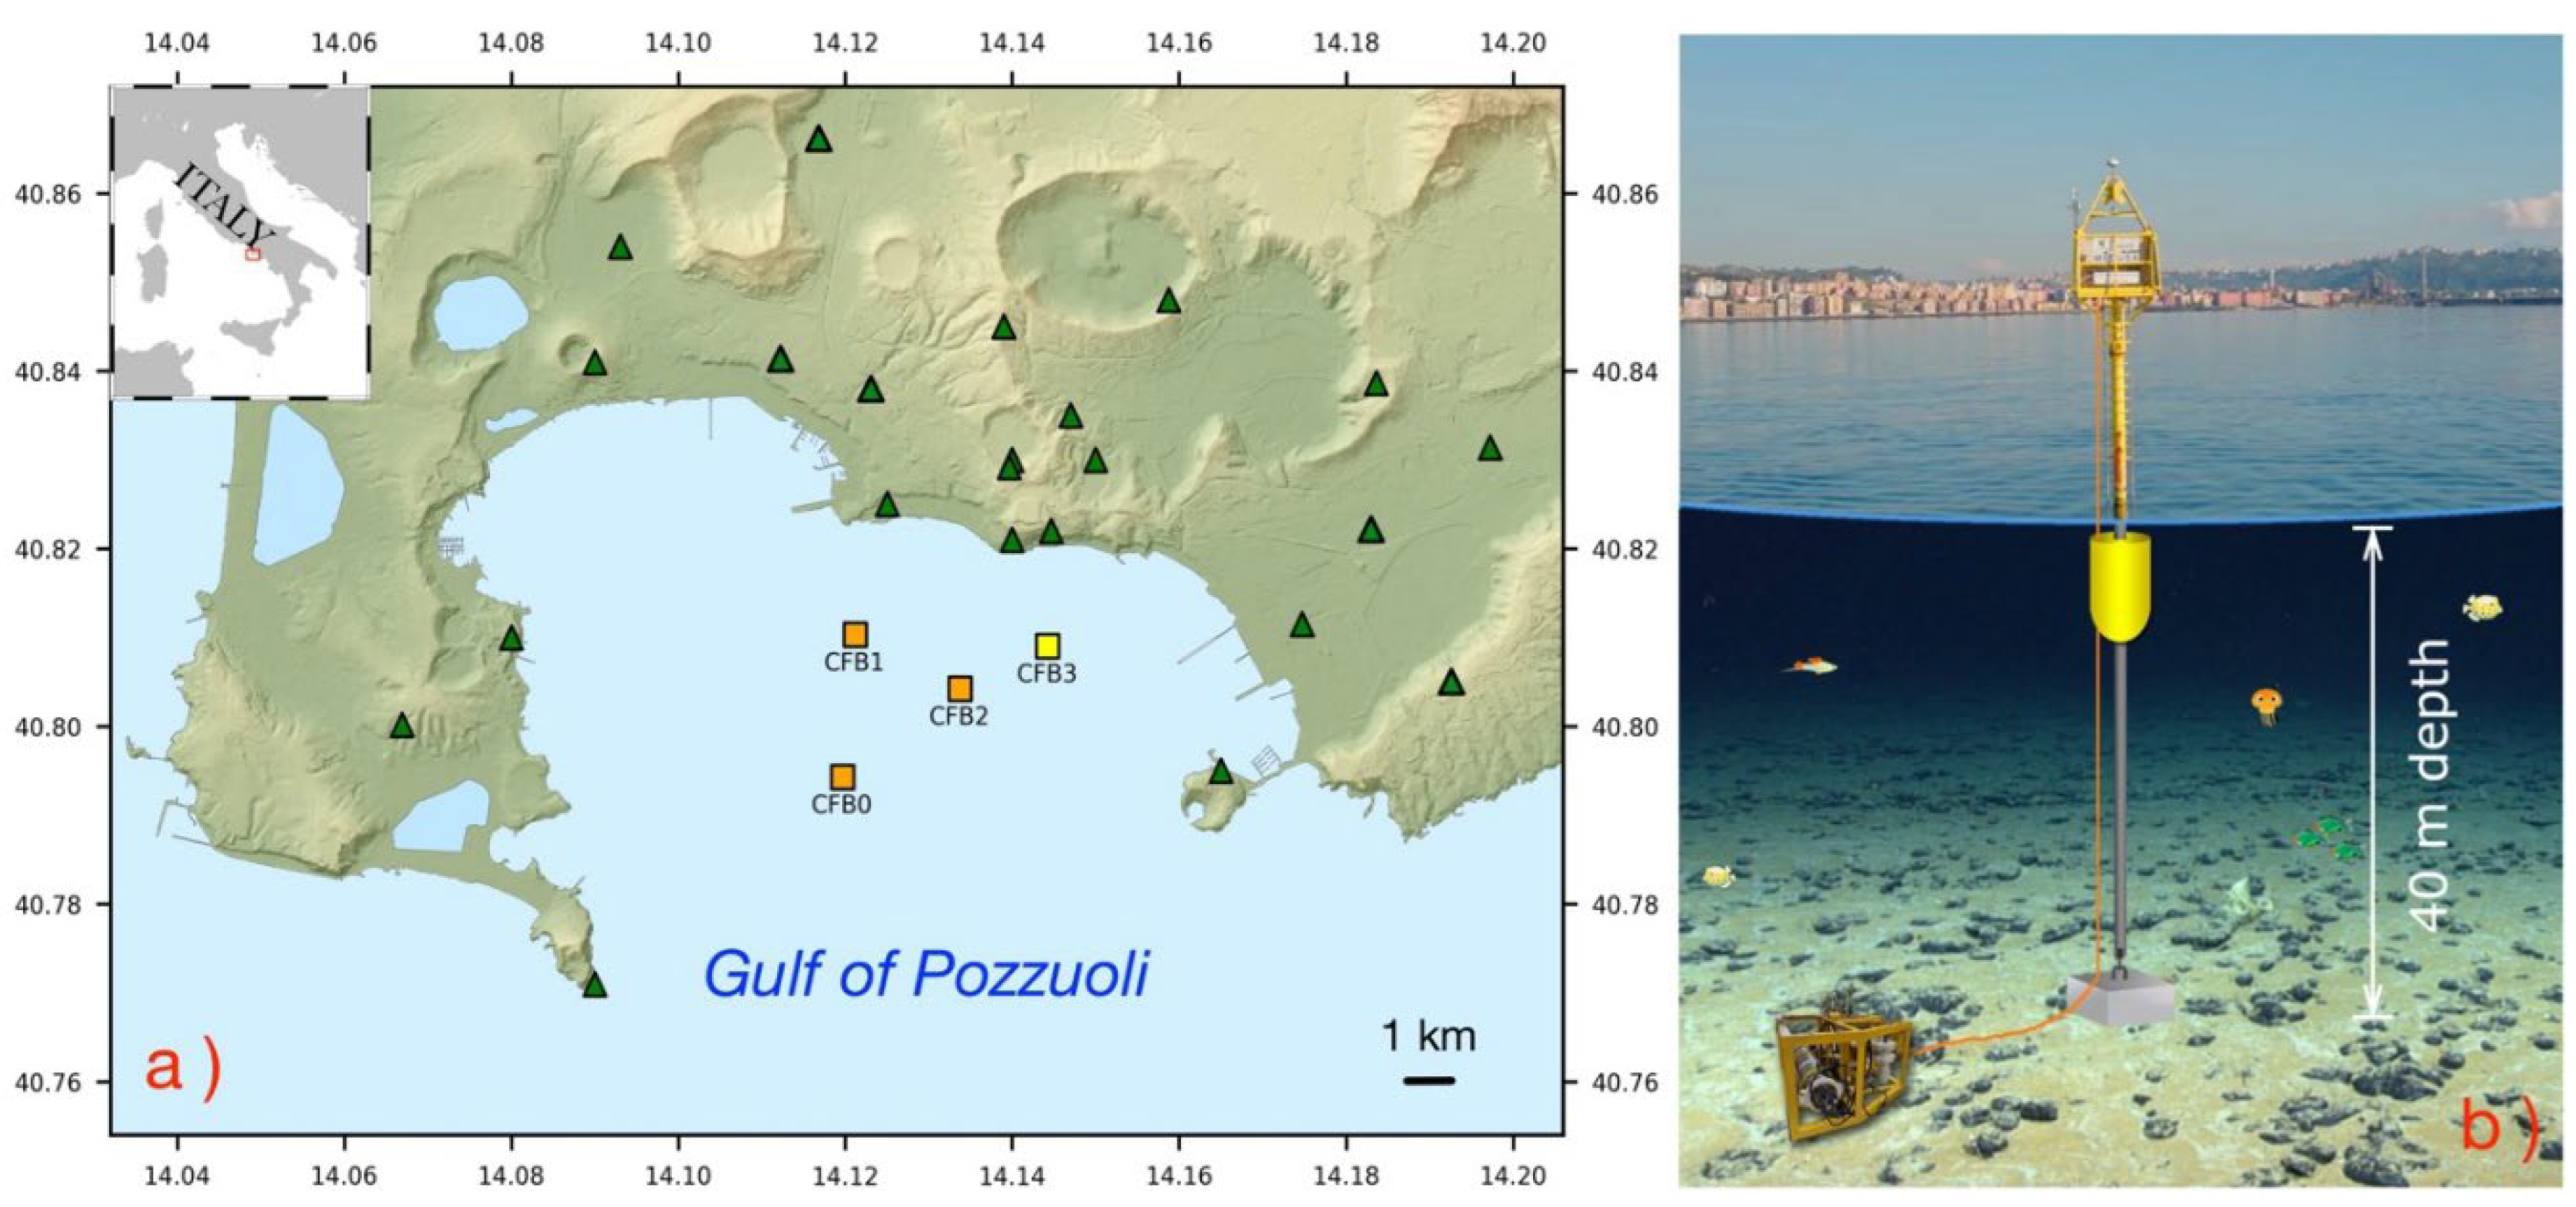
8]. MEDUSA (Multiparametric Elastic-Beacon-Based Devices and Underwater Sensor Acquisition) is a permanent network of four marine multidisciplinary platforms (MMP) operating since 2016 in the Gulf of Pozzuoli, which supplement the land-based geophysical monitoring network managed by the Istituto Nazionale di Geofisica e Vulcanologia (INGV) (
Figure 3a). Each MMP consists of an anchored spark buoy connected by cable to an instrumented module at seabed, placed a few meters from the ballast of the buoy (
Figure 3b).
The seafloor module is equipped with geophysical and oceanographic sensors: i) a 0.01 ÷ 50 Hz seismometer; ii) a hydrophone, namely the reference hydrophone RH; iii) a Paroscientific high-resolution pressure sensor; iv) a single-point three-component acoustic current meter. A cylindrical subsea pressure vessel contains the acquisition systems and the electronic devices. The acquisition of the four data streams produced by the three components of the seismometer and by the hydrophone is performed with a sampling rate of 200 sps for the RH by means of a Quanterra-Kinemetrics Q330 digitizer.
The emerging part of the buoy hosts a 5 GHz and UMTS-4G communication systems, solar panels, weather station and control electronics. In addition, on the top of the buoy a geodetic GNSS receiver monitors the seafloor movements produced by the volcanic activity of the area [
9,
10].
The electro-mechanical cable connecting the seafloor module to the buoy supplies power, data transmission and clock signal from the GPS receiver.
For the specific purpose of the FOH test, we developed a dedicated submarine frame to host the sensor for the deployment nearby one of the MEDUSA seabed modules. The FOH frame is smaller than the MEDUSA seabed modules and is made of stainless steel with dimensions of 0.51 m x 0.81 m. To synchronize the recorded signals, RH and FOH used the same clock signal, locked to the GPS. To maximize the probability of recording a significant number of earthquakes by the FOH, we deployed the FOH module in the proximity of the MMP (CFB3), the closest MEDUSA platform to the area where earthquake occurrence is the most frequent: the Solfatara crater [
11].
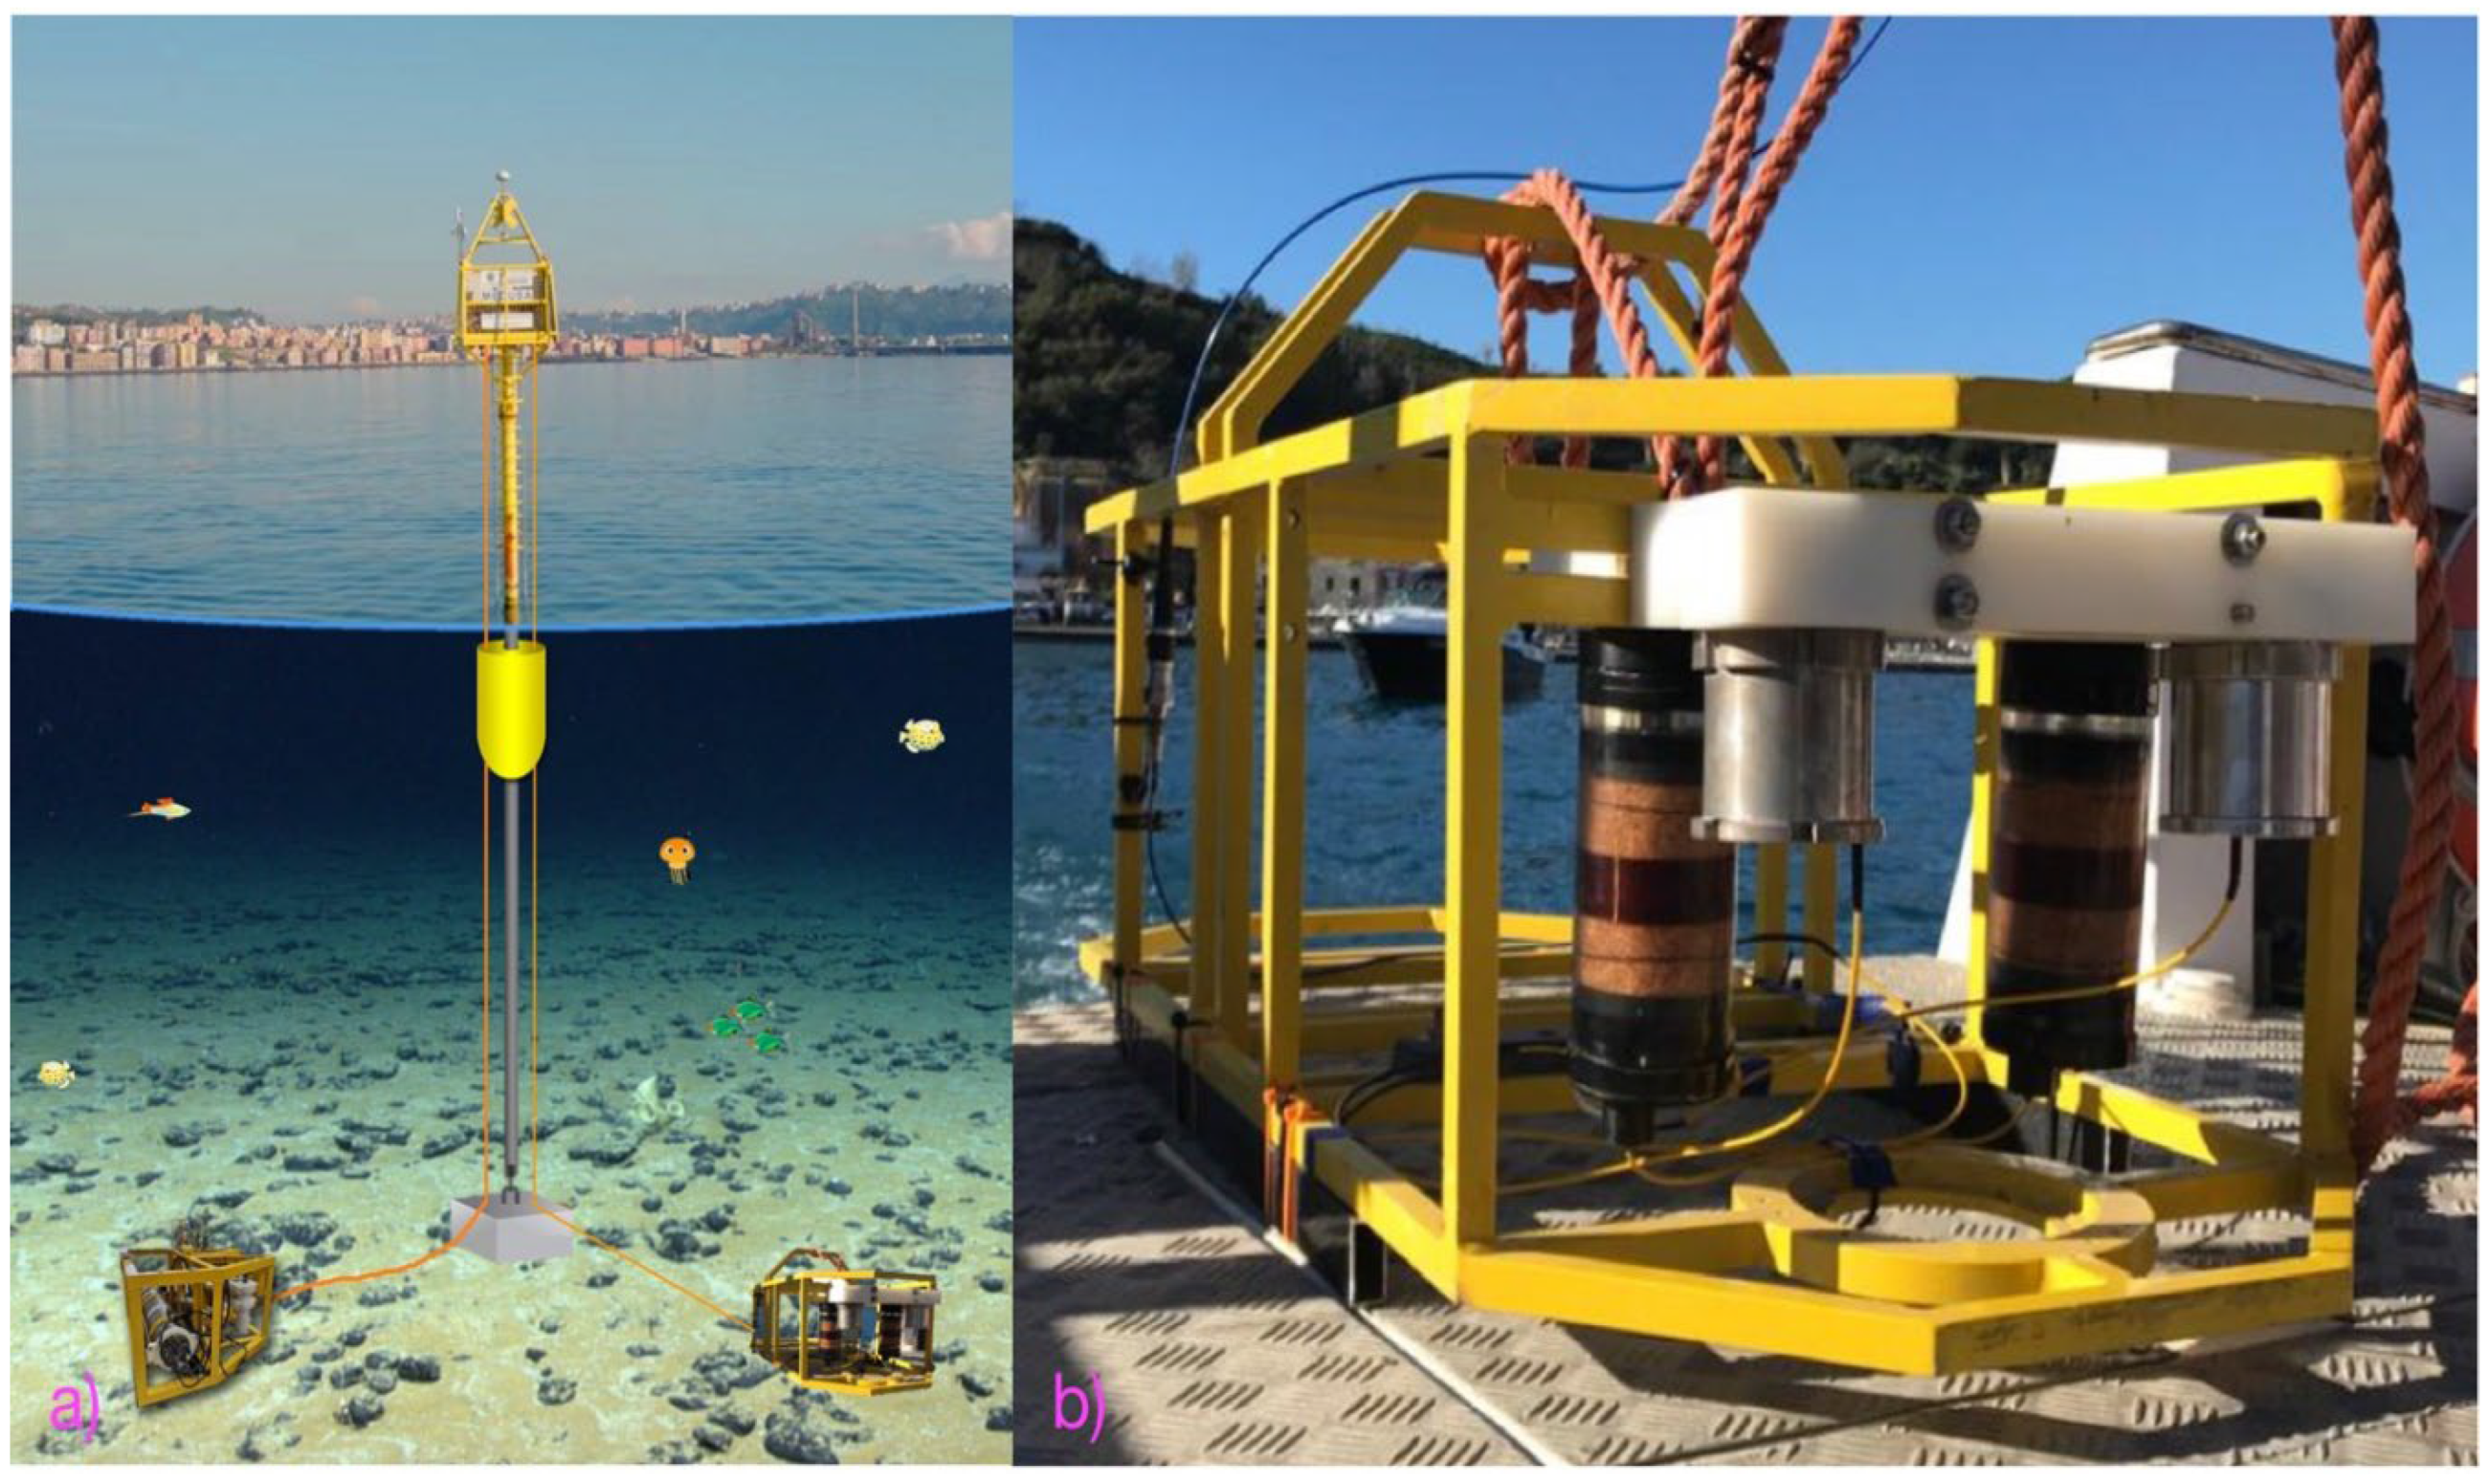
Figure 4 shows the FOH module (b) deployed and positioned on the seafloor by means of an electromechanical cable, at a distance of about 2 m from to the existing MMP at CFB3 site (a).
The optical interrogator of the FOH was mounted on the top of the corresponding buoy (
Figure 4a) and connected to the FOH by means of a 70 m long optical fiber cable for the data transmission.
The frame hosting the FOH was installed on December 14th, 2020 and operated for seven days.
In the following all the data analysis presented was performed using earthquake recordings from the FOH and RH.
3. Results and Discussion
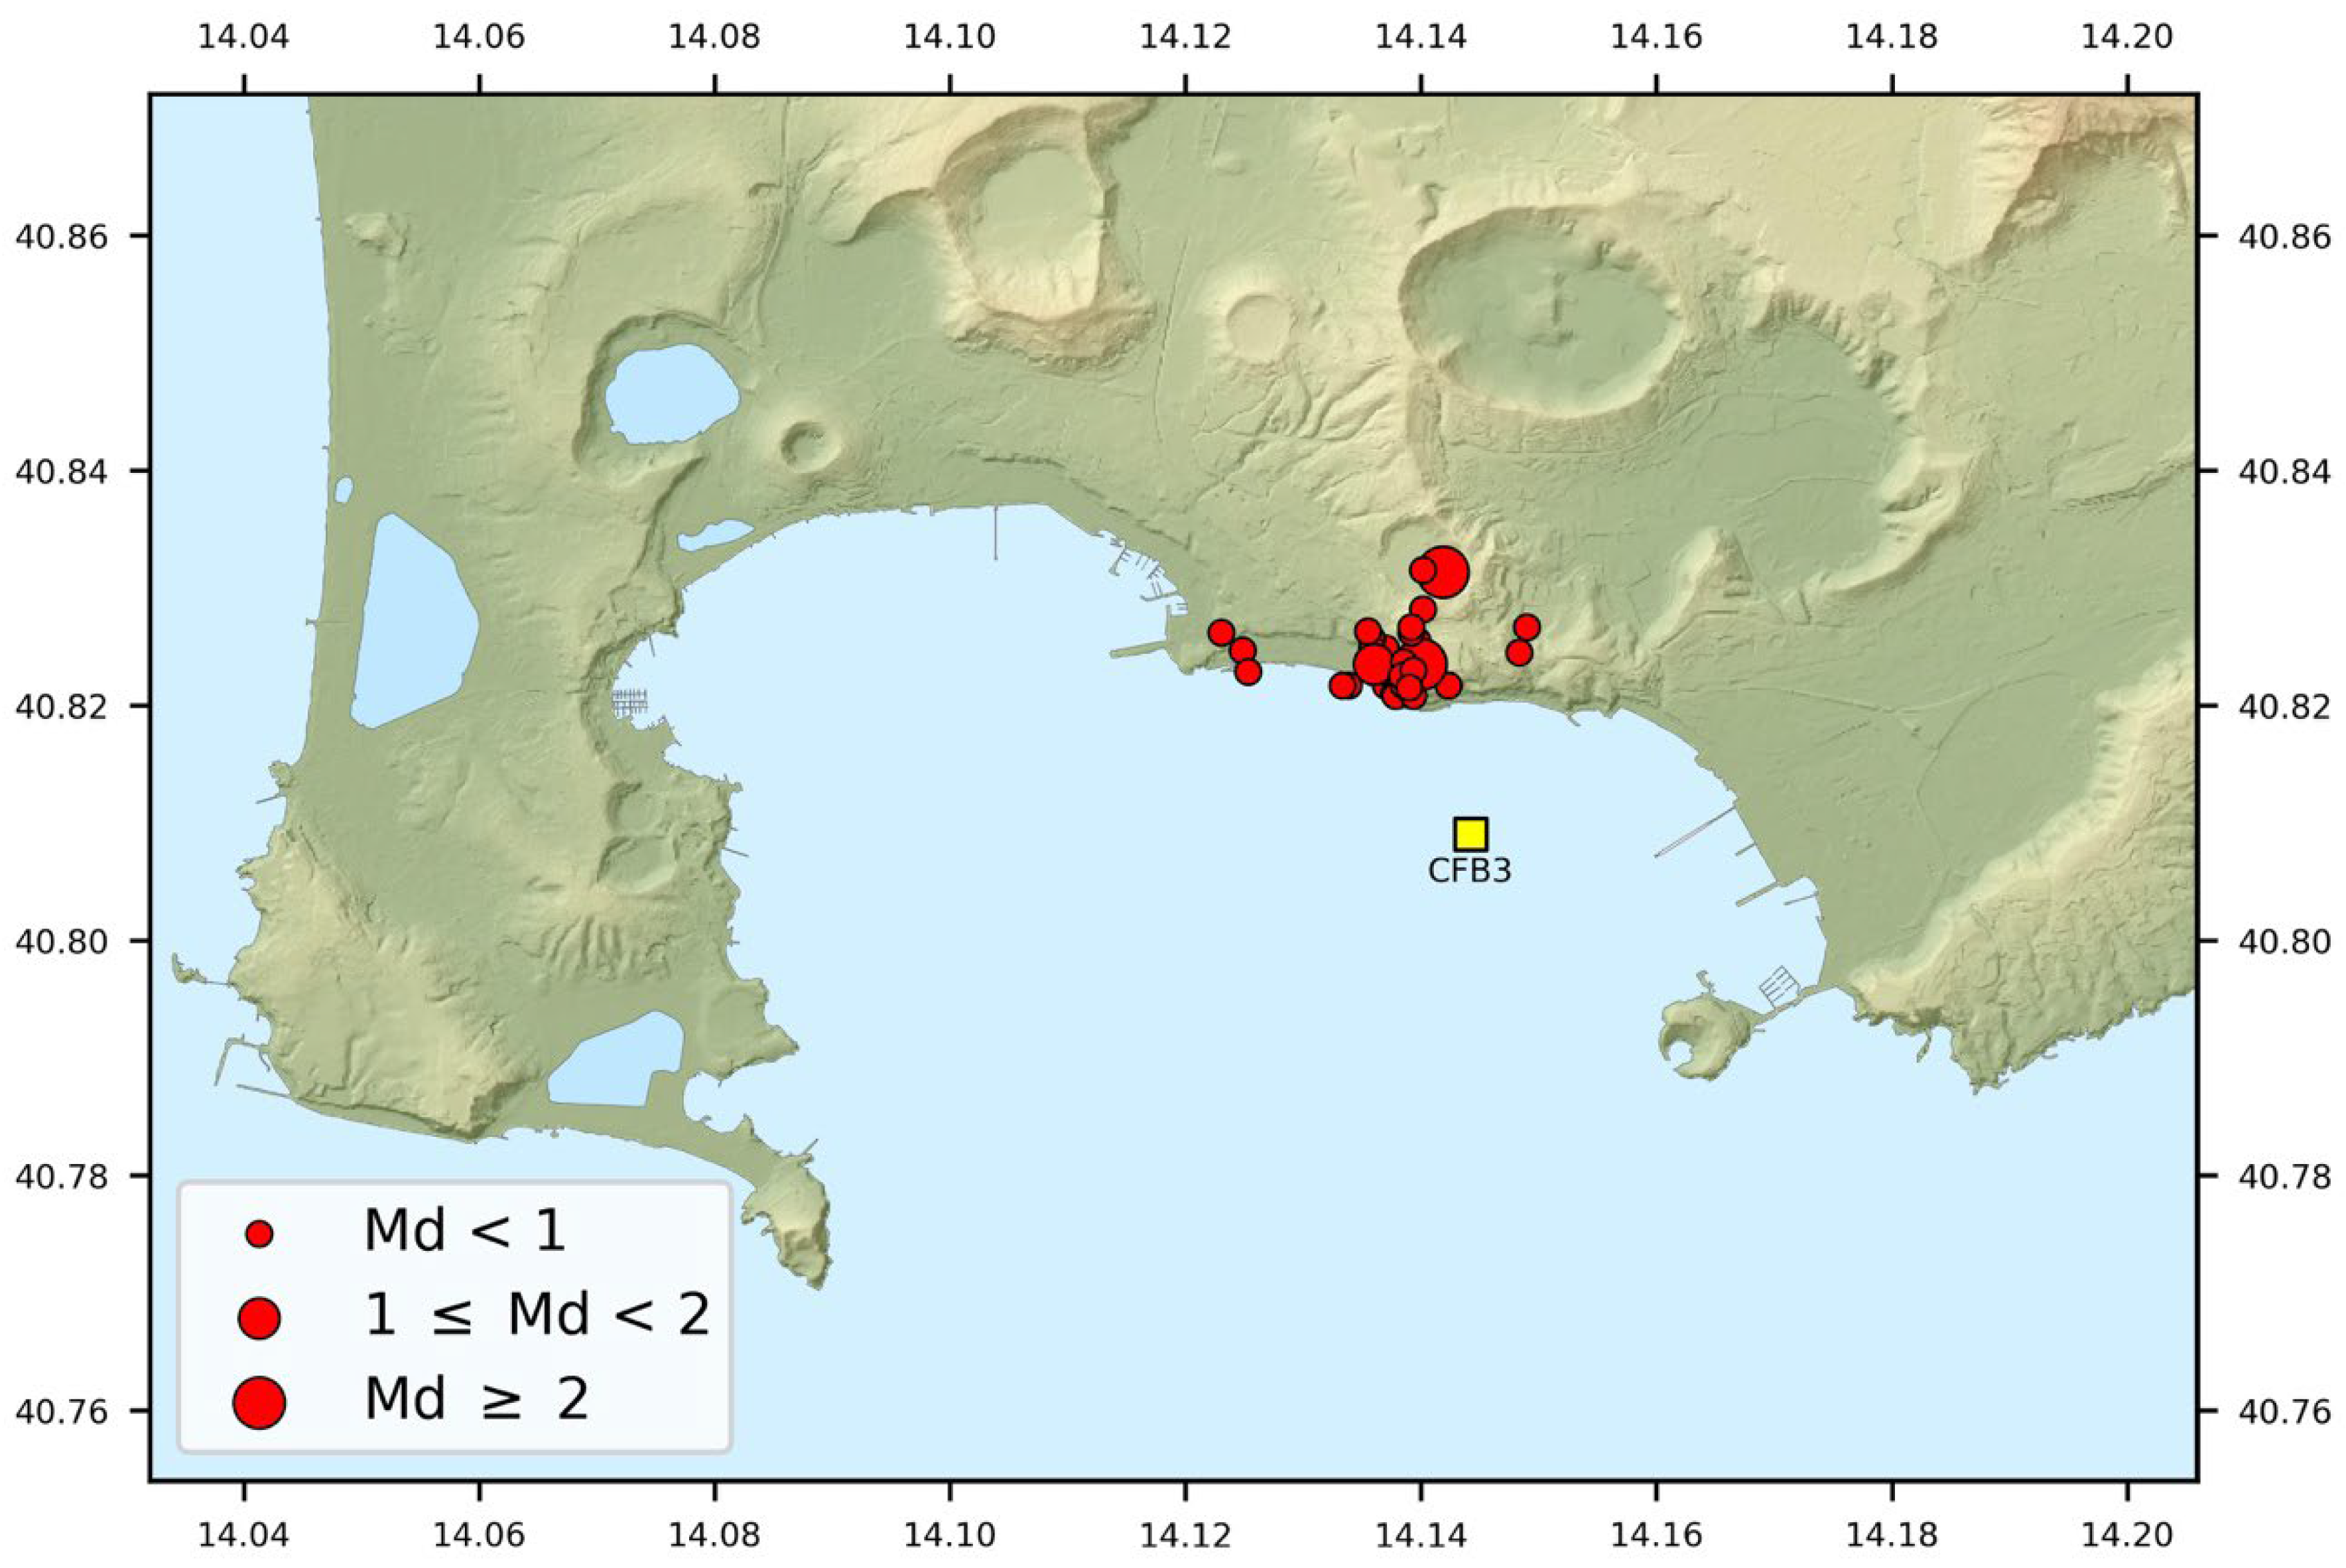
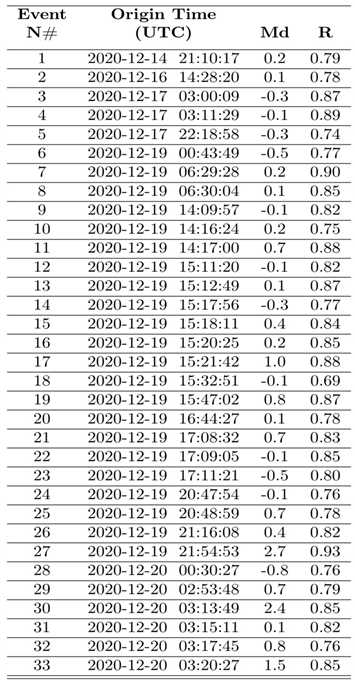
The local seismicity bulletin produced by INGV-OV reports the events occurred during the test period of the FOH. From this list, we selected events according to the quality of their recordings in terms of signal to noise ratio. In particular, the primary selection criteria applied is the adoption of a threshold value of this ratio set to 5, measured over a time window of two seconds starting from the P arrival time. Thirty-three events were finally selected according to this criterion. The corresponding hypocentral parameters are reported in
Table 1 and
Figure 5.
The earthquakes have a magnitude range -0.8 < Md < 2.7 and mostly occurred around the Solfatara crater (
Figure 5) as expected. Their epicentral distance from the RH and FOH located at the CFB3 site is lower than 2.5 km and the hypocentral depths are within the first 3 km. Unfortunately, no stronger earthquakes occurred at regional distances (longer than 100 km).
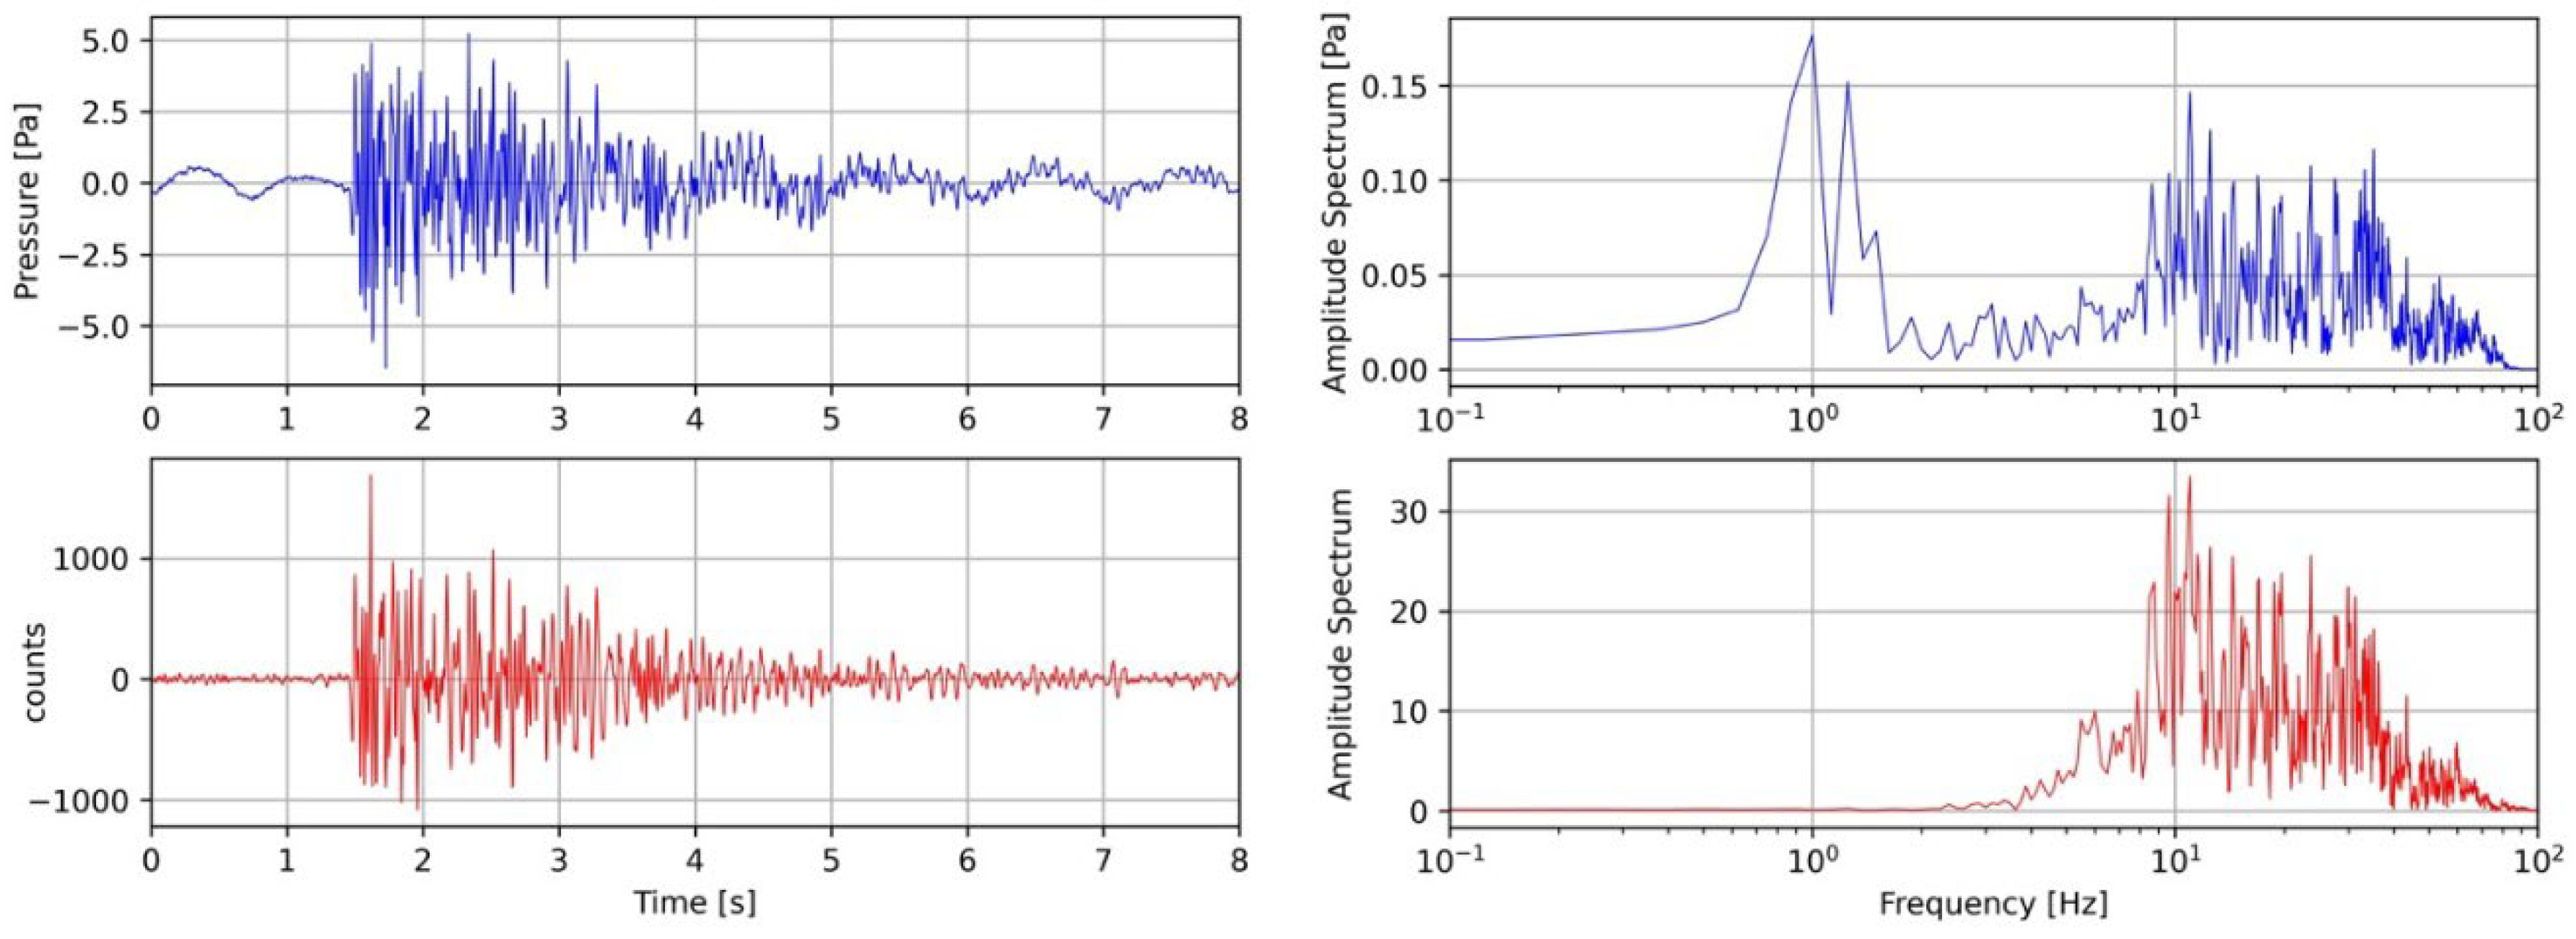
For the sake of brevity, in this paragraph, we present the results of the analysis applied to one earthquake that can be considered an appropriate example to analyze the signal in the frequency domain. The complete analysis of the 33 earthquake recordings is shown in the
Appendix A.
Figure 6 shows the waveform and the amplitude spectra of the earthquake recorded by both the FOH and the RH. The signal of the RH was converted into physical units of pressure using a conversion factor of 6.28 · 10-4 Pa/count to take into account for the data acquisition system and the sensitivity. The signal of the FOH is reported in counts.
From
Figure 6, a long-period waveform is evident; it is due to the overlapping of the pressure variation induced by the sea waves and the earthquake signal, and corresponds to a large spectral amplitude value in the 0.5 ÷ 5 Hz frequency band. On the contrary, this characteristic is not present in the lower panels of the FOH. At frequencies greater than 5 Hz, the two amplitude spectra show very similar behavior and this feature can be observed on the spectra of the other analyzed events reported in the
Appendix A. This is evidence that the frequency response of the FOH is limited at low frequency at about 5 Hz.
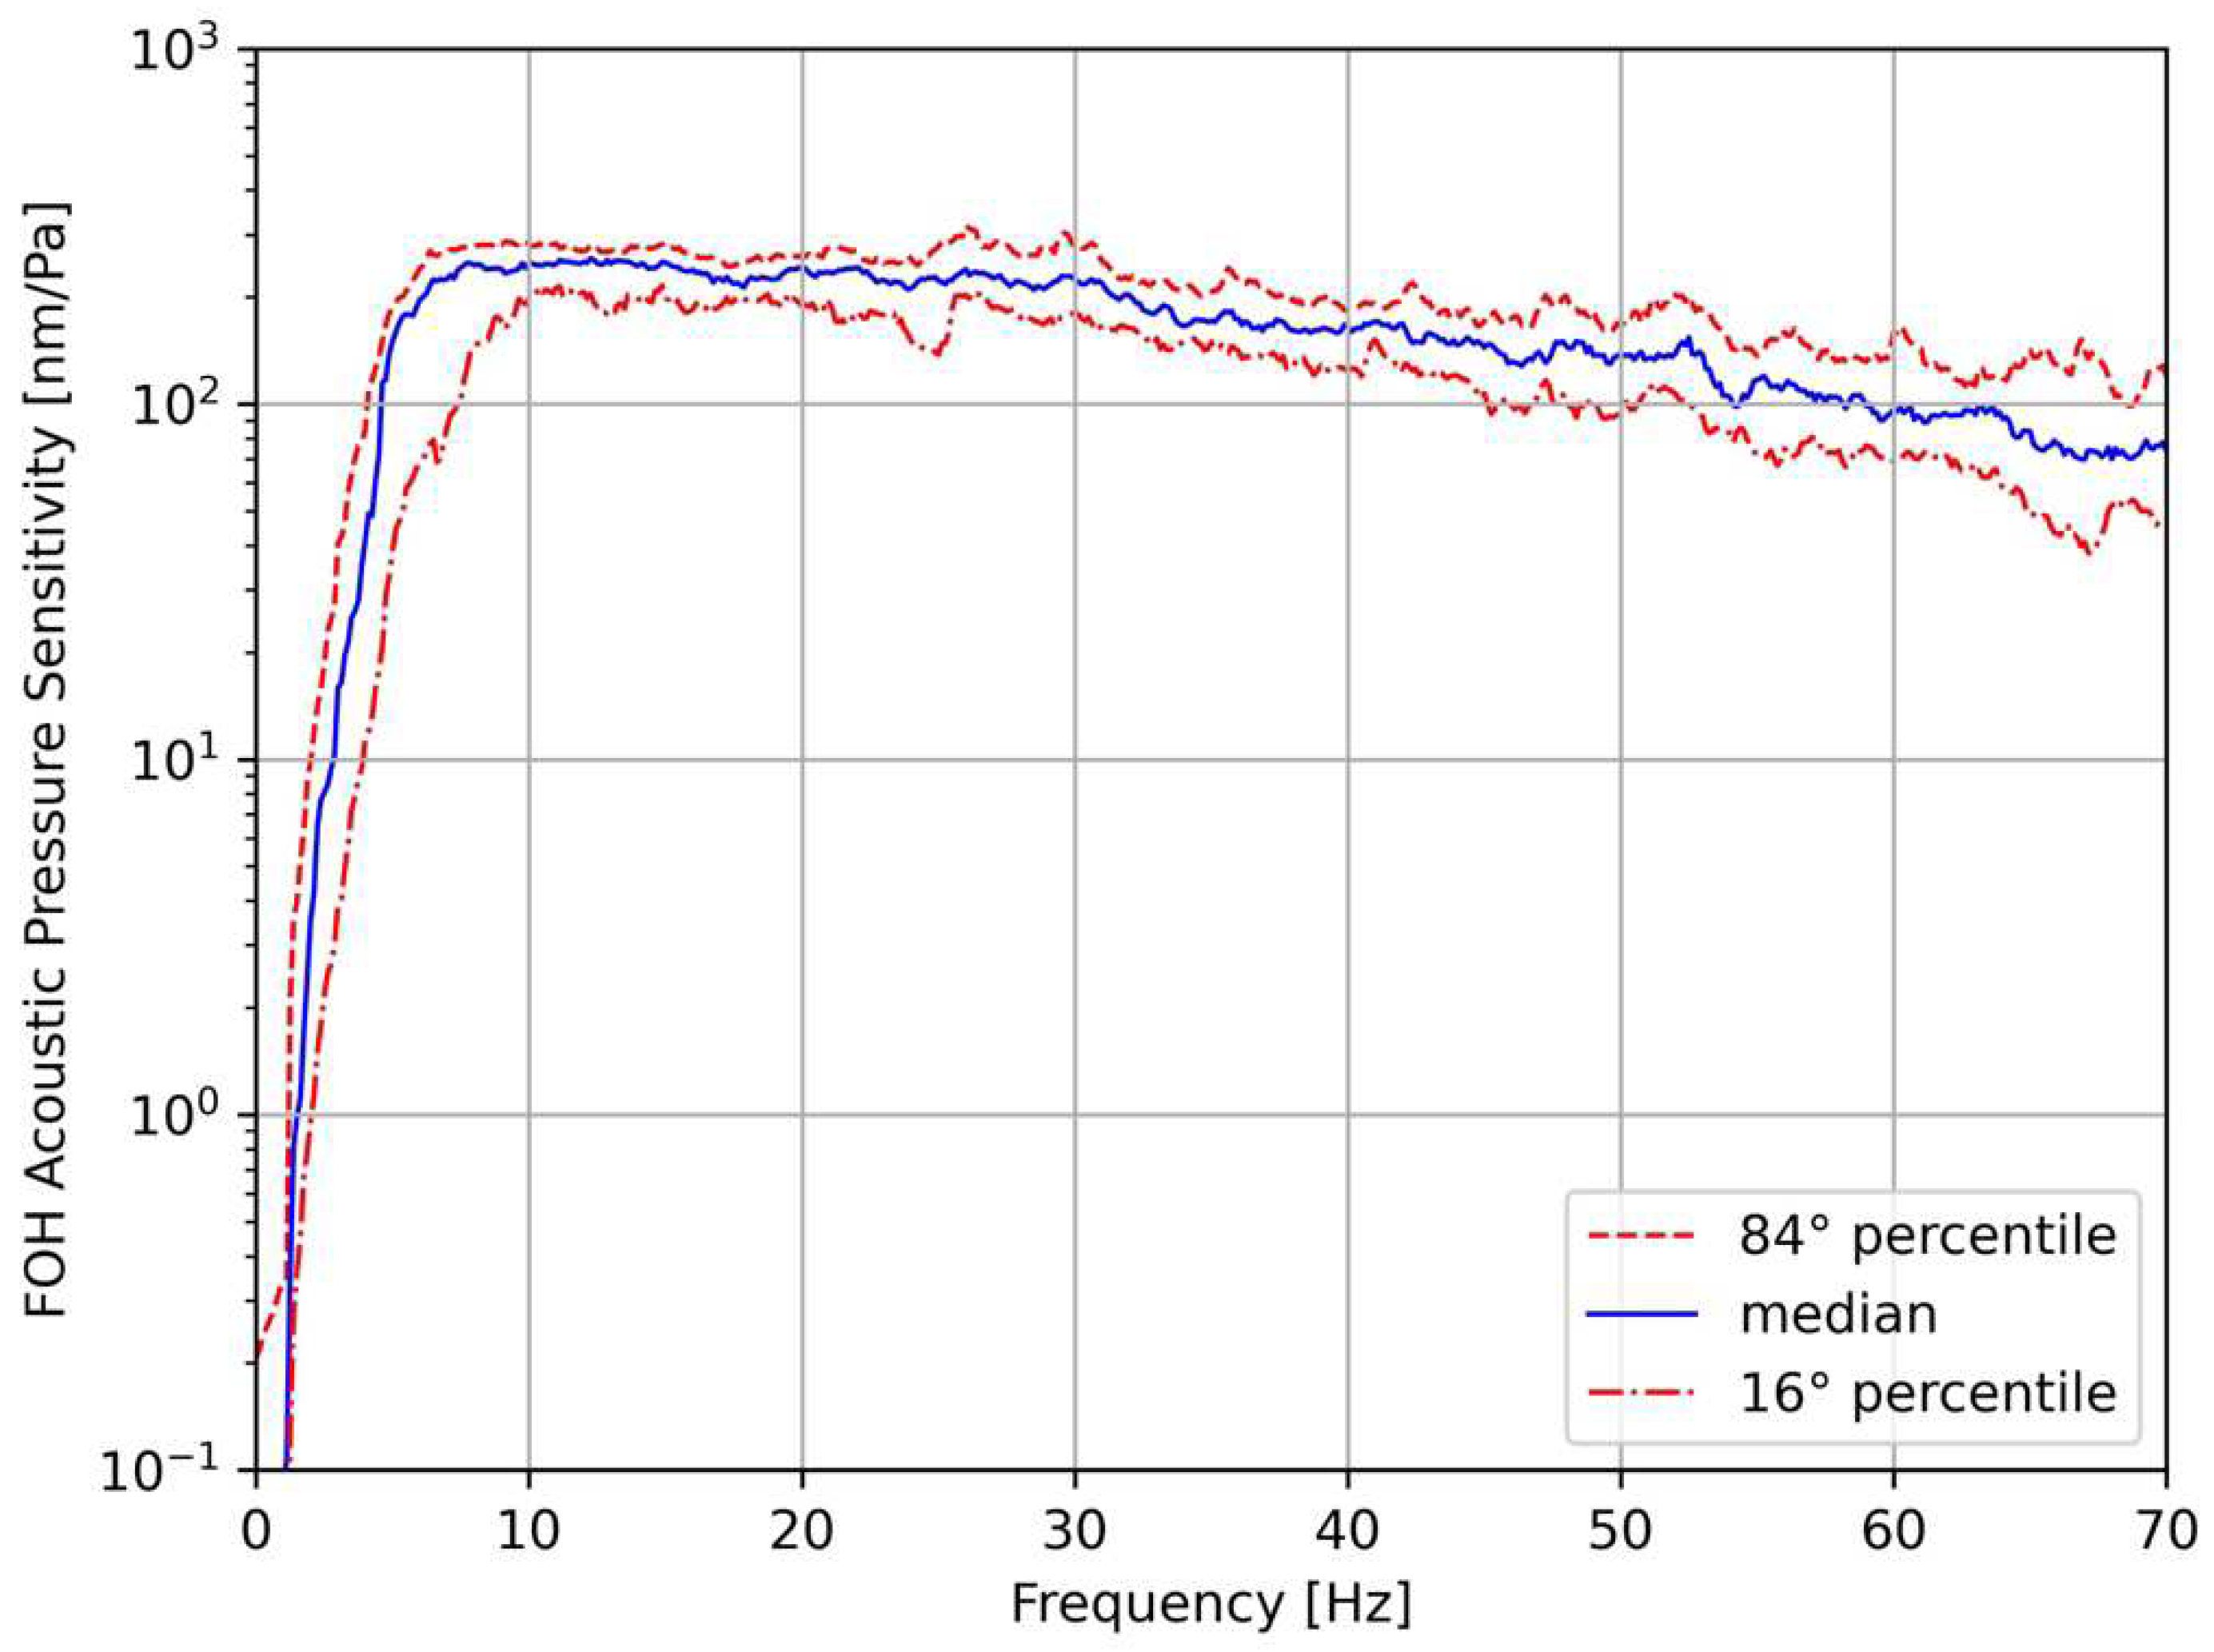
The transfer function required to convert the amplitude count values recorded by the FOH in pressure units (Pascal) was calculated from the frequency domain amplitude ratio between the signals of the same earthquake recorded by the FOH and RH. A smoothing-filtering method is applied on both the spectra, to average out the spectral fluctuations, according to the processing procedure described in [
12].
Figure 7 shows the transfer function, or acoustic pressure responsivity, obtained from the spectra ratios of the 33 selected earthquake records reported in the
Appendix A.
The blue curve represents the median of all 33 spectral ratios used. It shows a flat trend with a strong low-frequency decay where 5 Hz represents the corner frequency value. From the
Figure 7 is remarkable that all curves are included in a narrow band of ±50 nm/Pa around the median value.
To compare the full waveform of the FOH recordings with the RH we used the mean responsivity value in the 5 ÷ 40 Hz frequency band in which most of the energy of the recorded earthquakes is present, as shown from the amplitude spectra. Then, the value of 230 nm/Pa is considered to convert the amplitude values of the FOH recorded signals into pressure values of Pa. A final check of this value was obtained by computing the cross-correlation coefficient (R) between the earthquake records of the two hydrophones. The record pairs were previously high-pass filtered at 5 Hz with a Butterworth filter. As example,
Figure 8 shows an interesting record in which two consecutive earthquakes occur in a short time. Here the records of the two hydrophones are displayed superimposed on the same plot. A clear similarity of the two waveforms is evident through the complete and persistent 8 seconds overlap of the waveform duration.
The high-value of the cross-correlation coefficient (0.93) shown in the
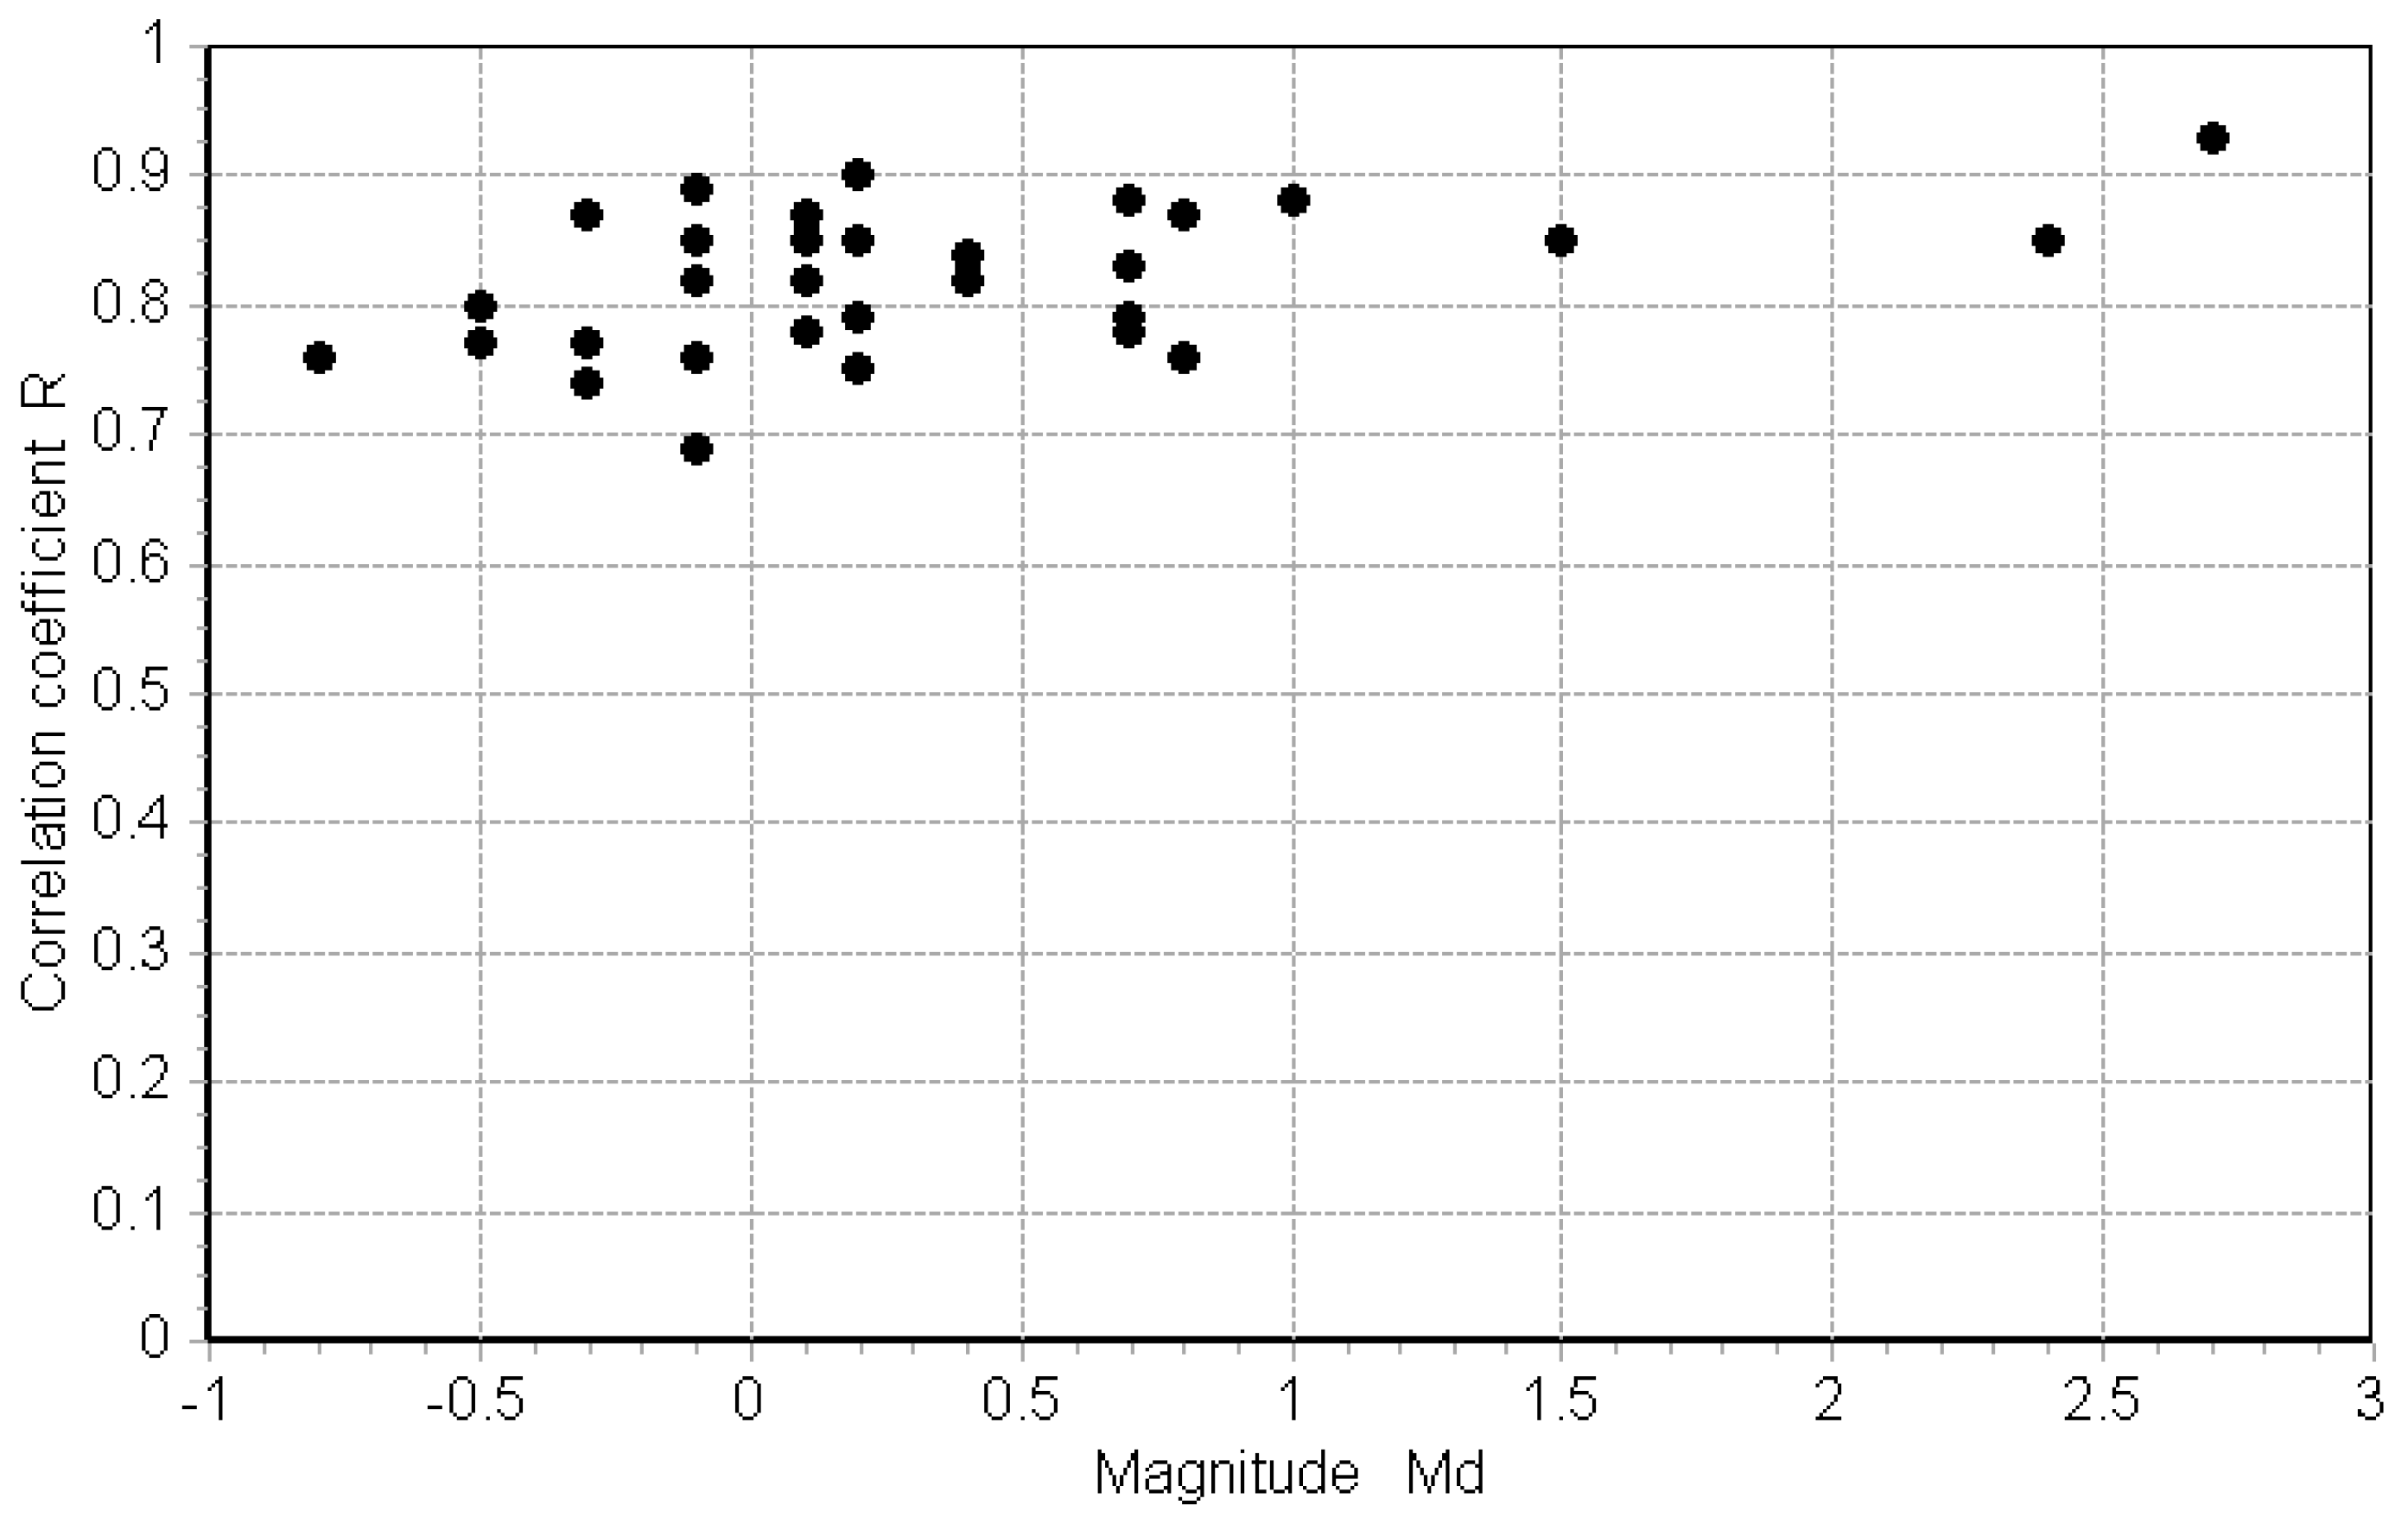
Figure 8, confirms that the two waveforms have the same frequency content, both in amplitude and phase. The same analysis performed in the frequency band 5 ÷ 70 Hz on the records of the 33 selected earthquakes confirms the high-value of the R coefficient for all the analyzed pairs (
Table 1 and
Figure 9).
Figure 9 and
Table 1 show that the lowest value of R is 0.69 and most of the events have a R value greater than 0.75 (31 events out of 33). There is no evident relationship between R and Md, i.e., high values of R correspond to a wide range of magnitudes. This indicates excellent recording quality with FOH even for events of very small magnitude, even less than zero.
4. Conclusions
We have successfully developed a new FOH and experimented with it at sea taking advantage of MEDUSA marine facilities in the Gulf of Pozzuoli. The FOH was installed on a new dedicated frame and deployed at a depth of 40 m, close to a reference well-calibrated hydrophone RH on board an existing seafloor instrumented module. During the sea trial period (seven days), 33 earthquakes with magnitude ranging -0.8 ÷ 2.7 occurred in a small volume of the Solfatara area, at a distance not longer than 4 km from FOH and RH. As the seismic waves’ path from the source to the recording site was similar for all earthquakes, we disregarded the seismic wave attenuation and considered the magnitude as the sole parameter reflecting the energy and amplitude of the radiated seismic waves. According to the magnitude range of the selected earthquakes, the frequency content of the seismic waves is expected from a few Hertz to 40 ÷ 50 Hz [
14,15]. Nevertheless, below this frequency range, wind-generated acoustic waves and microseism can be also observed.
Figure 6 brings in the top panels an example of the low-frequency content of the analyzed acoustic waves. In fact, the waveform recordings by RH show the presence of a long-period signal and an evident and sharp peak in the amplitude spectrum. On the contrary, the low-frequency waves and the corresponding spectral peak are completely absent in the FOH recordings of
Figure 6 (bottom panels). The spectral ratio FOH/RH performed for all the recorded earthquakes shows that the low- frequency response cut-off of the FOH is 5 Hz (
Figure 7). For frequency greater than 5 Hz,
Figure 7 shows an almost flat trend of the ratio FOH/RH with a mean value of 230 nm/Pa. Using this value as the conversion factor of the seismic recordings of the FOH into pressure units, we achieve a perfect match of the recordings of FOH and RH (
Figure 8 and
Appendix A).
The FOH trial shows that in the frequency and amplitude range of interest of seismic activity monitoring, the FOH has an excellent frequency response equivalent to the one of the most common high-quality sensors, such as HTI-04-PCA/ULF. The results of the comparison between FOH and RH indicate the excellent suitability of FOH in the standard seismic frequency range with high sensitivity and high fidelity.
Author Contributions
Conceptualization, S.G. and G.I.; methodology, G.I. and R.R.; software, R.R. and M.J.; validation, S.G., G.I. and M.P.; formal analysis, R.R.; investigation, G.I.; resources, S.G., M.P. and R.R.; data curation, R.R. and M.J.; writing—original draft preparation, S.G. and G.I.; writing—review and editing, S.G. and G.I.; funding acquisition, S.G. All authors have read and agreed to the published version of the manuscript.
Funding
POR FESR 2014/2020 ‘OPTIMA’ (OPtical Technology In Marine and medical Applications) - Distretti ad alta tecnologia, aggregazioni e laboratori pubblico privati per il rafforzamento del potenziale scientifico e tecnologico della Regione Campania - Concessione contributo, a titolo di aiuto ad-hoc.
Institutional Review Board Statement
Not applicable.
Informed Consent Statement
Not applicable.
Data Availability Statement
Data available on request.
Acknowledgments
This work was financially supported by the project (Operating Regional-Plan) POR ‘OPTIMA’ (OPtical Technology In Marine and medical Applications), which INGV and CeRICT consortium have been some of scientific participants.
Conflicts of Interest
The authors declare no conflict of interest. The funders had no role in the design of the study; in the collection, analyses or interpretation of data; in the writing of the manuscript; or in the decision to publish the results.
Appendix A
This Appendix display the waveforms and earthquake spectra reported in
Table 1. Each panel shows for each earthquake the overlap of the waveform and spectrum of the signals recorded by the FOH and RH. The earthquake number of
Table 1 is shown in each panel together with the correlation coefficient R. All the waveforms are high-pass filtered at 5 Hz with a Butterworth filter.
Figure A1.
Overlap of the waveform and spectrum of the signals recorded by the FOH and RH for the Event #1 (see
Table 1).
Figure A1.
Overlap of the waveform and spectrum of the signals recorded by the FOH and RH for the Event #1 (see
Table 1).
Figure A2.
Overlap of the waveform and spectrum of the signals recorded by the FOH and RH for the Event #2 (see
Table 1).
Figure A2.
Overlap of the waveform and spectrum of the signals recorded by the FOH and RH for the Event #2 (see
Table 1).
Figure A3.
Overlap of the waveform and spectrum of the signals recorded by the FOH and RH for the Event #3 (see
Table 1).
Figure A3.
Overlap of the waveform and spectrum of the signals recorded by the FOH and RH for the Event #3 (see
Table 1).
Figure A4.
Overlap of the waveform and spectrum of the signals recorded by the FOH and RH for the Event #4 (see
Table 1).
Figure A4.
Overlap of the waveform and spectrum of the signals recorded by the FOH and RH for the Event #4 (see
Table 1).
Figure A5.
Overlap of the waveform and spectrum of the signals recorded by the FOH and RH for the Event #5 (see
Table 1).
Figure A5.
Overlap of the waveform and spectrum of the signals recorded by the FOH and RH for the Event #5 (see
Table 1).
Figure A6.
Overlap of the waveform and spectrum of the signals recorded by the FOH and RH for the Event #6 (see
Table 1).
Figure A6.
Overlap of the waveform and spectrum of the signals recorded by the FOH and RH for the Event #6 (see
Table 1).
Figure A7.
Overlap of the waveform and spectrum of the signals recorded by the FOH and RH for the Event #7 (see
Table 1).
Figure A7.
Overlap of the waveform and spectrum of the signals recorded by the FOH and RH for the Event #7 (see
Table 1).
Figure A8.
Overlap of the waveform and spectrum of the signals recorded by the FOH and RH for the Event #8 (see
Table 1).
Figure A8.
Overlap of the waveform and spectrum of the signals recorded by the FOH and RH for the Event #8 (see
Table 1).
Figure A9.
Overlap of the waveform and spectrum of the signals recorded by the FOH and RH for the Event #9 (see
Table 1).
Figure A9.
Overlap of the waveform and spectrum of the signals recorded by the FOH and RH for the Event #9 (see
Table 1).
Figure A10.
Overlap of the waveform and spectrum of the signals recorded by the FOH and RH for the Event #10 (see
Table 1).
Figure A10.
Overlap of the waveform and spectrum of the signals recorded by the FOH and RH for the Event #10 (see
Table 1).
Figure A11.
Overlap of the waveform and spectrum of the signals recorded by the FOH and RH for the Event #11 (see
Table 1).
Figure A11.
Overlap of the waveform and spectrum of the signals recorded by the FOH and RH for the Event #11 (see
Table 1).
Figure A12.
Overlap of the waveform and spectrum of the signals recorded by the FOH and RH for the Event #12 (see
Table 1).
Figure A12.
Overlap of the waveform and spectrum of the signals recorded by the FOH and RH for the Event #12 (see
Table 1).
Figure A13.
Overlap of the waveform and spectrum of the signals recorded by the FOH and RH for the Event #13 (see
Table 1).
Figure A13.
Overlap of the waveform and spectrum of the signals recorded by the FOH and RH for the Event #13 (see
Table 1).
Figure A14.
Overlap of the waveform and spectrum of the signals recorded by the FOH and RH for the Event #14 (see
Table 1).
Figure A14.
Overlap of the waveform and spectrum of the signals recorded by the FOH and RH for the Event #14 (see
Table 1).
Figure A15.
Overlap of the waveform and spectrum of the signals recorded by the FOH and RH for the Event #15 (see
Table 1).
Figure A15.
Overlap of the waveform and spectrum of the signals recorded by the FOH and RH for the Event #15 (see
Table 1).
Figure A16.
Overlap of the waveform and spectrum of the signals recorded by the FOH and RH for the Event #16 (see
Table 1).
Figure A16.
Overlap of the waveform and spectrum of the signals recorded by the FOH and RH for the Event #16 (see
Table 1).
Figure A17.
Overlap of the waveform and spectrum of the signals recorded by the FOH and RH for the Event #17 (see
Table 1).
Figure A17.
Overlap of the waveform and spectrum of the signals recorded by the FOH and RH for the Event #17 (see
Table 1).
Figure A18.
Overlap of the waveform and spectrum of the signals recorded by the FOH and RH for the Event #18 (see
Table 1).
Figure A18.
Overlap of the waveform and spectrum of the signals recorded by the FOH and RH for the Event #18 (see
Table 1).
Figure A19.
Overlap of the waveform and spectrum of the signals recorded by the FOH and RH for the Event #19 (see
Table 1).
Figure A19.
Overlap of the waveform and spectrum of the signals recorded by the FOH and RH for the Event #19 (see
Table 1).
Figure A20.
Overlap of the waveform and spectrum of the signals recorded by the FOH and RH for the Event #20 (see
Table 1).
Figure A20.
Overlap of the waveform and spectrum of the signals recorded by the FOH and RH for the Event #20 (see
Table 1).
Figure A21.
Overlap of the waveform and spectrum of the signals recorded by the FOH and RH for the Event #21 (see
Table 1).
Figure A21.
Overlap of the waveform and spectrum of the signals recorded by the FOH and RH for the Event #21 (see
Table 1).
Figure A22.
Overlap of the waveform and spectrum of the signals recorded by the FOH and RH for the Event #22 (see
Table 1).
Figure A22.
Overlap of the waveform and spectrum of the signals recorded by the FOH and RH for the Event #22 (see
Table 1).
Figure A23.
Overlap of the waveform and spectrum of the signals recorded by the FOH and RH for the Event #23 (see
Table 1).
Figure A23.
Overlap of the waveform and spectrum of the signals recorded by the FOH and RH for the Event #23 (see
Table 1).
Figure A24.
Overlap of the waveform and spectrum of the signals recorded by the FOH and RH for the Event #24 (see
Table 1).
Figure A24.
Overlap of the waveform and spectrum of the signals recorded by the FOH and RH for the Event #24 (see
Table 1).
Figure A25.
Overlap of the waveform and spectrum of the signals recorded by the FOH and RH for the Event #25 (see
Table 1).
Figure A25.
Overlap of the waveform and spectrum of the signals recorded by the FOH and RH for the Event #25 (see
Table 1).
Figure A26.
Overlap of the waveform and spectrum of the signals recorded by the FOH and RH for the Event #26 (see
Table 1).
Figure A26.
Overlap of the waveform and spectrum of the signals recorded by the FOH and RH for the Event #26 (see
Table 1).
Figure A27.
Overlap of the waveform and spectrum of the signals recorded by the FOH and RH for the Event #27 (see
Table 1).
Figure A27.
Overlap of the waveform and spectrum of the signals recorded by the FOH and RH for the Event #27 (see
Table 1).
Figure A28.
Overlap of the waveform and spectrum of the signals recorded by the FOH and RH for the Event #28 (see
Table 1).
Figure A28.
Overlap of the waveform and spectrum of the signals recorded by the FOH and RH for the Event #28 (see
Table 1).
Figure A29.
Overlap of the waveform and spectrum of the signals recorded by the FOH and RH for the Event #29 (see
Table 1).
Figure A29.
Overlap of the waveform and spectrum of the signals recorded by the FOH and RH for the Event #29 (see
Table 1).
Figure A30.
Overlap of the waveform and spectrum of the signals recorded by the FOH and RH for the Event #30 (see
Table 1).
Figure A30.
Overlap of the waveform and spectrum of the signals recorded by the FOH and RH for the Event #30 (see
Table 1).
Figure A31.
Overlap of the waveform and spectrum of the signals recorded by the FOH and RH for the Event #31 (see
Table 1).
Figure A31.
Overlap of the waveform and spectrum of the signals recorded by the FOH and RH for the Event #31 (see
Table 1).
Figure A32.
Overlap of the waveform and spectrum of the signals recorded by the FOH and RH for the Event #32 (see
Table 1).
Figure A32.
Overlap of the waveform and spectrum of the signals recorded by the FOH and RH for the Event #32 (see
Table 1).
Figure A33.
Overlap of the waveform and spectrum of the signals recorded by the FOH and RH for the Event #33 (see
Table 1).
Figure A33.
Overlap of the waveform and spectrum of the signals recorded by the FOH and RH for the Event #33 (see
Table 1).
References
- Meng, Z.; Hu, Y.; Ni, M.; Xiong, S.; Zhang, R.; Li, X.; Stewart, G.; Dong, F.Z. and Culshaw, B. Development of a 32-element fiber optic hydrophone system. Proc. SPIE 5589, Fib. Op. Sens. Tech. and App. III, 2004. [CrossRef]
- De Freitas, J.M. Recent developments in seismic seabed oil reservoir monitoring applications using fibre-optic sensing networks. Meas. Sci. Technol. 2011. [Google Scholar] [CrossRef]
- Langhammer, J.; Nakstad, H.; Eriksrud, M.; Berg, A.; Rønnekleiv, E.; Waagaard, O. and Thompson, M. Fibre Optic Reservoir Monitoring: Field Trials and Results. Offshore Tech. Conf., Houston, Texas, USA, May 2008. [CrossRef]
- Janneh, M.; Bruno, F.A.; Guardato, S.; Donnarumma, G.P.; Iannaccone, G.; Gruca, G.; Werzinger, S.; Gunda, A.; Rijnveld, N.; Cutolo, A.; Pisco, M. and Cusano A. Field demonstration of an optical fiber hydrophone for seismic monitoring at Campi-Flegrei caldera. Opt. & Laser Tech. Volume 158, Part A, 2023, 108920. [CrossRef]
- Robinson, S.P.; Hayman, G. and Wang, A. J. Low-frequency calibration of hydrophones and acoustic systems. 2017, CTBTO International Hydroacoustics Workshop, IHW2017 Vienna, 11-13 September 2017.
- Cui, S. and Khoo, D. W. Y. Underwater Calibration of Hydrophones at Very Low Frequencies from 30 Hz to 2 kHz. J. Phys.: Conf. Ser. 2018, Vol. 1065. No. 7. IOP Publishing. [CrossRef]
- Iannaccone, G.; Pucciarelli, G.; Guardato, S.; Donnarumma, G. P.; Macedonio, G. and Beranzoli, L. When the Hydrophone Works as an Accelerometer, Seism. Res. Letters 92, page 365-377, 2020. [CrossRef]
- Iannaccone, G.; Guardato, S.; Donnarumma, G.P.; De Martino, P.; Dolce, M.; Macedonio, G.; Chierici, F. and Beranzoli, L. Measurement of seafloor deformation in the marine sector of the Campi Flegrei caldera (Italy). 2018, J. of Geophys. Res.: Solid Earth, 123. [CrossRef]
- De Martino, P.; Guardato, S.; Tammaro, U.; Vassallo, M. and Iannaccone, G. A first GPS measurement of vertical seafloor displacement in the Campi Flegrei Caldera (Italy). 2014, J. of Volc. and Geoth. Res., vol. 276, pp. 145-151. [CrossRef]
- De Martino, P.; Guardato, S.; Donnarumma, G.P.; Dolce, M.; Trombetti, T.; Chierici, F.; Macedonio, G.; Beranzoli, L. and Iannaccone, G. Four years of continuous seafloor displacement measurements in the Campi Flegrei caldera. Front. in Earth Sc., 2020. [CrossRef]
- Giudicepietro, F.; Ricciolino, P.; Bianco, F.; Caliro, S.; Cubellis, E.; D’Auria, L.; De Cesare, W.; De Martino, P.; Esposito, AM.; Galluzzo, D.; Macedonio, G.; Lo Bascio, D.; Orazi, M.; Pappalardo, L.; Peluso, R.; Scarpato, G.; Tramelli, A. and Chiodini G. Campi Flegrei, Vesuvius and Ischia Seismicity in the Context of the NeapolitanVolcanic Area. 2021, Front. Earth Sci. 9:662113. [CrossRef]
- Pisco, M.; Bruno, F.A.; Galluzzo, D.; Nardone, L.; Gruca, G.; Rijnveld, N.; Bianco, F.; Cutolo, A. and Cusano, A. Opto-mechanical lab-on-fiber seismic sensors detected the Norcia earthquake, Sci. Rep., vol. 8, pp. 6680, 2018. [CrossRef]
- Aki, K. and Richards, P.G., Quantitative Seismology: Theory and Methods. Freeman and Co., San Francisco, CA, 1980.
- Del Pezzo, E.; De Natale, G.; Martini, M. and Zollo A. Source parameters of microearthquakes at Phlegraean Fields (Southern Italy) volcanic area. Phys. of Earth and Plan. Int., 47 (1987) 25-42, 1986. [CrossRef]
|
Disclaimer/Publisher’s Note: The statements, opinions and data contained in all publications are solely those of the individual author(s) and contributor(s) and not of MDPI and/or the editor(s). MDPI and/or the editor(s) disclaim responsibility for any injury to people or property resulting from any ideas, methods, instructions or products referred to in the content. |
© 2023 by the authors. Licensee MDPI, Basel, Switzerland. This article is an open access article distributed under the terms and conditions of the Creative Commons Attribution (CC BY) license (http://creativecommons.org/licenses/by/4.0/).


