Submitted:
12 February 2023
Posted:
16 February 2023
You are already at the latest version
Abstract
Keywords:
1. Introduction
- Environmental benefits include recovering water resources and minimizing sewage production [5].
- Economic benefits are the reduction of water supply costs (through water recycling), which results in reduced household water bills [15].
- Energy benefits in the form of limited energy generation per family per year by reusing the greywater with the installed turbines, pipe system, storage and disinfection in high rise buildings [16].
1.1. Greywater Classification, Parameters, and Guidelines
1.2. Soil Properties and Biodiversity
- The chloroform fumigation-incubation (CFI) and chloroform fumigation-extraction (CFE) methods are biochemical techniques used to determine the distribution and diversity of soil microorganisms [54]. Fumigation methods give an estimate of microbial biomass as a whole and are related to microbial abundance rather than microbial biodiversity [55], as they measure the CO2 emissions of the microbial population alive and link it to the metabolism of that population. These methods are not accurate but are broadly used as they are very economical.
- Spectrophotometric methods are easy and rapid methods employed to find soil properties [56]. Based on near-infrared spectral absorption various elements of the soil can be simultaneously detected [57]. When these methods are used, it is possible to infer information about the mineral and organic composition of the soil, as well as microbial soil life [58], as the method can identify bacteria as gram-positive or gram-negative [58] through reflectance of a certain type of light [59]. However, these methods lack a clear perception of biodiversity due to low sensitivity and selectivity [60].
- Phospholipid fatty acids (PLFAs) are key components of microbial cell membranes. The analysis of PLFAs extracted from soils can provide information about the overall structure of terrestrial (microorganisms from soil and freshwater) microbial communities [61].
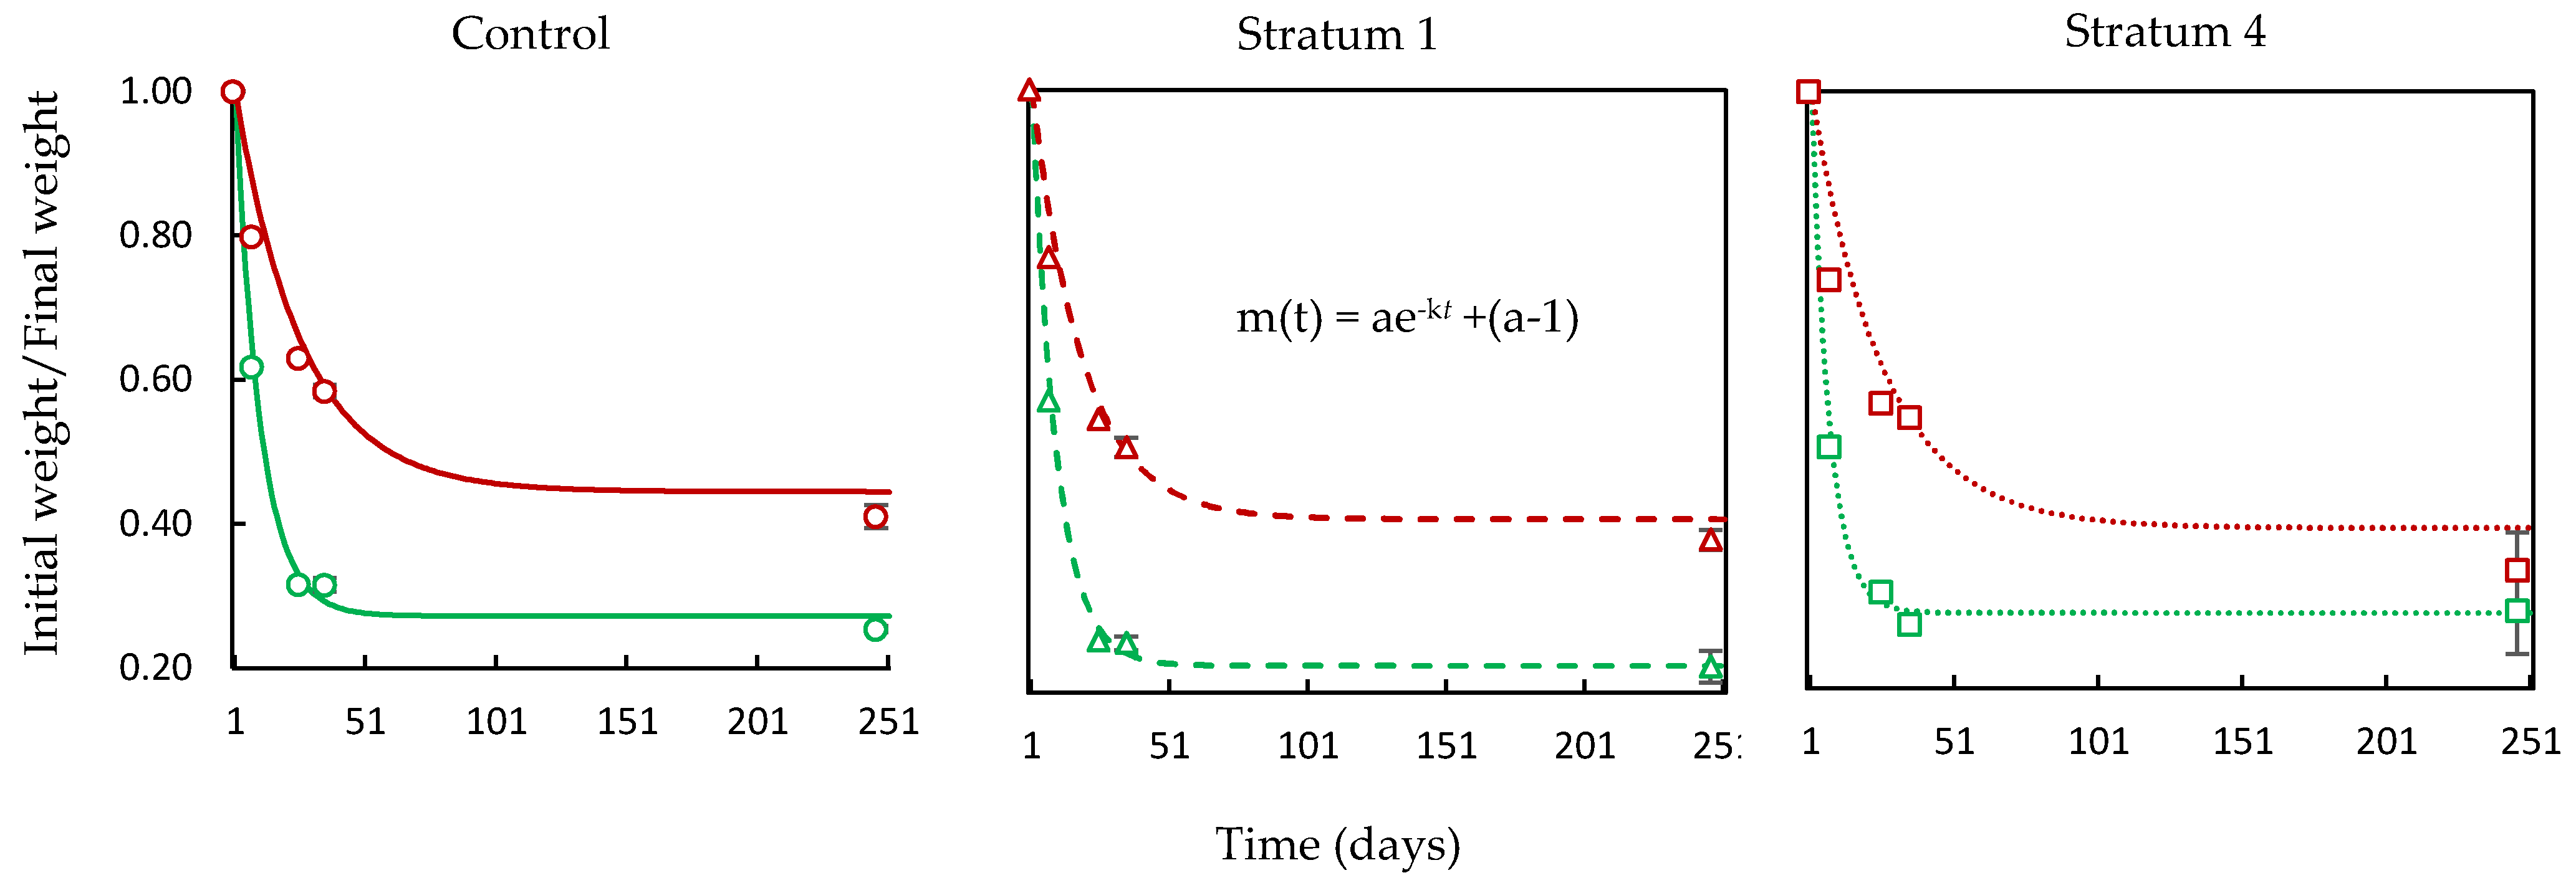
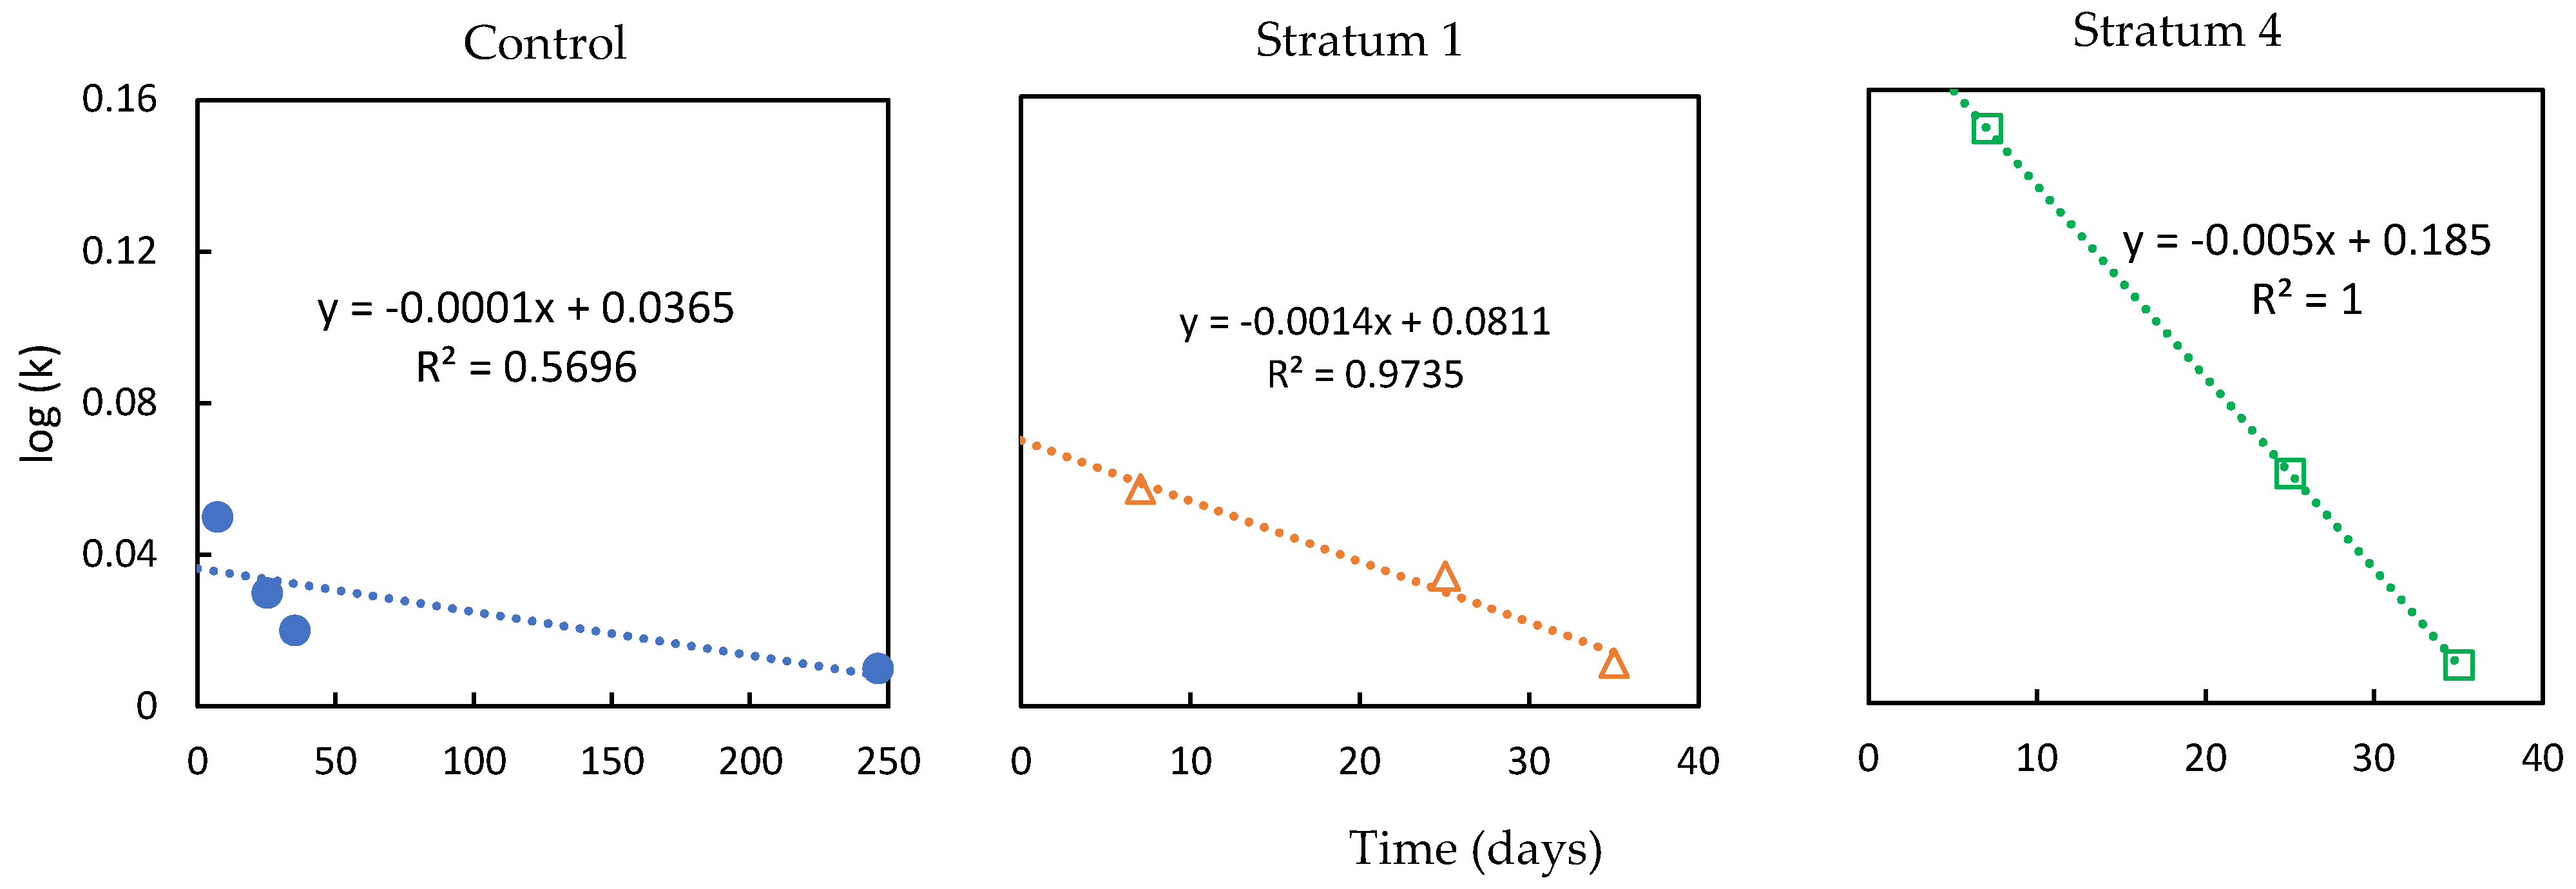
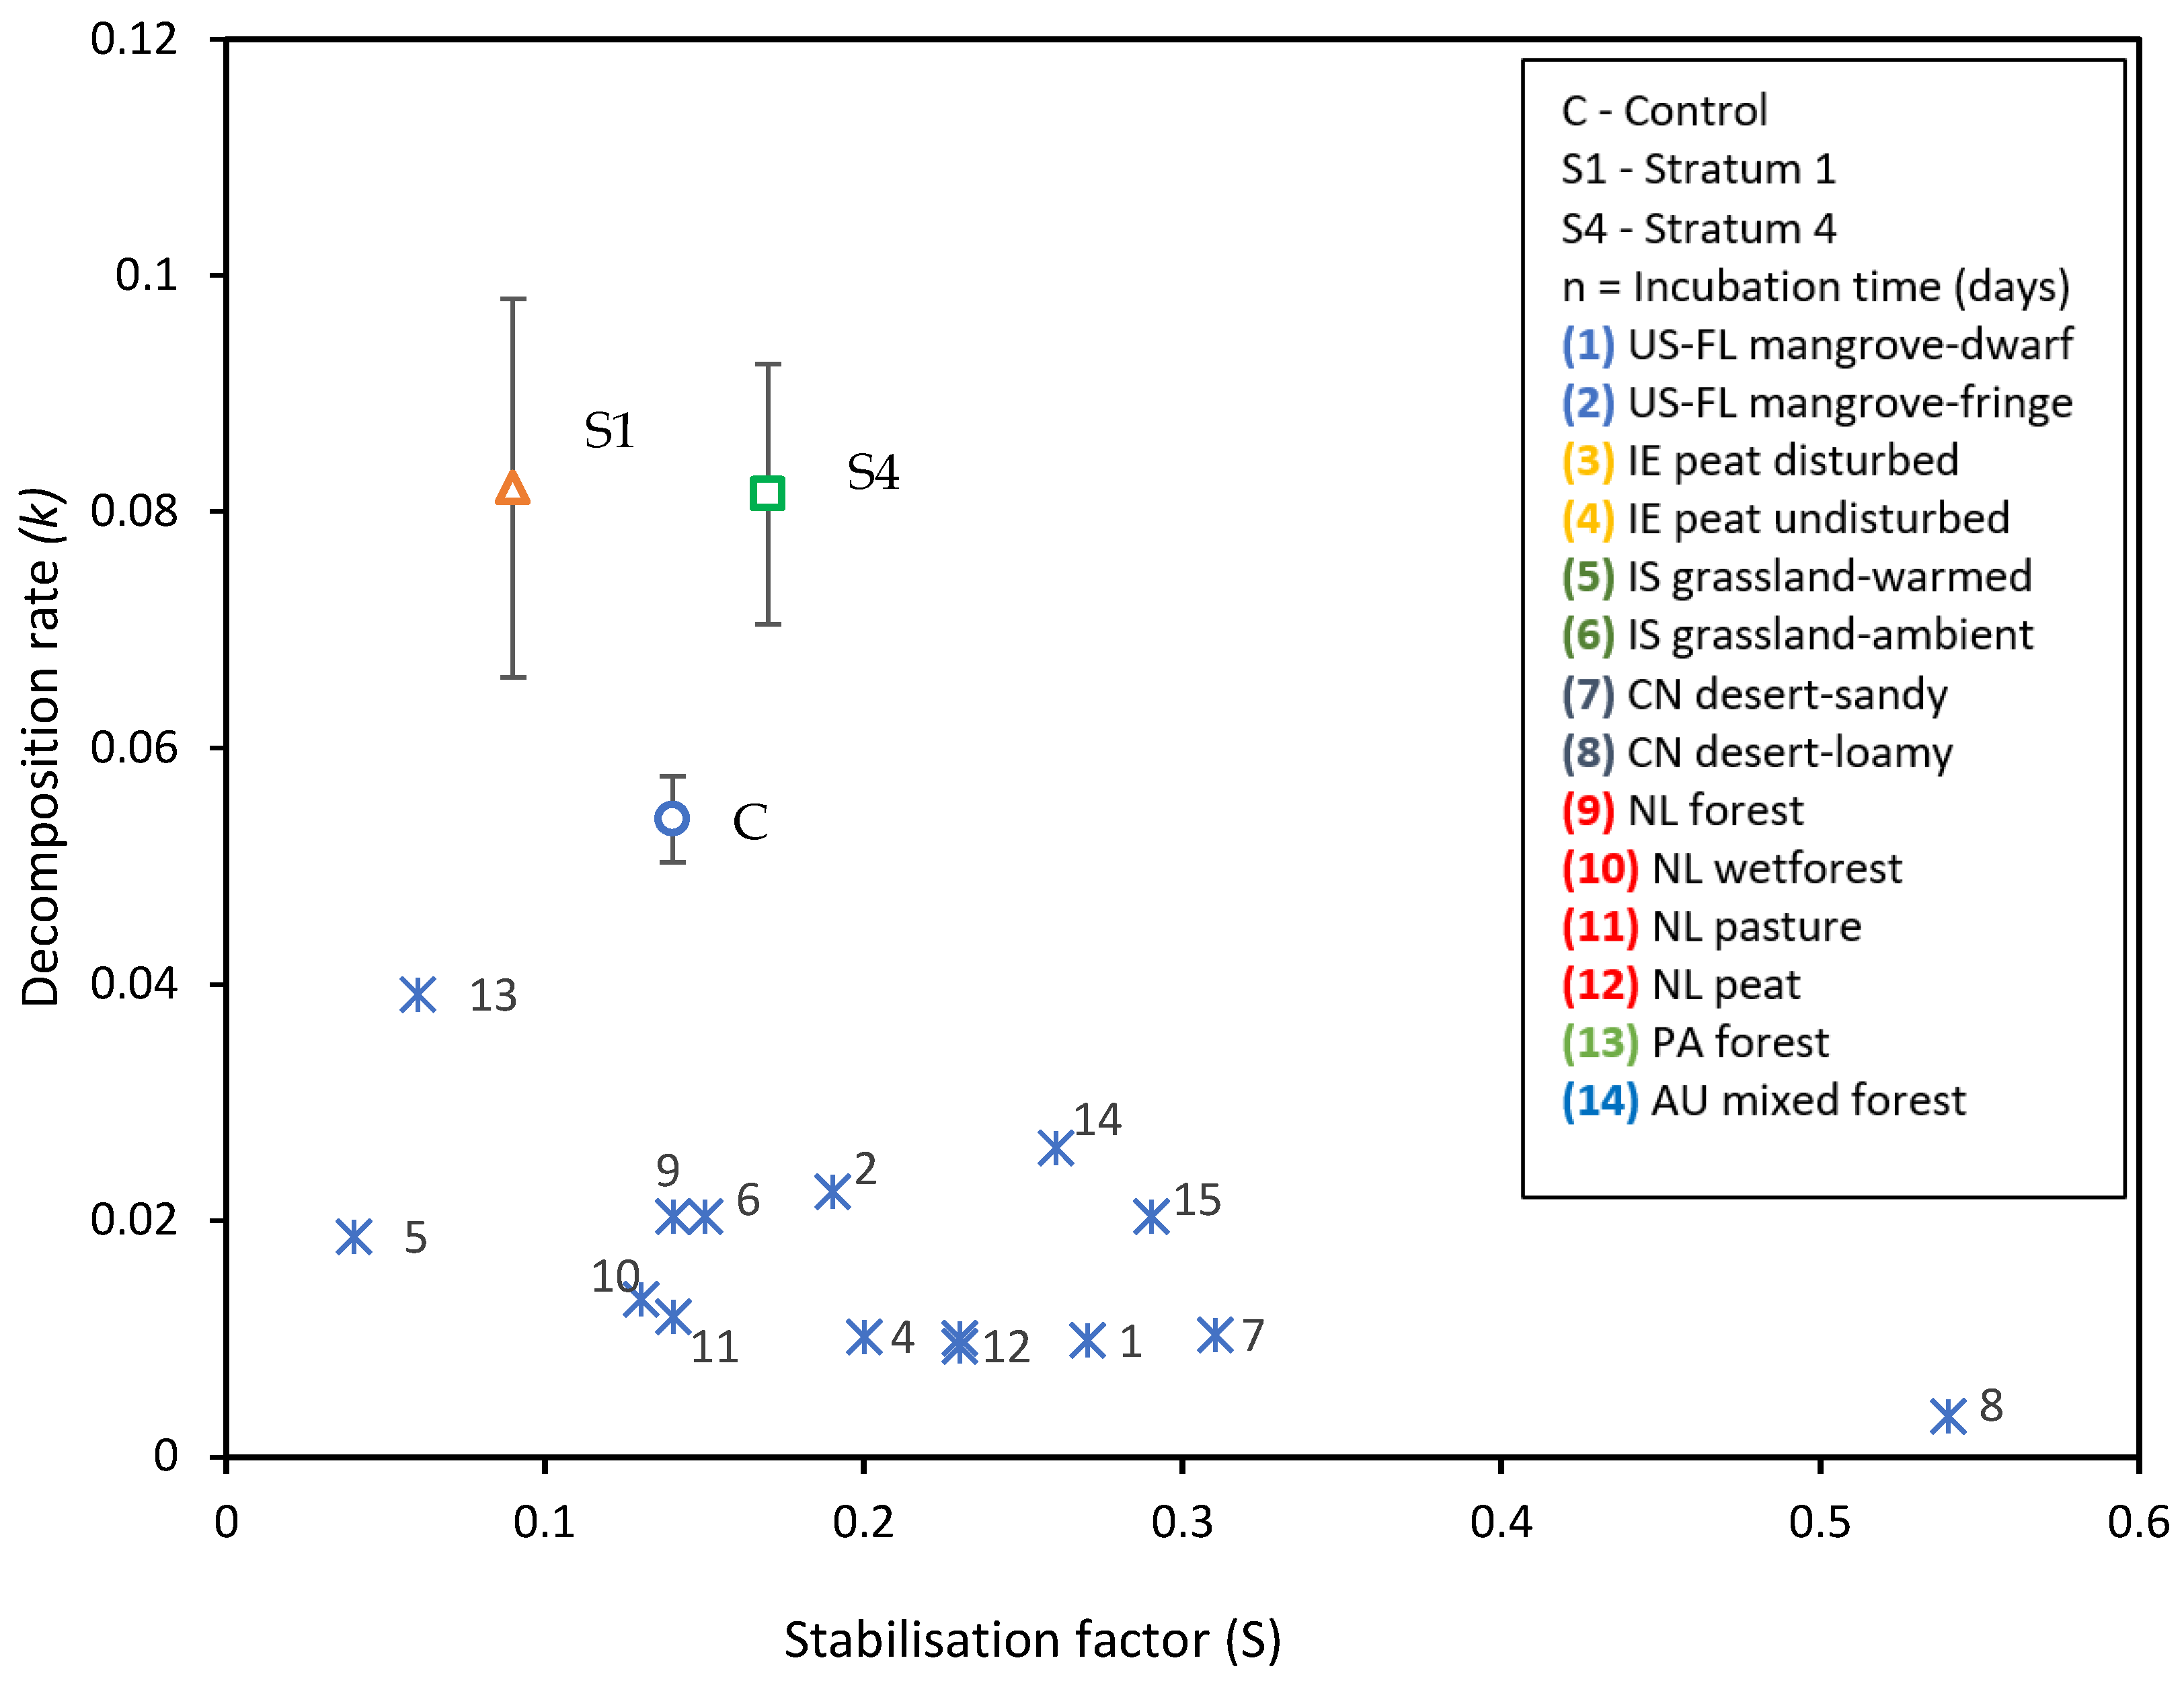
- The tea bag plantation method is used to find the decomposition rate of the soil that had absorbed the GW. The Tea Bag Index (TBI) method is a standardized and economical method to quantify microbial-driven decomposition by measuring the tea mass after being buried in soil over a certain period [62]. This decomposition rate (k) results from increased microbial biomass (cell formations) and higher metabolic activity. Two different tea types are widely accepted for this test: rooibos and green. Each data point corresponds to a replica, i. e. a pair of tea bags includes one rooibos and one green tea bag. Rooibos tea is easy to decompose, while green tea is characterized by a slower rate of decomposition. The fraction of green tea that remains after the rooibos tea is fully decomposed is used to estimate the amount of biomass that is fixed in the soil, which is called stabilization (S). The TBI is calculated from both types of tea and is based on these two factors (S and k). Hence, the 'S' indicates the amount of material that remains in the soil, and ‘k’ is the amount lost as a byproduct of the decomposition. Both ‘S’ and ‘k’ are functions of the initial and final weights of their respective tea bags [62].
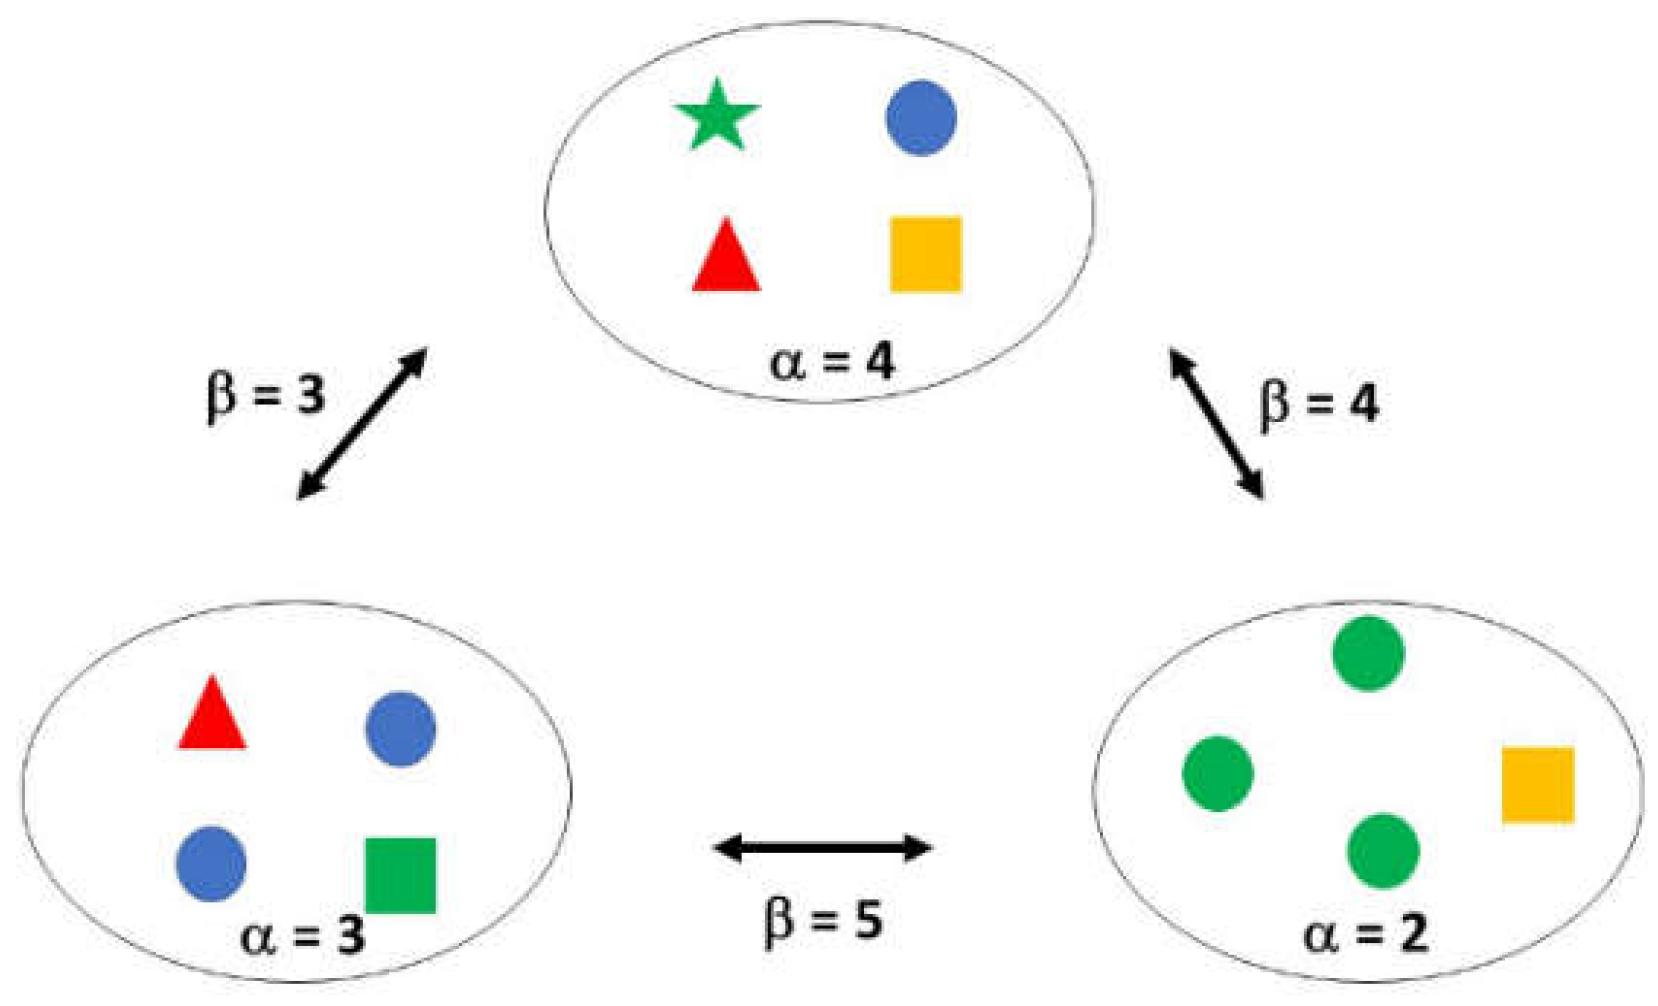
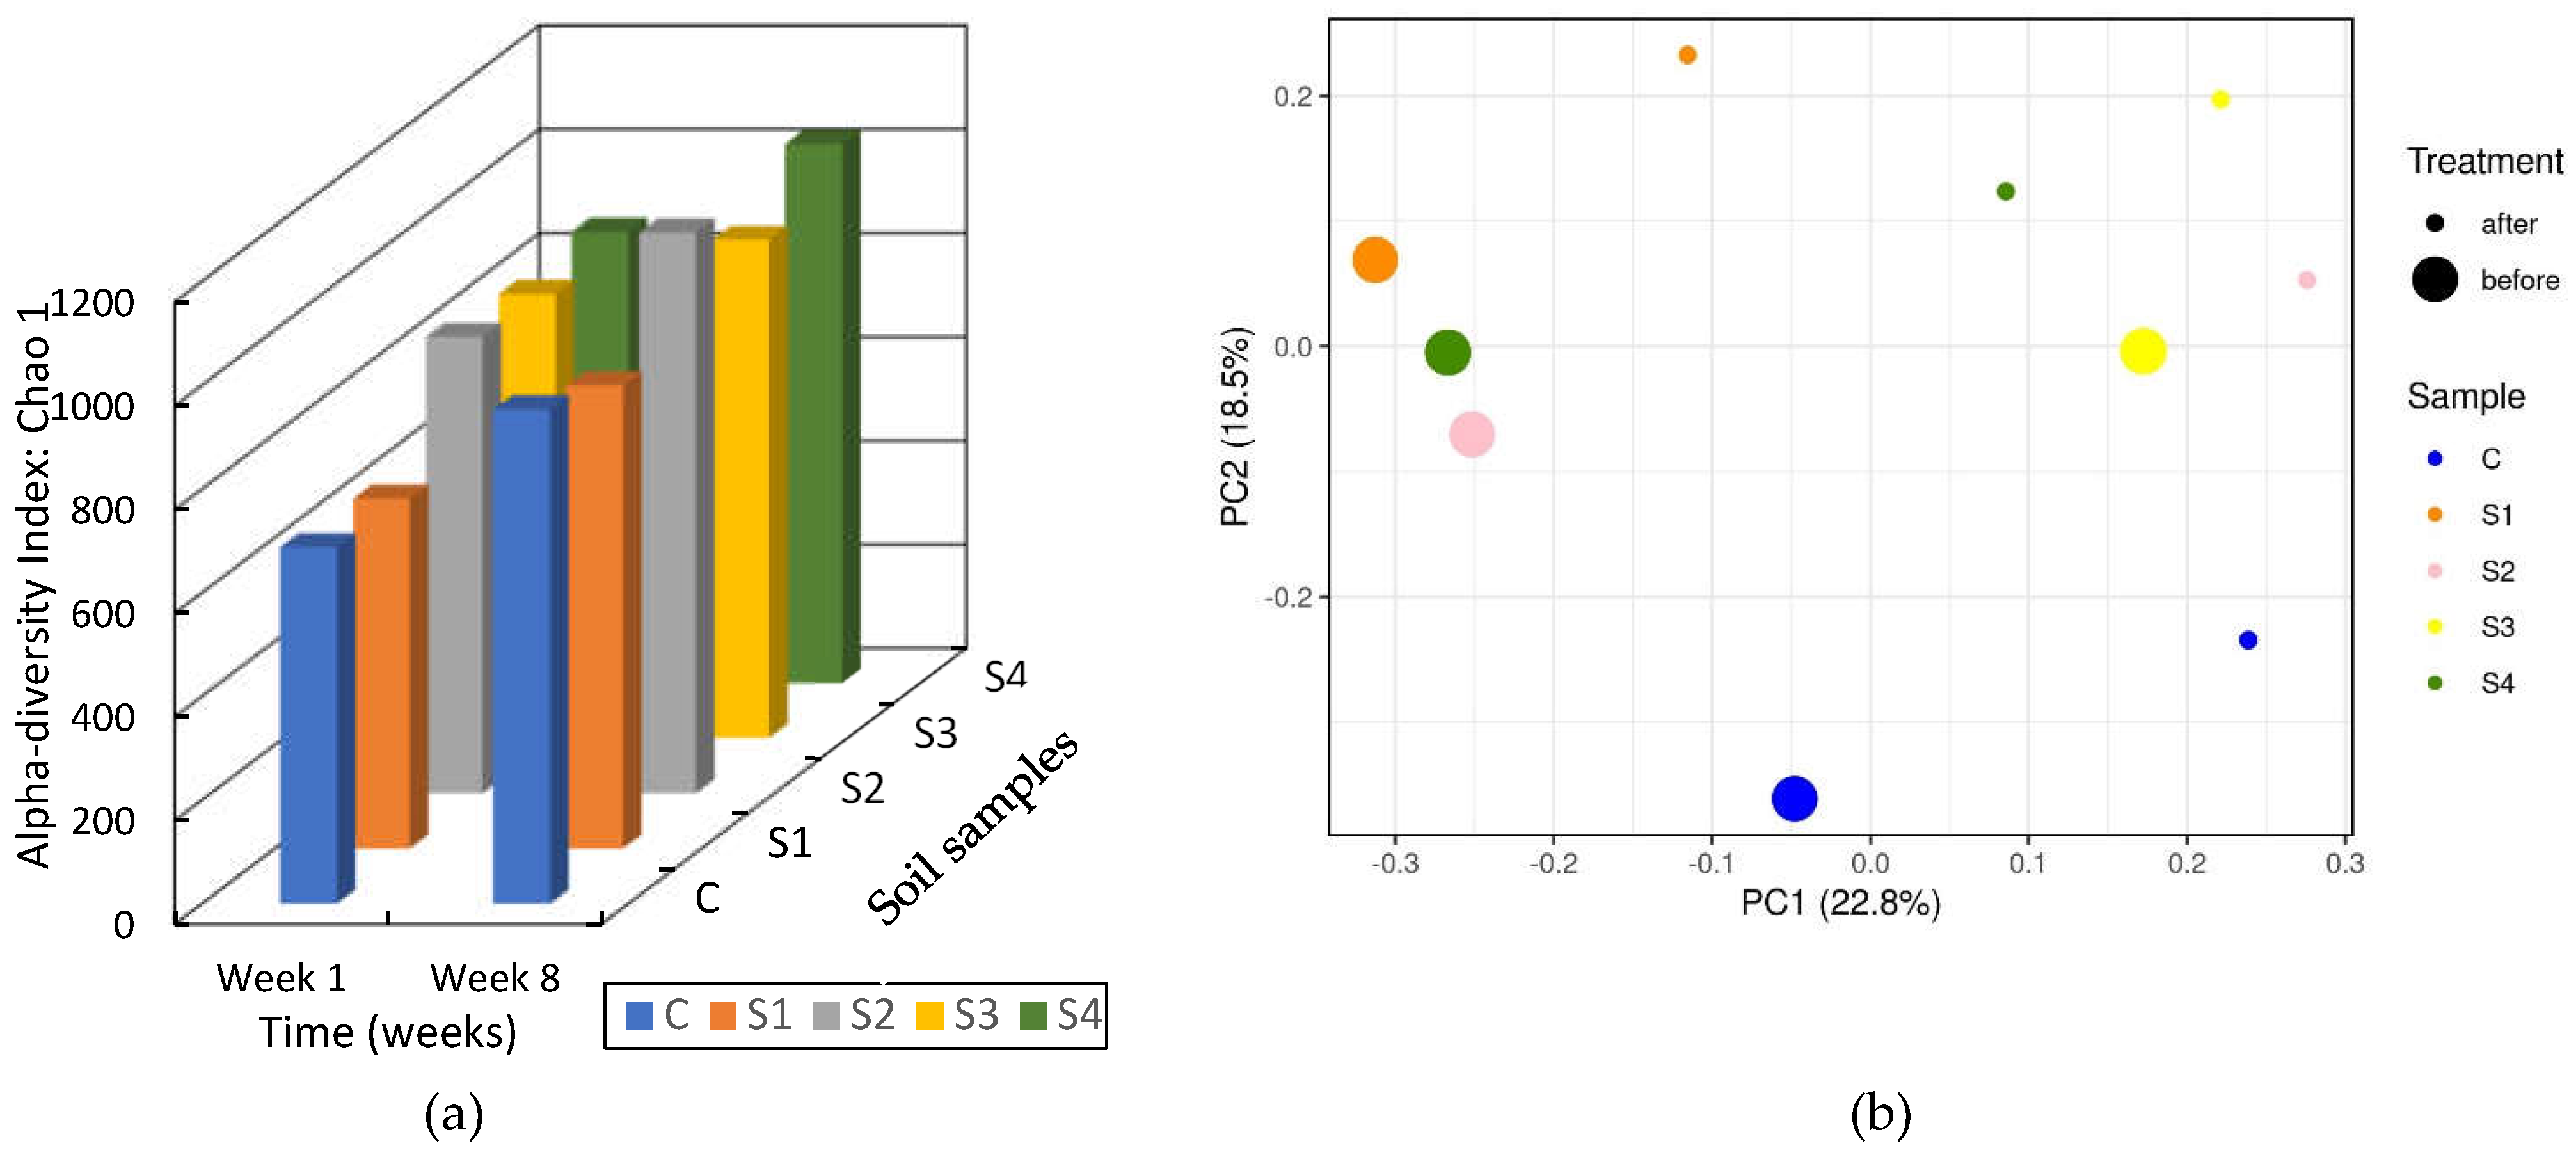
- DNA sequencing is a method used to gather information about organisms and their environment [63]. The sequencing is done through a two-stage process. Firstly, with commercial DNA kits, the cells are broken down, involving mechanical and chemical processes [64]. Secondly, short single-stranded DNA fragments, known as primers, are amplified by artificial replication [65]. The amplified DNA fragments are then sequenced, and a taxonomy of all the different kinds of bacteria is generated. Based on that taxonomy, diversity indexes are calculated, namely the alpha (α) and beta (β) [66]. α-diversity is local diversity, which counts the types of microbes in a sample [67]. The higher the species richness the greater the α-diversity of a particular sample. α-diversity occurs within a given area within a region that is smaller than the entire distribution of the species [68]. β-diversity compares all the different kinds of microbes between two or more samples [69]. It gives an estimation of how similar or dissimilar the microbes of different communities are in different samples. β-diversity is the rate of change in species richness that occurs with a change in spatial scale [68]. Both α and β diversities are determined from the Phylogenetic tree, which is a representation of the evolutionary relationships among various taxa [70]. A simple calculation of the diversities is shown in Figure 1.
2. Materials and Methods
2.1. GW Soap Recipe
2.2. Construction and Arrangement of Staircase Wetland
2.3. Tea Bag Plantation in Staircase Wetland
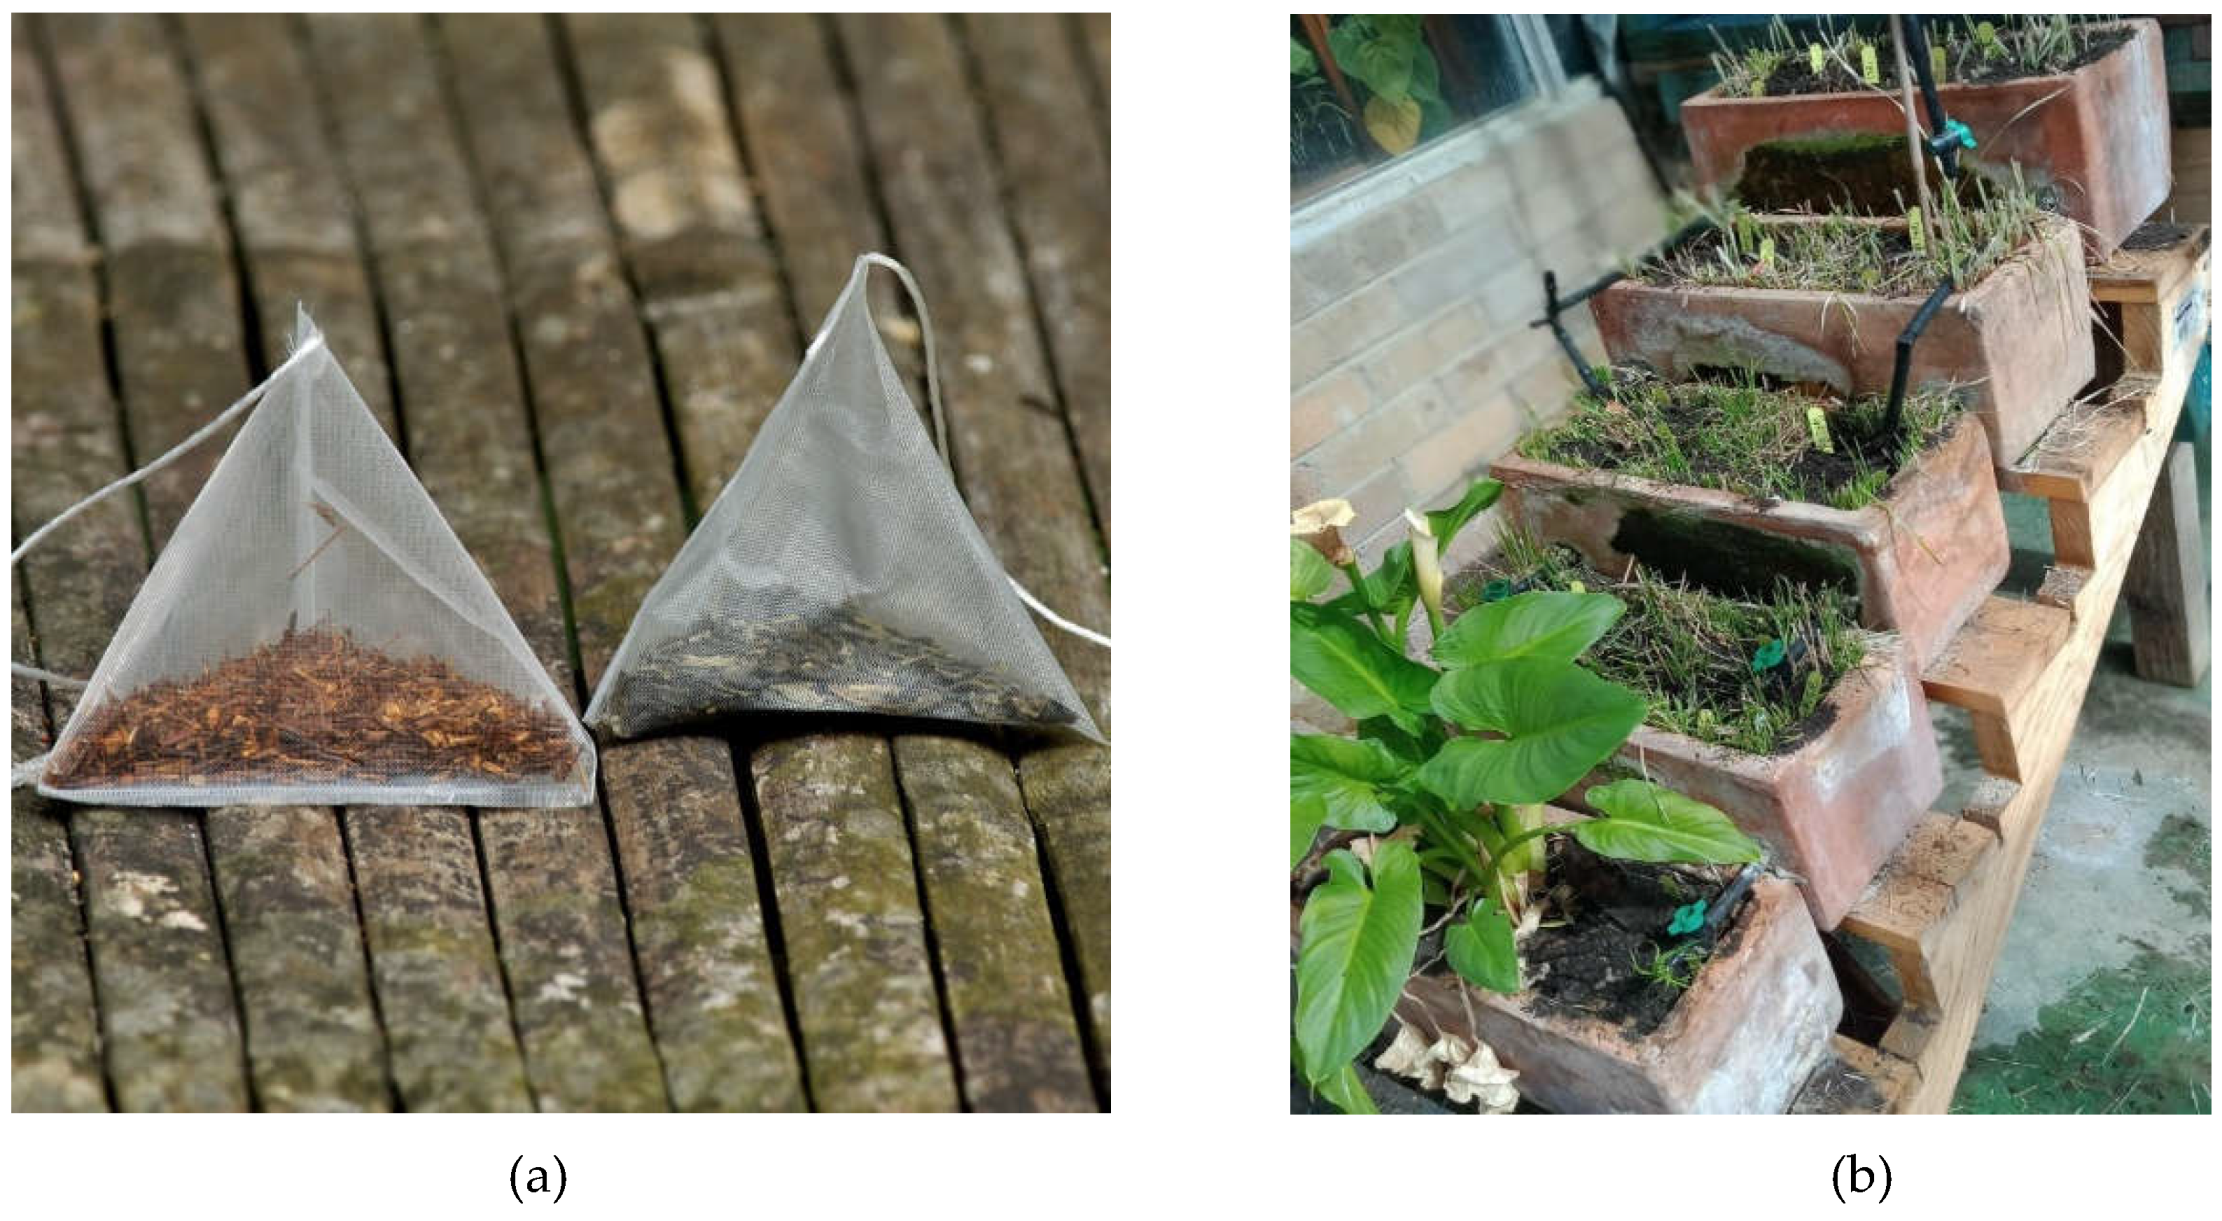
2.4. Soil DNA Tests
2.5. Statistical Analysis
3. Results and Analysis
3.1. Water Tests
3.2. Soil Tests
3.3. Soil Biomass
3.3.1. Tea Bag Results
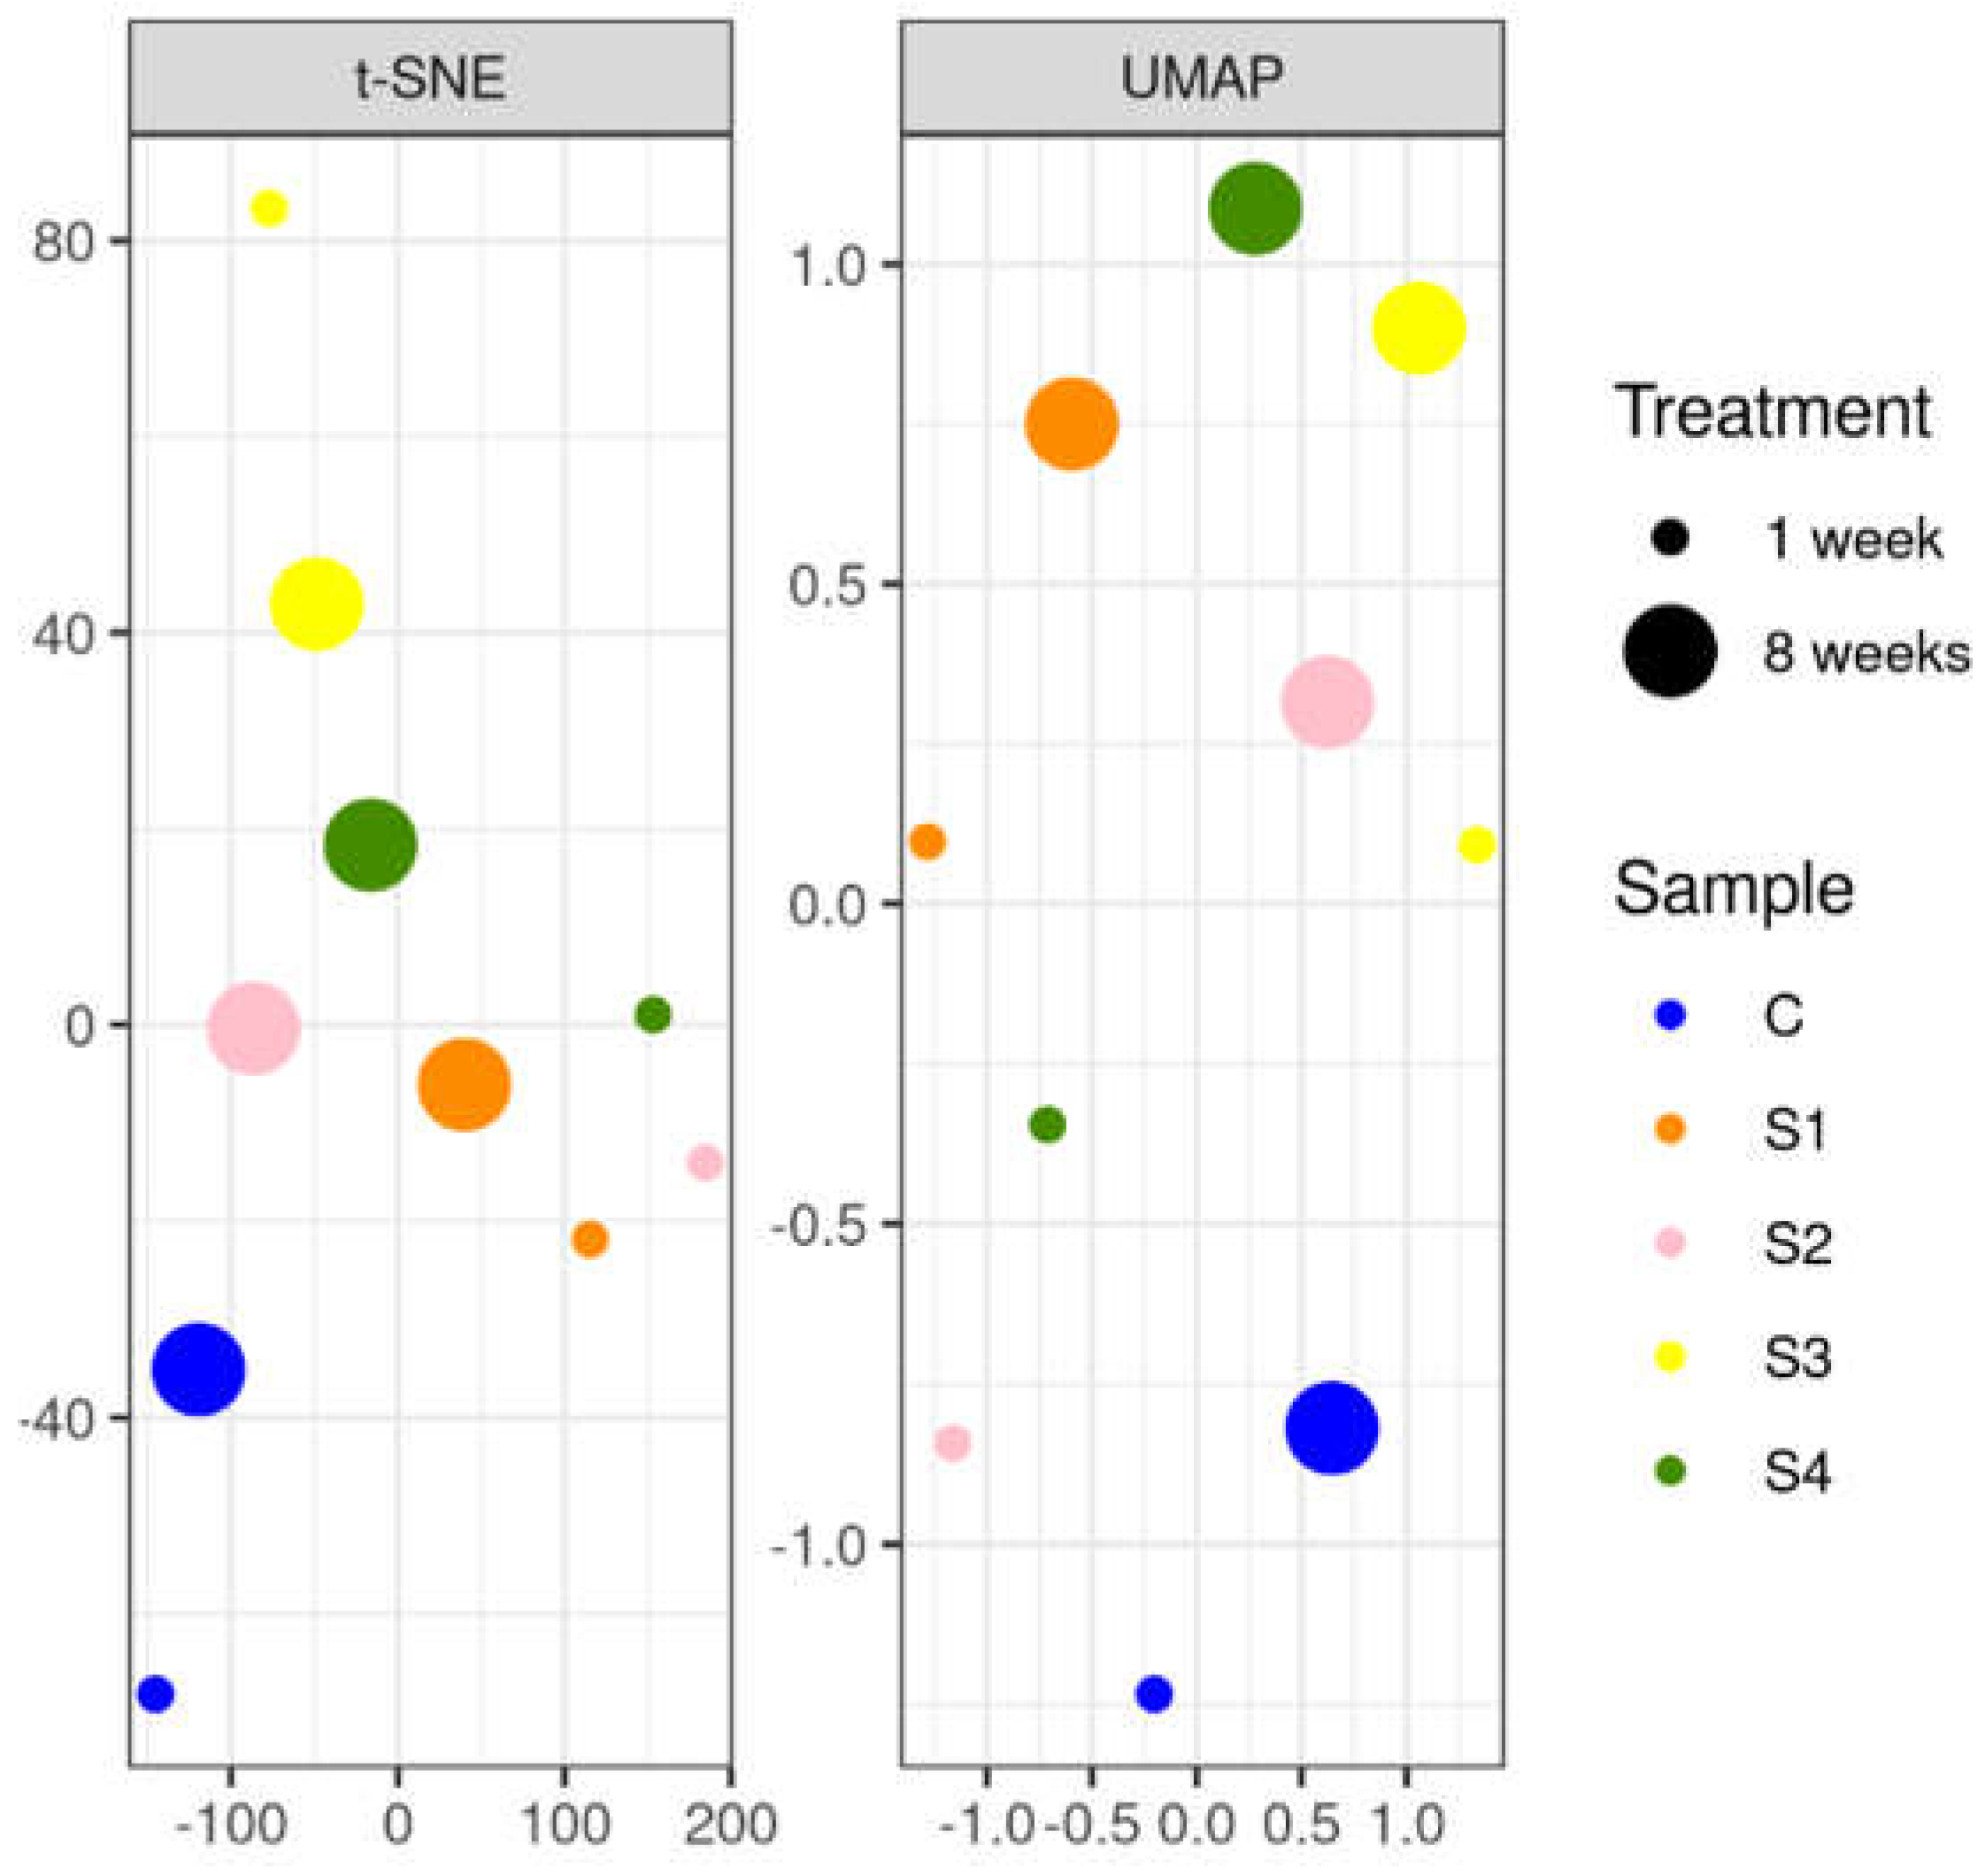
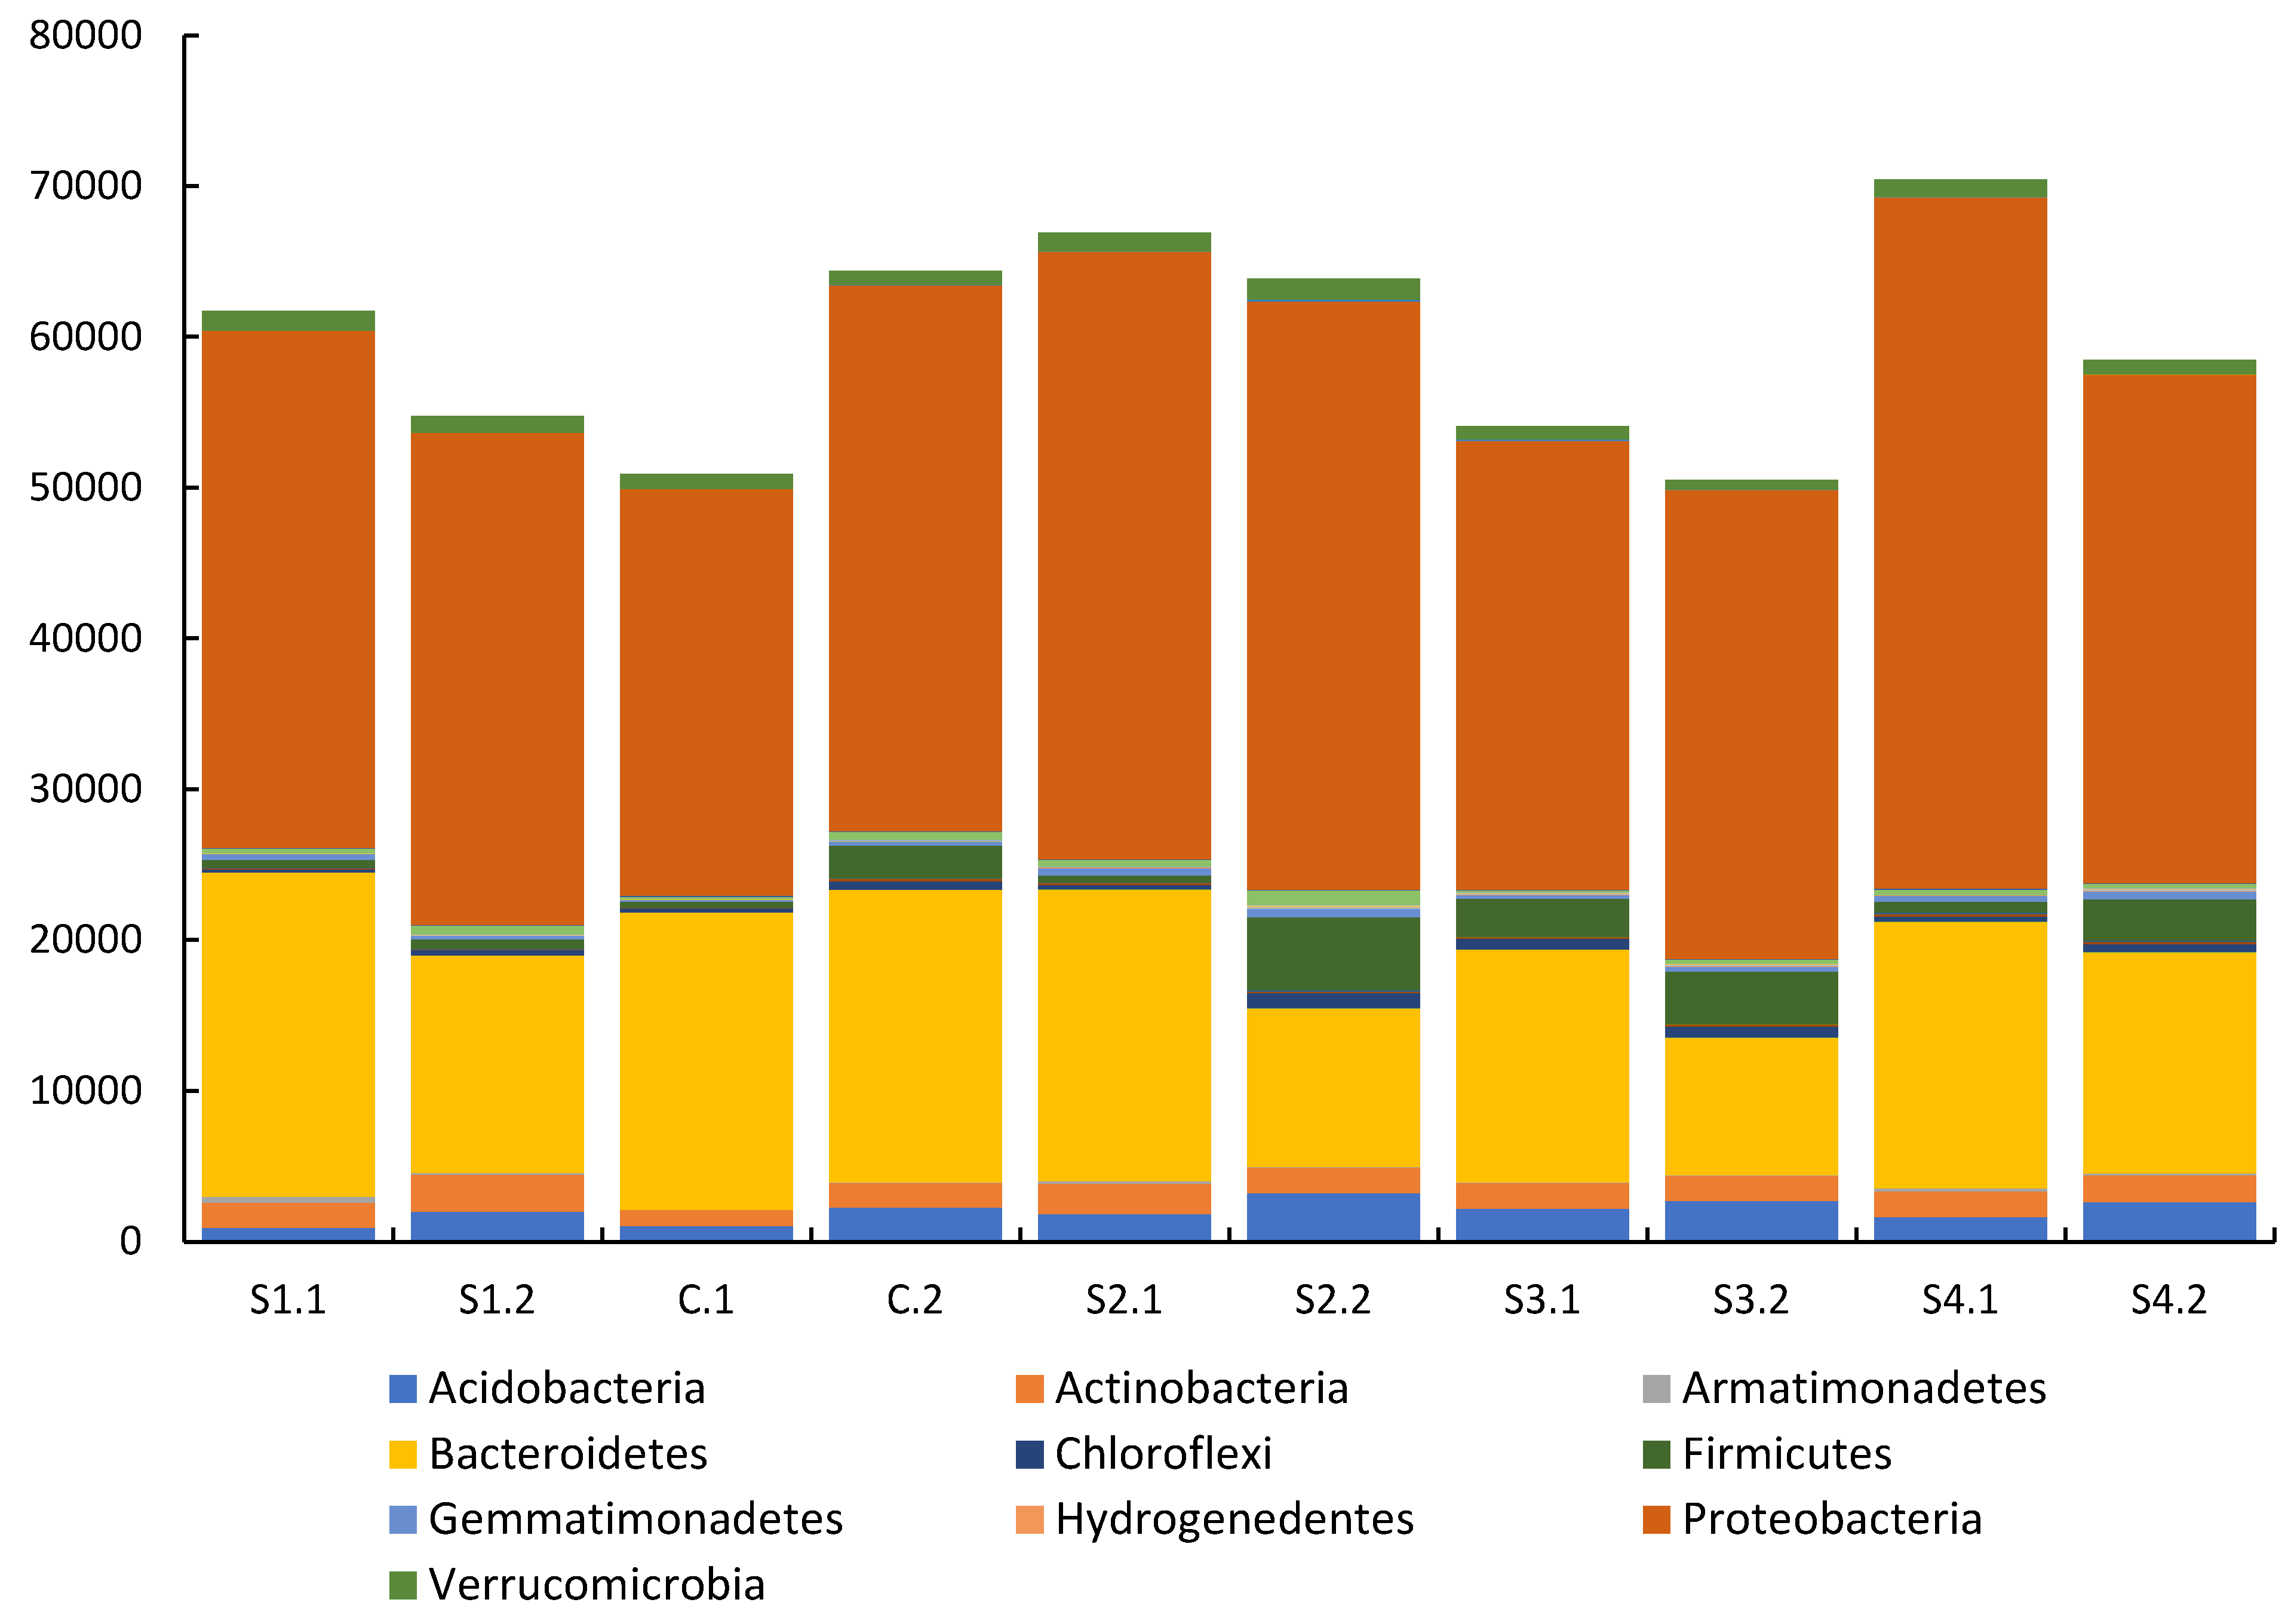
3.3.2. Soil DNA Results
| C | S1 | S2 | S3 | S4 | |
|---|---|---|---|---|---|
| C | - | 1 | 0.25 | 1 | 1 |
| S1 | 1 | - | 0 | 1 | 0 |
| S2 | 0.25 | 0 | - | 0 | -0.25 |
| S3 | 1 | 1 | 0 | - | 0.5 |
| S4 | 1 | 0 | -0.25 | 0.5 | - |
4. Conclusions
Acknowledgments
Conflicts of Interest
Appendix A - Water tests summary (average values with standard deviations)
| pH | EC (mS/cm) | Turbidity (NTU) | TSS (mg/l) | BOD (cfu/100mL) | TC (cfu/100mL) | FC (cfu/100mL) | |
| Tap water (for Control stratum - ) | 6.8 ± 0.05 | 0.23 ± 0.02 | 0.70 ± 0.10 | <5 | <5 | 92 ± 2.50 | <10 |
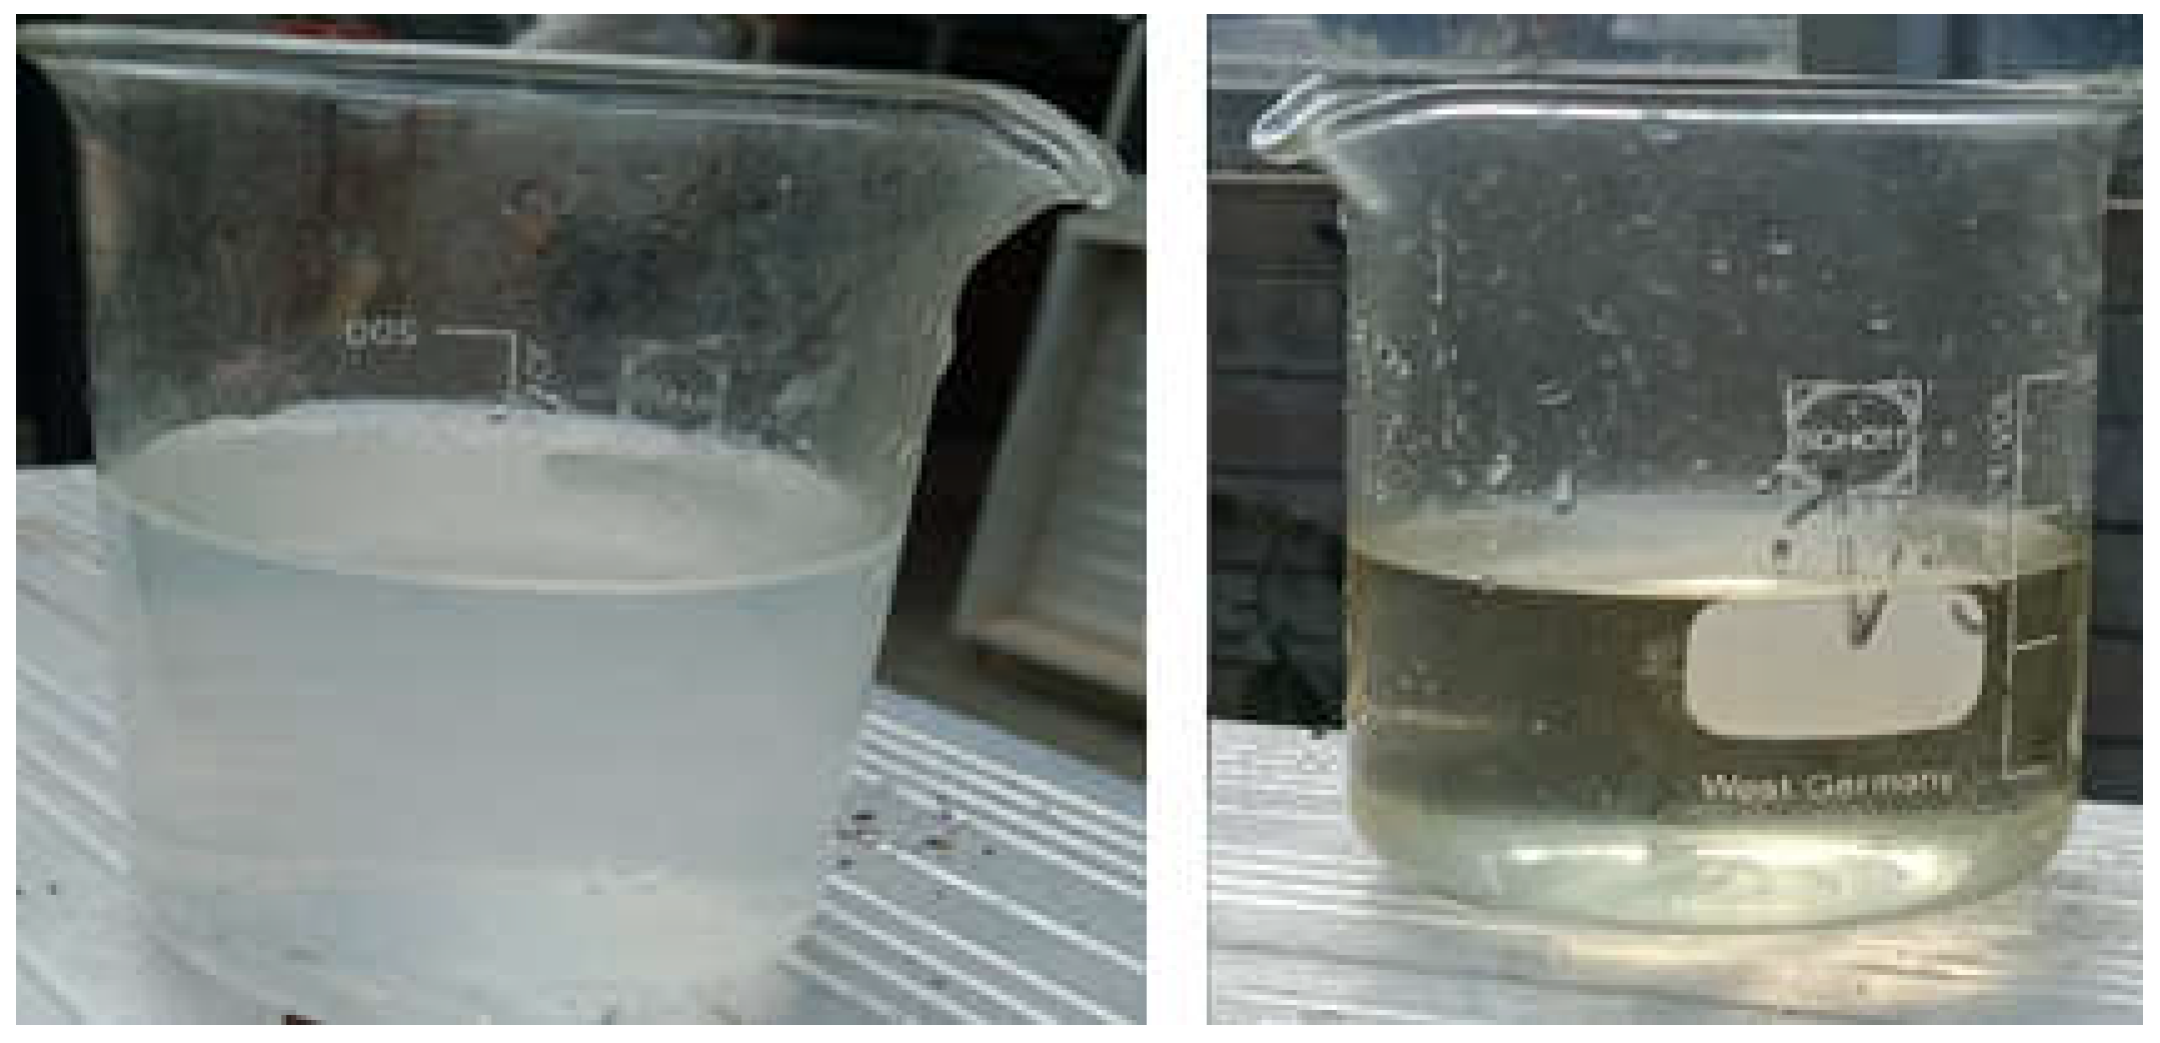
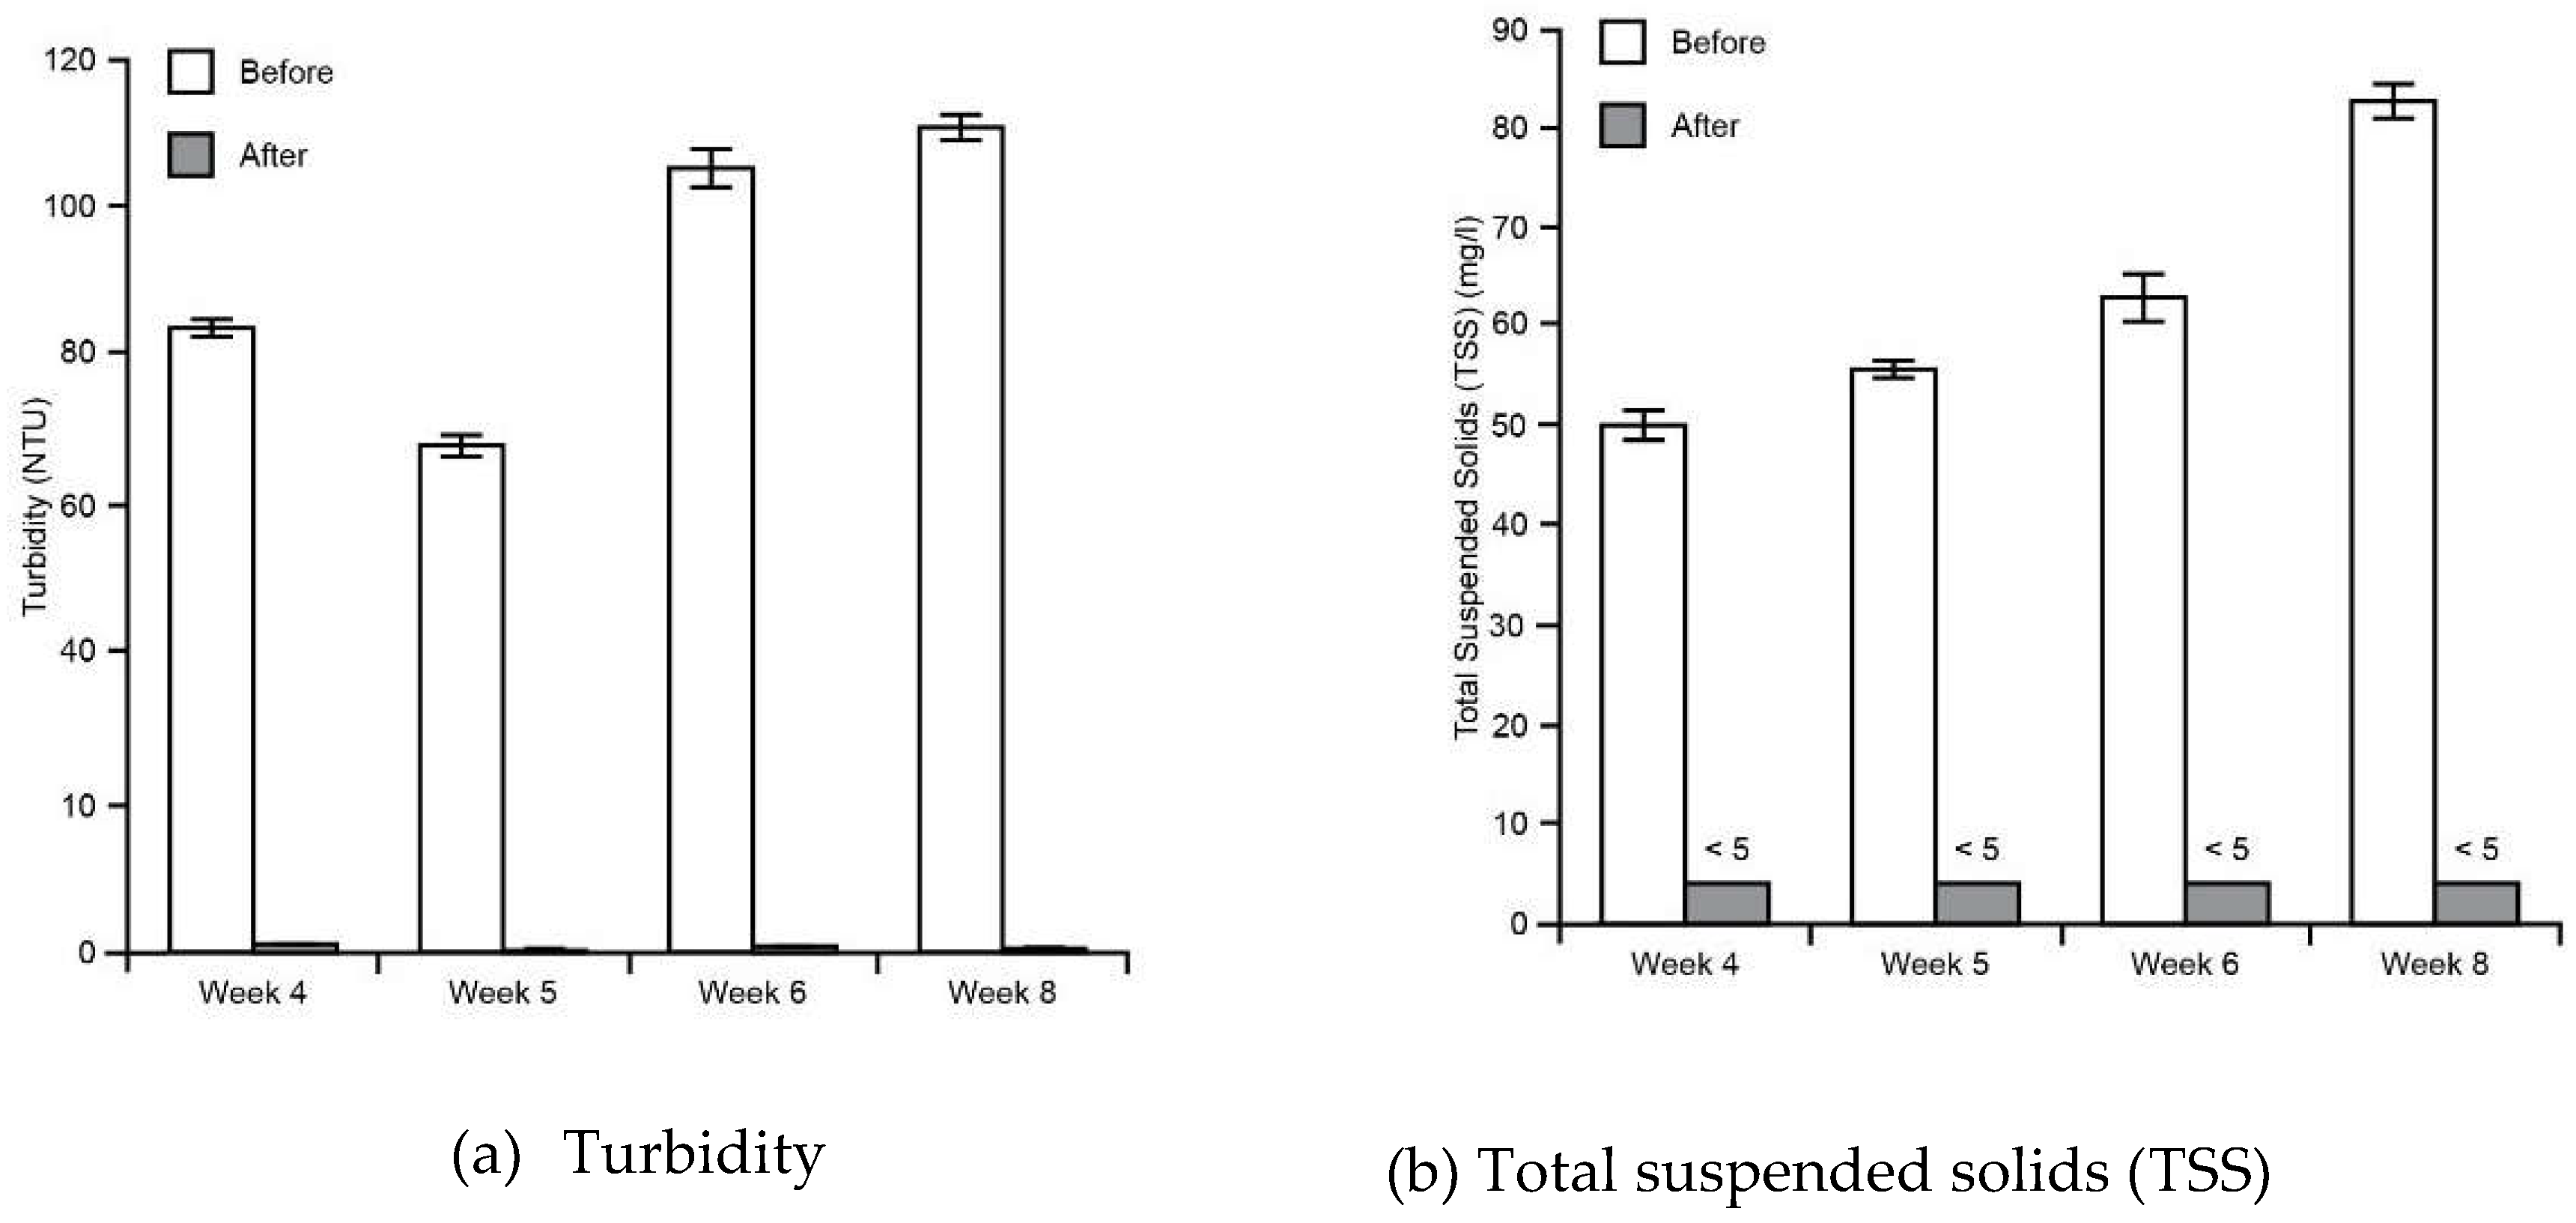
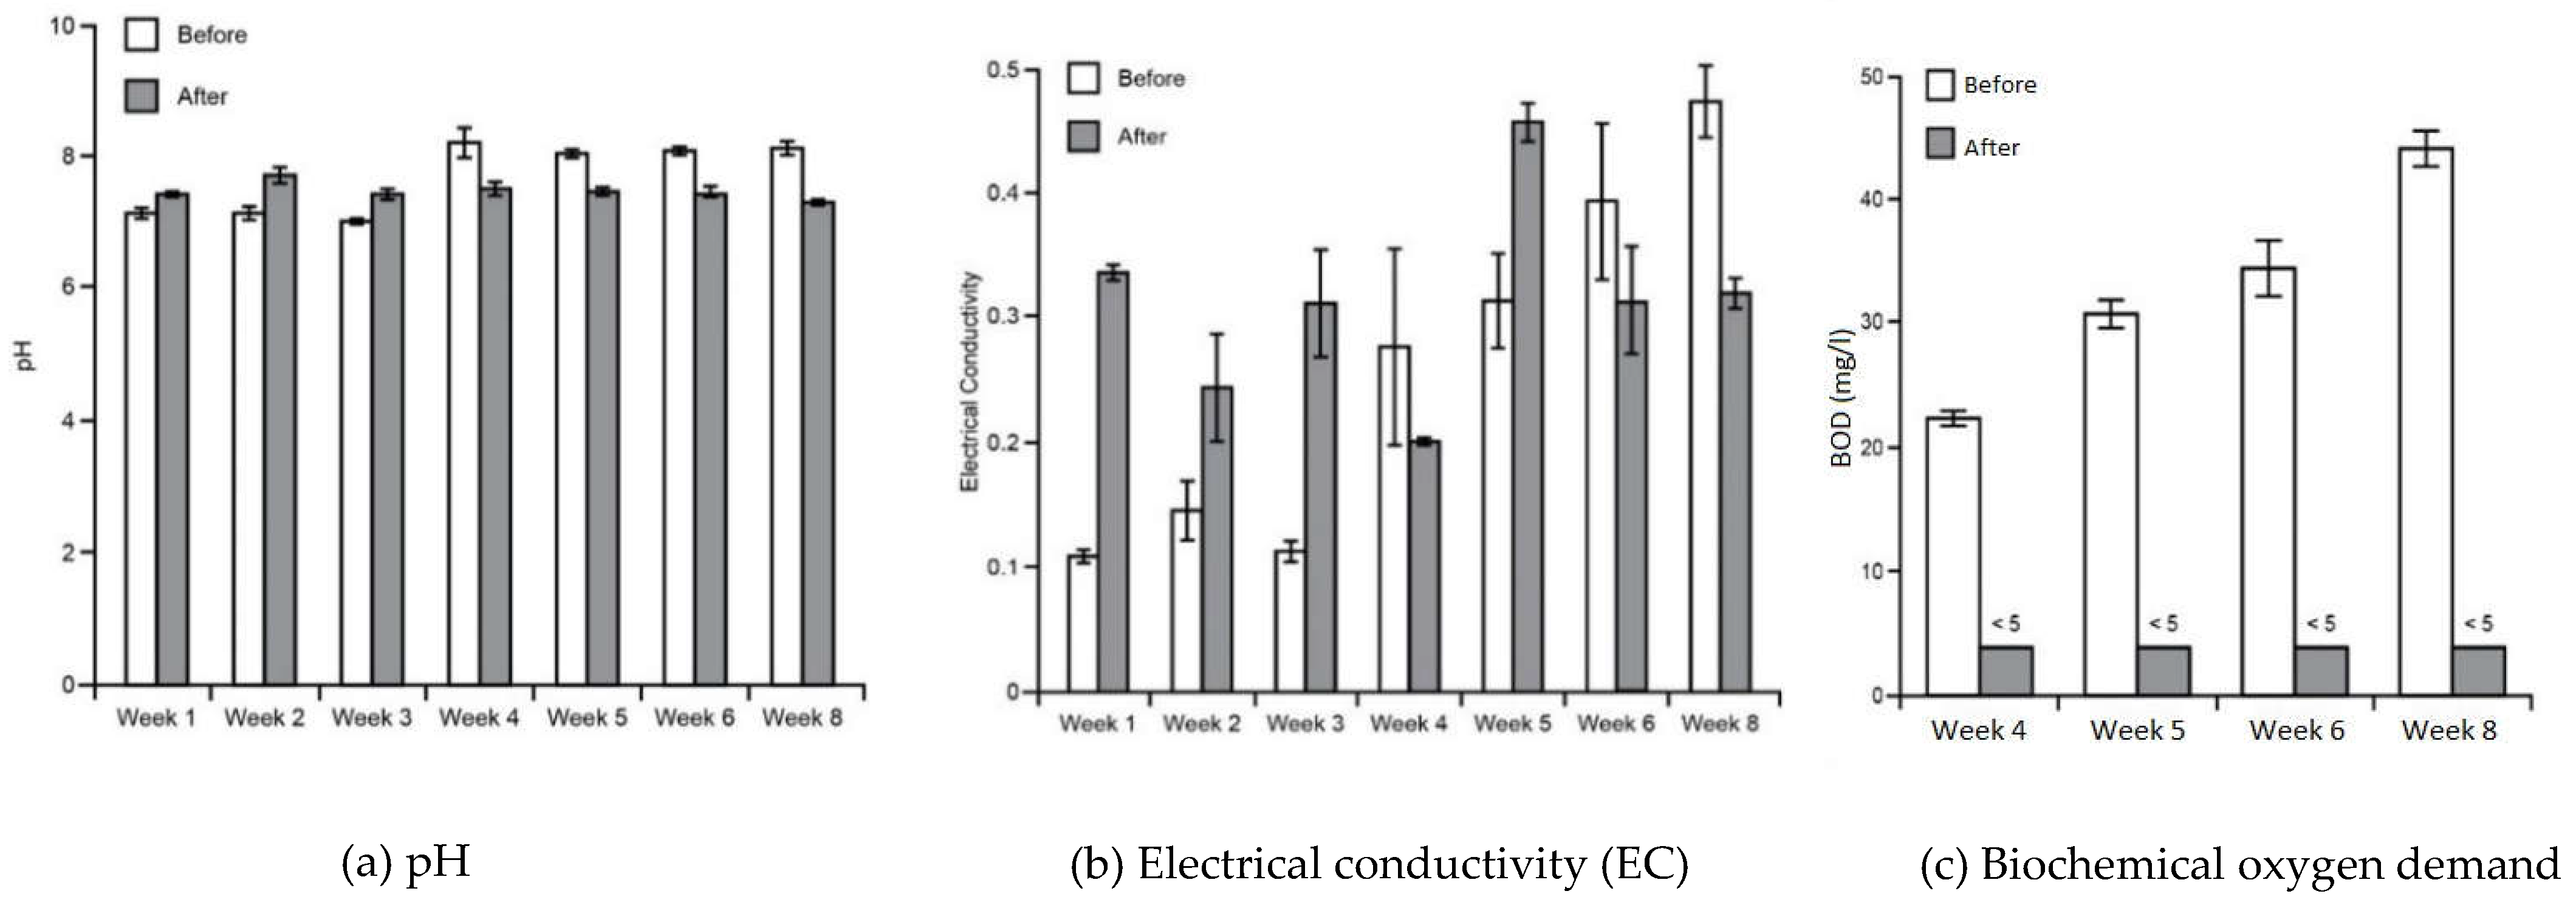
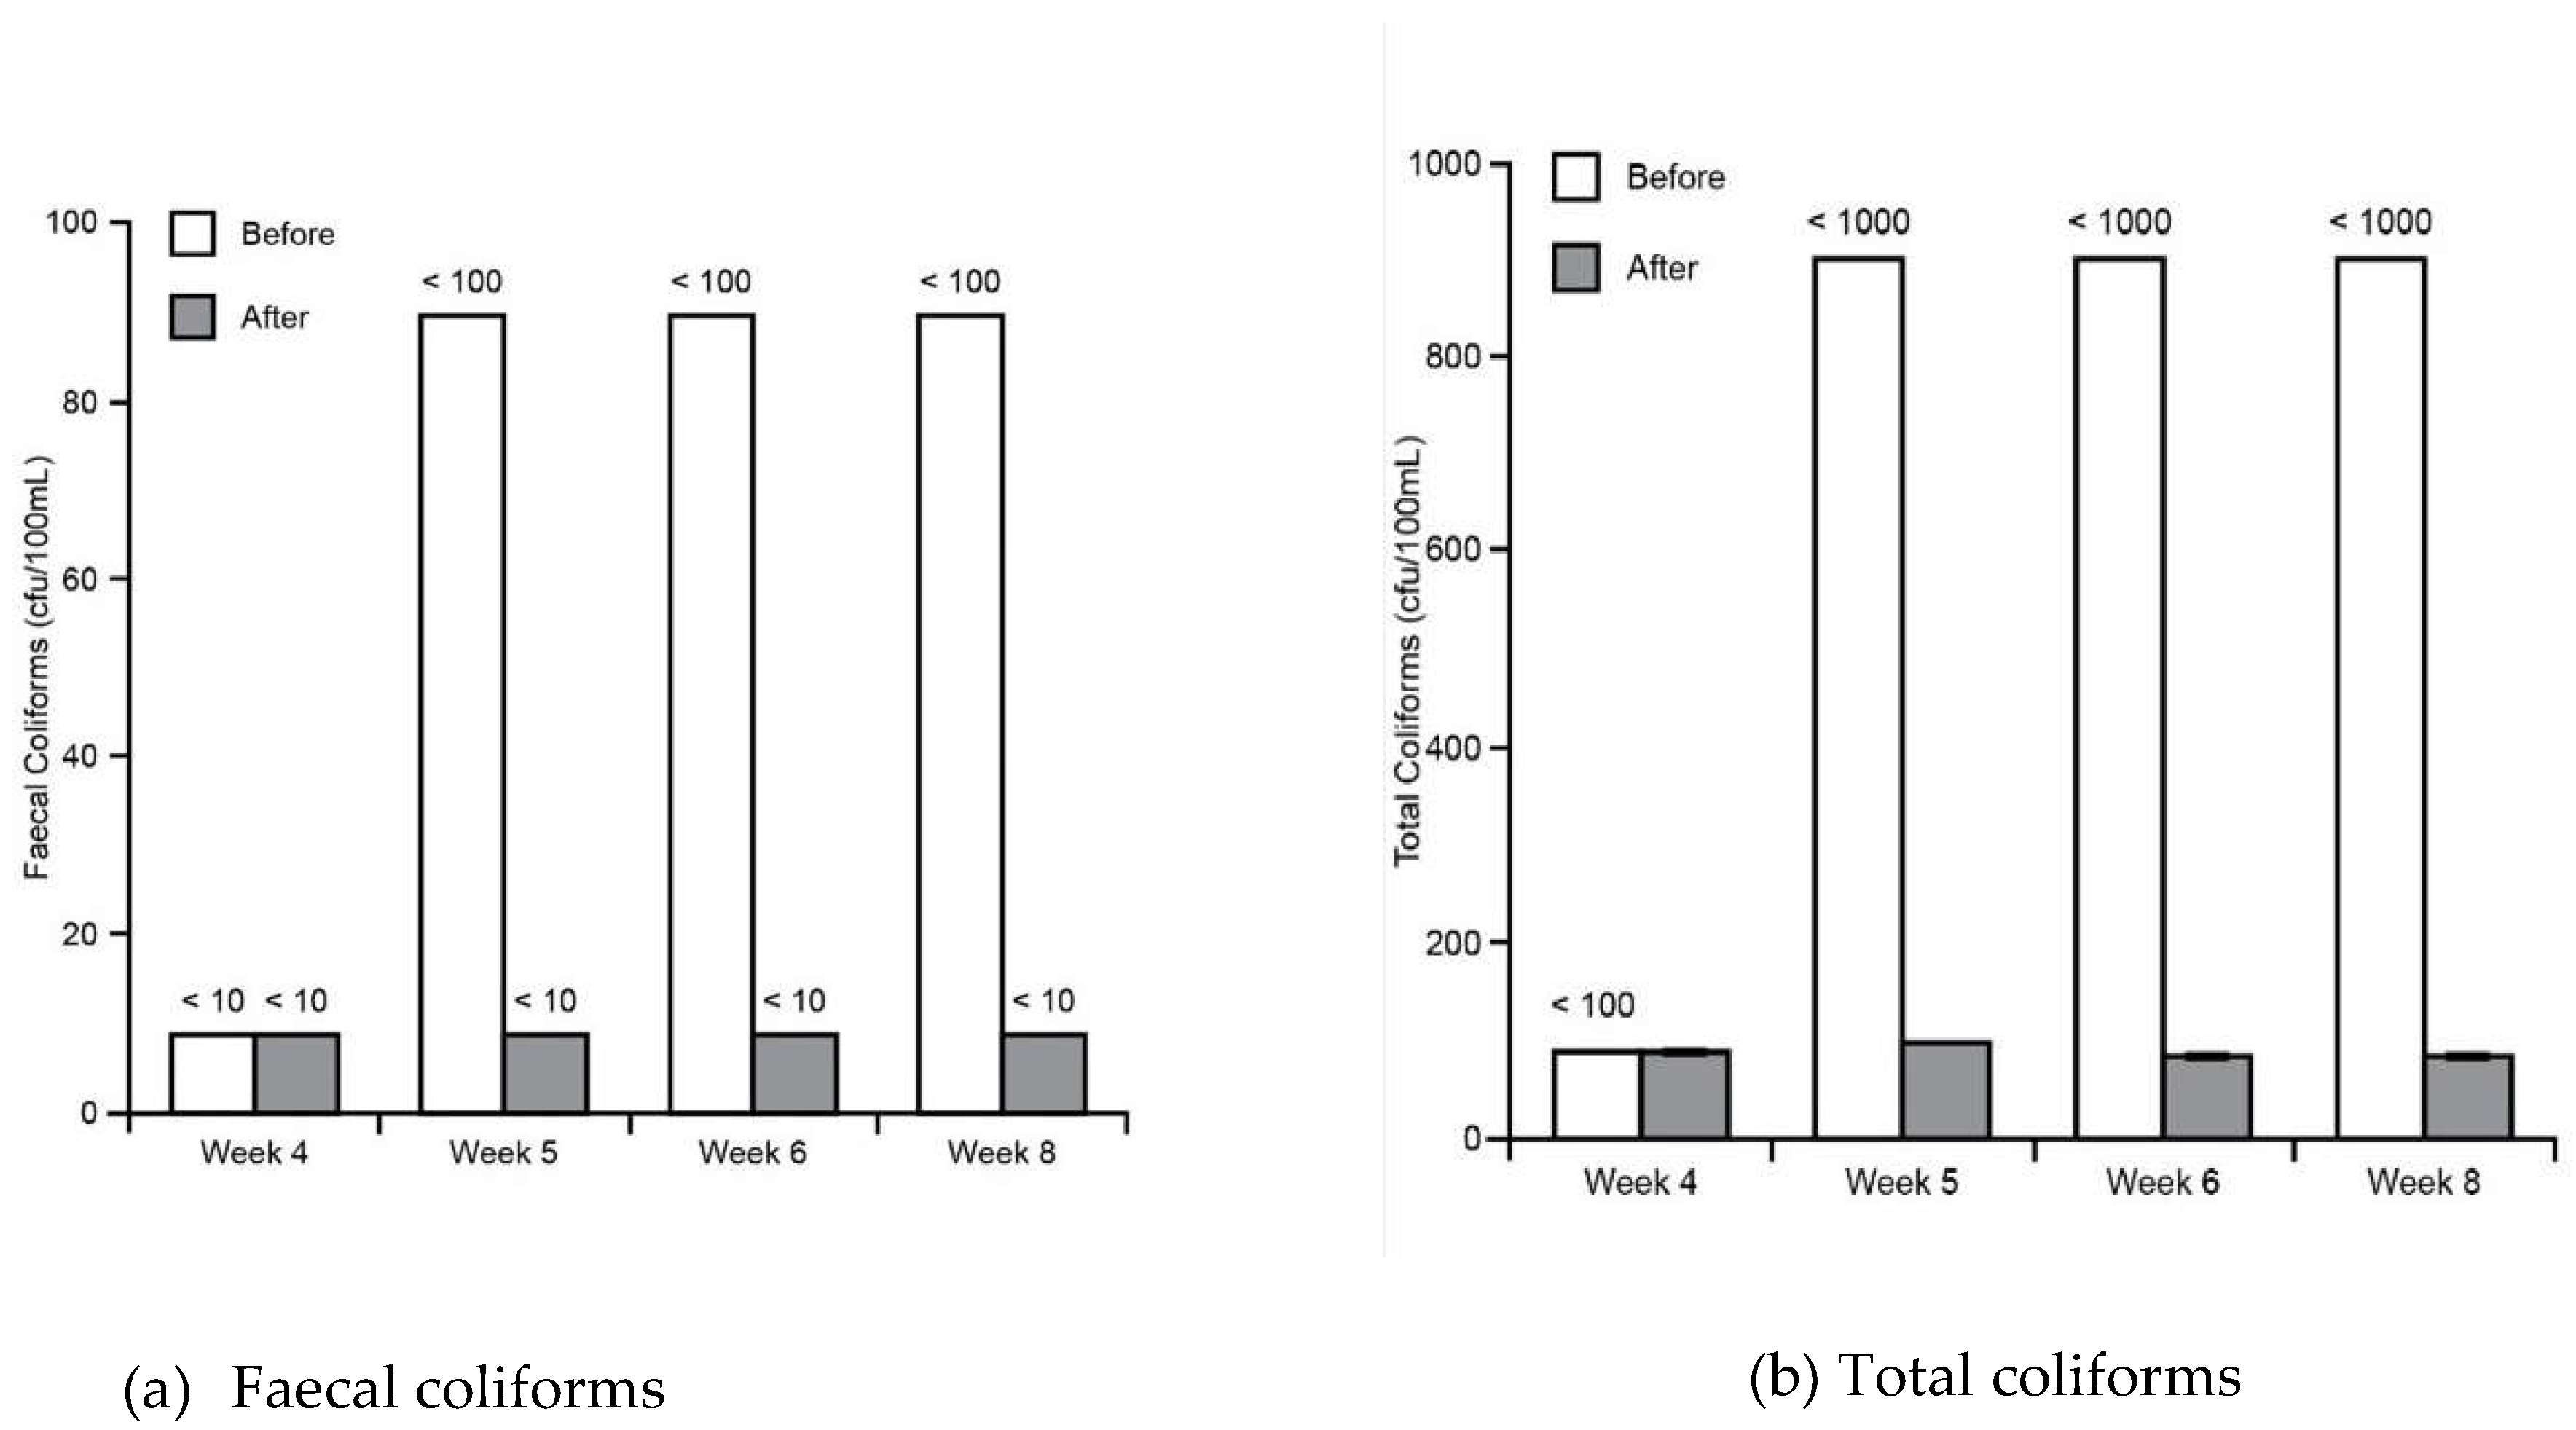
| Sink (before passing wetlands) | 7.14 ± 0.30 (First 3 weeks) | 0.26 ± 0.15 | 92.6 ± 18.18 | 62.6 ± 13 | 33.1 ± 8.43 | <1000 | <100 |
| 8.16 ± 0.21 (Last 5 weeks) | |||||||
| Water tank (after passing wetlands) | 7.57 ± 0.20 (First 3 weeks) | 0.31 ± 0.09 | 0.68 ± 0.31 | <5 | <5 | 90.83 ± 5.56 | <10 |
| 7.46 ± 0.14 (Last 5 weeks) |
Appendix B - Soil tests summary (average values with standard deviations)
| pH | EC | TOC | TN | CEC | MC | Tea Bag Index Tests | Phylum Taxonomy | ||||
| ‘k’ | ‘S’ | Before GW Use | After GW Use | ||||||||
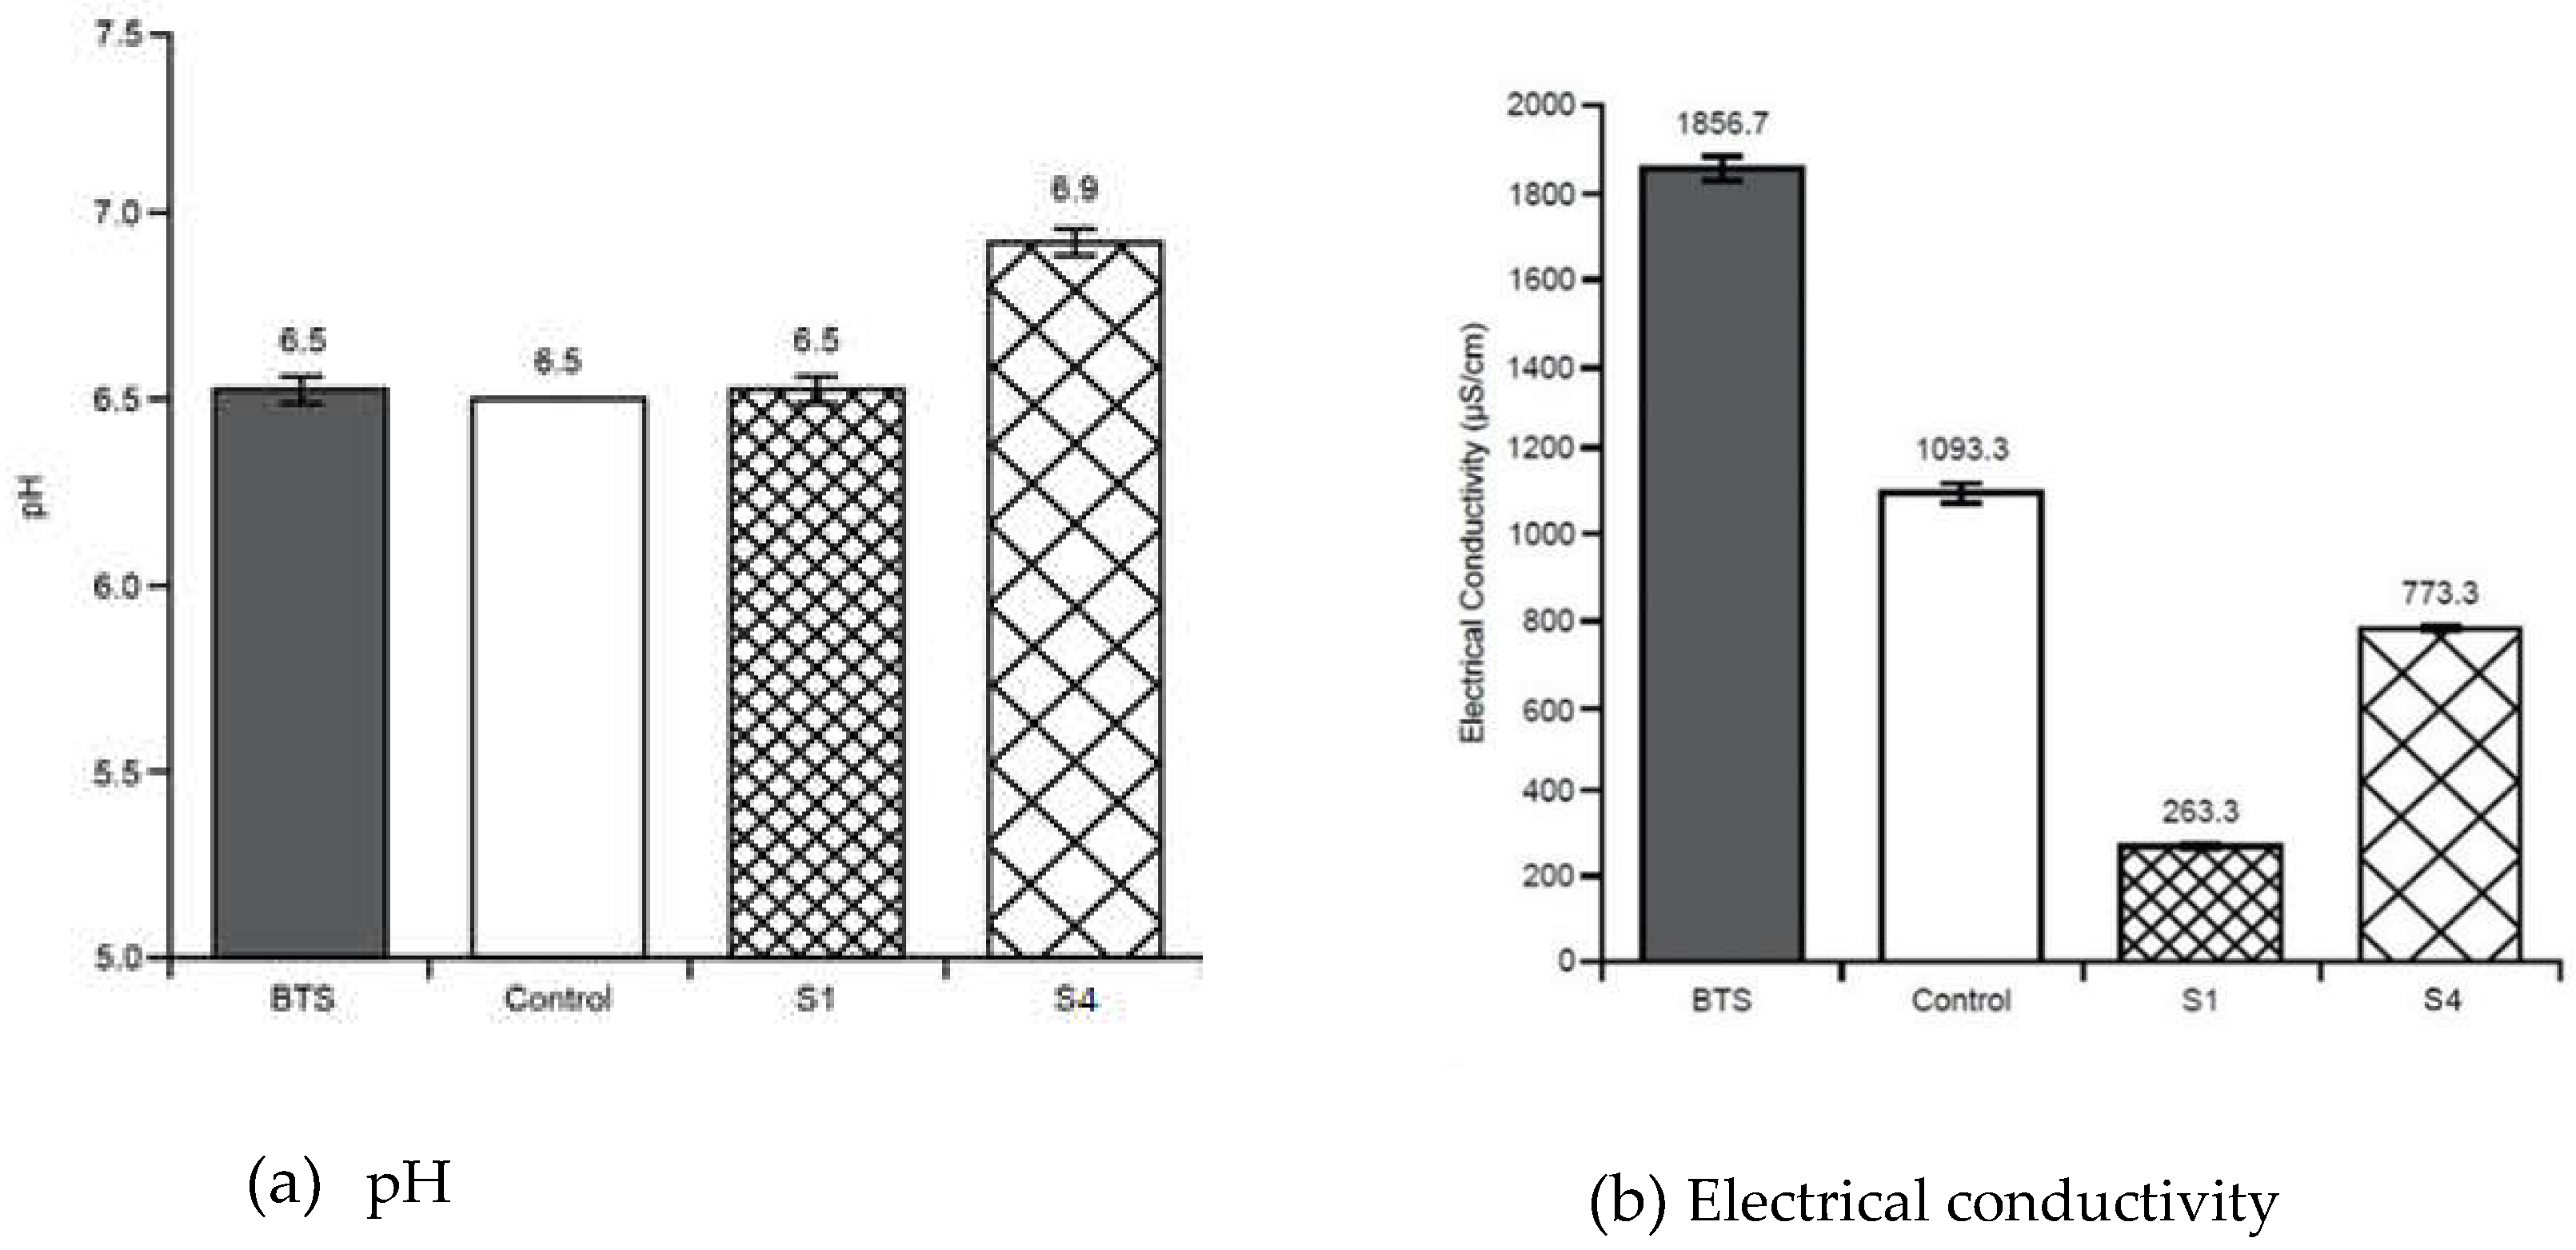
| Before treatment soil sample | 6.53 ± 0.05 | 1865 ± 51.31 |
300000± 10000 | 7100± 265 | 37.6 ± 0.57 |
60.6 ± 0.57 |
- |
- | 38% Bacteroidetes 53% Proteobacteria 2% Acidobacteria 2% Actinobacteria 1% Firmicutes 4% Others |
30% Bacteroidetes 56% Proteobacteria 3.5% Acidobacteria 2.5% Actinobacteria 3.5% Firmicutes 5% Others |
|
| Stratum - S1 | 6.53± 0.03 | 263 ± 3.33 |
266666± 3333 |
8033± 120 | 35.6 ± 0.33 |
67.3 ± 0.33 |
0.17 | 0.10 | 34% Bacteroidetes 55% Proteobacteria 1.5% Acidobacteria 3% Actinobacteria 1% Firmicutes 5% Others |
26% Bacteroidetes 59% Proteobacteria 4% Acidobacteria 4% Actinobacteria 1% Firmicutes 6% Others |
|
| Control Stratum - | 6.50 | 1093 ± 23.3 |
253333± 3333 |
6533± 67 |
38.3 ± 0.33 |
63.3 ± 0.33 |
0.24 | 0.08 | 38% Bacteroidetes 53% Proteobacteria 2% Acidobacteria 2% Actinobacteria 1% Firmicutes 4% Others |
30% Bacteroidetes 56% Proteobacteria 3.5% Acidobacteria 2.5% Actinobacteria 3.5% Firmicutes 5% Others |
|
| Stratum – S2 | - | - | - | - | - | - | - | - | 29% Bacteroidetes 60% Proteobacteria 3% Acidobacteria 3% Actinobacteria 1% Firmicutes 4% Others |
17% Bacteroidetes 61% Proteobacteria 5% Acidobacteria 3% Actinobacteria 8% Firmicutes 6% Others |
|
| Stratum – S3 | - | - | - | - | - | - | - | - | 28% Bacteroidetes 55% Proteobacteria 4% Acidobacteria 3% Actinobacteria 4% Firmicutes 6% Others |
18% Bacteroidetes 61% Proteobacteria 5% Acidobacteria 3% Actinobacteria 6.5% Firmicutes 6% Others |
|
| Stratum – S4 | 6.90 ± 0.05 | 773 ± 5.77 |
31444 ± 5773 |
7500± 100 | 25 | 66.3 ± 0.57 |
0.20 | 0.10 | 25% Bacteroidetes 65% Proteobacteria 2.5% Acidobacteria 2.5% Actinobacteria 1% Firmicutes 4% Others |
25% Bacteroidetes 57% Proteobacteria 5% Acidobacteria 3% Actinobacteria 5% Firmicutes 5% Others |
|
Appendix C - DNA Extraction Technique Used in the Metagen Lab Queensland
Appendix D - Teabag Index (TBI) Calculation Sheets
| Equation (2) | Equation (8) | Equation (2) | Equation (3) | Equation (6) | Equation (7) | |||||||
|
Time (t) |
M0/Mt – Green Tea |
ag (0.6936 to 0.8342) |
k (0.08278 to 0.1422) |
m(t) |
S |
M0/Mt – Rooibos Tea |
ar (0.4111 to 0.7279) |
k (0.0168 to 0.09136) |
m(t) |
Constant ‘k’ |
Variable ‘k’ |
ar |
| 0 | 1 | - | - | 1 | - | 1 | - | - | 1 | - | - | - |
| 7 | 0.61 | 0.72 | 0.10 | 0.62 | 0.14 | 0.79 | 0.55 | 0.03 | 0.86 | 0.06 | 0.05 | 0.59 |
| 25 | 0.31 | 0.72 | 0.10 | 0.32 | 0.14 | 0.62 | 0.55 | 0.03 | 0.65 | 0.05 | 0.03 | 0.49 |
| 35 | 0.31±0.010 | 0.72 | 0.10 | 0.29 | 0.14 | 0.58±0.008 | 0.55 | 0.03 | 0.58 | 0.05±0.001 | 0.02 | 0.39 |
| 246 | 0.25±0.004 | 0.72 | 0.10 | 0.27 | 0.14 | 0.41±0.015 | 0.55 | 0.03 | 0.44 | - | 0.01 | 0.29 |
| Equation (2) | Equation (8) | Equation (2) | Equation (3) | Equation (6) | Equation (7) | |||||||
|
Time (t) |
M0/Mt – Green Tea |
ag (0.6936 to 0.8342) |
k (0.08278 to 0.1422) |
m(t) |
S |
M0/Mt – Rooibos Tea |
ar (0.4111 to 0.7279) |
k (0.0168 to 0.09136) |
m(t) |
Constant ‘k’ |
Variable ‘k’ |
ar |
| 0 | 1 | - | - | 1 | - | 1 | - | - | 1 | - | - | - |
| 7 | 0.58 | 0.76 | 0.11 | 0.58 | 0.09 | 0.77 | 0.56 | 0.05 | 0.82 | 0.07 | 0.07 | 0.56 |
| 25 | 0.26 | 0.76 | 0.11 | 0.28 | 0.09 | 0.56 | 0.56 | 0.05 | 0.57 | 0.07 | 0.05 | 0.50 |
| 35 | 0.26±0.009 | 0.76 | 0.11 | 0.25 | 0.09 | 0.52±0.012 | 0.56 | 0.05 | 0.51 | 0.08±0.003 | 0.03 | 0.30 |
| 246 | 0.23±0.021 | 0.76 | 0.11 | 0.23 | 0.09 | 0.40±0.013 | 0.56 | 0.05 | 0.43 | - | - | - |
| Equation (2) | Equation (8) | Equation (2) | Equation (3) | Equation (6) | Equation (7) | |||||||
|
Time (t) |
M0/Mt – Green Tea |
ag (0.6121 to 0.7858) |
k (0.1064 to 0.2179) |
m(t) |
S |
M0/Mt – Rooibos Tea |
ar (0.2254 to 0.9446) |
k (-0.01546 to 0.09644) |
m(t) |
Constant ‘k’ |
Variable ‘k’ |
ar |
| 0 | 1 | - | - | 1 | - | 1 | - | - | 1 | - | - | - |
| 7 | 0.52 | 0.69 | 0.16 | 0.52 | 0.17 | 0.74 | 0.58 | 0.04 | 0.85 | 0.09 | 0.15 | 0.37 |
| 25 | 0.32 | 0.69 | 0.16 | 0.31 | 0.17 | 0.58 | 0.58 | 0.04 | 0.62 | 0.09 | 0.06 | 0.38 |
| 35 | 0.28±0.010 | 0.69 | 0.16 | 0.30 | 0.17 | 0.56±0.008 | 0.58 | 0.04 | 0.55 | 0.08±0.003 | 0.01 | 0.25 |
| 246 | 0.30±0.057 | 0.69 | 0.16 | 0.30 | 0.17 | 0.35±0.050 | 0.58 | 0.04 | 0.41 | - | - | - |
References
- Water, U. Target 6.3 – Water quality and wastewater. Sustainable Development Goal 6 2022. Available from: https://www.sdg6monitoring.org/indicators/target-63/.
- IUCN, I.U.f.C.o.N. Nature-based Solutions. 2022 [cited 2022. Available from: https://www.iucn.org/commissions/commission-ecosystem-management/our-work/nature-based-solutions.
- Eriksson, E., et al., Characteristics of grey wastewater. Urban Water, 2002. 4(1): p. 85-104.
- UNICEF. Water scarcity. 2022 [cited 2022. Available from: https://www.unicef.org/wash/water-scarcity.
- Boano, F., et al., A review of nature-based solutions for greywater treatment: Applications, hydraulic design, and environmental benefits. Science of The Total Environment, 2020. 711: p. 134731.
- Agency, E.P. Economic Beneifts of Wetlands. 2006. Available from: https://nepis.epa.gov/Exe/ZyNET.exe/2000D2PF.TXT?ZyActionD=ZyDocument&Client=EPA&Index=2006+Thru+2010&Docs=&Query=&Time=&EndTime=&SearchMethod=1&TocRestrict=n&Toc=&TocEntry=&QField=&QFieldYear=&QFieldMonth=&QFieldDay=&IntQFieldOp=0&ExtQFieldOp=0&XmlQuery=&File=D%3A%5Czyfiles%5CIndex%20Data%5C06thru10%5CTxt%5C00000000%5C2000D2PF.txt&User=ANONYMOUS&Password=anonymous&SortMethod=h%7C-&MaximumDocuments=1&FuzzyDegree=0&ImageQuality=r75g8/r75g8/x150y150g16/i425&Display=hpfr&DefSeekPage=x&SearchBack=ZyActionL&Back=ZyActionS&BackDesc=Results%20page&MaximumPages=1&ZyEntry=1&SeekPage=x&ZyPURL.
- Wu, H., et al., A review on the sustainability of constructed wetlands for wastewater treatment: Design and operation. Bioresource Technology, 2015. 175: p. 594-601.
- Yildiz, B.S., 18 - Water and wastewater treatment: biological processes, in Metropolitan Sustainability, F. Zeman, Editor. 2012, Woodhead Publishing. p. 406-428.
- Klancko, R.J., Drinking Water Regulation and Health. Frederick W. Pontius, ed. 2003. John Wiley and Sons, New York. 1,029 pp. $150 cloth. Environmental Practice, 2005. 7(1): p. 56-57.
- Davis, L., A handbook of constructed wetlands: a guide to creating wetlands for: agricultural wastewater, domestic wastewater, coal mine drainage, stormwater in the Mid-Atlantic Region. 1995.
- Halverson, N., Review of Constructed Subsurface Flow vs. Surface Flow Wetlands. 2004.
- Halverson, N., Review of constructed subsurface flow vs. surface flow wetlands. 2004, Savannah River Site (SRS), Aiken, SC (United States).
- Kadlec, R.H. and S. Wallace, Treatment wetlands. 2008: CRC press.
- Stottmeister, U., et al., Effects of plants and microorganisms in constructed wetlands for wastewater treatment. Biotechnology advances, 2003. 22(1-2): p. 93-117.
- Byrne, J., et al., Quantifying the Benefits of Residential Greywater Reuse. Water, 2020. 12(8).
- Hadad, E., et al., Simulation of dual systems of greywater reuse in high-rise buildings for energy recovery and potential use in irrigation. Resources, Conservation and Recycling, 2022. 180: p. 106134.
- J, N., Waste water reuse studies and trial in Canberra. . Desalination. 106(106): p. 399–405.
- Hiltner, L., Uber nevere Erfahrungen und Probleme auf dem Gebiet der Boden Bakteriologie und unter besonderer Beurchsichtigung der Grundungung und Broche. Arbeit. Deut. Landw. Ges. Berlin, 1904. 98: p. 59-78.
- Kuzyakov, Y. and B.S. Razavi, Rhizosphere size and shape: Temporal dynamics and spatial stationarity. Soil Biology and Biochemistry, 2019. 135: p. 343-360.
- Garland, J.L., et al., Graywater processing in recirculating hydroponic systems: phytotoxicity, surfactant degradation, and bacterial dynamics. Water Research, 2000. 34(12): p. 3075-3086.
- Christova-Boal, D., R.E. Eden, and S. McFarlane, An investigation into greywater reuse for urban residential properties. Desalination, 1996. 106(1): p. 391-397.
- Australia, L.S. Testing soils and plants. 2015 [cited 2020. Available from: https://www.landscape.sa.gov.au/mr/publications/testing-soils-and-plants.
- FIEMG, Construction industry chamber, in Construction Sustainability Guide. 2008. p. 60.
- Proença, L.C. and E. Ghisi, Assessment of Potable Water Savings in Office Buildings Considering Embodied Energy. Water Resources Management, 2013. 27(2): p. 581-599.
- Couto, E.d.A.d., et al., Greywater treatment in airports using anaerobic filter followed by UV disinfection: an efficient and low cost alternative. Journal of Cleaner Production, 2015. 106: p. 372-379.
- Leonard, M., et al., Field study of the composition of greywater and comparison of microbiological indicators of water quality in on-site systems. Environmental Monitoring and Assessment, 2016. 188(8): p. 475.
- Judd, B.J.A.P.P.J.R.S.S., Grey water characterisation and its impact on the selection and operation of technologies for urban reuse. Water science and technology : a journal of the International Association on Water Pollution Research, 2004. 50(2): p. 157–164.
- Hourlier, F., et al., Formulation of synthetic greywater as an evaluation tool for wastewater recycling technologies. Environmental technology, 2010. 31: p. 215-23.
- Harsha, S.F.A., Deletic; Belinda E. Hatt; Perran L.M., Cook, Nitrogen removal in greywater living walls: Insights into the governing mechanisms. Water, 2018. 10(4).
- Ghaitidak, D.M. and K.D. Yadav, Characteristics and treatment of greywater—a review. Environmental Science and Pollution Research, 2013. 20(5): p. 2795-2809.
- Michael, L.P., Coghlan, Domestic water use study in Perth, Western Australia 1998-2001. 2003, Water corporation: Perth Australia.
- Gopalsamy, P., G. Edwin, and N. Muthu, Constructed Wetlands for the Treatment of Domestic Grey Water: An Instrument of the Green Economy to Realize the Millennium Development Goals. 2013. p. 313-321.
- Edwin, G.A., P. Gopalsamy, and N. Muthu, Characterization of domestic gray water from point source to determine the potential for urban residential reuse: a short review. Applied Water Science, 2014. 4(1): p. 39-49.
- Friedler, E., Quality of Individual Domestic Greywater Streams and its Implication for On-Site Treatment and Reuse Possibilities. Environmental Technology, 2004. 25(9): p. 997-1008.
- Shaikh, I.N. and M.M. Ahammed, Quantity and quality characteristics of greywater: A review. Journal of Environmental Management, 2020. 261: p. 110266.
- BANACH, J.L. and H.J. van der FELS-KLERX, Microbiological Reduction Strategies of Irrigation Water for Fresh Produce. Journal of Food Protection, 2020. 83(6): p. 1072-1087.
- Saroj BP, S.M.G., Performance of greywater treatment plant by the economical way for Indian rural development. International Journal of ChemTech Research, 2011. 3(4): p. 1808–1815.
- Samayamanthula, D.R., C. Sabarathinam, and H. Bhandary, Treatment and effective utilization of greywater. Applied Water Science, 2019. 9(4): p. 90.
- Oktor, K. and D. Çelik, Treatment of wash basin and bathroom greywater with Chlorella variabilis and reusability. Journal of Water Process Engineering, 2019. 31: p. 100857.
- Zipf, M.S., I.G. Pinheiro, and M.G. Conegero, Simplified greywater treatment systems: Slow filters of sand and slate waste followed by granular activated carbon. Journal of Environmental Management, 2016. 176: p. 119-127.
- Al-Jayyousi, O.R., Greywater reuse: towards sustainable water management. Desalination, 2003. 156(1): p. 181-192.
- Jefferson, B., et al., Grey water characterisation and its impact on the selection and operation of technologies for urban reuse. Water Science and Technology, 2004. 50(2): p. 157-164.
- Jamrah, A., et al., Evaluating greywater reuse potential for sustainable water resources management in Oman. Environmental Monitoring and Assessment, 2007. 137(1): p. 315.
- Ziemba, C., et al., Chemical composition, nutrient-balancing and biological treatment of hand washing greywater. Water Research, 2018. 144: p. 752-762.
- Division, U.S.E.P.A.O.o.W.M.M.S., N.R.M.R.L.T. Transfer, and S. Division, Guidelines for water reuse. 2004: US Environmental Protection Agency.
- Health, N.S.W., Greywater reuse in Sewered single Domestic Premises. Sydney: NSW Government. 2000.
- Donovan, J.F. and J.E. Bates, Guidelines for Water Refuse. 1980.
- James, D., et al., Grey water reclamation for urban non-potable reuse - challenges and solutions a review. 2016.
- Sanz, L.A. and B.M. Gawlik, Water reuse in Europe. European Commission–Joint Research Centre–Institute for Environment and Sustainability, 2014.
- Bastian, R. and D. Murray, Guidelines for water reuse. EPA Office of Research and Development: Washington, DC, USA, 2012.
- Ltd, S.Q.P. Fact Sheets Microbial Biomass. 2020. Available from: http://www.soilquality.org.au/factsheets/microbial-biomass-qld#:~:text=Soil%20microbial%20biomass%20(bacteria%2C%20fungi,dioxide%20and%20plant%20available%20nutrients.
- Hartmann, M., et al., Distinct soil microbial diversity under long-term organic and conventional farming. The ISME Journal, 2015. 9(5): p. 1177-1194.
- Makarov, M.I., et al., Determination of carbon and nitrogen in microbial biomass of southern-Taiga soils by different methods. Eurasian Soil Science, 2016. 49(6): p. 685-695.
- Kandeler, E., Chapter 7 - Physiological and Biochemical Methods for Studying Soil Biota and Their Functions, in Soil Microbiology, Ecology and Biochemistry (Fourth Edition), E.A. Paul, Editor. 2015, Academic Press: Boston. p. 187-222.
- Zhang, Z., et al., Soil bacterial quantification approaches coupling with relative abundances reflecting the changes of taxa. Scientific reports, 2017. 7(1): p. 4837-4837.
- Phillips, K. Methods of Soil Analysis Using Spectrophotometric Technology. 2015. Available from: https://blog.hunterlab.com/blog/color-measurement/methods-soil-analysis-using-spectrophotometric-technology/#:~:text=Compared%20to%20other%20methods%20of,of%20various%20soil%20materials%20simultaneously.
- Ben-Dor, E., et al., Imaging Spectrometry for Soil Applications, in Advances in Agronomy. 2008, Academic Press. p. 321-392.
- Chon, N.Q., Soil microbial biomass. 2021, Eurofins.
- Berezin, S., et al., Replacing a Century Old Technique - Modern Spectroscopy Can Supplant Gram Staining. Scientific reports, 2017. 7(1): p. 3810-3810.
- Assadi, Y., M.A. Farajzadeh, and A. Bidari, 2.10 - Dispersive Liquid–Liquid Microextraction, in Comprehensive Sampling and Sample Preparation, J. Pawliszyn, Editor. 2012, Academic Press: Oxford. p. 181-212.
- Quideau, S.A., et al., Extraction and Analysis of Microbial Phospholipid Fatty Acids in Soils. Journal of visualized experiments : JoVE, 2016(114): p. 54360.
- Keuskamp, J.A., et al., Tea Bag Index: a novel approach to collect uniform decomposition data across ecosystems. Methods in Ecology and Evolution, 2013. 4(11): p. 1070-1075.
- Zwolinski, M., DNA Sequencing: Strategies for Soil Microbiology. Soil Science Society of America Journal - SSSAJ, 2007. 71.
- Alberts B; Johnson A; Lewis J, e.a., Isolating, Cloning, and Sequencing DNA, in Molecular Biology of the Cell. 2002, Garland Science: New York.
- Oleg A. Shchelochkov. Primer. 2022. Available from: https://www.genome.gov/genetics-glossary/Primer.
- Martins, I.S., et al., Ant taxonomic and functional beta-diversity respond differently to changes in forest cover and spatial distance. Basic and Applied Ecology, 2022. 60: p. 89-102.
- Willis, A.D., Rarefaction, Alpha Diversity, and Statistics. Frontiers in Microbiology, 2019. 10.
- Moore, J.C., Diversity, Taxonomic versus Functional, in Encyclopedia of Biodiversity (Second Edition), S.A. Levin, Editor. 2013, Academic Press: Waltham. p. 648-656.
- Knight, C.A.L.R., Species divergence and the measurement of microbial diversity. Federation of European Microbiological Societies FEMS, Microbiol Rev 2008. 32: p. 557–578.
- Choudhuri, S., Chapter 9 - Phylogenetic Analysis**The opinions expressed in this chapter are the author’s own and they do not necessarily reflect the opinions of the FDA, the DHHS, or the Federal Government, in Bioinformatics for Beginners, S. Choudhuri, Editor. 2014, Academic Press: Oxford. p. 209-218.
- Sirami, C., Biodiversity in heterogeneous and dynamic landscapes, in Oxford Research Encyclopedia of Environmental Science. 2016.
- Morris, E.K., et al., Choosing and using diversity indices: insights for ecological applications from the German Biodiversity Exploratories. Ecology and evolution, 2014. 4(18): p. 3514-3524.
- Cho, J.C. and J.M. Tiedje, Bacterial species determination from DNA-DNA hybridization by using genome fragments and DNA microarrays. Applied and environmental microbiology, 2001. 67(8): p. 3677-3682.
- Janssen, D. Choosing Clay or Plastic Pots for Plants. 2022. Available from: https://lancaster.unl.edu/hort/articles/2002/clay-or-plastic-pots.
- Bondall. Silasec - Waterproofing Cement Paint. 2021. Available from: https://www.bondall.com/concrete-additives/silasec/.
- Wolverton, B.C. and J.D. Wolverton, Growing Clean Water: Nature's Solution to Water Pollution. 2001: WES, Incorporated.
- Chowdhury, R. and J. Sulaiman Abaya, An Experimental Study of Greywater Irrigated Green Roof Systems in an Arid Climate. Journal of Water Management Modeling, 2018. 2018.
- Pradhan, S., S.G. Al-Ghamdi, and H.R. Mackey, Greywater treatment by ornamental plants and media for an integrated green wall system. International Biodeterioration & Biodegradation, 2019. 145: p. 104792.
- Oh, K.S., et al., Optimizing the in-line ozone injection and delivery strategy in a multistage pilot-scale greywater treatment system: System validation and cost-benefit analysis. Journal of Environmental Chemical Engineering, 2015. 3(2): p. 1146-1151.
- Keuskamp, J.A., et al., Tea Bag Index: a novel approach to collect uniform decomposition data across ecosystems. Methods in Ecology and Evolution, 2013. 4(11): p. 1070-1075.
- Dossou-Yovo, W., et al., Tea Bag Index to Assess Carbon Decomposition Rate in Cranberry Agroecosystems. Soil Systems, 2021. 5(3): p. 44.
- Prescott, C.E., Litter decomposition: what controls it and how can we alter it to sequester more carbon in forest soils? Biogeochemistry, 2010. 101(1): p. 133-149.
- Berg, B. and V. Meentemeyer, Litter quality in a north European transect versus carbon storage potential. Plant and Soil, 2002. 242(1): p. 83-92.
- Soest, P.V., Use of detergents in the analysis of fibrous feeds. II. A rapid method for the determination of fiber and lignin. Journal of the Association of official Agricultural Chemists, 1963. 46(5): p. 829-835.
- Australia, M. 2021. Available from: https://metagen.com.au/.
- MicrobiomeAnalyst. 2021. Available from: https://www.microbiomeanalyst.ca/.
- R-Project. 2021. Available from: https://www.r-project.org/.
- McInnes, L., J. Healy, and J. Melville, Umap: Uniform manifold approximation and projection for dimension reduction. arXiv preprint arXiv:1802.03426, 2018.
- Van der Maaten, L. and G. Hinton, Visualizing data using t-SNE. Journal of machine learning research, 2008. 9(11).
- Xiao, H., J. Liu, and F. Li, Both alpha and beta diversity of nematode declines in response to moso bamboo expansion in south China. Applied Soil Ecology, 2023. 183: p. 104761.
- Association, I.W. Simple Options to Remove Turbidity. 2022. Available from: https://www.iwapublishing.com/news/simple-options-remove-turbidity.
- Pinto, U., B.L. Maheshwari, and H.S. Grewal, Effects of greywater irrigation on plant growth, water use and soil properties. Resources, Conservation and Recycling, 2010. 54(7): p. 429-435.
- Merhaut, D.J. Get Cultured: Monitoring electrical conductivity of irrigation water and rooting media. 2022. Available from: https://ucnfanews.ucanr.edu/Articles/Get_Cultured/Monitoring_electrical_conductivity_of_irrigation_water_and_rooting_media_593/.
- Delzer, G. and S. McKenzie, FIVE-DAY BIOCHEMICAL 7.0 OXYGEN DEMAND.
- Kritzberg, E.S., et al., Browning of freshwaters: Consequences to ecosystem services, underlying drivers, and potential mitigation measures. Ambio, 2020. 49(2): p. 375-390.
- Bolan, N.S. and K. Kandaswamy, pH, in Encyclopedia of Soils in the Environment, D. Hillel, Editor. 2005, Elsevier: Oxford. p. 196-202.
- Fearnside, P.M., The effects of cattle pasture on soil fertility in the Brazilian Amazon: consequences for beef production sustainability. Tropical Ecology, 1980. 21(1): p. 125-137.
- Bai, W., L. Kong, and A. Guo, Effects of physical properties on electrical conductivity of compacted lateritic soil. Journal of Rock Mechanics and Geotechnical Engineering, 2013. 5(5): p. 406-411.
- services, B.p. Electrical Conductivity Conversion Chart. 2022. Available from: http://bps.net.au/cms/wp-content/uploads/2015/04/EC-Conversion-Chart.pdf.
- coalition, S.D.s.h. Soil Electrical Conductivity. 2022. Available from: https://www.sdsoilhealthcoalition.org/technical-resources/chemical-properties/soil-electrical-conductivity/.
- Doran, J.W. and T.B. Parkin, Quantitative Indicators of Soil Quality: A Minimum Data Set, in Methods for Assessing Soil Quality. 1997. p. 25-37.
- Lal, R., Soil health and carbon management. Food and Energy Security, 2016. 5(4): p. 212-222.
- Lal, R., Societal value of soil carbon. Journal of Soil and Water Conservation, 2014. 69(6): p. 186A-192A.
- Binkley, D. How Nitrogen-Fixing Trees Change Soil Carbon. in Tree Species Effects on Soils: Implications for Global Change. 2005. Dordrecht: Springer Netherlands.
- Organization, S.Q. Cations and Cation Exchange Capacity. 2022. Available from: https://www.soilquality.org.au/factsheets/cations-and-cec-tas.
- Neina, D., The role of soil pH in plant nutrition and soil remediation. Applied and Environmental Soil Science, 2019. 2019.
- Kopelman, R., Fractal Reaction Kinetics. Science, 1988. 241(4873): p. 1620-1626.
- Duddigan, S., et al., Chemical underpinning of the tea bag index: an examination of the decomposition of tea leaves. Applied and Environmental Soil Science, 2020. 2020.
- Chao, A. and C.-H. Chiu, Species Richness: Estimation and Comparison, in Wiley StatsRef: Statistics Reference Online. p. 1-26.
- Xia, Y., J. Sun, and D.-G. Chen, Statistical analysis of microbiome data with R. Vol. 847. 2018: Springer.
- Whitehead, H. and S. Dufault, Techniques for analyzing vertebrate social structure using identified individuals. Adv Stud Behav, 1999. 28: p. 33-74.
- Zheng, T., et al., Greywater: Understanding biofilm bacteria succession, pollutant removal and low sulfide generation in small diameter gravity sewers. Journal of Cleaner Production, 2020. 268: p. 122426.
- Zhang, C., et al., The Bacterial Community Diversity of Bathroom Hot Tap Water Was Significantly Lower Than That of Cold Tap and Shower Water. Frontiers in Microbiology, 2021. 12.
- Janssen, P.H., Identifying the Dominant Soil Bacterial Taxa in Libraries of 16S rRNA and 16S rRNA Genes. Applied and Environmental Microbiology, 2006. 72(3): p. 1719-1728.
- Spain, A.M., L.R. Krumholz, and M.S. Elshahed, Abundance, composition, diversity and novelty of soil Proteobacteria. The ISME Journal, 2009. 3(8): p. 992-1000.
- Fierer, N., M.A. Bradford, and R.B. Jackson, TOWARD AN ECOLOGICAL CLASSIFICATION OF SOIL BACTERIA. Ecology, 2007. 88(6): p. 1354-1364.
- Eilers, K.G., et al., Shifts in bacterial community structure associated with inputs of low molecular weight carbon compounds to soil. Soil Biology and Biochemistry, 2010. 42(6): p. 896-903.
- Wolińska, A., et al., Bacteroidetes as a sensitive biological indicator of agricultural soil usage revealed by a culture-independent approach. Applied Soil Ecology, 2017. 119: p. 128-137.
- Sciences, L. 16S rRNA Gene Sequencing for identification, classification and quantitation of microbes. 2021. Available from: https://lcsciences.com/16s-rrna-gene-sequencing-for-identification-classification-and-quantitation-of-microbes/#:~:text=16S%20rRNA%20gene%20sequencing%20is,(ex%20human%20gut%20microbiome).
- Lever, M.A., et al., A modular method for the extraction of DNA and RNA, and the separation of DNA pools from diverse environmental sample types. Frontiers in Microbiology, 2015. 6.
- Oberacker, P., et al., Bio-On-Magnetic-Beads (BOMB): Open platform for high-throughput nucleic acid extraction and manipulation. PLOS Biology, 2019. 17(1): p. e3000107.
- PORAZINSKA, D.L., et al., Evaluating high-throughput sequencing as a method for metagenomic analysis of nematode diversity. Molecular Ecology Resources, 2009. 9(6): p. 1439-1450.
- Takahashi, S., et al., Development of a Prokaryotic Universal Primer for Simultaneous Analysis of Bacteria and Archaea Using Next-Generation Sequencing. PLOS ONE, 2014. 9(8): p. e105592.
- Quast, C., et al., The SILVA ribosomal RNA gene database project: Improved data processing and web-based tools. Nucleic acids research, 2012. 41.




| GW Class | Origin | Products | Percentage of Total GW |
|---|---|---|---|
| Class A (LGW) | Washbasin | Hand Washing soap, toothpaste, body care products, shaving waste, hair |
50 – 60% [3] |
| Class B (LGW) | Bathroom | Body wash soap, shampoos, body care products, hair, body fats, lint, and traces of urine | |
| Class C (DGW) | Kitchen Sink | Food residues, high amounts of oil and fat, and dishwashing detergents. | 10% [25,26,27,28,29,30,31,32] |
| Class D (DGW) | Laundry & all other washing required spaces | Laundry soap, bleaches, oils, paints, solvents, non-biodegradable fibers from clothing, and microplastics. |
25 – 30% [31,32] |
| Physical Parameters [Units] | Values | Range |
|---|---|---|
| Turbidity [Nephelometric Turbidity unit, NTU] | 164 [30], 84.3 [33], 35-164 [35] | Irrigation water quality standard < 10 [36] Fairly turbid (15 – 25) Rather turbid (25 – 35) Turbid (35 – 50) Very turbid > 50 |
| Total solids (TS) | 835 [30], 204 [37], 450.3 [33] | |
| Total suspended solids (TSS) [mg/L] | 153-259 [30], 141.2 [33], 25-181 [35] | Irrigation water quality standard (≤ 33) |
| Total dissolved solids (TDS) [ppm] | 473.3 [33] | Ideal drinking (0 – 40) Acceptable (40 – 100) Borderline (100 – 200) Average tap water (200 – 300) Possibly hazardous (300 – 400) Potentially hazardous (400 – 500+) |
| Chemical parameters | ||
| pH | 7–7.3 [30], 7.43 [38],7.96 [39], 7.2 [33],6.72–9.82 [35], 6.7–9.8 [40] | Adequate for irrigation (6 – 8) |
| Biochemical oxygen demand (BOD) [mg/L] | 155–205 [30], 109 [41], 155 [42], 100 [43], 568 [39], 138.5 [33], 33–305 [35], 35–92 [40] | Irrigation water quality standard (≤ 50) |
| Chemical oxygen demand (COD) [mg/L] | 386–587 [30], 263 [41], 587 [42], 110 [43], 58 [37], 1171 [39], 340.5 [33], 47–587 [35], 47–350 [40] | Irrigation water quality standard (≤ 50) |
| Chlorides [mg/L] | 237 [30] | Irrigation water quality standard (≤ 70) |
| Methylene blue active substances (MBAS) [mg/L] | 3.3 [30] | – |
| Oil and grease (O&G) [mg/L] | 135 [30] | – |
| Total organic carbon (TOC) [mg/L] | 99 [42], 63 [43], 155.28 [44], 60.8 [33] | |
| Total Nitrogen (TN) / NH3 [mg/L] | 10.4 [30], 9.6 [41], 10.4 [42], 10.2 [43], 2.22 [44], 0.21 [37], 14.3 [39], 0.6 [33], 2.5–10.4 [35] | Irrigation water quality standard (≤ 5) |
| Total Phosphorous (TP) [mg/L] | 2.58 [41], 0.13 [42], 0.15 [44], 2.25 [39], 1.1 [33], 0.3–2.6 [35] | Irrigation water quality standard (≤ 0.8) |
| N/TOC [mg/mg] | 0.11 [42], 0.16 [43] | – |
| P/NOC [mg/mg] | 0.001 [42], | – |
| Microbiological parameters | ||
| Total coliform (TC) (Most Probable Number, [MPN] | 9.42E4 [30], 0.0–1.7 x 10⁶ [40] | – |
| Fecal coliform (FC) [MPN] | 3.50E4 [30] | – |
| Escherichia coli (E.coli) [MPN] | 10 [30] | <1000 per 100 mL |
| Ground elements & heavy metals | ||
| Boron (B) [mg/L] | 0.44 [30] | Irrigation water quality standard (≤ 0.75) |
| Calcium (Ca) [mg/L] | 51.19 [44], 0 [37], 5.1 [33] | Irrigation water quality standard (≤ 120) |
| Magnesium (Mg) [mg/L] | 7.25 [44], 0 [37], 1.8 [33] | Irrigation water quality standard (≤ 24) |
| Sodium (Na) [mg/L] | 131 [30], 17.11 [37], 19.2 [33] | Irrigation water quality standard (≤ 30) |
| Sulfur (S) [mg/L] | 27.70 [44], 2.12 [33] | |
| Copper (Cu) [mg/L] | 0.005 [44] | Irrigation water quality standard (≤ 0.02) |
| Zinc (Zn) [mg/L] | 0.020 [44], 2.03 [33] | Irrigation water quality standard (≤ 2) |
| Potassium (K) [mg/L] | 1.55 [44], 1.98 [37], 3.6 [33] | Irrigation water quality standard (≤ 20) |
| Iron (Fe) [mg/L] | 2 [44], 0.17 [33] | Irrigation water quality standard (≤ 5) |
| Required Parameters for Reuse of GW | USEPA Standards [47] |
UK/EU Water Standards [48,49] | NSW Government [46] | USEPA Reclaimed Water Standard for Water Closet Flushing [50] |
|---|---|---|---|---|
| Water quality | ||||
| pH | 6 – 9 | 6 – 9 | 5.5 – 7.5 | 6 – 9 (monitor 1/month) |
| TSS | < 30 mg/L | < 30 mg/L | 30 mg/L | |
| BOD | < 30 mg/L | < 30 mg/L | 20 mg/L | < 10 Monitor 1/week |
| Turbidity | 0.1 NTU |
< 2 NTU continuous monitor | ||
| Pathogen criteria | ||||
| Total coliform | 2.2 cfu/100 mL | 2 cfu/100 mL | 10 cfu/ 100 mL | |
| Fecal coliform | ≤ 200 cfu/100 mL | ≤ 200 cfu/100 mL | No fecal coliforms /100mL |
| Products | pH | EC |
|---|---|---|
| Water + Shampoo | 5.78 | 5.02 |
| Water + Mouthwash | 5.12 | 0.09 |
| Water + Toothpaste | 9.54 | 1.38 |
| Water + Body wash | 4.36 | > 6 |
| Water + Laundry soap | 10.72 | > 6 |
| Testing Parameters | Measuring Method/Standards |
|---|---|
| 1. Water tests | |
| 1.1 pH | Measured by Gro Line Waterproof Portable pH/EC |
| 1.2 Electrical conductivity | Measured by Gro Line Waterproof Portable pH/EC |
| 1.3 Turbidity | Measured nephelometrically using Inorg-022 a turbidimeter, in accordance with APHA latest edition, 2130-B. |
| 1.4 Total suspended solids | Determined gravimetrically by filtration of the sample. The samples are dried at 104+/-5 °C. |
| 1.5 BOD | Analyzed in accordance with Inorg-091 APHA latest edition 5210 D. |
| 1.6 Total coliform | Australian standard 4276.5-2007 |
| 1.7 Fecal coliform | Australian standard 4276.5-2007 |
| 2. Soil tests | |
| 2.1 Physiochemical tests | |
| 2.1.1 pH | Measured using pH meter and electrode in accordance with APHA latest edition, 4500-H+. |
| 2.1.2 Electrical conductivity (EC) | Measured using a conductivity cell at 25 °C in accordance with APHA latest edition 2510 and Rayment & Lyons. |
| 2.1.3 Moisture content | Determined by heating at 105°C (±5) for a minimum of 12 hours |
| 2.1.4 Total organic carbon (TOC) | A titrimetric method that measures the oxidizable organic content of soils. |
| 2.1.5 Total Nitrogen (TN) | Calculated as the sum of TKN (Total Kjeldahl Nitrogen) and oxidized nitrogen. Alternatively analyzed by combustion and chemiluminescence. |
| 2.1.6 Cation Exchange Capacity (CEC) - NH4Cl | Using 1M ammonium chloride exchange and ICP-AES (inductively coupled plasma atomic emission spectroscopy) analytical finish. |
| 2.2 Biomass tests | Tea bag index (TBI) tests |
| 2.3 DNA Extraction | Soil DNA sequencing |
Disclaimer/Publisher’s Note: The statements, opinions and data contained in all publications are solely those of the individual author(s) and contributor(s) and not of MDPI and/or the editor(s). MDPI and/or the editor(s) disclaim responsibility for any injury to people or property resulting from any ideas, methods, instructions or products referred to in the content. |
© 2023 by the authors. Licensee MDPI, Basel, Switzerland. This article is an open access article distributed under the terms and conditions of the Creative Commons Attribution (CC BY) license (http://creativecommons.org/licenses/by/4.0/).


