1. Introduction
Urban gardens play a role in maintaining biodiversity in anthropogenic areas. They provide evidence that their potential value may be considerable, as they can be semi-natural habitats that may act as a refuge for bacterial biodiversity [
1]. Some of these bacteria can include strains able to produce antibiotics and other interesting products for the industry such as extracellular enzymes [
2]. Moreover, urban garden soils are frequently influenced by anthropogenic activities, which may influence the composition of the bacterial community in a different manner than seen in conventional agriculture. This effect can be reflected in antibiotic-producing soil strains [
2]. The area in urban gardens often determines the amount of green space in many urbanized cities, and in some cities, urban gardens cover between 23 and 36% of the city area [
3,
4,
5]. Urban gardens support many local, landscape, and socio-political features that may contribute to conserving biodiversity. Understanding spatial connectivity can help predict species distribution, diversity, abundance, composition, and spatial distribution of bacterial resources. The use of maps for analyzing and illustrating the occurrence of bacterial pathogens at a national level has been employed on a European-wide basis since 1999 [
6].
In this study, we examined bacterial resources in an urban garden located in València (Eastern Spain) to determine how bacterial abundance and bacterial spatial distributions within an urban garden is associated with changes in soil composition. The park of Benicalap is one of the most important green spaces in the city of València. An outdoor space that has large sports areas, swimming pools, theater-forum, and children’s areas. The park was built in 1983, on the periphery of the city. It covers an approximate area of 80,000 . The vegetation is present in most of the park in the form of Mediterranean wooded groves: olive trees, cypresses, pines, laurels, holm oaks, mulberry trees or strawberry trees. The Park of Benicalap, with accesses through the avenue of Burjassot, Luis Braille street, and Andreu Alfaro street. In this study, We specifically tested the microbiological biodiversity: fungi, bacterial (Enterobacteria). In total, 28 samples were studied extensively in terms of soil bacteria composition, antibiotic effect against test strains, and the ability to produce extracellular hydrolytic enzymes. Bacteria and fungi are incapable of performing endocytosis processes, which prevents them from ingesting nourishing particles or taking advantage of macromolecules in suspension in the external environment directly as sources of nutrients. However, it is quite frequent that these microorganisms continue to produce and excrete the medium enzymes with the ability to extracellularly hydrolyze various types of macromolecules, producing smaller molecules (monomers, dimers, oligomers) that will later be incorporated by active transport to the cytoplasm. We also examined the role of bacterial abundance and spatial distribution in relation to other soil characteristics, such as pH or color.
2. Materials and Methods
2.1. Sample Collection
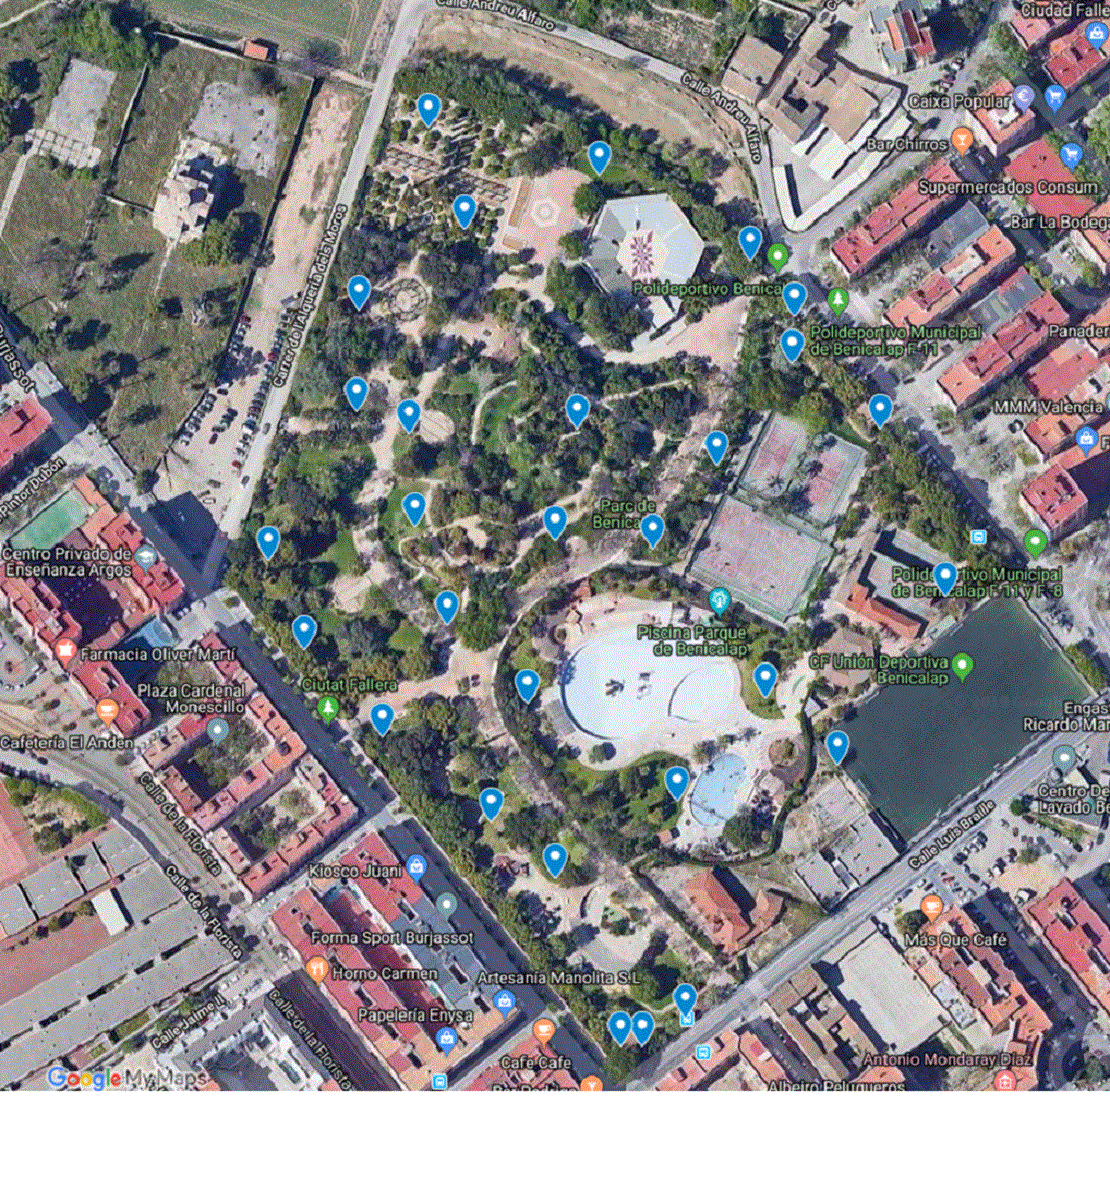
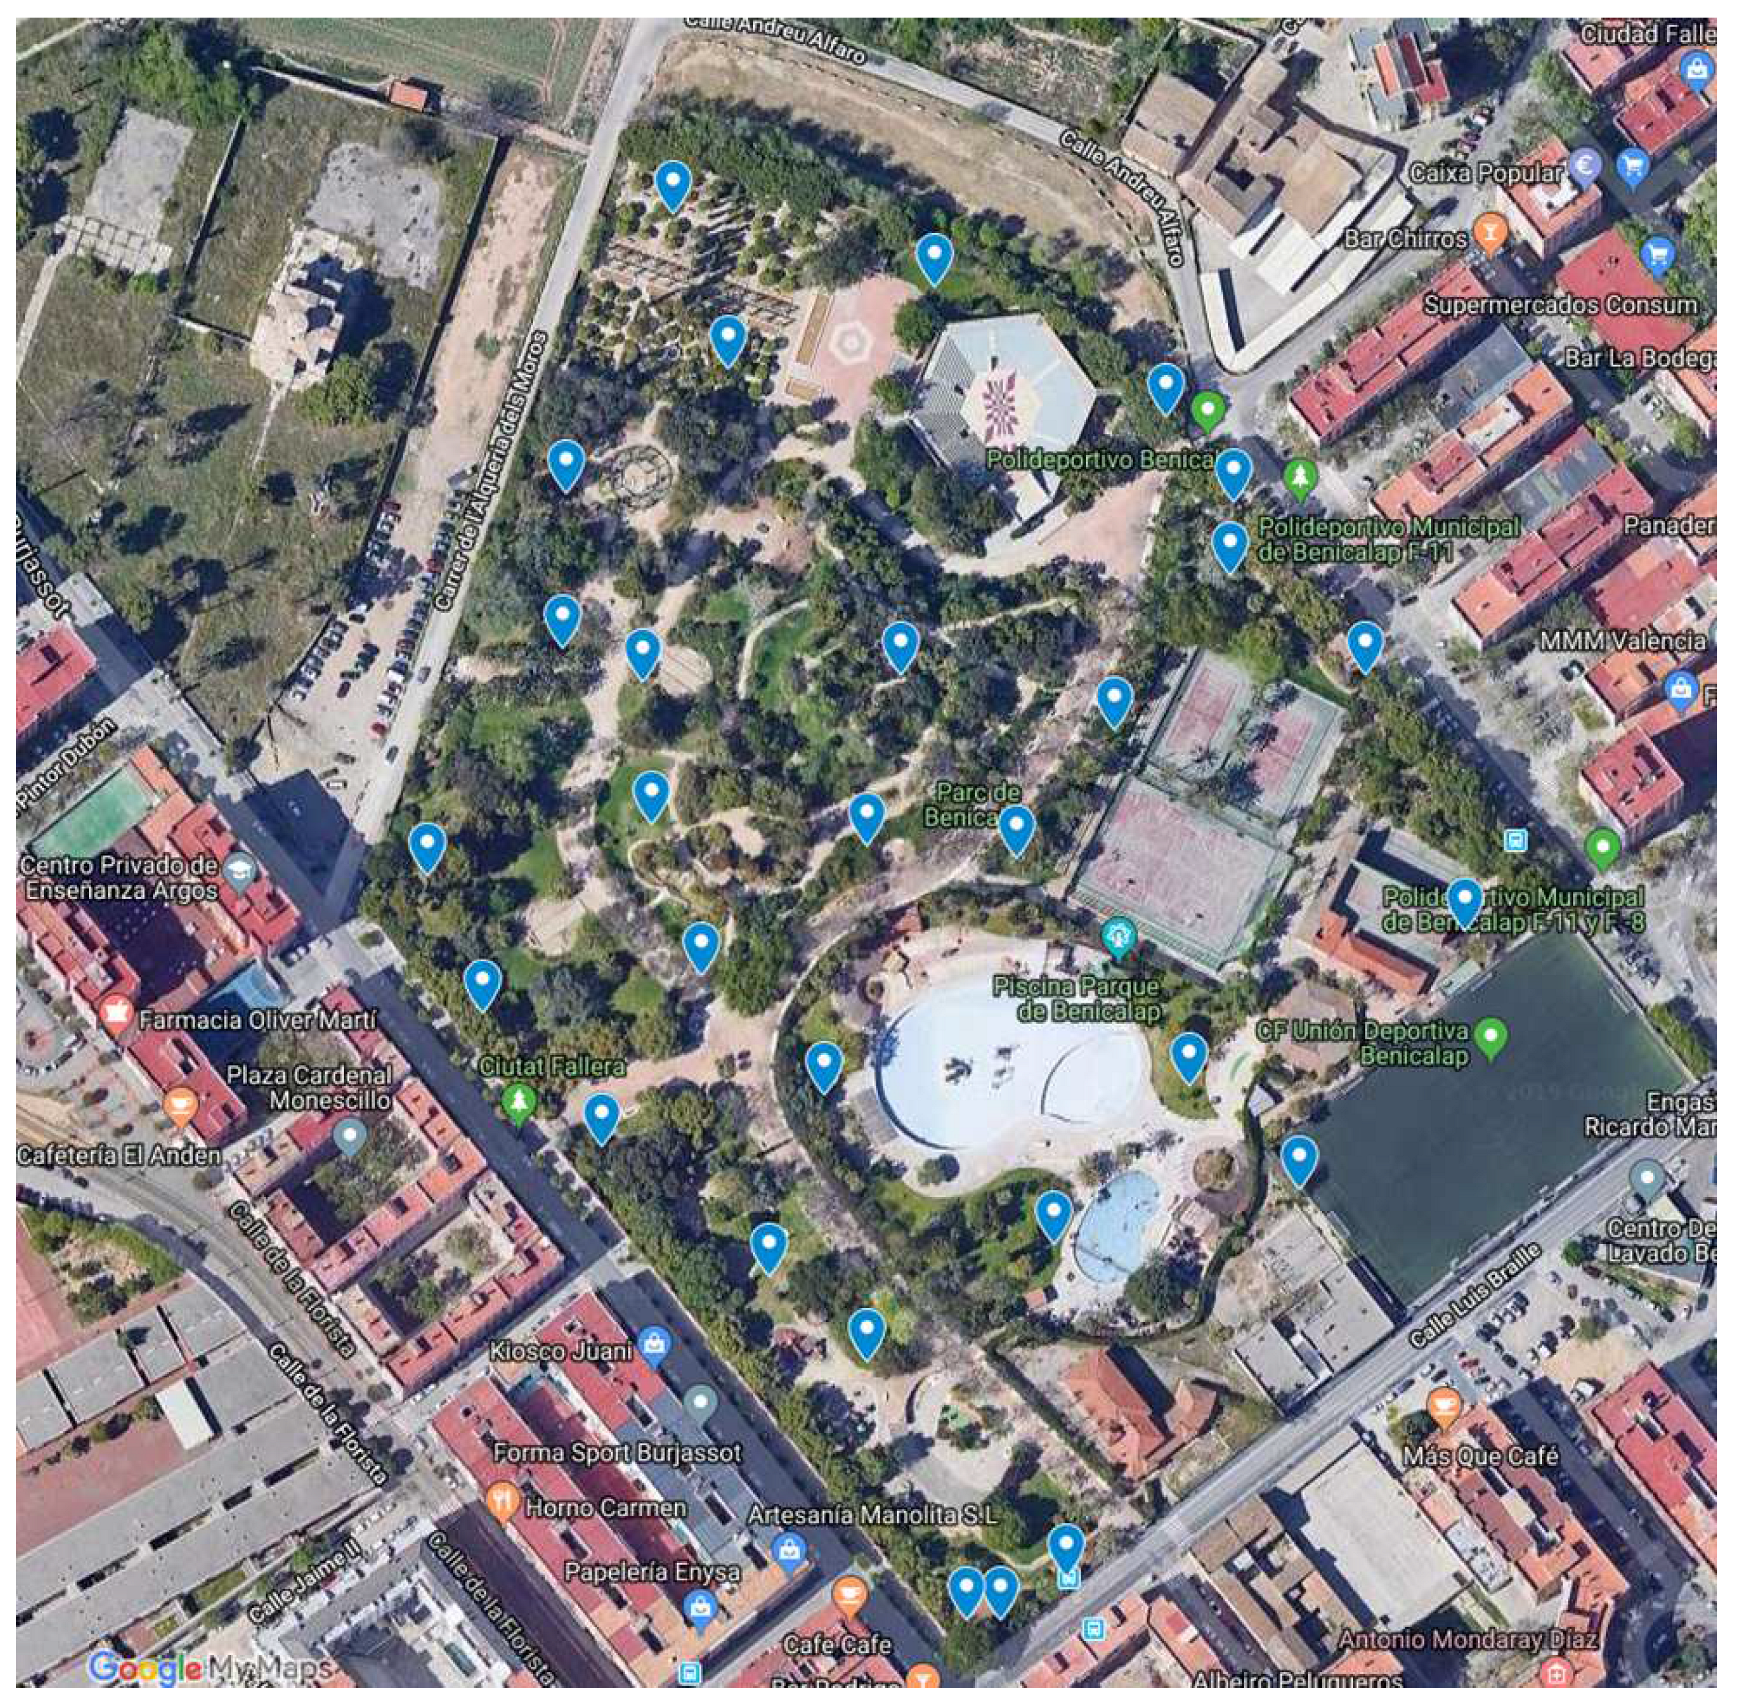
Soil sampling was conducted in an urban community park in Benicalap, València, Spain during 2018 and 2019 seasons (
Figure 1). The garden used municipal and rainwater for irrigation which is a common practice in many urban community gardens in metropolitan València. In total, 28 soil samples were collected at a depth of 0–10 cm. Samples were put into a screw tub and transported to the laboratory for bacterial isolation as described elsewhere [
7]. The remaining samples were stored at 4ºC for further analysis.
2.2. Soil Characterization
2.2.1. pH Measurement
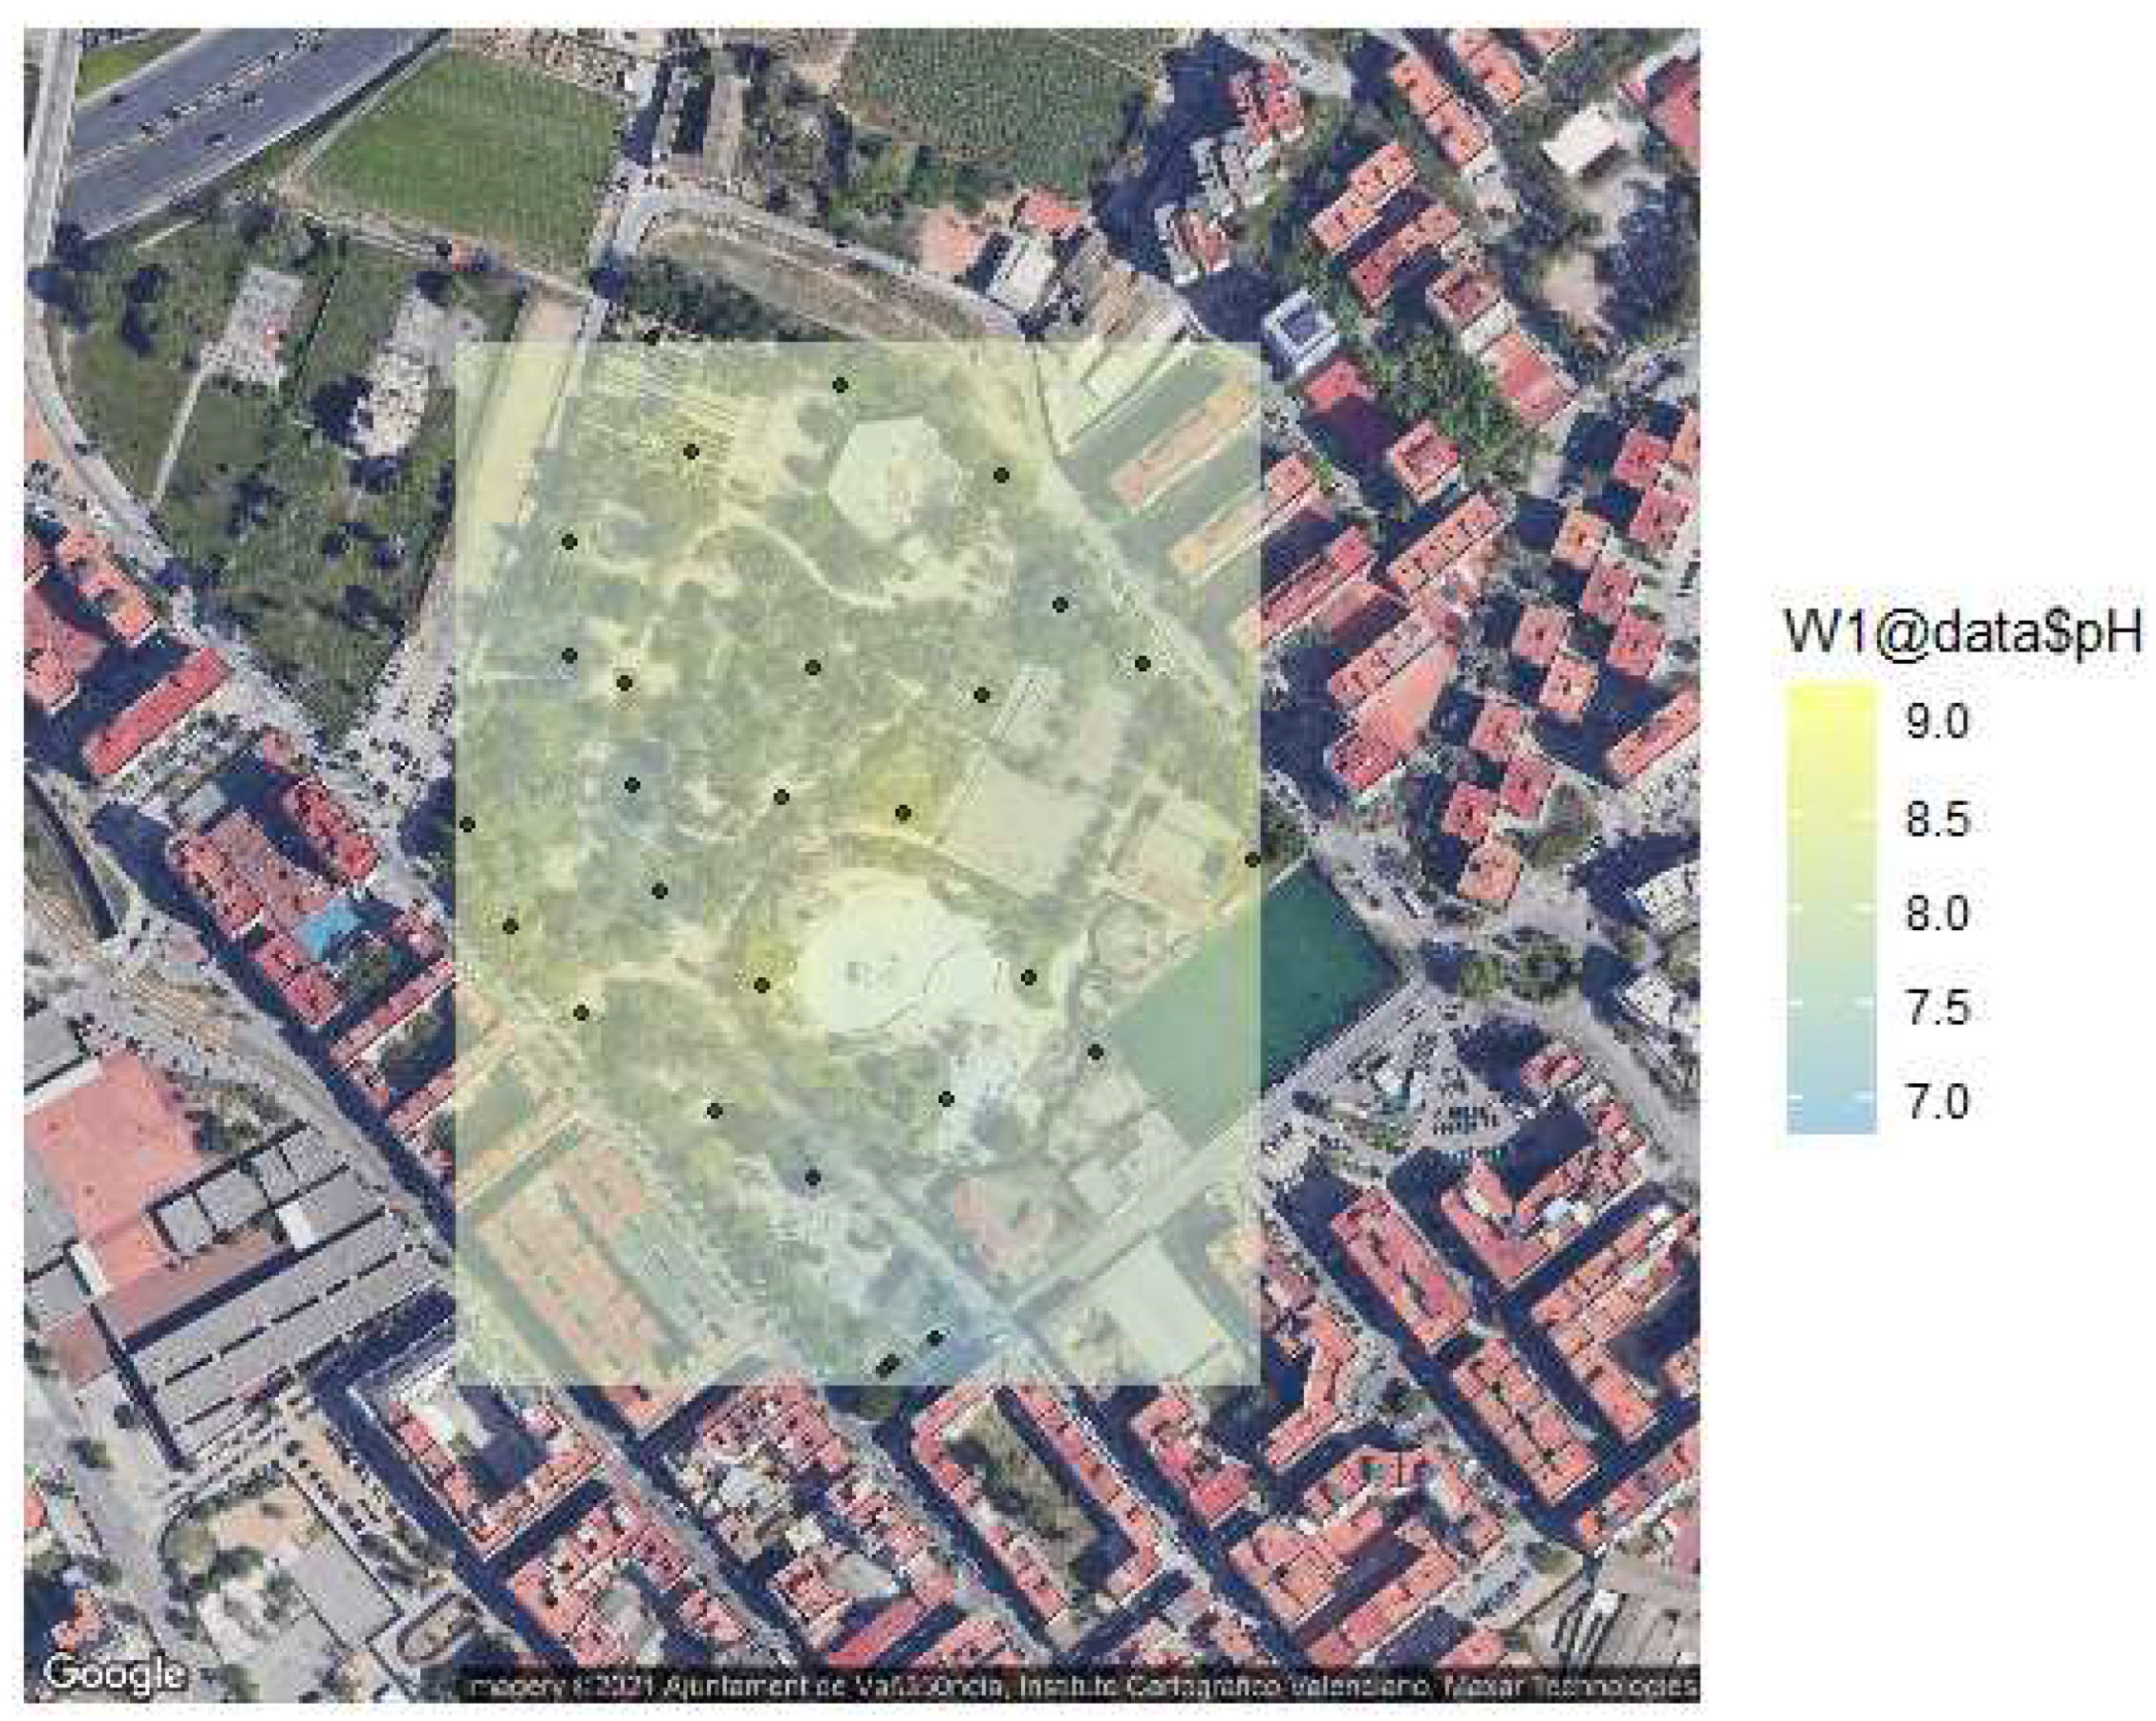
Soil pH was measured by dissolving 1 g of soil in 5 mL distilled water, shaking for 2 min, and then waiting 30 min for the soil to settle (assays by triplicate using a pH-meter (Consort, Turnhout, Belgium). A similar procedure was used with pH papers, dissolving 0.5 g of soil in 1 ml distilled water, vortexed for 5 min, and applying in small amounts to pH indicator strips (Universal Test Paper). The pH strip accuracy was tested against standard pH calibration solutions (
Figure 2).
2.2.2. Color, Texture, and Carbonate Content Determination
Soil color was determined by visual inspection and comparison of the samples against a Munsell standard table [
8]. The texture allows for classifying the soils according to the size of the different particles that compose it. The presence of carbonates in the soil was assessed by adding a few drops of 1:1 HCl to the soil samples to check the appearance of effervescence. The more intense the effervescence, the higher the calcium carbonate content in the soil.
2.3. Isolation and Antibiosis Characterization of Soil Bacteria
A total of 1 g of sample was suspended in 10 mL of sterile water to prepare serial dilutions and 0.1 mL of the 1:10 to 1:100,000 dilutions were platted in 10% trypticase soy agar (TSA, Conda, Spain). After a period of 48 h, 15-20 random colonies were picked and patched onto a fresh TSA “mother” plate with the help of a grid. After an incubation period of 24 h, calibrated suspensions of safe relatives (Escherichia coli CECT101, Bacillus cereus CECT495, Salmonella sp. CECT443, Staphylococccus aureus CECT4013, Pseudomonas fluorescens CECT378, Klebsiella pneumoniae CECT143, Enterobacter cloacae CECT194 or Enterococcus faecalis CECT184 were used to spread a lawn on TSA plates by using sterile swabs. All grown microorganisms from the mother grid plate were individually replicated on these plates using sterile toothpicks to check their antibiotic effect.
2.4. Microbial Identification
2.4.1. 16S rDNA Partial Sequence
Bacteria DNA was extracted and amplified according to Arahal et al. [
9]. Primers SWI-F (5’-AGAGTTTGATCCTGGCTCAG-3’) and SWI-R (5’-GGTTACCTTGTTACGACTT-3’) were used to amplify the 16S rRNA gene [
10]. The amplification reaction was performed in a Primus 25 thermocycler (MWG, Ebersberg, Germany). Amplification products were separated by electrophoresis on a 1% (w/v) agarose gel. PCR amplifications were purified and washed with a high-pure PCR product amplification kit (Boehringer Mannheim, Germany). Direct sequencing of the PCR products was performed by ABIPrism BigDye Terminator Cycle Sequence Ready Reaction Kit (Applied Biosystems, Stafford, TX, USA) in the SCSIE service (Universitat de València, Paterna, Spain). The sequences were aligned using the BLAST program, with complete sequences of 16S rDNA gene sequences retrieved from the EMBL nucleotide sequence data libraries [
11].
2.4.2. MALDI-TOF
The identification of bacterial strains has also been carried out following the protocol recommended by Bruker Daltonics (
http://www.bdal.de) by means of the extended direct transfer method. The strains were analyzed from fresh culture. The Matrix-Assisted Laser Desorption/Ionization-Time of Flight-Mass Spectrometry (MALDI-TOF MS) technique was performed using a Microflex L20 mass spectrometer (Bruker Daltonics) equipped with an N2 laser. All spectra were acquired in positive linear ion mode. The acceleration voltage was 20 kV [
12]. The spectra were acquired as the sum of 240 shots per target. The mass range used for the analysis was 2,000-20,000 Da. Three spectra were obtained per strain by the MALDI Biotyper Realtime Classification (RTC) method. The resulting identification in front of the database MBT 7854 and MBT 7311_RUO (Bruker Daltonics), corresponds to the profile of the highest log score.
2.5. Assays for Extracellular Hydrolytic Enzymes Production
To demonstrate the production of extracellular enzymes (hydrolases) the microorganisms were grown in a standard culture media, provided with the basic nutrients necessary for a good growth of the strain, supplemented with the macromolecule under investigation (proteins, polysaccharides, lipids or nucleic acids). After timely incubation, the presence of the macromolecule is investigated using an appropriate reagent to show its presence. Sometimes the presence of the macromolecule gives the environment a characteristic aspect (opacity, solidity); His disappearance will indicate at first glance that hydrolysis has occurred.
All the strains isolated in this project were spread in four replicated Petri plates containing the following media using sterile toothpicks. Composition of media in g .
Casein agar: 10 bacteriological peptone, 4 NaCl, 3 meat extract, 15 agar. 10% skim milk was sterilized in a separate vessel and once sterile both parts were poured into Petri plates. The plates were incubated at 28ºC for 3 days. The presence of casein gives the environment an opaque appearance that disappears when casein is hydrolyzed. A transparent halo must appear in the middle of the proteolytic microorganisms grown on casein. The non-proteolytic ones do not produce a change in the original aspect of the environment.
TWEEN-80 agar: The medium contains a synthetic lipid that presents ester links between sorbitol and oleic acid (Tween-80). It also contains calcium salts. If the microorganism has esterase activity (lipase), it will hydrolyze the ester link and release the oleic acid of the Tween-80. This oleic acid, in the presence of an excess of , will precipitate in the form of small crystalline oleate crystals that will form an opaque halo around growth.
Starch Agar: To reveal the presence of starch it is necessary to dye it with Lugol. Add 2 milliliters of Lugol to the plate and observe the development of the dark violet color in those areas where there is starch. If transparent halos appear around the growth of a microorganism, this indicates that there has been polysaccharide hydrolysis.
DNAse agar: 20 tryptose, 2 deoxyribonucleic acid, 5 sodium chloride, 12 agar. Organisms are streaked on to the surface of the agar medium and incubated. The growth on the surface of the agar is then flooded with 1N hydrochloric acid. Polymerised DNA precipitates in the presence of 1N HCl and makes the medium opaque. If the organisms produce DNase enzymes, in sufficient quantity to hydrolyse the DNA, then clear zones are seen around the colonies. As a control, Staphylococcus aureus CECT4013 was used.
2.6. Spatial Statistical Technique (Kriging Method)
Spatial statistics enables the examination of geographically located data through the utilization of various methods. The most frequently employed methods are Inverse Distance Weighted (IDW), splines, and Kriging. IDW is a straightforward and predictable interpolation technique that is based on the idea that the sample values closer to the location being predicted have a greater impact on the prediction outcome than sample values that are further away. However, one significant drawback of IDW is its tendency to produce a “bull’s eye” pattern and a jagged surface. Splines, like IDW, are also a deterministic interpolation method that creates a smooth surface by fitting a mathematical function to the input data. The final technique, Kriging, utilizes the concept of spatial autocorrelation [
13] and is rooted in statistical principles. Given its statistical approach, Kriging was selected as the preferred method of spatial interpolation.
The information obtained from soil samples forms a dataset that links different locations with their GPS coordinates, longitude, and latitude. The data is represented by the number of colonies or isolates that are capable of inhibiting the growth of certain control strains at a location
x, denoted as
. The dataset is defined as
, where
encompasses all the locations that are being modeled. The use of Kriging techniques [
14] is applied to this dataset to facilitate the spatial analysis.
3. Results and Discussion
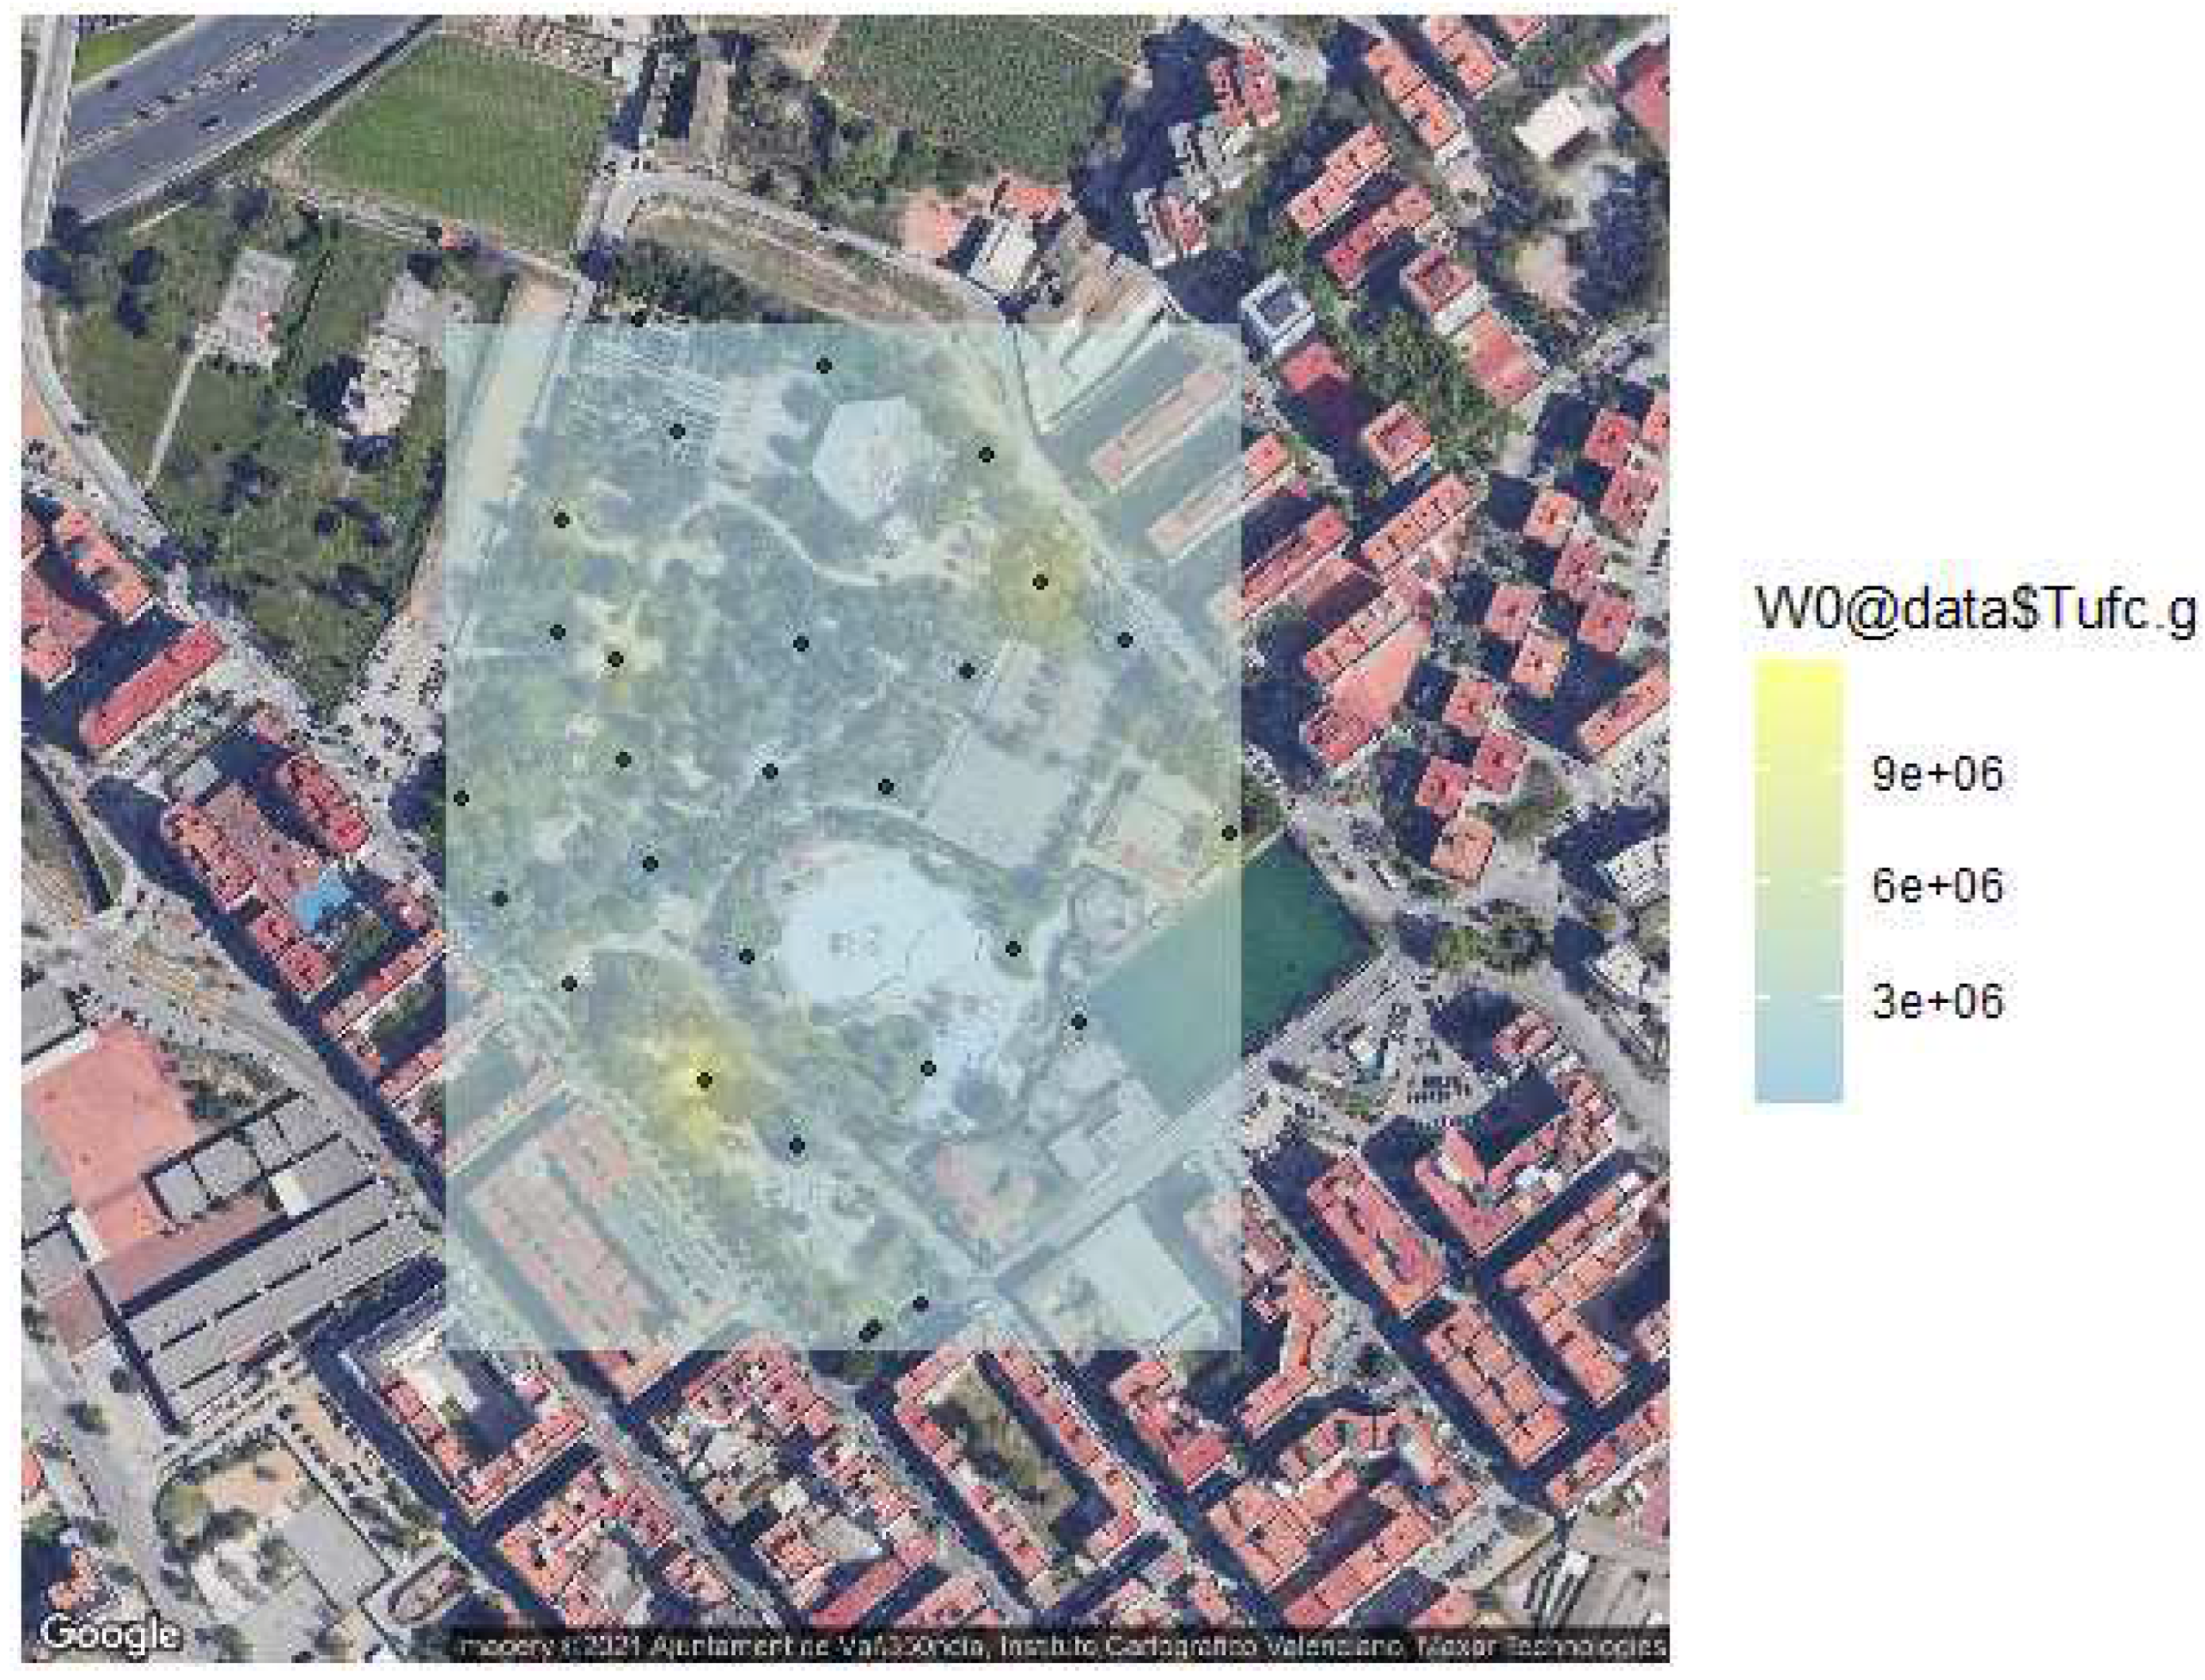
The soil of urban parks is capable of sustaining microbial life, in different degrees and conditions. Depending on the degree of anthropogenisation, areas with a higher concentration of micro-organisms are observed (top-right and bottom-left extremes)
Figure 3.
Based on the possible and different characteristics of these soils, we carried out different tests that allowed us to characterize them minimally. On the one hand, we determine the color, one of the most significant properties of the soil, generally conditioned by the existence and proportion of organic and mineral compounds.
Organic matter produces dark colors, usually blackish or brown. Most of the world’s soils are dominated by two large lineages of bacteria, the
Proteobacteria and the
Actinobacteria [
15]. They are very efficient competitors for organic carbon, which is a limiting resource in the soil. Therefore, the abundance of these increases the concentrations of organic carbon. The darker the soil, the greater the chance of finding a large number of microorganisms. Most of the analyzed soils showed a dark or brownish-dark coloration, which suggests a great number of organic compounds, and as a consequence high numbers of microorganisms (
Table 1).
Although the samples were taken at different depths, ranging from the surface to even 10 cm, similar results were observed. The type of soil is also associated with pH, a variable depending on the constituents of the same. The pH value indicates the type of microorganism that can be found in each soil sample. Thus, bacteria prefer pH neutral or close to neutrality, sometimes alkaline, while fungi are the majority at acidic pH [
15]. The soils analyzed exhibit a range of pH from 6.79 to 9.24. We have decided to only isolate bacteria for further experiments, following previous strategies of our group [
16,
17].
Microorganisms (bacteria) living in soil are often in competition with the other microbiota with which they share a niche. To evaluate the ability to inhibit the growth of other bacteria, especially those for which it is always interesting to find an inhibitor, we perform inhibition tests [
17]. After an incubation period of 24 h, calibrated suspensions of safe relatives (
E. coli,
S. aureus,
K. pneumoniae,
Salmonella sp.,
P. fluorescens and
Ent. cloacae) were used to spread a lawn on TSA plates by using sterile swabs. All grown microorganisms from the mother grid plate were individually replicated on these plates using sterile toothpicks to check their antibiotic effect (
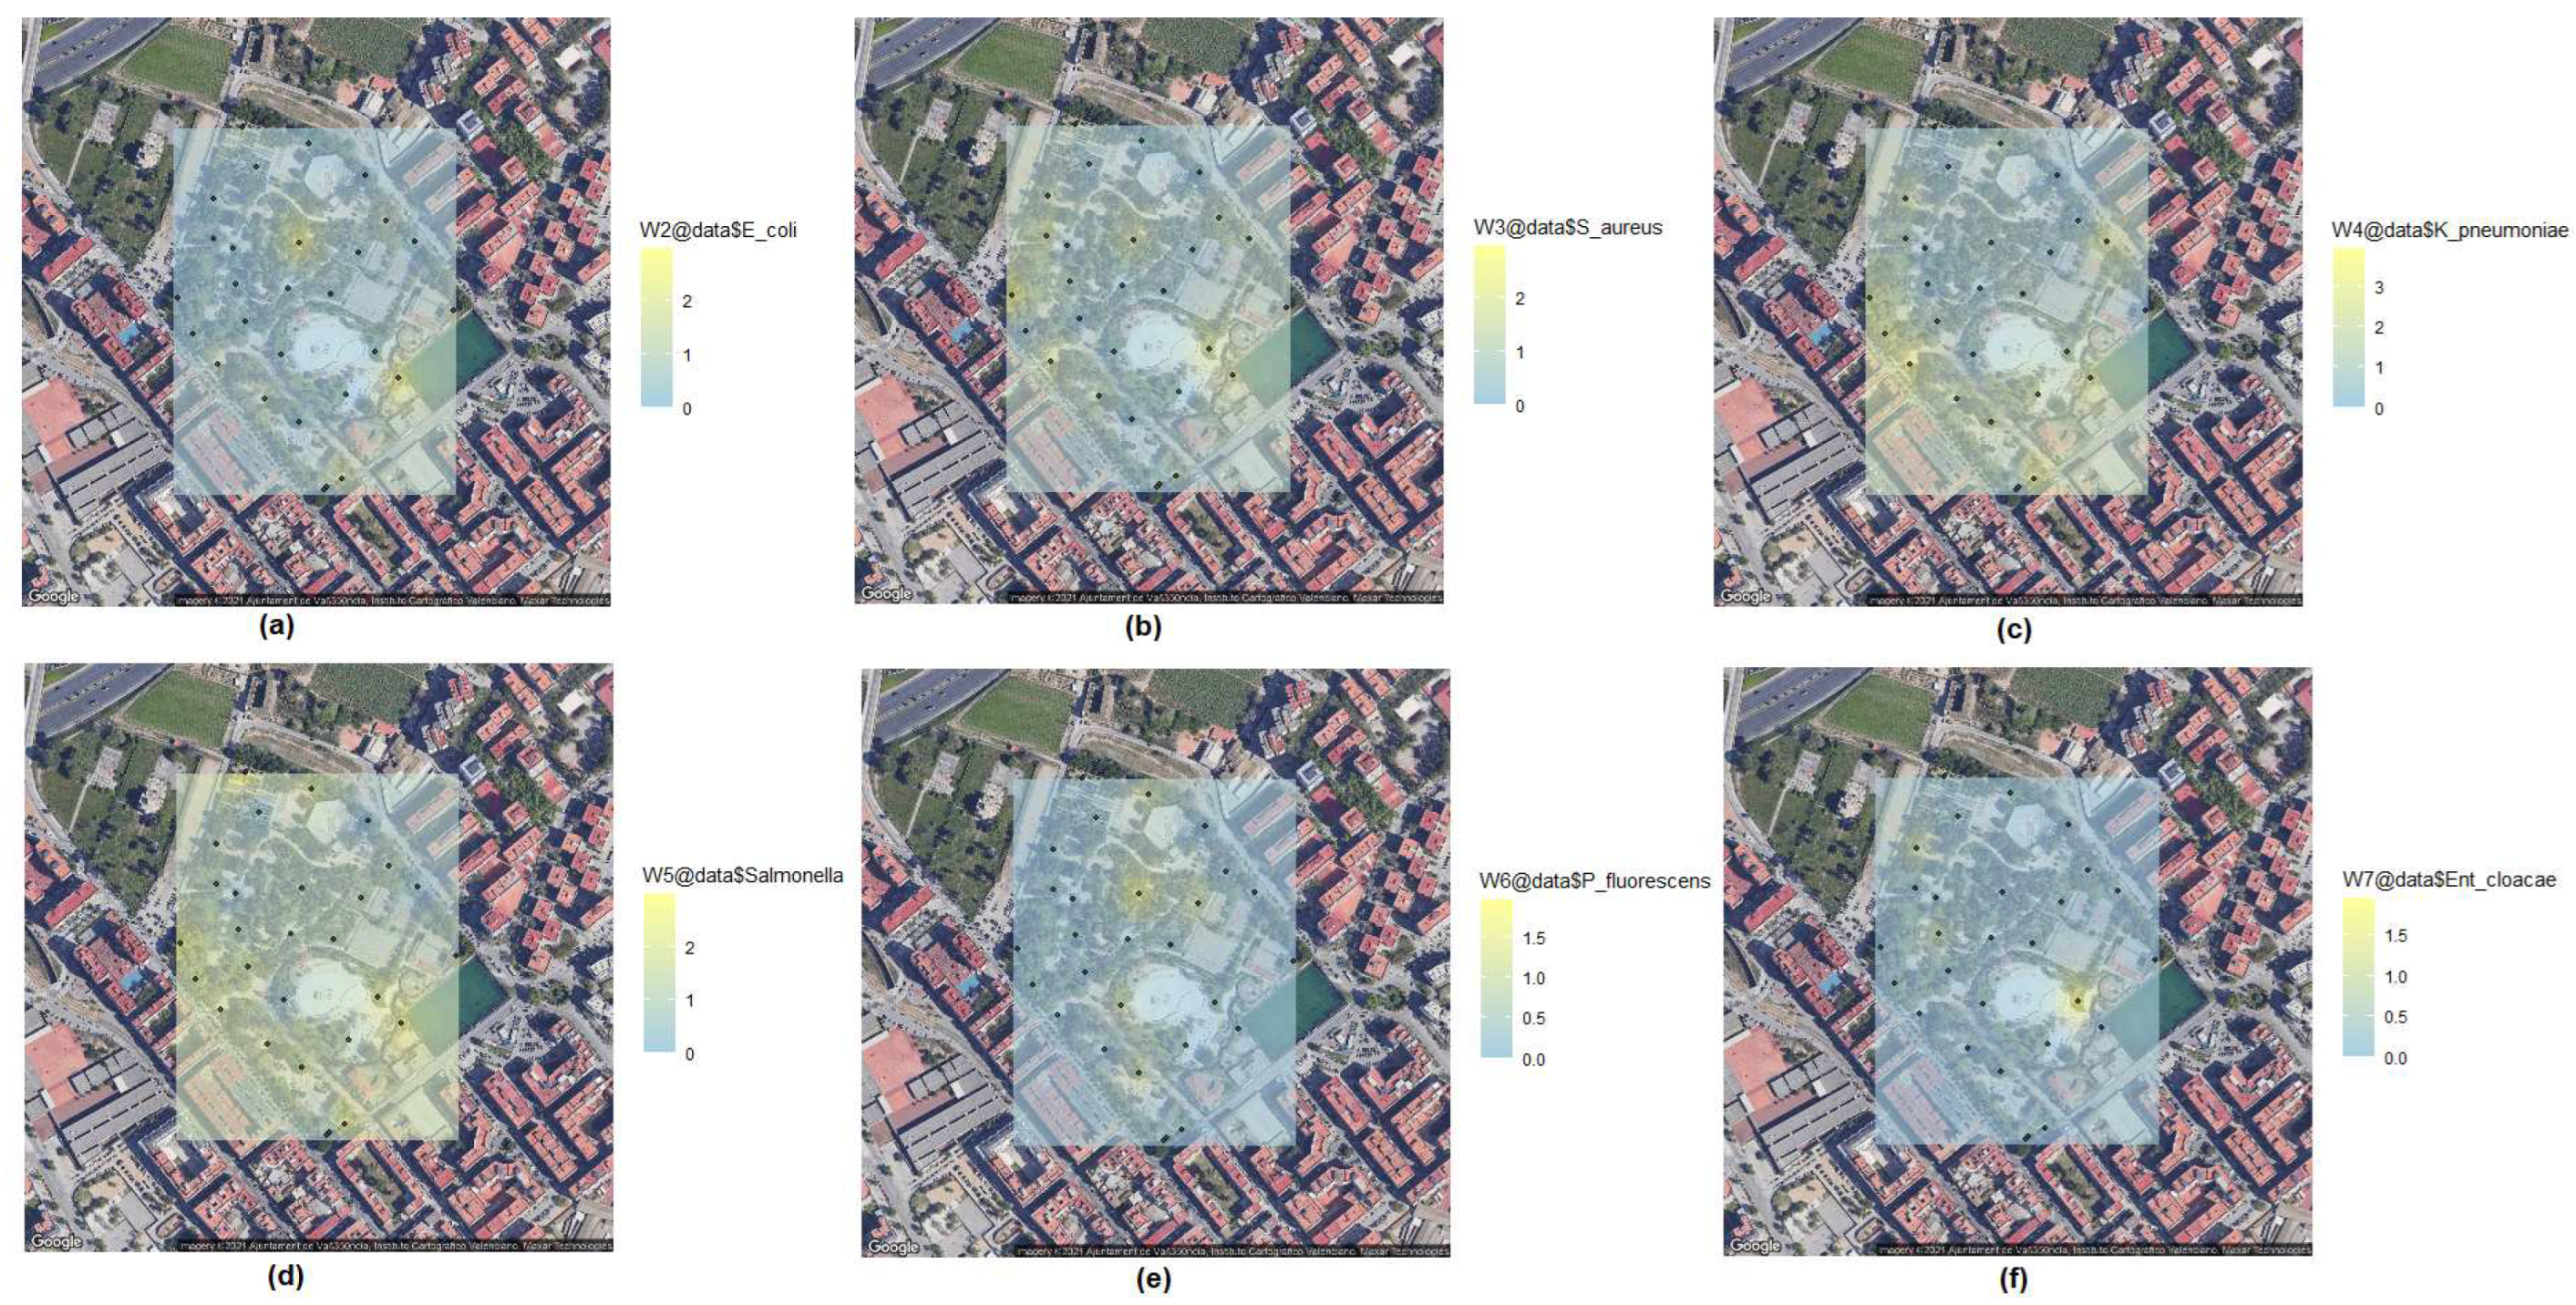
Table 2). A nice Kriging representation of these results is also shown in
Figure 4.
Among the 560 bacteria analysed, we detected a variable amount of antibiosis, with Salmonella sp. and K. pneumoniae being the species with the highest number of microorganisms with antibiotic effect. On the other hand, antibiosis against P. fluorescens and Ent. cloacae were almost anecdotal.
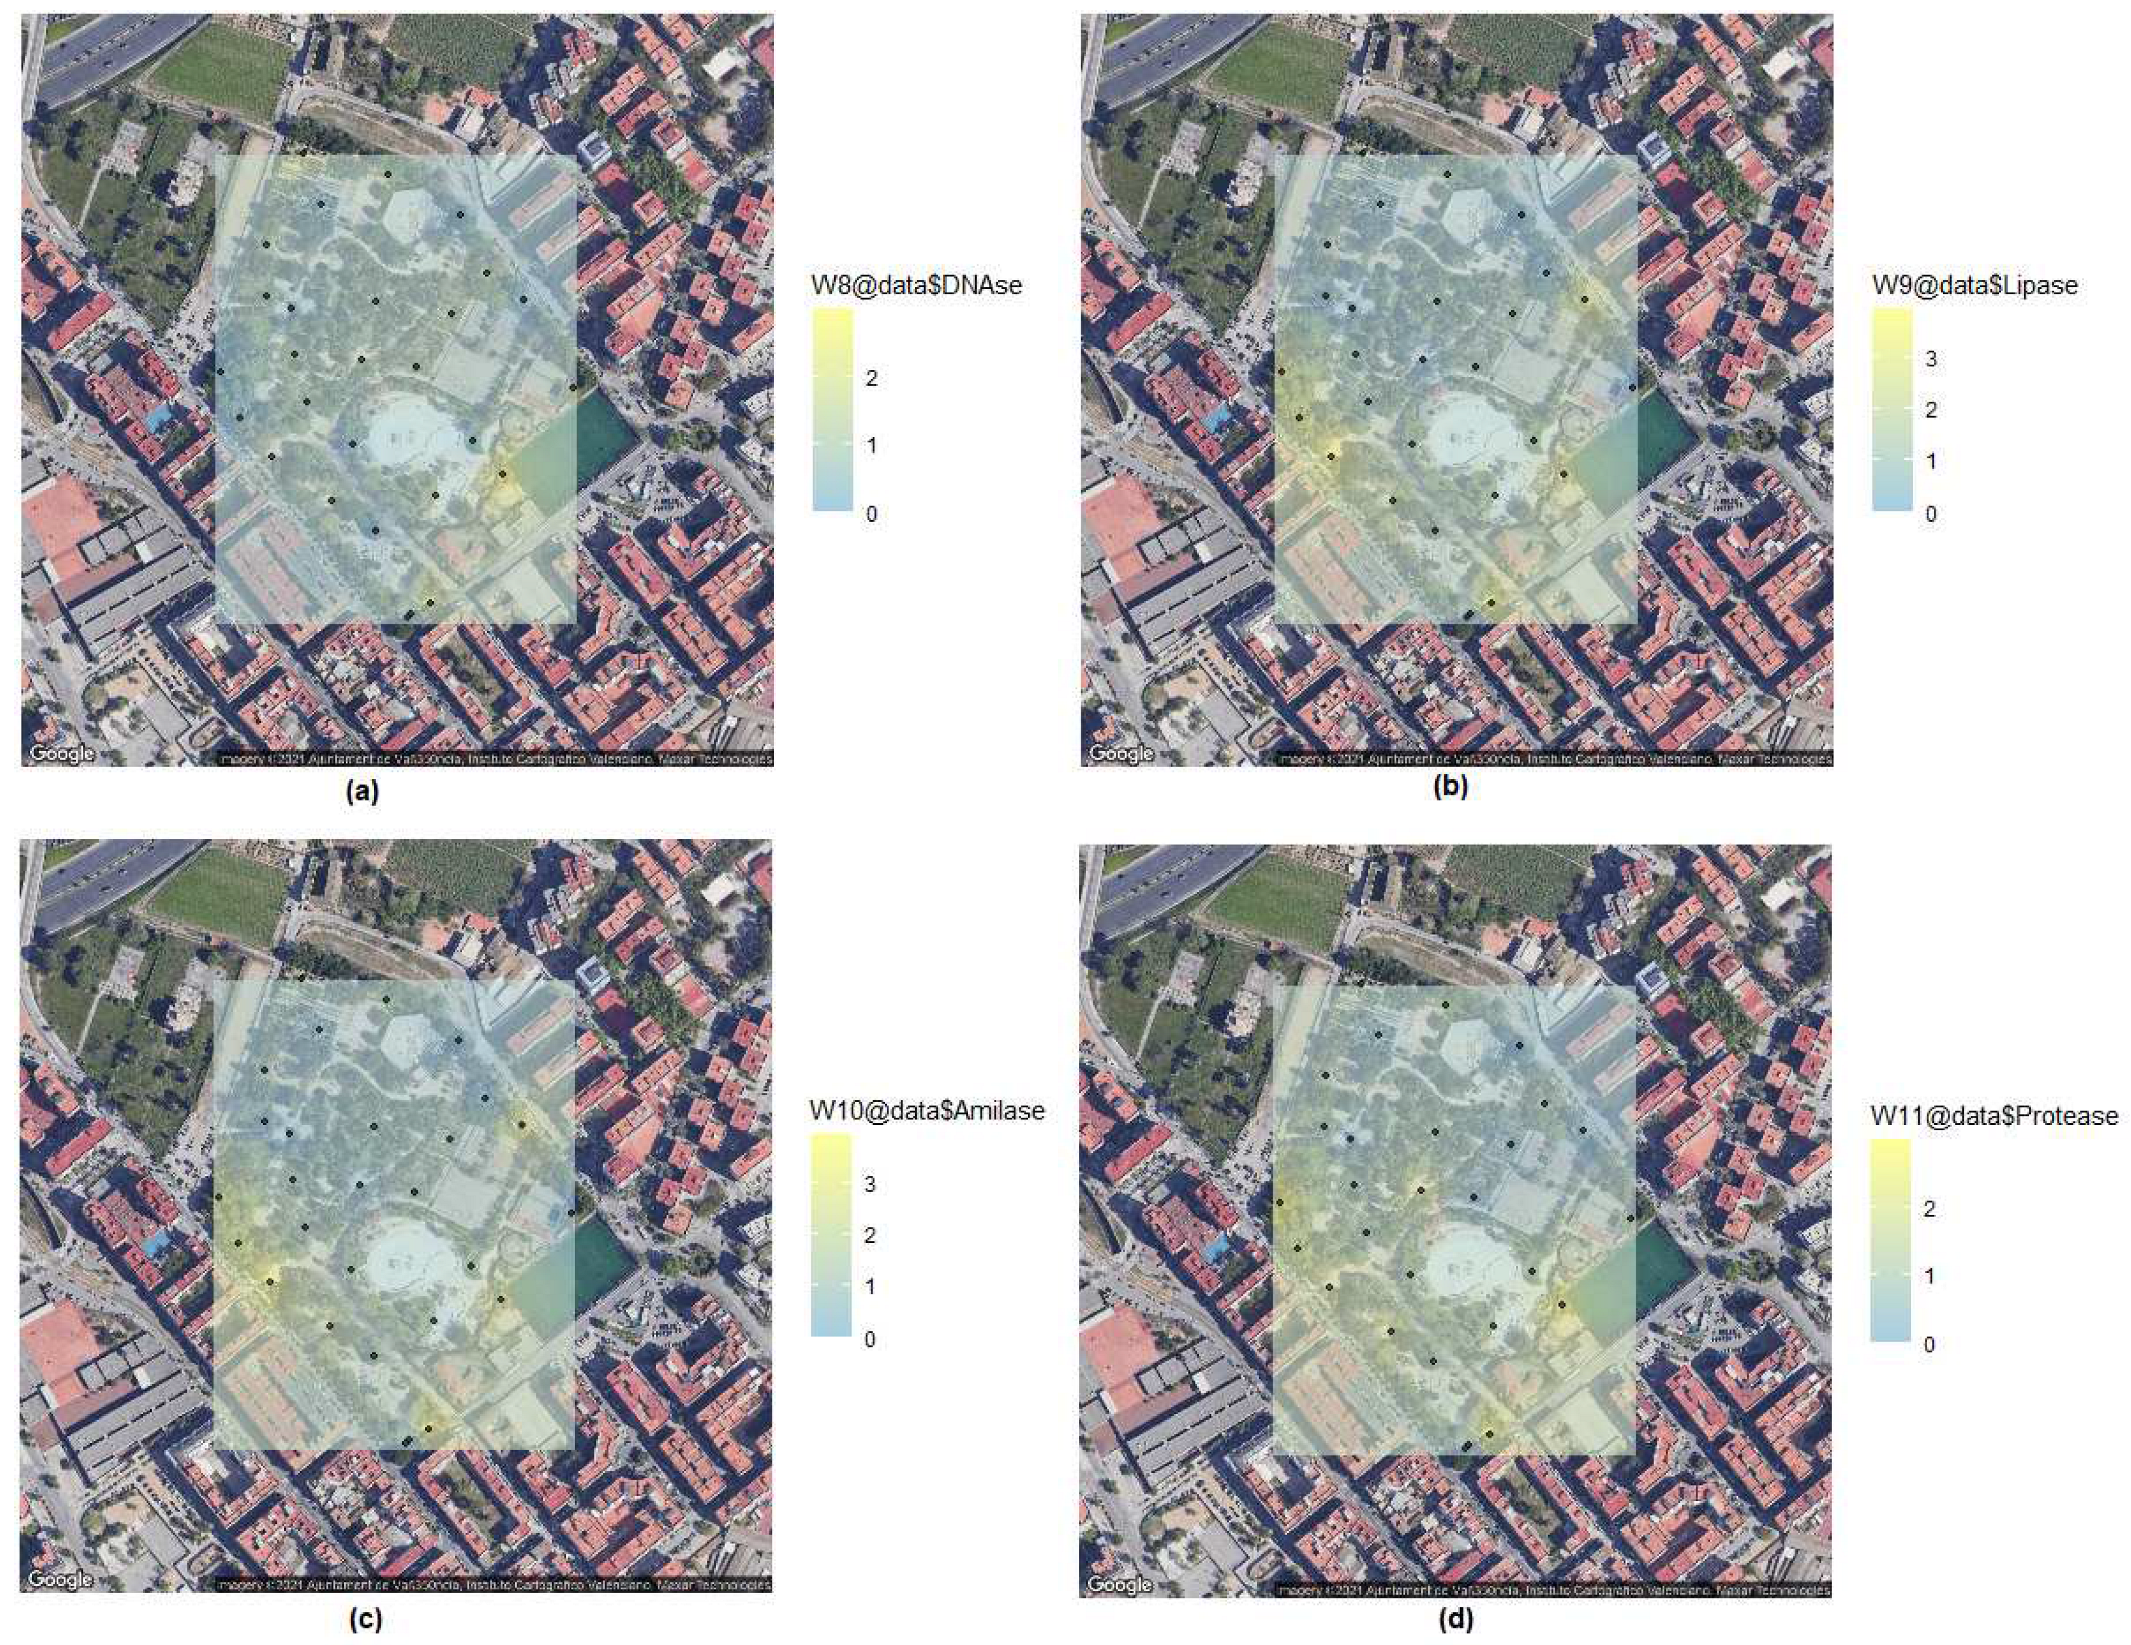
But, more interestingly, urban parks are home to a large number of microorganisms that can be a source of enzymes with industrial applications. We performed a set of four biochemical tests to detect possible enzyme producers of interest with DNase, lipase, amylase and protease activities among all isolated bacteria (
Table 3). Between 10 and 24 isolates tested positive. Distribution of results (Kriging representation) in
Figure 5.
Typically, DNase reaction is an indication of pathogenicity for staphylococci and other pathogenic bacteria in clinical assays [
18]. However, some soil-isolated bacteria produced transparent halos. Other organisms than staphylococci,
Serratia and aeromonads can produce DNases. The presence of extracellular DNA in soil or the disponibility of plasmid or chromosomal DNA from other soil bacteria that share the same ecological niche can be useful for specialized microbial populations with putative industrial uses as those previously described [
19].
4. Conclusions
Parks are indispensable components of urban environments. Their soils, and the microbiota that inhabit them, have a significant physical, chemical, and biological influence on their characteristics. Thus, urban parks play an important ecological role in preserving microbial diversity, while at the same time giving soils the capacity to self-purify pathogenic microorganisms, regulate the greenhouse effect, and other [
20,
21]. The ecological functions of the soil are directly related to the vital activity of the bacterial community that develops. For this reason, the study of these urban parks is of paramount importance.
In this study, we chose to investigate the microbial communities existing in one of the most emblematic urban parks in the city of Valencia. The park is one of the green lungs of the city but also serves as a recreational area, so microbial exchanges must be frequent. Its proximity to a totally urban environment, being completely surrounded by busy streets, allows us to observe whether its ecological function persists, after continuous use for many generations. To this end, we have determined the microbial concentration, mainly bacterial, at different points in the park, carrying out a globalised study using the Kriging strategy.
Despite having soils that are a mixture of various origins, the amount of bacteria detected is fairly uniform, with no levels higher than 1.20x in any of the samplings carried out. The population density has allowed us to obtain a couple of global conclusions. On the one hand, in a significant number of sampling points, we have managed to isolate bacteria capable of inhibiting the growth of control microorganisms. This leads us to believe that the microorganisms that inhabit the park are in intimate contact with the human population. Also, the isolated individuals possessed different enzymatic activities, perhaps in response to the environment, allowing them to degrade different compounds of interest.
Author Contributions
Both authors have prepared the manuscript. All authors have read and agreed to the published version of the manuscript.
Funding
This research received no external funding.
Acknowledgments
We are indebted to our grade students for sampling. We also acknowledge A. Ruvira and D. Ruiz (Spanish Type Culture Collection, CECT, Paterna, Spain) for MALDI-TOF MS analyses.
Conflicts of Interest
The authors declare no conflict of interest.
References
- Al-Delaimy, W.; Webb, M. Community Gardens as Environmental Health Interventions: Benefits Versus Potential Risks. Current environmental health reports 2017, 4, 252–265. [Google Scholar] [CrossRef] [PubMed]
- Mafiz, A.I.; Perera, L.N.; He, Y.; Zhang, W.; Xiao, S.; Hao, W.; Sun, S.; Zhou, K.; Zhang, Y. Case study on the soil antibiotic resistome in an urban community garden. International Journal of Antimicrobial Agents 2018, 52, 241–250. [Google Scholar] [CrossRef] [PubMed]
- Gaston, K.; Warren, P.; Thompson, K.; Smith, R. Urban domestic gardens (IV): The extent of the resource and its associated features. Biodiversity and Conservation 2005, 14, 3327–3349. [Google Scholar] [CrossRef]
- Loram, A.; Tratalos, J.; Warren, P.; Gaston, K. Urban domestic gardens (X): The extent & structure of the resource in five major cities. Landscape Ecology 2007, 22, 601–615. [Google Scholar] [CrossRef]
- Mathieu, R.; Freeman, C.; Aryal, J. Mapping private gardens in urban areas using object-oriented techniques and very high-resolution satellite imagery. Landscape and Urban Planning 2007, 81, 179–192. [Google Scholar] [CrossRef]
- ECDC. ECDC Ears-net Database. https://www.ecdc.europa.eu/en/antimicrobial-resistance/surveillance-and-disease-data/data-ecdc. Online; Accessed 24-August-2021.
- Arnal, D.; Moya, C.; Filippelli, L.; Segura-Garcia, J.; Maicas, S. Bacteria spatial tracking in Urban Park soils with MALDI-TOF Mass Spectrometry and Specific PCR. BioData Mining 2023, 16. [Google Scholar] [CrossRef] [PubMed]
- Thompson, J.; Pollio, A.; Turk, P. Comparison of munsell soil color charts and the globe soil color book. Soil Science Society of America Journal 2013, 77, 2089–2093. [Google Scholar] [CrossRef]
- Arahal, D.R.; Sánchez, E.; Macián, M.C.; Garay, E. Value of recN sequences for species identification and as a phylogenetic marker within the family "Leuconostocaceae". International Microbiology 2008, 11, 33–39. [Google Scholar] [CrossRef]
- Small World Initiative. Crowdsourcing antibiotic discovery. https://www.smallworldinitiative.org/about, 2019. Online; Accessed 27-December-2019.
- Altschul, S.F.; Gish, W.; Miller, W.; Myers, E.W.; Lipman, D.J. Basic local alignment search tool. Journal of Molecular Biology 1990, 215, 403–410. [Google Scholar] [CrossRef] [PubMed]
- Maier, T.; Klepel, S.; Renner, U.; Kostrzewa, M. Fast and reliable MALDI-TOF MS-based microorganism identification. Nature Methods 2006, 3, i–ii. [Google Scholar] [CrossRef]
- Isaaks, E.-H.; Srivastava, R.M. An Introduction to Applied Geostatistics; Oxford University Press: New York, NY, USA, 1989. [Google Scholar]
- Cressie, N. Statistics for Spatial Data; John Wiley: New York, NY, USA, 1993. [Google Scholar]
- Madigan, M.; Bender, D.; Buckley, D.; Sattley, W.; Stahl, D. Brock Biology of Microorganisms, 15th Edition; Pearson: London, UK, 2018. [Google Scholar]
- Maicas, S.; Fouz, B.; Figàs-Segura, A.; Zueco, J.; Rico, H.; Navarro, A.; Carbó, E.; Segura-Garcia, J.; Biosca, E. Implementation of Antibiotic Discovery by Student Crowdsourcing in the Valencian Community Through a Service Learning Strategy. Frontiers in Microbiology 2020, 11. [Google Scholar] [CrossRef]
- Maicas, S.; Segura-Garcia, J. Spatial distribution of antibiotic-producing bacteria in urban areas. A case study in Valencia (Spain). IEEE/ACM Transactions on Computational Biology and Bioinformatics 2020. [CrossRef]
- Kateete, D.; Kimani, C.; Katabazi, F.; Okeng, A.; Okee, M.; Nanteza, A.; Joloba, M.; Najjuka, F. Identification of Staphylococcus aureus: DNase and Mannitol salt agar improve the efficiency of the tube coagulase test. Annals of Clinical Microbiology and Antimicrobials 2010, 9. [Google Scholar] [CrossRef] [PubMed]
- Ten, L.; Liu, Q.M.; Im, W.T.; Lee, M.; Yang, D.C.; Lee, S.T. Pedobacter ginsengisoli sp. nov., a DNase-producing bacterium isolated from soil of a ginseng field in South Korea. International Journal of Systematic and Evolutionary Microbiology 2006, 56, 2565–2570. [Google Scholar] [CrossRef] [PubMed]
- Nannipieri, P.; Ascher, J.; Ceccherini, M.T.; Landi, L.; Pietramellara, G.; Renella, G. Microbial diversity and soil functions. European Journal of Soil Science 2003, 54, 655–670. [Google Scholar] [CrossRef]
- Lysak, L.V.; Lapygina, E.V. The Diversity of Bacterial Communities in Urban Soils. Eurasian Soil Science 2018, 51, 1050–1056. [Google Scholar] [CrossRef]
|
Disclaimer/Publisher’s Note: The statements, opinions and data contained in all publications are solely those of the individual author(s) and contributor(s) and not of MDPI and/or the editor(s). MDPI and/or the editor(s) disclaim responsibility for any injury to people or property resulting from any ideas, methods, instructions or products referred to in the content. |
© 2023 by the authors. Licensee MDPI, Basel, Switzerland. This article is an open access article distributed under the terms and conditions of the Creative Commons Attribution (CC BY) license (http://creativecommons.org/licenses/by/4.0/).
