1. Introduction
Quality assurance plays a crucial role in a neutron activation analysis laboratory as it guarantees the accuracy and predictability of the data obtained. It contributes to laboratory safety and enhances the overall quality of the laboratory [
1,
2]. Good practices and quality standards are key components in achieving quality assurance. These standards specify various methods that organizations can adopt to achieve their desired level of quality.
For the longevity and efficiency of the laboratory, it is imperative to keep the facilities and equipment up-to-date and well-maintained. Researchers must be educated on the prevailing standards and practices in their field. Furthermore, it is crucial to keep the resources and services supporting laboratory operations current and updated. Gamma detectors are a crucial piece of equipment in this regard [
1,
2].
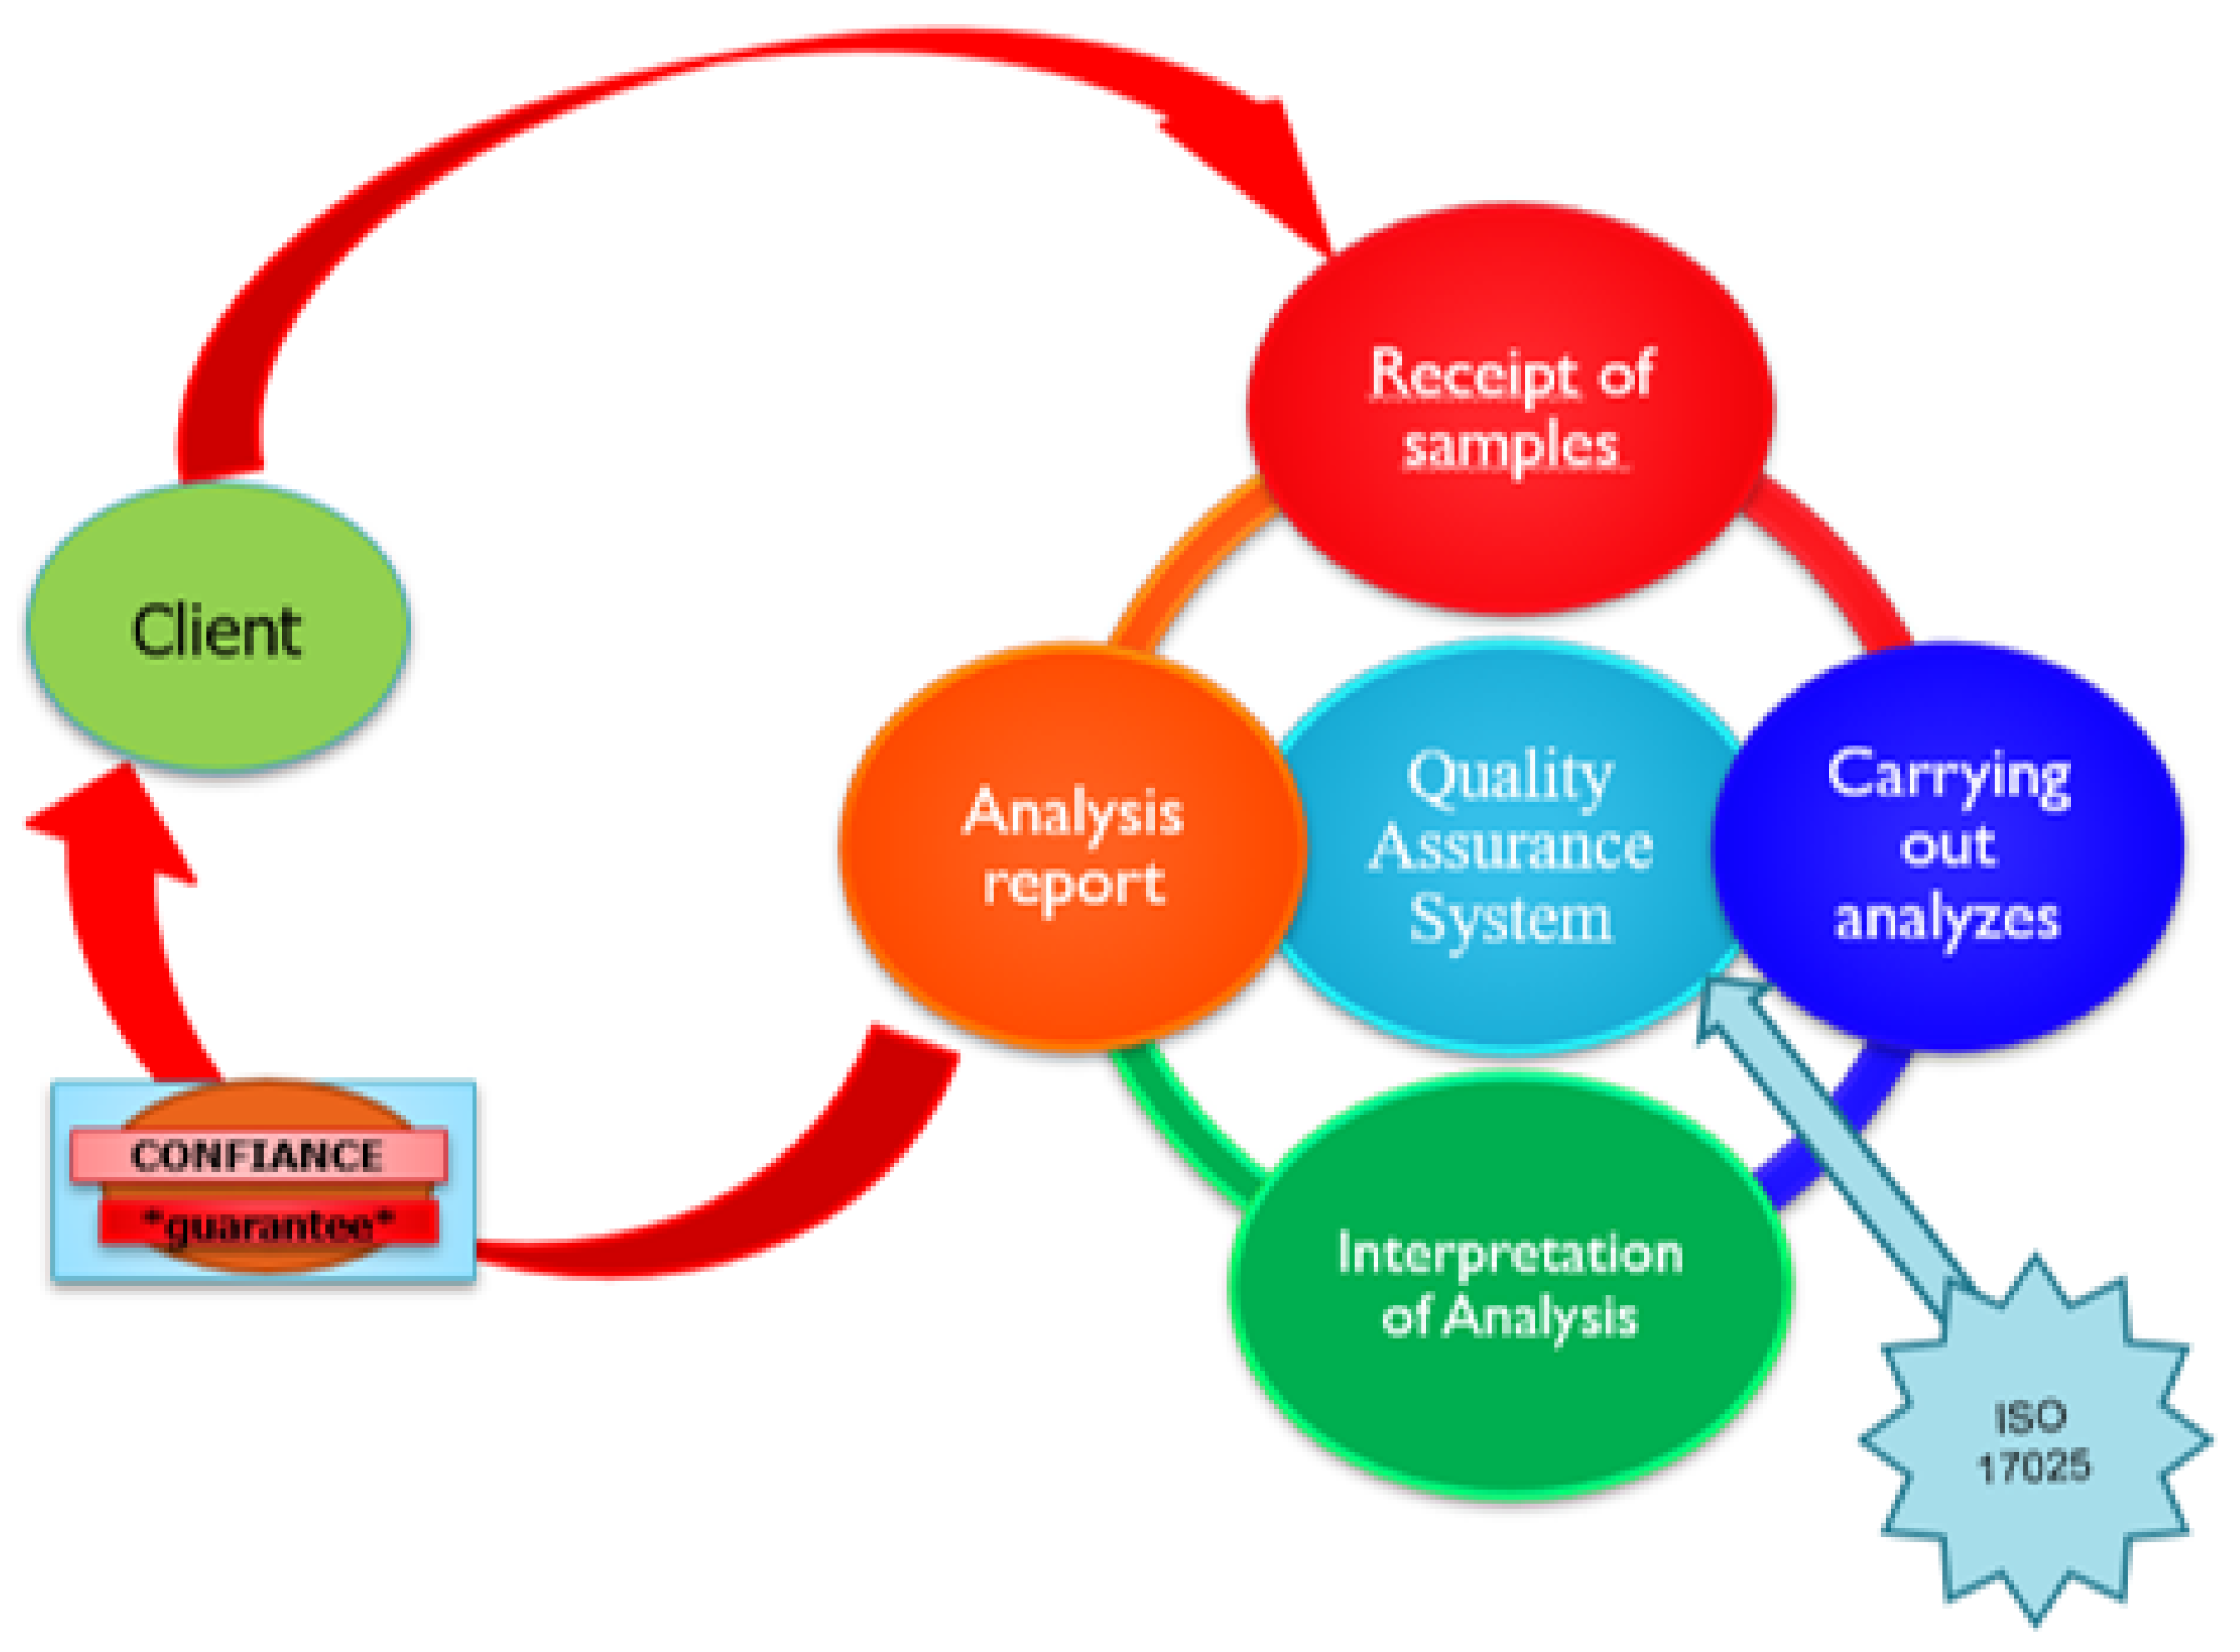
Gamma detectors are vital for laboratories as they allow for the detection of radiation and radioactive contaminants without altering the samples. These detectors also provide additional information that helps identify the chemical properties of samples. Quality assurance of High Purity Germanium (HPGE) detectors in a neutron activation laboratory is a critical process. This process involves verifying the agreement between the signal and the measured concentration, as well as the expected values of the samples. Quality assurance of HPGE detectors also supplies information about their ability to meet customer requirements and provide consistent and reliable data that aligns with ISO 17025 (as illustrated in
Figure 1) [
1,
2].
In the context of neutron activation analysis laboratory, gamma spectrometry is a measurement technique that detects emitted gamma rays by converting the energy deposited in a suitable detector material into an electrical signal. The processing of these signals produces a histogram referred to as a spectrum [
3,
4,
5].
This research focuses on two critical parameters, namely efficiency and resolution. The results of this research provide valuable information for the validation and confidence in the laboratory’s detectors.
Generally, gamma rays are emitted as a result of the de-excitation of atomic nuclei. They have a distinct energy that characterizes the emitting nucleus and, thus, serve as a means of identifying radioactive elements. Additionally, the area of a gamma spectrum represents the quantity of the emitting radioactive element, provided that the active acquisition times, the radioactive period of the isotopes being measured, and the emission intensity of the observed spectrum are known.
The analysis of the measured spectra enables the identification of various radioactive elements and the determination of their concentration in the studied sample [
3,
4,
5].
2. Materials and Methods
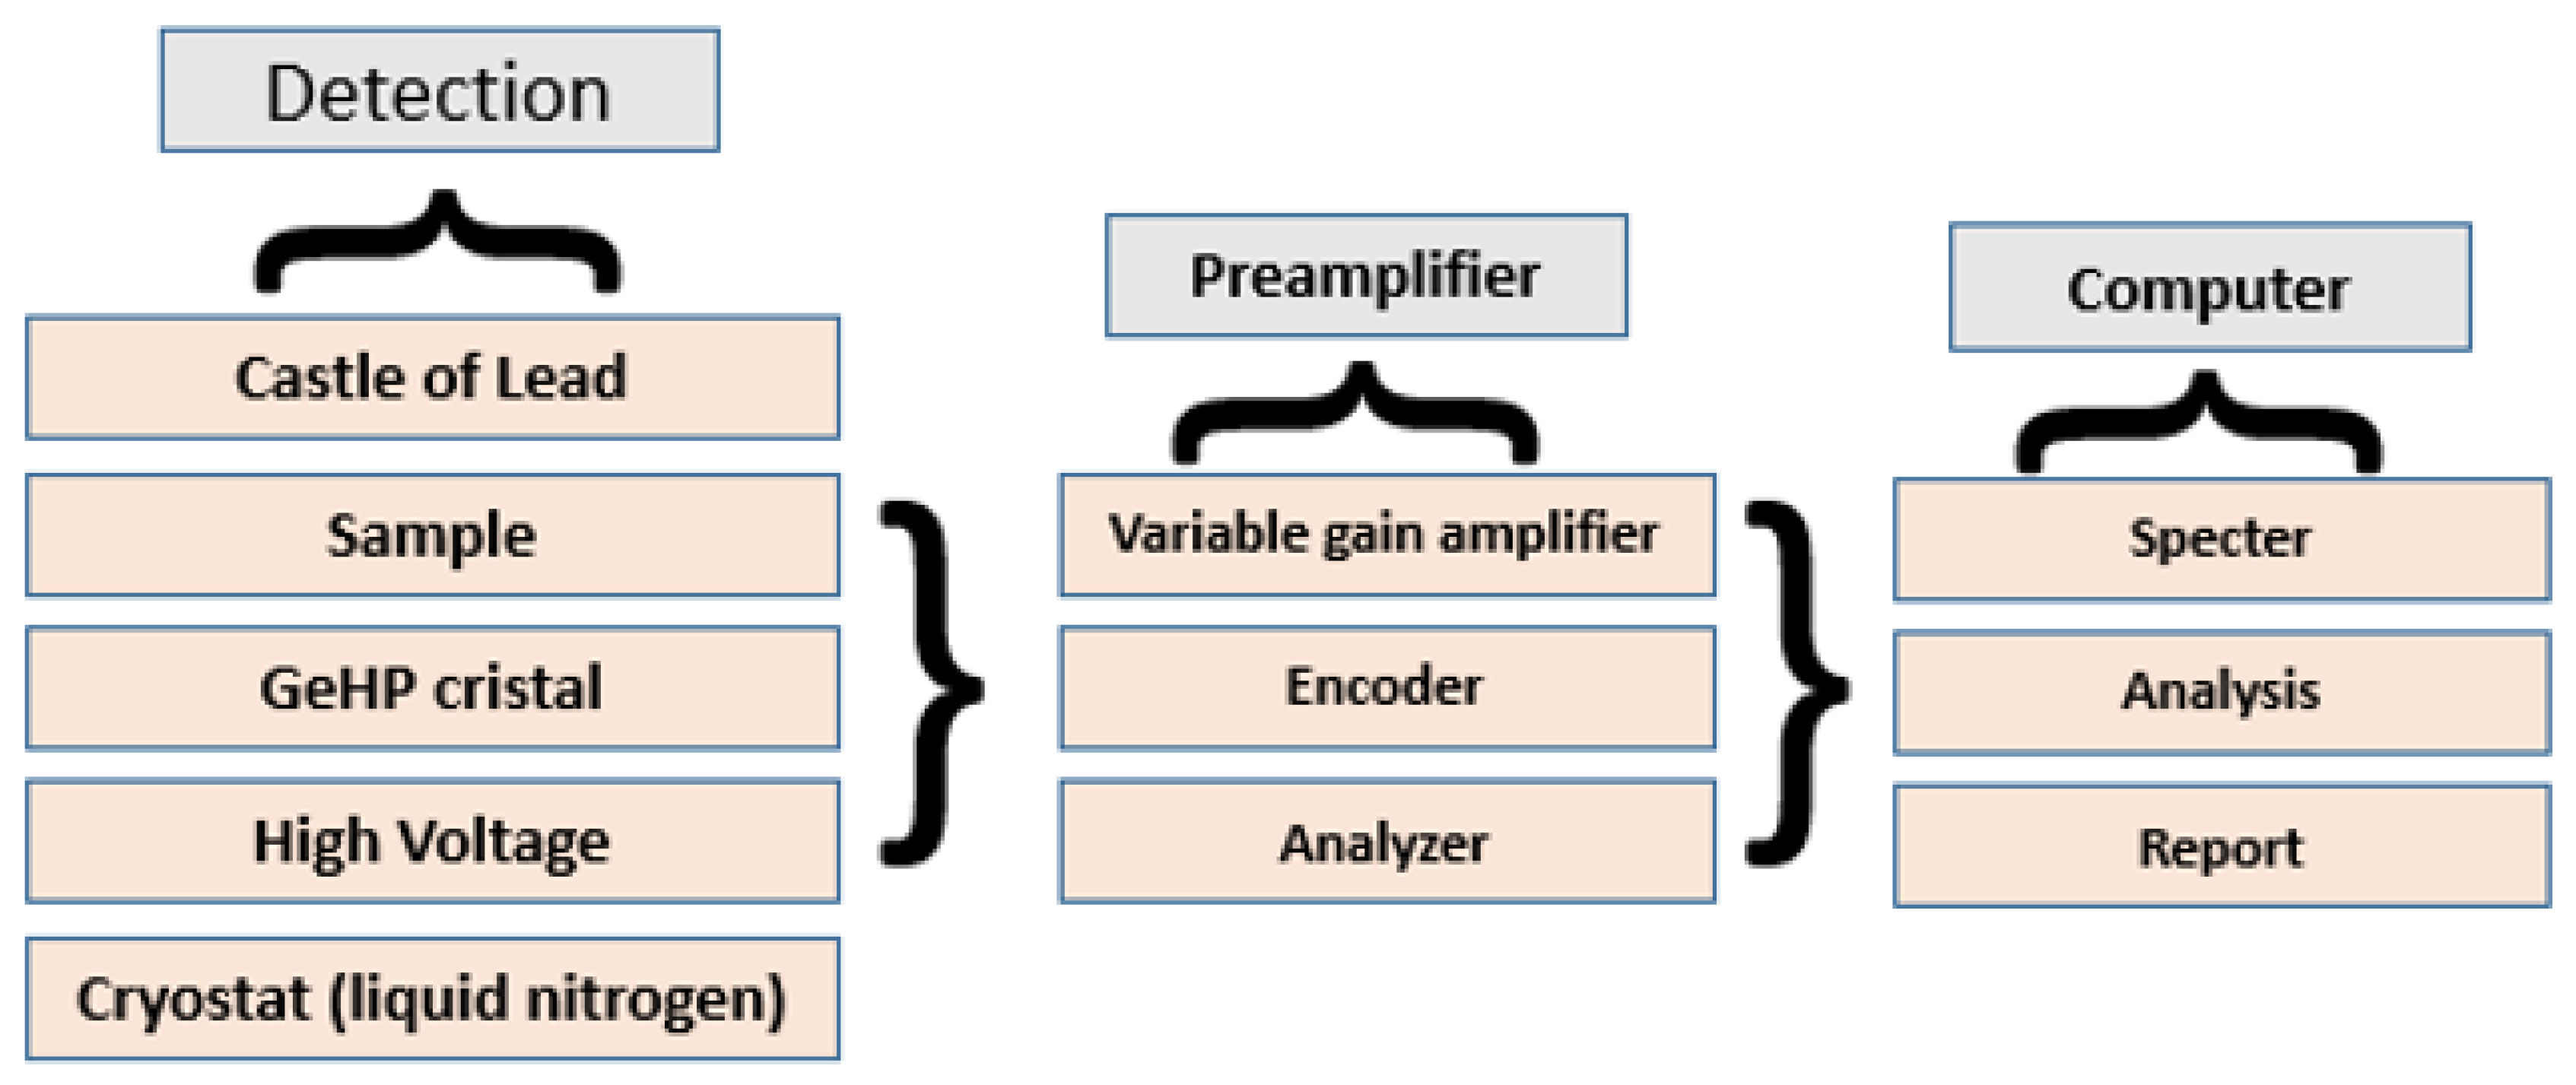
The schematic representation of the spectrometer’s chain is depicted in
Figure 2 and comprises several components, including a detection system that transforms gamma rays into electrical pulses. The sensitive component of this system is a High Purity Germanium (HPGe) crystal, and the associated electronics comprise a pre-amplifier, an amplifier for amplifying electrical pulses, an analog-to-digital converter, and a multi-channel analyzer that processes the electrical signals and presents them as a full spectrum of gamma radiation. The software used for signal processing and analysis is an integral part of this system [
6].
In general, modern radiation detection systems operate based on different principles, such as the ionization of gases (as in the case of Geiger-Müller counters), the excitation of crystals resulting from luminescence (as in scintillation detectors), and the ionization of solids (as in semiconductor detectors).
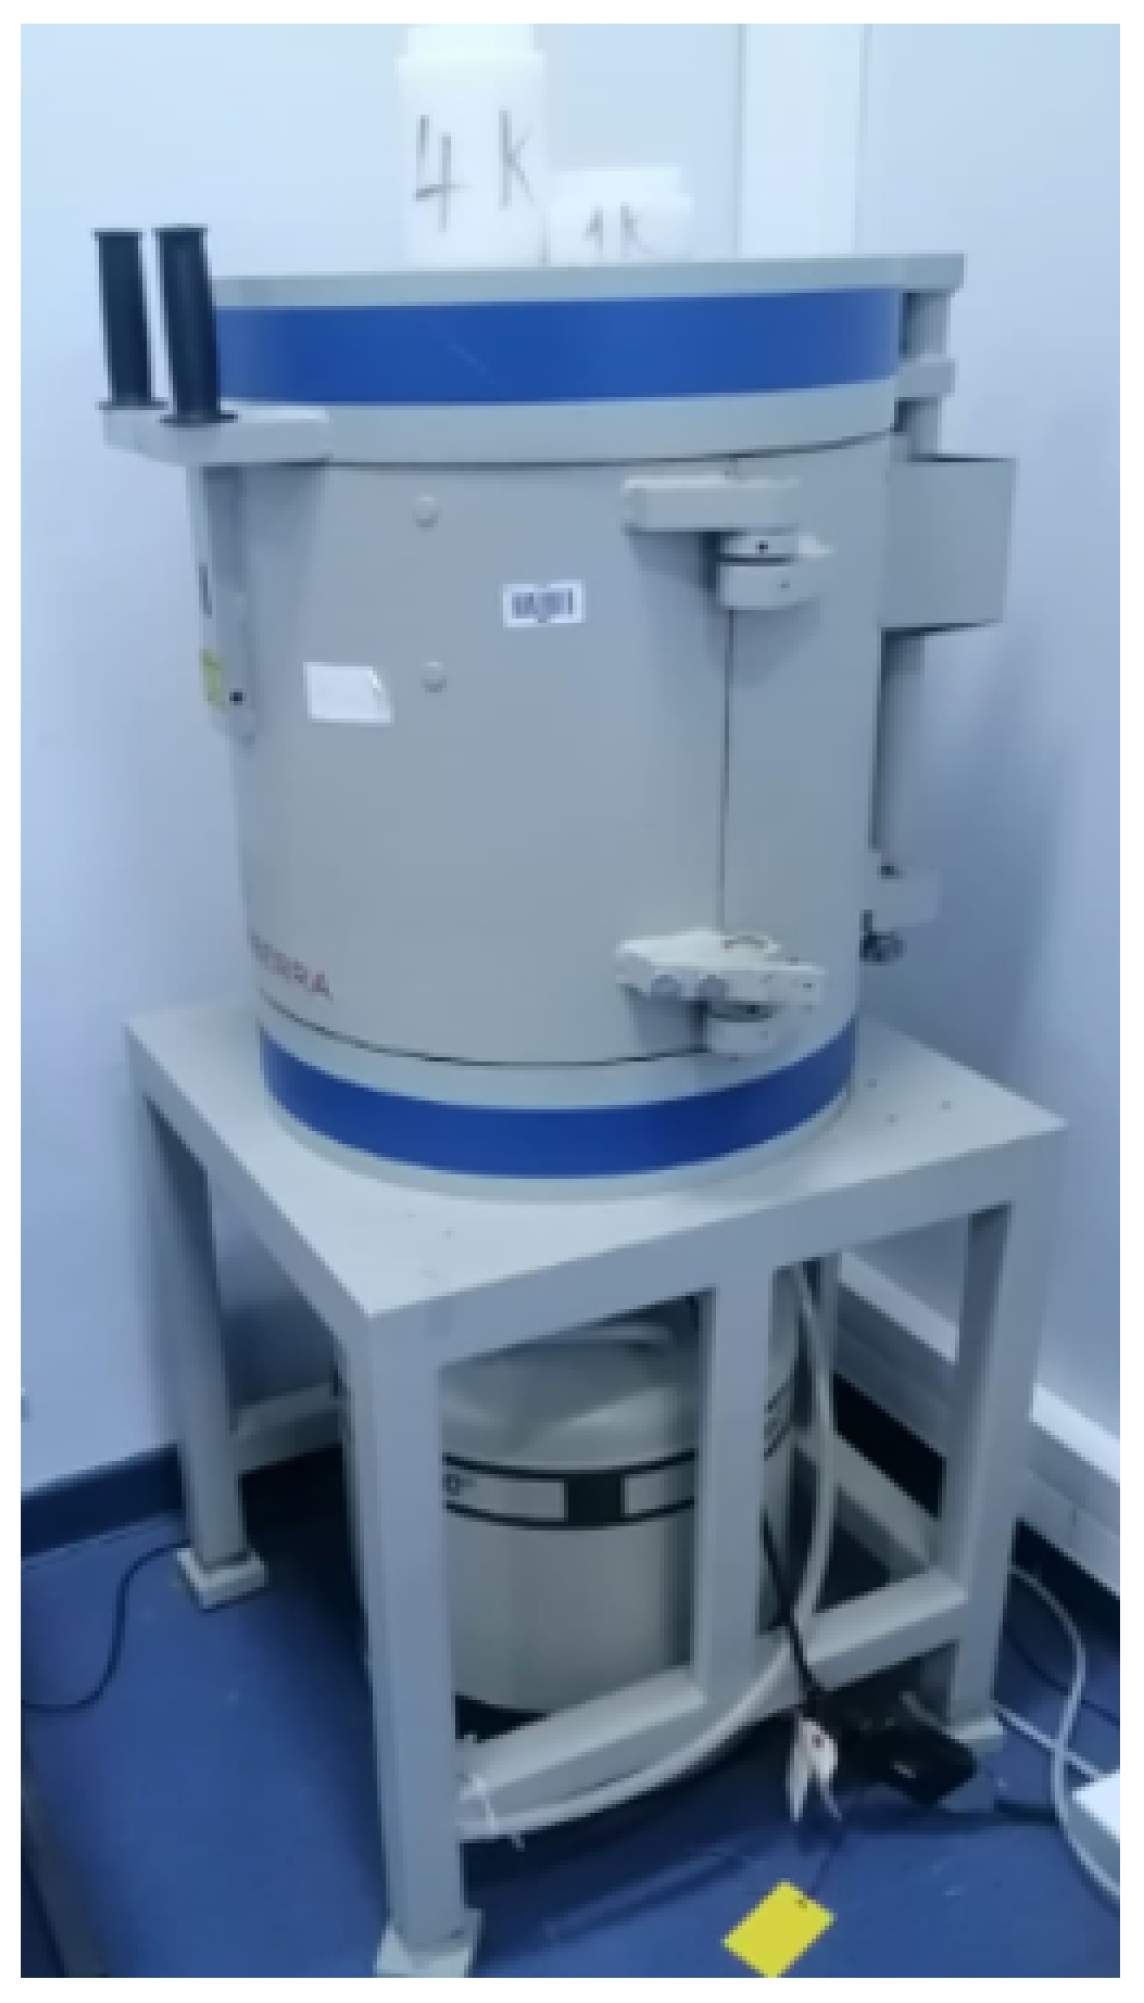
In this research, gamma radiation counting was performed using Hyper Pure Germanium (HPGe) detectors, which were shielded from external radiation by a lead castle (as depicted in
Figure 3). The crystal of the detector was maintained at a low temperature of -196°C using a vacuum cryostat filled with liquid nitrogen (as shown in
Figure 3). This was done to prevent the recording of electrical pulses originating from simple thermal agitation, as such pulses would be numerous and would quickly degrade the detector’s performance. However, at such low temperatures, the thermal noise is low enough to ensure high resolution.
The knowledge of the detector’s characteristics, such as efficiency and resolution, is crucial in obtaining reliable and accurate information regarding the radioelement concentration. This information also enables the adjustment and optimization of the detection system for more precise subsequent analyses. Efficiency and resolution are considered to be the main factors that determine the success of a spectrometric analysis.
Efficiency refers to the quality of detection of gamma radiation from an irradiated sample and primarily depends on the energy of the incident gamma radiation. Only a fraction of the radiation emitted by a source is recorded by the measurement system, and the efficiency is evaluated as a percentage, calculated using the following formula (1):
The second important parameter is resolution, which quantifies a detector’s ability to distinguish between peaks. It is defined by the Full Width at Half Maximum (FWHM) of a peak, expressed in KeV. The resolution is dependent on the energy of the incident radiation, with higher energy resulting in lower resolution. However, this disadvantage is offset by the fact that high energy results in fewer peaks compared to low energy. As part of our participation in establishing the quality assurance system within the AAN laboratory, we began by improving the laboratory equipment, starting with the detector. Mastering this element is crucial for enhancing the quality of the results of the Neutron Activation Analysis laboratory. To achieve this, the following objectives must be met:
Conduct the necessary technical operations to ensure proper operation of the equipment.;
Control the usage of equipment;
Create control charts for measuring instruments
Ensure the quality of test results.
We started with the efficiency test, which involves measuring the number of gamma detected at different energies at various distances. The following protocol was followed:
A point radioactive source of Eu-152 was placed in the detector;
The program that drives the gamma spectrometer for counting was launched;
The number of gamma detected was recorded for the energies of 121.78 KeV, 244 KeV, 344.28 KeV, 411 KeV, 443.96 KeV, 778.9 KeV, 964 KeV, 1112.07 KeV, and 1408 KeV;
The efficiency () was calculated using the following formula (2):
The following parameters were utilized in the experiment:
Counts: the number of gamma rays detected;
A(t): the activity of the source at time t;
I: the intensity of the emitted energy;
t: the counting time (live time).
The experiment was performed using a High Purity Germanium detector at varying distances (ranging from 0K to 7K) with a point source of Europium 152. The reference for the source is as follows: the reference date was November 21st, 2018 at 12h UTC with an initial activity of 37 kBq per unit area of 28 mg/cm², and with a diameter of 25 mm.
After conducting the efficiency test, the resolution test was performed. This test involved the following procedure: first, a point radioactive source of cobalt (Co-60) was placed at known and variable distances from the detector (ranging from 0K to 7K), with each distance (K) corresponding to a distance defined in
Table 1. Second, the program driving the gamma spectrometer was initiated for counting. Finally, the width at half height (FWHM) of the two peaks of Co-60, namely 1173.2 KeV and 1332.5 KeV, was recorded based on the distance.
At the conclusion of the efficiency and resolution tests and to ensure conformity, a control card must be implemented. This card enables us to monitor the production process and guarantee that the controlled variables remain consistent or meet the specified requirements, allowing for some inherent variability. The aim is to eliminate assignable causes and minimize random causes. Every process has inherent variability, which is the result of the combined impact of numerous small uncontrollable factors. These factors are associated with the combination of five components that make up a manufacturing process: machines, methods, materials, labor, and environment. These causes are referred to as random causes as they are not controllable. If they are not excessive, the process performance remains acceptable. A process with only random causes of variation is considered a stable and predictable process and is said to be in a state of statistical control. Random causes cannot be completely eliminated. There are other sources of variability in a process, resulting in exceptional dispersion, caused by four main factors: machine malfunctions, operator error, non-conforming material, and exceptional changes in the environment.
Ensuring the quality of the results is not a discretionary task. It is a crucial tool for the director and their team to guarantee the performance of their operations and to assure the quality of the results obtained during laboratory analysis. The laboratory has established quality processes, including the Z-Score, which is a unitless quantity that provides the relative difference between the laboratory measurement and the target value. A negative Z-score signifies that the measured value is below the average value, whereas a positive Z-score indicates that the measured value is above the average value.
The Z-score is calculated by the following formula (4):
where,
Measured value: is the result measured in the laboratory,;
Average value: Average value of all measurements.
3. Results
3.1. Resolution of detector D01:
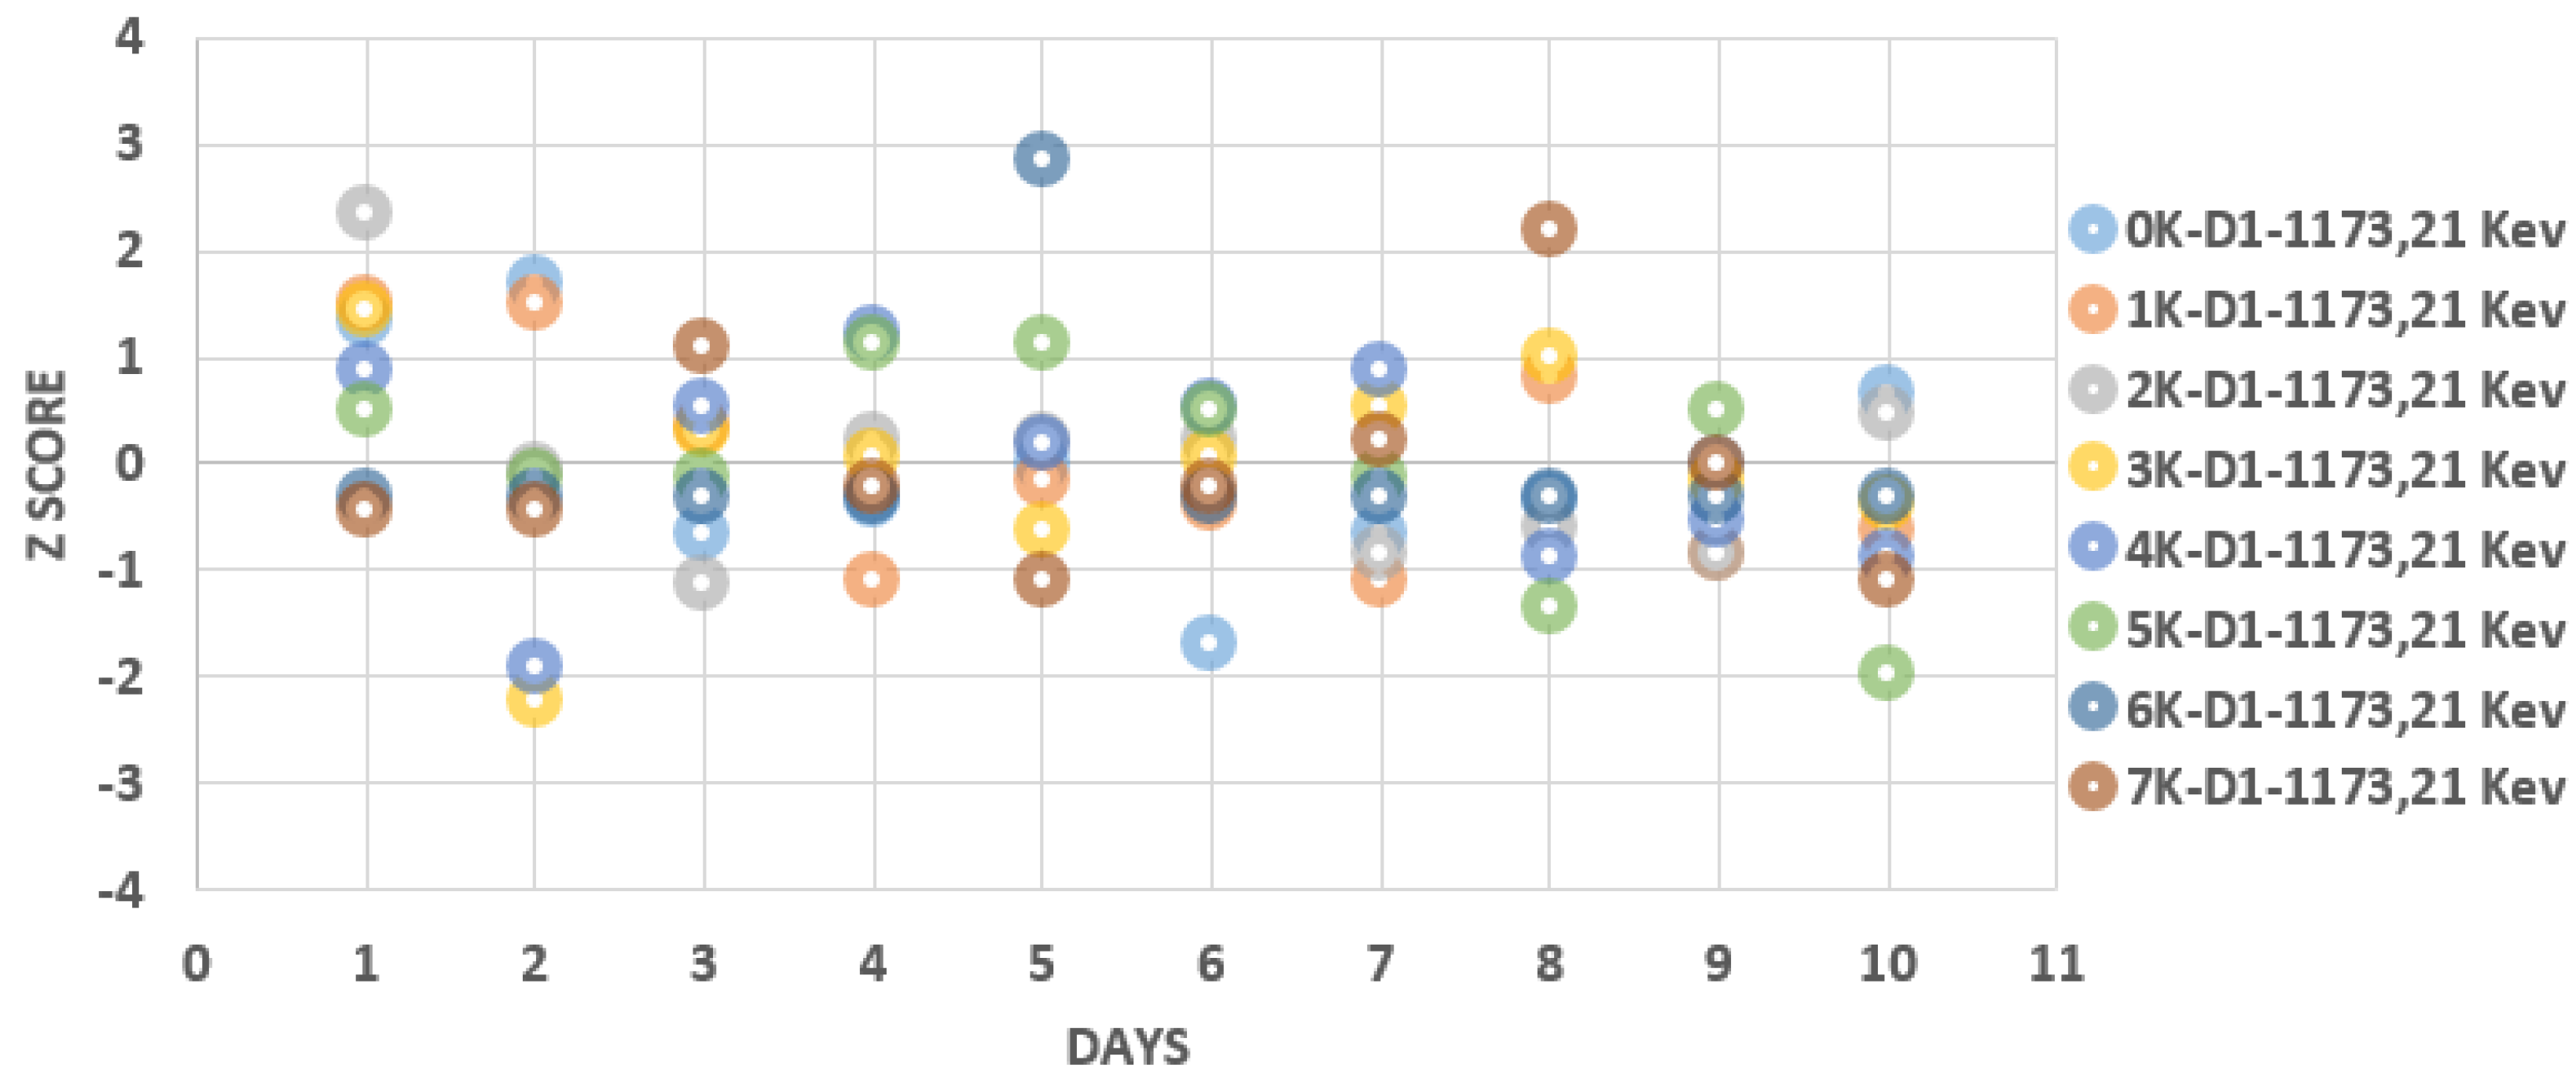
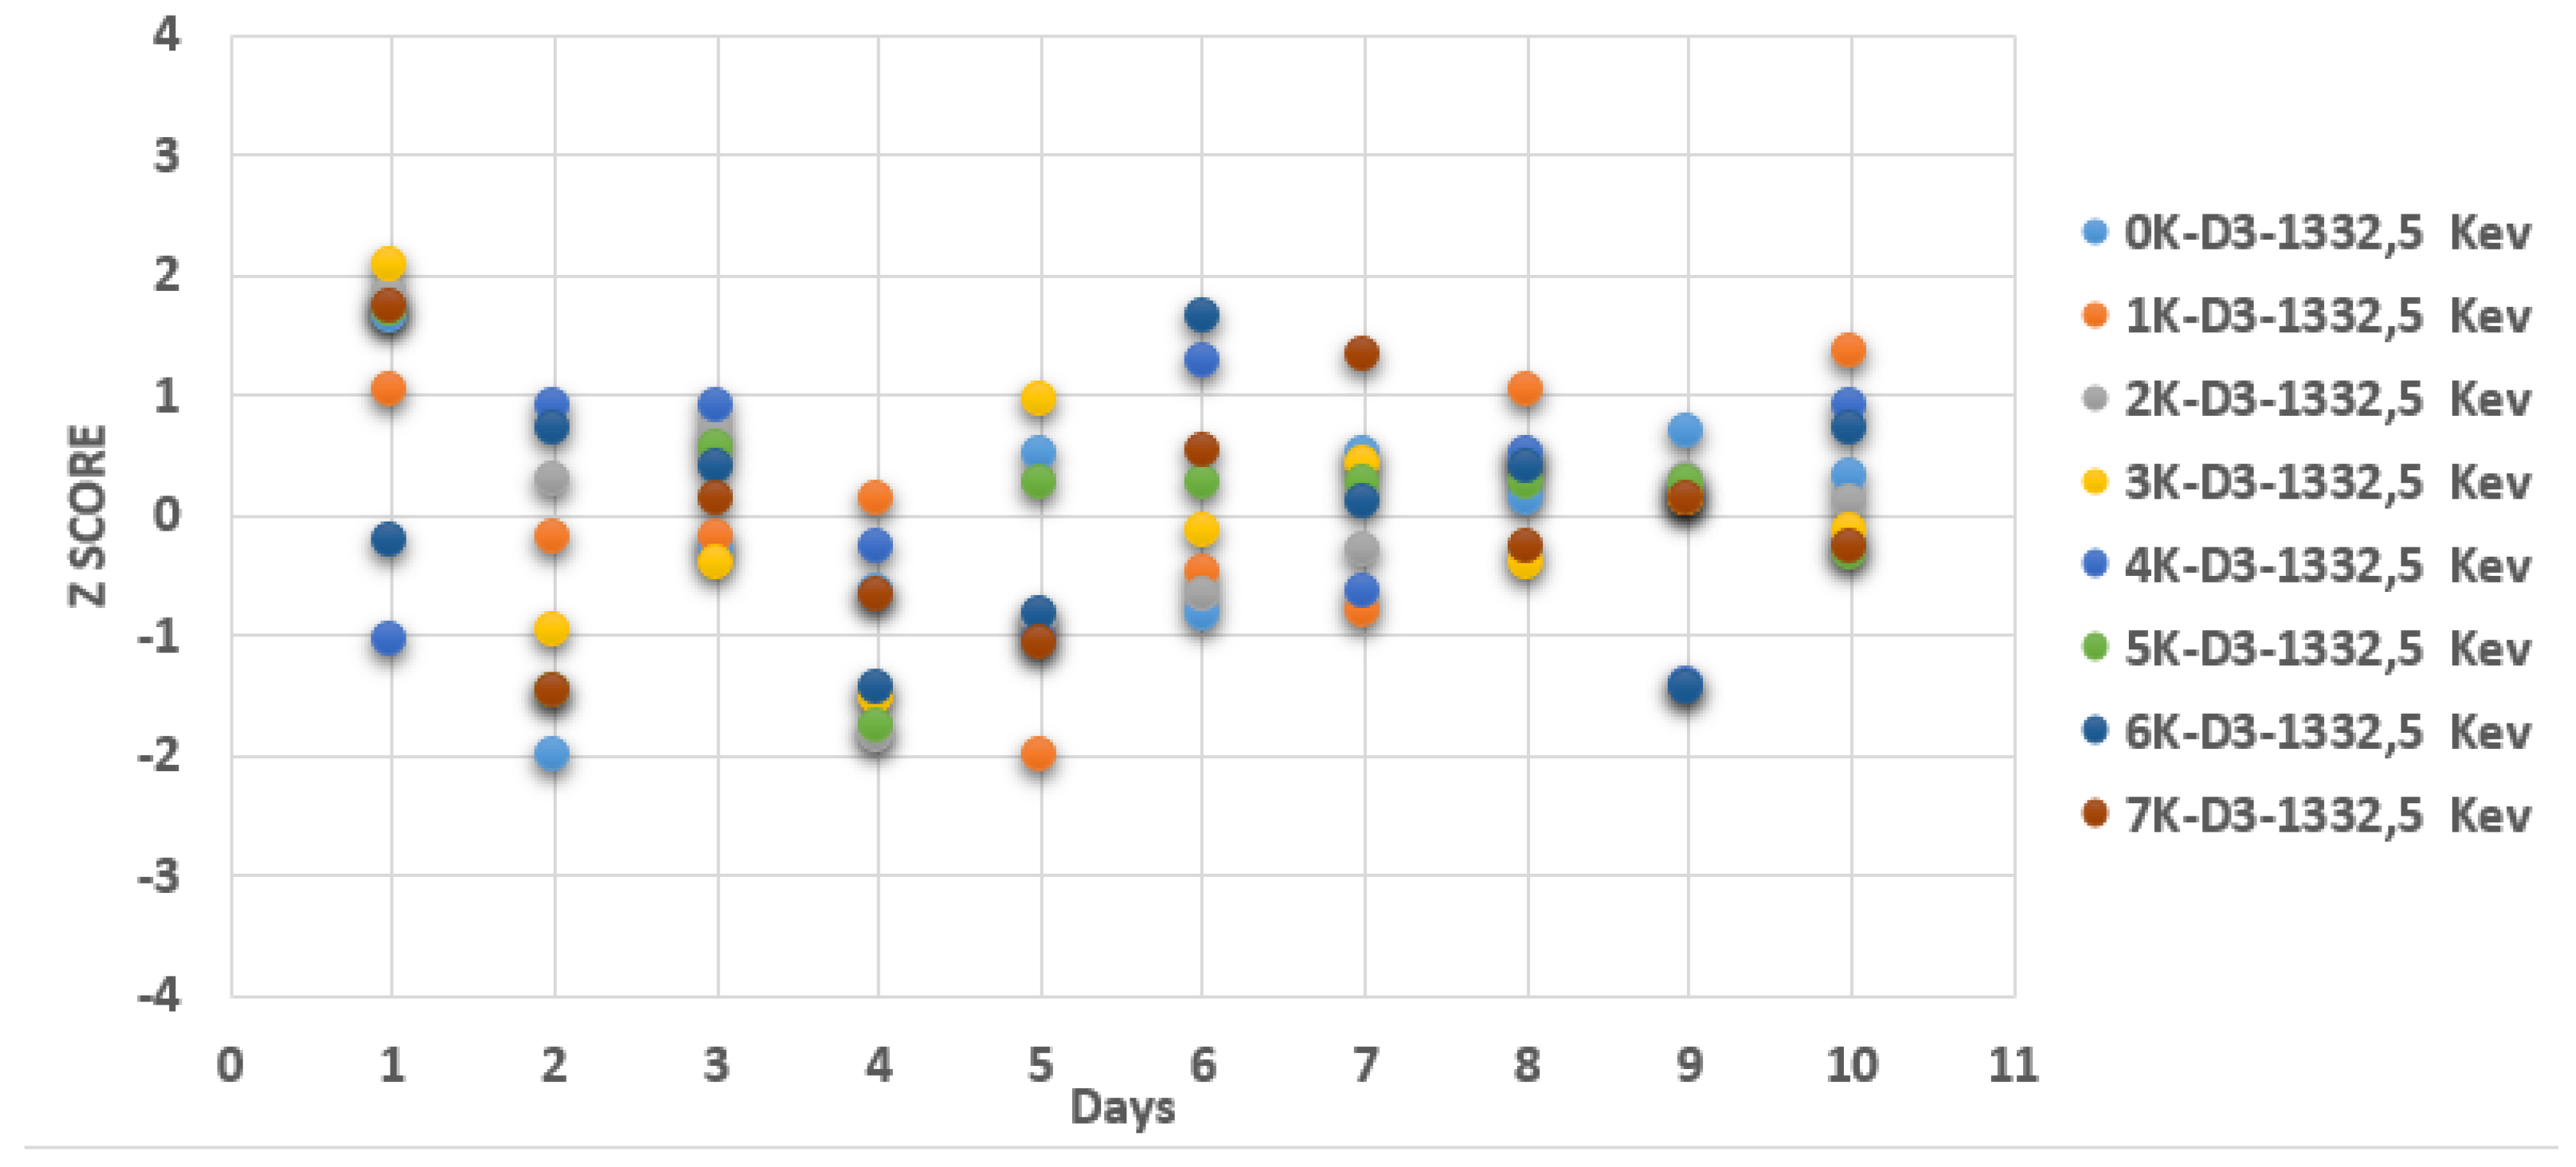
The Z-Score was calculated for the D01 detector resolution test measurements taken at varying distances (ranging from 0K to 7K) from the cobalt 60 source, at energies 1173.2 KeV and 1332.5 KeV, over different days. The calculation was performed using the aforementioned formula and the Excel program. The results of this calculation are presented in the following graphs of
Figure 4 and
Figure 5, with control limits of 3 and -3.
The analysis of the results reveals that the majority of the data points are within the control band centered around the central axis. On the second day, a few points are observed near the upper control limit (+3 and -3), indicating that the measurements taken during this particular verification are within control limits.
It is observed that all the data points fall within the vicinity of the average value, with a few points from the second day of the test located near the upper control limit (+3 and -3). This indicates that the measurements taken are in good order.
3.2. Efficiency of detector D01:
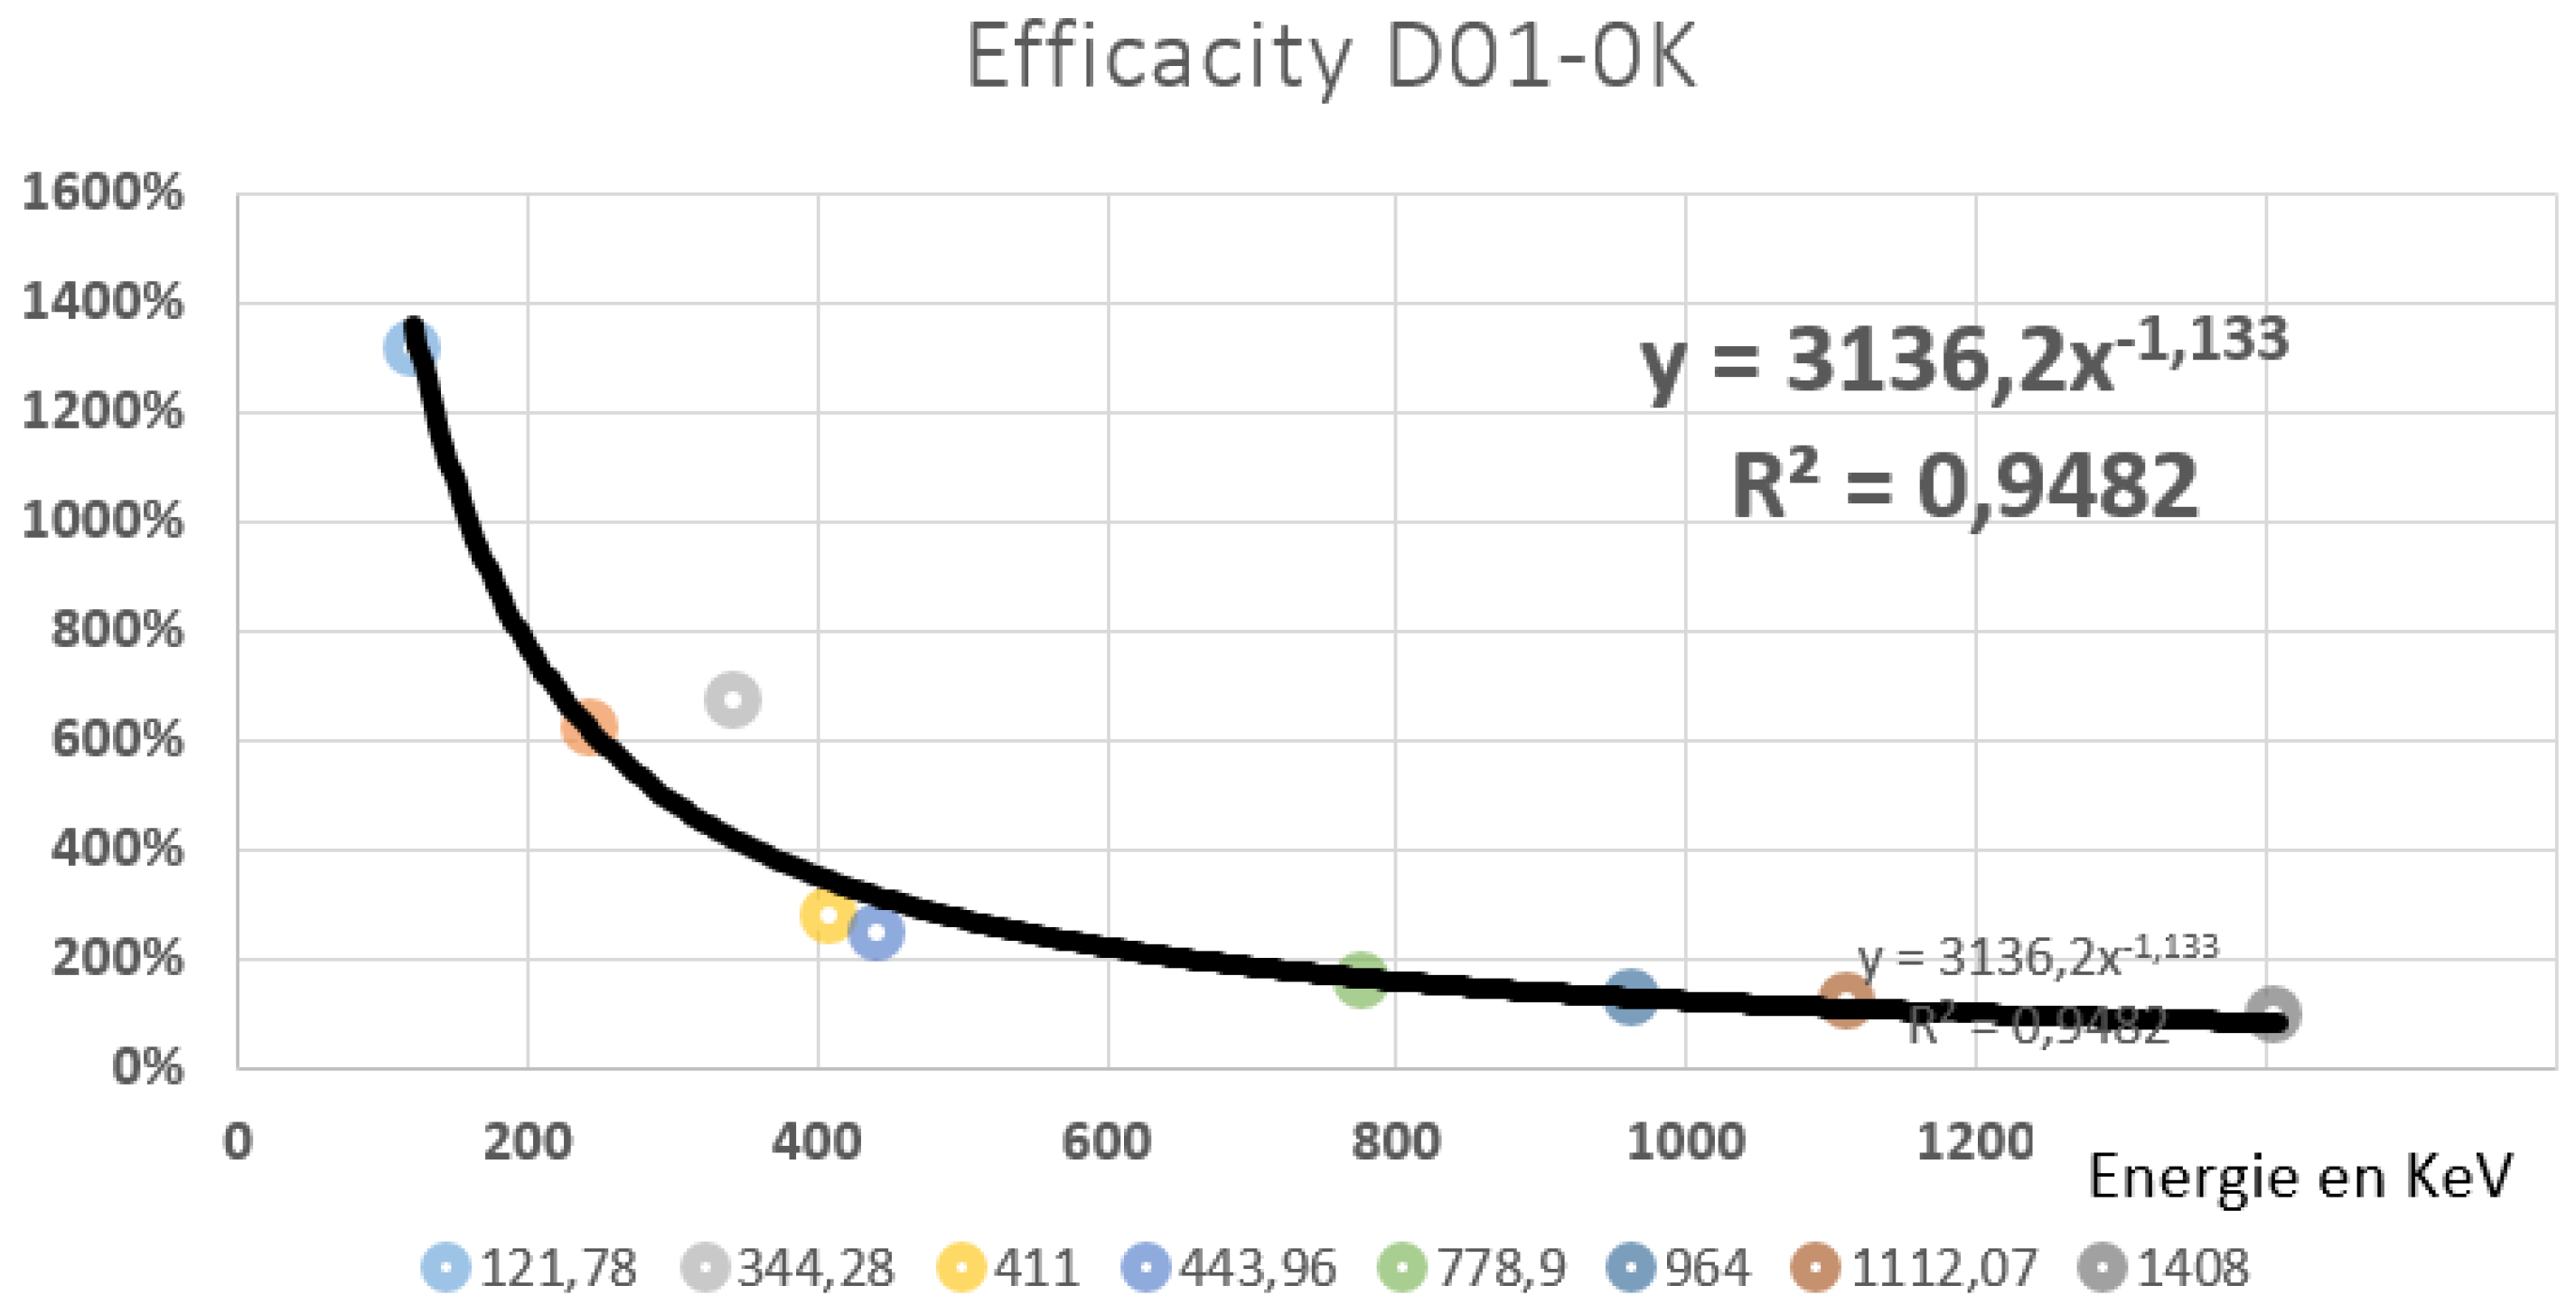
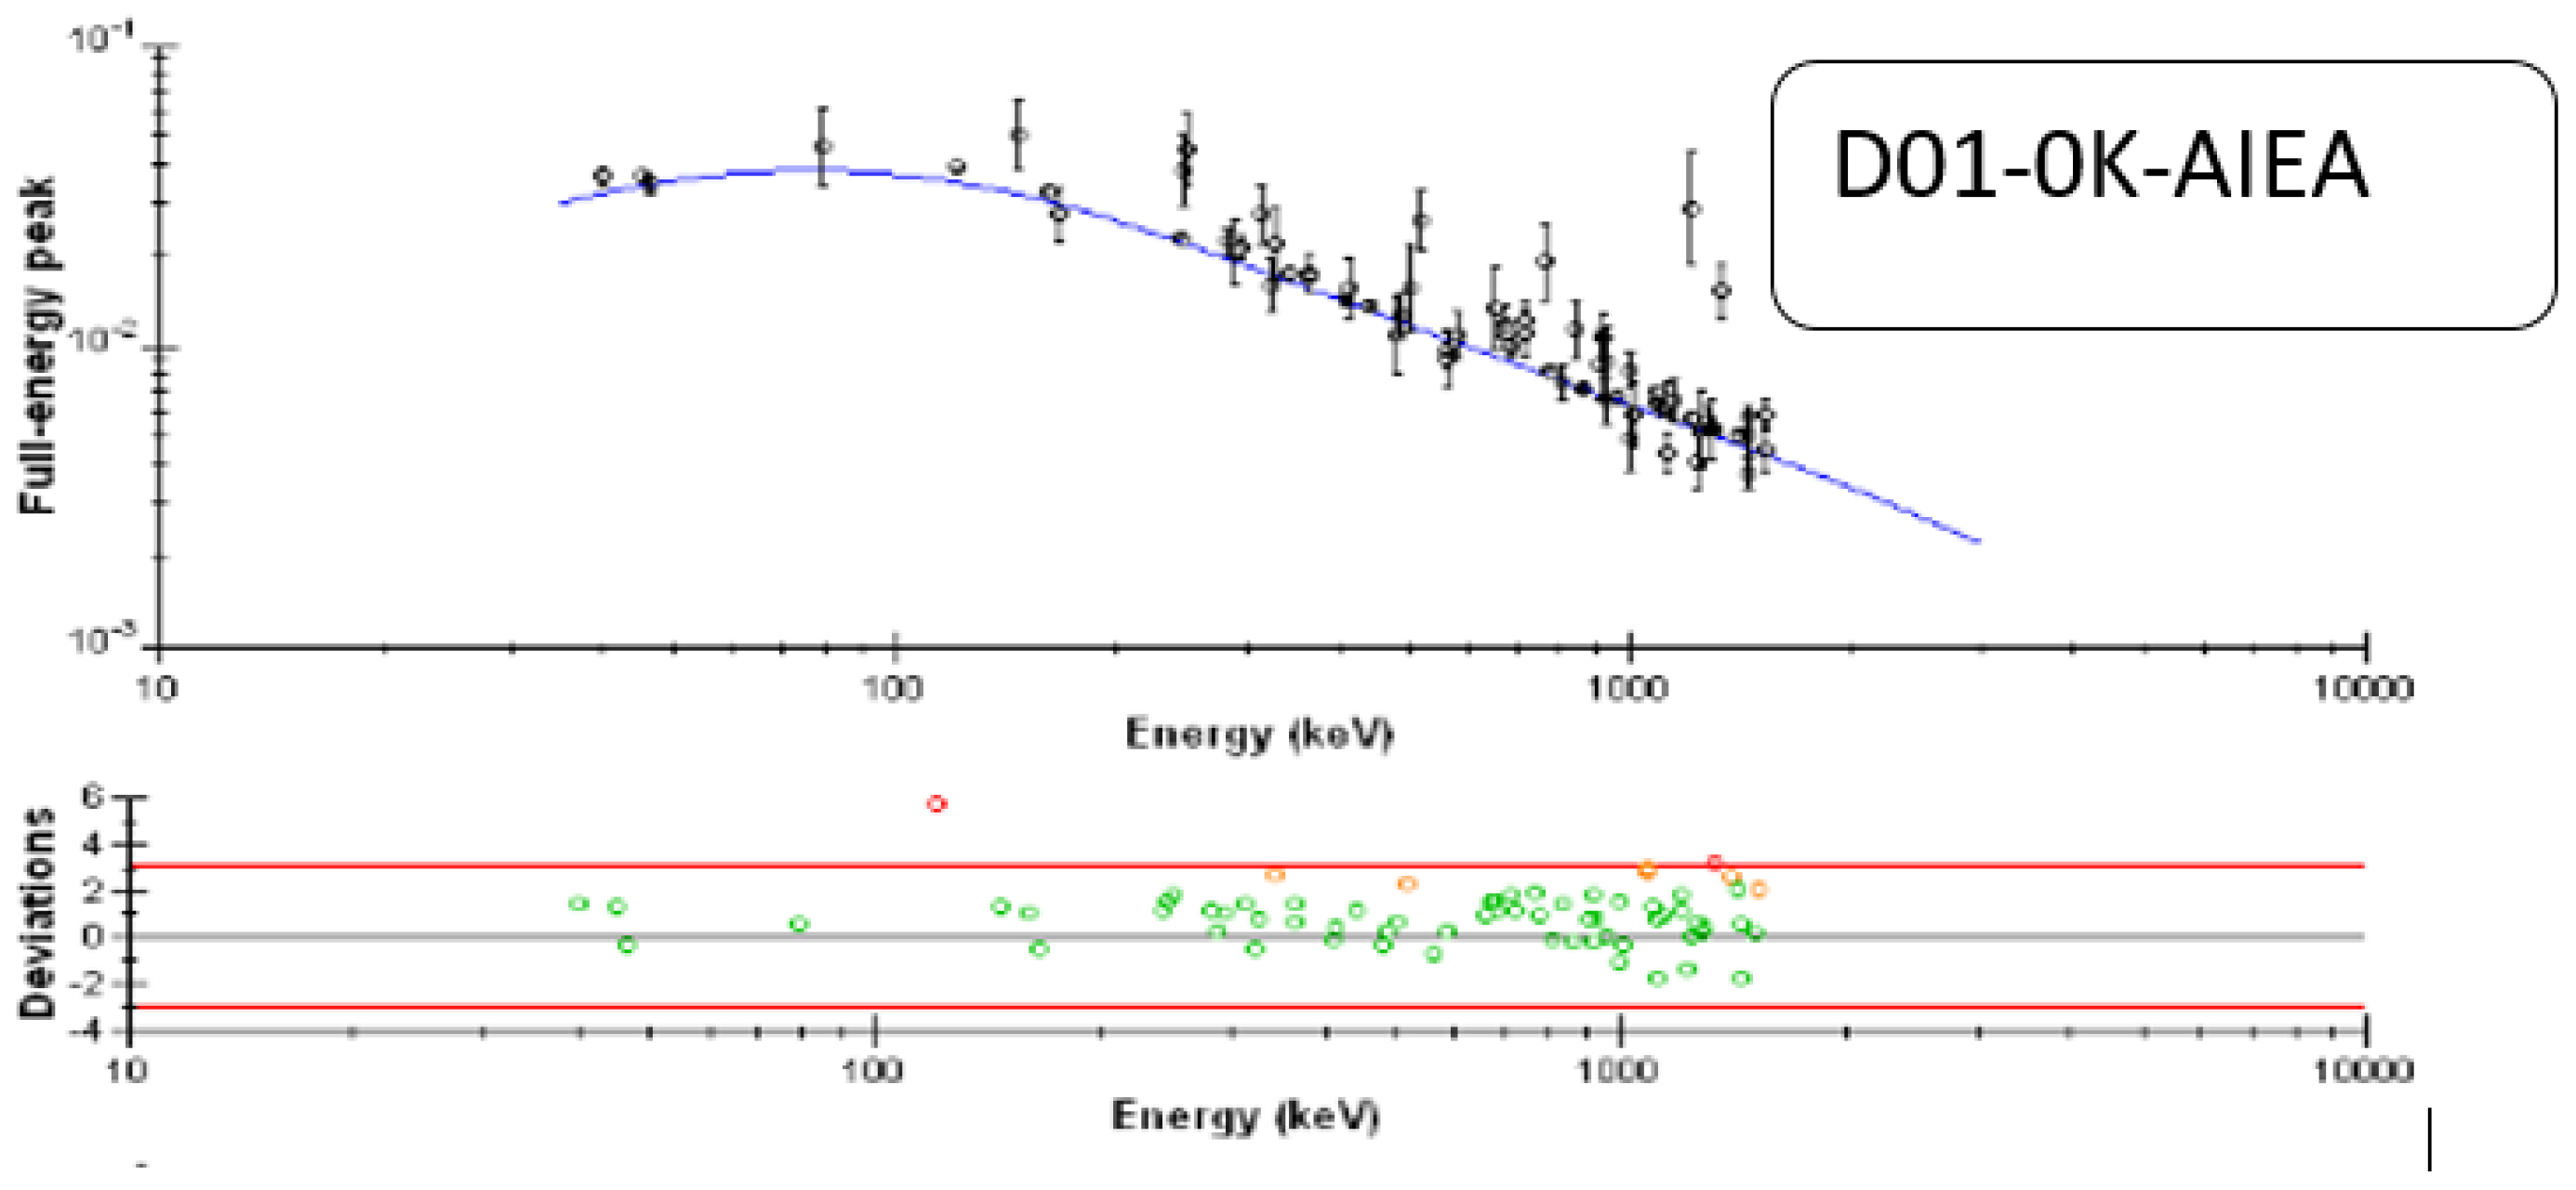
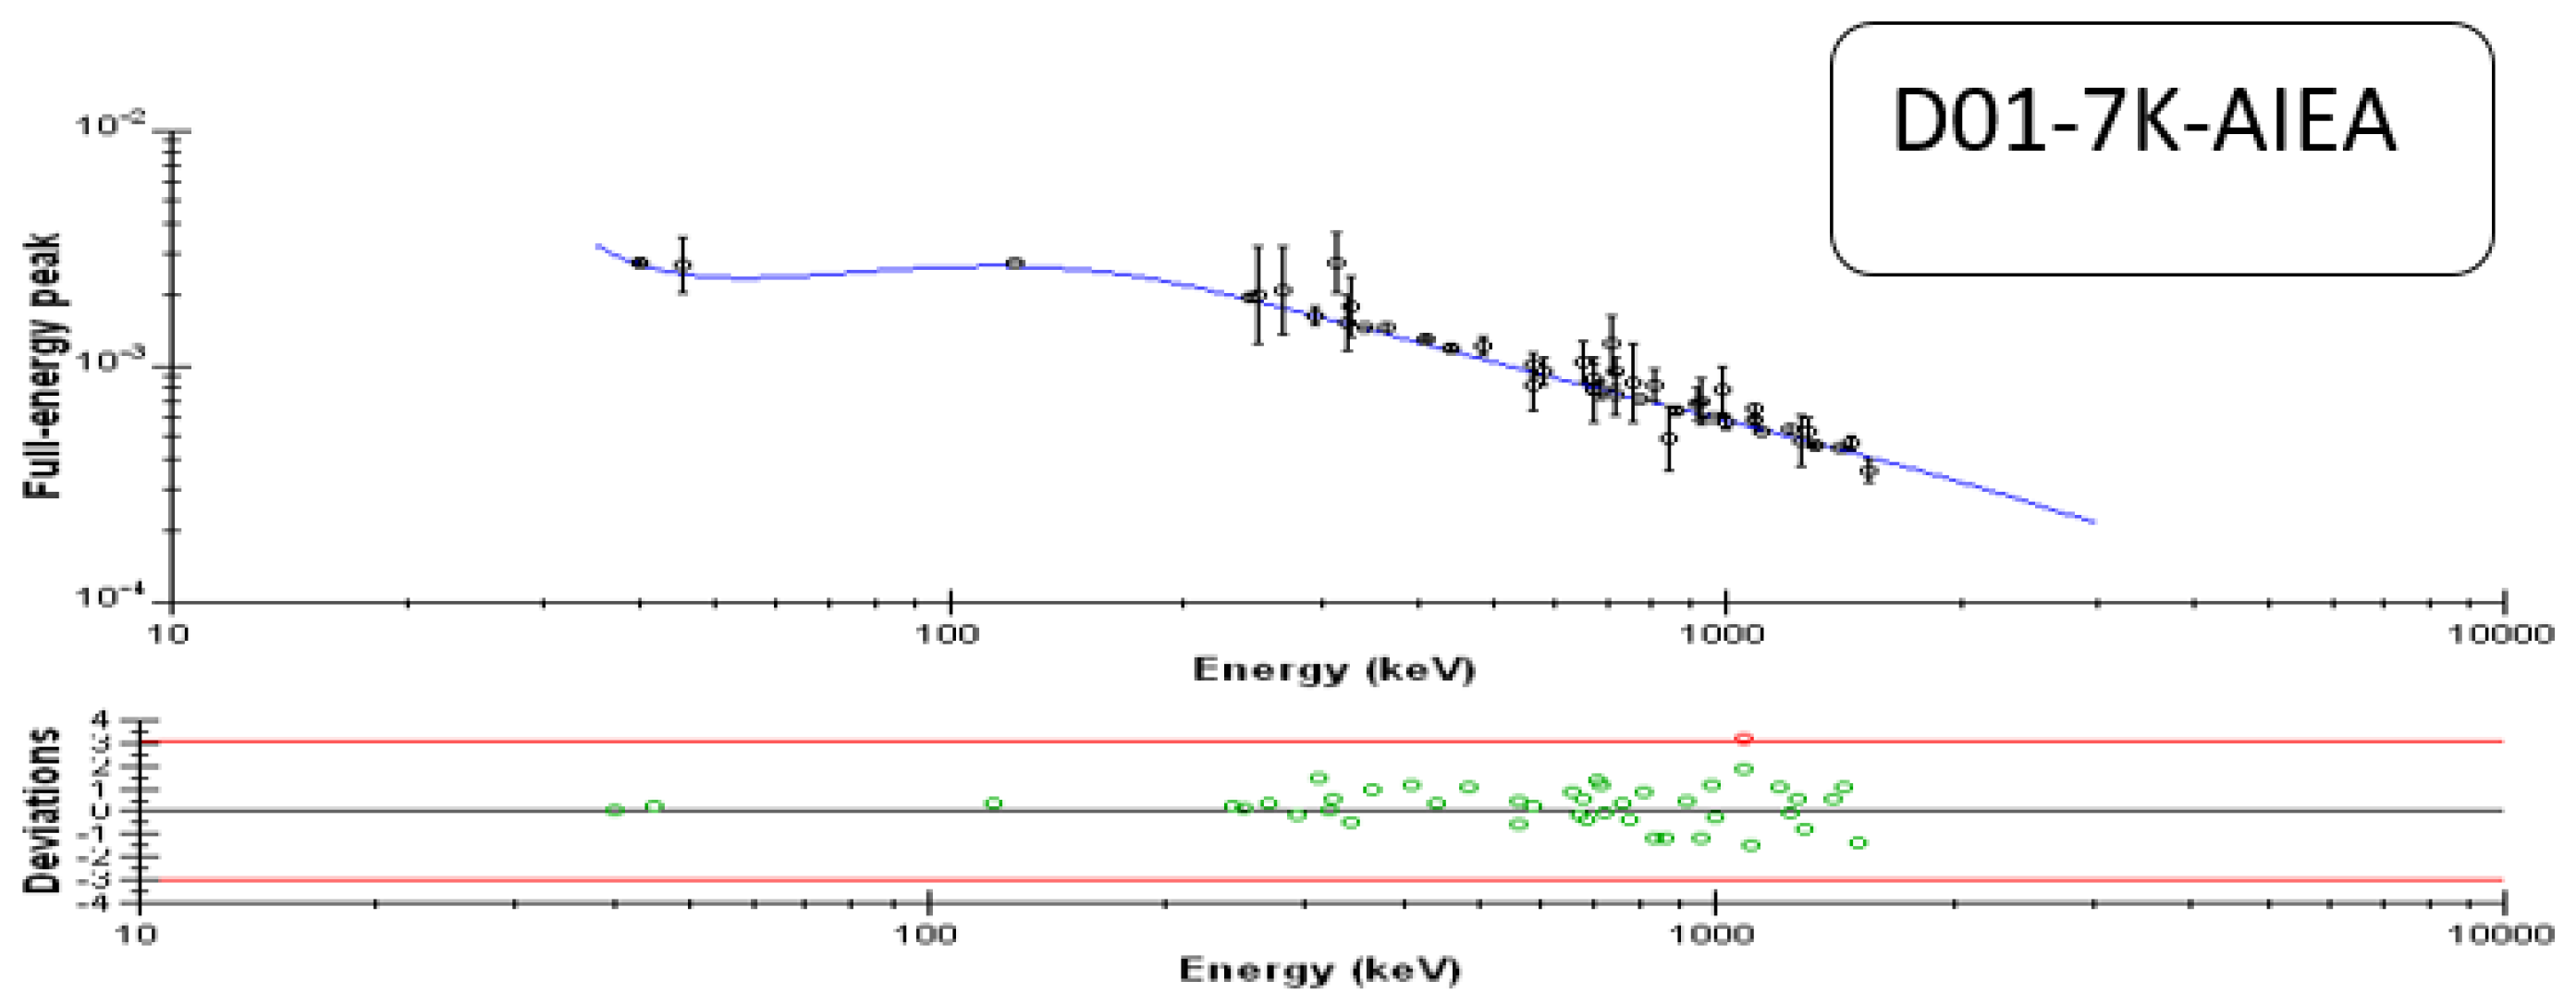
Based on the measurement of gamma emissions from the Europium 152 source at various energies (121.78 keV, 244 KeV, 344.28 KeV, 411 KeV, 443.96 KeV, 778.9 KeV, 964 KeV, 1112.07 KeV and 1408 KeV), and as detected (counted) by the D01 detector at different distances (from 0K to 7K), we calculated the efficiency at varying distances and corresponding energies. The results of these calculations are detailed and depicted graphically using two programs, Excel (as shown in
Figure 6 and
Figure 7 for 0K and 7K) and k0-IAEA (as depicted in
Figure 8 and
Figure 9 for 0K and 7K).
The graph in
Figure 6 reveals that the majority of the data points conform to the curve, except for the initial points, which are affected by the "dead time" and "sum peak" effects. These effects are a result of two gamma photons emitted by a radioisotope during its de-excitation process, which results in photoelectric effects. The photo-cathode detects both electrons simultaneously, amplifying them and producing a peak that corresponds to the sum of the two energies. This leads to a decrease in the detector’s effectiveness, which must be addressed through correction.
To mitigate this phenomenon, the source can be moved away from the detector, as seen in
Figure 7, where the distance was increased from 1K to 7K. This effectively eliminates the anomaly, as all efficiency points in the graph now lie on the curve, indicating good efficiency of the detector.
The general trend of the curve demonstrates why the detector’s efficiency is near 100% at low energy levels. However, as the energy increases, the efficiency decreases proportionally, as shown in
Figure 8.
When plotting the detector’s efficiency as a function of energy using the K0_AIEA software at a distance of 0K (
Figure 8), it becomes apparent that many of the data points deviate from the curve, a phenomenon attributed to the "peak sum" and the dead time effects. This leads to a decrease in the detector’s effectiveness, which requires correction.
To improve the efficiency, it is necessary to move the source away from the detector, ideally by a distance of approximately 2K. As shown in
Figure 9 with a distance of 7K, this effectively eliminates the anomaly and results in good detector efficiency.
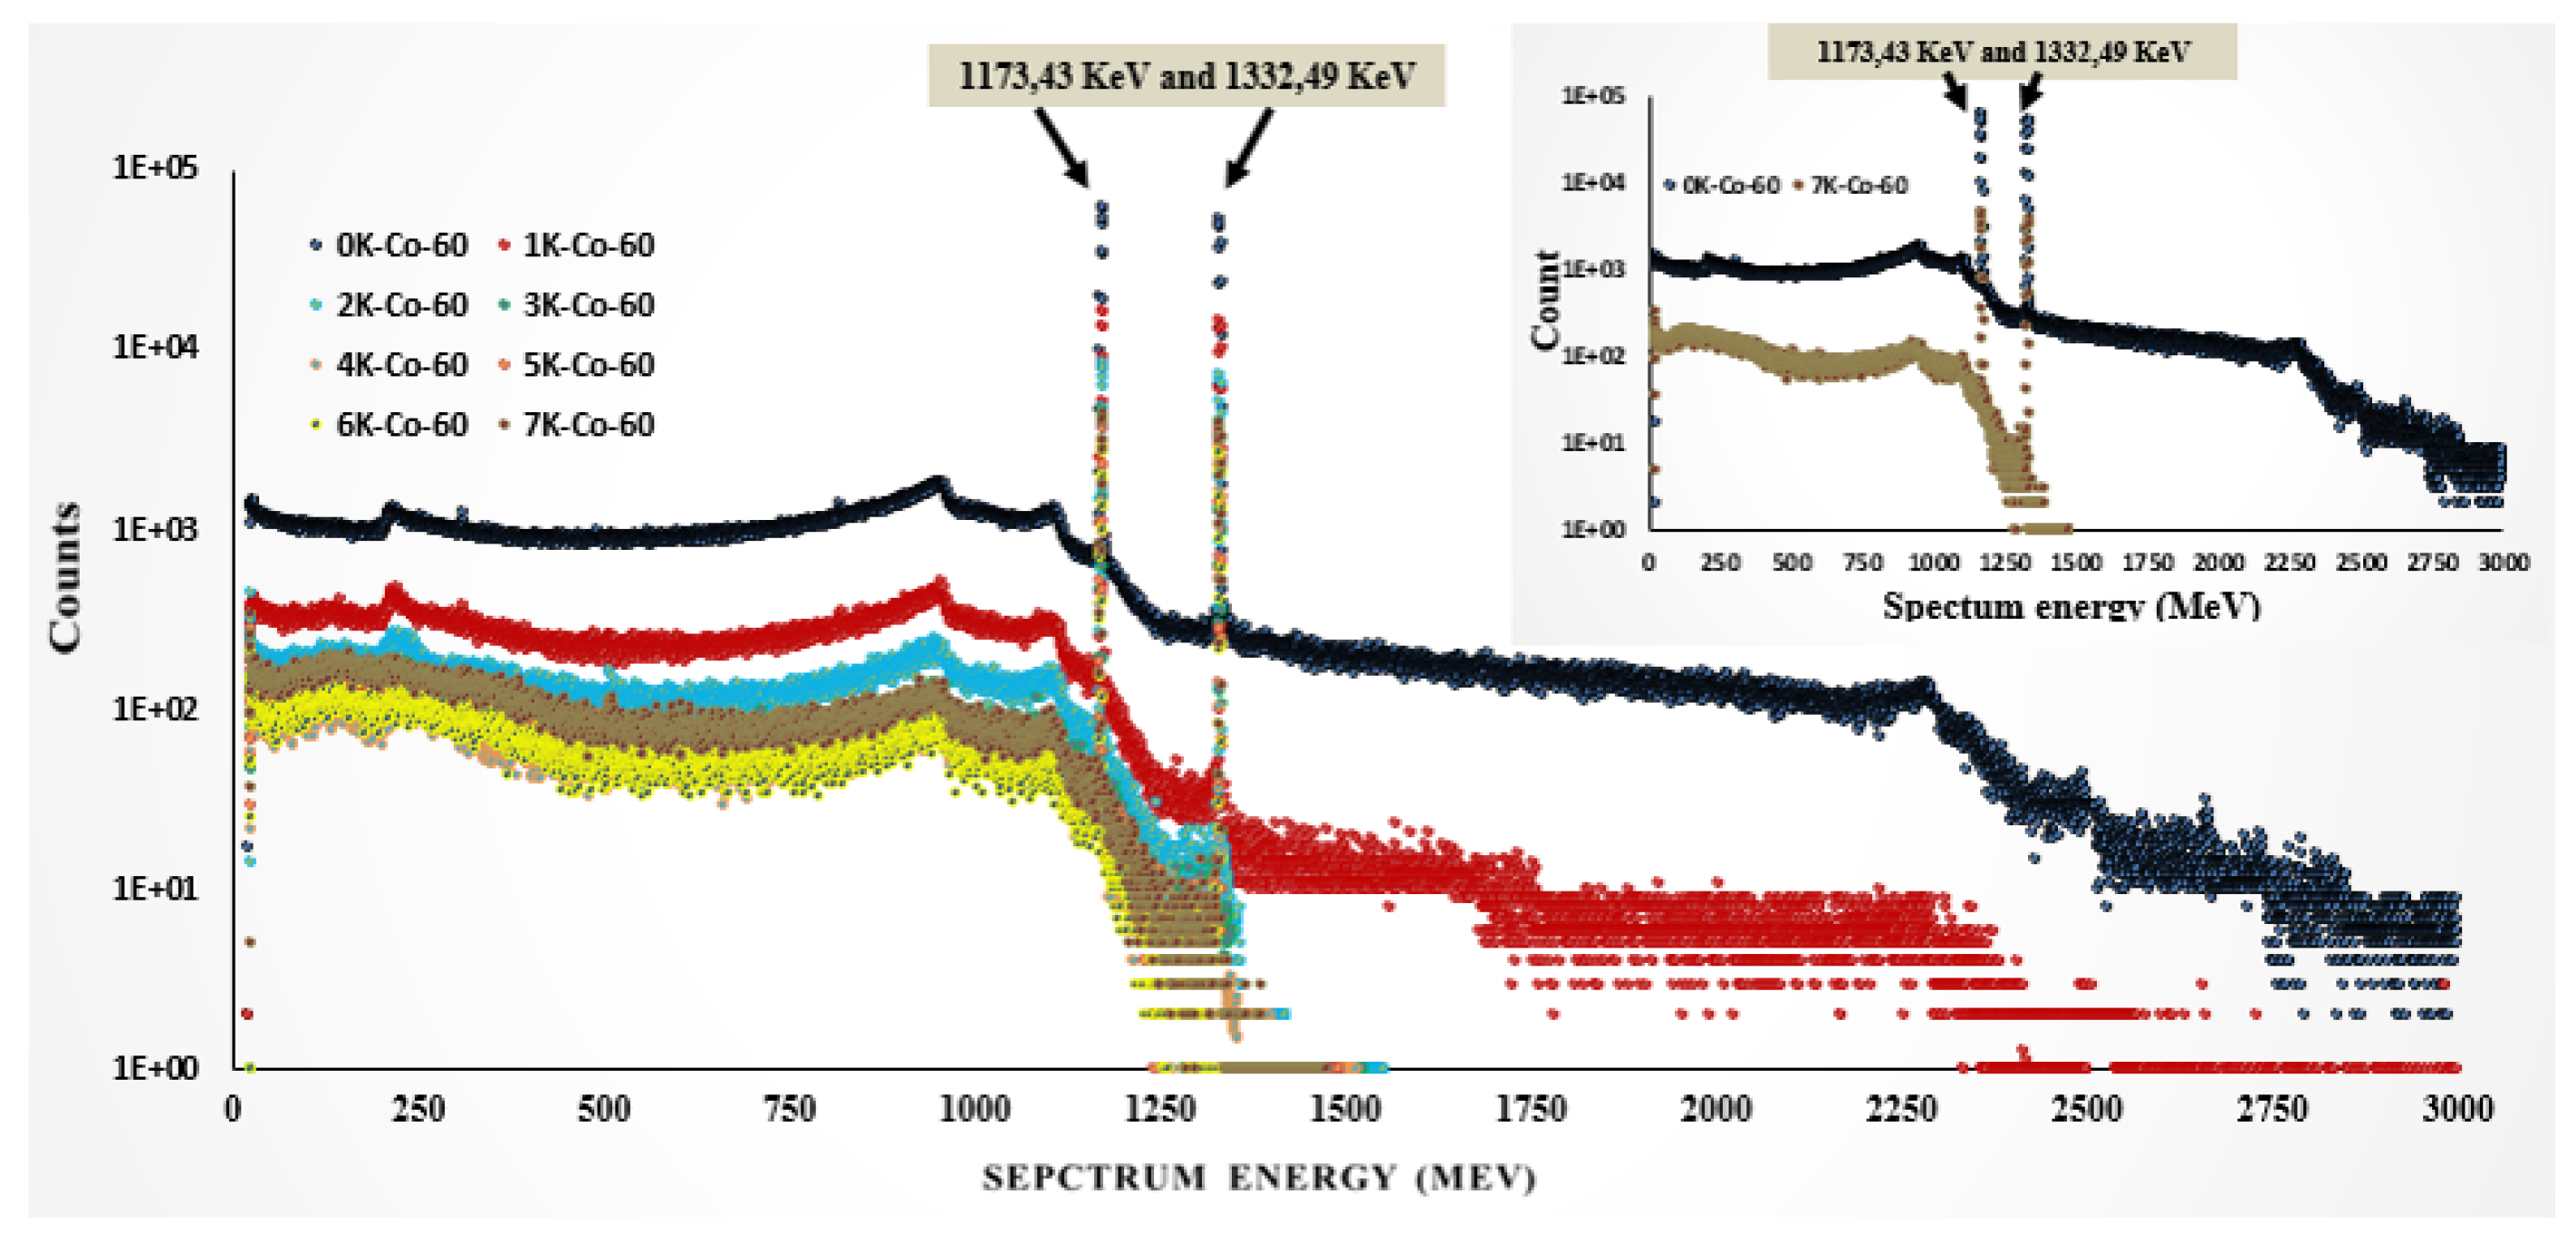
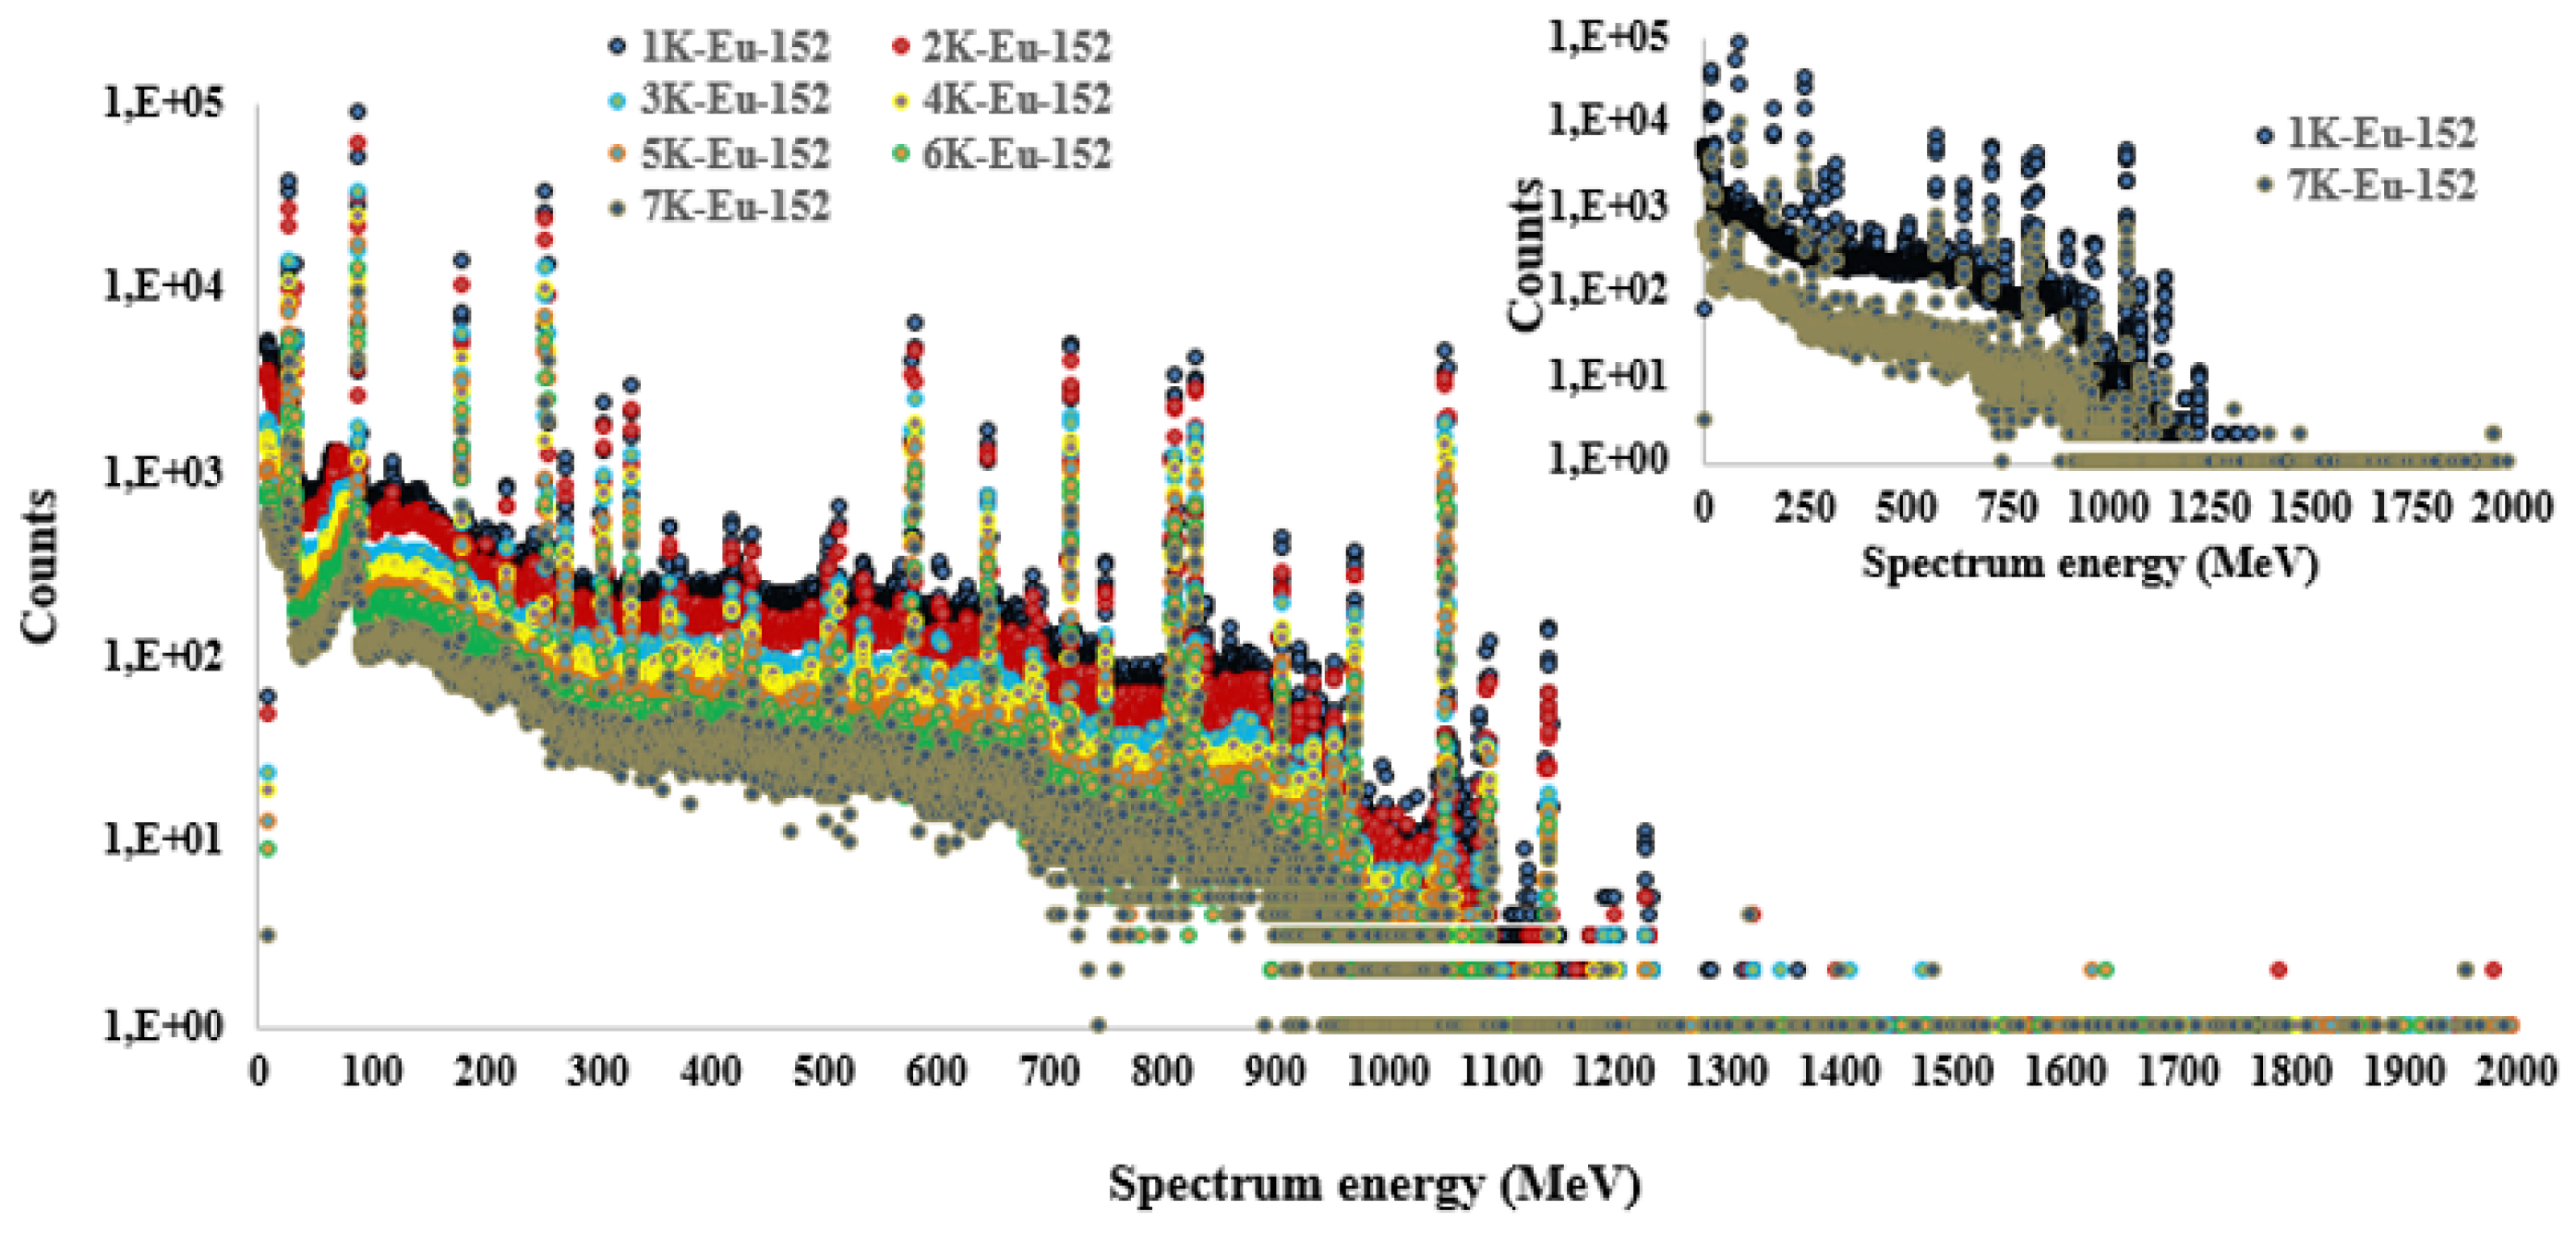
The Gamma Vision software provides us with a spectrum that displays the energy on the x-axis and the corresponding number of counts on the y-axis. This spectrum is a histogram that depicts the distribution of photons based on their energy levels. To accurately identify radioactive elements, an energy calibration is necessary to establish a linear relationship between the channel number and the energy deposited in the crystal. To perform this calibration, we use test sources that emit gamma radiation at known energies, such as Co-60 and Eu-152, at different distances from 0K to 7K, as shown in
Figure 10.
The figure shows the corresponding peaks in the spectrum, obtained over a 15-minute acquisition period.
In general, the HPGe detector is a type of gamma spectrometry device that is widely used to measure gamma radiation. It operates by converting gamma photons into electrons through their interaction with the germanium crystal. The resulting electrons are collected, and the energy of the gamma photons is calculated based on the amount of energy deposited in the crystal.
From the figure, we can observe that in a gamma spectrum obtained from an HPGe detector, two peaks from Co-60 are present, with energies of 1173.43 keV and 1332.49 keV. These peaks correspond to the energy of gamma photons emitted during the decay of Co-60, a radioactive isotope. The 1173.43 keV peak is due to the decay of Co-60 to the ground state of Ni-60, while the 1332.49 keV peak is due to the decay of Co-60 to the first excited state of Ni-60. These peaks are frequently utilized as reference peaks for calibrating gamma spectrometry systems and evaluating the energy resolution of the HPGe detector.
In a gamma spectrum obtained using an HPGe detector (
Figure 10), you may see a lot of peaks from Eu-152. This is because Eu-152 is a radioactive isotope that undergoes several gamma emissions in its decay process. The energies of the gamma photons emitted by Eu-152 vary and produce multiple peaks in the gamma spectrum, allowing you to determine the presence and quantity of Eu-152 in a sample.
The gamma photons emitted by Eu-152 have energies that are characteristic of the specific decay process and can be used to identify and quantify the isotope. By analyzing the gamma spectrum, you can determine the activity of the sample and gain important information about the sample’s composition and behavior.
It’s worth noting that the appearance of a large number of peaks from Eu-152 in the gamma spectrum indicates a relatively high activity of the isotope, which can have implications for the safety and handling of the sample.
Using both Co-60 and Eu-152 as gamma sources for calibration has several advantages in gamma spectrometry such as: wide range of gamma energies: Co-60 and Eu-152 both emit gamma photons with a wide range of energies, which allows as to calibrate the system over a large energy range and ensure that the system is performing accurately and consistently across the entire energy range.
Monte Carlo simulation is a robust technique for verifying results across various fields, including nuclear physics. The MCNP (Monte Carlo N-Particle) code is a widely used simulation tool that models the interactions of radiation and particles with materials in a system. The code generates random samples of particle interactions, enabling the estimation of quantities such as flux, dose, and radiation levels. By using Monte Carlo simulations with MCNP, complex systems can be simulated in detail and the results can be validated against experimental data.
In recent times, the commercial availability of some simulation codes for efficiency calculation has been leveraged to overcome these limitations. Monte Carlo simulation-based detector calibration has gained attention from researchers in the past and has been the subject of extensive research in recent years.
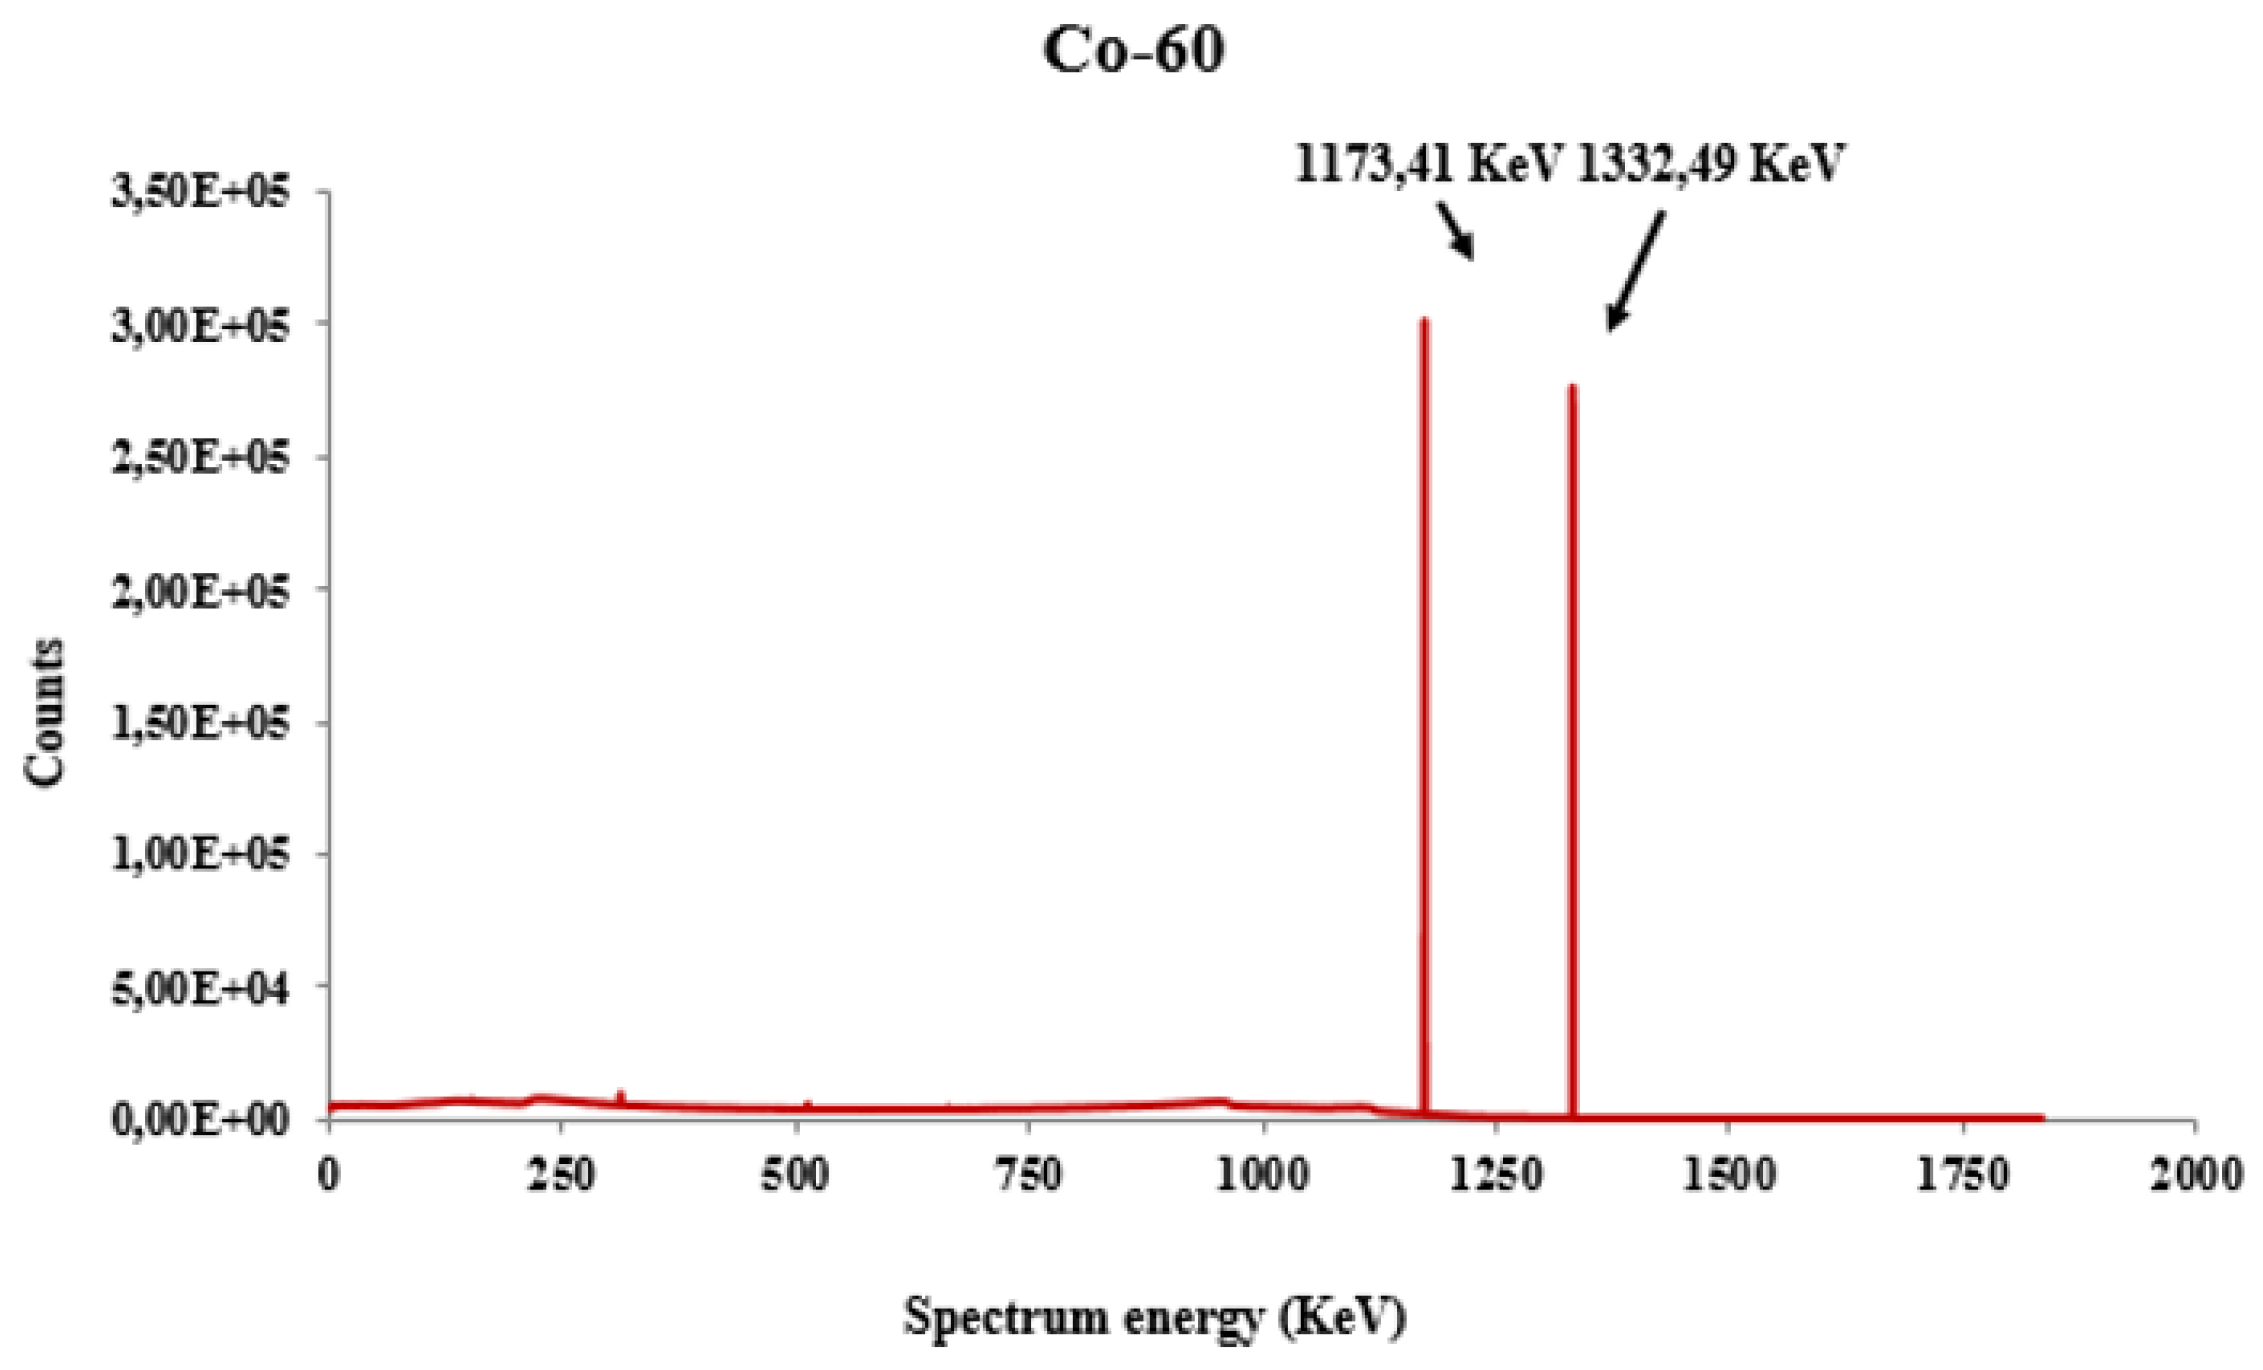
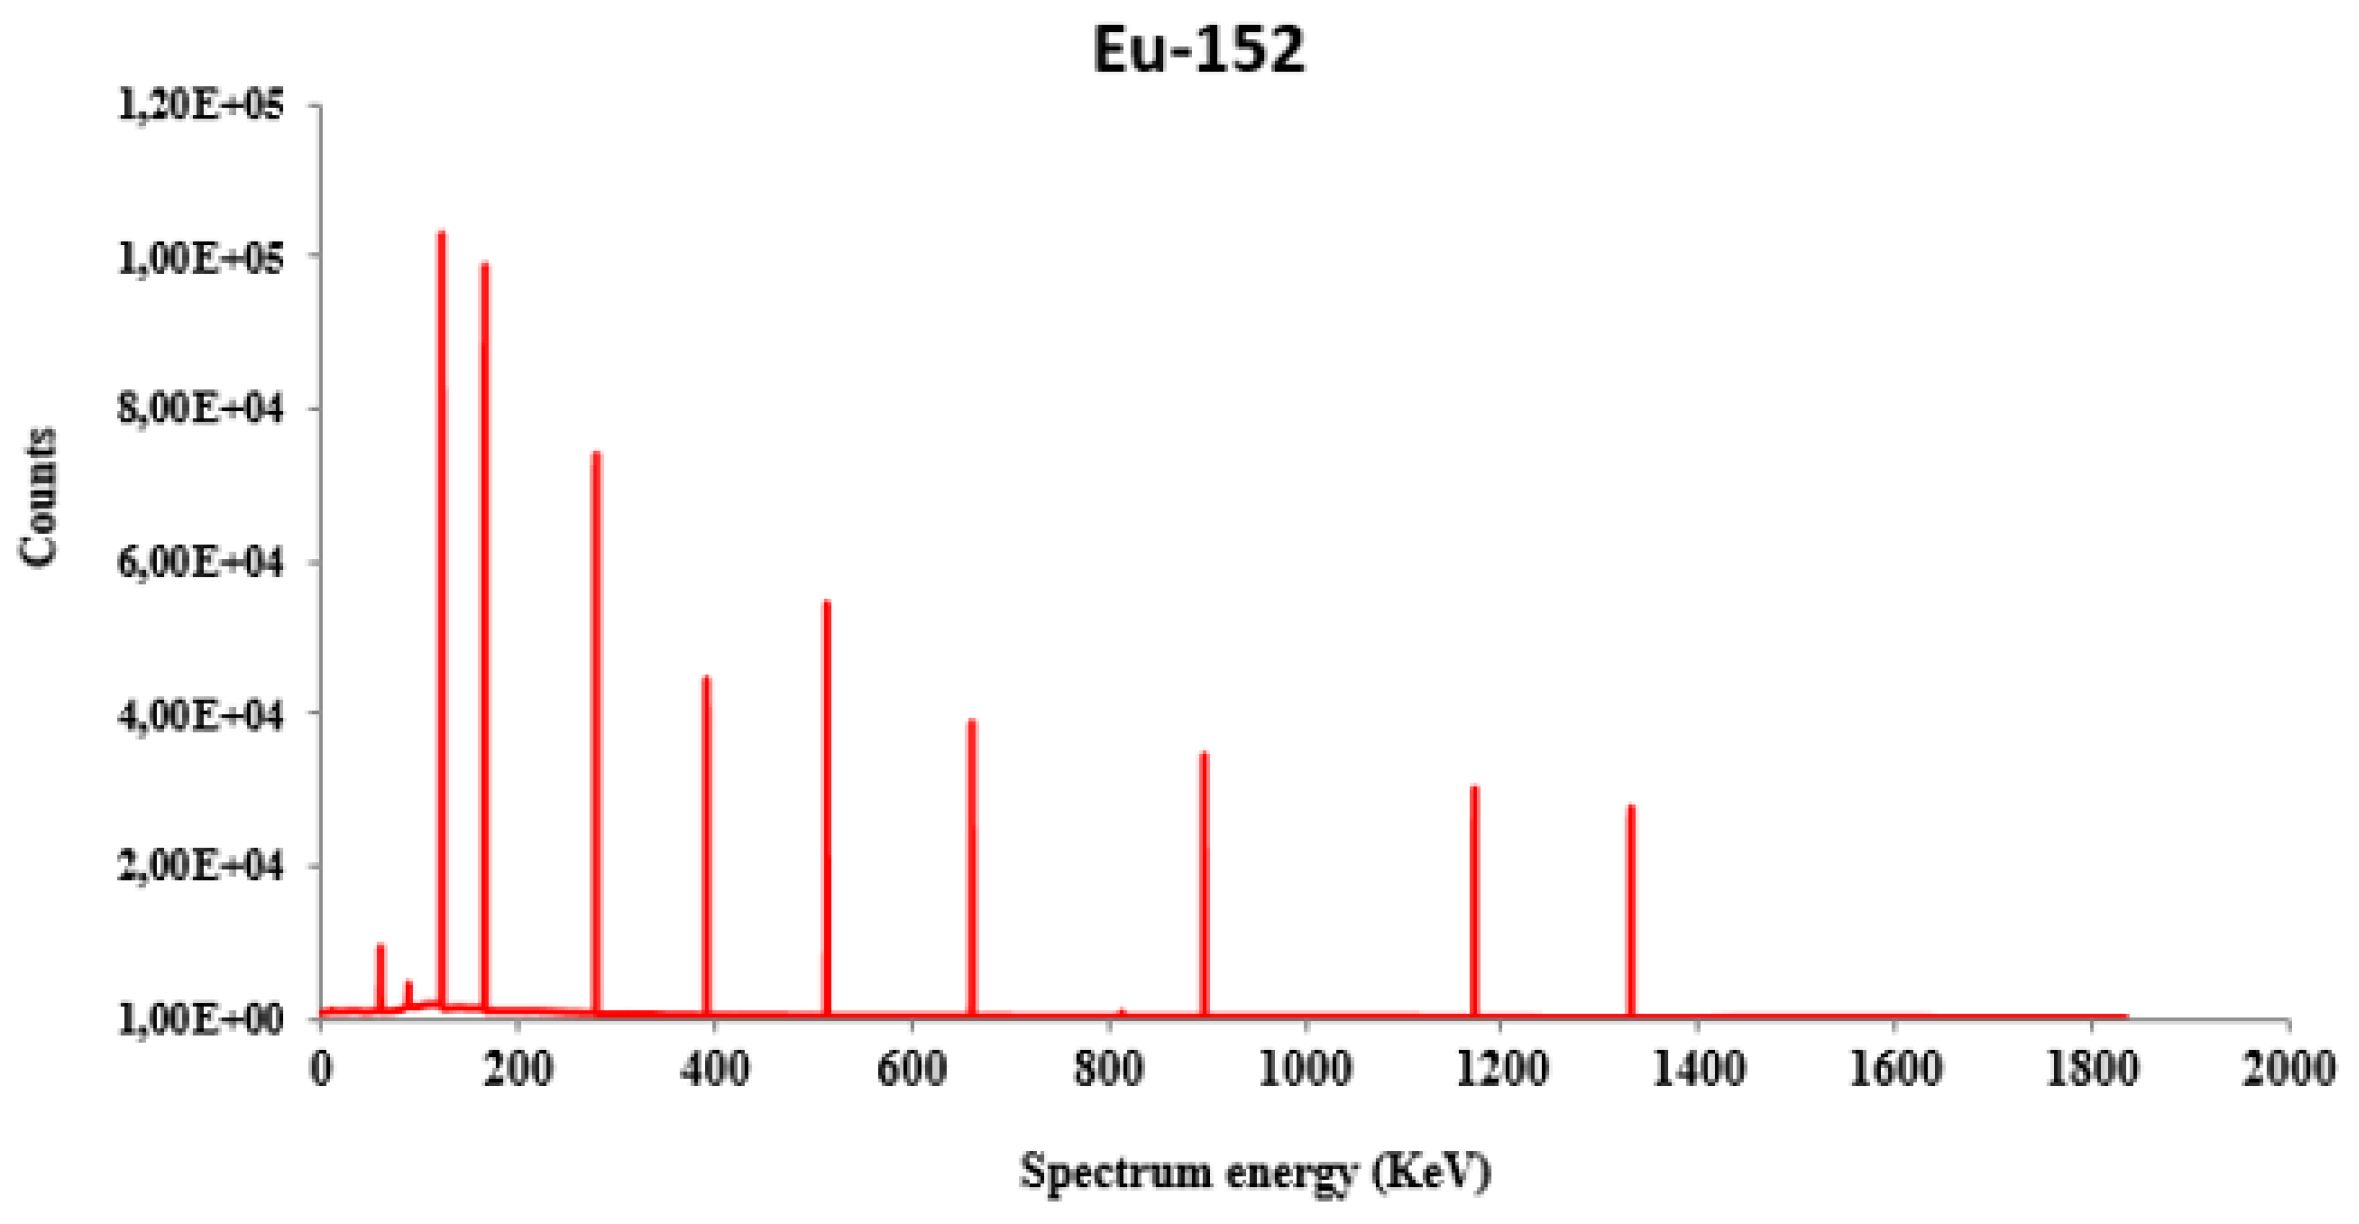
Figure 12 and
Figure 13 depict the variation in gamma radiation detection by the two sources (Co-60
Figure 12 and Eu-152
Figure 13) using Monte Carlo simulation via the MCNP6 code. The validation of experimental results through Monte Carlo simulation reflects a good measure of the detector used in our laboratory.
Simulating the behavior of radiation and particles in a detector using sources such as Co-60 and Eu-152 (shown in
Figure 12 and
Figure 13, respectively) can provide valuable insights into the detector’s performance. This allows us to better understand the detector’s response and validate the accuracy of our measurements. The MCNP (Monte Carlo N-Particle) [
7,
8] code is particularly useful in simulating the gamma spectra and evaluating the full-energy peak efficiency of the detector when using Co-60 and Eu-152 sources, which are commonly utilized in the fields of nuclear physics and radiation detection. By comparing the results from the simulation with experimental data, we can verify the accuracy of our measurements and confirm that the detector is functioning as intended.
4. Discussion
Quality assurance and quality control are critical for a laboratory to produce reliable and accurate results for its clients. Without these practices, results may be misleading and potentially have negative consequences.
Adhering to quality standards brings a higher level of rigor to laboratory procedures, clearly defines roles and responsibilities, and harmonizes practices. Monitoring non-conformities and malfunctions is a top priority in any quality approach. The development of written internal quality documents is also essential, as it provides traceability of all actions and helps to move away from an oral tradition. The ISO 17025 standard requires that all factors contributing to the analysis result be taken into account and considered in technical requirements.
Implementing a quality approach is a long-term project that requires the progressive adoption of principles and methods by all laboratory professionals and an improvement of expertise. To ensure success, the approach should be implemented gradually, starting with the most pressing priorities. At the AAN laboratory, the implementation of a quality approach was carried out in three stages: first, mastering the neutron activation analysis technique and methodology; second, evaluating the management and technical prescriptions of the ISO 17025 standard; and third, verifying the D01 detector in the AAN laboratory’s counting room. The verification concluded that the D01 detector is compliant and produces reliable results. These verifications and the processes established by the AAN laboratory aim to ensure the quality of results delivered to its clients.
5. Conclusion
The utilization of high-purity germanium detectors has become a standard in the environmental sector for conducting efficient assessments of environmental radioactivity. This non-invasive approach enables the measurement of all gamma-emitting radioactive elements within a broad energy range of 20 to 2000 keV in an array of sample types with a single measurement.
The D01 detector at the neutron activation analysis laboratory underwent rigorous metrological control tests, yielding reliable results. Further validation was achieved through the implementation of daily control measurements, which were utilized to generate control charts and calculate the Z-score of each value, thus reinforcing the validity of the outcomes. To guarantee the quality of the data delivered to clients, all processes and verifications that are dependent on the traceability established by the AAN laboratory are monitored closely.
Quality assurance is a crucial aspect of scientific and technological fields that extends beyond neutron activation analysis. This principle can be implemented in an array of disciplines and activities to ensure the accuracy, reliability, and validity of results.
Data Availability Statement
Not applicable.
Acknowledgments
We would like to express our sincere gratitude to the authors who worked on Neutron Activation Analysis Laboratory for their valuable contributions to the field. We also extend our appreciation to CNESTEN for their support in sharing this work. Without their efforts, this important research would not have been possible. Thank you.
Conflicts of Interest
The authors declare no conflict of interest.
References
- nternational Atomic Energy Agency Quality Assurance and Quality Control in Neutron Activation Analysis: A Guide to Practical Approaches. Technical Reports Series No. 487 2022, STI/DOC/010/487 ¦ 978-92-0-132421-4.
- Abdessamad Didi, Participation à l’Instauration d’Assurance Qualité: Au sein du Laboratoire d’Analyse par Activation Neutronique . ISBN 10: 6138396286 ISBN 13: 9786138396284, Publisher, In Éditions universitaires européennes; 2018. 1. “Combination of k0-IAEA and KayWin for the characterization of neutron flux parameters at Triga Mark II Research Reactor, Morocco” Article accepté pour publication dans Journal of Radioanalytical and Nuclear Chemistry (2023). [CrossRef]
- Chahidi H., Bounouira H., Amsil H., Choukri A., Didi A. & Aarab I. Combination of k0-IAEA and KayWin for the characterization of neutron flux parameters at Triga Mark II Research Reactor, Morocco, In Journal of Radioanalytical and Nuclear Chemistry; 2023, In press. [CrossRef]
- Aarab I., Bounouira H., Chakir E., Amsil H. & Didi A. Utilization of k0-Standardisation Method of Neutron Activation Analysis for Determining the Major and Trace Elements of Medicinal Plants from the Senhaja Srair Region of Morocco, In Journal of Radioanalytical and Nuclear Chemistry; 2023, In press. [CrossRef]
- Moubakou Diahou RRC, Bounouira H, Dallou GB, Sondzo JS, Amsil H, Abdessamad. Didi, lliasse Aarab, Cherkaoui El Moursli R, Bouka Biona C. Kayzero-standardization method of Neutron activation analysis study for major and minor elements determined in soils and phosphate rocks of the prospective phosphate mining area in the Hinda district, Republic of Congo, In Journal of Radioanalytical and Nuclear Chemistry; 2023, In press. [CrossRef]
- Alistair T. McCay , Thomas L. Harley ,Paul L. Younger ,David C. W. Sanderson and Alan J. Cresswell. Gamma-ray Spectrometry in Geothermal Exploration: State of the Art Techniques,In Energies; 2014, 7(8), 4757-4780. [CrossRef]
- MCNP6.1/MCNP5/MCNPX. Los Alamos National Laboratory, Los Alamos. New Mexico, August. Monte Carlo N-Particle Code System for Multiparticle and High Energy Application,In Los Alamos National Laboratory; 2013.
- Monte Carlo Team N-Particle Transport Code System Including MCNP6.1, and Data Libraries, MCNP6 User’s Manual,,(Los Alamos National Security, LLC, Los Alamos National Laboratory),In Code Version 6.1.1beta, LA-CP-14-00745; 2014.
|
Disclaimer/Publisher’s Note: The statements, opinions and data contained in all publications are solely those of the individual author(s) and contributor(s) and not of MDPI and/or the editor(s). MDPI and/or the editor(s) disclaim responsibility for any injury to people or property resulting from any ideas, methods, instructions or products referred to in the content. |
© 2023 by the authors. Licensee MDPI, Basel, Switzerland. This article is an open access article distributed under the terms and conditions of the Creative Commons Attribution (CC BY) license (http://creativecommons.org/licenses/by/4.0/).
