Submitted:
16 February 2023
Posted:
22 February 2023
You are already at the latest version
Abstract
Keywords:
1. Introduction
2. Materials and Methods
2.1. Bioinformatics
2.2. Animals
2.3. DNA vector generation
2.4. Immuno-fluorescence labeling and imaging
2.5. MGE primary cultures
2.6. Statistics and cell assessments
2.7. Western blotting
3. Results
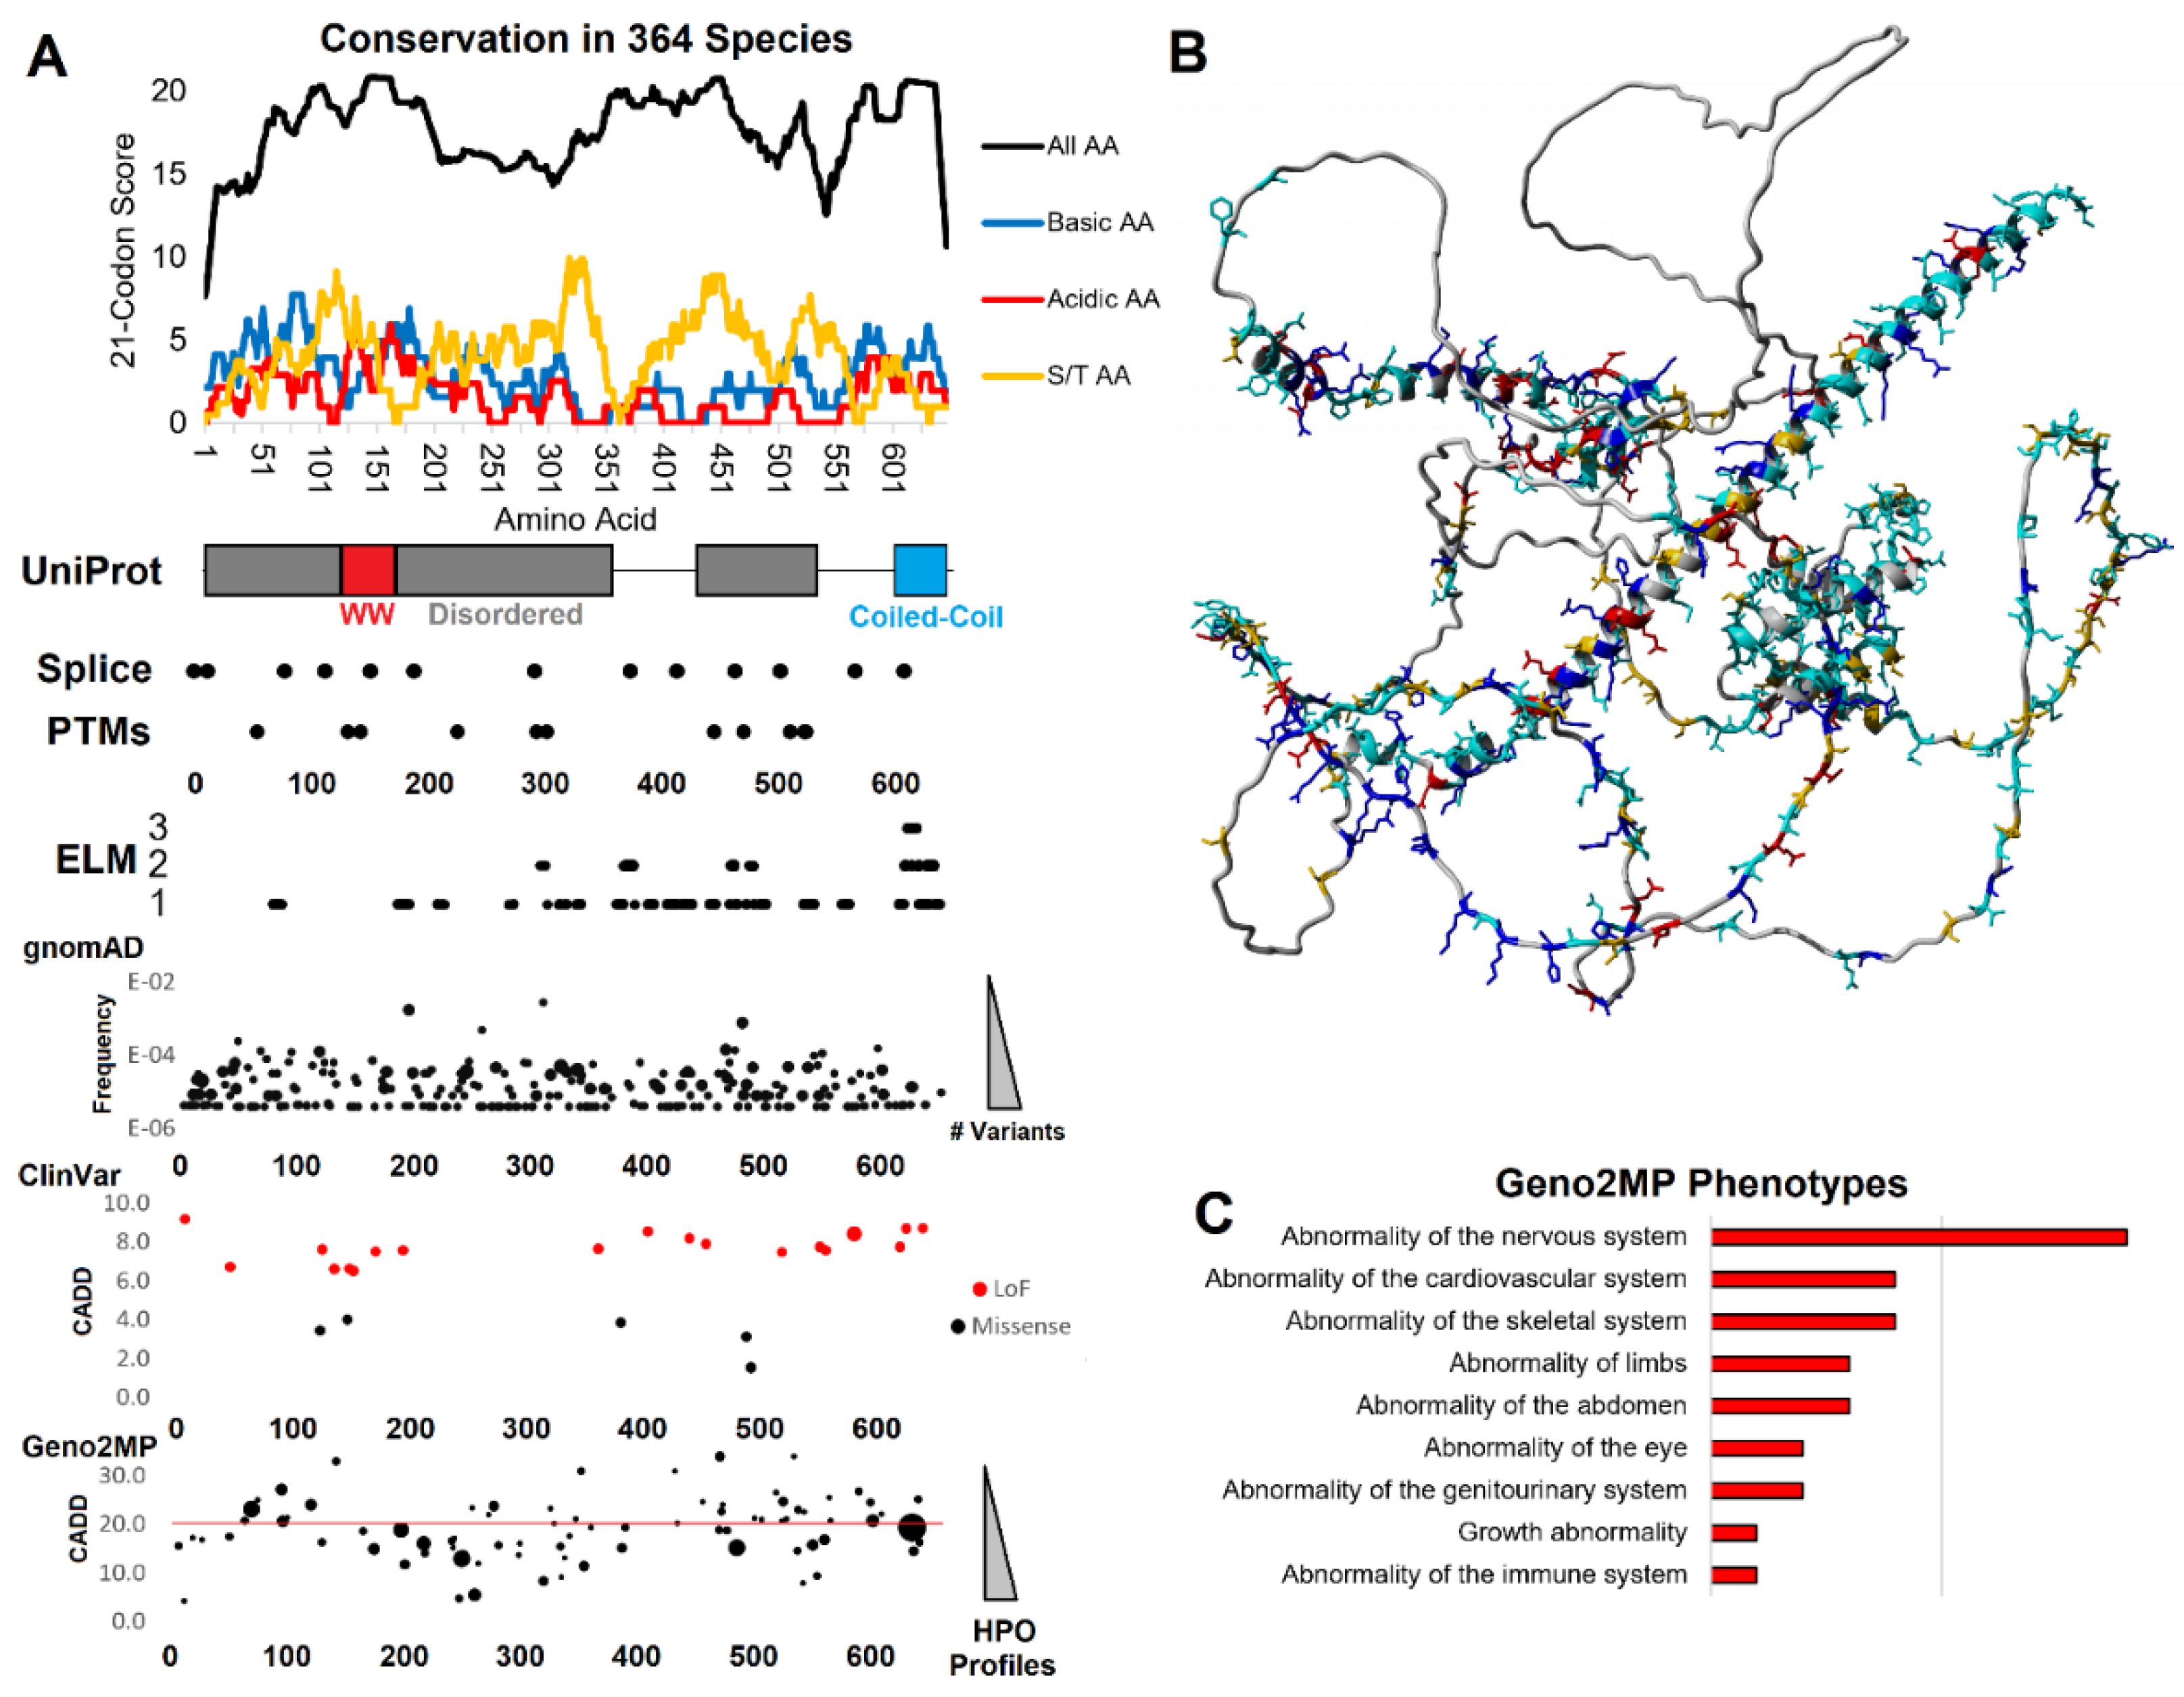
3.1. Functional domain and motif annotations of WAC
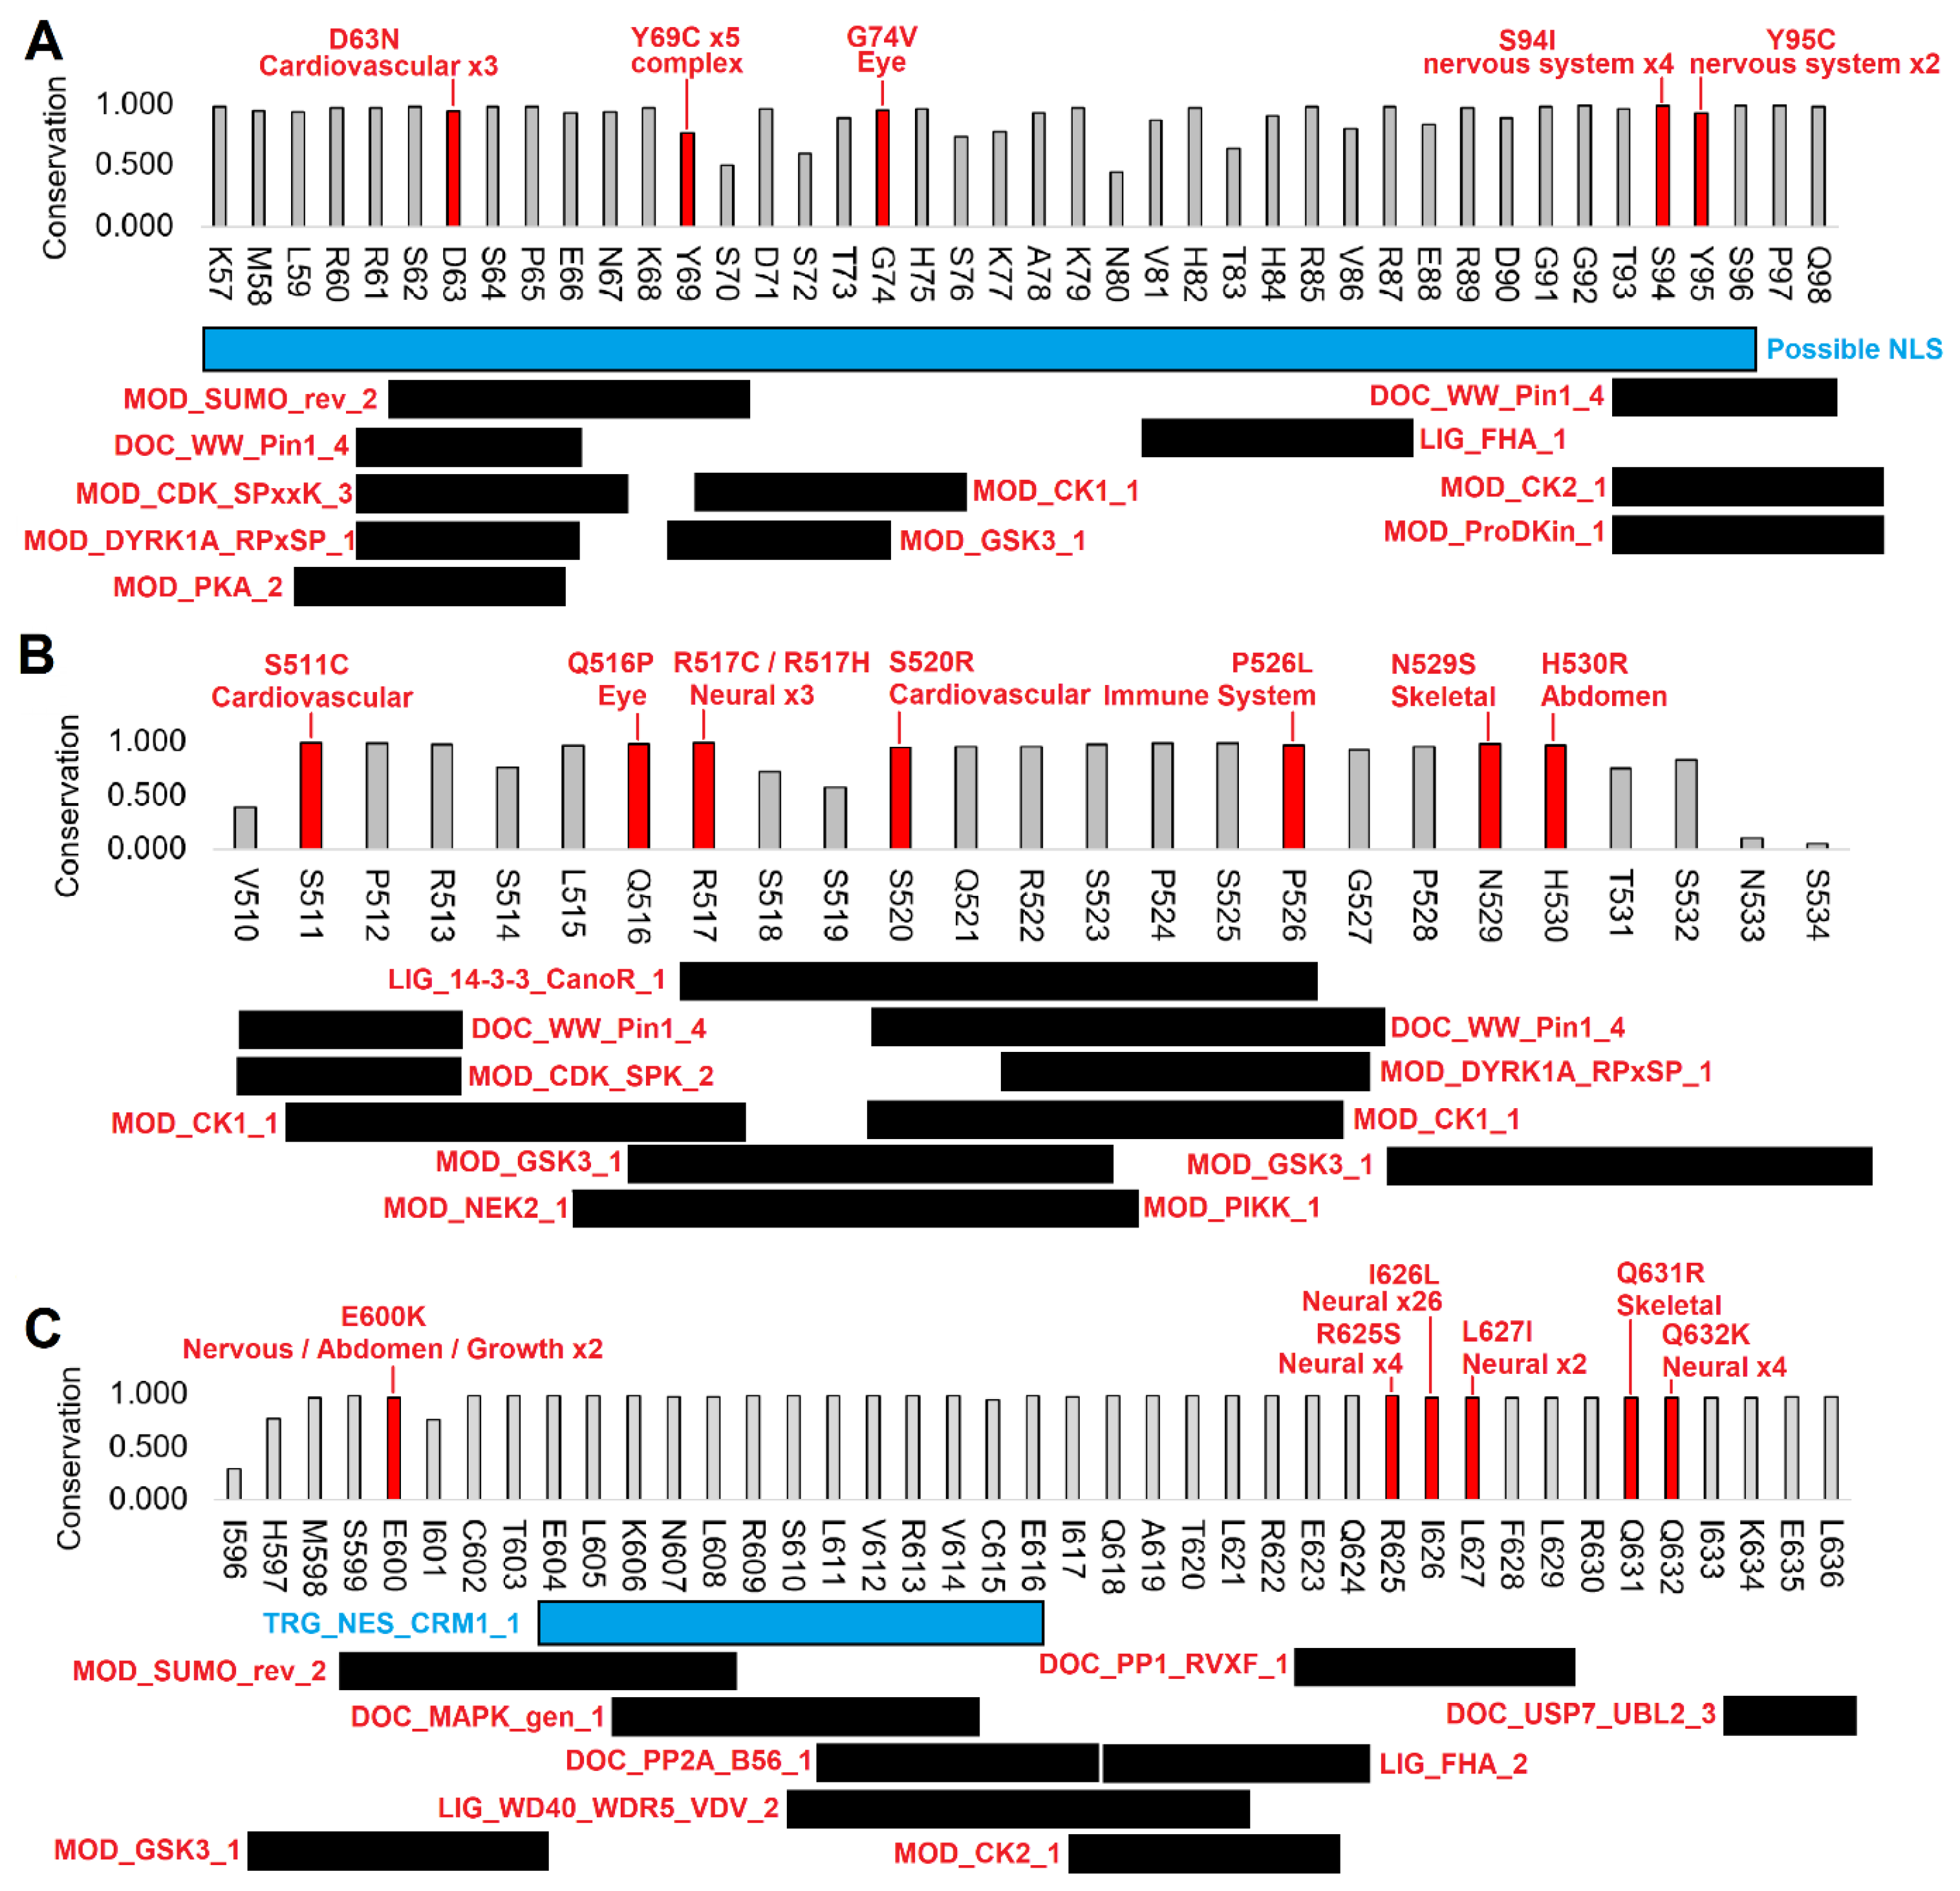
3.2. Human clinical variants annotated to functional motifs of WAC
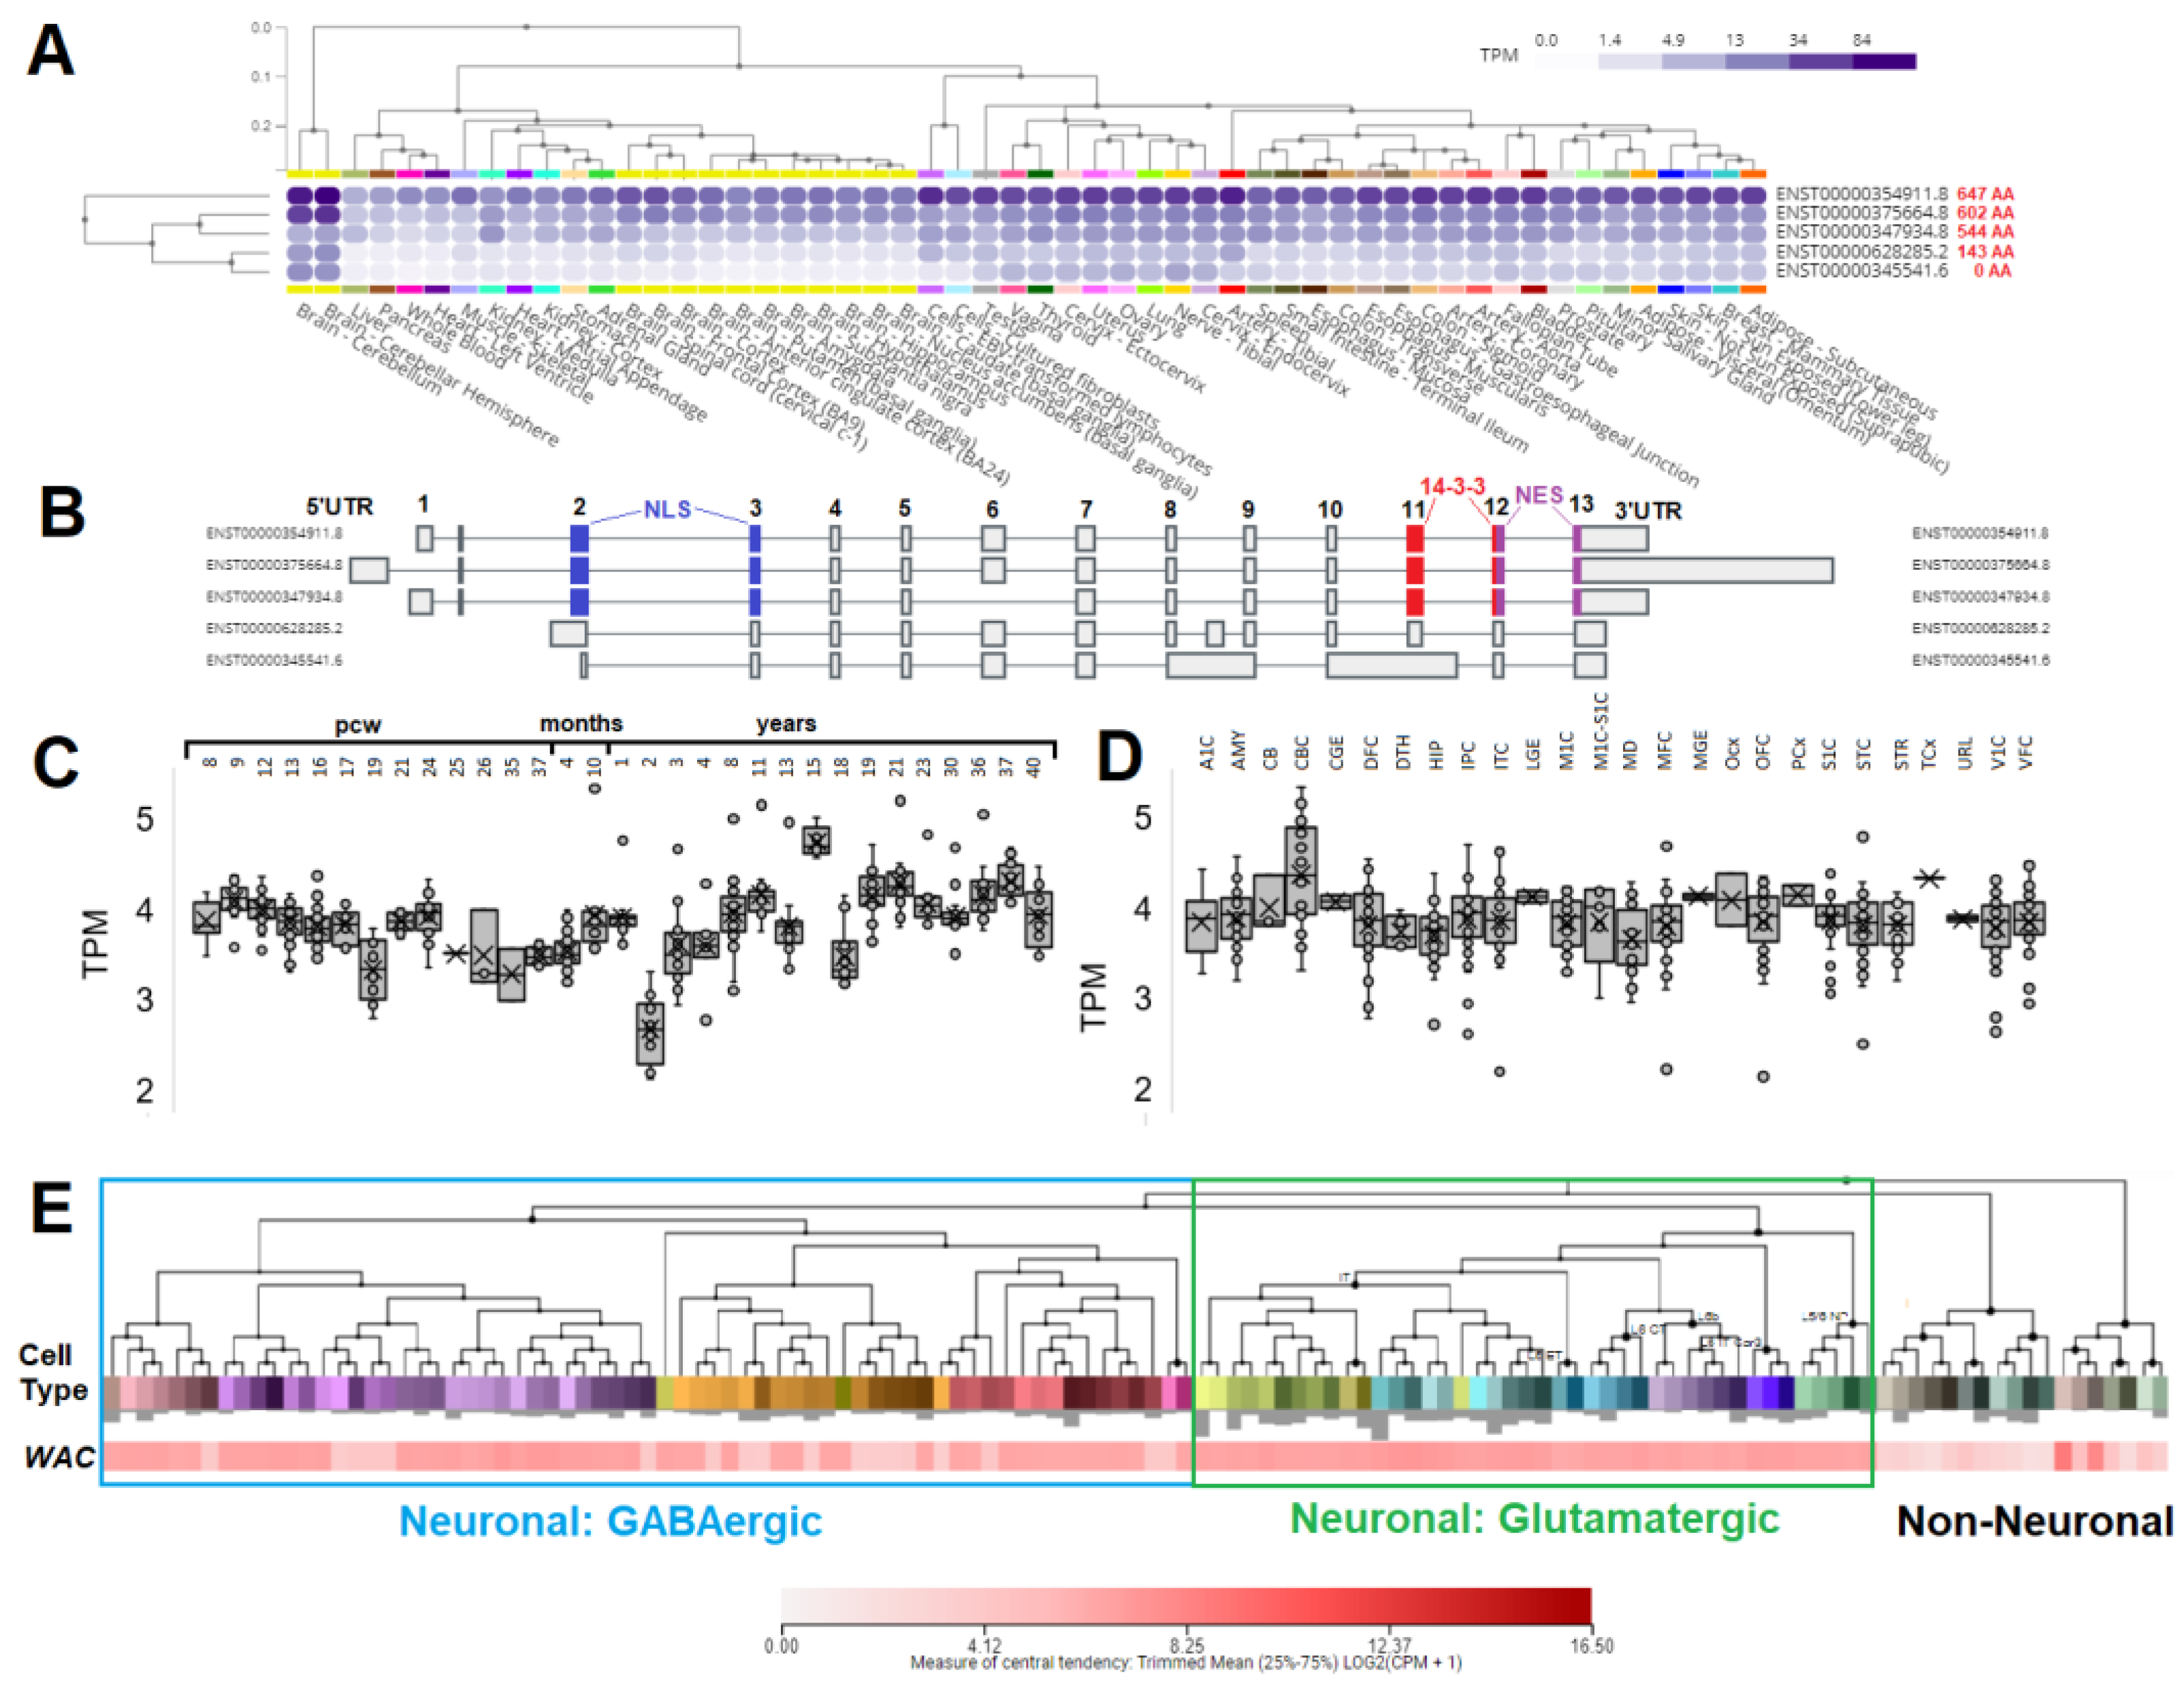
3.3. Expression of WAC within human brain and neural cell types
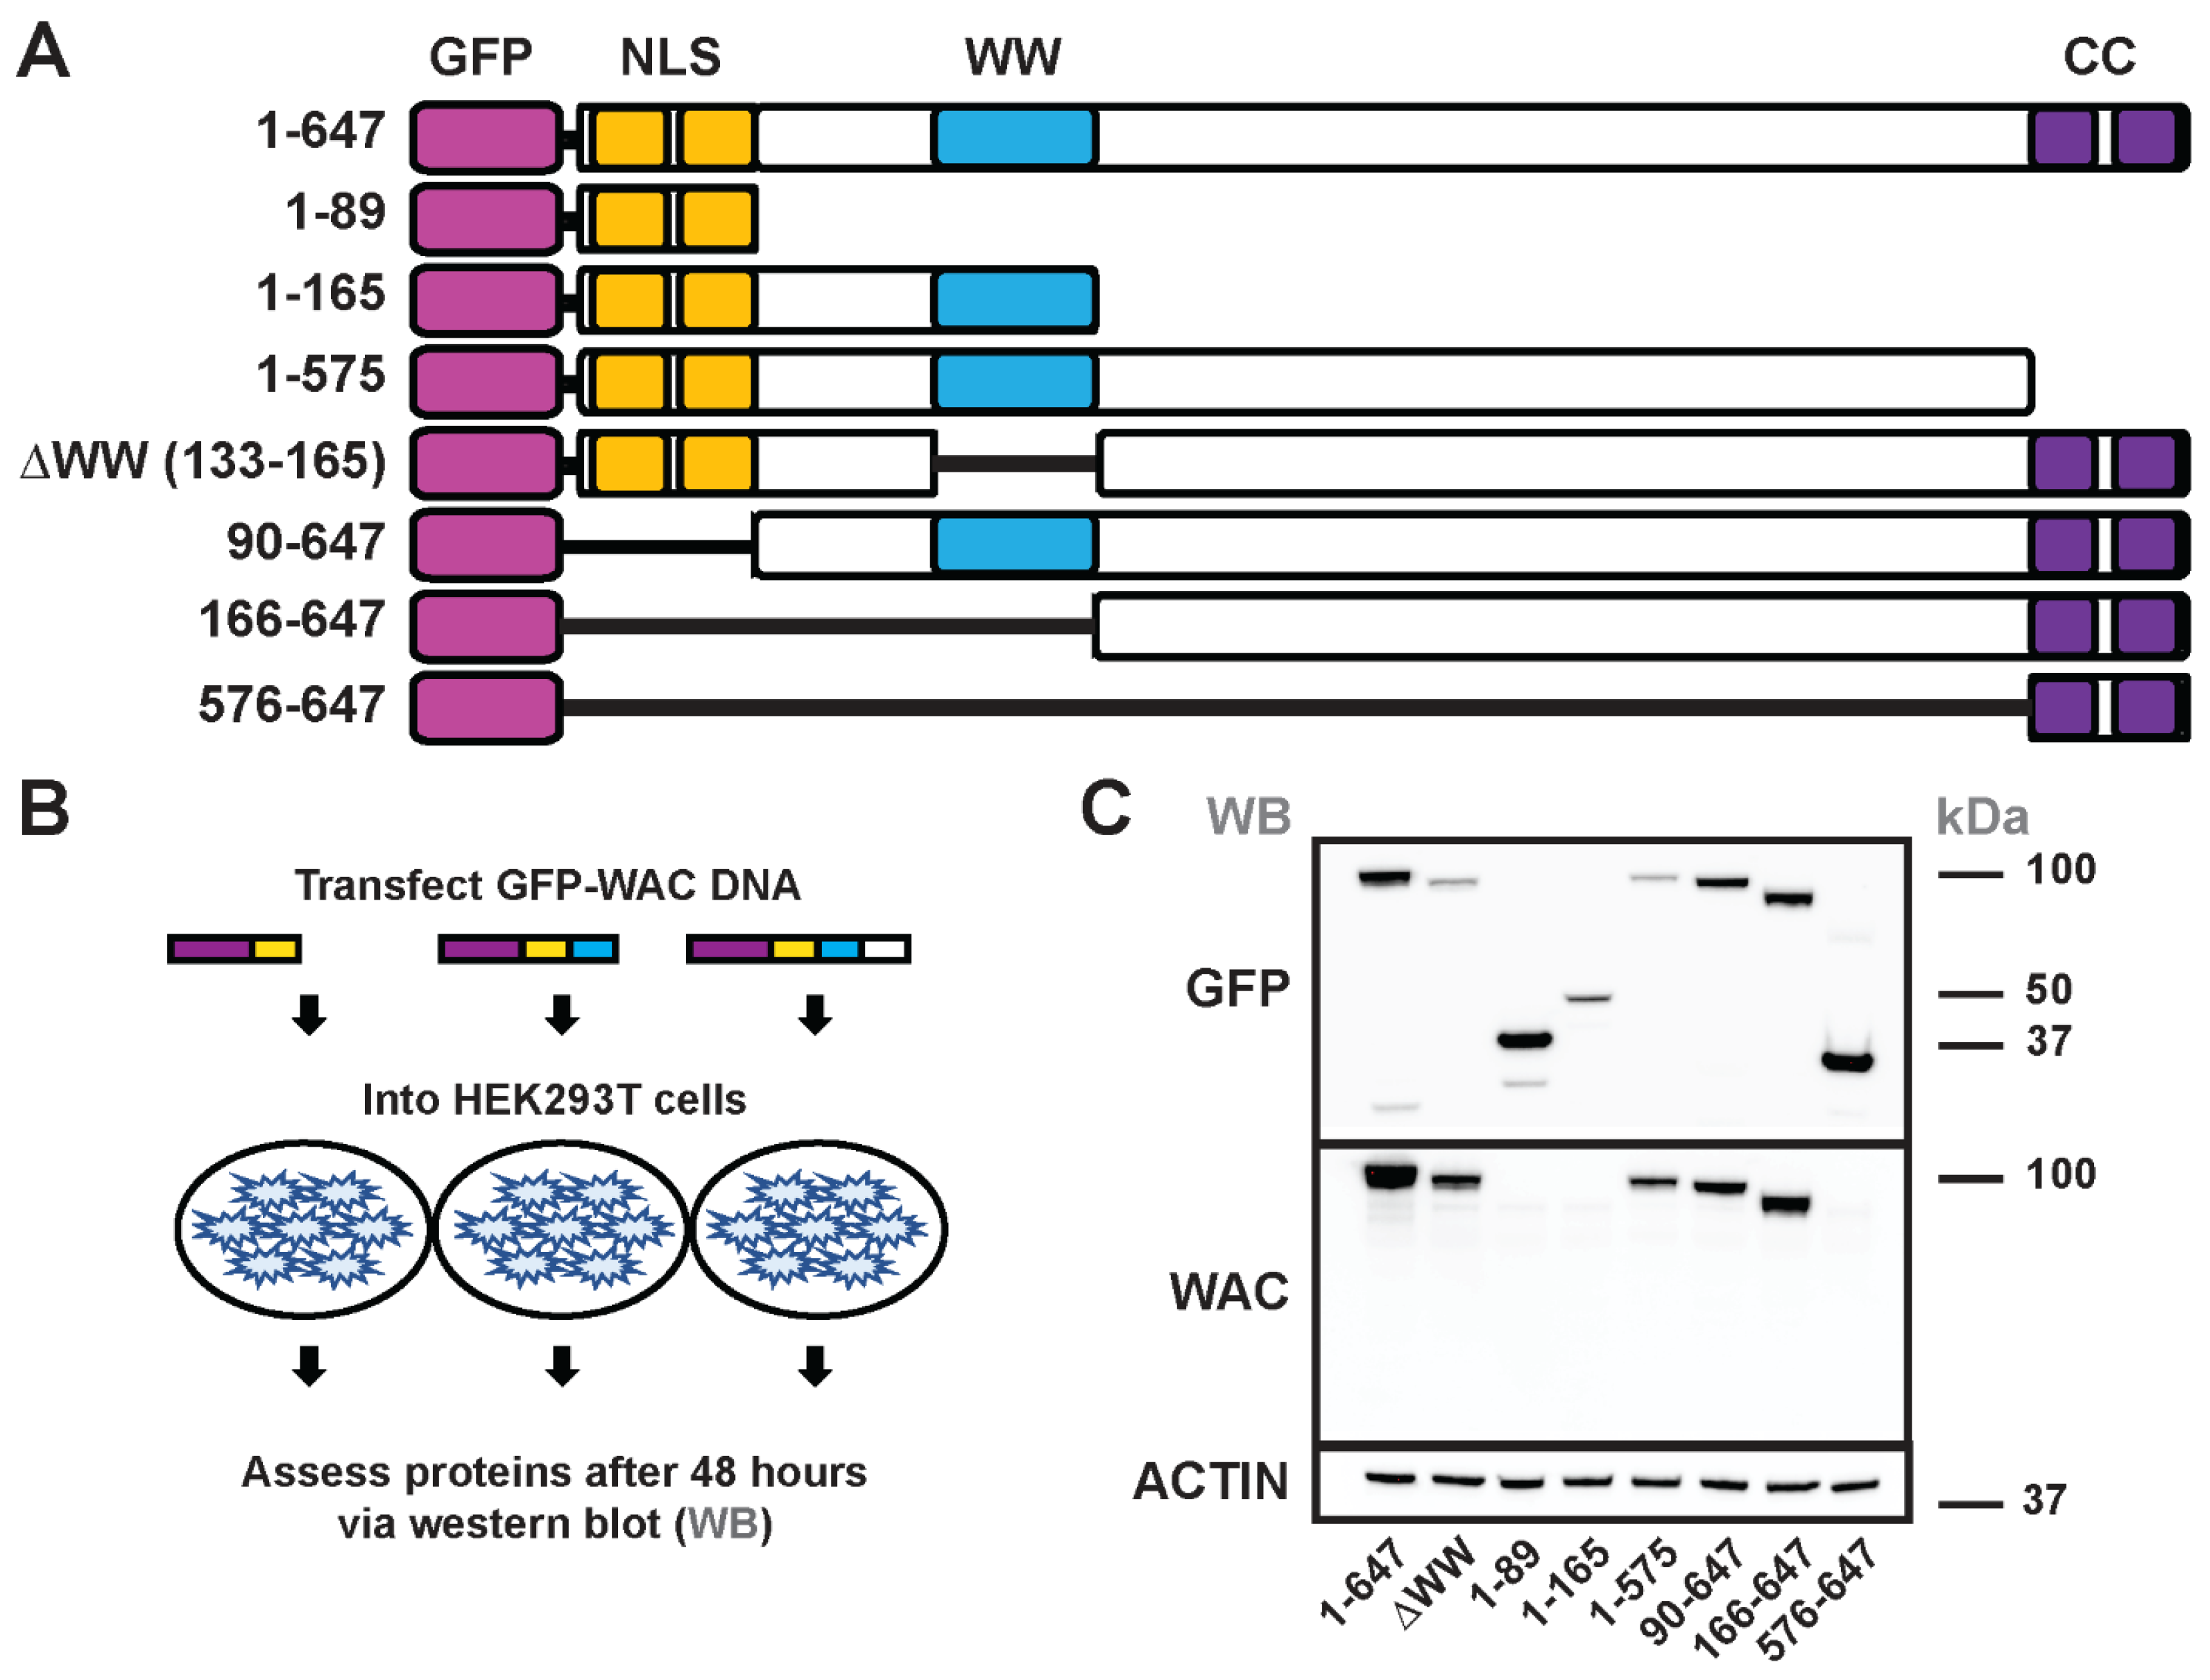
3.4. Generation and structure/function of GFP-WAC mutant fusion proteins
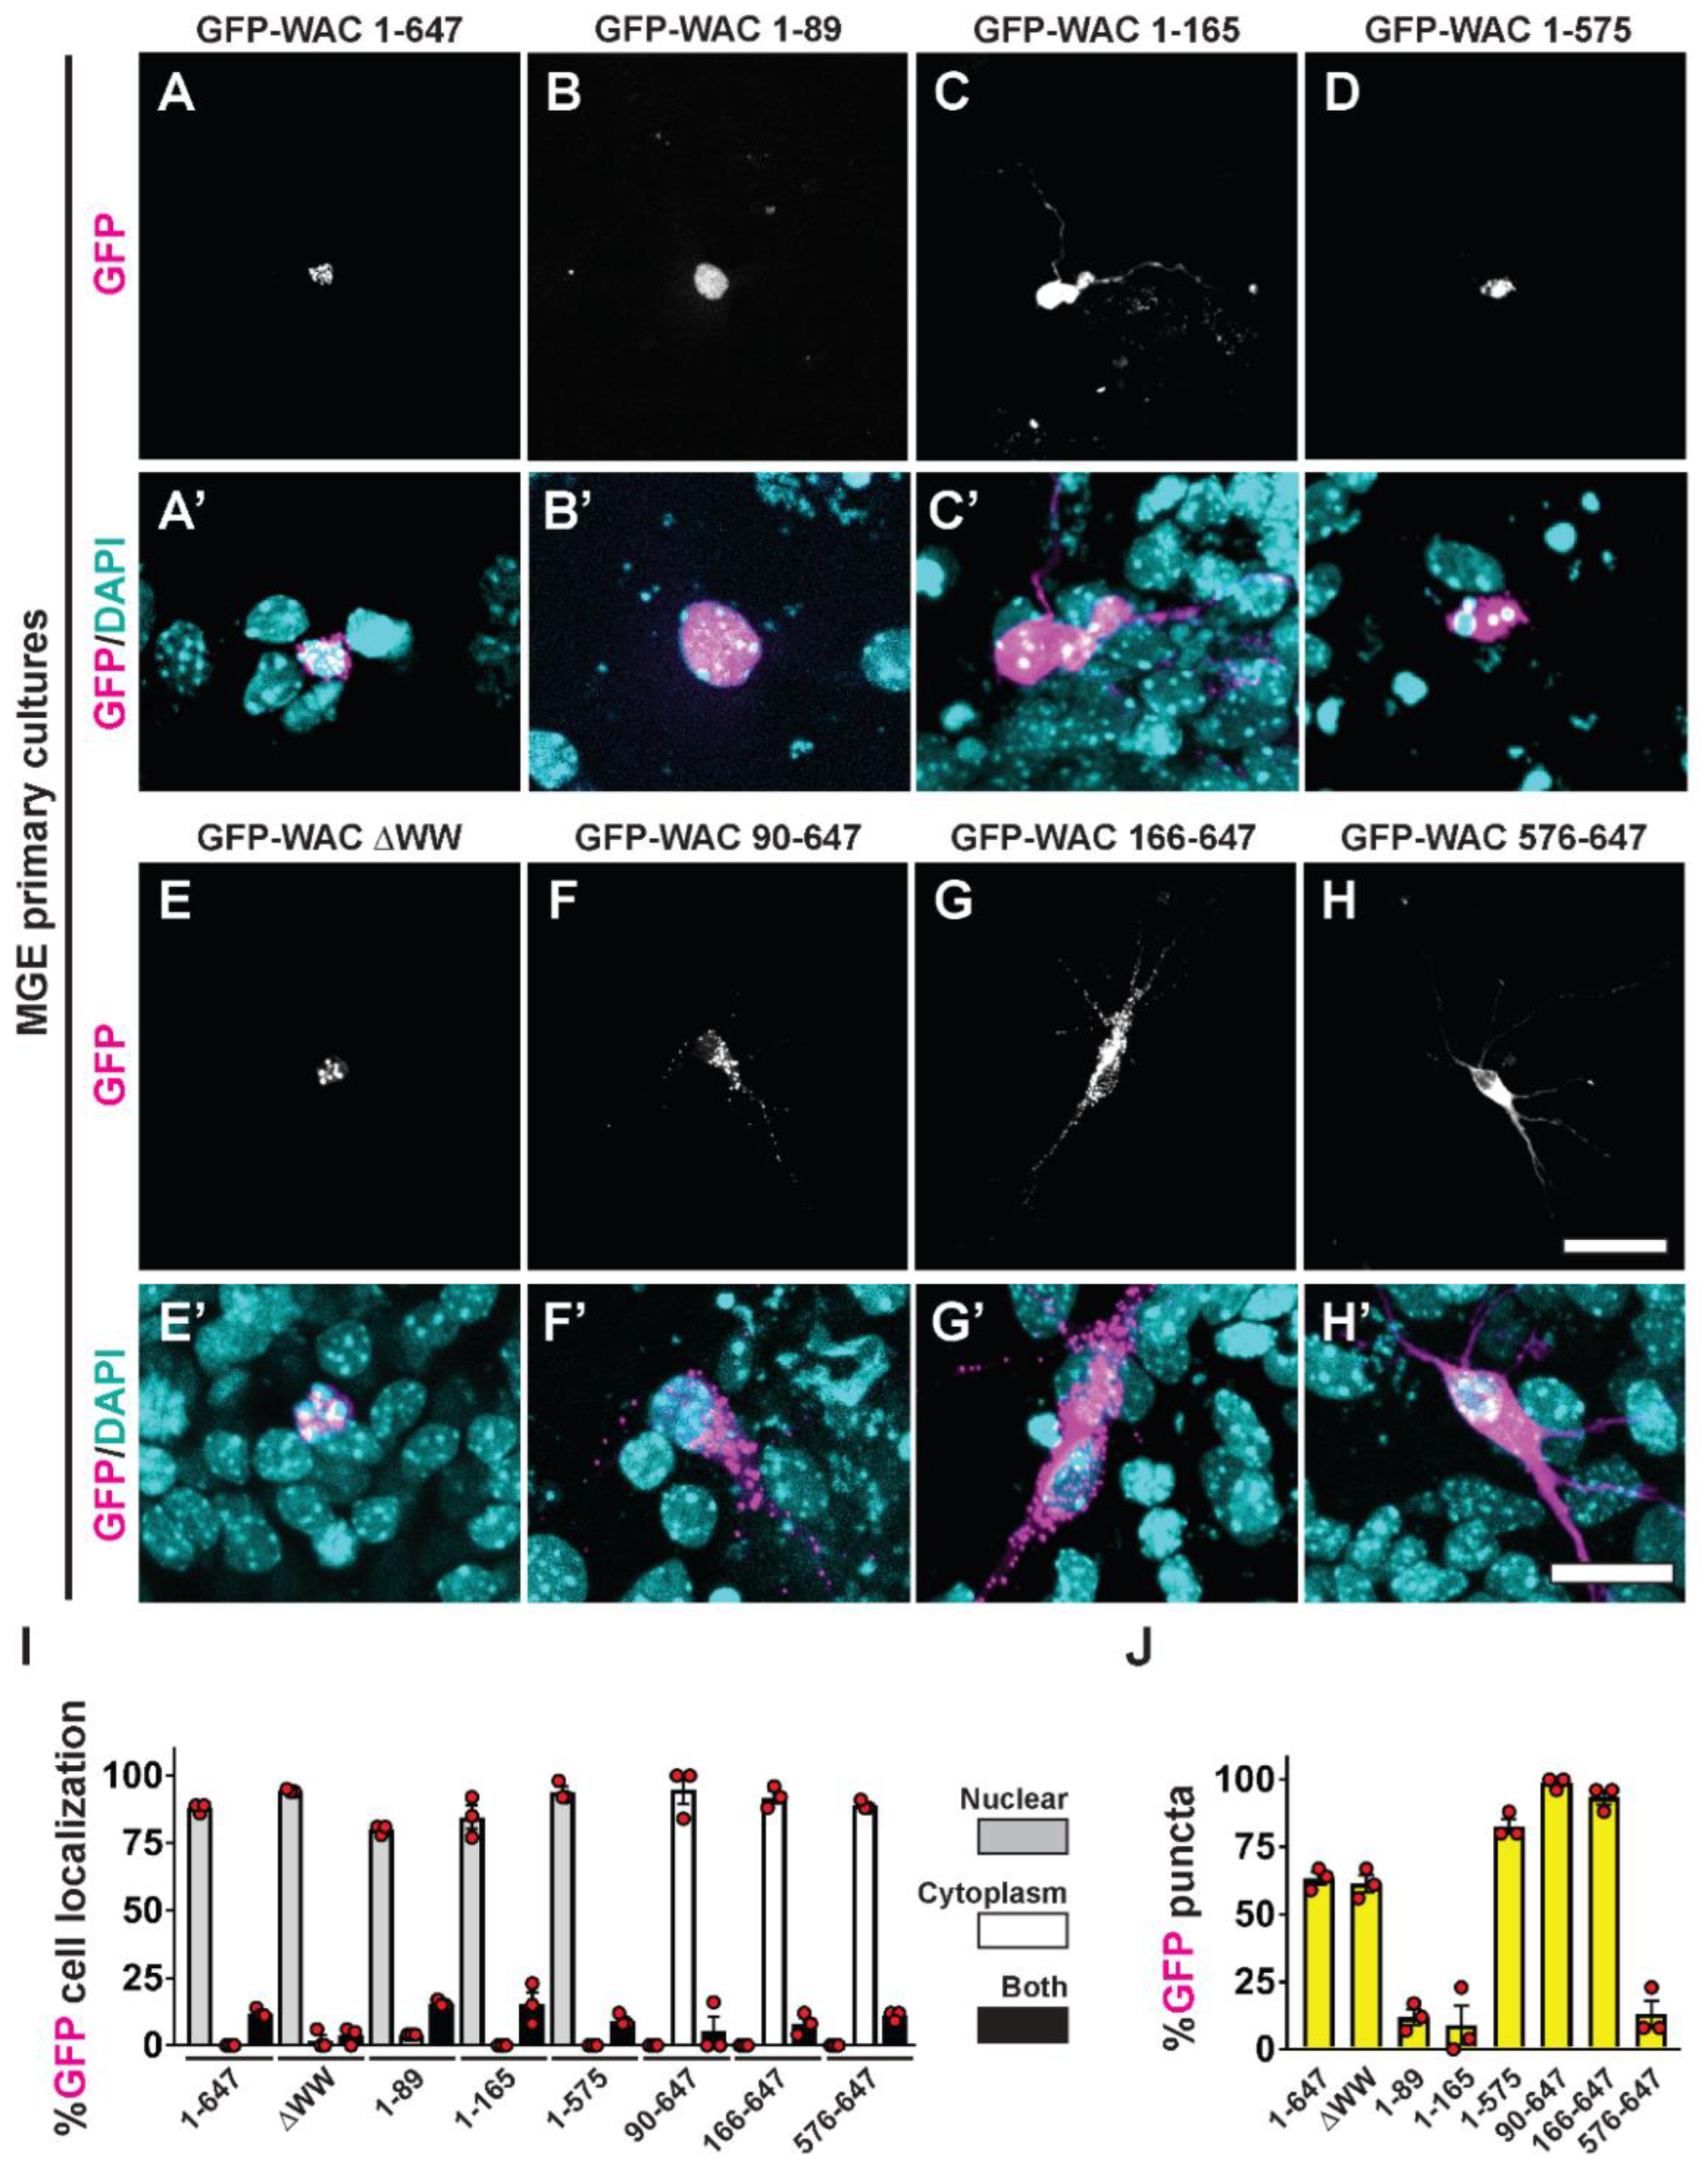
3.5. WAC deletion mutant proteins exhibit differential targeting and aggregation in neurons
4. Discussion
Author Contributions
Funding
Institutional Review Board Statement
Data Availability Statement
Conflicts of Interest
References
- Mitchell, K.J. The Genetics of Neurodevelopmental Disease. Curr. Opin. Neurobiol. 2011, 21, 197–203. [CrossRef]
- Chang, J.; Gilman, S.R.; Chiang, A.H.; Sanders, S.J.; Vitkup, D. Genotype to Phenotype Relationships in Autism Spectrum Disorders. Nat. Neurosci. 2015, 18, 191–198. [CrossRef]
- Bupp, C.P.; English, B.K.; Rajasekaran, S.; Prokop, J.W. Introduction to Personalized Medicine in Pediatrics. Pediatr. Ann. 2022, 51, e381–e386. [CrossRef]
- DeSanto, C.; D’Aco, K.; Araujo, G.C.; Shannon, N.; DDD Study; Vernon, H.; Rahrig, A.; Monaghan, K.G.; Niu, Z.; Vitazka, P.; et al. WAC Loss-of-Function Mutations Cause a Recognisable Syndrome Characterised by Dysmorphic Features, Developmental Delay and Hypotonia and Recapitulate 10p11.23 Microdeletion Syndrome. J. Med. Genet. 2015, 52, 754–761. [CrossRef]
- Lugtenberg, D.; Reijnders, M.R.F.; Fenckova, M.; Bijlsma, E.K.; Bernier, R.; van Bon, B.W.M.; Smeets, E.; Vulto-van Silfhout, A.T.; Bosch, D.; Eichler, E.E.; et al. De Novo Loss-of-Function Mutations in WAC Cause a Recognizable Intellectual Disability Syndrome and Learning Deficits in Drosophila. Eur. J. Hum. Genet. EJHG 2016, 24, 1145–1153. [CrossRef]
- Leonardi, E.; Bellini, M.; Aspromonte, M.C.; Polli, R.; Mercante, A.; Ciaccio, C.; Granocchio, E.; Bettella, E.; Donati, I.; Cainelli, E.; et al. A Novel WAC Loss of Function Mutation in an Individual Presenting with Encephalopathy Related to Status Epilepticus during Sleep (ESES). Genes 2020, 11. [CrossRef]
- Alawadhi, A.; Morgan, A.T.; Mucha, B.E.; Scheffer, I.E.; Myers, K.A. Self-Limited Focal Epilepsy and Childhood Apraxia of Speech with WAC Pathogenic Variants. Eur. J. Paediatr. Neurol. EJPN Off. J. Eur. Paediatr. Neurol. Soc. 2021, 30, 25–28. [CrossRef]
- Morales, J.A.; Valenzuela, I.; Cuscó, I.; Cogné, B.; Isidor, B.; Matalon, D.R.; Gomez-Ospina, N. Clinical and Molecular Characterization of Five New Individuals with WAC-Related Intellectual Disability: Evidence of Pathogenicity for a Novel Splicing Variant. Am. J. Med. Genet. A. 2022. [CrossRef]
- Sanders, S.J.; He, X.; Willsey, A.J.; Ercan-Sencicek, A.G.; Samocha, K.E.; Cicek, A.E.; Murtha, M.T.; Bal, V.H.; Bishop, S.L.; Dong, S.; et al. Insights into Autism Spectrum Disorder Genomic Architecture and Biology from 71 Risk Loci. Neuron 2015, 87, 1215–1233. [CrossRef]
- Fu, J.M.; Satterstrom, F.K.; Peng, M.; Brand, H.; Collins, R.L.; Dong, S.; Wamsley, B.; Klei, L.; Wang, L.; Hao, S.P.; et al. Rare Coding Variation Provides Insight into the Genetic Architecture and Phenotypic Context of Autism. Nat. Genet. 2022, 54, 1320–1331. [CrossRef]
- Xu, G.M.; Arnaout, M.A. WAC, a Novel WW Domain-Containing Adapter with a Coiled-Coil Region, Is Colocalized with Splicing Factor SC35. Genomics 2002, 79, 87–94. [CrossRef]
- Zhang, F.; Yu, X. WAC, a Functional Partner of RNF20/40, Regulates Histone H2B Ubiquitination and Gene Transcription. Mol. Cell 2011, 41, 384–397. [CrossRef]
- McKnight, N.C.; Jefferies, H.B.J.; Alemu, E.A.; Saunders, R.E.; Howell, M.; Johansen, T.; Tooze, S.A. Genome-Wide SiRNA Screen Reveals Amino Acid Starvation-Induced Autophagy Requires SCOC and WAC. EMBO J. 2012, 31, 1931–1946. [CrossRef]
- David-Morrison, G.; Xu, Z.; Rui, Y.-N.; Charng, W.-L.; Jaiswal, M.; Yamamoto, S.; Xiong, B.; Zhang, K.; Sandoval, H.; Duraine, L.; et al. WAC Regulates MTOR Activity by Acting as an Adaptor for the TTT and Pontin/Reptin Complexes. Dev. Cell 2016, 36, 139–151. [CrossRef]
- Qi, F.; Chen, Q.; Chen, H.; Yan, H.; Chen, B.; Xiang, X.; Liang, C.; Yi, Q.; Zhang, M.; Cheng, H.; et al. WAC Promotes Polo-like Kinase 1 Activation for Timely Mitotic Entry. Cell Rep. 2018, 24, 546–556. [CrossRef]
- Stafford, A.M.; Pacheco-Vergara, M.; Uhl, K.L.; Jager, T.E.; Li, X.; Jeong, J.; Vogt, D. A Murine Wac Model Exhibits Phenotypes Relevant to DeSanto-Shinawi Syndrome 2022, 2022.01.24.477600.
- Wonders, C.P.; Anderson, S.A. The Origin and Specification of Cortical Interneurons. Nat. Rev. Neurosci. 2006, 7, 687–696. [CrossRef]
- Prokop, J.W.; Lazar, J.; Crapitto, G.; Smith, D.C.; Worthey, E.A.; Jacob, H.J. Molecular Modeling in the Age of Clinical Genomics, the Enterprise of the next Generation. J. Mol. Model. 2017, 23, 75. [CrossRef]
- Prokop, J.W.; Jdanov, V.; Savage, L.; Morris, M.; Lamb, N.; VanSickle, E.; Stenger, C.L.; Rajasekaran, S.; Bupp, C.P. Computational and Experimental Analysis of Genetic Variants. Compr. Physiol. 2022, 12, 3303–3336. [CrossRef]
- Maglott, D.; Ostell, J.; Pruitt, K.D.; Tatusova, T. Entrez Gene: Gene-Centered Information at NCBI. Nucleic Acids Res. 2005, 33, D54–D58. [CrossRef]
- Papadopoulos, J.S.; Agarwala, R. COBALT: Constraint-Based Alignment Tool for Multiple Protein Sequences. Bioinformatics 2007, 23, 1073–1079. [CrossRef]
- The UniProt Consortium UniProt: A Hub for Protein Information. Nucleic Acids Res. 2015, 43, D204–D212. [CrossRef]
- Karczewski, K.J.; Francioli, L.C.; Tiao, G.; Cummings, B.B.; Alföldi, J.; Wang, Q.; Collins, R.L.; Laricchia, K.M.; Ganna, A.; Birnbaum, D.P.; et al. The Mutational Constraint Spectrum Quantified from Variation in 141,456 Humans. Nature 2020, 581, 434–443. [CrossRef]
- Landrum, M.J.; Lee, J.M.; Benson, M.; Brown, G.; Chao, C.; Chitipiralla, S.; Gu, B.; Hart, J.; Hoffman, D.; Hoover, J.; et al. ClinVar: Public Archive of Interpretations of Clinically Relevant Variants. Nucleic Acids Res. 2016, 44, D862–D868. [CrossRef]
- Jumper, J.; Evans, R.; Pritzel, A.; Green, T.; Figurnov, M.; Ronneberger, O.; Tunyasuvunakool, K.; Bates, R.; Žídek, A.; Potapenko, A.; et al. Highly Accurate Protein Structure Prediction with AlphaFold. Nature 2021, 596, 583–589. [CrossRef]
- Kumar, M.; Michael, S.; Alvarado-Valverde, J.; Mészáros, B.; Sámano-Sánchez, H.; Zeke, A.; Dobson, L.; Lazar, T.; Örd, M.; Nagpal, A.; et al. The Eukaryotic Linear Motif Resource: 2022 Release. Nucleic Acids Res. 2022, 50, D497–D508. [CrossRef]
- Li, M.; Santpere, G.; Imamura Kawasawa, Y.; Evgrafov, O.V.; Gulden, F.O.; Pochareddy, S.; Sunkin, S.M.; Li, Z.; Shin, Y.; Zhu, Y.; et al. Integrative Functional Genomic Analysis of Human Brain Development and Neuropsychiatric Risks. Science 2018, 362, eaat7615. [CrossRef]
- Jones, A.R.; Overly, C.C.; Sunkin, S.M. The Allen Brain Atlas: 5 Years and Beyond. Nat. Rev. Neurosci. 2009, 10, 821–828. [CrossRef]
- Vogt, D.; Hunt, R.F.; Mandal, S.; Sandberg, M.; Silberberg, S.N.; Nagasawa, T.; Yang, Z.; Baraban, S.C.; Rubenstein, J.L.R. Lhx6 Directly Regulates Arx and CXCR7 to Determine Cortical Interneuron Fate and Laminar Position. Neuron 2014, 82, 350–364. [CrossRef]
- Angara, K.; Pai, E.L.-L.; Bilinovich, S.M.; Stafford, A.M.; Nguyen, J.T.; Li, K.X.; Paul, A.; Rubenstein, J.L.; Vogt, D. Nf1 Deletion Results in Depletion of the Lhx6 Transcription Factor and a Specific Loss of Parvalbumin+ Cortical Interneurons. Proc. Natl. Acad. Sci. U. S. A. 2020. [CrossRef]
- Wundrach, D.; Martinetti, L.E.; Stafford, A.M.; Bilinovich, S.M.; Angara, K.; Prokop, J.W.; Crandall, S.R.; Vogt, D. A Human TSC1 Variant Screening Platform in Gabaergic Cortical Interneurons for Genotype to Phenotype Assessments. Front. Mol. Neurosci. 2020, 13, 573409. [CrossRef]
- Sudol, M.; Hunter, T. NeW Wrinkles for an Old Domain. Cell 2000, 103, 1001–1004. [CrossRef]
- Truebestein, L.; Leonard, T.A. Coiled-coils: The Long and Short of It. Bioessays 2016, 38, 903–916. [CrossRef]
- Snijders Blok, L.; Hiatt, S.M.; Bowling, K.M.; Prokop, J.W.; Engel, K.L.; Cochran, J.N.; Bebin, E.M.; Bijlsma, E.K.; Ruivenkamp, C.A.L.; Terhal, P.; et al. De Novo Mutations in MED13, a Component of the Mediator Complex, Are Associated with a Novel Neurodevelopmental Disorder. Hum. Genet. 2018, 137, 375–388. [CrossRef]
- Shimada, T.; Fournier, A.E.; Yamagata, K. Neuroprotective Function of 14-3-3 Proteins in Neurodegeneration. BioMed Res. Int. 2013, 2013, e564534. [CrossRef]
Disclaimer/Publisher’s Note: The statements, opinions and data contained in all publications are solely those of the individual author(s) and contributor(s) and not of MDPI and/or the editor(s). MDPI and/or the editor(s) disclaim responsibility for any injury to people or property resulting from any ideas, methods, instructions or products referred to in the content. |
© 2023 by the authors. Licensee MDPI, Basel, Switzerland. This article is an open access article distributed under the terms and conditions of the Creative Commons Attribution (CC BY) license (http://creativecommons.org/licenses/by/4.0/).


