1. Introduction
Images are one of the necessary forms of data in the modern era. They are used to capture a variety of physical projections ranging from scientific images to personal memories. Nevertheless, the recorded images are not always in the ideal composition and often require post-processing techniques to enhance their quality. These techniques include brightness and contrast enhancement, saturation and chromaticity adjustments, and artificial high dynamic range image creation, which are now accessible through easily accessible software and smartphone applications [
1,
2]. With the recent development in diffractive lenses and metalenses, it is highly likely that future cameras will utilize such flat lenses for digital imaging [
3,
4]. Two main problems foreseen with the above lenses are their sensitivity to wavelength changes and technical constraints in manufacturing such lenses with a large diameter. In addition to the above, spatial aberrations are expected, as with any imaging lens. The recorded information in a linear, shift-invariant incoherent imaging system can be expressed as
, where
O is the object function,
PSF is the point spread function,
N is the noise, and ‘
’ is a 2D convolutional operator. The task is to extract
O from
I as close as possible to reality. As seen from the equation, if
PSF is a sharp Kronecker Delta-like function, then
I is a copy of
O with a minimum feature size given as ~λ/NA. However, due to aberrations and limited NA, the recorded information is not an exact copy of
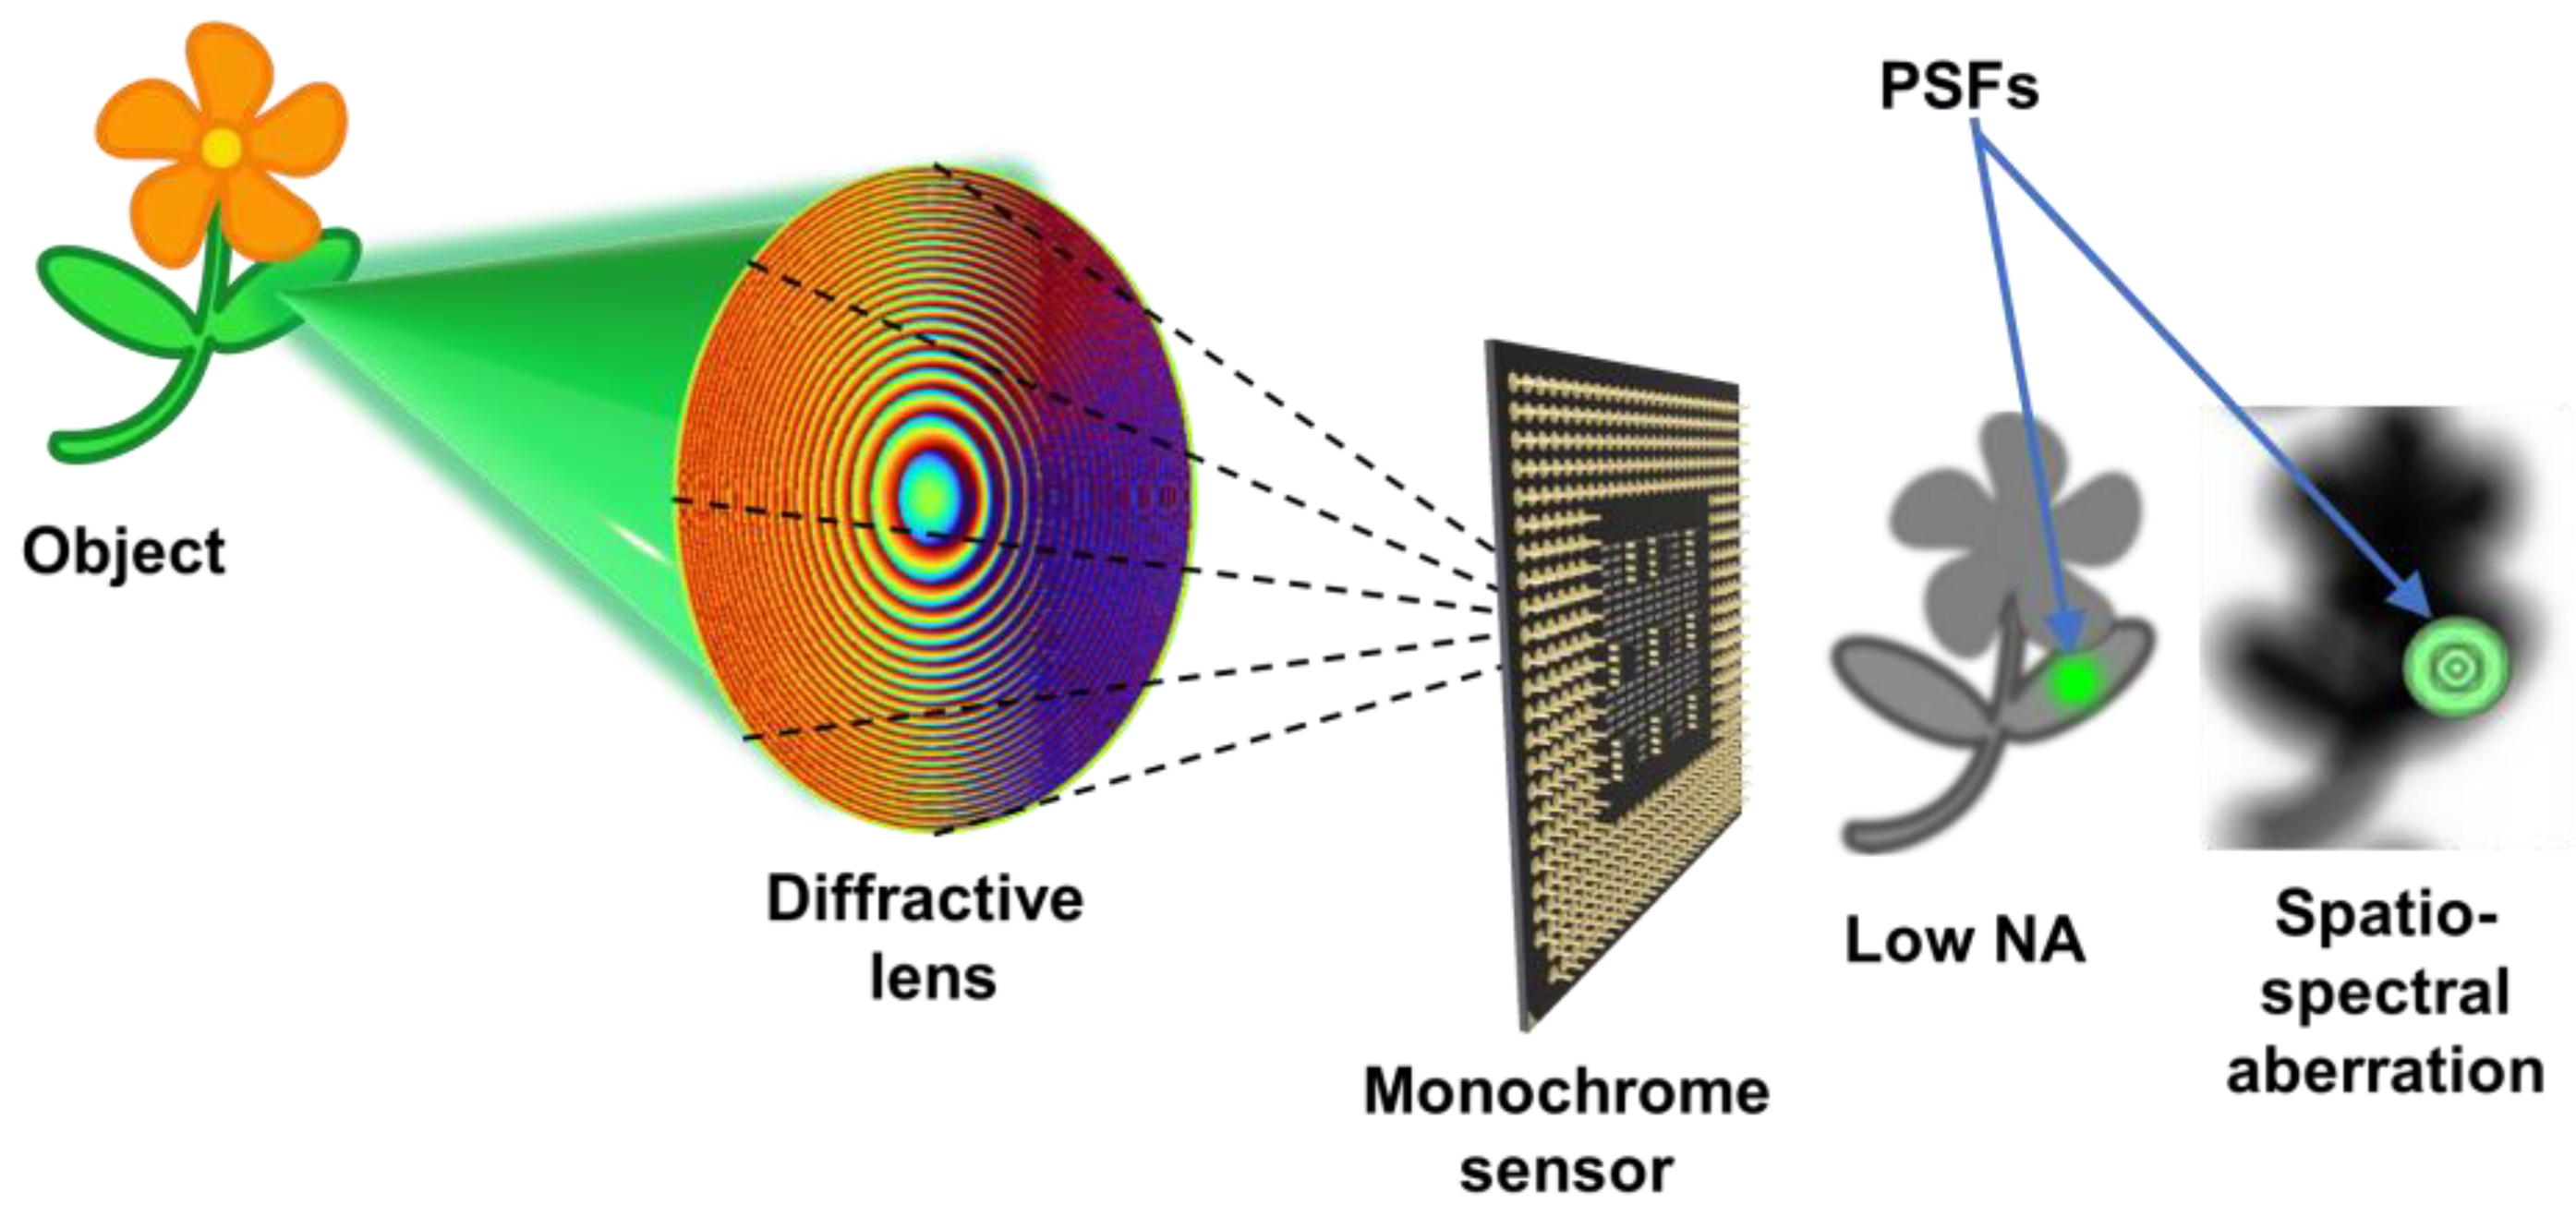
O but a modified version. The modified version can either be a blur or a distortion. Therefore, computational post-processing is required to correct the recorded information of spatial and spectral aberrations digitally, and also to enhance the resolution. In addition to spatio-spectral aberrations, there are other areas and situations where deblurring is essential. Like with human vision, where there is the least distance of distinct vision, there is a distance limit beyond which it is difficult to image an object with the maximum resolution of a smartphone camera. In such cases, the recorded image appears blurred. It is necessary to develop computational imaging solutions to the above problems. The concept figure is shown in
Figure 1.
Deep-learning based pattern recognition methods are gradually overtaking signal-processing based pattern recognition approaches during the past years [
5]. In deep learning, the first training step where the network is trained using a large data set, focused images are used. The performances of deep learning methods are affected by the degree of blur and distortion occurring during recording. It has been proven that invasive indirect imaging methods have abilities to deblur images in the presence of stronger distortion in comparison to non-invasive approaches [
6] and most the imaging situations are linear by nature, so it is possible to apply invasive methods wherever possible. Therefore, deblurring can also improve the performance of deep learning methods. If the aberrations of the imaging system are thoroughly studied and understood, then it is possible to apply even non-invasive methods that can use synthetic PSFs for image deblurring. This manuscript investigates a recently developed invasive computational reconstruction method called Lucy-Richardson-Rosen algorithm (LR
2A) for deblurring images affected by spatial and spectral aberrations. LR
2A was used to digitally extend the imaging range of smartphone cameras and to improve the performances of a deep learning network.
2. Materials and Methods
There are numerous deconvolution techniques developed to process the captured distorted information into high-resolution images [
7,
8,
9]. One straightforward approach to deconvolution is given as
, where ‘
’ is a 2D correlational operator and
O’ is the reconstructed image. As seen, the object information is sampled by
with some background noise. The above method of reconstruction is commonly called the matched filter, which generates significant background noise, and in many cases, a phase-only filter or a Weiner filter was used to improve the signal-to-noise ratio [
10,
11]. All the above filters work on the fundamental principle of pattern recognition, where the PSF is scanned over the object intensity, and every time a pattern matching is achieved, a peak is generated. In this way, the object information is reconstructed. Recently, a non-linear reconstruction (NLR) method has been developed, which is given as
, where
α and
β were tuned between -1 to 1 until a minimum entropy is obtained [
12]. Even though NLR has a wide applicability range involving different optical modulators, the resolution is limited by the autocorrelation function
[
13]. This imposes a constraint on the nature of PSF and, therefore on the type of aberrations that can be corrected. So NLR is expected to work better with PSFs with intensity localizations than PSFs that are blurred versions of point images.
Another widely used deconvolution method is the iterative Lucy-Richardson algorithm (LRA) [
14,
15]. The (
n+1)
th solution is given as
, where
PSF’ is the flipped version and complex conjugate of
PSF. The loop begins with an initial guess which is
I, and gradually converges to the maximum likelihood solution. Unlike NLR, the resolution of LRA is not constrained by the autocorrelation function. However, LRA has only a limited application range and cannot be implemented for a wide range of optical modulators such as NLR. Recently, a new deconvolution method LR
2A was developed by replacing the correlation in LRA by NLR [
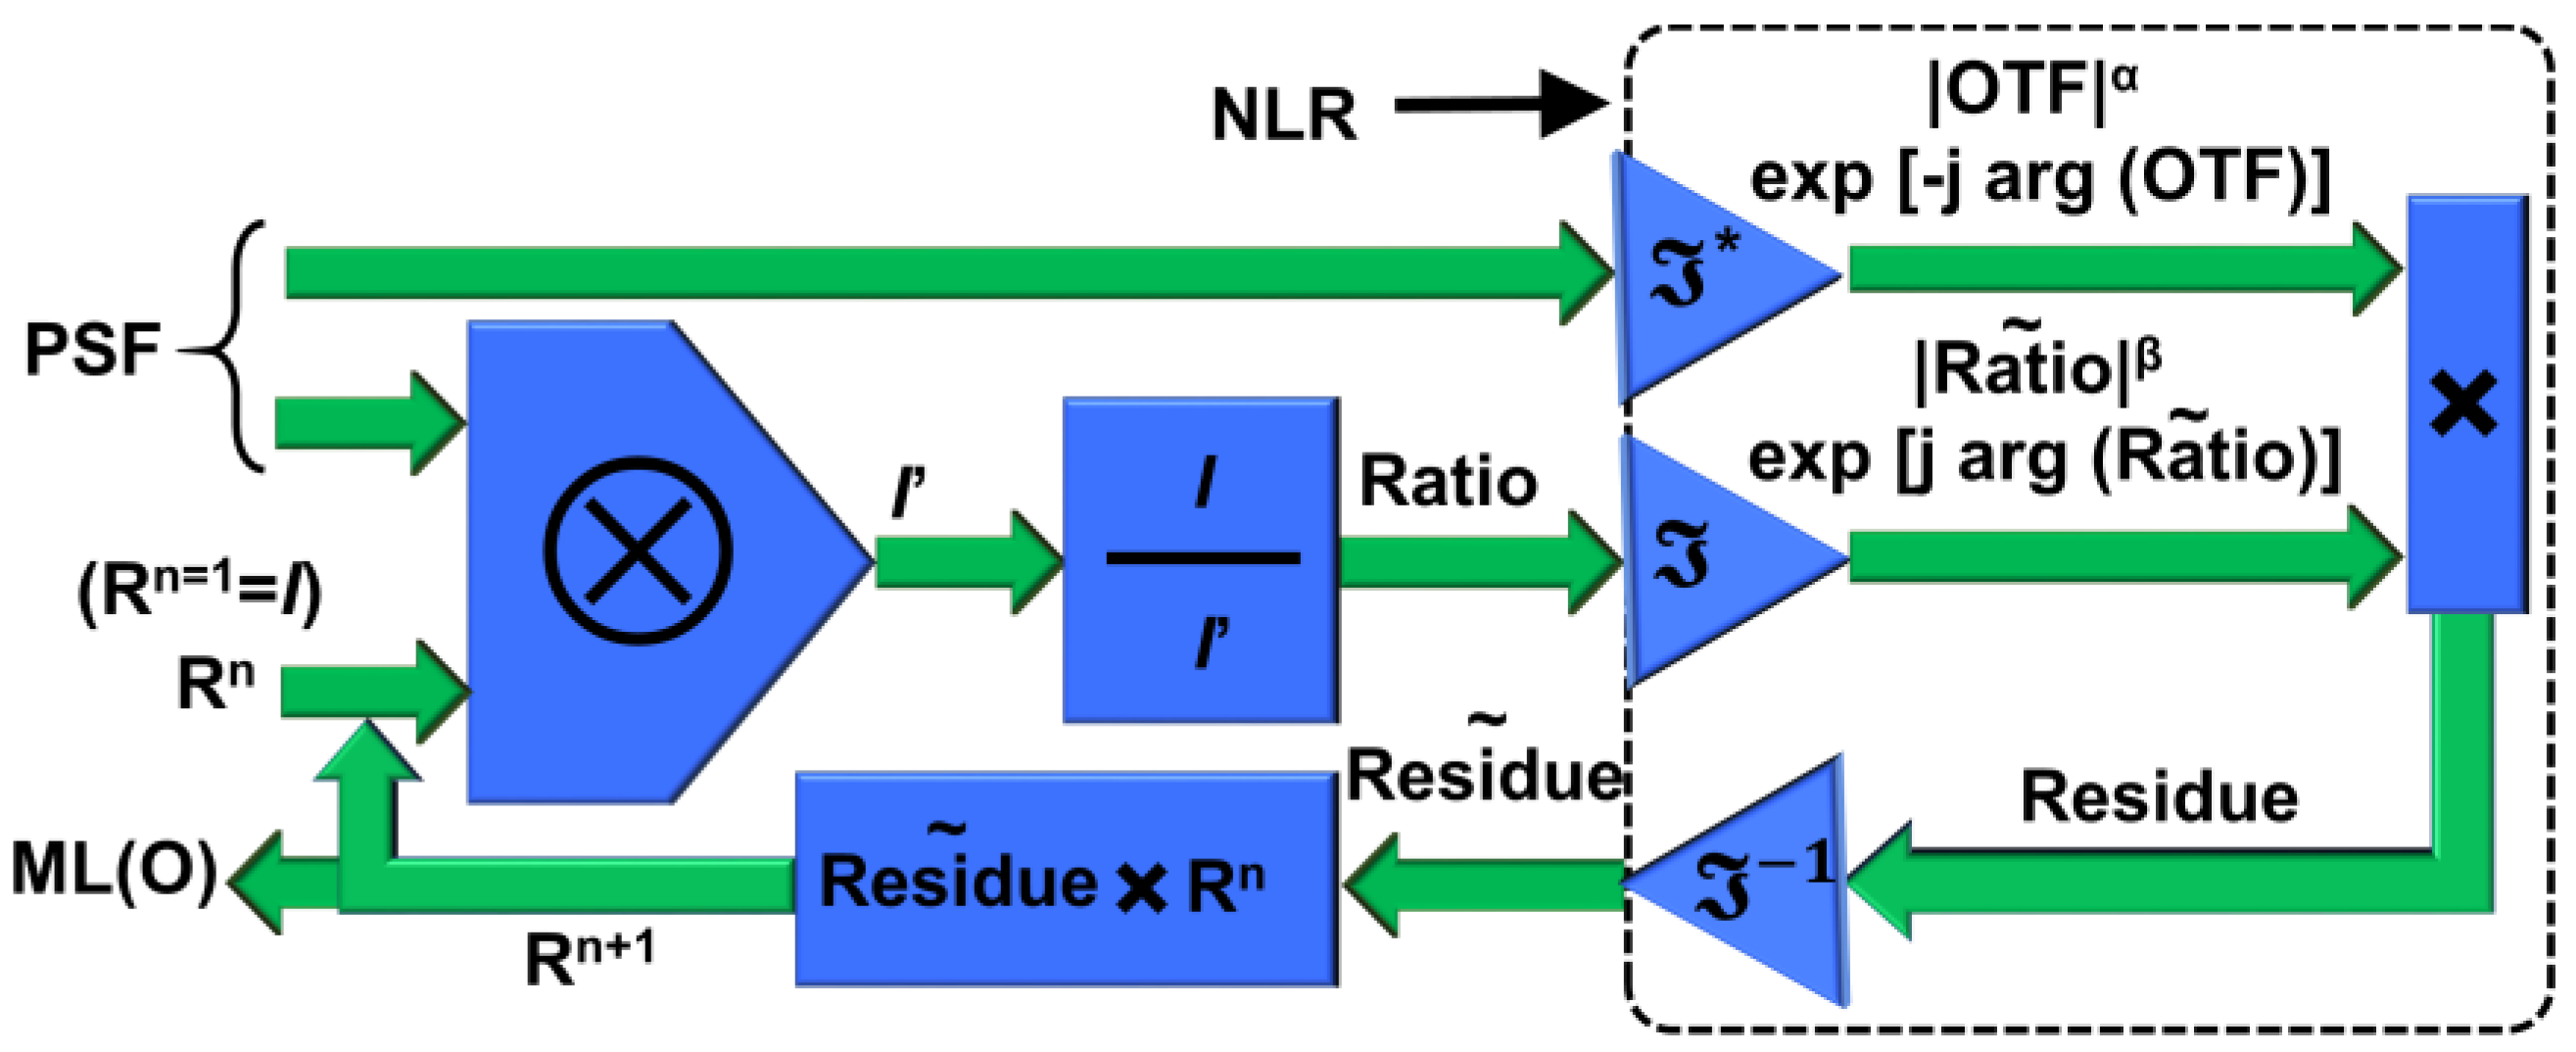
16]. The schematic of the reconstruction method is shown in
Figure 2. The algorithm begins with a convolution between the PSF and
I, with
I as the initial guess coefficient, which results in
I’. The ratio between the two matrices
I and
I’ was correlated with the PSF, and this correlation is replaced by NLR, and the resulting residue is multiplied to the first guess, and this process is continued until a maximum likelihood solution is obtained.
In the present work, we have used the LR
2A to deblur images captured using lenses with low NA and spatial and spectral aberrations. Further, we compared the results with the parent benchmarking algorithms, such as the classical LRA and NLR, to verify their effectiveness. The simulation was carried out in MATLAB with a matrix size of 500 × 500 pixels, pixel size of 8 µm, and central wavelength of
λ = 632.8 nm. The object and image distances were set as 30 cm, and a diffractive lens was designed with a focal length of 15 cm for the central wavelength with the radius of the zones given as
. This diffractive lens is representative of both diffractive as well as metalens that works based on the Pancharatnam Berry phase [
17]. A standard test object ‘Lena’ in greyscale, has been used for this study.
3. Simulation studies
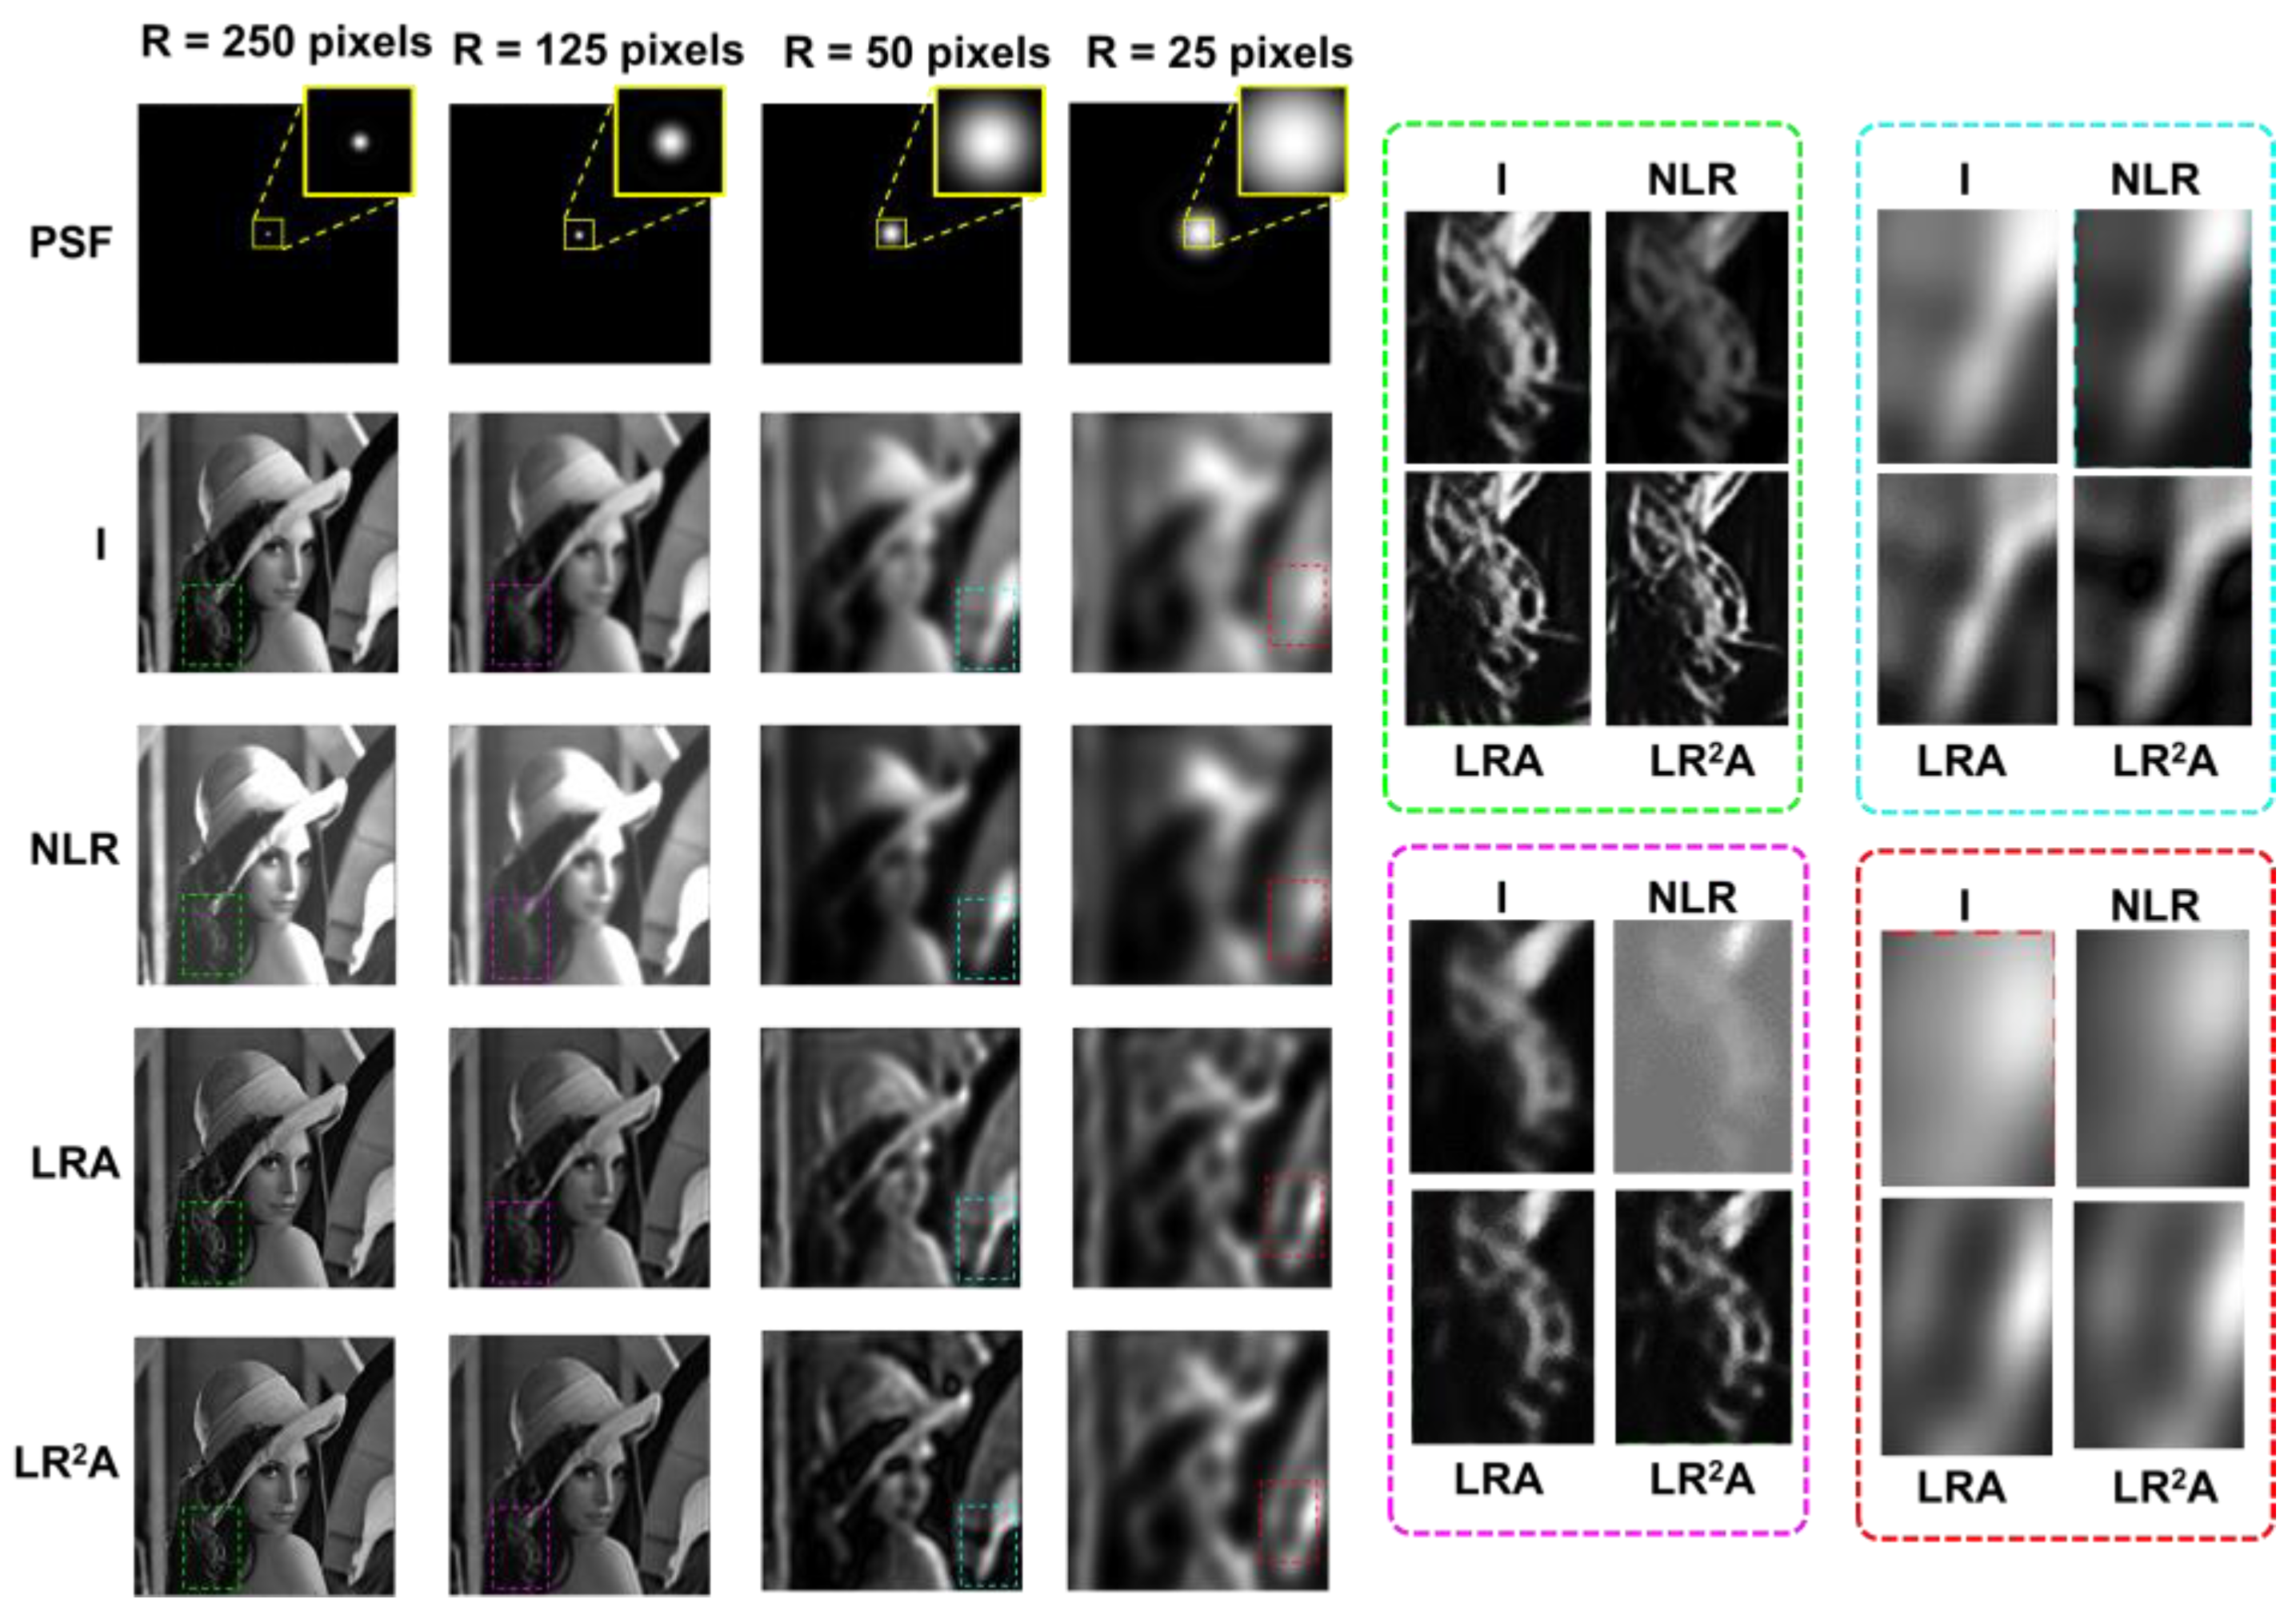
In the first study, the NA of the system was varied by introducing an iris in the plane of the diffractive lens and varying its’ diameter. The images of the PSF and object intensity distributions for the radius of the aperture
R = 250, 125, 50, and 25 pixels are shown in
Figure 3. Deblurring results with NLR (
α = 0.2,
β = 1) are shown in
Figure 3. The deblurring results of LRA and LR
2A are shown for the above cases, where the number of iterations
p required for LRA was at least 10 times that of LR
2A, with the last case requiring 100 for LRA and only 8 for LR
2A ((
α = 0,
β = 0.9). Comparing the results of NLR, LRA, and LR
2A, it appears that the performances of LRA and LR
2A are similar, while NLR does not deblur due to not sharp autocorrelation function.
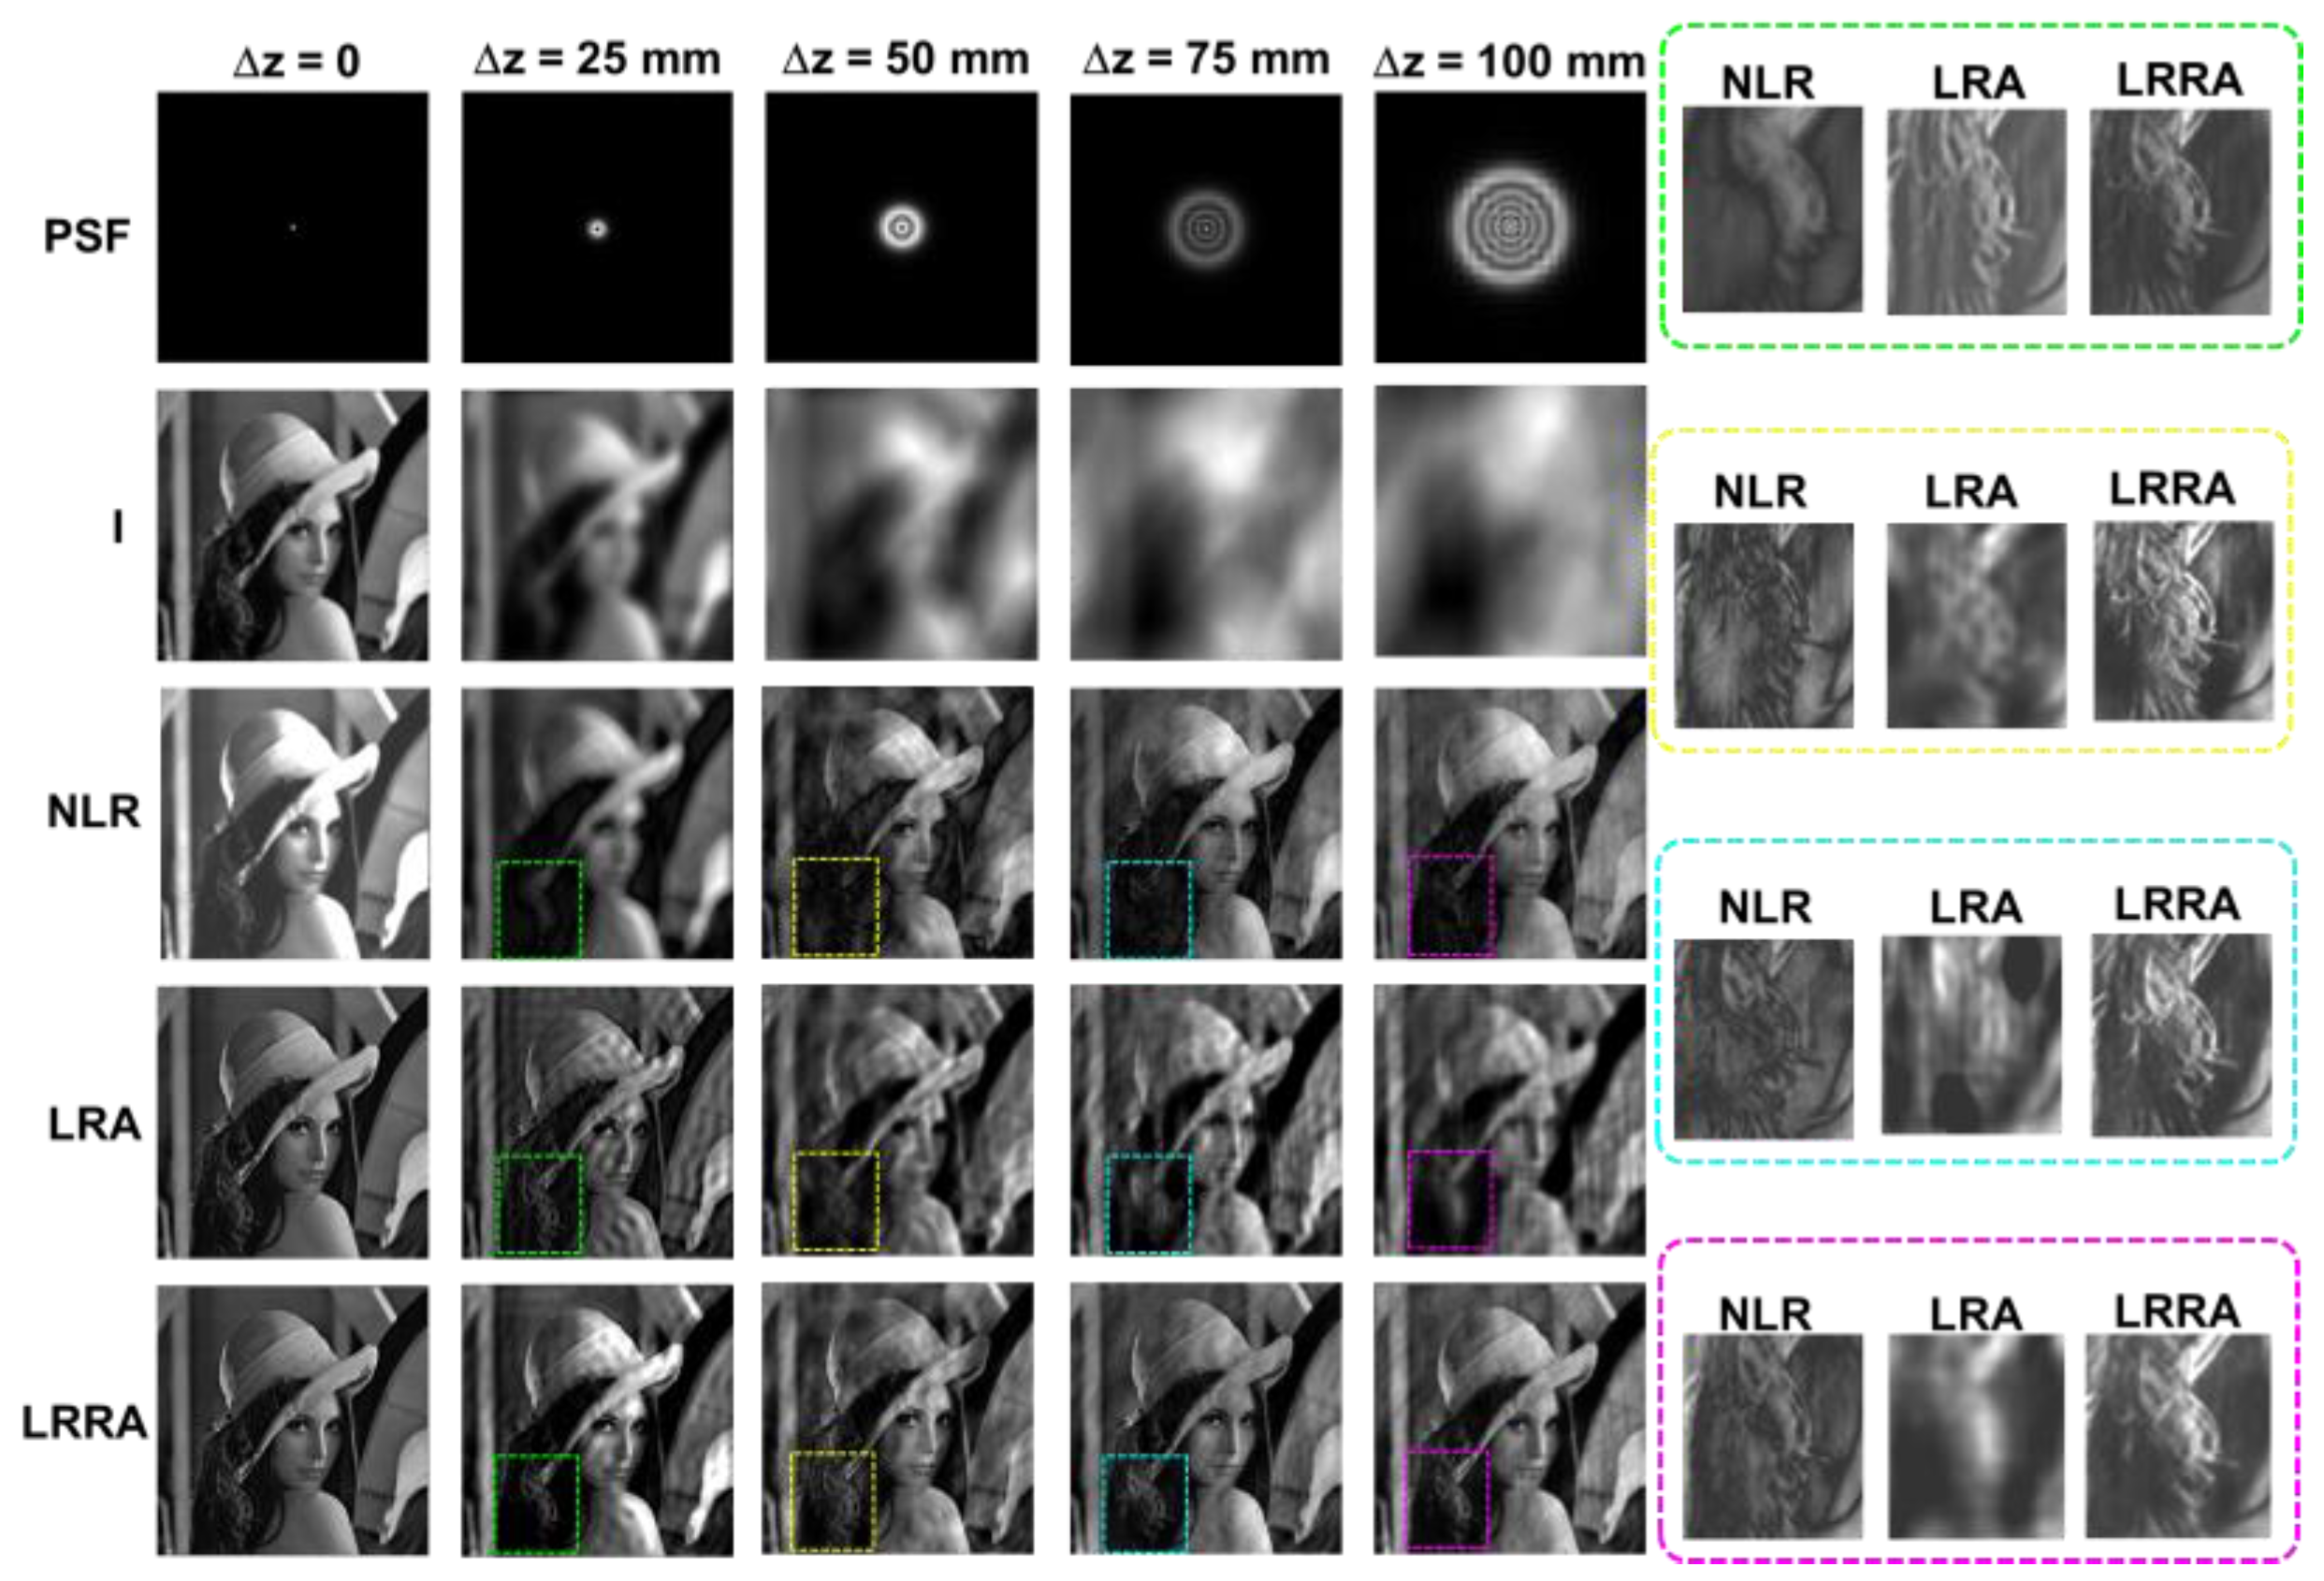
In the next study, once again, spatial aberrations in the form of axial aberrations were introduced into the system. The imaging condition (1/
u+1/
v=1/
f), where
u and
v are object and image distances, was disturbed by changing
u to
u+Δ
z, where Δ
z = 0, 25 mm, 50 mm, 75 mm, and 100 mm. The images of the PSF, object intensity patterns, and deblurring results with NLR, LRA, and LR
2A are shown in
Figure 4. It is evident that the results of NLR are better than LRA, and the results of LR
2A are better than both for large aberrations. However, when Δ
z = 25 mm, LRA is better than NLR, once again due to the lower sharpness of the autocorrelation function.
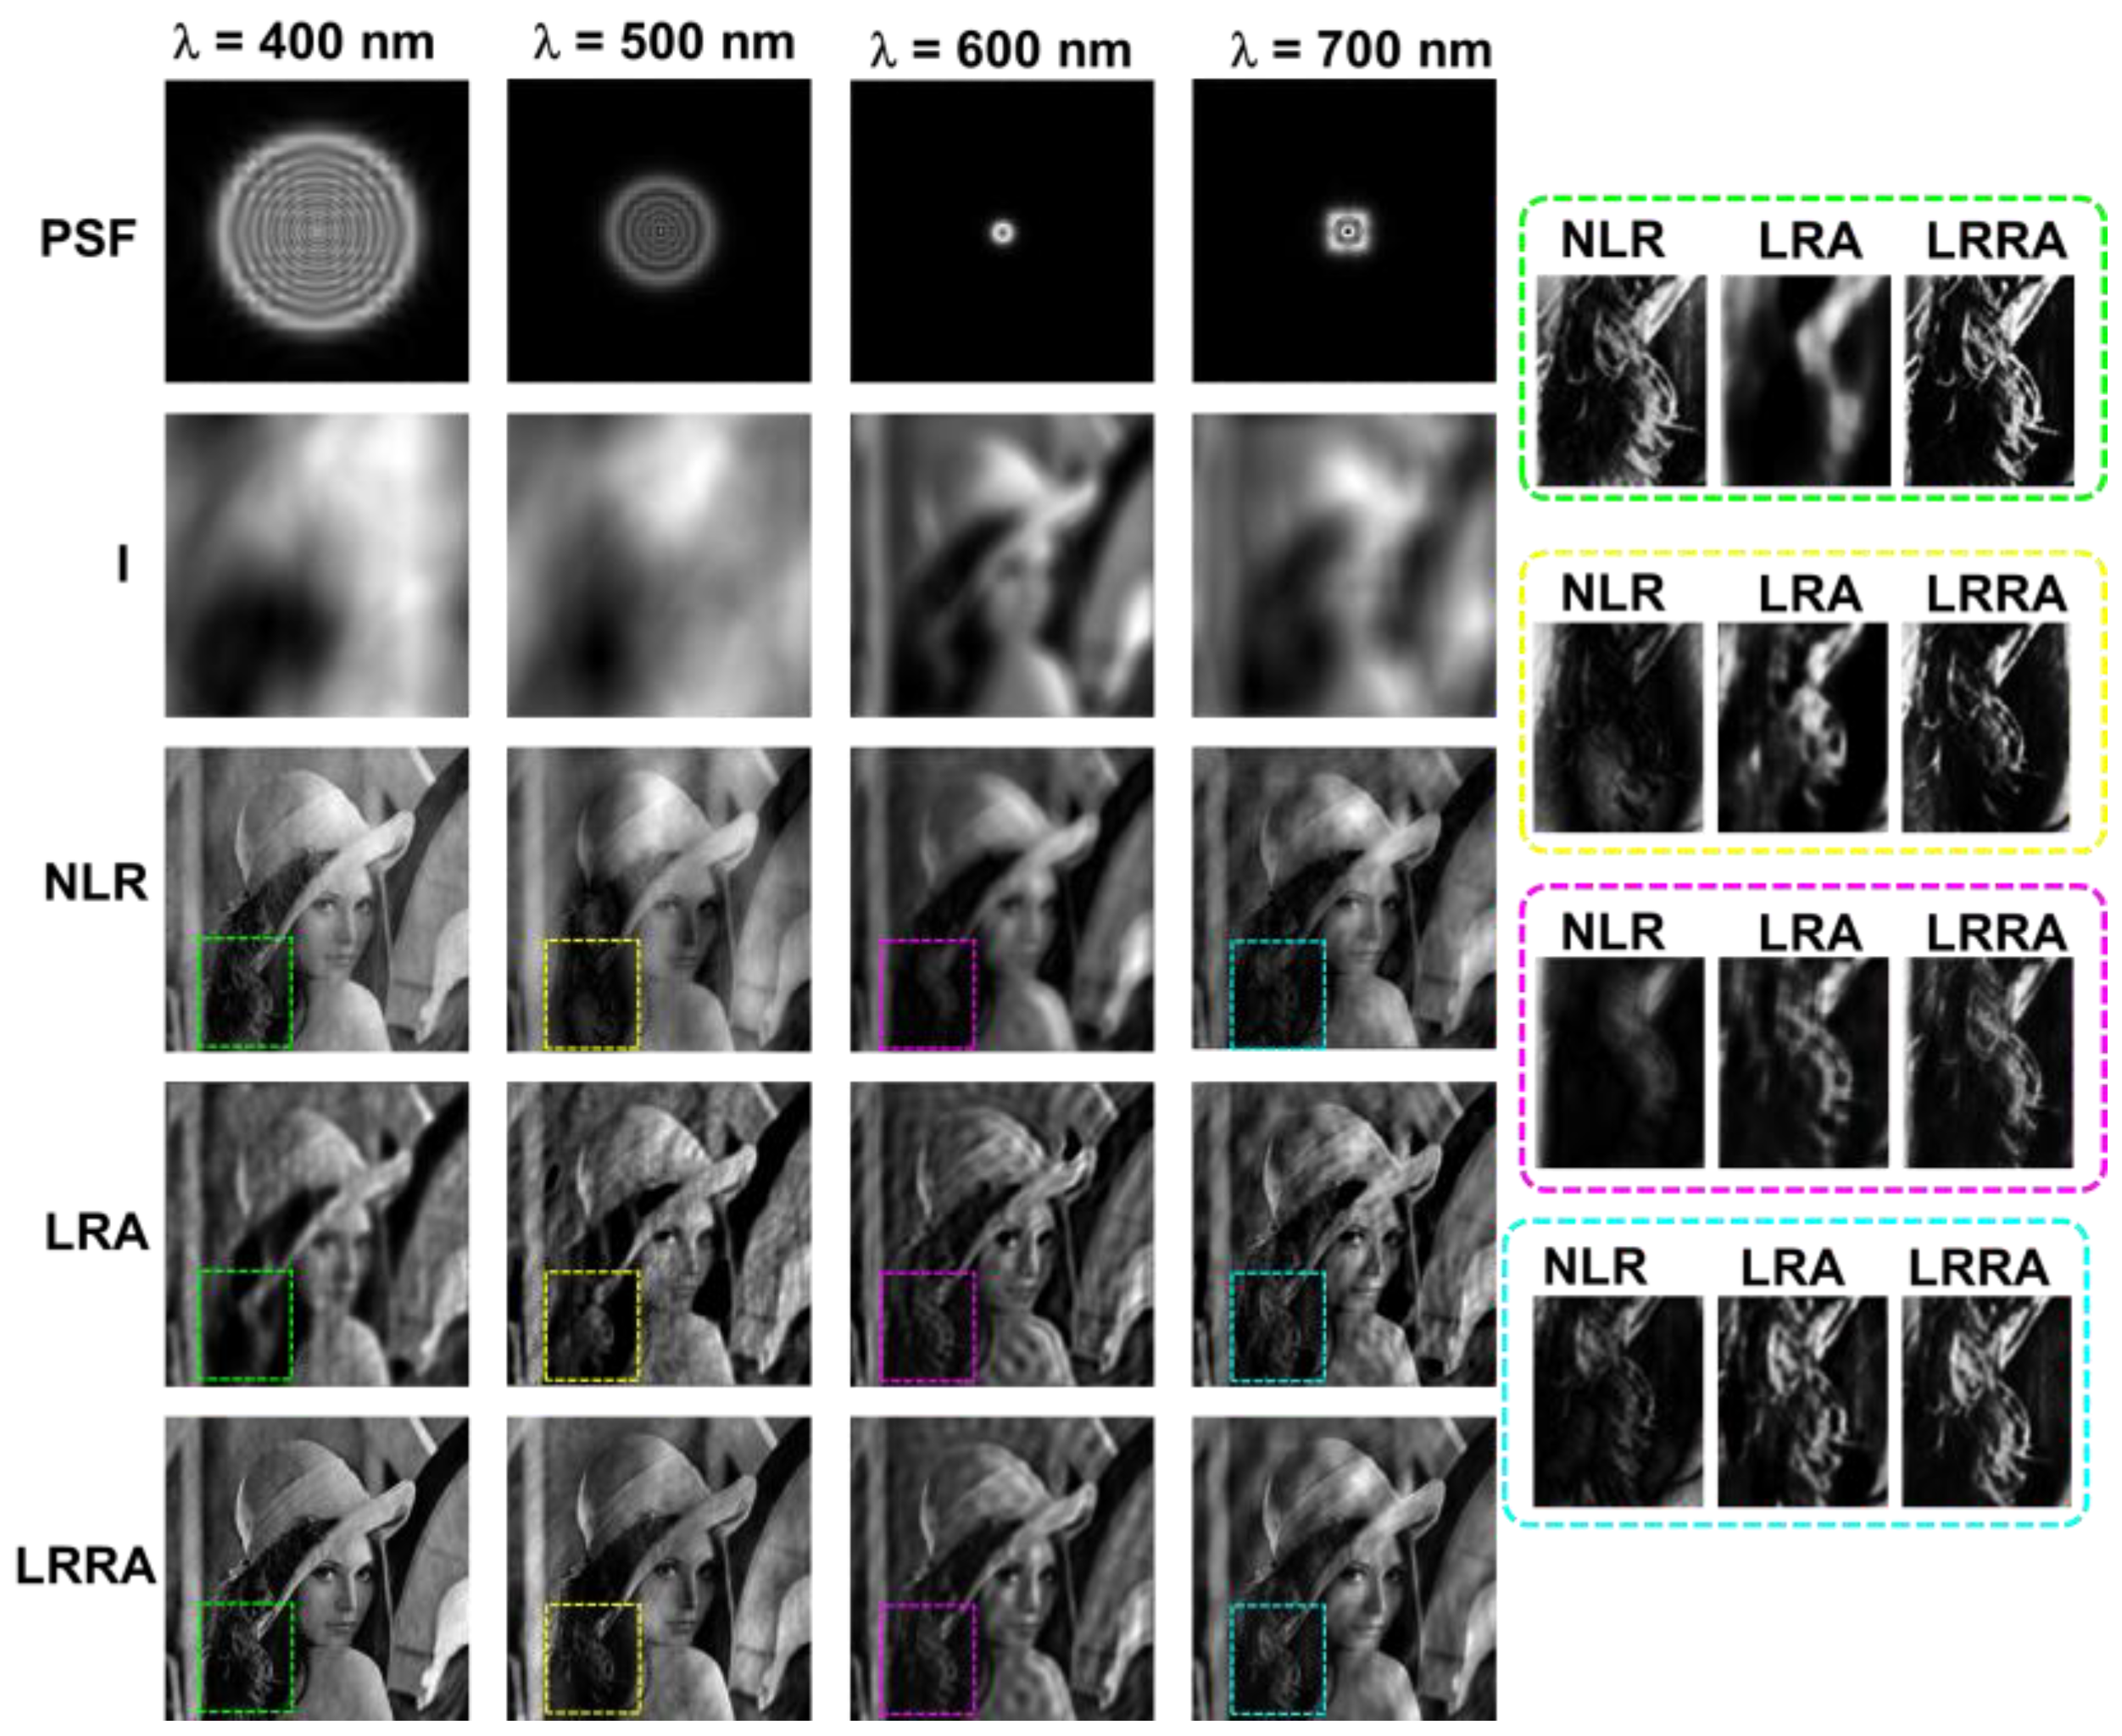
To understand the spectral aberrations effect, the illumination wavelength was varied from the design wavelength as λ = 400 nm, 500 nm, 600 nm, and 700 nm. Since the optical modulator is a diffractive lens, unlike a refractive lens exhibits chromatic aberrations. The images of the PSFs, object intensity patterns, and deblurring results with NLR, LRA, and LR
2A are shown in
Figure 5. As seen from the figures, the results obtained from LR
2A are significantly better than LRA and NLR. Another interesting observation can be made from the results. When the intensity distribution is concentrated in a small area, LRA performs better than NLR and vice versa. In all cases, the optimal value of LR
2A aligns with one of the cases of NLR or LRA. For concentrated intensity distributions, the results of LR
2A align towards LRA; in other cases, the results of LR
2A align with NLR. In all cases, LR
2A performs better than NLR and LRA. It must be noted that in the case of focusing error due to change in distance and wavelength, the deblurring with different methods improve the results. But for the first case, when the lateral resolution is low due to low NA, the deblurring methods did not improve the results as expected.
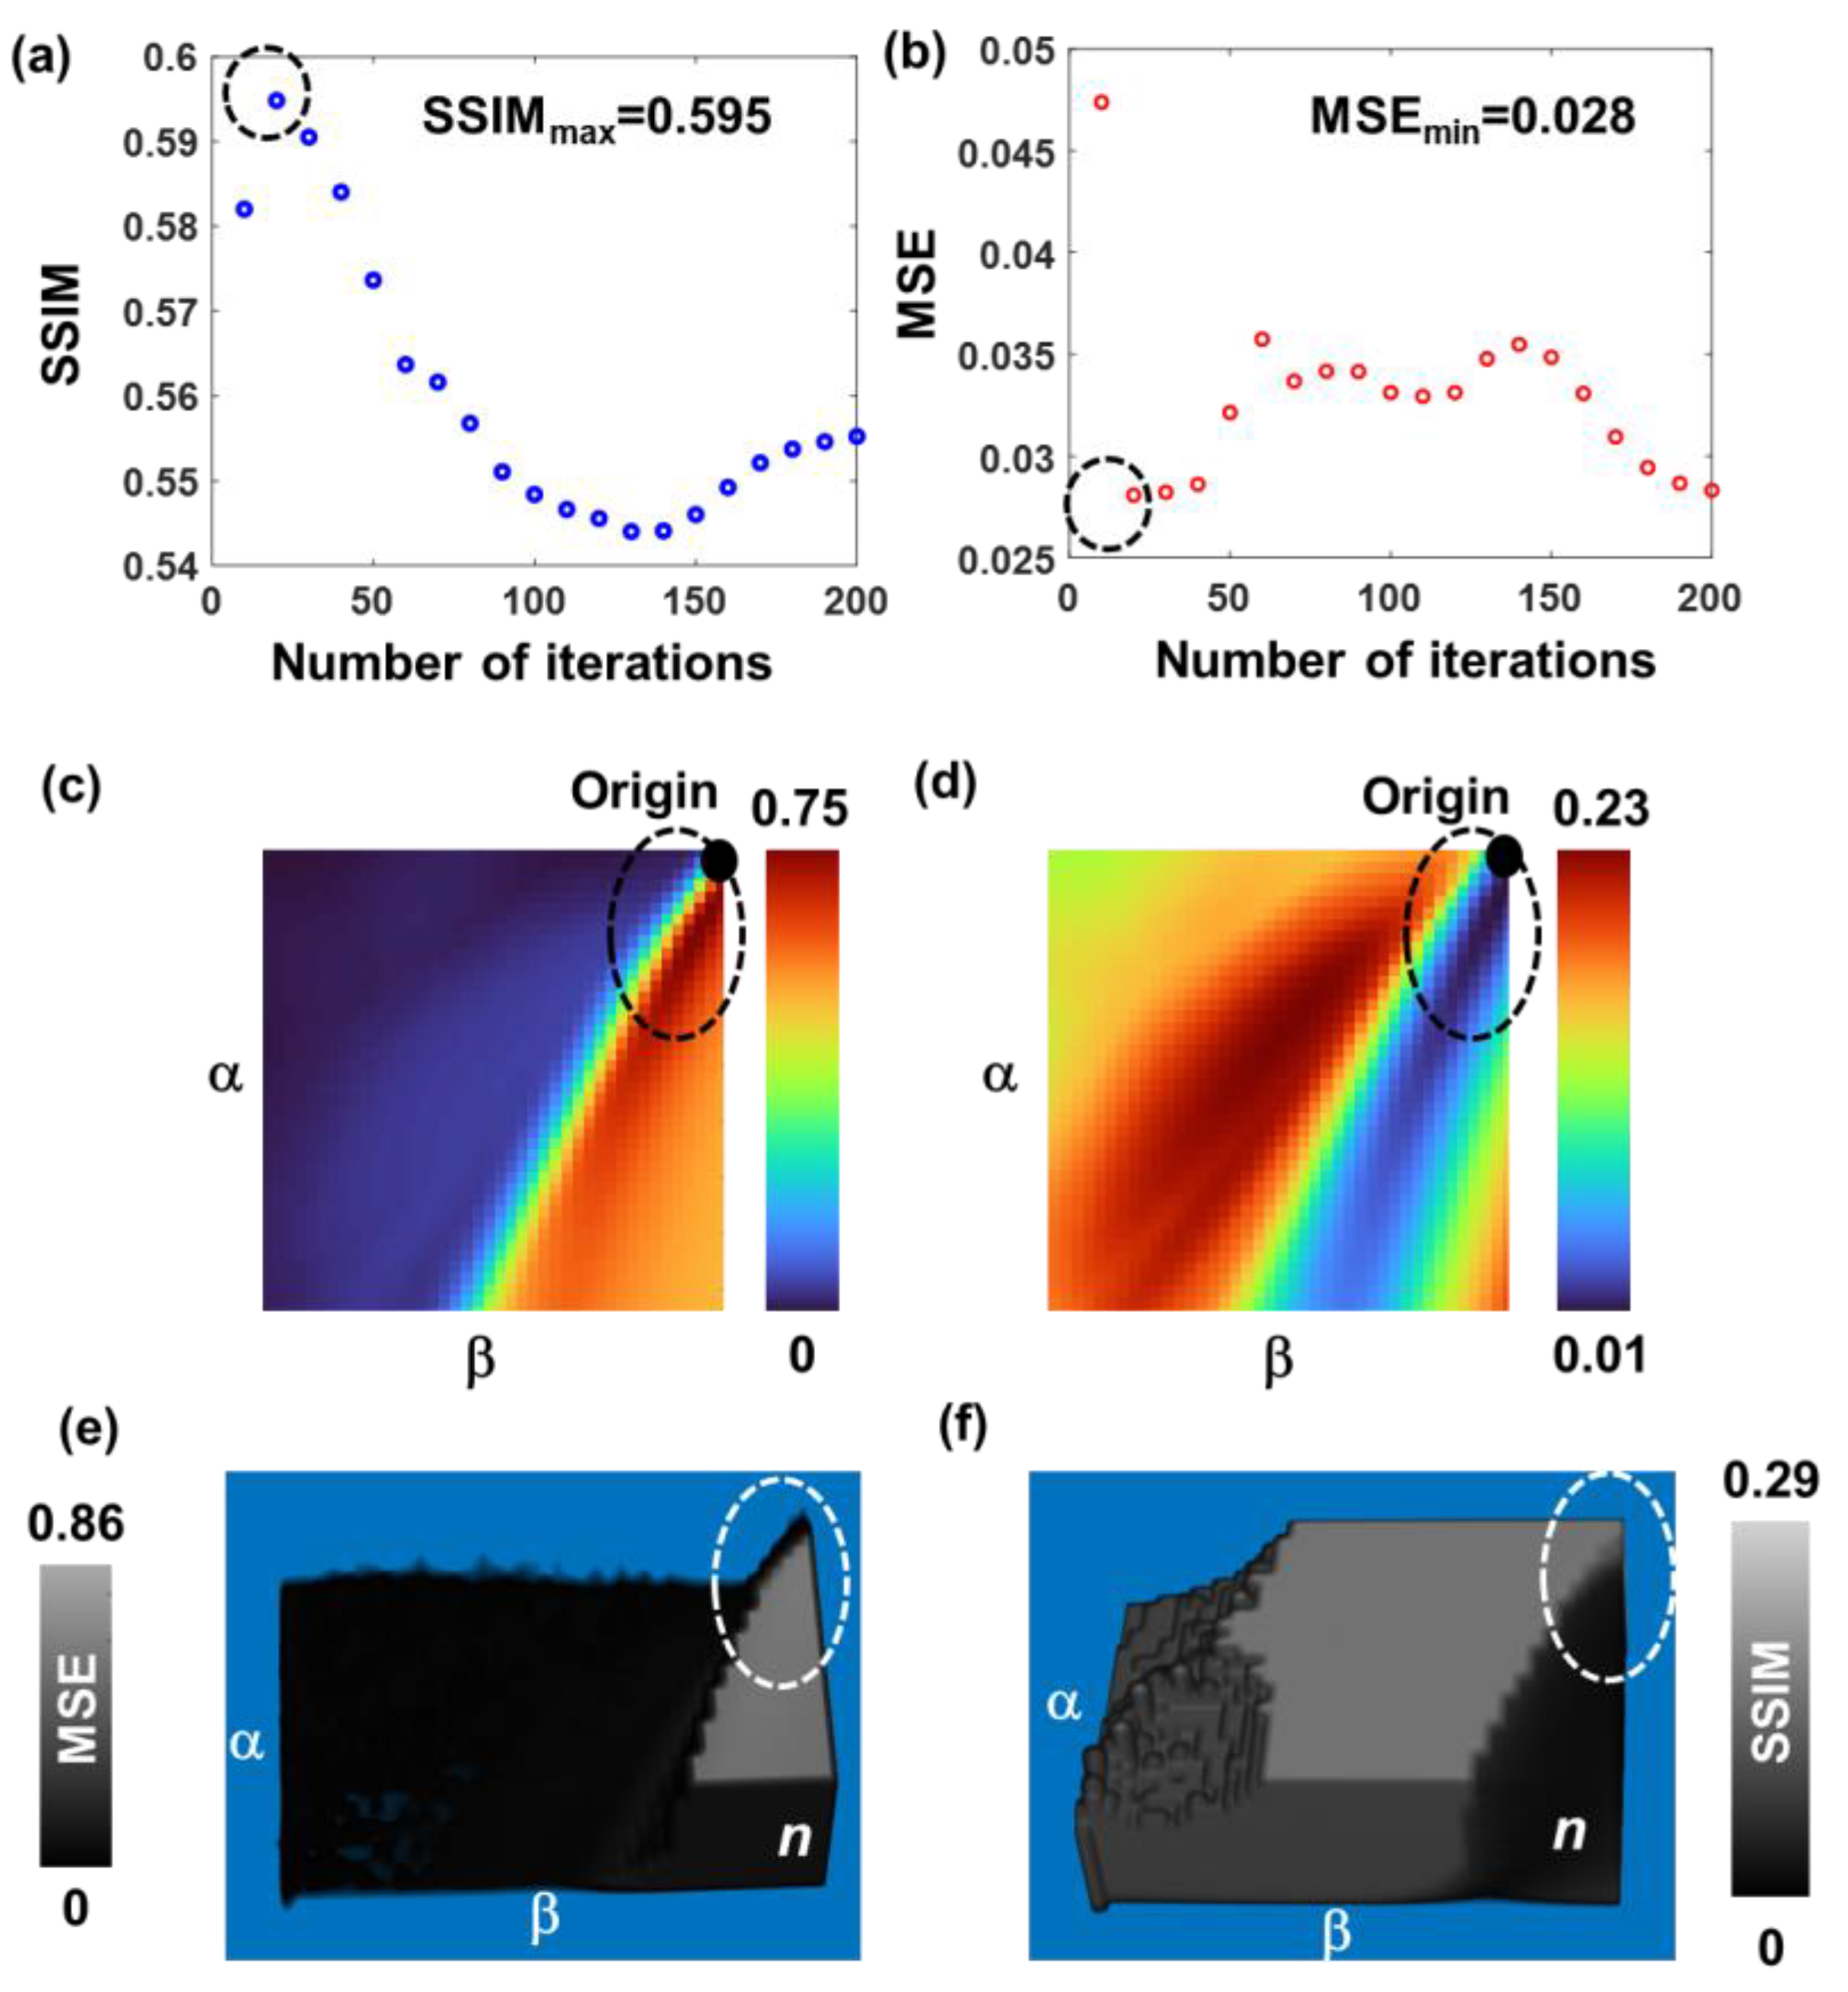
From the results shown in Figs. 3-Fig. 5, it is seen that the performance of LR2A is better than LRA and NLR. The number of possible solutions for LR2A is higher than that of NLR and LRA. The control parameter in the original LRA is limited to one, which is the number of iterations p. The number of control parameters of NLR is two - α and β resulting in a total of m2 solutions, where m is the number of states from (αmin, βmin) to (αmax, βmax). The number of control parameters in LR2A is m2n. Quantitative studies were carried out next for two cases that are aligned towards the solutions of NLR and LRA using structural similarity (SSIM) and mean square error (MSE).
The data from the first column of
Figure 5 was used for quantitative comparative studies. As seen from the results, the maximum SSIM obtained using LRA, NLR and LR
2A are 0.595, 0.75, and 0.86, respectively. The minimum value of the MSE for LRA, NLR, and LR
2A are 0.028, 0.01, and 0.001, respectively. The above values confirm LR
2A performed better than both LRA and NLR and NLR better than LRA. The regions of overlap between SSIM and MSE reassure the validity of this analysis.
4. Optical experiments
A preliminary invasive study was carried out on simple objects consisting of a few points using a quasi-monochromatic light source and a single refractive lens [
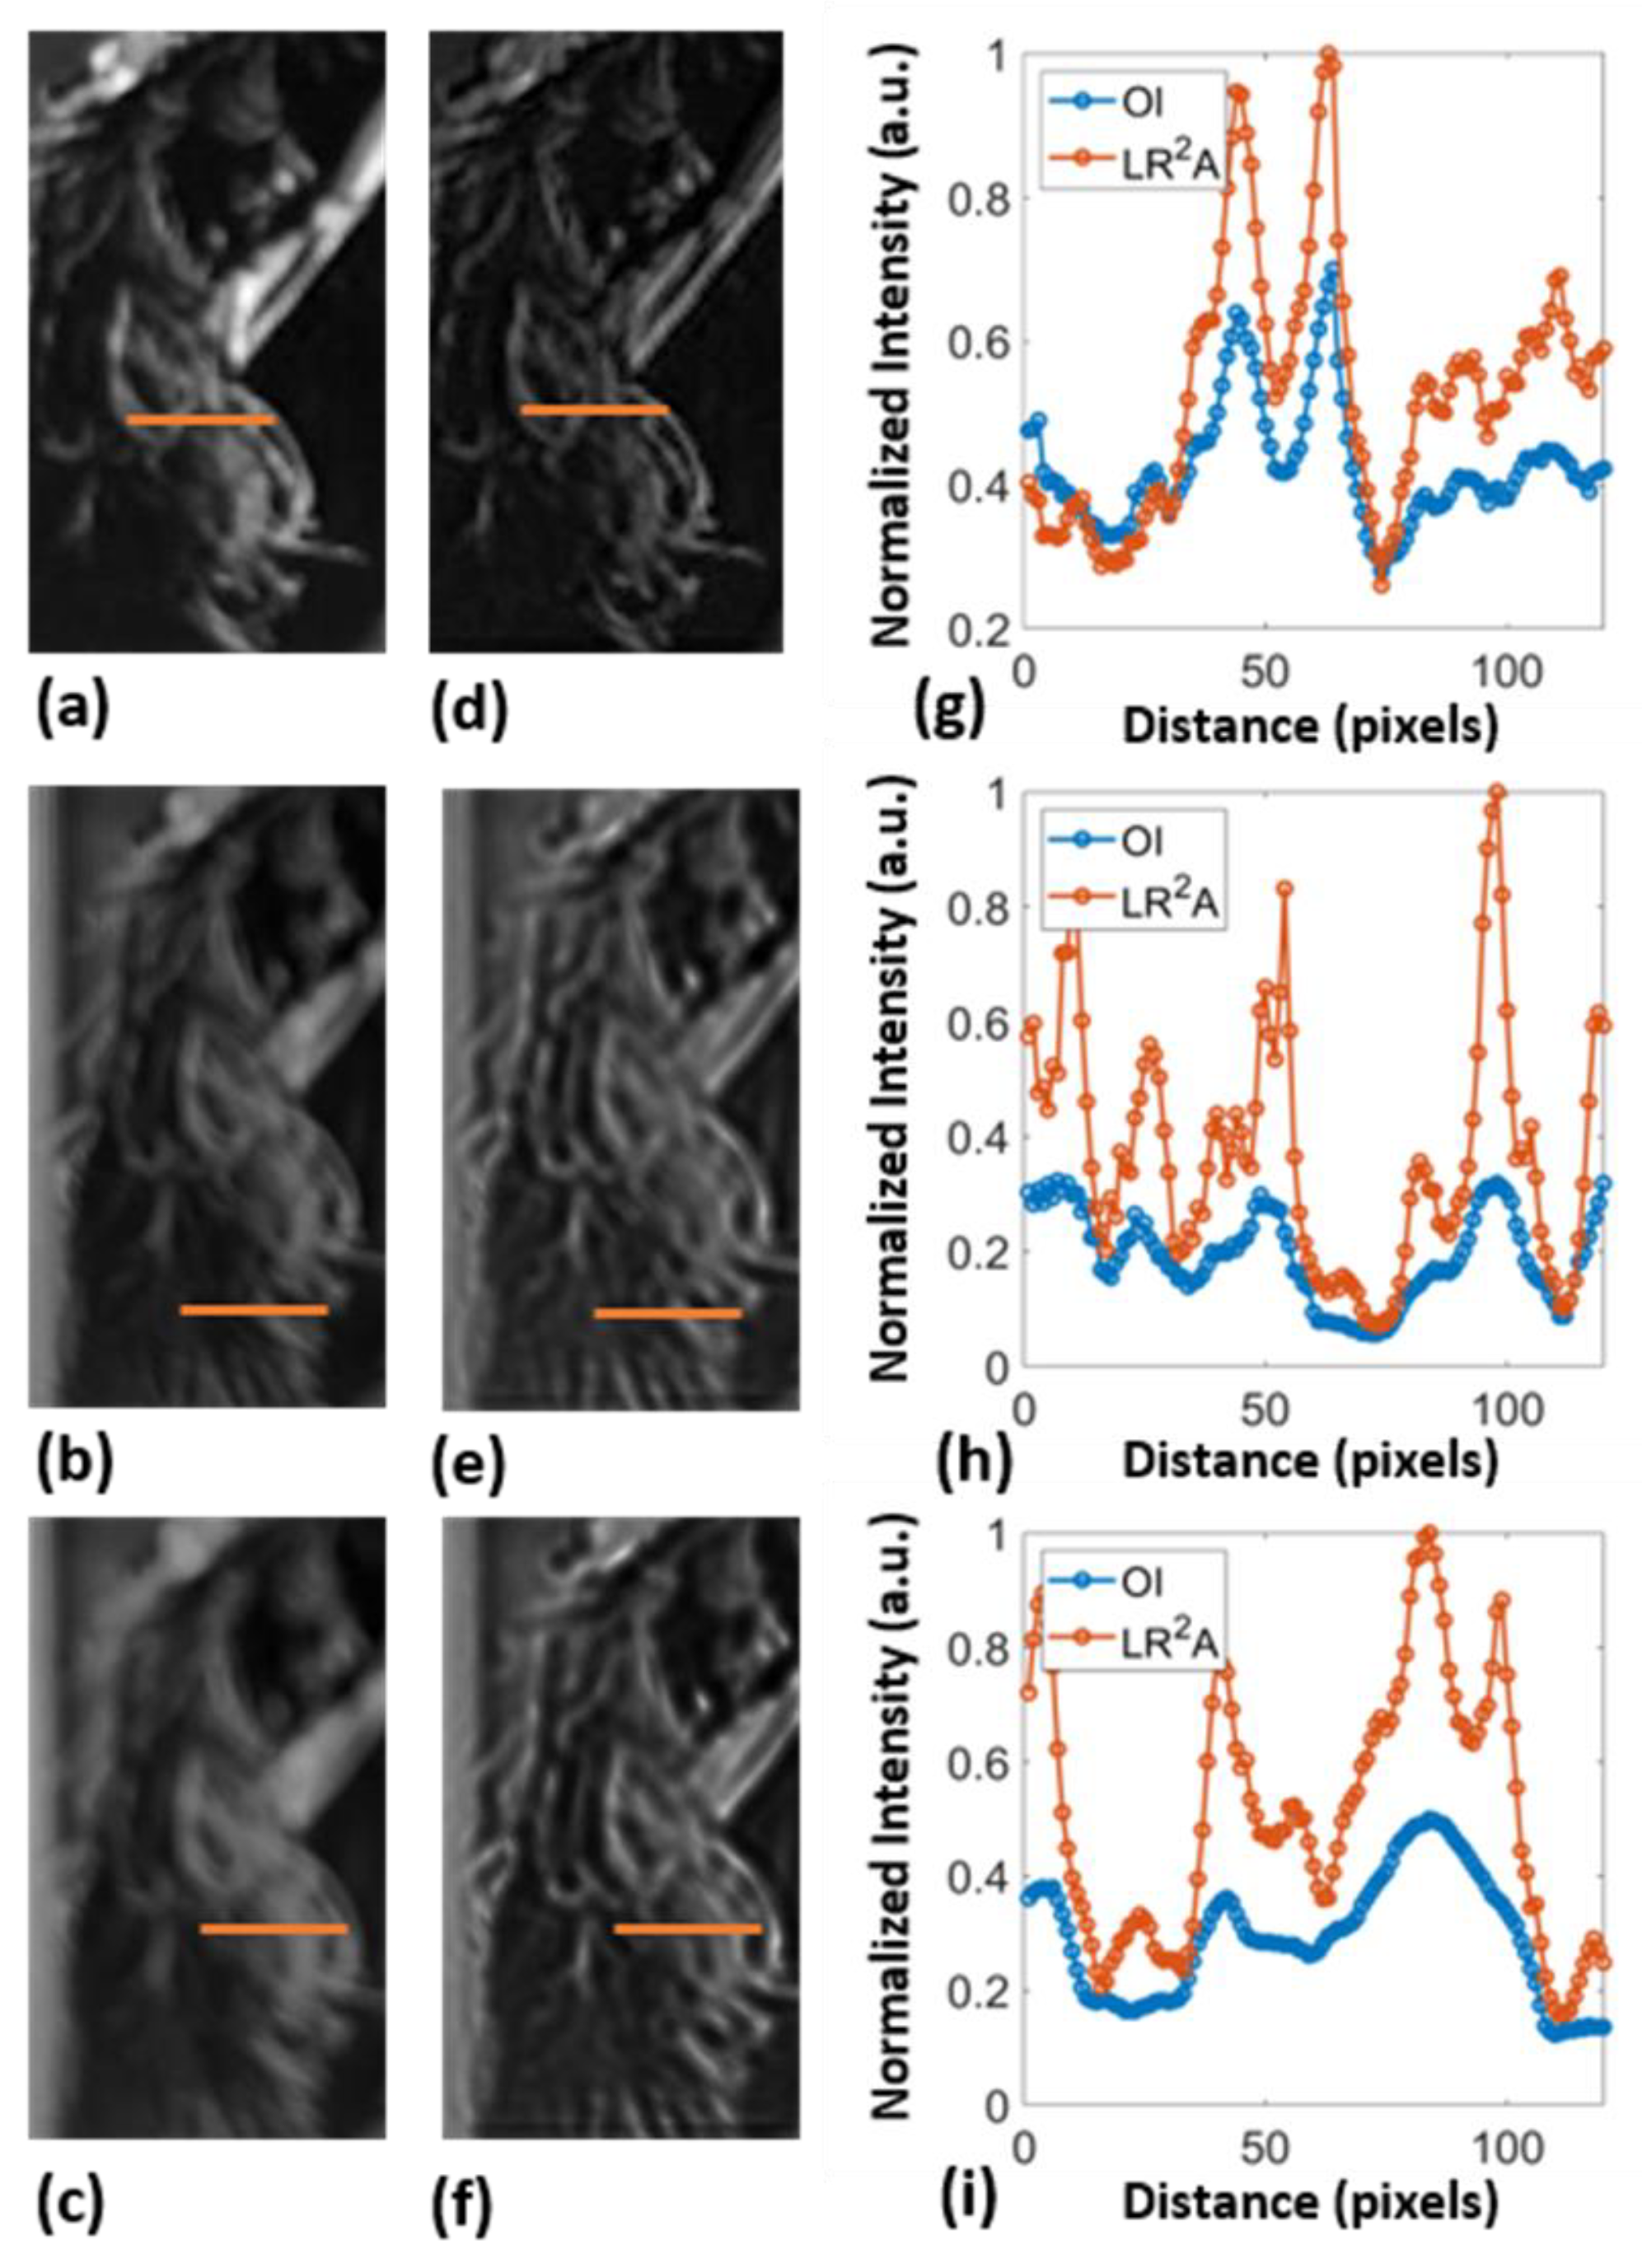
18]. However, the performance was not high due to the weak intensity distributions from a pinhole, scattering, and experimental errors. In this study, the method is evaluated again in both invasive as well as non-invasive mode. In invasive mode, the PSF was obtained from the recorded image of the object from isolated points and by creating a guide star in the form of a point object added to the object. In non-invasive mode, the PSF was synthesized within the computer for different spatio-spectral aberrations using Fresnel propagation as described in section – 3. To examine the method for practical applications, we have projected a test image – Lena, on a computer monitor and captured it using two smartphone cameras (Samsung Galaxy A71 with 64-megapixel (f/1.8) primary camera and Oneplus Nord 2CE with 64-megapixel (f/1.7) primary camera). The object projection was adjusted to a point where the device’s autofocus software can no longer adjust the focus. To record PSF, a small white dot was added to the image and then extracted manually. The images were recorded ~ 4 cm from the screen with different point sizes, 0.3, 0.4, and 0.5 cm, respectively. They were then fed back to our algorithm and reconstructed using LR
2A (
α = 0.1,
β = 0.98, and 2 iterations). The recorded raw images and the reconstructed ones of the hair region of the test sample are shown in
Figure 7. Line data were extracted from the images as indicated by the lines and plotted for comparison. In all the cases, LR
2A improved the image resolution. What appears in the recorded image as a single entity can be clearly discriminated as multiple entities using LR
2A, indicating a significant performance as seen in the plots where a single peak is replaced by multiple peaks.
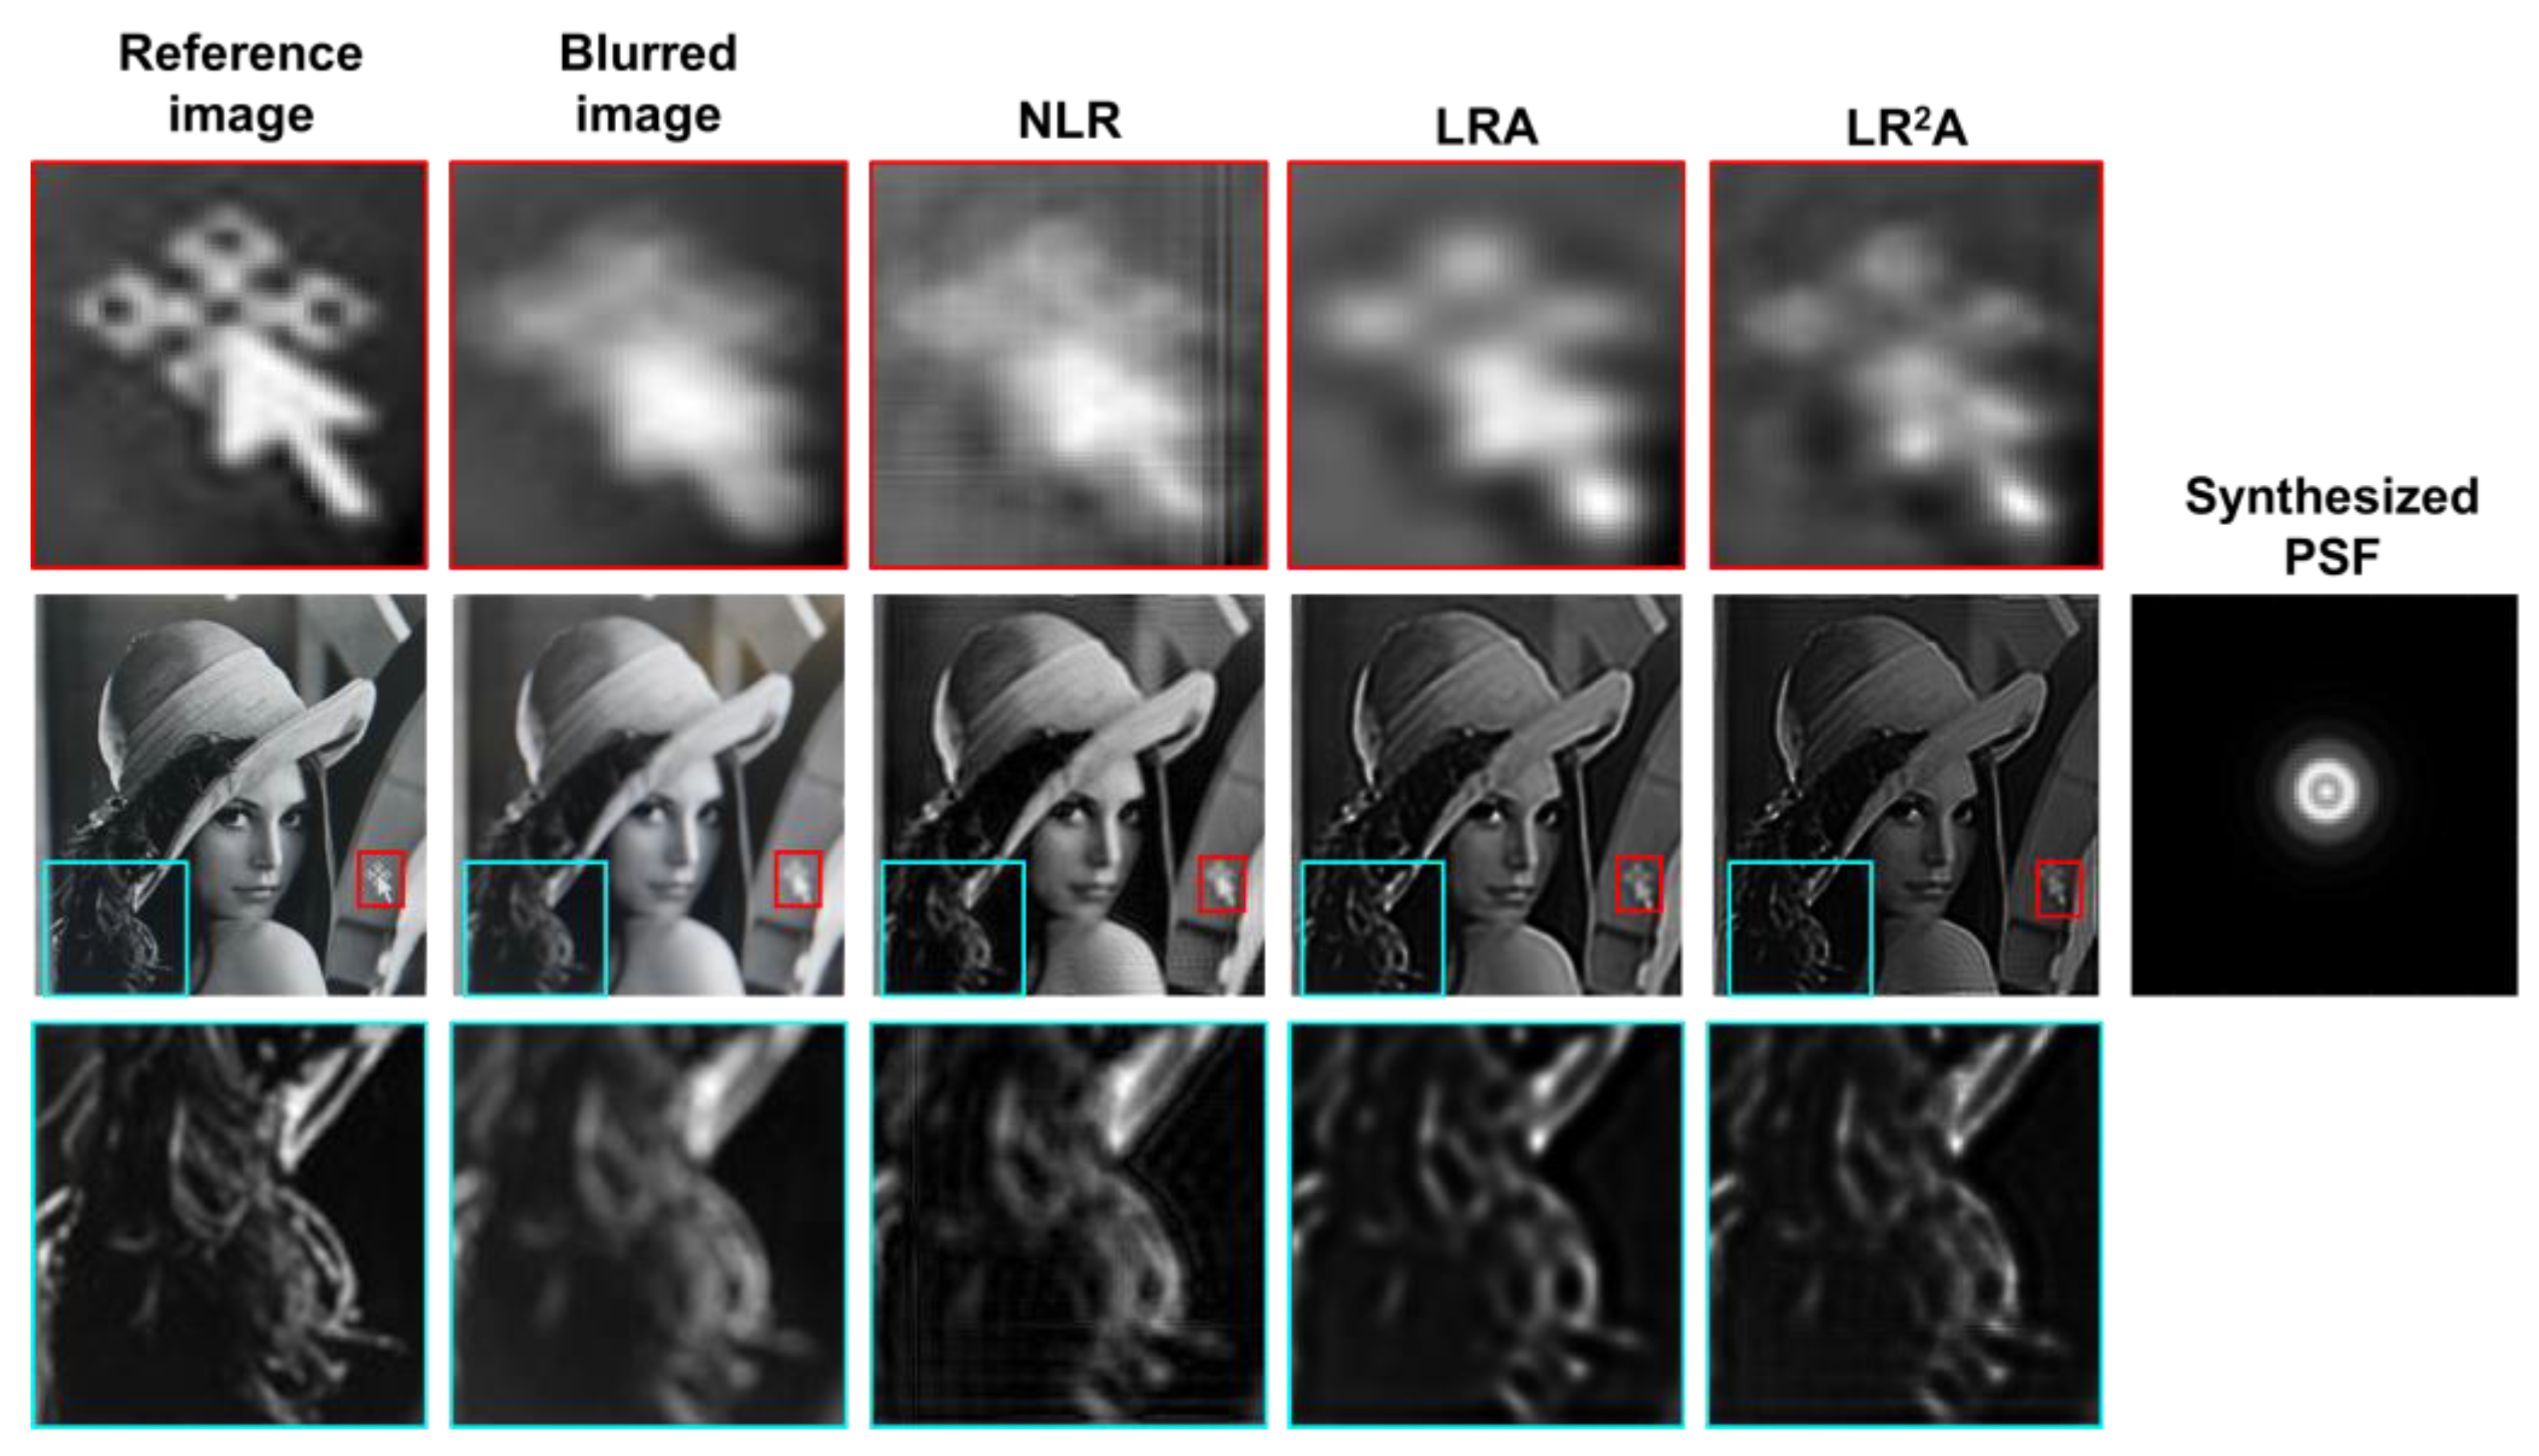
For non-invasive mode, Lena image was displayed on the monitor and recorded using Samsung Galaxy A7. The image of the fully resolved image, blurred image due to recording close to the screen are shown in Figs. 8(a) and 8(b) respectively. One of the reconstruction results using NLR (α = 0, β = 0.9), LRA (10 iterations) and LR2A (α = 0, β = 1 and 3 iterations) are shown in Figs. 8(c), 8(d) and 8(e) respectively. Two areas with interesting features are magnified for all the three cases. The results indicate a better quality of reconstruction with LR2A. The image could not be completely deblurred but can be improved without invasively recording PSF. The deblurred images are sharper and have more information than the blurred image. The proposed method can be converted into an application for deblurring images recorded using smart phone cameras.
Figure 8.
Deblurring of blurred images using NLR, LRA and LR2A using synthetic PSF.
Figure 8.
Deblurring of blurred images using NLR, LRA and LR2A using synthetic PSF.
5. Deep Learning Experiments
Deep learning experiments rely on the quality of the training data sets which in many cases may be blurred due to different types of aberrations. In many deep learning-based approaches, adding a diverse data sets consisting of focused and blurred images may affect the convergence of the network. In such cases, it might be useful to attach a signal processing based deblurring method to reduce the time of training, data sets and improve classification. In this study, deep learning experiments were carried for classification of images with diverse spatio-spectral aberrations with LRA, NLR and LR2A. A "bell paper" image was blurred for different spatio-spectral aberrations and deblurred using the above algorithms. The images obtained from LR2A was much clearer, with sharper edges and fine details in comparison to the other two algorithms. The NLR method resulted in an image reconstruction that were slightly oversmoothed, with some loss of fine details. The LRA method produced a better result than NLR, but it was relatively slower than the other two methods, and the improvement was not as significant as with LR2A. Overall, the LR2A algorithm was the most effective of all three in removing the blur and preserving the fine details in the image.
Also, several pretrained deep learning models were tested to prove the efficiency of LR
2A[
19]. Pretrained models are highly complex neural networks that have been trained on enormous datasets of images, allowing them to recognize a wide range of objects and features in images. MATLAB offers a variety of these models that can be used for image classification, each with its own unique characteristics and strengths. One such model is Darknet53, a neural network architecture used for object detection. Comprised of 53 layers, this network is known for its high accuracy in detecting objects. It first came to prominence in the revolutionary YOLOv3 object detection algorithm. Another powerful model is EfficientNetB0, a family of neural networks specifically designed for performance and efficiency. These models use a unique scaling approach that balances model depth, width, and resolution, producing significant results in image classification tasks.
InceptionResNetV2 is another noteworthy model, combining the Inception and ResNet modules to create a deep neural network that is both accurate and efficient. It first gained widespread recognition in the ImageNet Large Scale Visual Recognition Challenge of 2016, where it achieved state-of-the-art performance in the classification task. NASNetLarge and NASNetMobile are additional models that were discovered using neural architecture search (NAS). These models are highly adaptable, with the flexibility to be customized for a wide range of image classification tasks. Finally, ResNet101 and ResNet50 are neural network architectures that belong to the ResNet family of models. With 50 and 101 layers, respectively, these models have been widely used in image classification tasks and are renowned for achieving state-of-the-art performance on many benchmark datasets. Overall, the diverse range of pretrained models available in MATLAB provides a wealth of possibilities for performing complex image classification tasks. Detailed analysis of different networks and computational algorithms such as NLR, LRA and LR2A are given in the supplementary materials.
GoogleLeNet is a convolutional neural network developed by researchers at Google, which is one of the widely used methods for image classification [
20]. Feeding a focused image is as important as feeding a correct image into the deep learning network for optimal performance. This is because a blur can cause significant distortion to an image that may be mistaken for another image. A trained google net in MATLAB accepts only color images (RGB) with a size of 224×224 for classification. In this experiment, a color test image, ‘bell pepper,’’’ was used. However, the LR
2A method was shown only for a single wavelength. In this case, red, green, and blue channels were extracted from the color image, different degrees of spatial and spectral blurs were applied to the image, and the resulting images were fused back into a color image. Blurred and reconstructed images obtained from LR
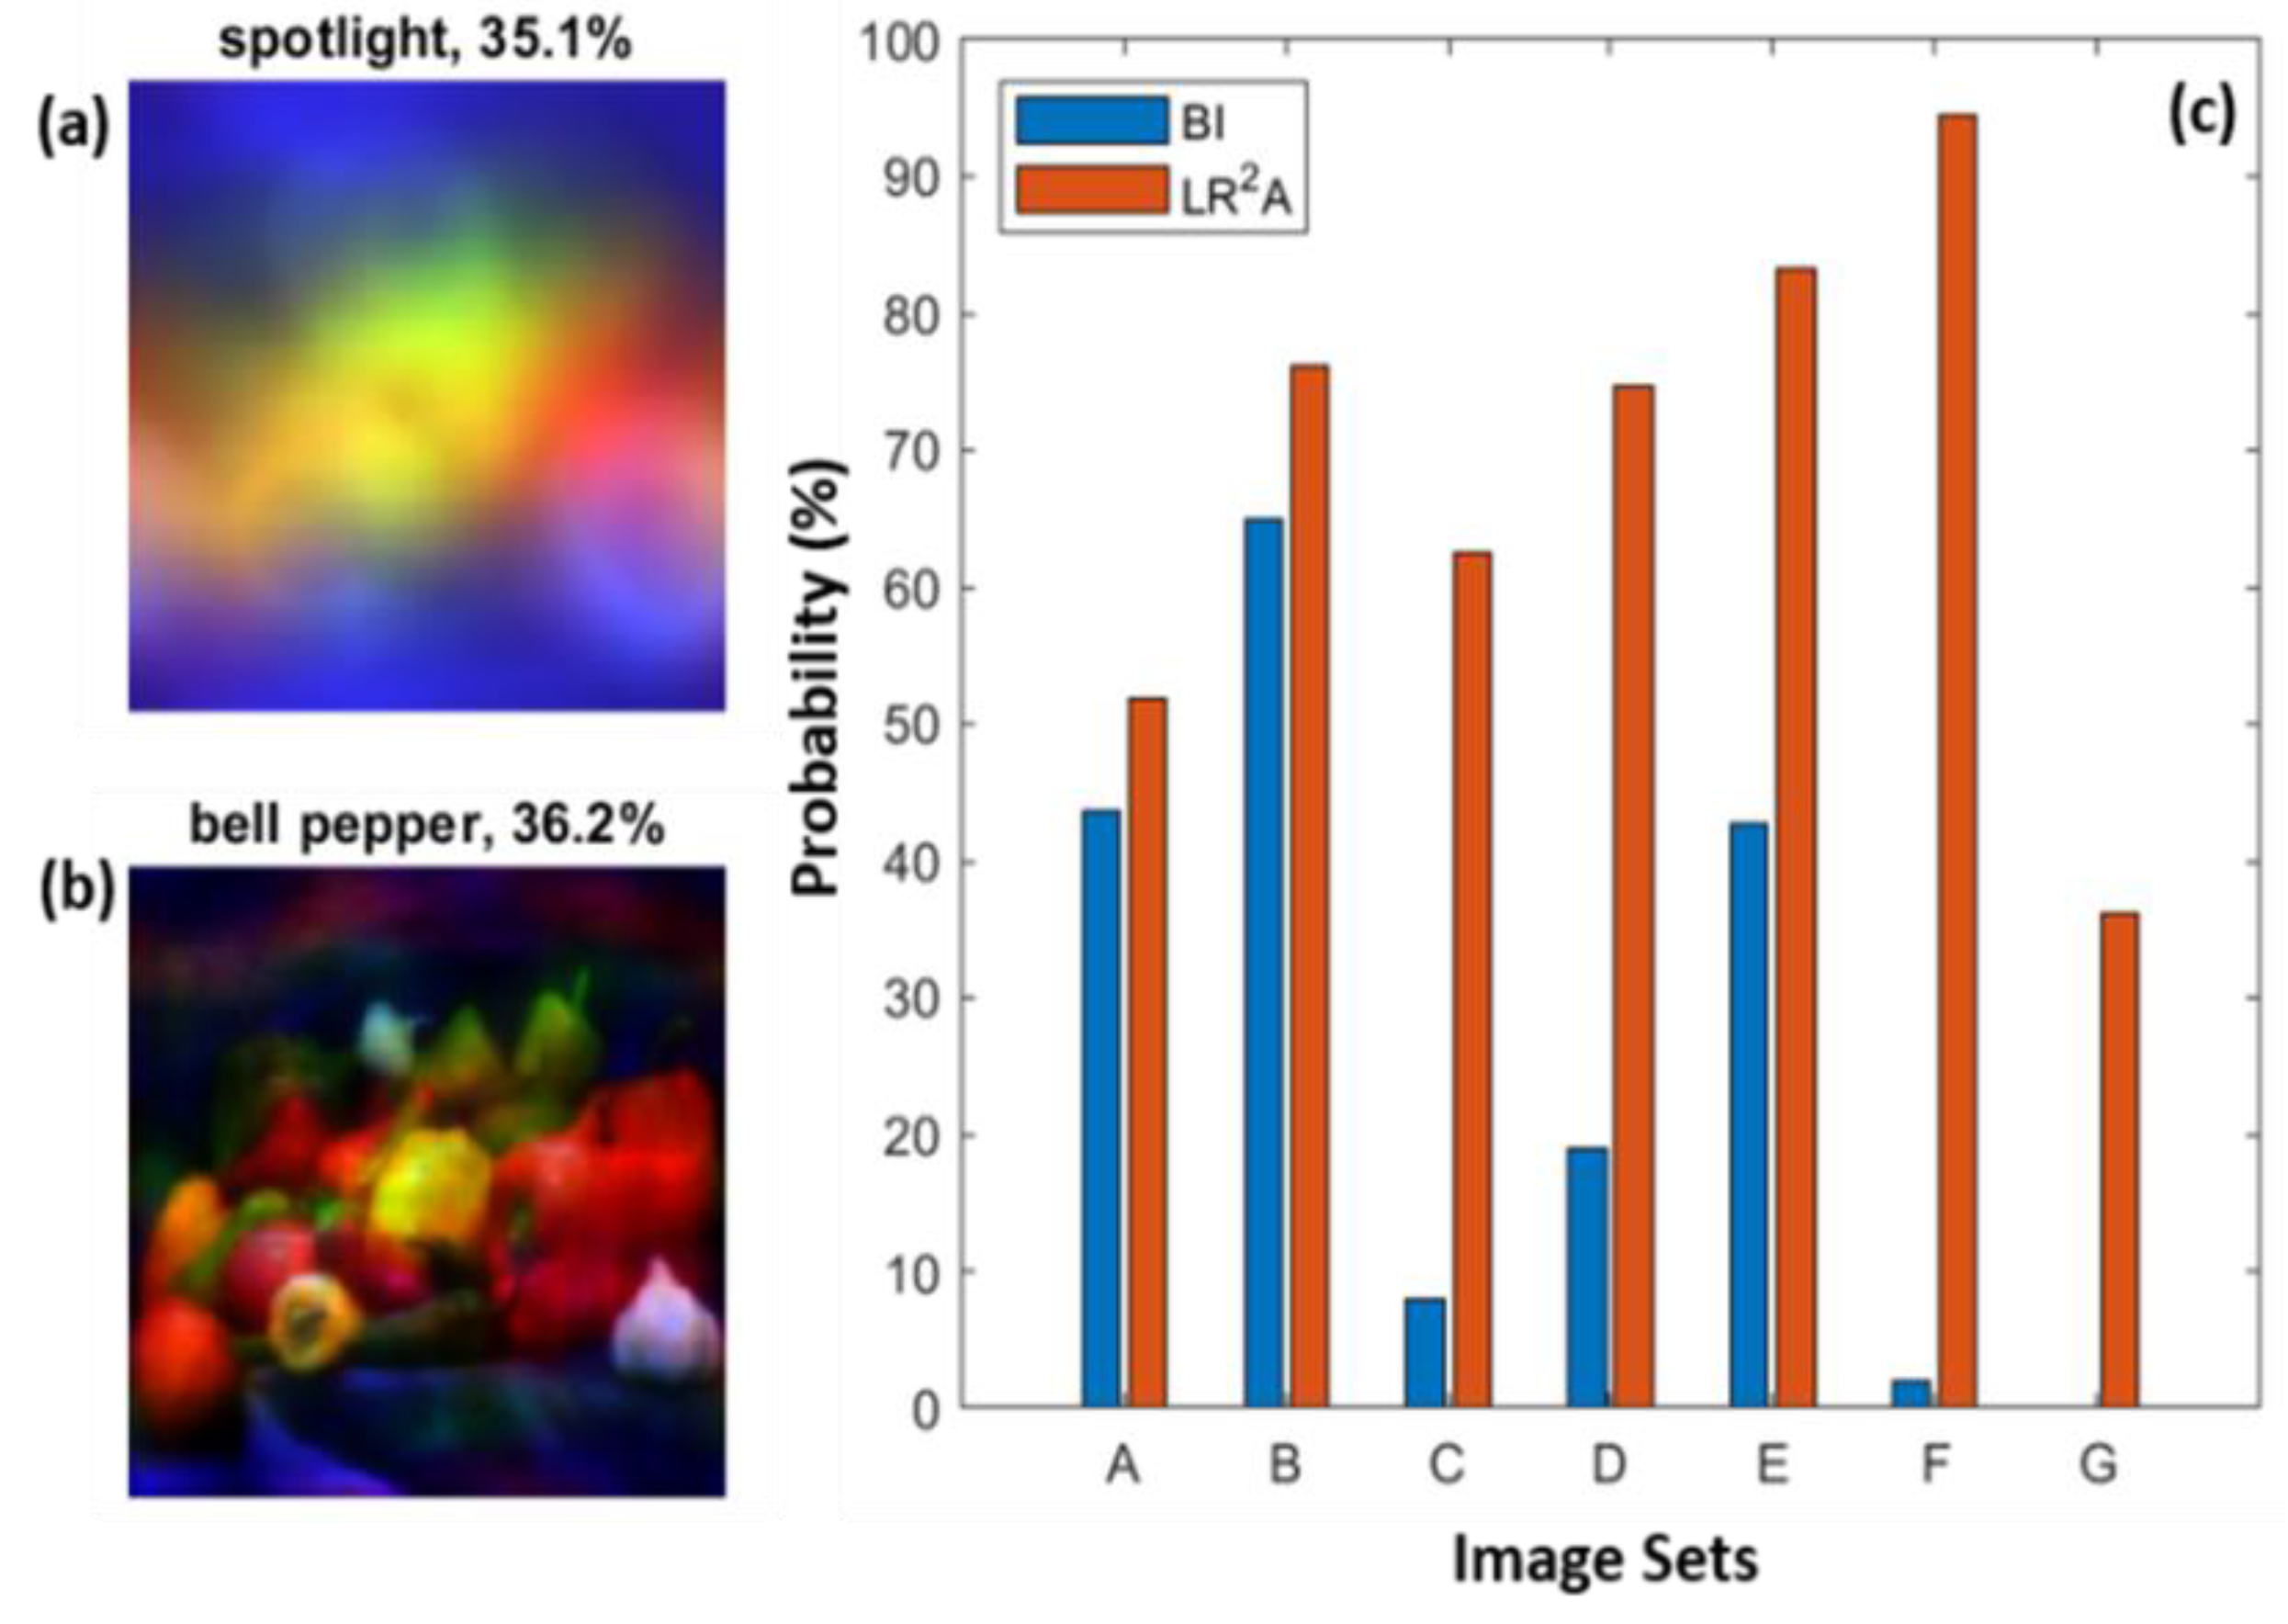
2A of a standard image ‘pepper’ is loaded, and its classification has been done. The results obtained for a typical case of blur and the reconstructed images are shown in Figures 9(a) and 9(b), respectively. It can be seen from
Figure 9(a) that the algorithm cannot identify the pepper and classified it as a spotlight. In fact, the label ‘bell pepper’ does not appear in the top 25 classification labels (25
th with the probability of 0.3%), whereas for the LR
2A reconstructed, the classification results have been improved by multifold, and the classification probability was about 36%. Some other blurring cases are also considered (
Figure 8(c) A(
R=100 pixels), B(
R=200 pixels), C(Δ
z=0.37 mm), D(Δ
z=0.38 mm) and E(Δ
z=0.42 mm), F(Δλ=32.8 nm), G(Δλ=132.8 nm). In all the cases, image classification probability was significantly improved.
6. Summary and conclusion
LR
2A is a recently developed computational reconstruction method that integrates two well-known algorithms, namely LRA and NLR [
16]. In this study, LR
2A was implemented for the deblurring of images captured by a monochrome camera in the presence of spatial and spectral aberrations and with a limited numerical aperture. Simulation studies were carried out for different values of numerical apertures and axial and chromatic aberrations, and in every case, LR
2A was found to perform better than both LRA and NLR. In the cases where the energy is concentrated in a smaller area, LRA performed better than NLR and vice versa. But in all cases, LR
2A aligned towards one of NLR or LRA and was better than both. The convergence rate of LR
2A was also at least an order better than LRA, and in some cases, the ratio of the number of iterations between LRA and LR
2A was >50 times which is significant. We believe that these preliminary results are promising, and LR
2A can be an attractive tool for pattern recognition applications and image deblurring in incoherent linear shift-invariant imaging systems. Optical experiments were carried out using the camera from smartphones, and the recorded images were significantly enhanced with LR
2A. Similar improvement was also observed in the case of deep learning-based image classification. The current research outcome also indicates the need for an integrated approach involving signal processing, optical methods, and deep learning to achieve optimal performance [
21].
Supplementary Materials
Not Applicable.
Author Contributions
Conceptualization, V. A., R. S., S. J., I. S., A. J.; methodology, V. A., R. S., I. S., A. J., P. P. A; deep learning experiments, A. J., and P. P. A.; software, A. J., I. S., V. A., P. P. A., A. S. J. F. R., and S. G.; validation, F. G. A., A. B., D. S., S. H. N., M. H., T. K., and A. P. I. X.; resources, V. A., S. J.; smart phone experiments, V. A., P. P. A., S. G., A. S. J. F. R., and A. J.; writing—original draft preparation, V. A., P. P. A., and A. J.; writing—review and editing, all the authors.; supervision, V. A., R. S., and S. J.; project administration, V. A., R. S., and S. J.; funding acquisition, V. A., R. S., and S. J.; All authors have read and agreed to the published version of the manuscript.
Funding
This research was funded by European Union’s Horizon 2020 research and innovation programme grant agreement No. 857627 (CIPHR) and ARC Linkage LP190100505 project.
Institutional Review Board Statement
Not Applicable.
Informed Consent Statement
Not Applicable.
Data Availability Statement
The data can be obtained from the authors upon reasonable request.
Acknowledgments
The authors thank Tiia Lillemaa for the administrative support.
Conflicts of Interest
The authors declare no conflict of interest.
References
- Peng, X.; Gao, L.; Wang, Y.; Kneip, L. Globally-Optimal Contrast Maximisation for Event Cameras. IEEE Trans. Pattern Anal. Mach. Intell. 2021, 44, 3479–3495. [CrossRef]
- Li, P.; Liang, J.; Zhang, M. A degradation model for simultaneous brightness and sharpness enhancement of low-light image. Signal Processing 2021, 189, 108298. [CrossRef]
- Kim, J.; Seong, J.; Yang, Y.; Moon, S.-W.; Badloe, T.; Rho, J. Tunable metasurfaces towards versatile metalenses and metaholograms: A review. Adv. Photonics 2022, 4, 024001. [CrossRef]
- Pan, M.Y.; Fu, Y.F.; Zheng, M.J.; Chen, H.; Zang, Y.J.; Duan, H.G.; Li, Q.; Qiu, M.; Hu, Y.Q. Dielectric metalens for miniaturized imaging systems: Progress and challenges. Light Sci. Appl. 2022, 11, 195. [CrossRef]
- Bai, X.; Wang, X.; Liu, X.; Liu, Q.; Song, J.; Sebe, N.; Kim, B. Explainable deep learning for efficient and robust pattern recognition: A survey of recent developments. Pattern Recognit. 2021, 120, 108102. [CrossRef]
- Rosen, J.; Vijayakumar, A.; Kumar, M.; Rai, M.R.; Kelner, R.; Kashter, Y.; Bulbul, A.; Mukherjee, S. Recent advances in self-interference incoherent digital holography. Adv. Opt. Photon. 2019, 11, 1–66. [CrossRef]
- Padhy, R.P.; Chang, X.; Choudhury, S.K.; Sa, P.K.; Bakshi, S. Multi-stage cascaded deconvolution for depth map and surface normal prediction from single image. Pattern Recognit. Lett. 2019, 127, 165-173. [CrossRef]
- Riad, S.M. The deconvolution problem: An overview. Proc. IEEE, 1986, 74, 82-85. [CrossRef]
- Starck, J.L.; Pantin, E.; Murtagh, F. Deconvolution in astronomy: A review. PASP 2002, 114, 1051. [CrossRef]
- Horner, J.L.; Gianino, P.D. Phase-only matched filtering. Appl. Opt. 1984, 23, 812–816. [CrossRef]
- Vijayakumar, A.; Jayavel, D.; Muthaiah, M.; Bhattacharya, S.; Rosen, J. Implementation of a speckle-correlation-based optical lever with extended dynamic range. Appl. Opt. 2019, 58, 5982–5988. [CrossRef]
- Rai, M.; Vijayakumar, A.; Rosen, J. Non-linear adaptive three-dimensional imaging with interferenceless coded aperture correlation holography (I-COACH). Opt. Express 2018, 26, 18143–18154. [CrossRef]
- Smith, D.; Gopinath, S.; Arockiaraj, F.G.; Reddy, A.N.K.; Balasubramani, V.; Kumar, R.; Dubey, N.; Ng, S.H.; Katkus, T.; Selva, S.J.; Renganathan, D.; Kamalam, M.B.R.; John Francis Rajeswary, A.S.; Navaneethakrishnan, S.; Inbanathan, S.R.; Valdma, S.-M.; Praveen, P.A.; Amudhavel, J.; Kumar, M.; Ganeev, R.A.; Magistretti, P.J.; Depeursinge, C.; Juodkazis, S.; Rosen, J.; Anand, V. Nonlinear Reconstruction of Images from Patterns Generated by Deterministic or Random Optical Masks—Concepts and Review of Research. J. Imaging 2022, 8, 174. [CrossRef]
- Lucy, L.B. An iterative technique for the rectification of observed distributions. Astron. J. 1974, 79, 745. [CrossRef]
- Richardson, W.H. Bayesian-Based Iterative Method of Image Restoration. J. Opt. Soc. Am. 1972, 62, 55–59. [CrossRef]
- Anand, V.; Han, M.; Maksimovic, J.; Ng, S.H.; Katkus, T.; Klein, A.; Bambery, K.; Tobin, M.J.; Vongsvivut, J.; Juodkazis, S.; et al. Single-shot mid-infrared incoherent holography using Lucy-Richardson-Rosen algorithm. Opto-Electron. Sci. 2022, 1, 210006.
- Zhang, L.; Liu, S.; Li, L.; Cui, T.J. Spin-Controlled Multiple Pencil Beams and Vortex Beams with Different Polarizations Generated by Pancharatnam-Berry Coding Metasurfaces. ACS Appl. Mater. Interfaces 2017, 9, 36447–36455. [CrossRef]
- Praveen, P.A.; Arockiaraj, F.G.; Gopinath, S.; Smith, D.; Kahro, T.; Valdma, S.-M.; Bleahu, A.; Ng, S.H.; Reddy, A.N.K.; Katkus, T.; Rajeswary, A.S.J.F.; Ganeev, R.A.; Pikker, S.; Kukli, K.; Tamm, A.; Juodkazis, S.; Anand, V. Deep Deconvolution of Object Information Modulated by a Refractive Lens Using Lucy-Richardson-Rosen Algorithm. Photonics 2022, 9, 625. [CrossRef]
- Arora, Ginni, et al. A comparative study of fourteen deep learning networks for multi skin lesion classification (MSLC) on unbalanced data. Neural. Comput. Appl. 2022, 1,27. [CrossRef]
- Tang, P.; Wang, H.; Kwong, S. G-MS2F: GoogLeNet based multi-stage feature fusion of deep CNN for scene recognition. Neurocomputing 2017, 225, 188–197. [CrossRef]
- Lin, X.; Rivenson, Y.; Yardimci, N.T.; Veli, M.; Luo, Y.; Jarrahi, M.; Ozcan, A. All-optical machine learning using diffractive deep neural networks. Science 2018 361, 1004-1008. [CrossRef]
|
Disclaimer/Publisher’s Note: The statements, opinions and data contained in all publications are solely those of the individual author(s) and contributor(s) and not of MDPI and/or the editor(s). MDPI and/or the editor(s) disclaim responsibility for any injury to people or property resulting from any ideas, methods, instructions or products referred to in the content. |
© 2023 by the authors. Licensee MDPI, Basel, Switzerland. This article is an open access article distributed under the terms and conditions of the Creative Commons Attribution (CC BY) license (http://creativecommons.org/licenses/by/4.0/).
