Submitted:
25 February 2023
Posted:
27 February 2023
You are already at the latest version
Abstract

Keywords:
1. Introduction
2. Materials and Methods
2.1. Starting material
2.2. Recrystallization process
3.1. Characterization of microstructure
3. Results
3.1. Microstructure of the raw material
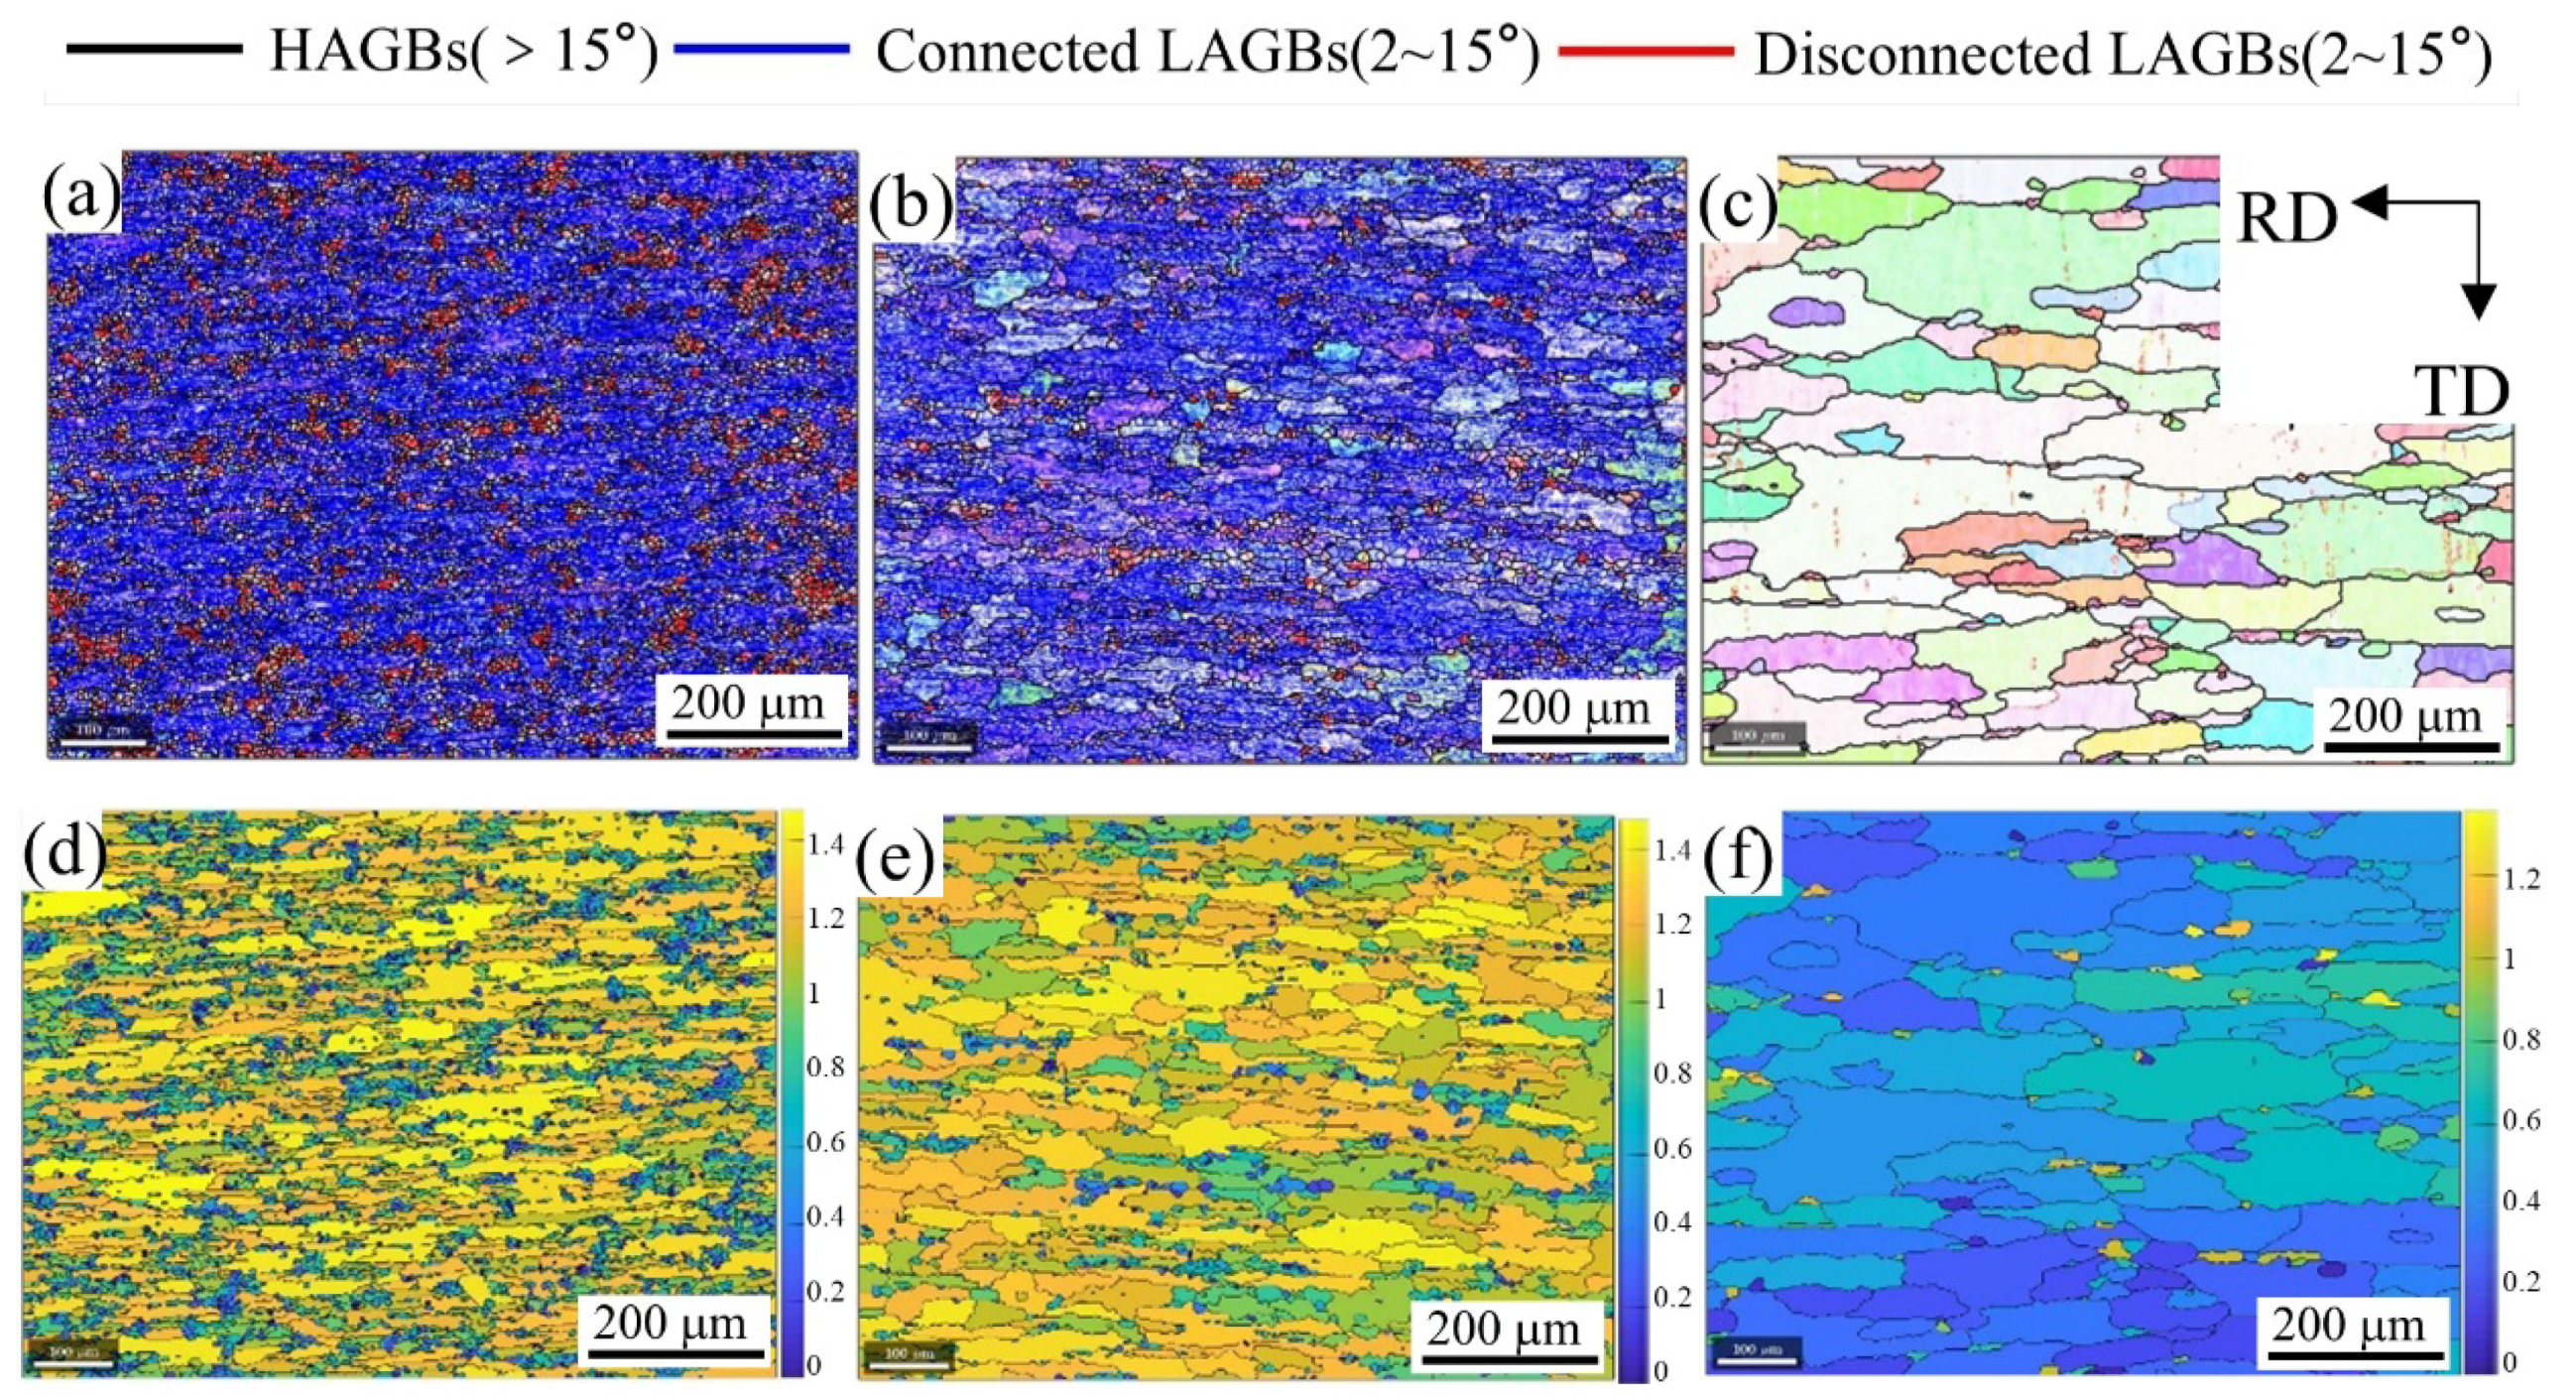
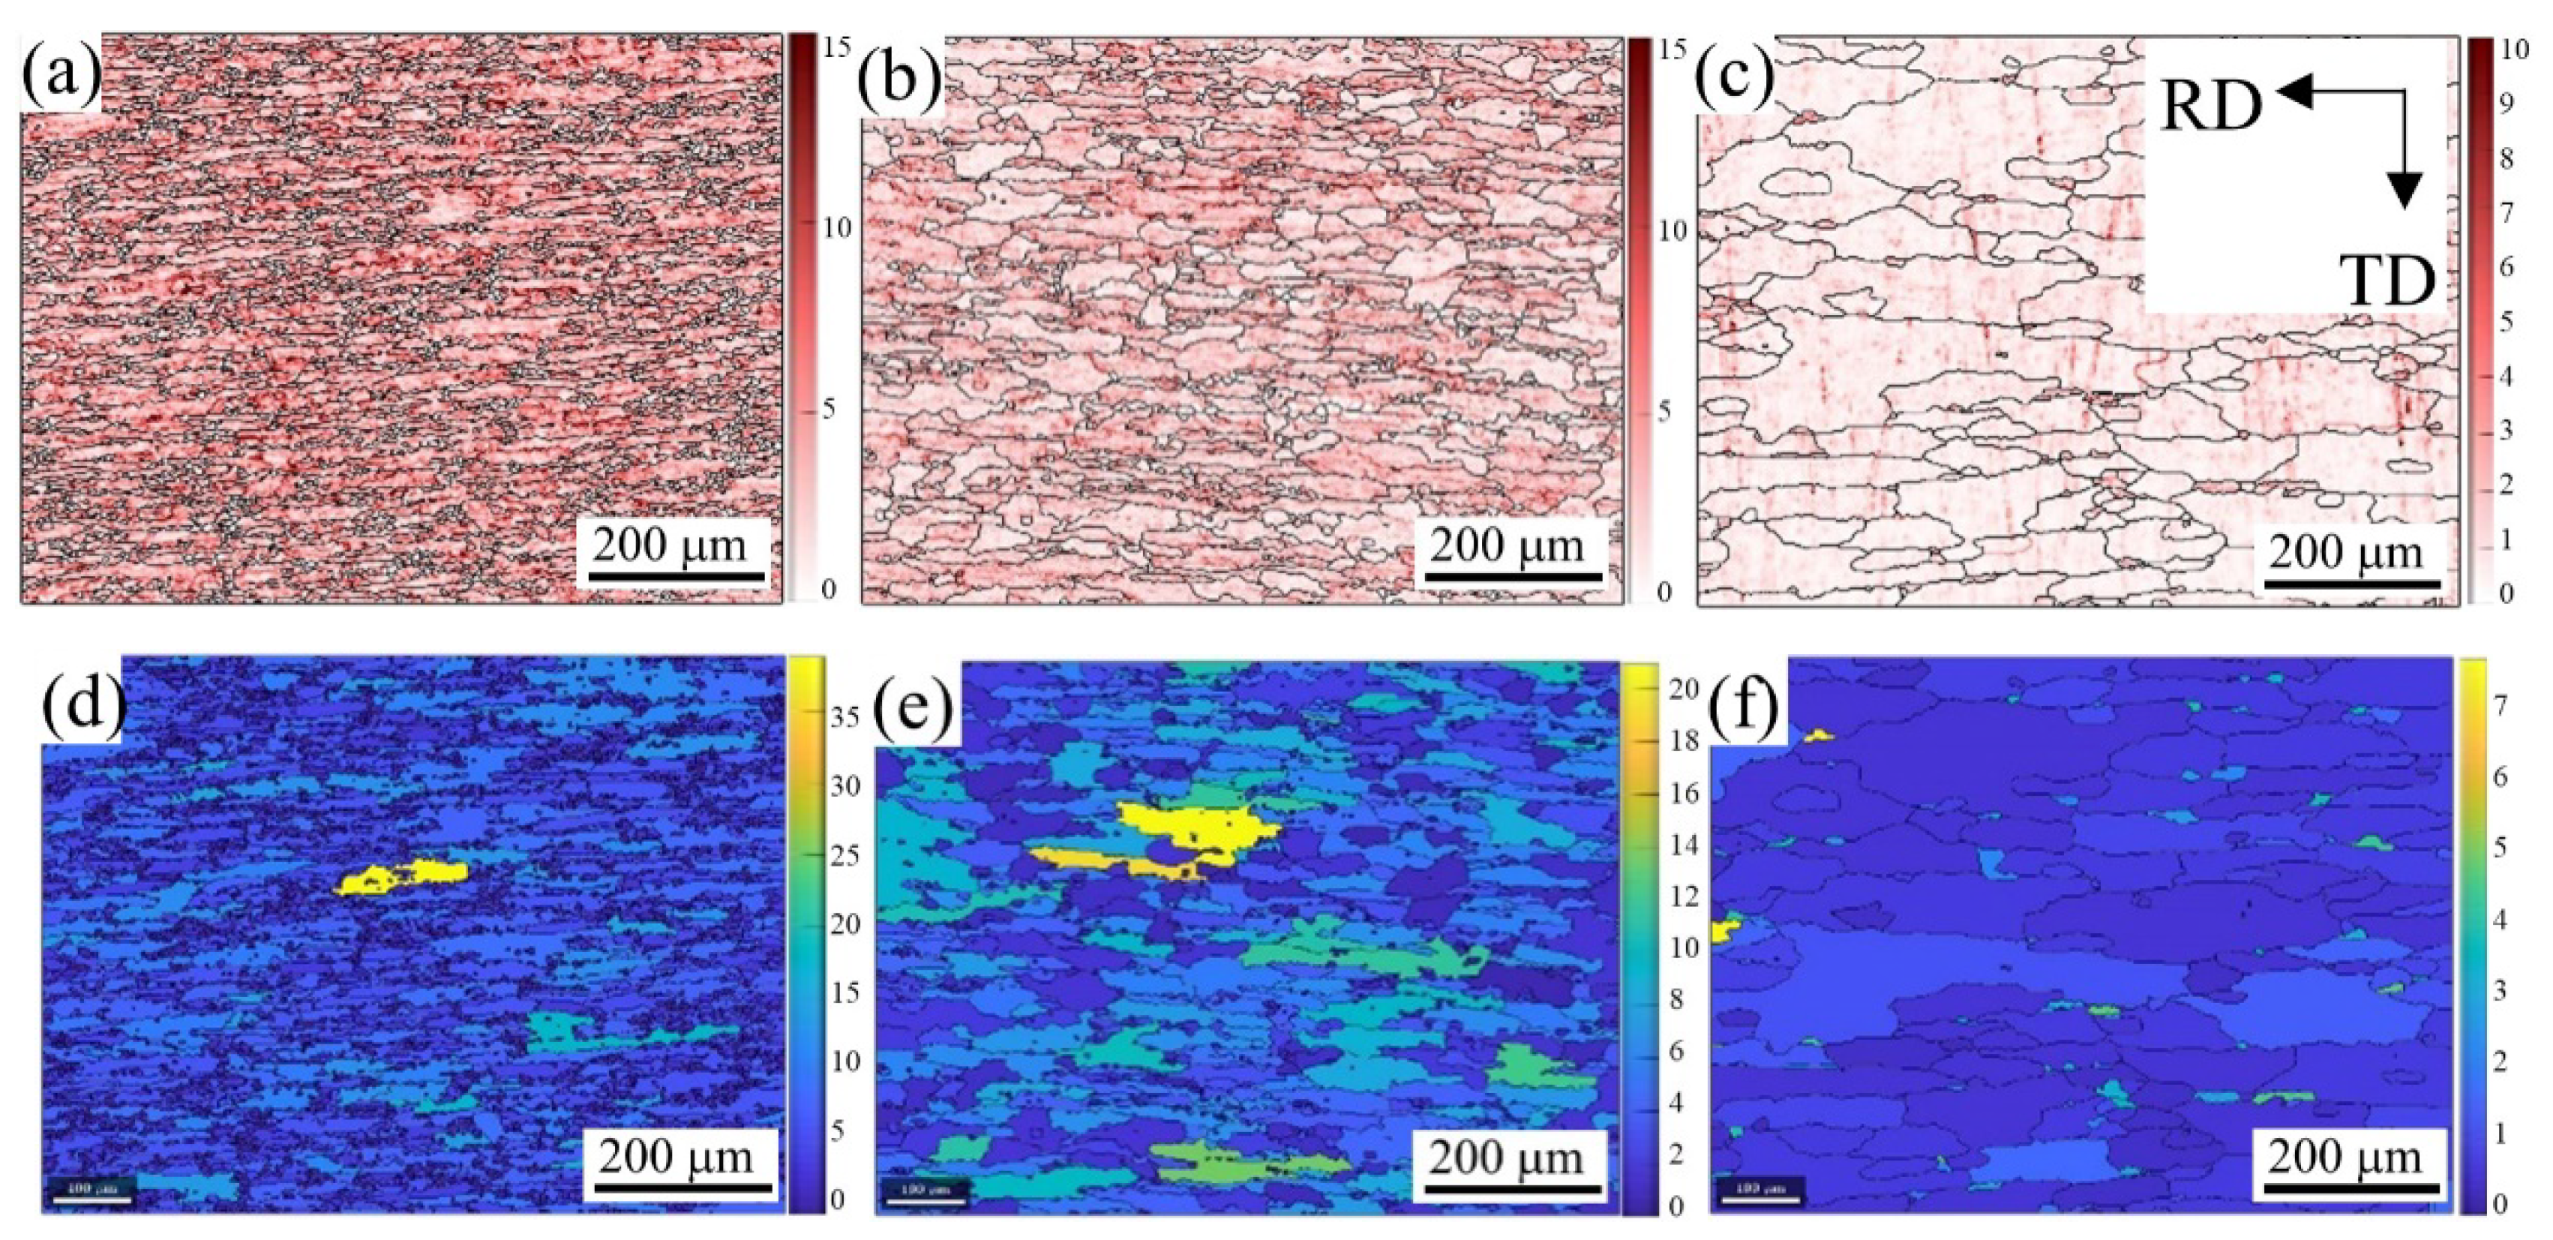
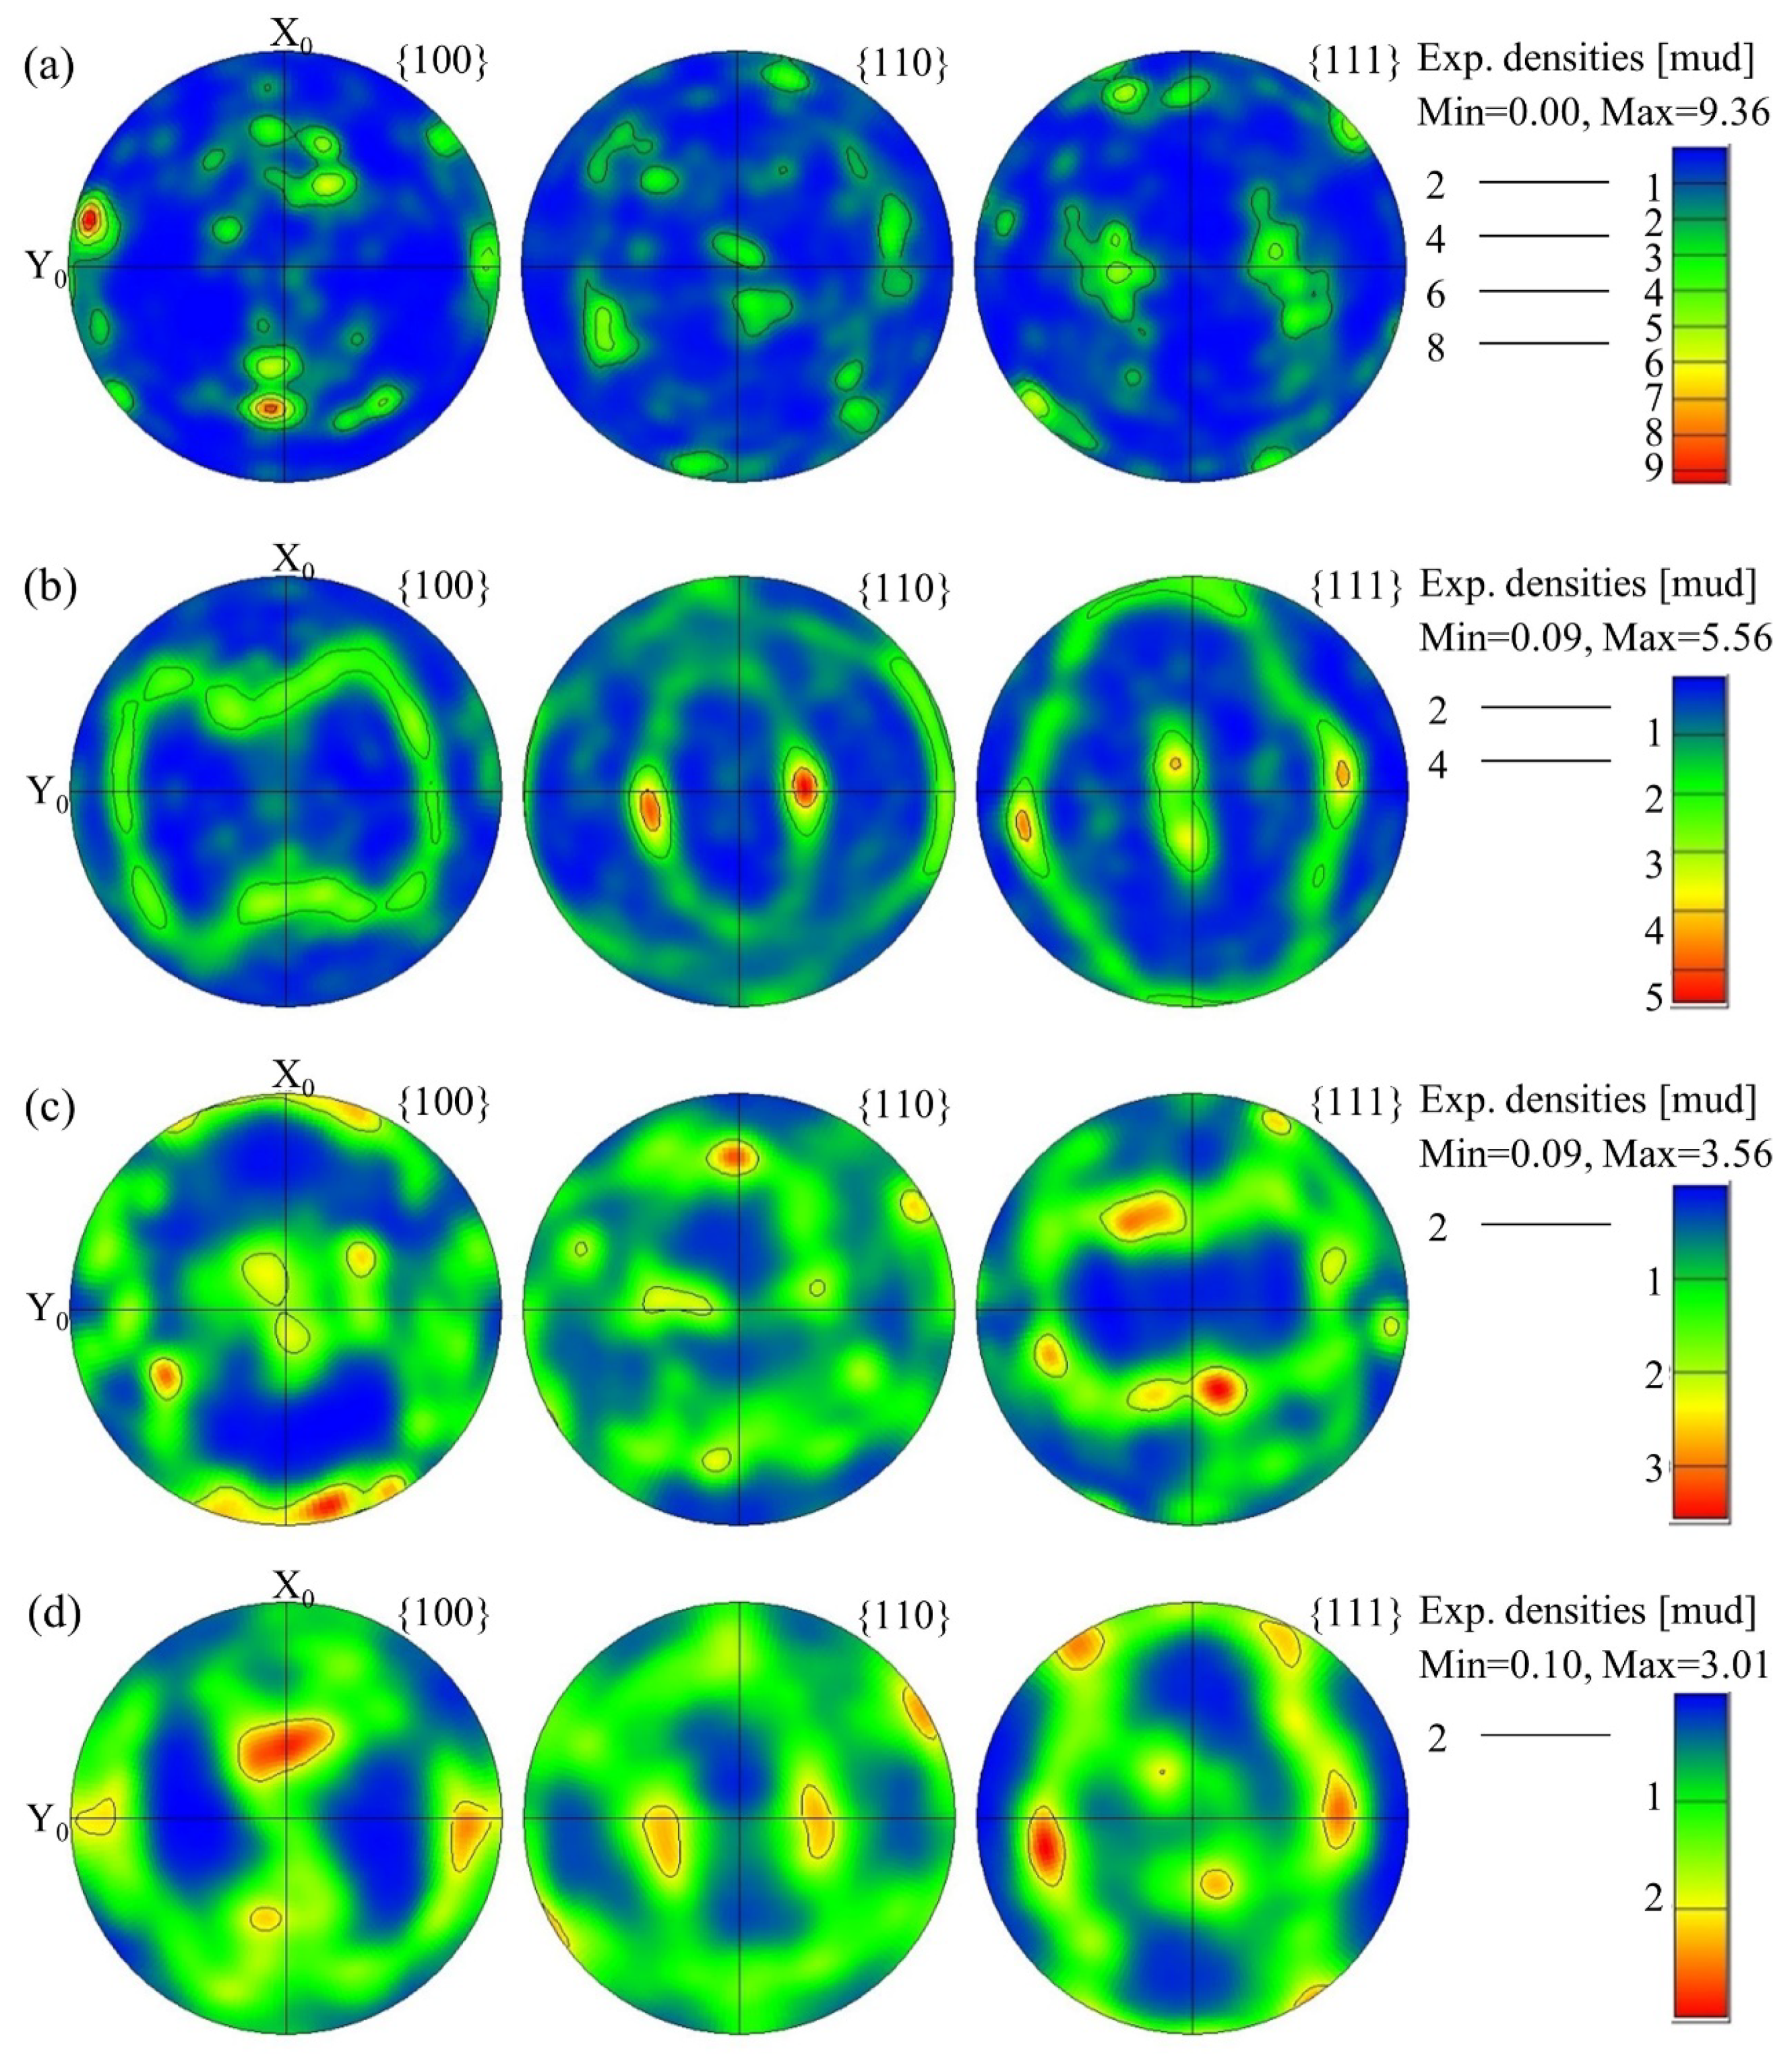
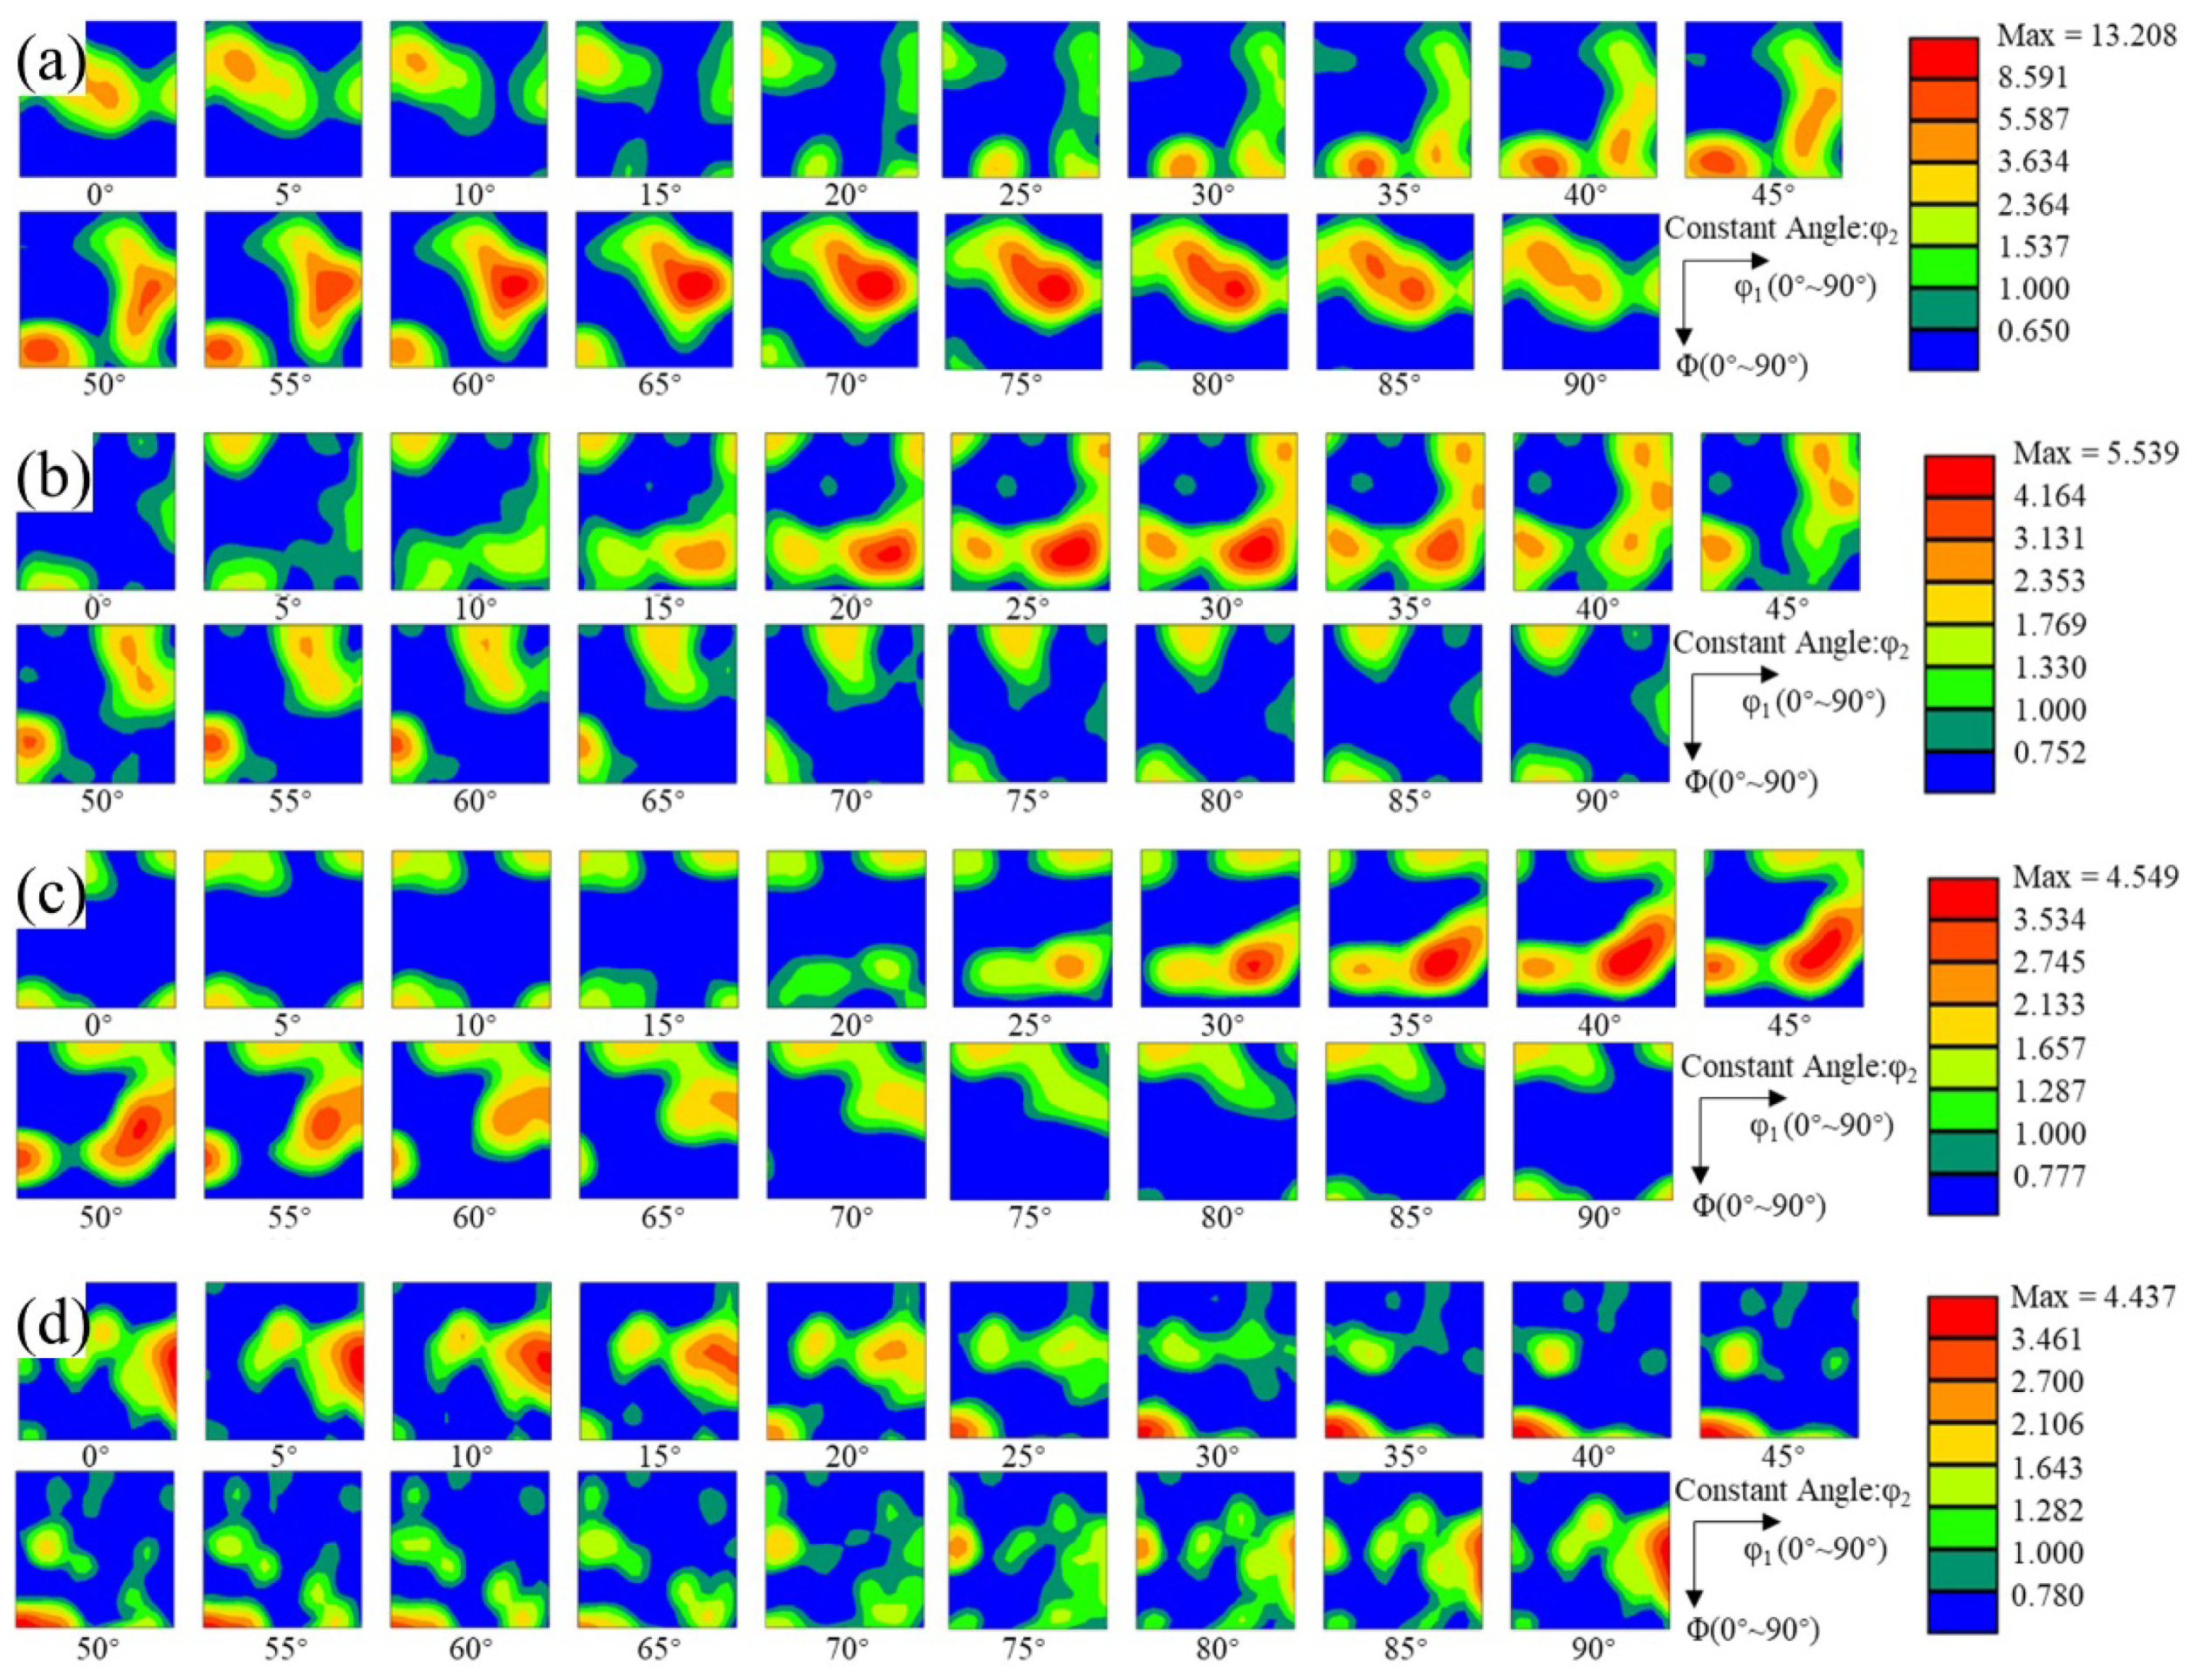
3.2. EBSD analysis results during recrystallization process
3.3. Second-phase particles in 2A14 alloy
3.4. Microstructure with smaller hierarchy of scale
4. Discussion
4.1. The deformed state
4.2. The second phases in 2A14 Al alloy
4.3. The recrystallization mechanism
5. Conclusions
Author Contributions
Funding
Institutional Review Board Statement
Informed Consent Statement
Data Availability Statement
Acknowledgments
Conflicts of Interest
References
- Santos, M.C.; Machado, A.R.; Sales, W.F.; Barrozo, M.A.S.; Ezugwu, E.O. Machining of Aluminum Alloys: A Review. Int. J. Adv. Manuf. Technol. 2016, 86, 3067–3080. [Google Scholar] [CrossRef]
- Williams, J.C.; Starke, E.A. Progress in Structural Materials for Aerospace Systems11The Golden Jubilee Issue—Selected Topics in Materials Science and Engineering: Past, Present and Future, Edited by S. Suresh. Acta Mater. 2003, 51, 5775–5799. [Google Scholar] [CrossRef]
- Gregson, P.J. Aluminium Alloys: Physical Metallurgy, Processing and Properties. In High Performance Materials in Aerospace; Flower, H.M., Ed.; Springer: Dordrecht, The Netherlands, 1995; ISBN 978-94-011-0685-6. [Google Scholar]
- Flemings, M.C. Behavior of Metal Alloys in the Semisolid State. Metall. Trans. A 1991, 22, 957–981. [Google Scholar] [CrossRef]
- Czerwinski, F. Thermomechanical Processing of Metal Feedstock for Semisolid Forming: A Review. Metall. Mater. Trans. B 2018, 49, 3220–3257. [Google Scholar] [CrossRef]
- Binesh, B.; Aghaie-Khafri, M. RUE-Based Semi-Solid Processing: Microstructure Evolution and Effective Parameters. Mater. Des. 2016, 95, 268–286. [Google Scholar] [CrossRef]
- Fu, J.; Wang, S.; Wang, K. Influencing Factors of the Coarsening Behaviors for 7075 Aluminum Alloy in the Semi-Solid State. J. Mater. Sci. 2018, 53, 9790–9805. [Google Scholar] [CrossRef]
- Jiang, J.; Liu, Y.; Xiao, G.; Wang, Y.; Xiao, X. Effects of Temperature and Time on Microstructural Evolution of Semisolid 5A06 Aluminum Alloy: Preparation of Semisolid Billets in Ellipsoid Solid Phase. J. Mater. Eng. Perform. 2020, 29, 5346–5359. [Google Scholar] [CrossRef]
- Lan, J.; Shen, X.; Liu, J.; Hua, L. Strengthening Mechanisms of 2A14 Aluminum Alloy with Cold Deformation Prior to Artificial Aging. Mater. Sci. Eng. A 2019, 745, 517–535. [Google Scholar] [CrossRef]
- Wang, M.; Huang, L.; Liu, W.; Ma, Y.; Huang, B. Influence of Cumulative Strain on Microstructure and Mechanical Properties of Multi-Directional Forged 2A14 Aluminum Alloy. Mater. Sci. Eng. A 2016, 674, 40–51. [Google Scholar] [CrossRef]
- Wang, B.; Yi, Y.; He, H.; Huang, S. Effects of Deformation Temperature on Second-Phase Particles and Mechanical Properties of Multidirectionally-Forged 2A14 Aluminum Alloy. J. Alloy. Compd. 2021, 871, 159459. [Google Scholar] [CrossRef]
- Chen, G.; Chen, Q.; Qin, J.; Du, Z. Effect of Compound Loading on Microstructures and Mechanical Properties of 7075 Aluminum Alloy after Severe Thixoformation. J. Mater. Process. Technol. 2016, 229, 467–474. [Google Scholar] [CrossRef]
- Chen, Q.; Chen, G.; Ji, X.; Han, F.; Zhao, Z.; Wan, J.; Xiao, X. Compound Forming of 7075 Aluminum Alloy Based on Functional Integration of Plastic Deformation and Thixoformation. J. Mater. Process. Technol. 2017, 246, 167–175. [Google Scholar] [CrossRef]
- Jiang, J.; Wang, Y.; Xiao, G.; Nie, X. Comparison of Microstructural Evolution of 7075 Aluminum Alloy Fabricated by SIMA and RAP. J. Mater. Process. Technol. 2016, 238, 361–372. [Google Scholar] [CrossRef]
- Humphreys, J.; Rohrer, G.S.; Rollett, A. Chapter 1—Introduction. In Recrystallization and Related Annealing Phenomena, 3rd ed.; Humphreys, J., Rohrer, G.S., Rollett, A., Eds.; Elsevier: Oxford, 2017; ISBN 978-0-08-098235-9. [Google Scholar]
- Huang, K.; Marthinsen, K.; Zhao, Q.; Logé, R.E. The Double-Edge Effect of Second-Phase Particles on the Recrystallization Behaviour and Associated Mechanical Properties of Metallic Materials. Prog. Mater. Sci. 2018, 92, 284–359. [Google Scholar] [CrossRef]
- Jiang, J.; Zhang, Y.; Wang, Y.; Xiao, G.; Liu, Y.; Zeng, L. Spheroidizing Process of 2A12 Aluminum Alloy Grains during Heating up and Semisolid Isothermal Treatment Stages. J. Mater. Eng. Perform. 2021, 30, 5974–5986. [Google Scholar] [CrossRef]
- Huang, K.; Logé, R.E. A Review of Dynamic Recrystallization Phenomena in Metallic Materials. Mater. Des. 2016, 111, 548–574. [Google Scholar] [CrossRef]
- Wang, Y.; Zhao, S.; Zhao, X.; Zhao, Y. Microstructural Coarsening of 6061 Aluminum Alloy Semi-Solid Billets Prepared via Recrystallization and Partial Melting. J. Mech. Sci. Technol. 2017, 31, 3917–3923. [Google Scholar] [CrossRef]
- Humphreys, J.; Rohrer, G.S.; Rollett, A. Chapter 3—Deformation Textures. In Recrystallization and Related Annealing Phenomena, 3rd ed.; Humphreys, J., Rohrer, G.S., Rollett, A., Eds.; Elsevier: Oxford, 2017; ISBN 978-0-08-098235-9. [Google Scholar]
- Humphreys, J.; Rohrer, G.S.; Rollett, A. Chapter 12—Recrystallization Textures. In Recrystallization and Related Annealing Phenomena, 3rd ed.; Humphreys, J., Rohrer, G.S., Rollett, A., Eds.; Elsevier: Oxford, 2017; ISBN 978-0-08-098235-9. [Google Scholar]
- Zhang, J.X.; Sun, H.Y.; Li, J.; Liu, W.C. Effect of Precipitation State on Recrystallization Texture of Continuous Cast AA 2037 Aluminum Alloy. Mater. Sci. Eng. A 2019, 754, 491–501. [Google Scholar] [CrossRef]
- Chen, X.; Peng, Y.; Chen, C.; Li, J.; Wang, K.; Wang, T. Mechanical Behavior and Texture Evolution of Aluminum Alloys Subjected to Strain Path Changes: Experiments and Modeling. Mater. Sci. Eng. A 2019, 757, 32–41. [Google Scholar] [CrossRef]
- Wang, X.; Shi, T.; Jiang, Z.; Chen, W.; Guo, M.; Zhang, J.; Zhuang, L.; Wang, Y. Relationship among Grain Size, Texture and Mechanical Properties of Aluminums with Different Particle Distributions. Mater. Sci. Eng. A 2019, 753, 122–134. [Google Scholar] [CrossRef]
- McQueen, H.J. Development of Dynamic Recrystallization Theory. Mater. Sci. Eng. A 2004, 387–389, 203–208. [Google Scholar] [CrossRef]
- Muzyk, M.; Pakiela, Z.; Kurzydlowski, K.J. Ab Initio Calculations of the Generalized Stacking Fault Energy in Aluminium Alloys. Scr. Mater. 2011, 64, 916–918. [Google Scholar] [CrossRef]
- Gruber, B.; Grabner, F.; Falkinger, G.; Schökel, A.; Spieckermann, F.; Uggowitzer, P.J.; Pogatscher, S. Room Temperature Recovery of Cryogenically Deformed Aluminium Alloys. Mater. Des. 2020, 193, 108819. [Google Scholar] [CrossRef]
- Huang, C.X.; Hu, W.; Yang, G.; Zhang, Z.F.; Wu, S.D.; Wang, Q.Y.; Gottstein, G. The Effect of Stacking Fault Energy on Equilibrium Grain Size and Tensile Properties of Nanostructured Copper and Copper–Aluminum Alloys Processed by Equal Channel Angular Pressing. Mater. Sci. Eng. A 2012, 556, 638–647. [Google Scholar] [CrossRef]
- Sakai, T.; Belyakov, A.; Kaibyshev, R.; Miura, H.; Jonas, J.J. Dynamic and Post-Dynamic Recrystallization under Hot, Cold and Severe Plastic Deformation Conditions. Prog. Mater. Sci. 2014, 60, 130–207. [Google Scholar] [CrossRef]
- Hu, Y.L.; Lin, X.; Li, Y.L.; Zhang, S.Y.; Gao, X.H.; Liu, F.G.; Li, X.; Huang, W.D. Plastic Deformation Behavior and Dynamic Recrystallization of Inconel 625 Superalloy Fabricated by Directed Energy Deposition. Mater. Des. 2020, 186, 108359. [Google Scholar] [CrossRef]
- Zhang, Y.; Yi, Y.; Huang, S.; Dong, F. Influence of Quenching Cooling Rate on Residual Stress and Tensile Properties of 2A14 Aluminum Alloy Forgings. Mater. Sci. Eng. A 2016, 674, 658–665. [Google Scholar] [CrossRef]
- Wu, D.; Li, W.; Liu, K.; Yang, Y.; Hao, S. Optimization of Cold Spray Additive Manufactured AA2024/Al2O3 Metal Matrix Composite with Heat Treatment. J. Mater. Sci. Technol. 2022, 106, 211–224. [Google Scholar] [CrossRef]
- Liu, X.; Liu, Y.; Zhou, Z.; Zhan, Q. Enhanced Strength and Ductility in Al-Zn-Mg-Cu Alloys Fabricated by Laser Powder Bed Fusion Using a Synergistic Grain-Refining Strategy. J. Mater. Sci. Technol. 2022, 124, 41–52. [Google Scholar] [CrossRef]
- Han, T.; Wang, F.; Li, J.; He, C.; Zhao, N. Effect of GNPs on Microstructures and Mechanical Properties of GNPs/Al-Cu Composites with Different Heat Treatment Status. J. Mater. Sci. Technol. 2021, 92, 1–10. [Google Scholar] [CrossRef]
- Jiao, N.N.; Lai, Y.X.; Chen, S.L.; Gao, P.; Chen, J.H. Atomic-Scale Roles of Zn Element in Age-Hardened AlMgSiZn Alloys. J. Mater. Sci. Technol. 2021, 70, 105–112. [Google Scholar] [CrossRef]
- Ding, S.; Zhang, J.; Khan, S.A.; Yanagimoto, J. Static Recovery of A5083 Aluminum Alloy after a Small Deformation through Various Measuring Approaches. J. Mater. Sci. Technol. 2022, 104, 202–213. [Google Scholar] [CrossRef]
- Zhang, Y.; Jiang, J.; Wang, Y.; Xiao, G.; Liu, Y.; Huang, M. Recrystallization Process of Hot-Extruded 6A02 Aluminum Alloy in Solid and Semi-Solid Temperature Ranges. J. Alloy. Compd. 2022, 893, 162311. [Google Scholar] [CrossRef]
- Atkinson, H.V.; Burke, K.; Vaneetveld, G. Recrystallisation in the Semi-Solid State in 7075 Aluminium Alloy. Mater. Sci. Eng. A 2008, 490, 266–276. [Google Scholar] [CrossRef]
- Engler, O.; Kuhnke, K.; Hasenclever, J. Development of Intermetallic Particles during Solidification and Homogenization of Two AA 5xxx Series Al-Mg Alloys with Different Mg Contents. J. Alloy. Compd. 2017, 728, 669–681. [Google Scholar] [CrossRef]
- Engler, O.; Miller-Jupp, S. Control of Second-Phase Particles in the Al-Mg-Mn Alloy AA 5083. J. Alloy. Compd. 2016, 689, 998–1010. [Google Scholar] [CrossRef]
- Engler, O.; Liu, Z.; Kuhnke, K. Impact of Homogenization on Particles in the Al–Mg–Mn Alloy AA 5454—Experiment and Simulation. J. Alloy. Compd. 2013, 560, 111–122. [Google Scholar] [CrossRef]
- Qian, X.; Parson, N.; Chen, X.-G. Effects of Mn Content on Recrystallization Resistance of AA6082 Aluminum Alloys during Post-Deformation Annealing. J. Mater. Sci. Technol. 2020, 52, 189–197. [Google Scholar] [CrossRef]
- Kuang, J.; Zhao, X.; Zhang, Y.; Zhang, J.; Liu, G.; Sun, J.; Xu, G.; Wang, Z. Impact of Thermal Exposure on the Microstructure and Mechanical Properties of a Twin-Roll Cast Al-Mn-Fe-Si Strip. J. Mater. Sci. Technol. 2022, 107, 183–196. [Google Scholar] [CrossRef]
- Hu, G.W.; Zeng, L.C.; Du, H.; Liu, X.W.; Wu, Y.; Gong, P.; Fan, Z.T.; Hu, Q.; George, E.P. Tailoring Grain Growth and Solid Solution Strengthening of Single-Phase CrCoNi Medium-Entropy Alloys by Solute Selection. J. Mater. Sci. Technol. 2020, 54, 196–205. [Google Scholar] [CrossRef]
- Wang, P.; Shuai, S.; Huang, C.; Liu, X.; Fu, Y.; Wang, J.; Ren, Z. Revealing the Influence of High Magnetic Field on the Solute Distribution during Directional Solidification of Al-Cu Alloy. J. Mater. Sci. Technol. 2021, 88, 226–232. [Google Scholar] [CrossRef]
- She, H.; Shu, D.; Dong, A.; Wang, J.; Sun, B.; Lai, H. Relationship of Particle Stimulated Nucleation, Recrystallization and Mechanical Properties Responding to Fe and Si Contents in Hot-Extruded 7055 Aluminum Alloys. J. Mater. Sci. Technol. 2019, 35, 2570–2581. [Google Scholar] [CrossRef]
- Wang, T.; Atehortua, J.E.; Song, M.; Reza-E-Rabby, M.; Taysom, B.S.; Silverstein, J.; Roosendaal, T.; Herling, D.; Whalen, S. Extrusion of Unhomogenized Castings of 7075 Aluminum via ShAPE. Mater. Des. 2022, 213, 110374. [Google Scholar] [CrossRef]
- Behnamfard, S.; Taherzadeh Mousavian, R.; Khosroshahi, R.A.; Brabazon, D. A Comparison between Hot-Rolling Process and Twin-Screw Rheo-Extrusion Process for Fabrication of Aluminum Matrix Nanocomposite. Mater. Sci. Eng. A 2019, 760, 152–157. [Google Scholar] [CrossRef]
- Chen, L.; Zhang, S.; Li, Z.; Zhao, G.; Zhang, C.; Lin, J. Investigation on Peripheral Coarse Grains and Precipitation Behavior of In-Situ TiB2/Al–Cu–Mg Composites with Various Mg Contents. Mater. Sci. Eng. A 2021, 826, 142000. [Google Scholar] [CrossRef]
- Wei, B.; Pan, S.; Liao, G.; Ali, A.; Wang, S. Sc-Containing Hierarchical Phase Structures to Improve the Mechanical and Corrosion Resistant Properties of Al-Mg-Si Alloy. Mater. Des. 2022, 218, 110699. [Google Scholar] [CrossRef]
| Element | Cu | Si | Mn | Mg | Fe | Ti | Zn | Ni | Al |
|---|---|---|---|---|---|---|---|---|---|
| Standard | 3.9~4.8 | 0.6~1.2 | 0.4~1.0 | 0.4~0.8 | ≤0.7 | ≤0.15 | ≤0.3 | ≤0.1 | Bal. |
| Sample | 4.370 | 0.916 | 0.781 | 0.590 | 0.177 | 0.025 | 0.027 | 0.006 | Bal. |
| Texture type | Texture name | {hkl}<uvw> | (φ1, Φ, φ2) |
|---|---|---|---|
| Deformation texture | Copper | {112}<111> | (90, 35, 45) |
| Brass | {011}<211> | (35, 45, 0) | |
| S | {123}<634> | (59, 37, 63) | |
| Recrystallization texture | P | {011}<122> | (70, 45, 0) |
| Recrystallized brass | {236}<385> | (79, 31, 33) |
Disclaimer/Publisher’s Note: The statements, opinions and data contained in all publications are solely those of the individual author(s) and contributor(s) and not of MDPI and/or the editor(s). MDPI and/or the editor(s) disclaim responsibility for any injury to people or property resulting from any ideas, methods, instructions or products referred to in the content. |
© 2023 by the authors. Licensee MDPI, Basel, Switzerland. This article is an open access article distributed under the terms and conditions of the Creative Commons Attribution (CC BY) license (http://creativecommons.org/licenses/by/4.0/).


