1. Introduction
Over the past two years, the global COVID-19 pandemic has highlighted the crucial role of accurate patient diagnostics in preventing an overload of healthcare resources. The pandemic has led to a significant increase in patient surges globally, resulting in varying degrees of respiratory illnesses and a rise in mortality rates [
1]. The symptoms of COVID-19 induced by the varying strains of the pathogen SARS-CoV-2 are challenging to differentiate from other common respiratory infections in a large proportion of those infected. Moreover, disease progression varies from asymptomatic cases to critical patient conditions, making it challenging for appropriate treatment selections and accurate prognosis. Some patients with COVID-19 rapidly develop severe dysfunctions and even critical illness demonstrating an excellent example of infection variability due to internal physiological factors [
2]. Furthermore, even after recovery, a portion of patients keep experiencing a spectrum of COVID-19-like symptoms generally termed “Long COVID” making disease outcome prognosis even more challenging. Subsequently, this situation is substantially aggravated by the lack of understanding of the main signaling and pathogenetic mechanisms induced by COVID-19 infection in the host.
Correct risk evaluation and management in the realm of infectious diseases are critical for the diagnostic assessment and selection of the best line of therapies, markedly increasing the likelihood of patient survival [
3]. The COVID-19 outbreak has highlighted the significance of implementing these measures. Therefore, one of the greatest challenges during the pandemic, especially in resource-strained settings, has been the early identification of individual patients at higher risk for adverse outcomes. Hence, it is critical to develop and implement intelligent risk-assessment tools that can predict a patient's disease progression and recovery and suggest best-fit therapeutics for markedly reducing disease severity.
Data-driven risk evaluation based on artificial intelligence/machine learning (AI/ML) software models is considered an effective decision-making algorithm in the streamlining triage of emergency patients [
4]. Sorting patients into different cohorts based on the disease severity and prognosis helps rationally allocate healthcare resources and identify the most effective therapy. Contemporary AI/ML-driven approaches in the healthcare space have accelerated the drug discovery and development pipelines due to the availability and prioritization of data alongside a wide range of statistical learning methods that leverage data to draw inferences and make new predictions [
5]. Additionally, computational assistance to healthcare providers contributes to reduced emotional pressure and, consequently, increased accuracy selection of successful therapeutic strategies [
6,
7].
Implementation of AI/ML-based patient stratification is a suitable strategy for developing custom patient-specific therapeutic guidance because of the sufficient availability of COVID-19 clinical data. Such strategies may contribute to overcoming the pandemic altogether as model applications move from patient-based to population-based [
4]. Current AI/ML algorithms providing COVID-19 prognosis belong to either image- or non-image-based categories. The first group significantly relies on chest X-ray or digital tomography readouts [
8] that reflect lung function but cannot accurately quantitate the degree of immune response and upregulation of biomarkers in the inflammatory pathways. It was demonstrated that quantifying proinflammatory cytokine levels, blood, and urine biomarkers improves assessments of patient clinical conditions with high accuracy [
9]. Non-image-based methods for COVID-19 include using electronic health record (EHR) information to diagnose COVID-19 and assess its severity. These methods consist of two basic types of studies: score system-based and ML-based COVID-19 diagnostics [
10]. Researchers seek to identify important predictors and assign them associated scores for the former. Subsequently, the summation of the scores can potentially lead to the stratification of patients with different disease severities [
9,
11]. Currently, several risk assessment scores are available to predict the severity of different, none COVID-19 related, diseases for ICU patients [
12]. Furthermore, predictors indicating the need for intensive respiratory or vasopressor support for COVID-19 patients or suggesting the high mortality risk in COVID-19 patients with pneumonia have been identified [
13,
14].
Liang et al. [
9] built a predictive risk score (COVID-GRAM) system, which included ten important predictive factors screened from 72 potential predictors among epidemiological, clinical, laboratory, and imaging variables. The COVID-GRAM was used to estimate the risk of developing critical illness for patients with COVID-19. Other methods are based on a gradient boosting decision tree model that predicts an individual’s COVID-19 infection progression, recovery rate, and mortality risk using demographic information such as age, sex, race, and a series of routine lab tests [
15]. Recent advances in deep learning (DL) combined with EHR datasets have gained recent traction for diagnosing COVID-19. For example, a feedforward neural network-based DL survival model was used to predict critical illness development risk in COVID-19 patients by evaluating 74 baseline clinical features [
9]. It has been noted that patient genomics data, which plays a crucial role in the diversity of disease severity, is not accounted for in any of those models [
16,
17]. Adding genomics information into a predictive modeling system can help enrich and identify critical pathways and associated nuances contributing to the disease severity and select the most appropriate treatment options.
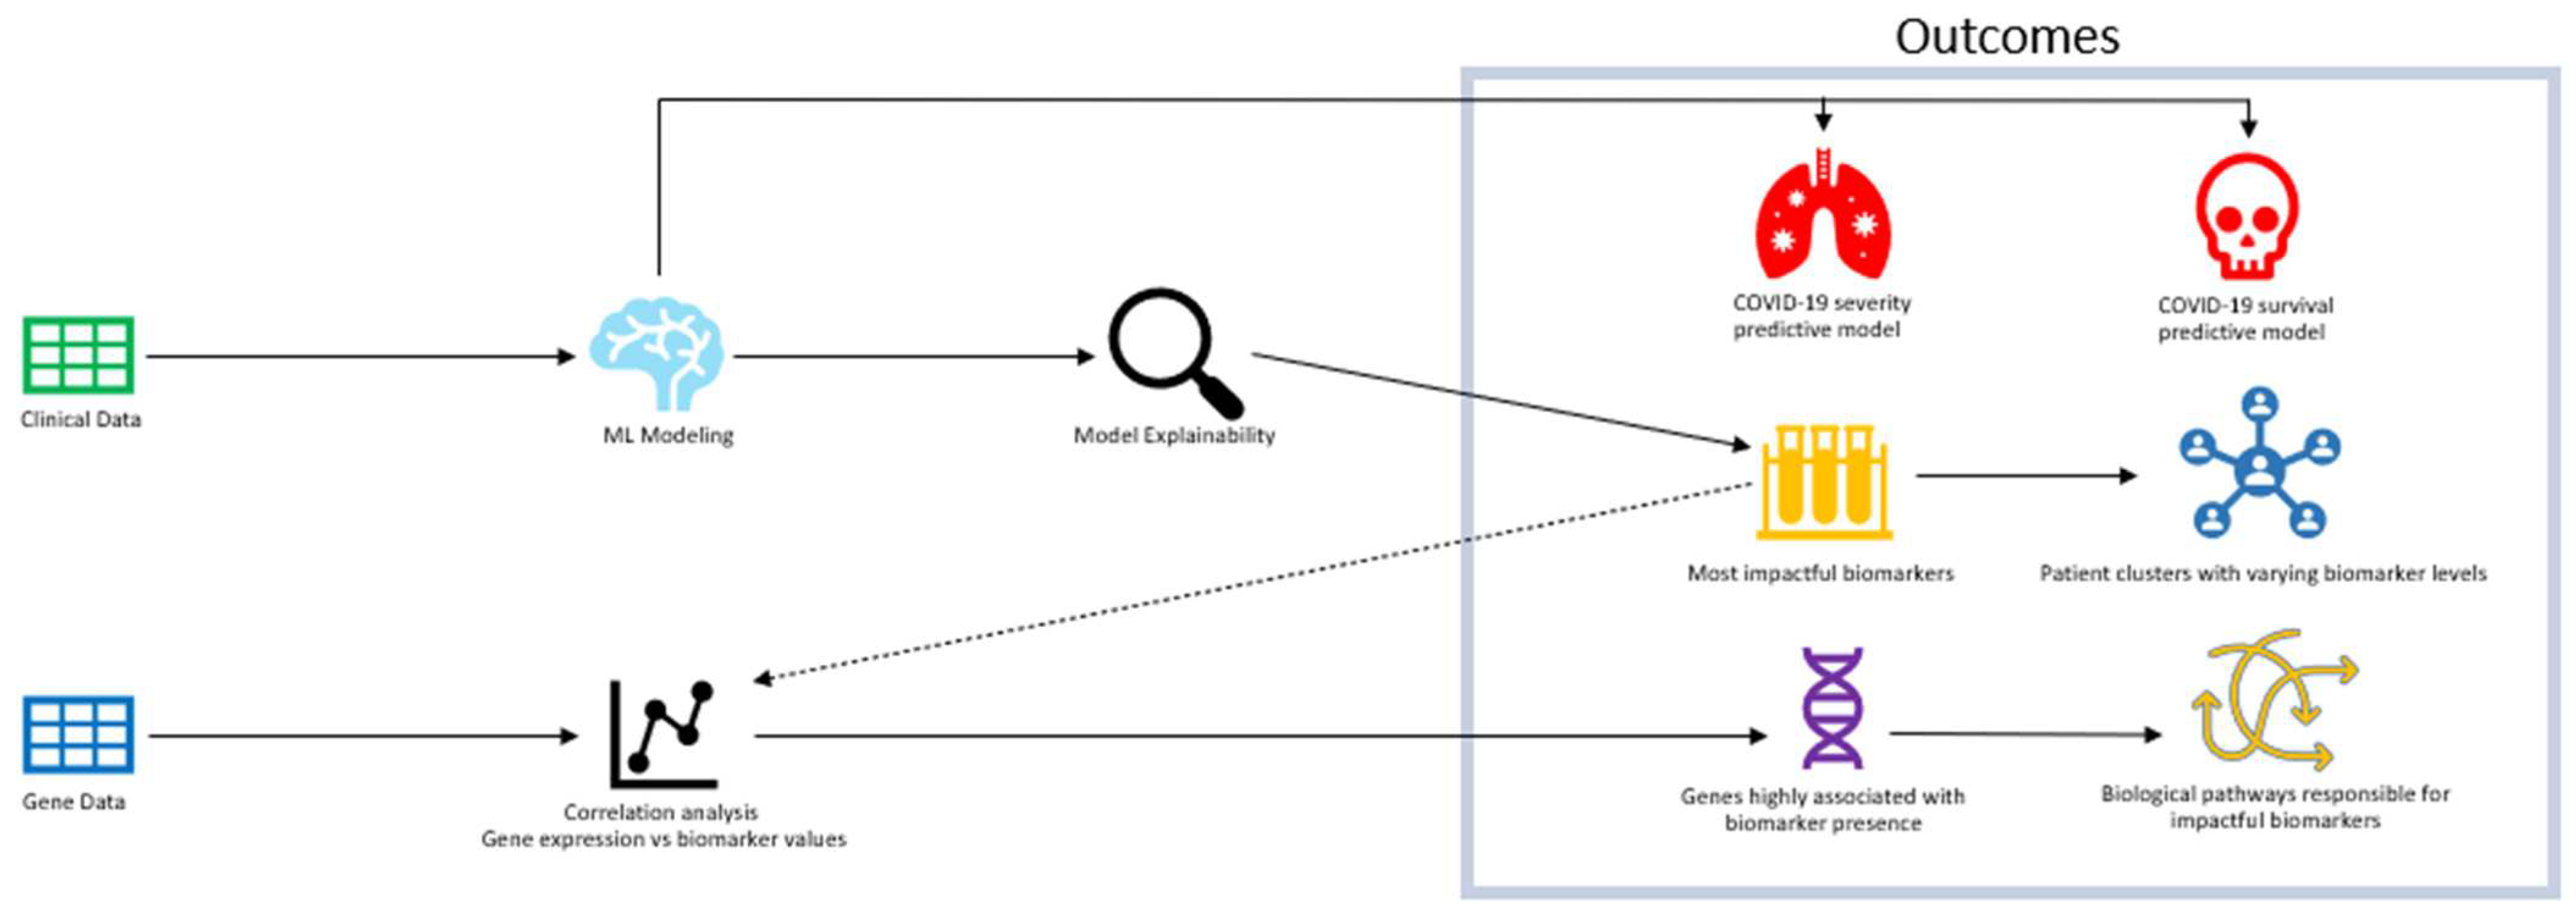
Understanding the biological pathways that impact severe cases of COVID-19 is crucial to identifying effective drug interventions and improving survival rates. The main approach of the study was to understand the most impactful biomarkers that contribute to severe cases and lower survival through ML predictive models (
Figure 1). Models were trained on clinical patient data that include several biomarker levels in correspondence with case severity and survival. After achieving optimal performance, an analysis of model explainability was conducted to reveal the "black box effect" of the predictive models and identify the biomarkers and their corresponding values that have the greatest influence on model predictions. Upon identifying significant biomarkers, a correlation analysis was conducted between groups of genes and the biomarkers that were modulated to pinpoint the most probable cluster of genes contributing to severe cases of COVID-19 and decreased survival rates. ML modeling was employed to conduct a correlation analysis on a patient pool consisting of both OMICS and clinical datasets. Our AI/ML modeling has helped us reveal the significant association between the most influential gene cluster and the related biological pathways. This manuscript showcases our findings, which can greatly improve our comprehension of the features of potential drug candidates to address the severity and mortality of COVID-19.
2. Materials and Methods
2.1. Clinical data acquisition
An analytical review of the literature indexed in the PubMed/MEDLINE, and Scopus databases was conducted. The goal was to summarize all available sources providing clinical and OMICs data for individual patients infected with SARS-CoV-2 and admitted to the healthcare institutions. The search strategy for the relevant clinical publications was to use broad terms and specific biomarker terminology to identify as many publications with appropriate COVID-19 patient datasets. We included peer-reviewed, pre-proof, and papers published ahead of print that reported COVID-19 cases, confirmed by real-time reverse transcriptase-polymerase chain reaction. Articles in English and non-English languages were selected. The first run of the literature search using general terminology returned more than three hundred thousand article titles. Following, the search ranking algorithm was applied to triage the sources found, and twenty-two research articles with the primary patient data (
Supplementary data S1) were evaluated and used as a database for further ML training.
Specific sets of clinical terms with assigned logical weight for biomarker identification were deployed in the AI algorithm to further rank the source according to their relevance in providing individual clinical data.
2.2. Data curation
The clinical dataset consisted of patient conditions, lab test results, clinician reports including SOFA score, which is used to predict ICU mortality based on lab results and clinical data. SOFA score is considered helpful for ML model training because it directly reflects patient condition based on the oxygen saturation, respiratory function, platelets count, blood pressure values, creatinine and bilirubin test values as well as Glasgow coma scale. SOFA score has demonstrated its reliability during its use for more than 25 years since it was developed [
18]. The full clinical datasets for these patients were downloaded from Synapse with the identification number syn35874390 from synapse.org. The dataset was filtered to include patients that had tested positive for COVID-19 through either PCR and/or antibody tests. There were 581 unique patients with a combined set of 7707 clinical data points containing multiple days of patient information. Individual patient parameters were categorized into demographic parameters, comorbidities, blood cell count parameters, and biochemical and inflammatory biomarkers. Duplicates were dropped to result in the overall 7707 clinical data points to ensure that unique patient information would be used to train the Machine Learning model. The gene expression dataset for this analysis was obtained from the Gene Expression Omnibus (GEO) with the accession number GSE215865. The dataset consisted of transcriptomics, (RNA-seq) of whole blood samples of hospitalized COVID-19 patients and healthy hospitalized control patients [
19]. Using the metadata available, the gene expression was reduced to 1198 samples after removing sets of patients with largely incomplete clinical descriptions [
20].
2.3. Bioinformatics methodology
Gene network analysis was conducted on 1198 gene expression data with WGCNA package [
21] to identify significant correlation between co-expressed gene modules and patients disease severity, comorbidity and clinical biomarkers. First, Differentially expressed genes (DEGs) between COVID-19 positive and negative (control) were extracted using normalized gene counts (at p-value < 0.05 and abs(logFC) >= 1) using limma package [
22], and fed into construction of weighted gene co-expression networks. Using WGCNA functions, approximate scale free topology was determined to define the adjacency matrix and transformed into topological overlaps (TOM) and dissimilarity (dissTOM) matrix. A hierarchical clustering was performed to identify gene modules with minimum size set at 30 genes. Modules with gene expression similarity were subsequently merged based on module eigengene and cluster correlation. Also, to determine key genes associated with COVID-19 severity and other clinical features, Gene Significance (GS) and Module Membership was calculated for every gene in modules and filtered at GS > 0.2 and MM > 0.8. Gene with high values typically have high connection and interaction, and do have strong association with traits of interests [
21]. The selected key gene biomarkers are further analysis for biological annotations and activities. To gain insights into the biological role of these genes, functional annotation analysis was performed using Gene Ontology (GO) [
23,
24] and Kyoto Encyclopedia of Genes and Genome (KEGG) [
25] using ShuyGO web-based tools [
26].
2.4. Descriptor analysis and selection
For the initial dataset used in model training, we collected various types of data such as patient condition, biomarkers, comorbidities, and therapy information. The data was classified as either numerical or categorical data. The dataset also had biomarkers with varying levels of missing values, each of which was identified in the missing values table (
Supplementary Table S7). Each relevant column used for model training is indicated in the column groups table (
Supplementary Table S1).
All features were then normalized and evaluated to discern relative importance to the respective target features (survival outcome and disease severity) using our ML infrastructure pipeline. These algorithms were optimized to the data available in the training set. Algorithm performance in selecting essential features were proportional to training data size [
27]. BIOiSIM™’s AI infrastructure included automated statistical learning algorithms prioritizing a large collection of features and selecting those features that improved model performance. This subset was further refined during model training through Recursive Feature Elimination (RFE) and Boruta selection algorithms.
2.5. Model training and evaluation
We developed two different types of ML models for this project. Both classification models used the biomarkers information, comorbidities, and therapy information to predict either COVID-19 case severity or survival outcome.
Inbuilt ML and DL algorithms were used for both classification and regression models. The ML algorithms used in the study included linear algorithms such as Bayesian ridge, support vector machines, tree-based ensemble methods such as LightBoost, CatBoost, XGBoost, random forests, and recurrent neural network variants such as multi-layer perceptions [
28]. Features selected from the initially assembled descriptor set were used as inputs in the training process.
All individual patient data contained information regarding the survival outcomes and length of hospital stay as the initial set for model training and evaluation. They were considered critical for the model learning. The ML infrastructure randomly divided the entire dataset into 80% and 20% portions for the training and test splits.
Classification model evaluation metrics include balanced accuracy and ROC-AUC score (Area Under the Receiver Operating Characteristic Curve). Balanced accuracy is defined as an optimal approach to the standard accuracy metric, which is adjusted to perform better on imbalance datasets. ROC-AUC score assesses the distinction of probability predictions between two classes. Balanced accuracy was selected since the survival model training dataset was imbalanced and to maintain consistent evaluation with severity models. The ROC-AUC evaluation enables the assessment of the predicted probabilities, which could be advantageous if the models were to be utilized in a clinical environment. This approach provides probabilistic information regarding the status of a patient with COVID-19. Subsequently, both metrics were determined on each test set from each respective trained model.
3. Results
3.1. Model outcomes
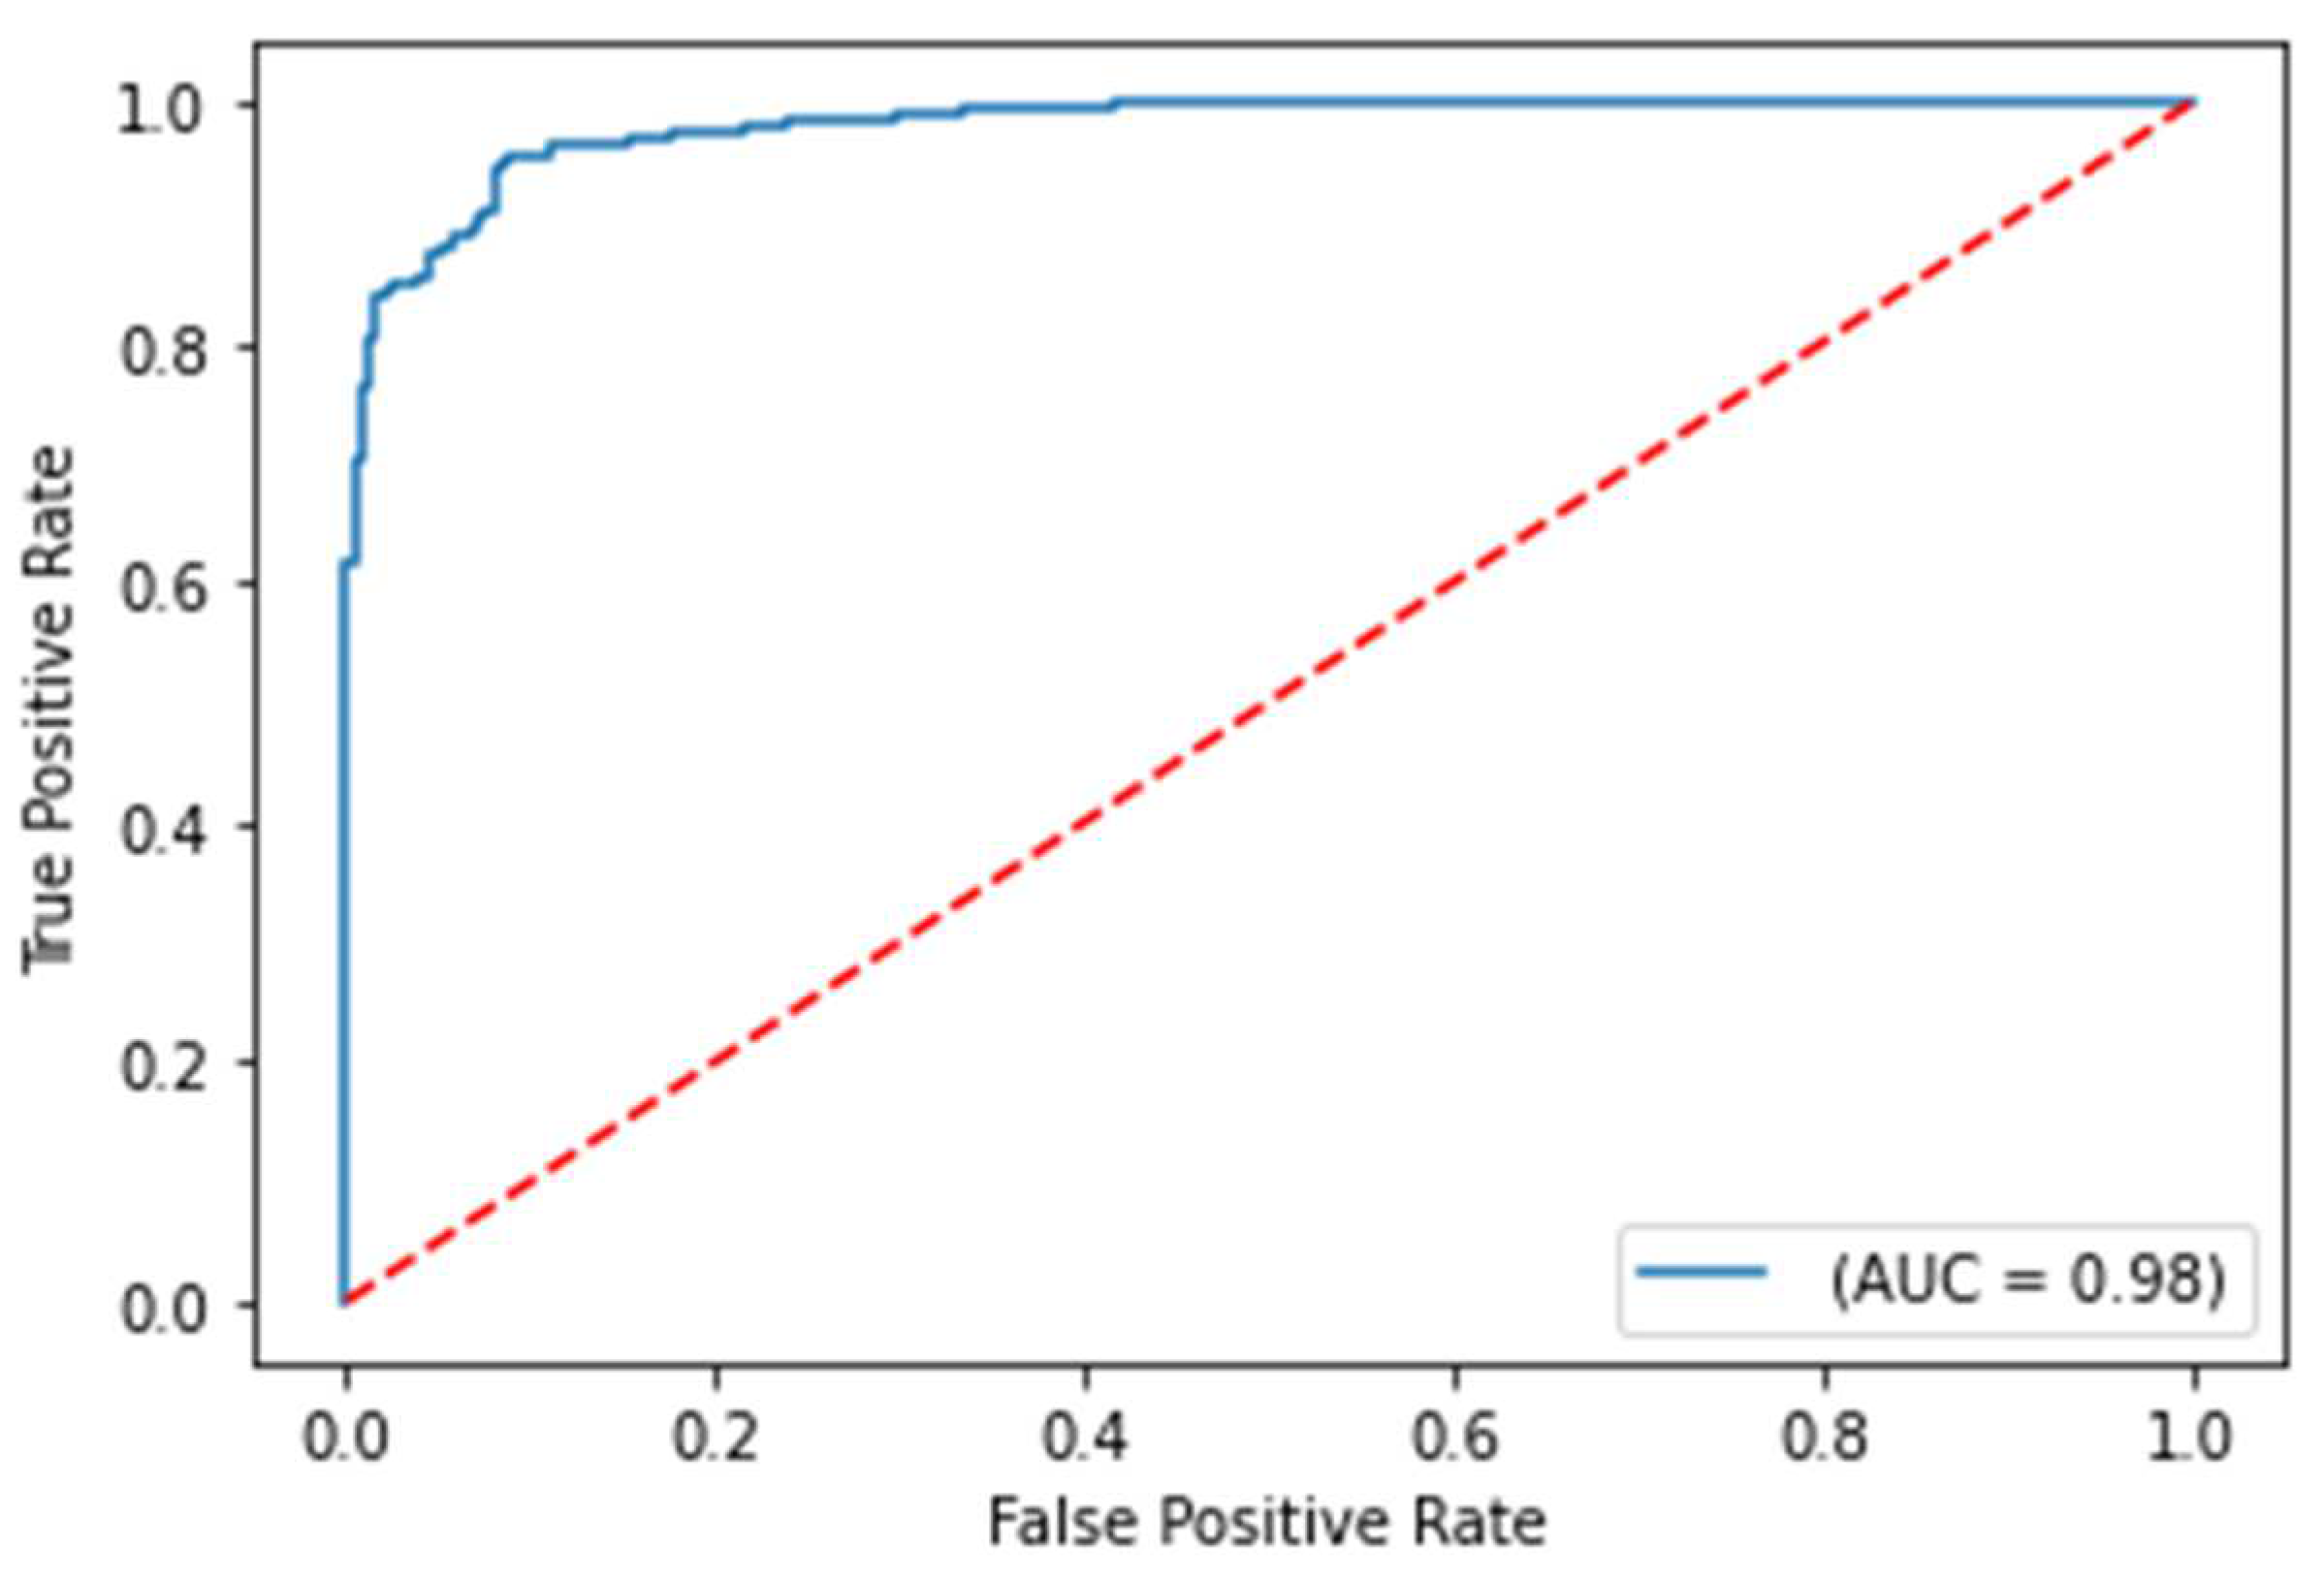
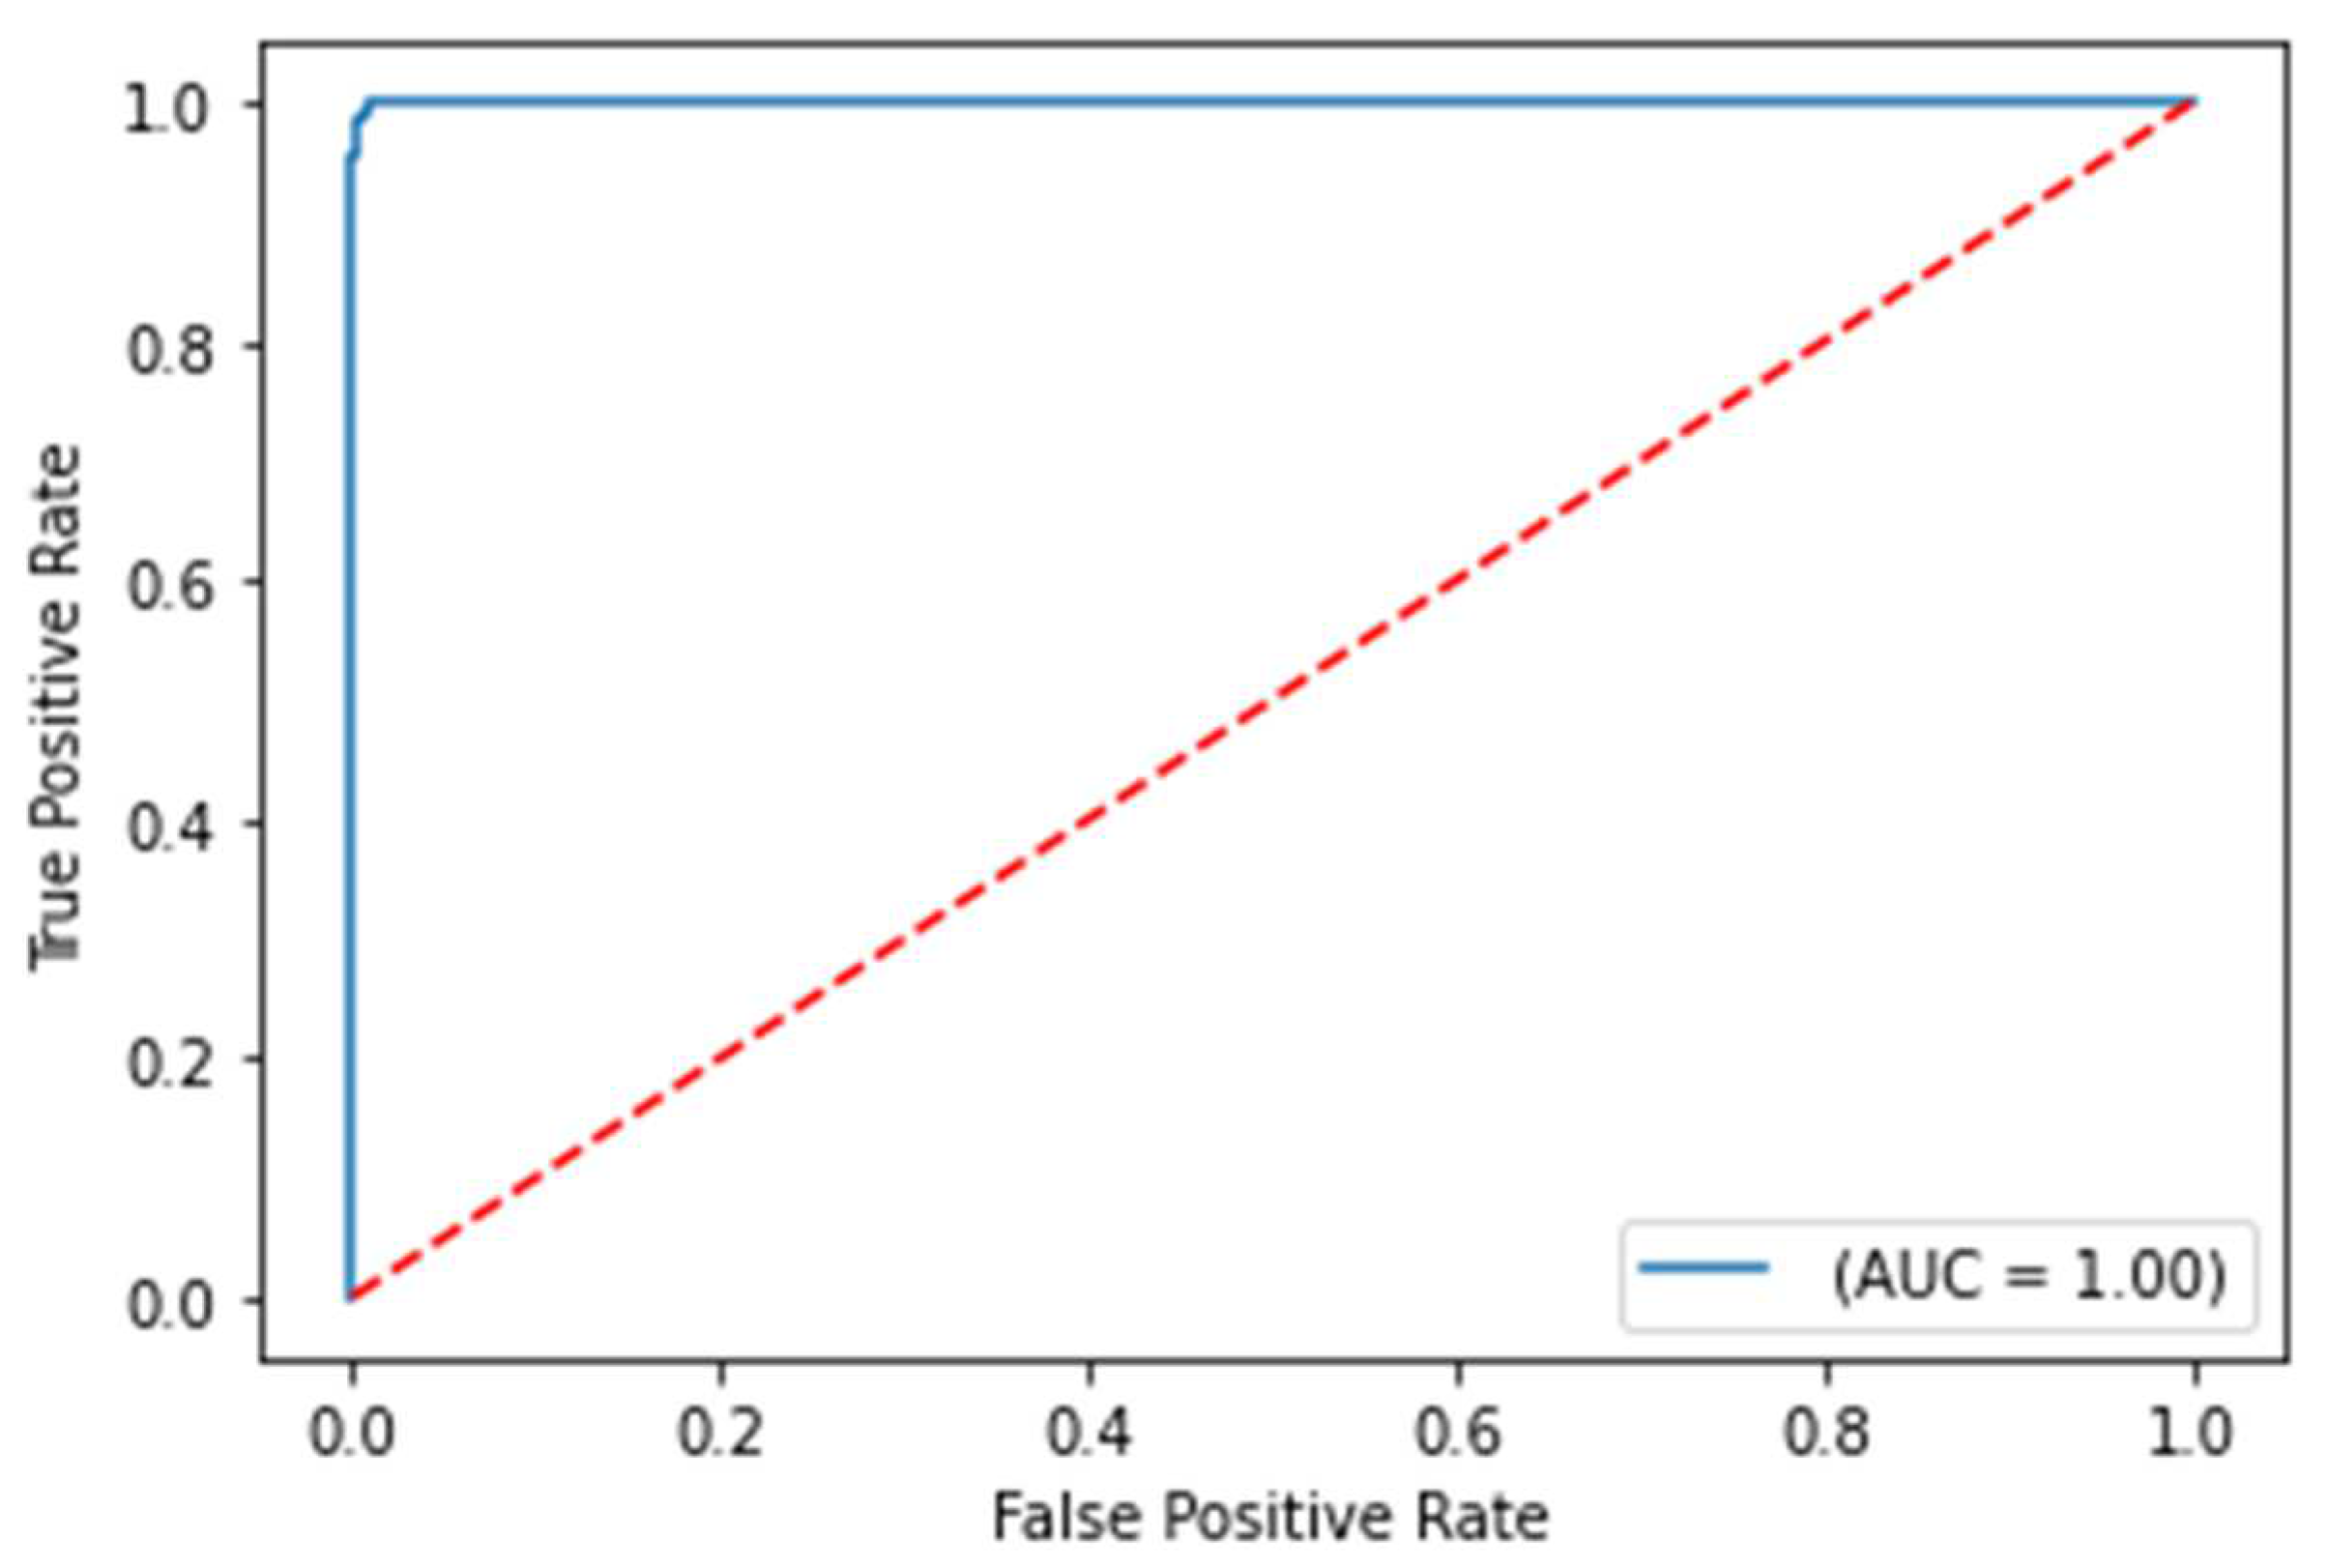
The balanced accuracy was 91.6%, and the ROC-AUC score was 98.1% for the best performing severity model. The balanced accuracy was 99.4%, and the ROC-AUC score was 99.9% with the best performing survival model. Both models were LightGBM classifier models, a lightweight modeling infrastructure that applies Gradient Boosting Machine (GBM) decision trees. GBMs consist of iterative, or “boosted,” decision trees that fit training feature thresholds to approximate predictions. GBMs have built-in methods to handle missing data points, such as those seen within the varying biomarkers of the clinical dataset. The high performing results indicate the usefulness of clinical features for both predictive use cases. The predictive modeling results are summarized in
Table 1. ROC curves for severity and survival models are shown in
Figure 2 and
Figure 3, respectively.
The fact that the clinical features used to train both models can be generalized, along with the absence of some portions of the biomarker laboratory datasets, reinforces the practicality of deploying predictive model in a clinical setting. The input to the predictive models need not include all the listed blood biomarker values in the feature set to generate a dependable prediction, but rather only some of them.
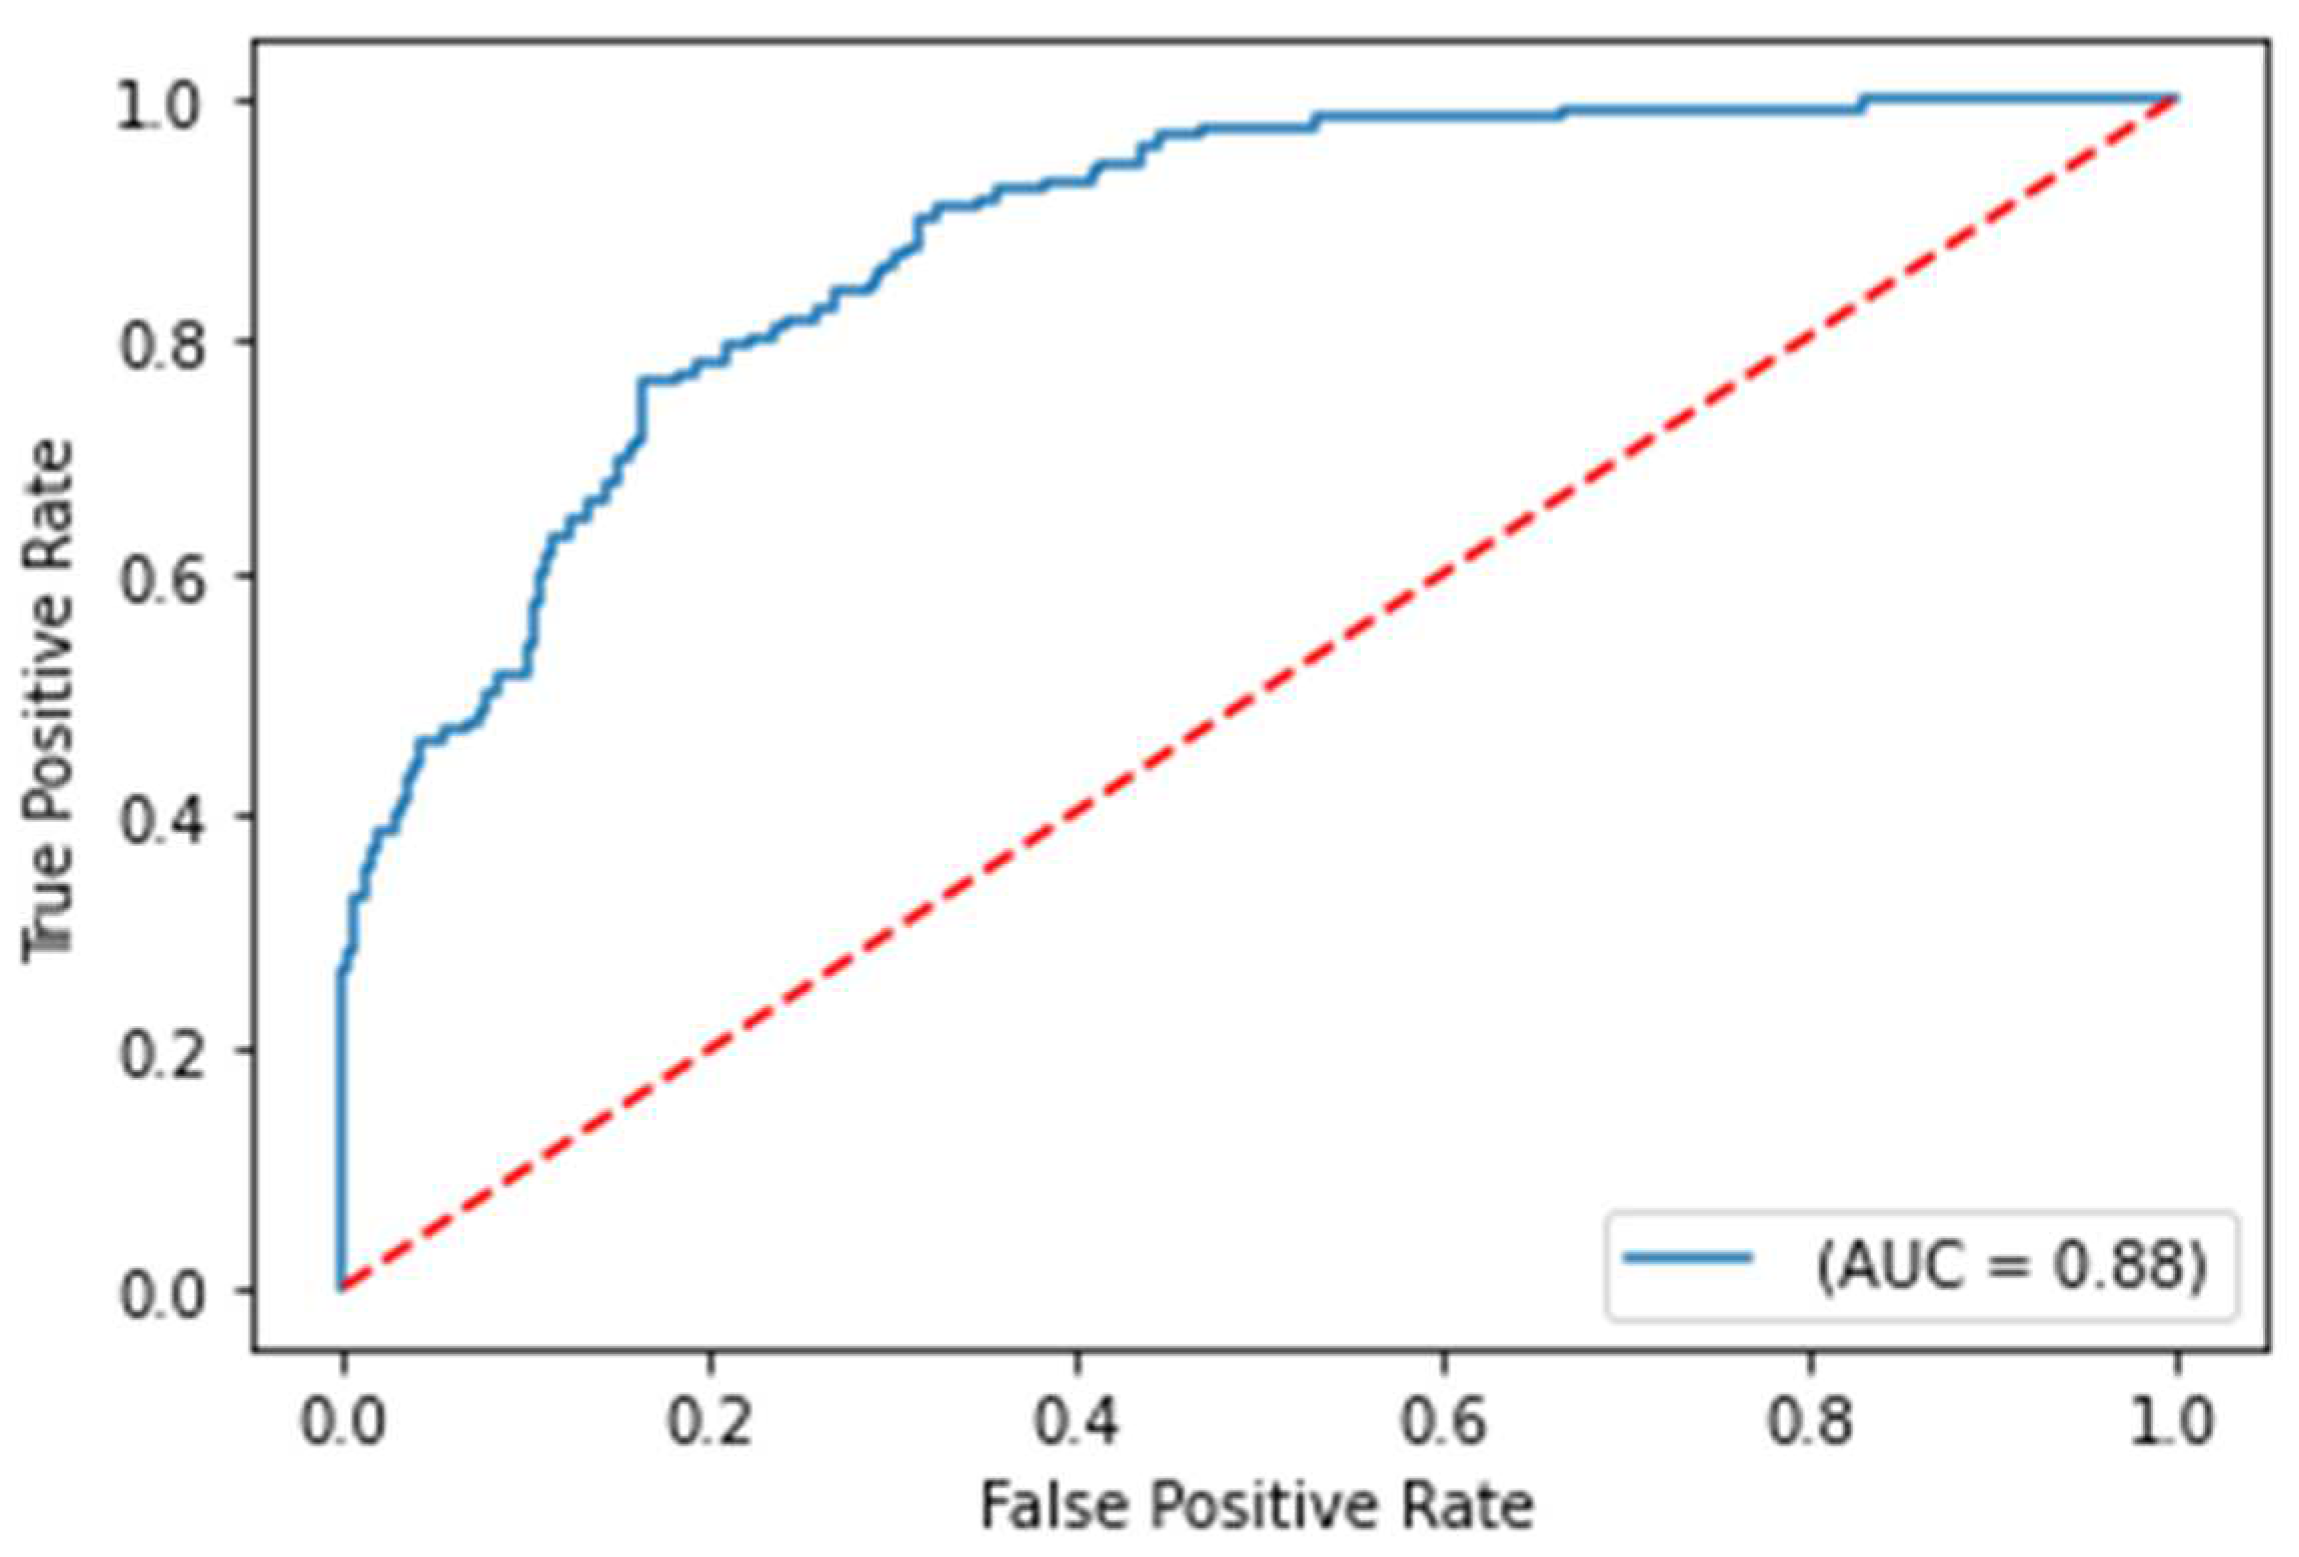
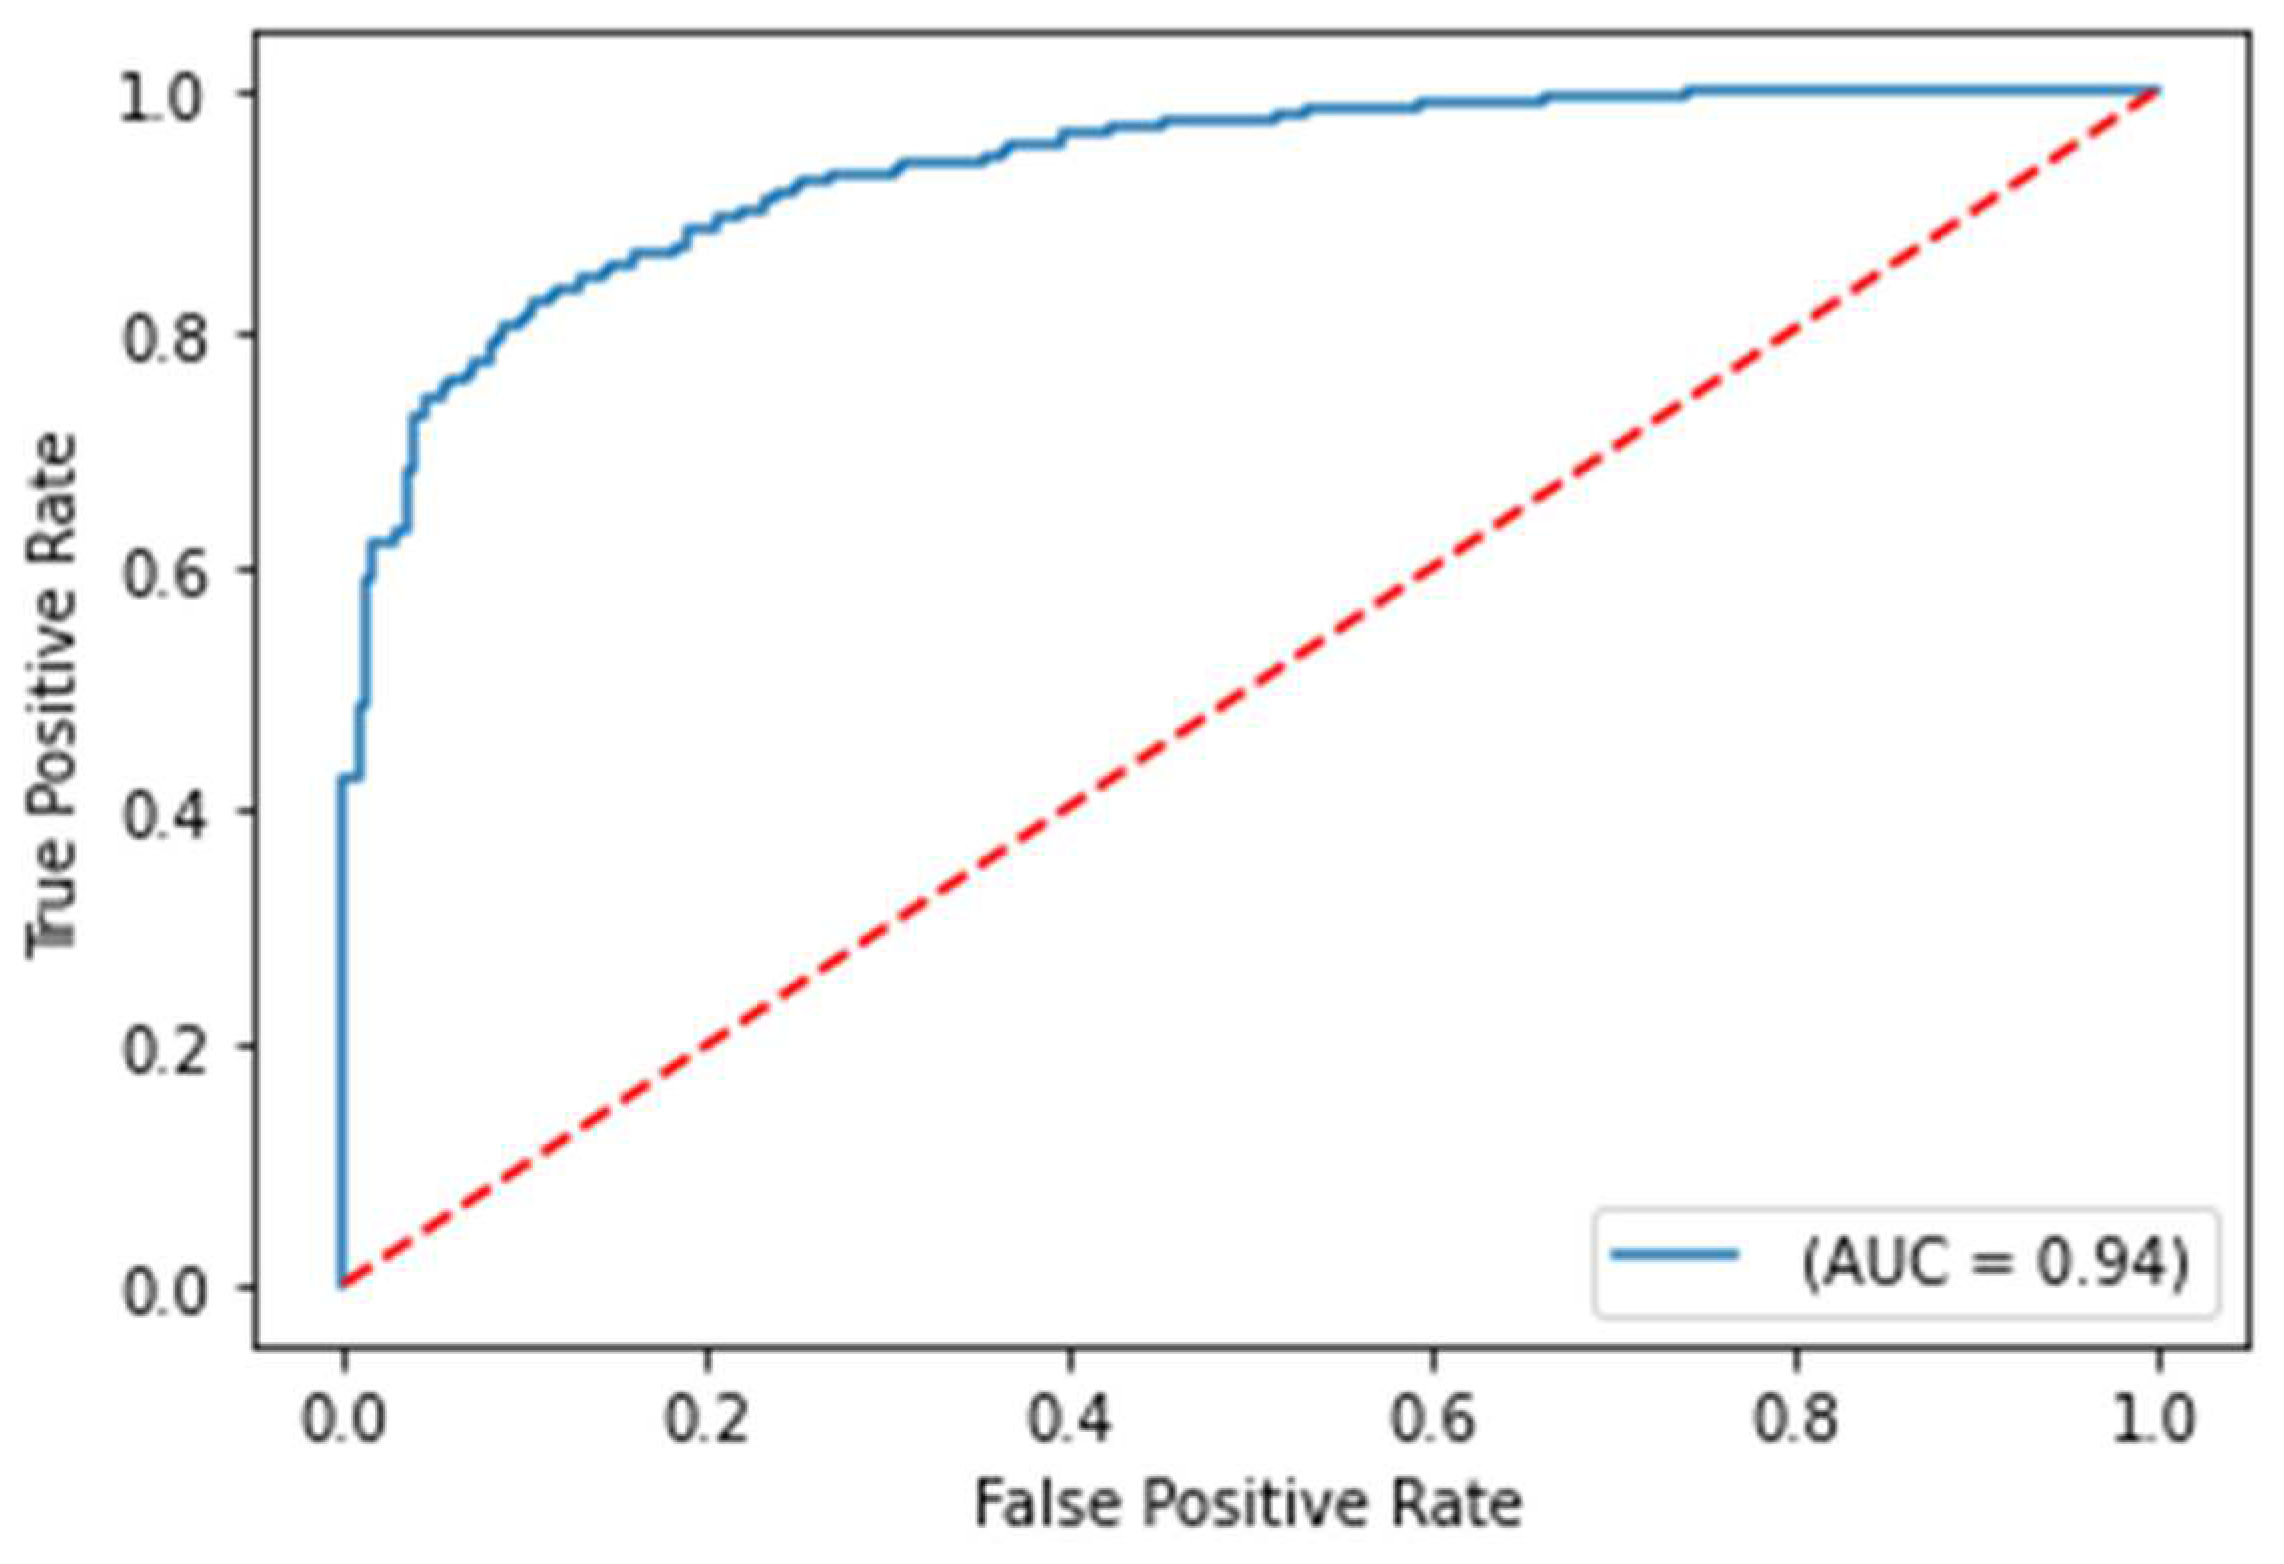
In the next use case, training data was also modified only to include patients with no comorbidities to assess if similar biomarker-based features for non-comorbidity patients are representative of predicting COVID-19 case severity and survival for a cohort containing both comorbidity and non-comorbidity patients within the same test set. With this data filtering, the training set was reduced by 63%, making it reasonable for the evaluation metrics to drop. The results of this training data modification are shown in
Table 2.
Figure 5.
ROC curve on the test set for COVID-19 survival prediction model with comorbidities removed from the training set
Figure 5.
ROC curve on the test set for COVID-19 survival prediction model with comorbidities removed from the training set
Despite using a modified training set, the model performance results still demonstrate a robust test ROC-AUC score of 93.5% for predicting the severity of COVID-19. This suggests that the features without comorbidities remain highly indicative of COVID-19 case severity, regardless of whether the patients have comorbidities or not. However, the ROC-AUC score for the COVID-19 survival models is significantly lower with the training set adjustment, which indicates that certain comorbidities are strongly correlated with survival. These results suggest that it is unlikely to observe strong influence of comorbidity features through the model explainability analysis for the COVID-19 severity model. However, impactful comorbidity features such as coronary artery disease and diabetes from model explainability analysis for the COVID-19 survival model can be noted during analysis.
3.2. Patient biomarker analysis
3.2.1. Clinical biomarker evaluation
As high performance for both COVID-19 severity and survival models were achieved, model explainability analysis allowed evaluation of the biomarker values that are highly correlated with more severe COVID-19 cases and least survival of COVID-19. Model explainability was achieved through SHAP (SHapley Additive exPlanations) analysis, which is an approach to explain the output of any machine learning model based on game theory that infers model interpretation of specific feature values based on the impact that they have on the model itself [
29]. Specific feature values are transformed into SHAP values to measure the impact on the model prediction. Equation 1 below shows calculation of the SHAP value for the nth feature among N feature subsets, given a feature subset without the nth feature (S), the total number of features (F), and the predictive model (M):
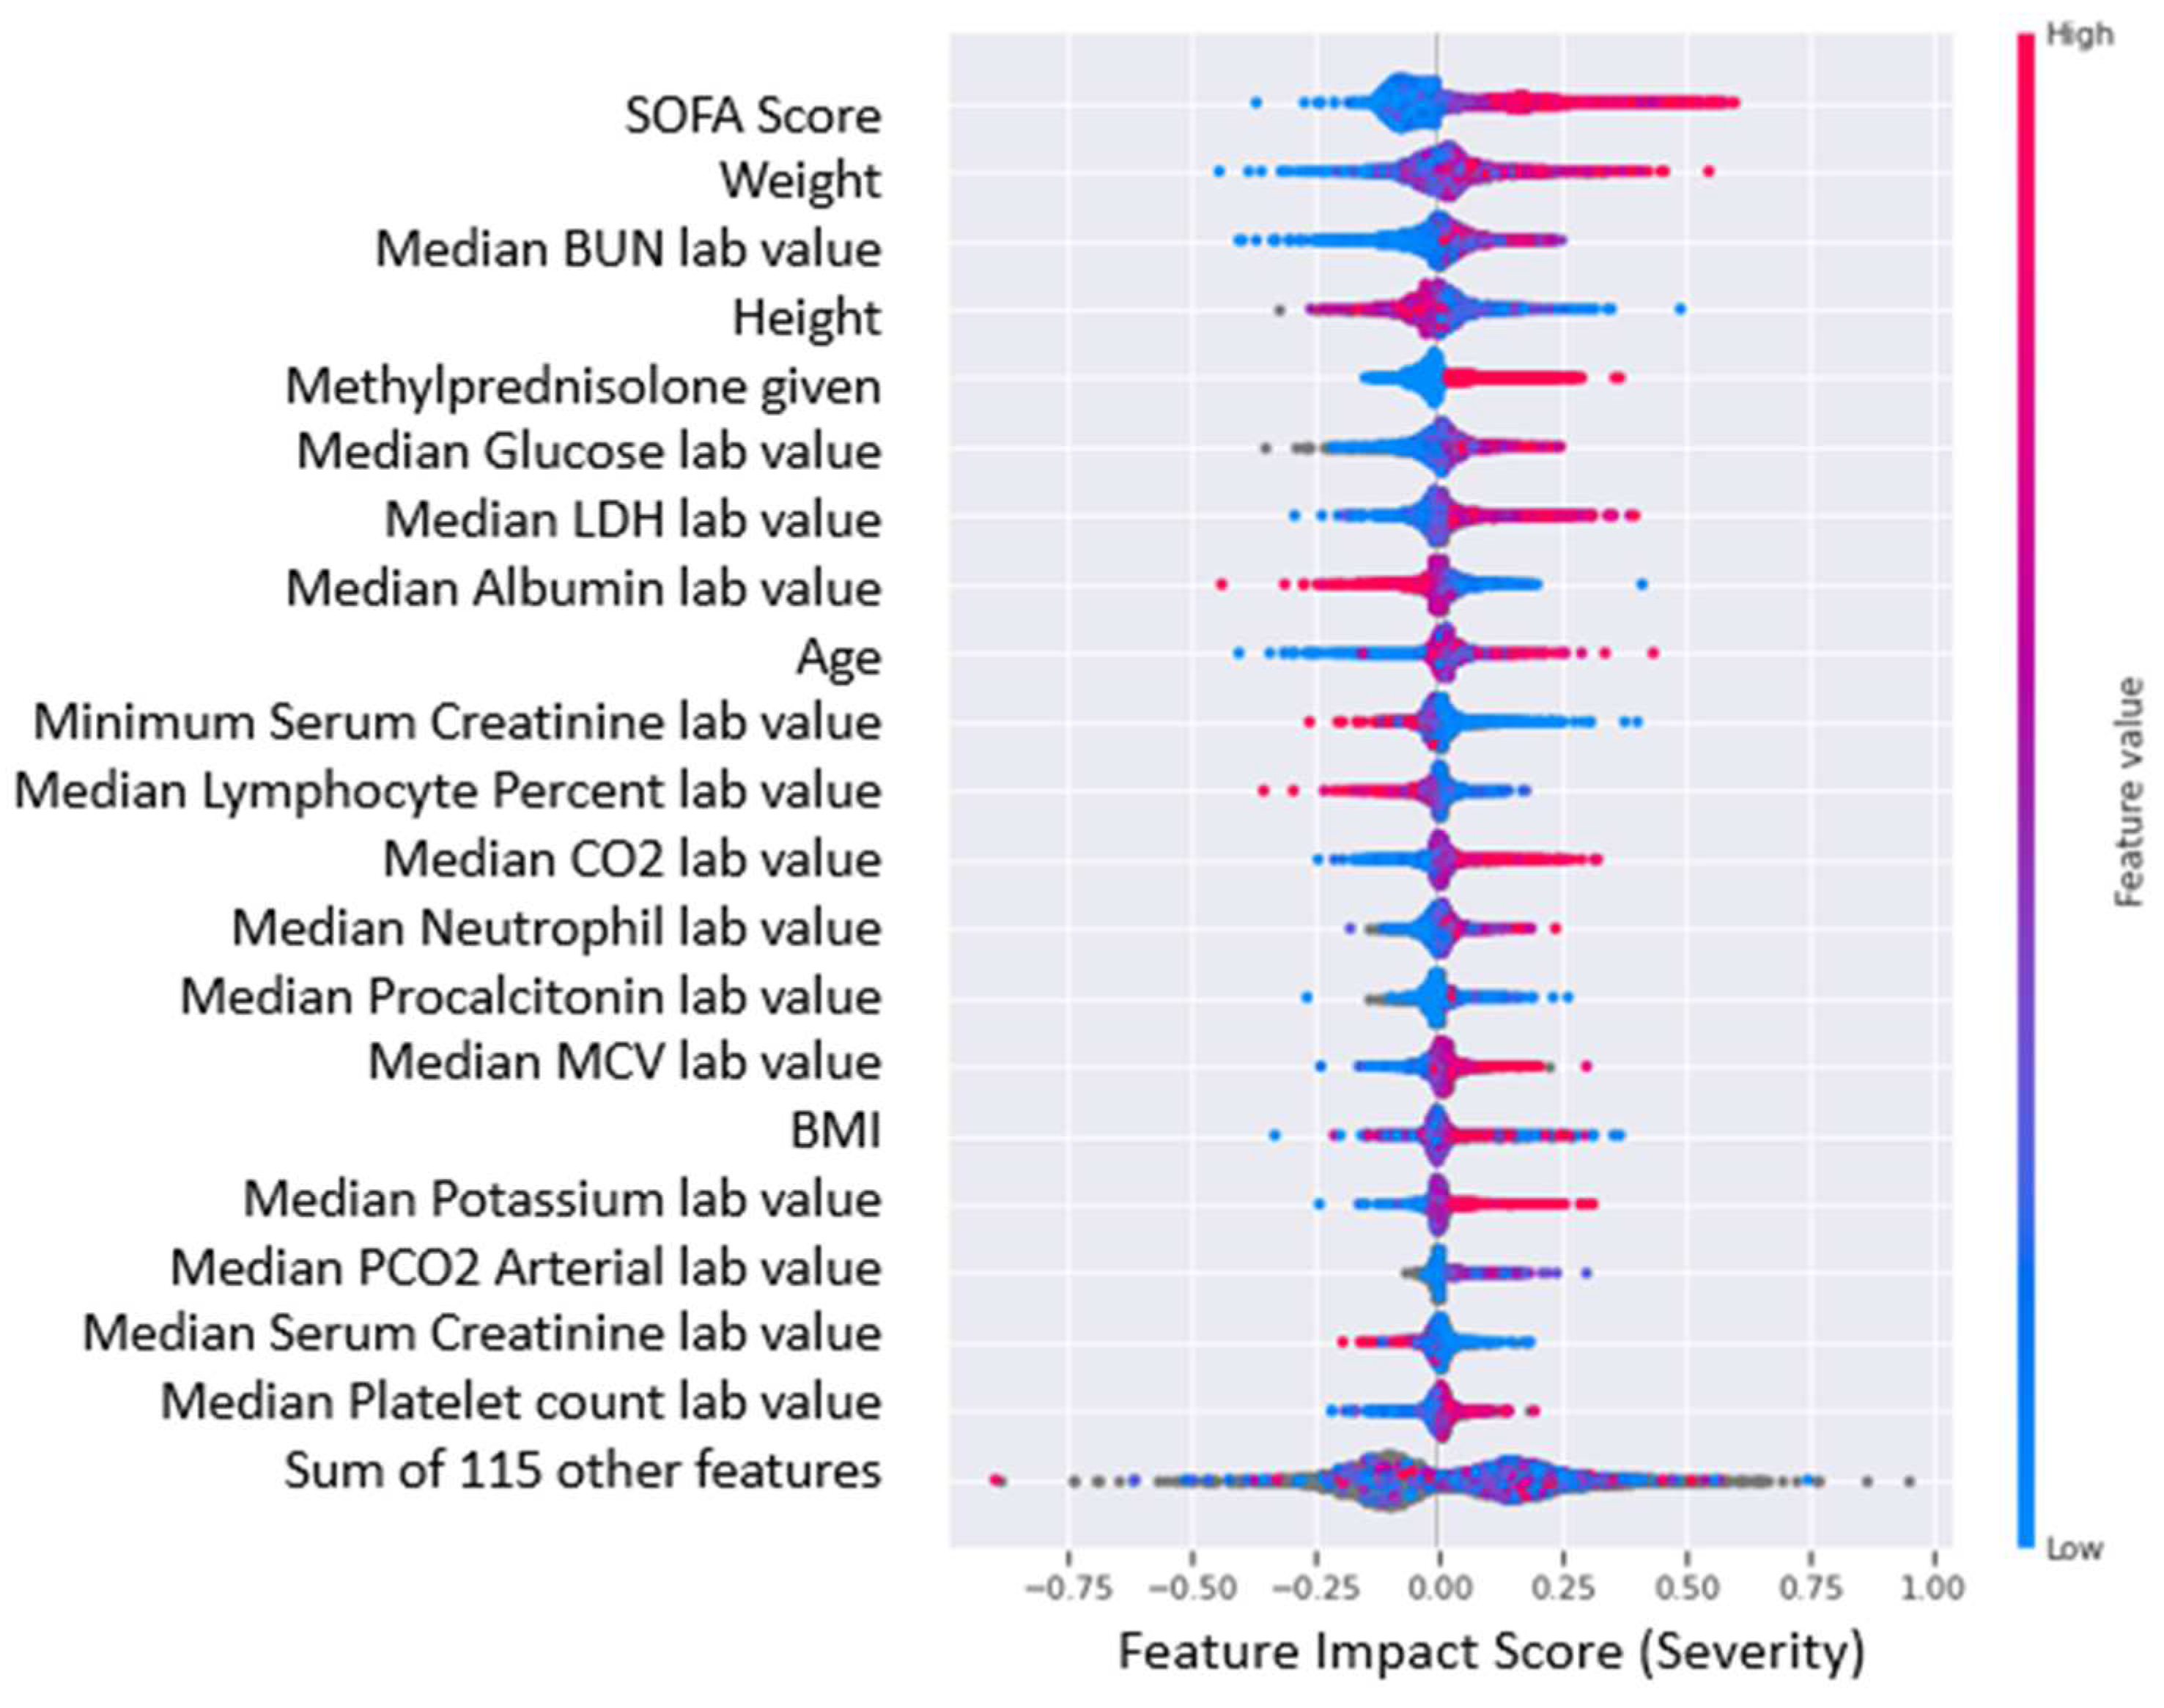
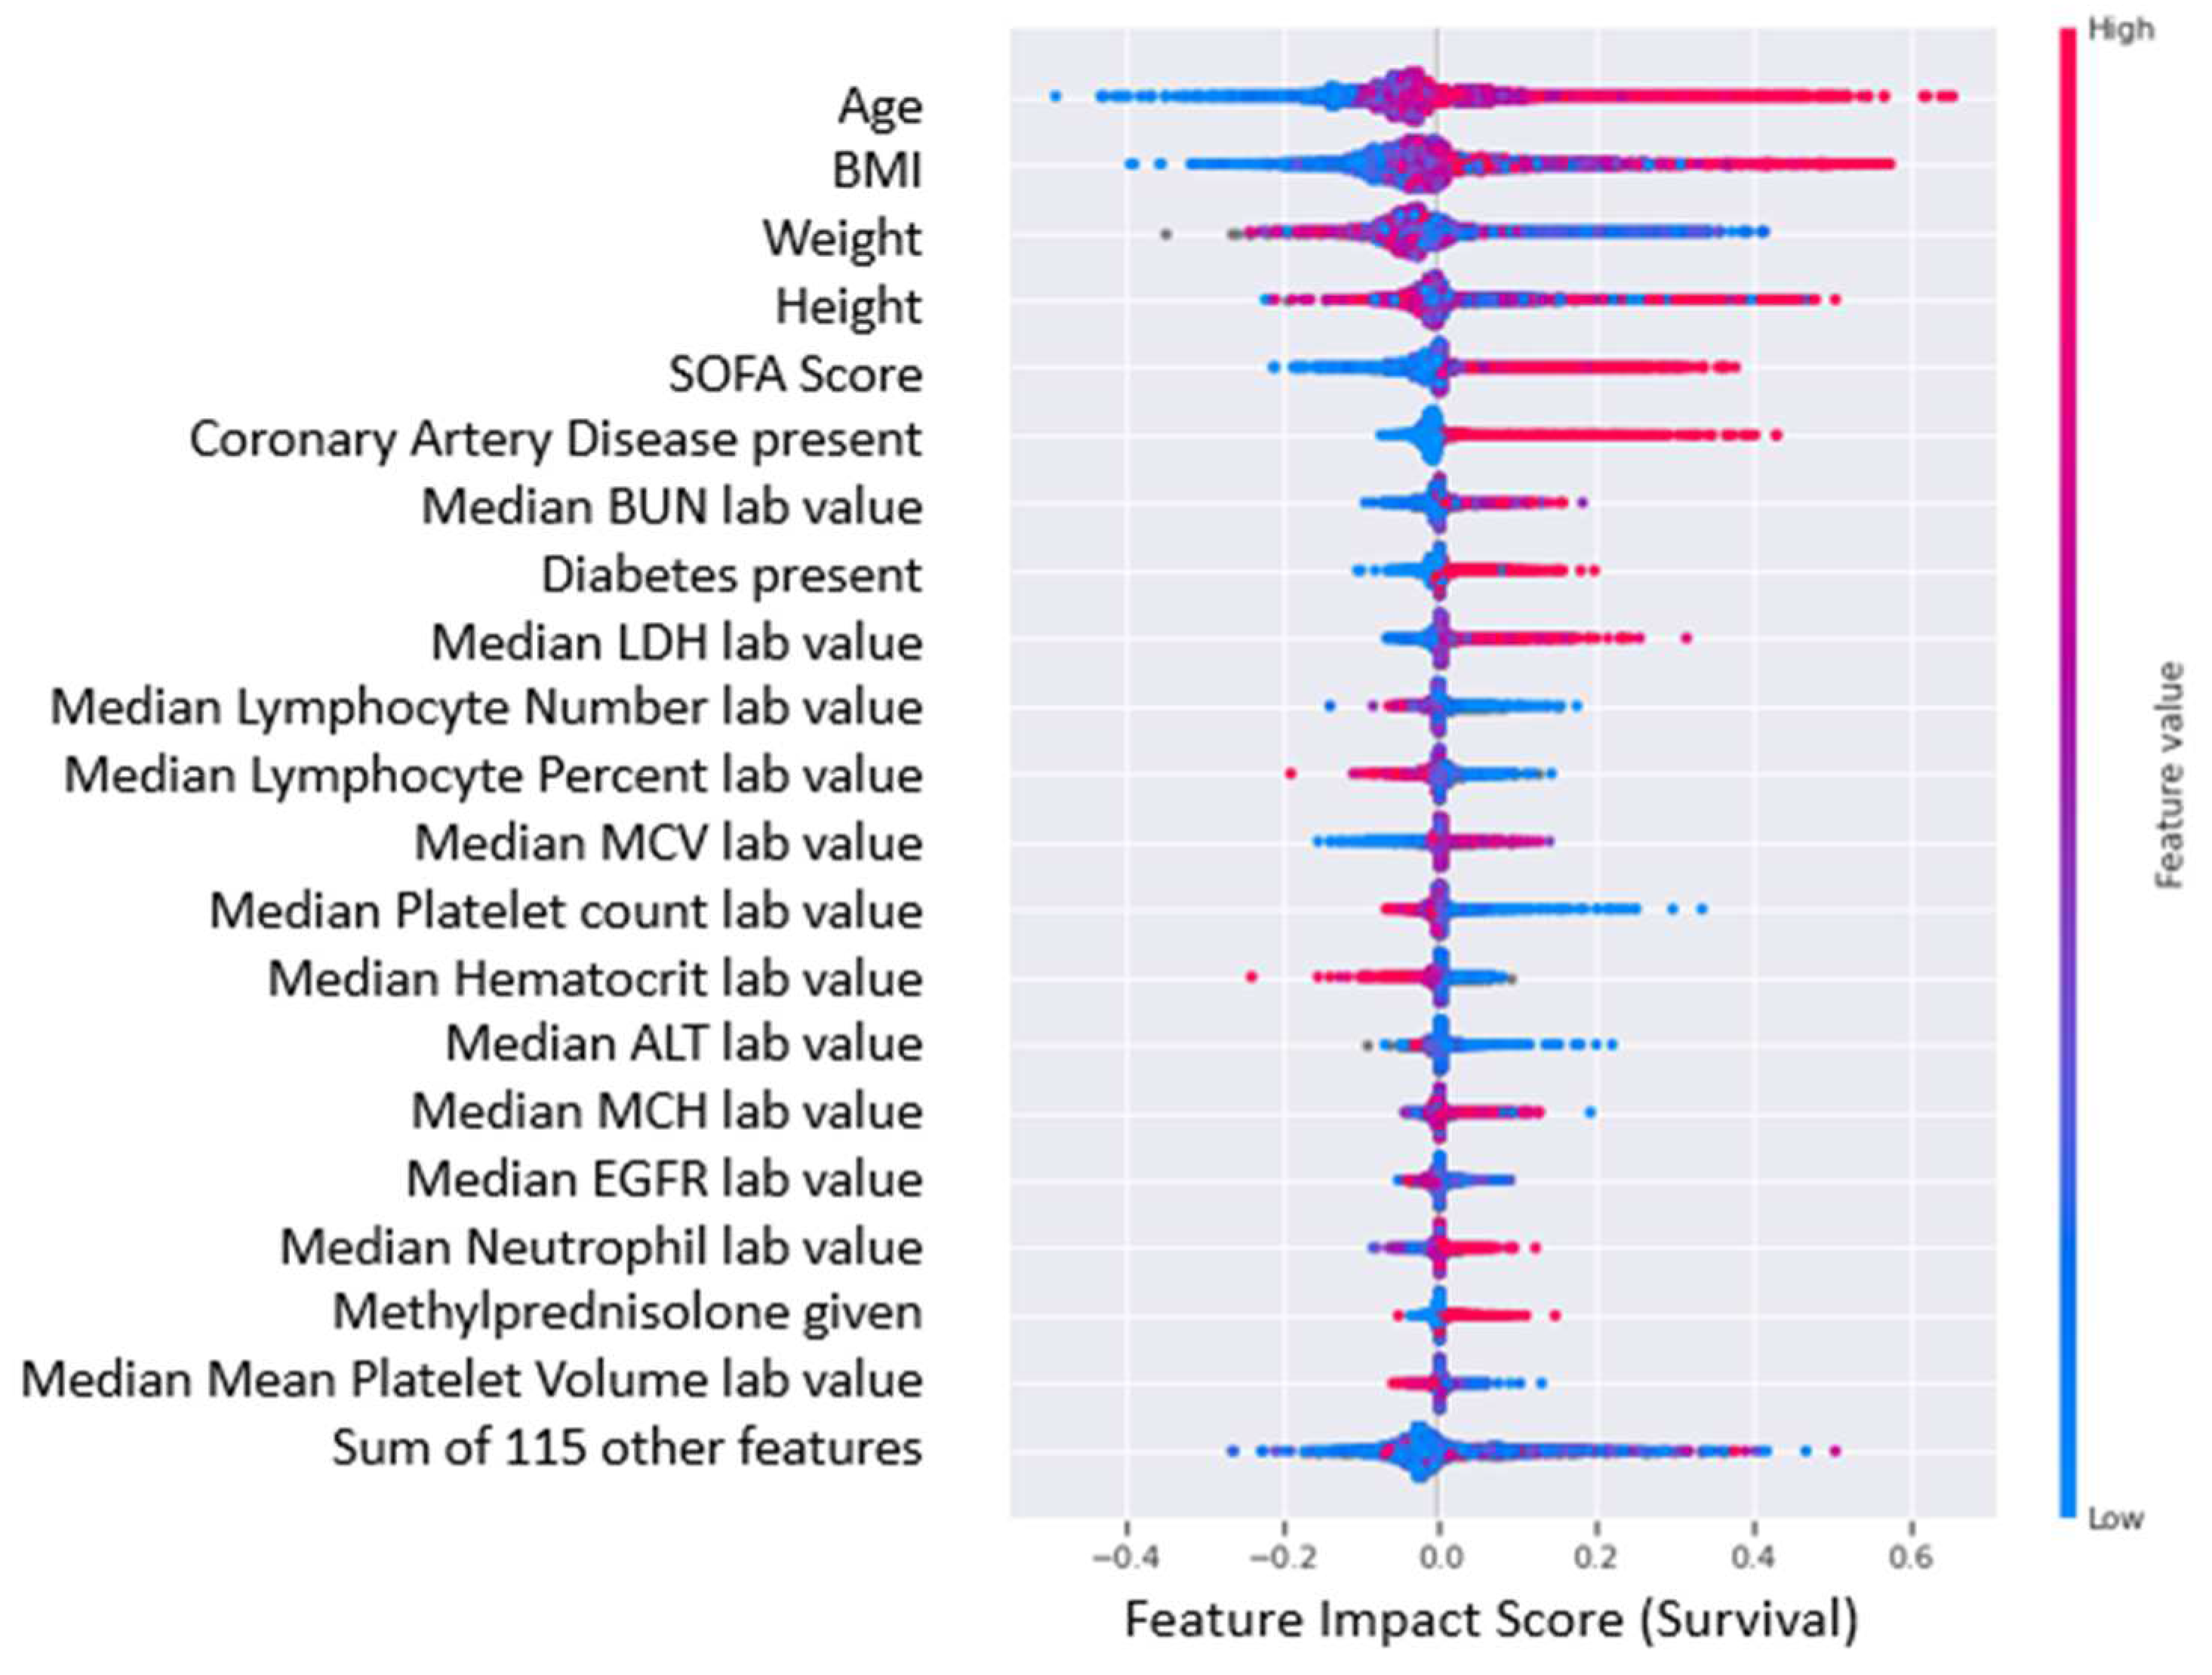
The feature impact scores interpolated from SHAP values for the top 20 most impactful features of the COVID-19 severity and survival predictive models are shown in
Figure 6 and
Figure 7, where higher feature impact scores indicated whether higher or lower feature values were correlated with more severe COVID-19 cases and lower chance of survival from COVID-19.
As implied by the results presented earlier, there were no significant comorbidity-based features in the COVID-19 severity model. However, it was interesting to note that the presence of comorbidities, coronary artery disease and diabetes were strongly correlated with low survival. Moreover, there has been evidence to suggest the presence of coronary artery disease [
30] and diabetes [
31] is a predictor for both COVID-19 severity and mortality. It is also interesting to note that patients who had been given methylprednisolone had a higher probability of having a severe case and lower survivability. Although there is no established link between the identified medication and COVID-19 severity or patient survival in the clinical dataset, it would be valuable to examine the medication's impact when used in conjunction with insights from impactful biomarkers. Furthermore, this is particularly relevant given that steroid anti-inflammatory drugs are frequently given to patients with severe and critical respiratory infections [
32]. It is highly possible that severe patients were given the medication as a potentially preventive measure; however, from the analysis there is no indication of any positive or negative effect on their survival or severity.
Beyond comorbidities and medications, the following features, included biomarkers, have a specific pattern associated with severe COVID-19 cases and lower survival predicted by our AI/ML driven platform were further validated by external studies:
Sequential Organ Failure Assessment (SOFA) Score: Higher SOFA score values are associated with more severe cases and lower survival [
33]
Lactate Dehydrogenase (LDH): Higher presence of LDH is associated with more severe cases and lower survival [
34]
Blood Urea Nitrogen (BUN): Higher presence of BUN is associated with more severe cases and lower survival especially with lower Serum Creatinine levels [
35] and lower Albumin levels [
36]
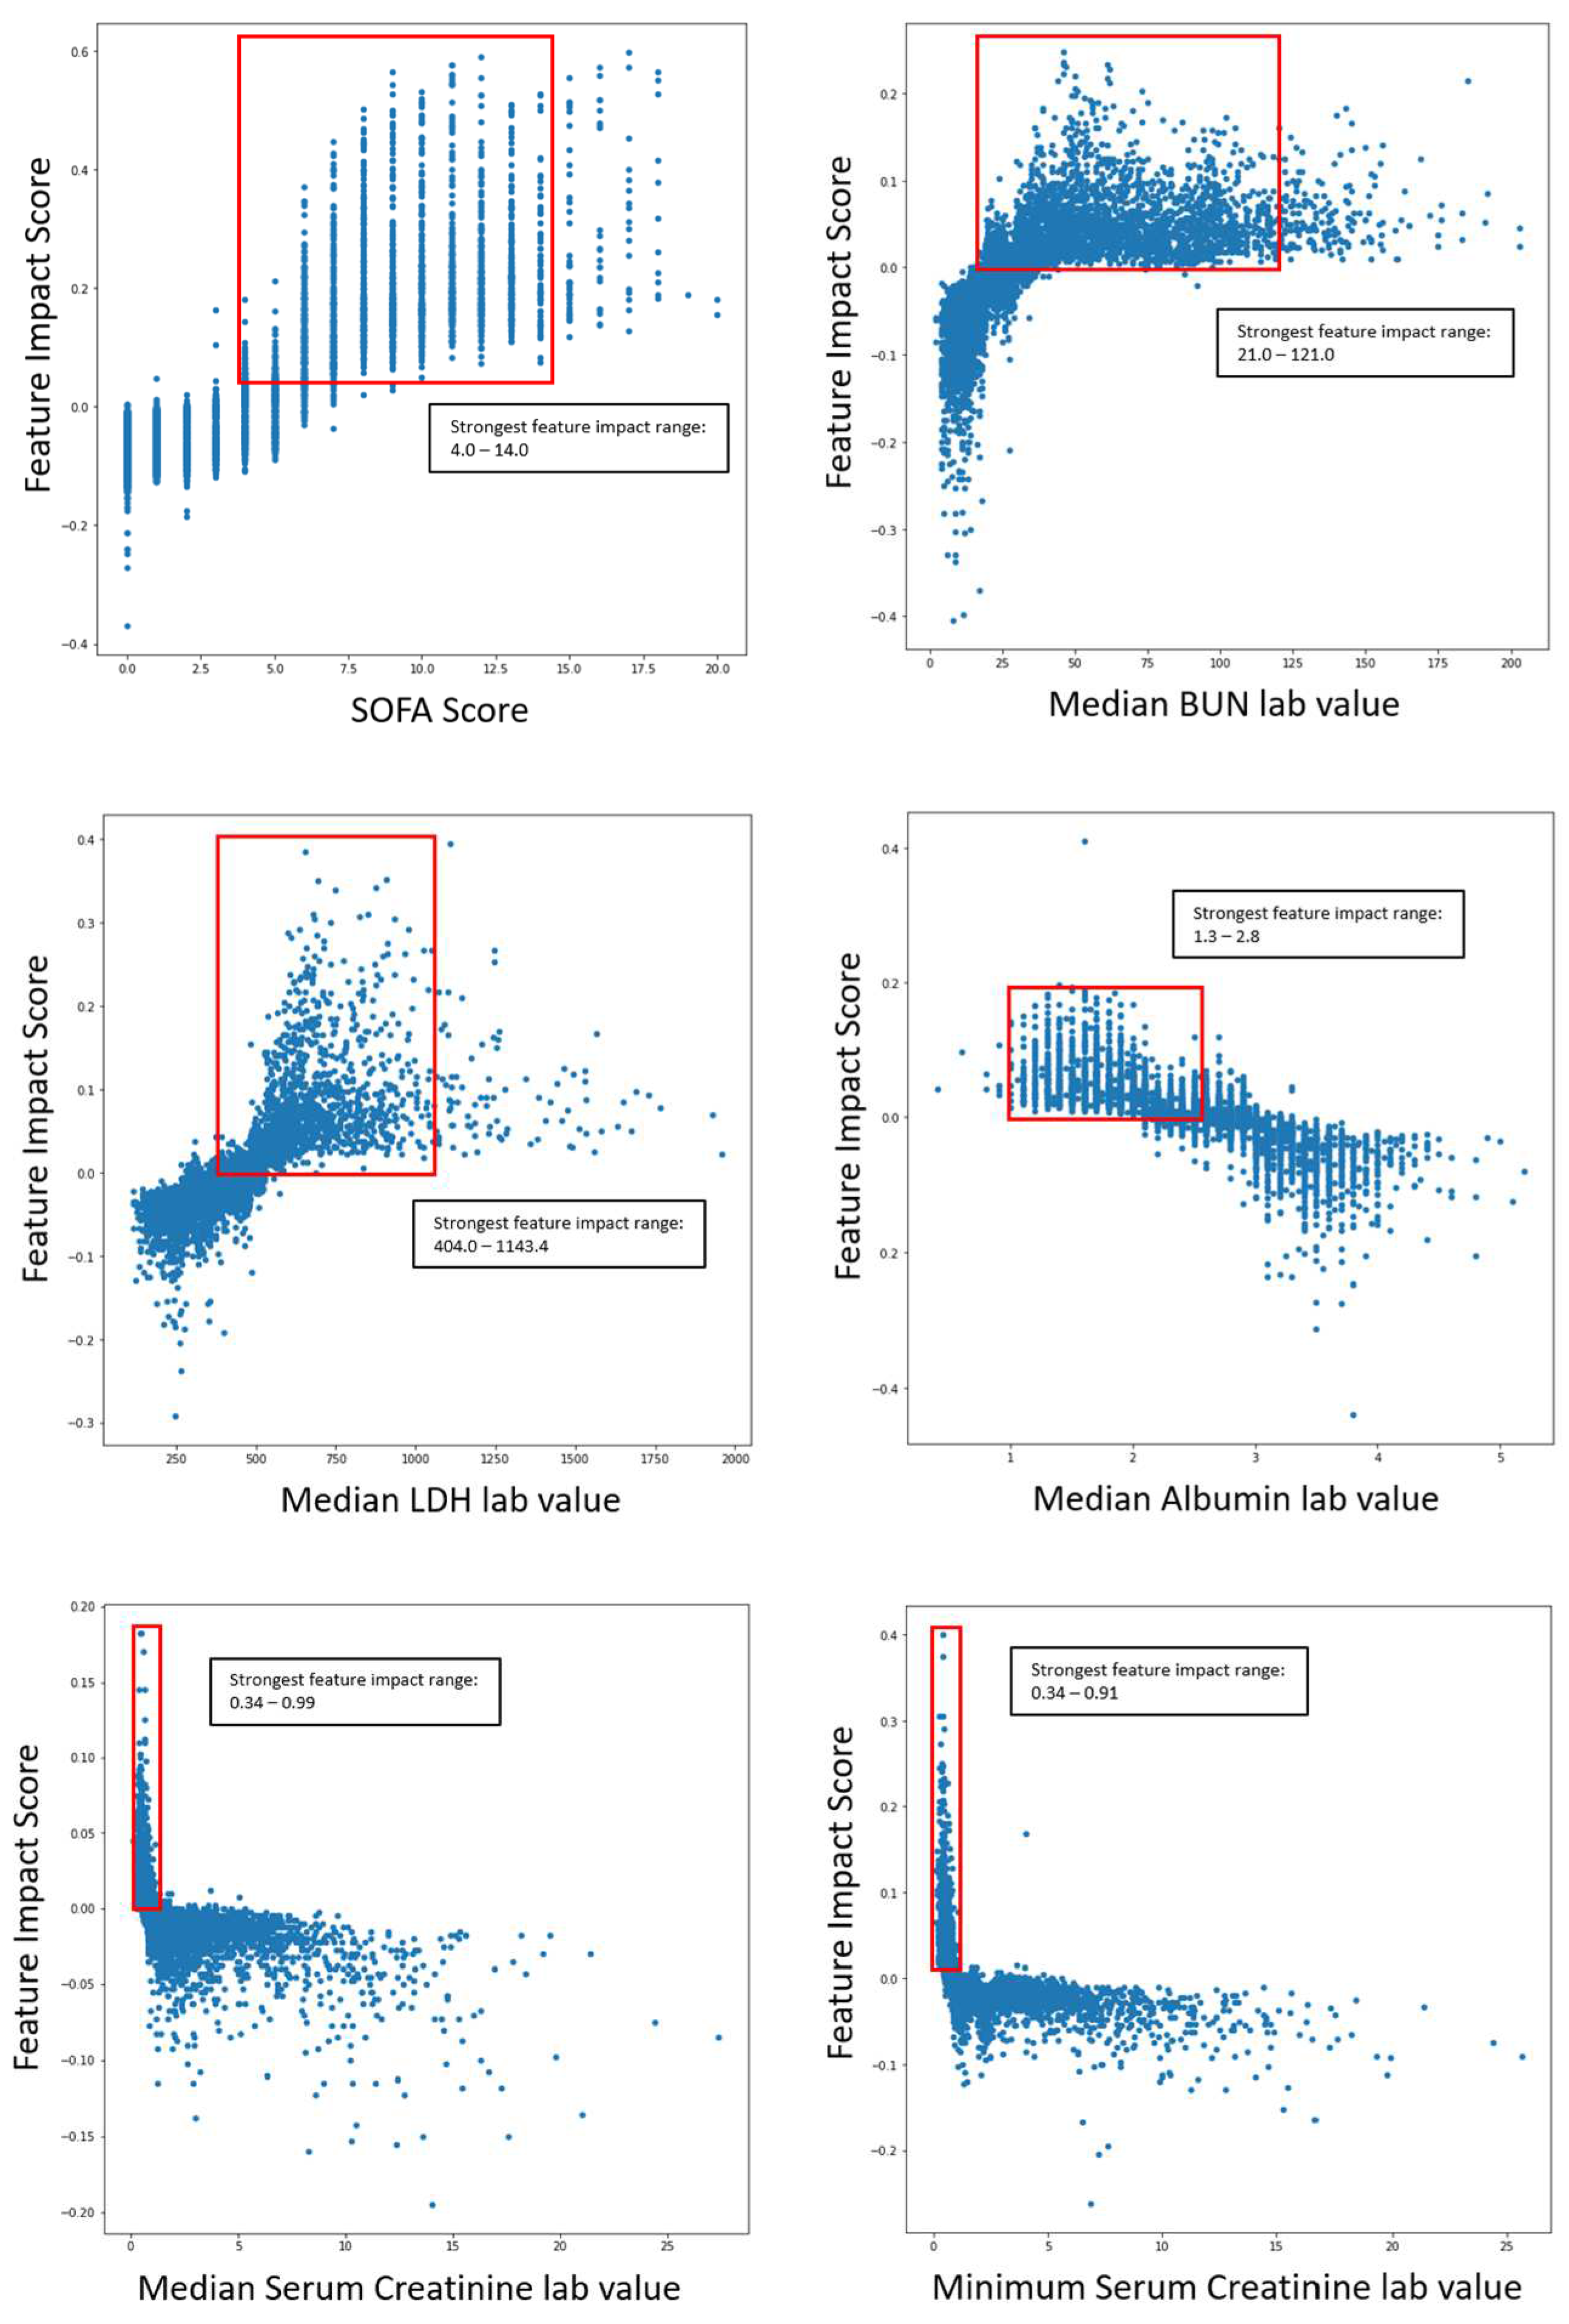
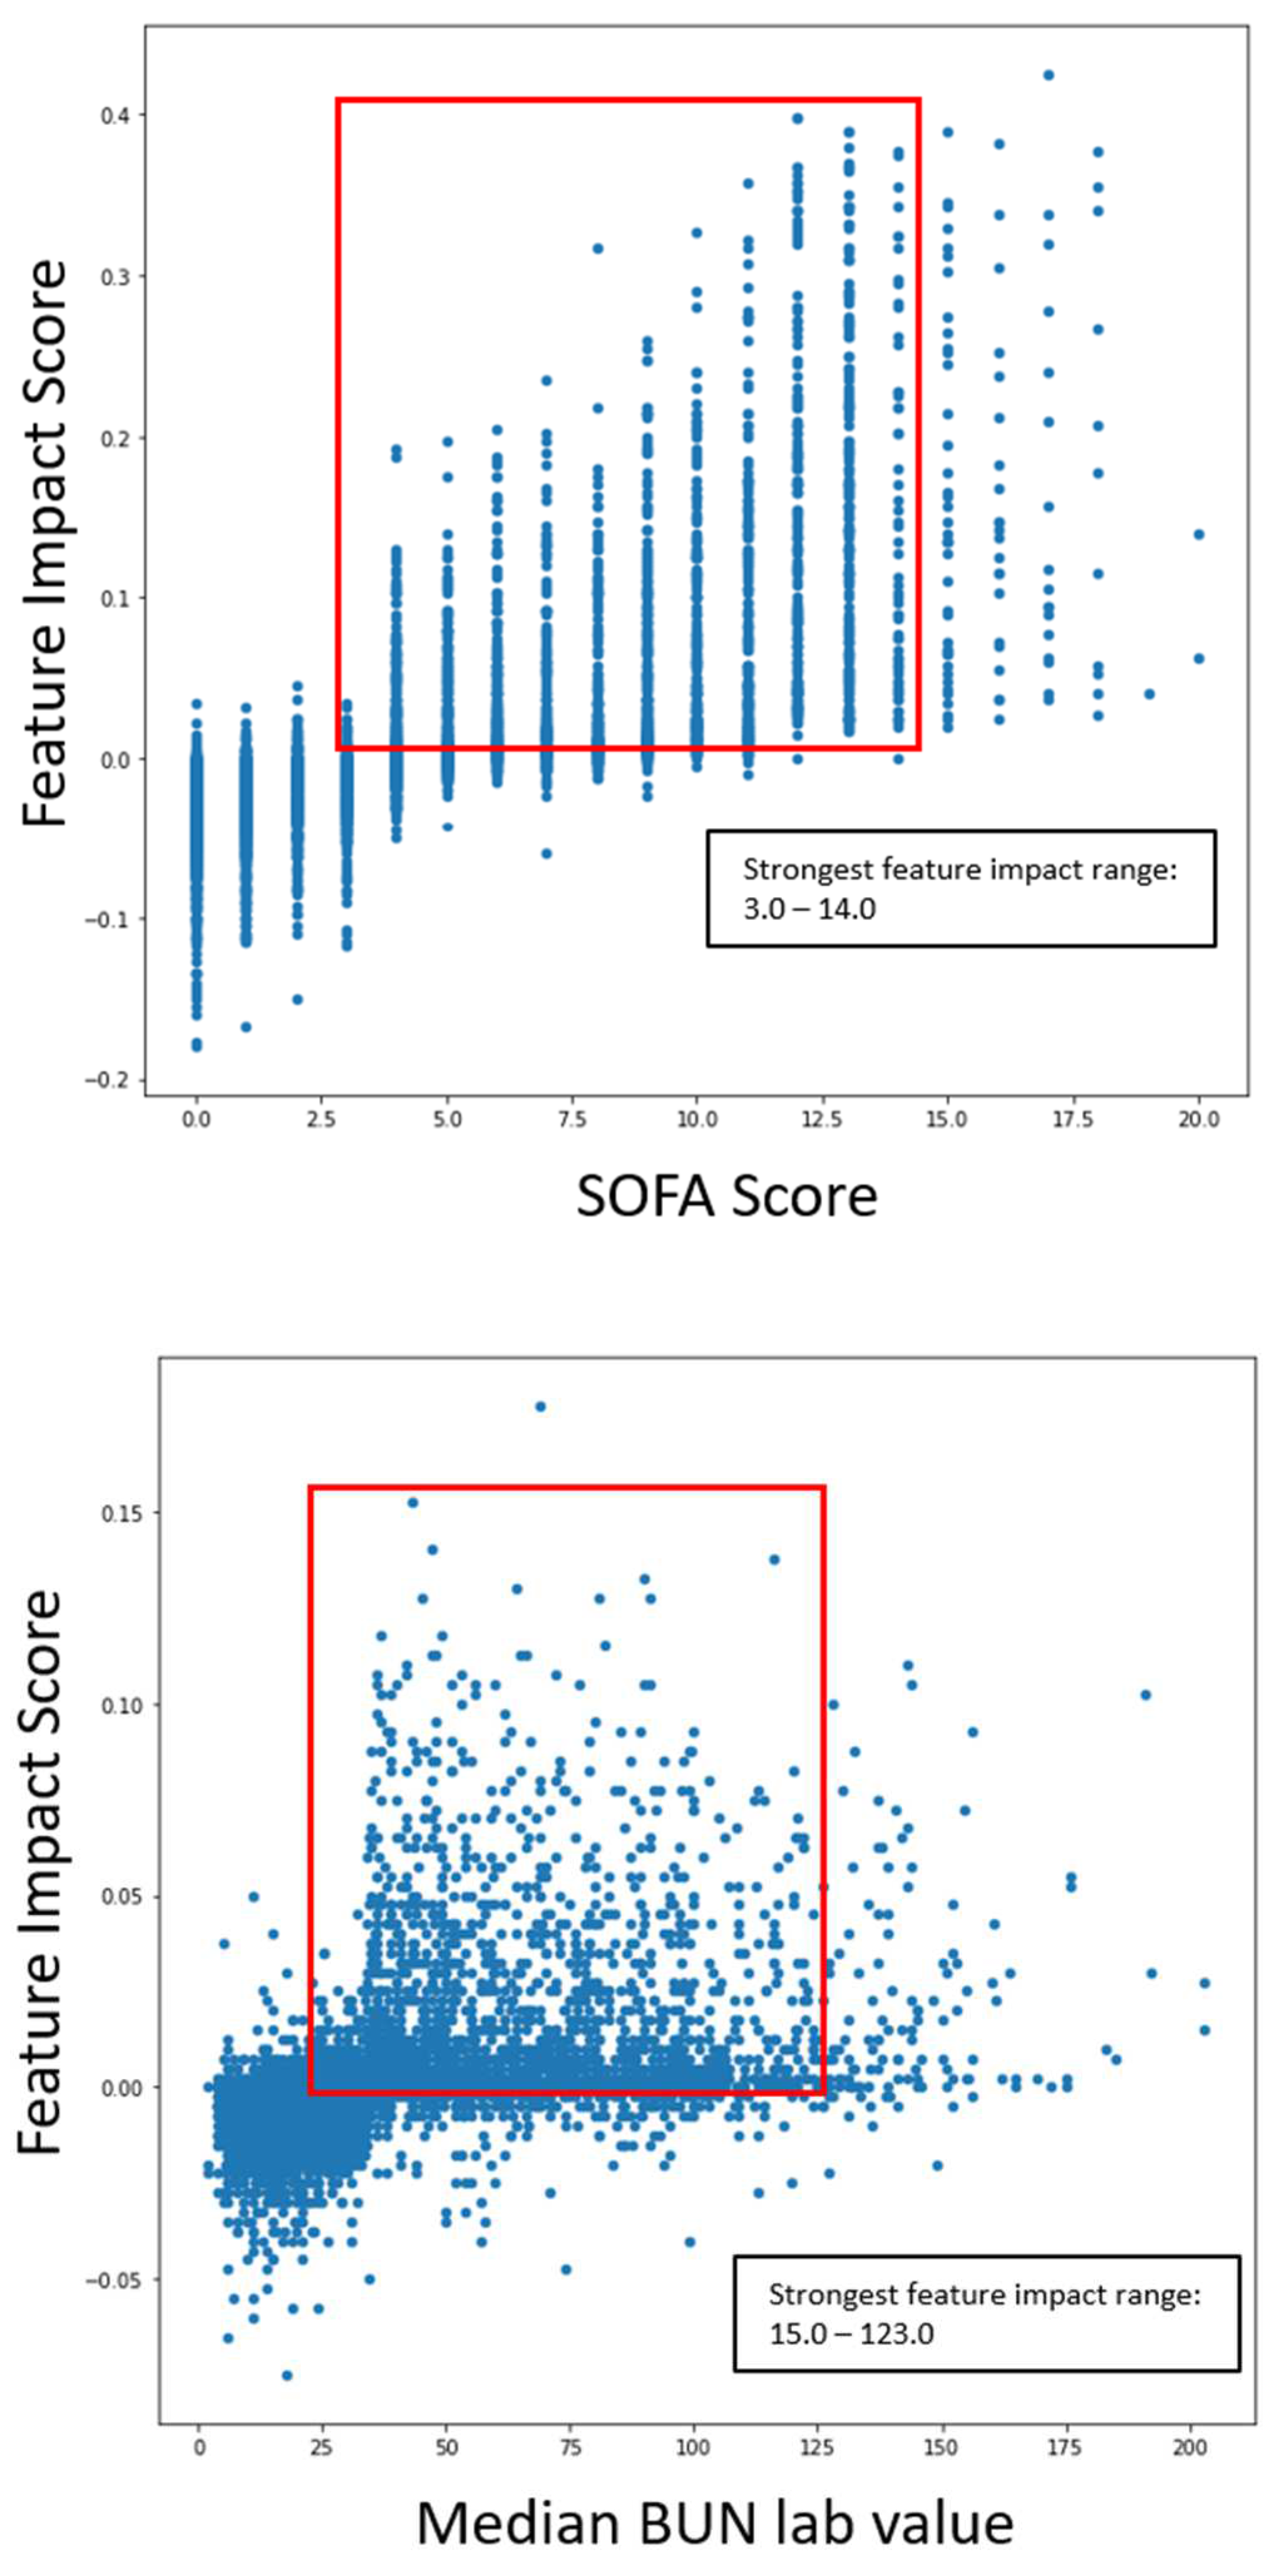
The following graphs shown in
Figure 8 outlines the specific range of values within scatter plots for impactful features as it pertains to COVID-19 severity.
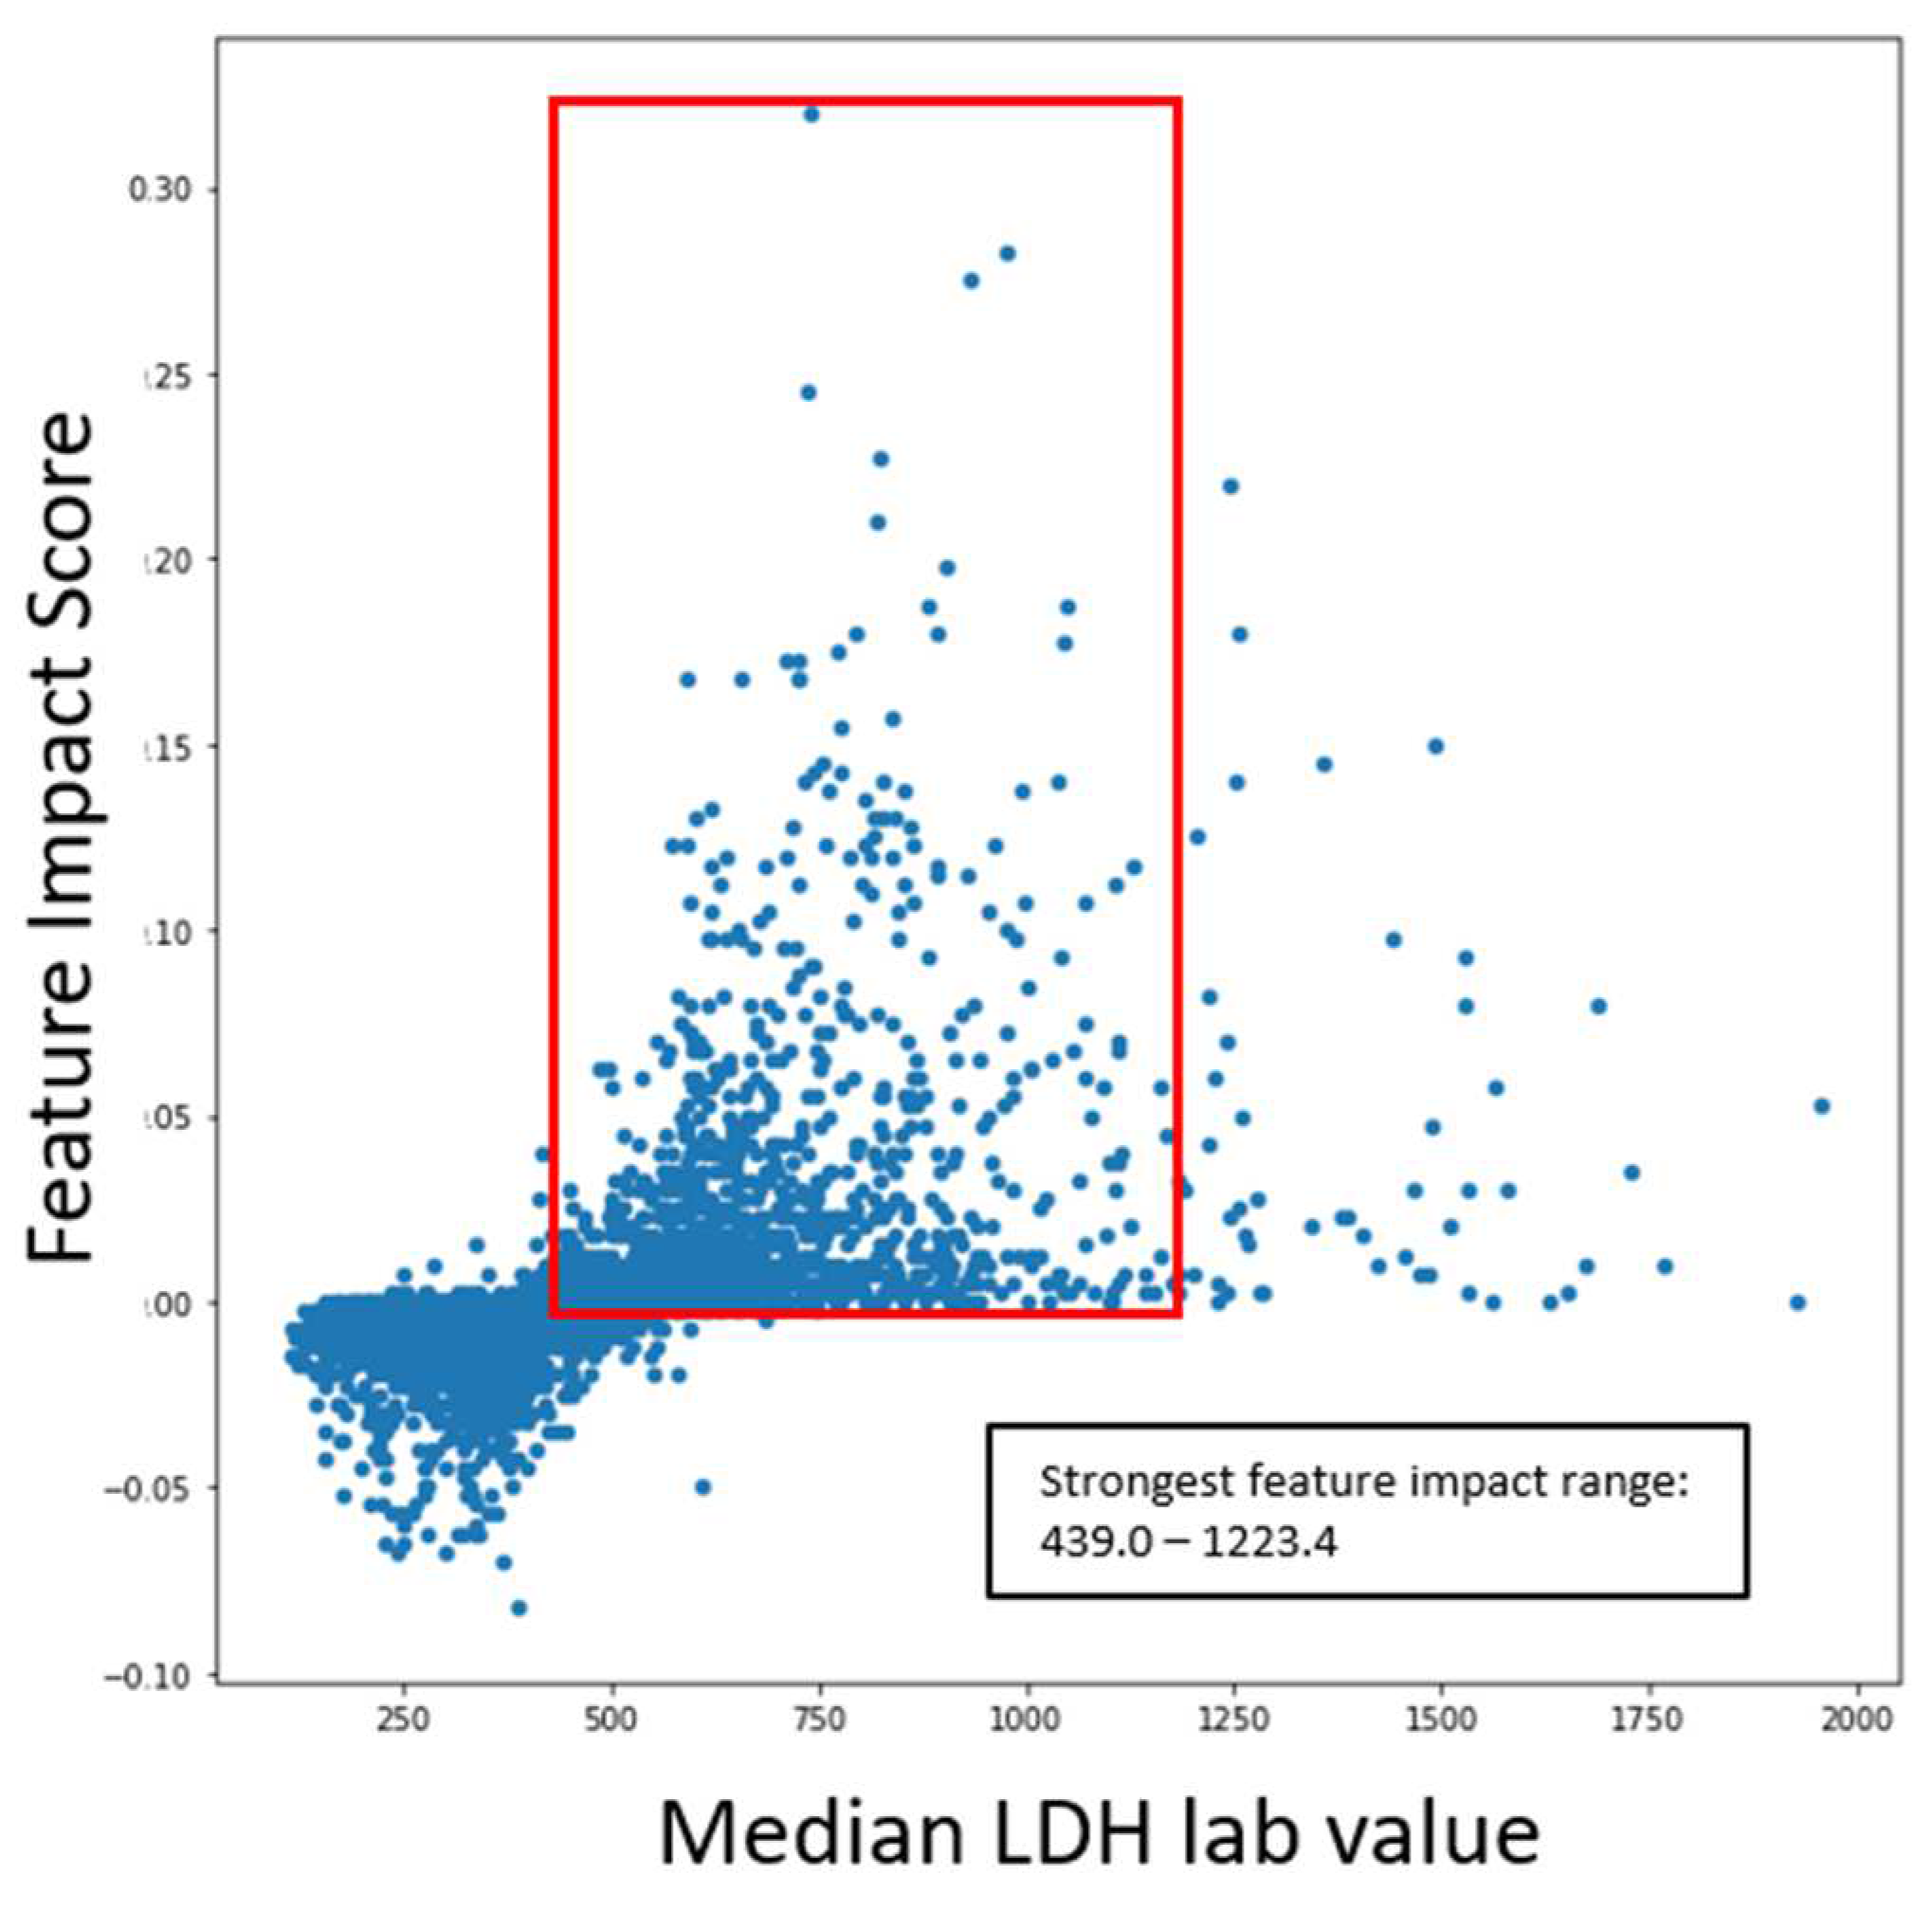
The ranges of values were calculated by measuring the 5th and 95th quantile of biomarker values when severity was high. The same logic was applied to survival models. The following graphs in
Figure 9 outline the specific range of values within scatter plots for impactful features concerning COVID-19 survival.
The scatter plots indicated the clear correlation between certain biomarker ranges and feature impact on each respective model. These validated features were selected for the gene correlation analysis to see what specific group of genes were associated with the upregulation of the given features.
With the generated SHAP values (feature impact scores) for each given feature value, a clustering analysis was done to see how patients were grouped with varying biomarker levels. The clustering analysis was done on feature impact scores based on the COVID-19 severity model explainability analysis. The elbow method [
37] was used to determine the optimal number of clusters, and K-Means clustering was the clustering modality that generated the final clusters. Observations for each cluster and biomarker box plots are shown in (
Supplementary Table S7, Supplementary Figure S1). It is worth noting that the distinction between the clusters were due to varying levels of the body weight, SOFA score, BUN, serum creatinine, LDH, albumin, PCO2 arterial, potassium levels, and lymphocyte count percent. Despite not showing any significant biomarker variation compared to the norm, Cluster 5 had a high percentage of severe COVID-19 cases among the patient group, with 93.1% affected. This suggests several less impactful biomarkers may have influenced the cluster's formation.
3.2.2. Omics data analysis of COVID19 patients
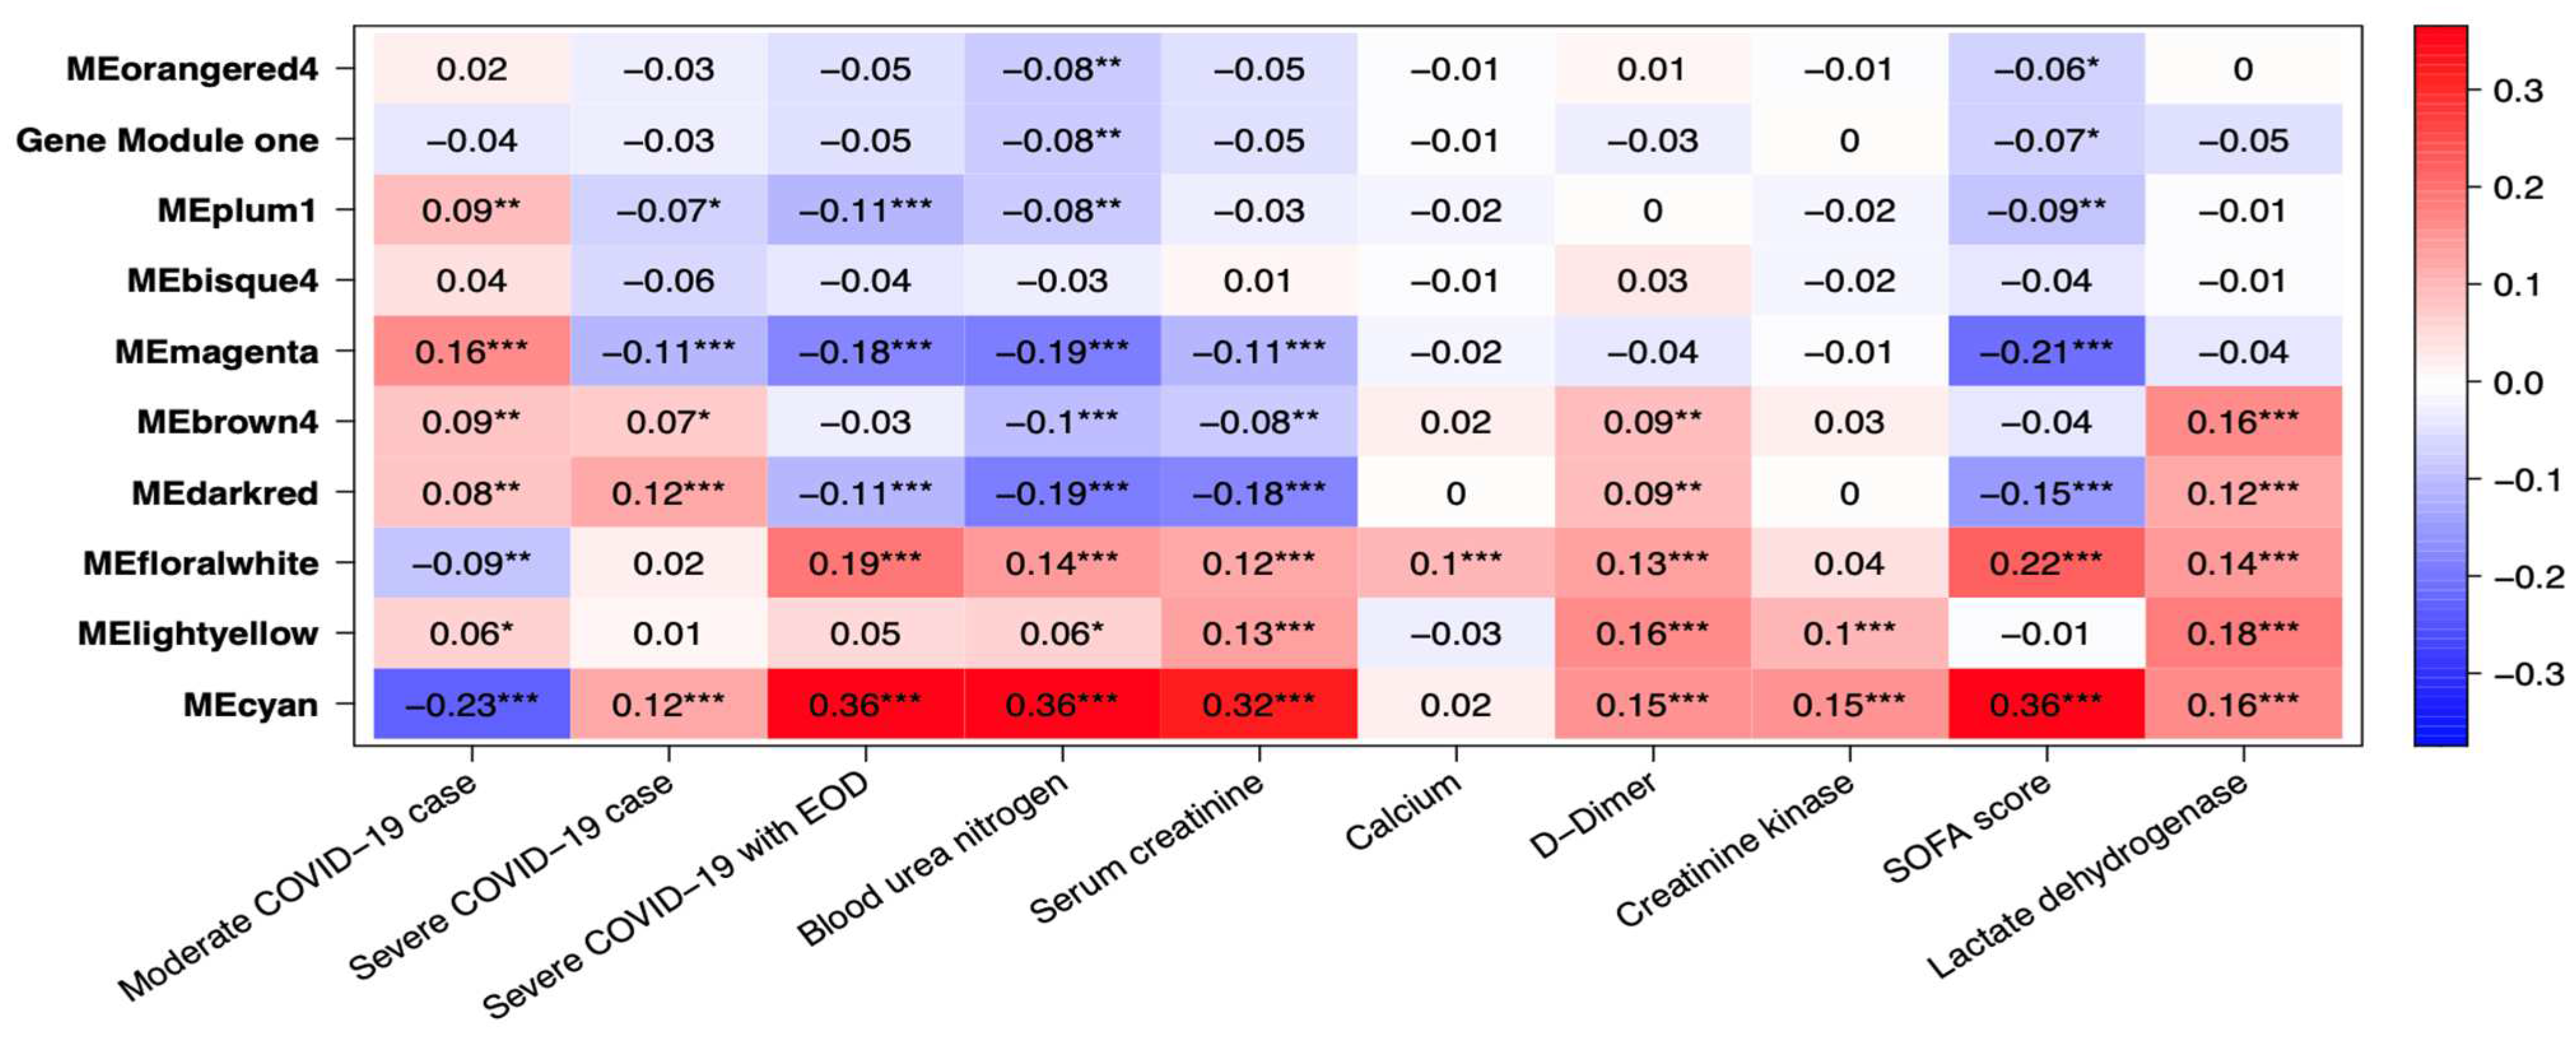
Several gene co-expression modules were identified through gene network analysis, with MEcyan and MEdarkred standing out for their strong correlation with several key traits. Of these two modules, MEcyan was particularly noteworthy, as it showed a significant positive correlation with COVID-19 severity, end of organ damage (EOD), clinical biomarkers like BUN, serum creatine, D-Dimer, creatine kinase, LDH, and SOFA score evaluation of patients. This finding aligns with the ML prediction referenced in
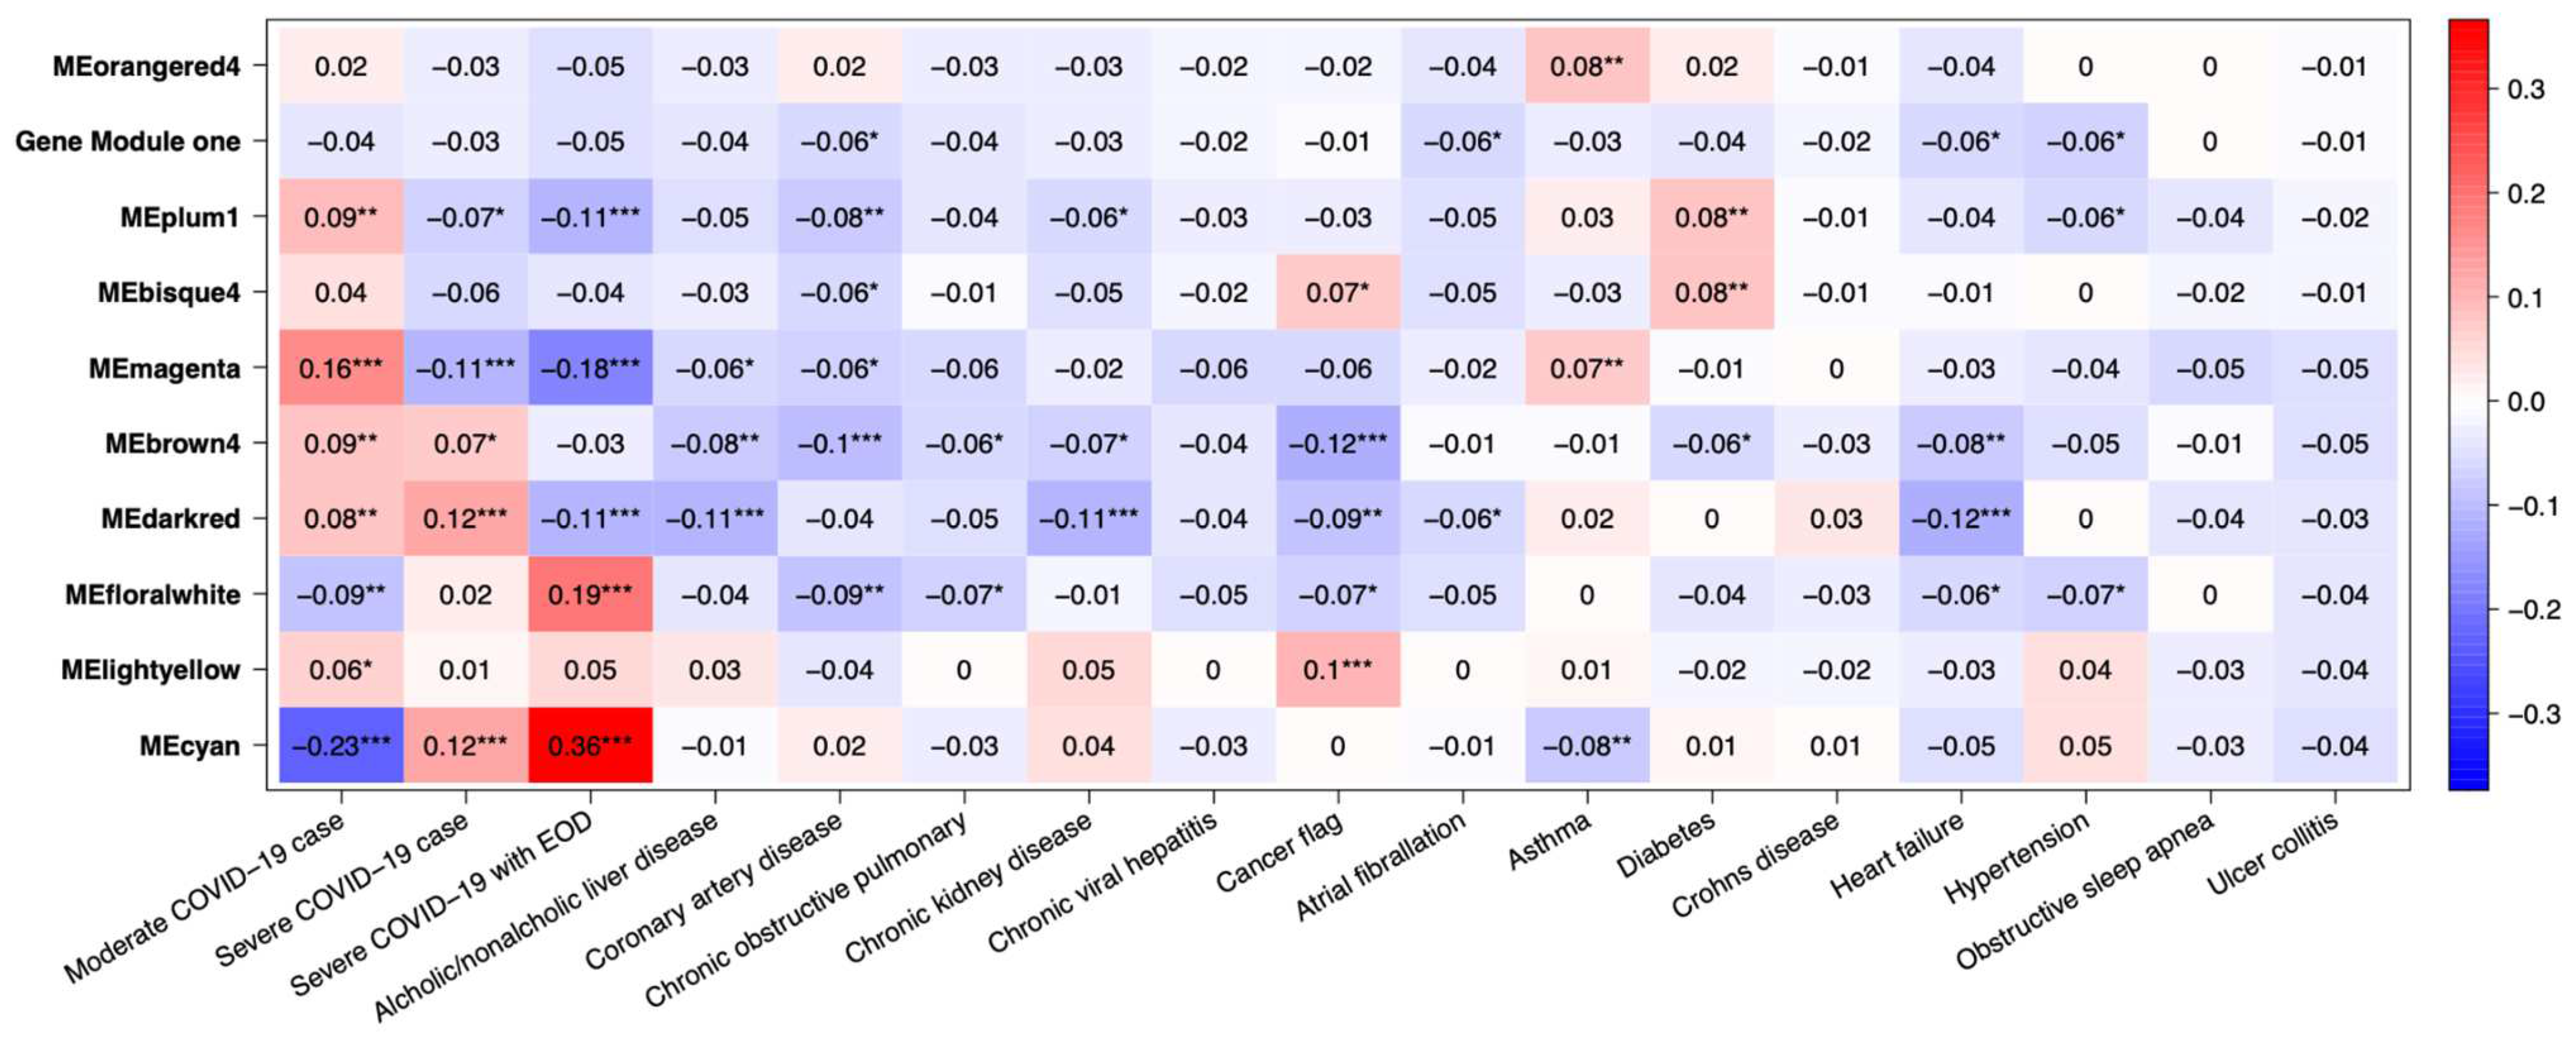
Figure 10. However, only MEdarked indicates a moderately significant association with comorbidities such as chronic kidney disease (CRD), heart failure, and alcohol/non-alcohol liver disease comorbidity in patients as shown in
Figure 11. In this study, MEcyan and MEdarkred gene modules were selected for functional annotation analysis and also analyzed for biological significance in the pathways across patients’ traits, COVID-19 severity, patient disease comorbidity, and major clinical biomarker record of the patients.
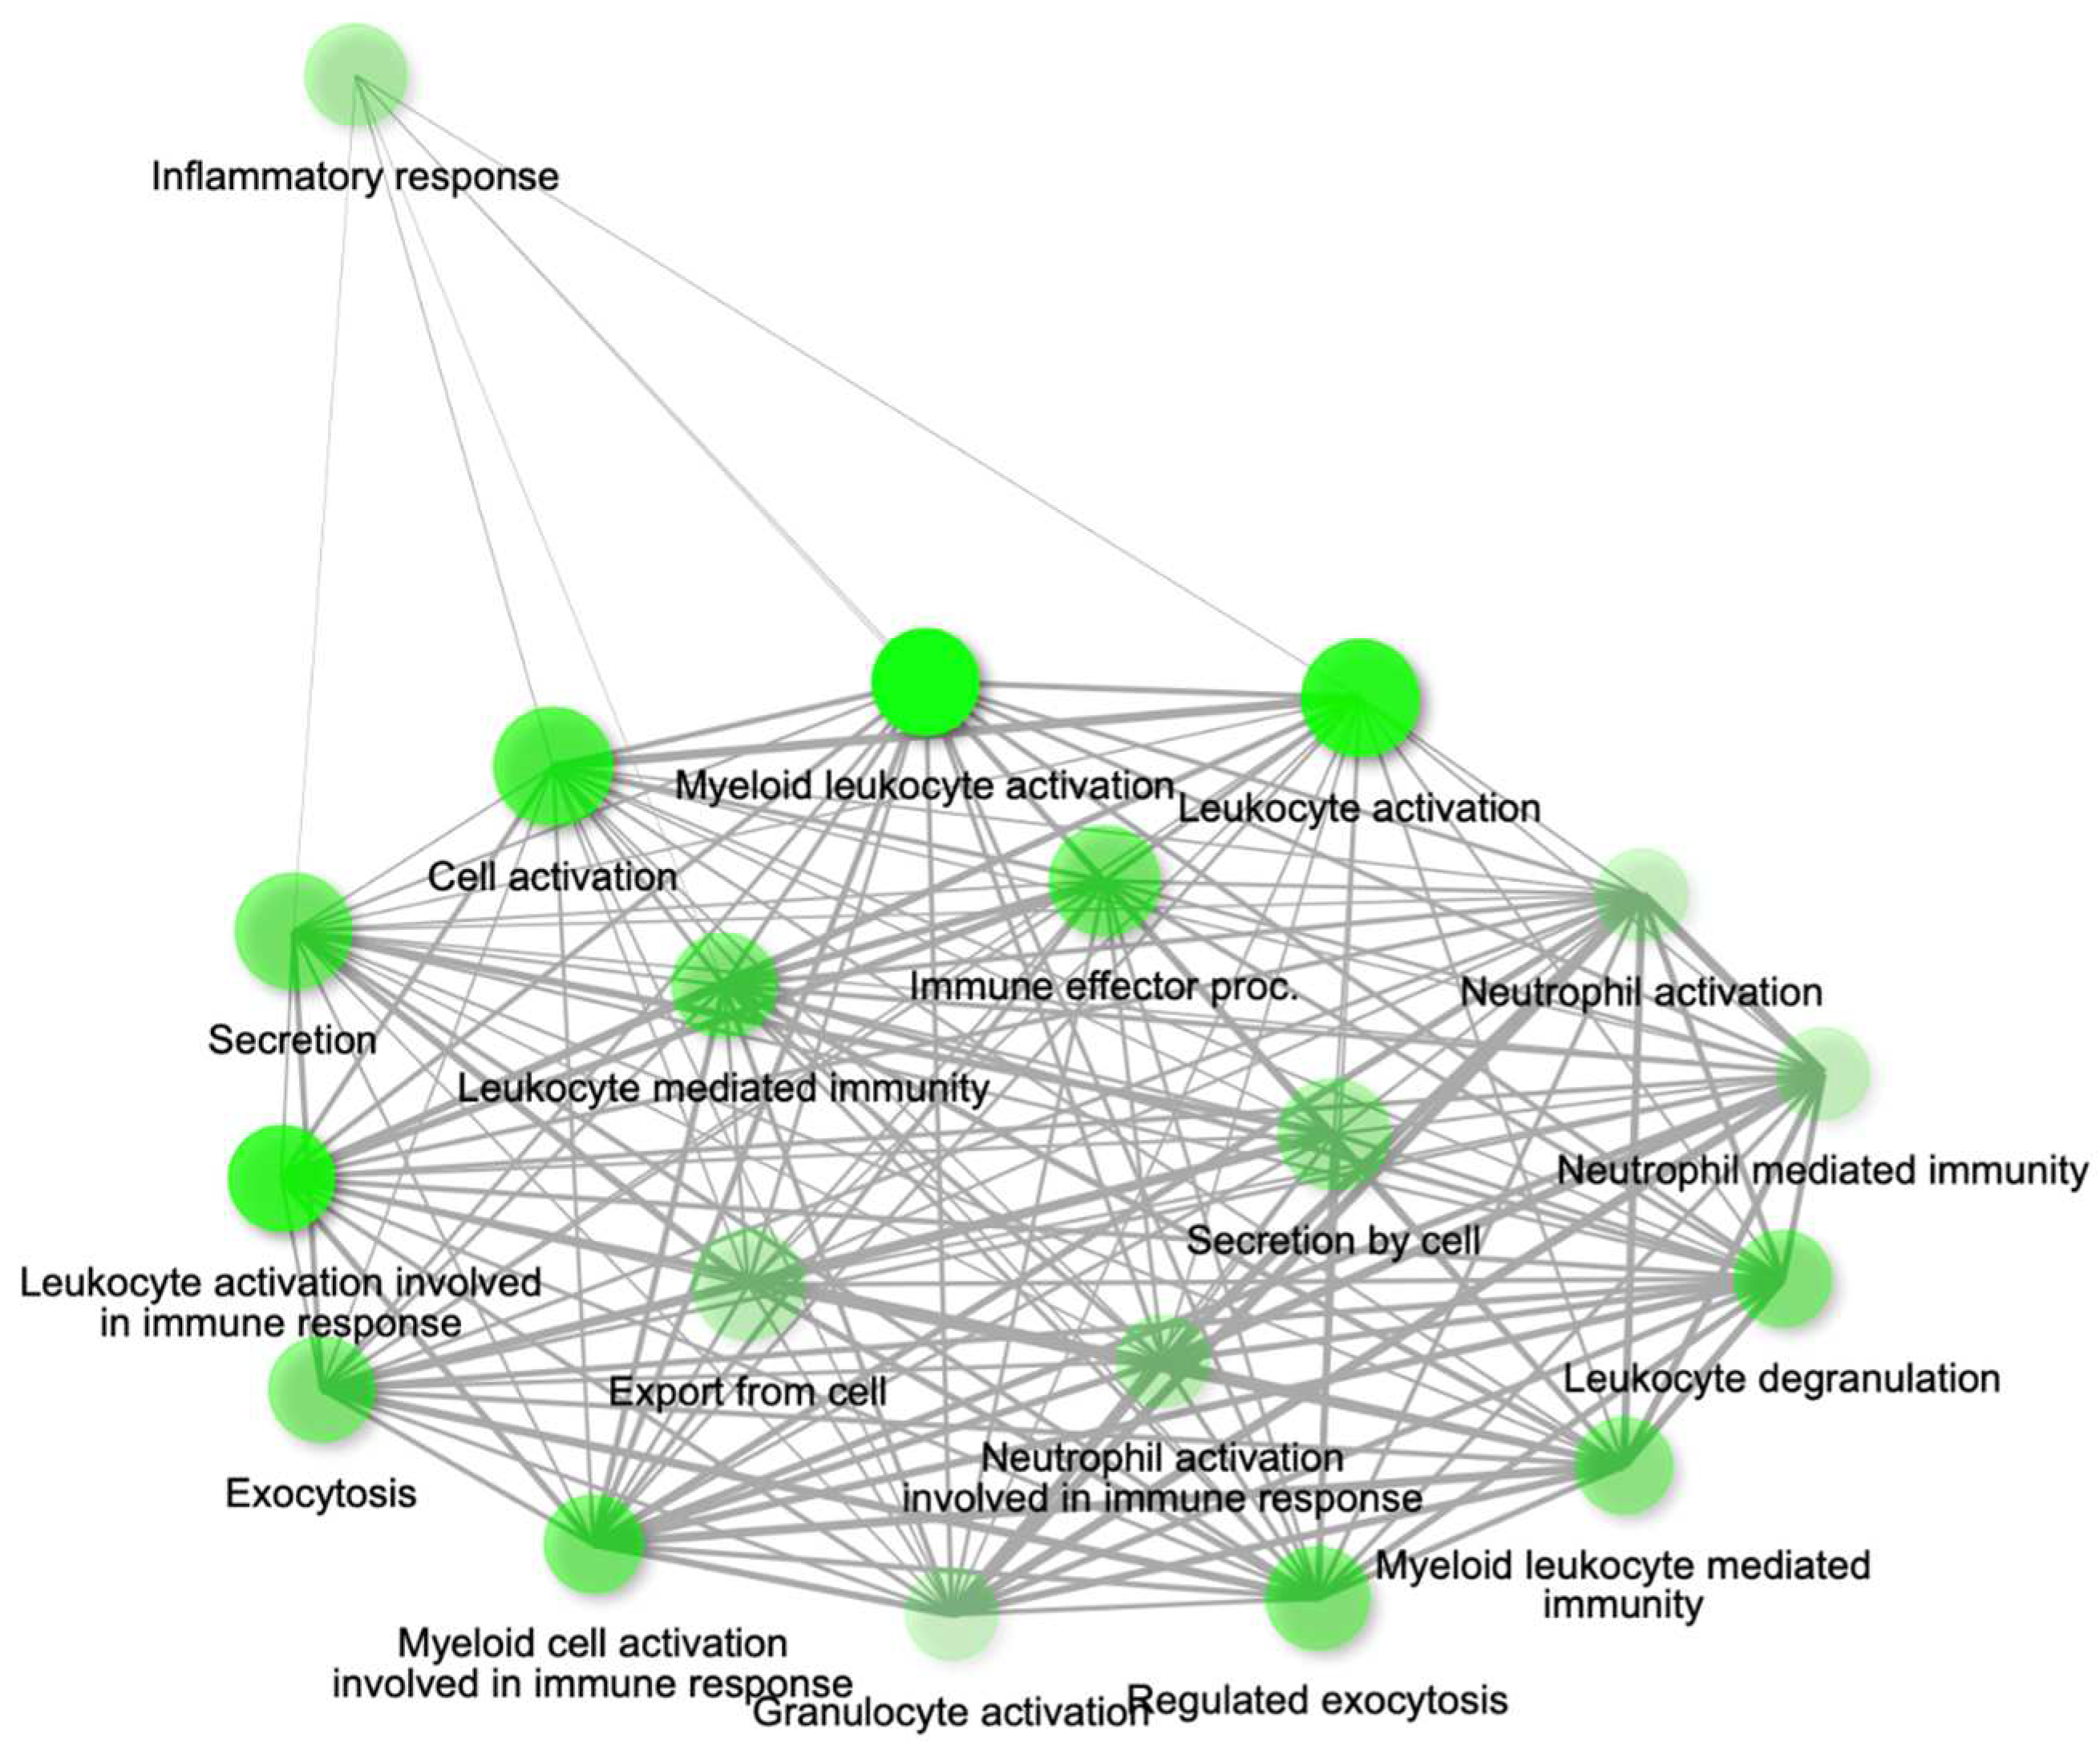
The genes present in the MEcyan module were subjected to functional enrichment analysis, which revealed their enrichment in pathways related to inflammatory and diverse immune responses, as per the Gene Ontology (GO) enrichment annotation (
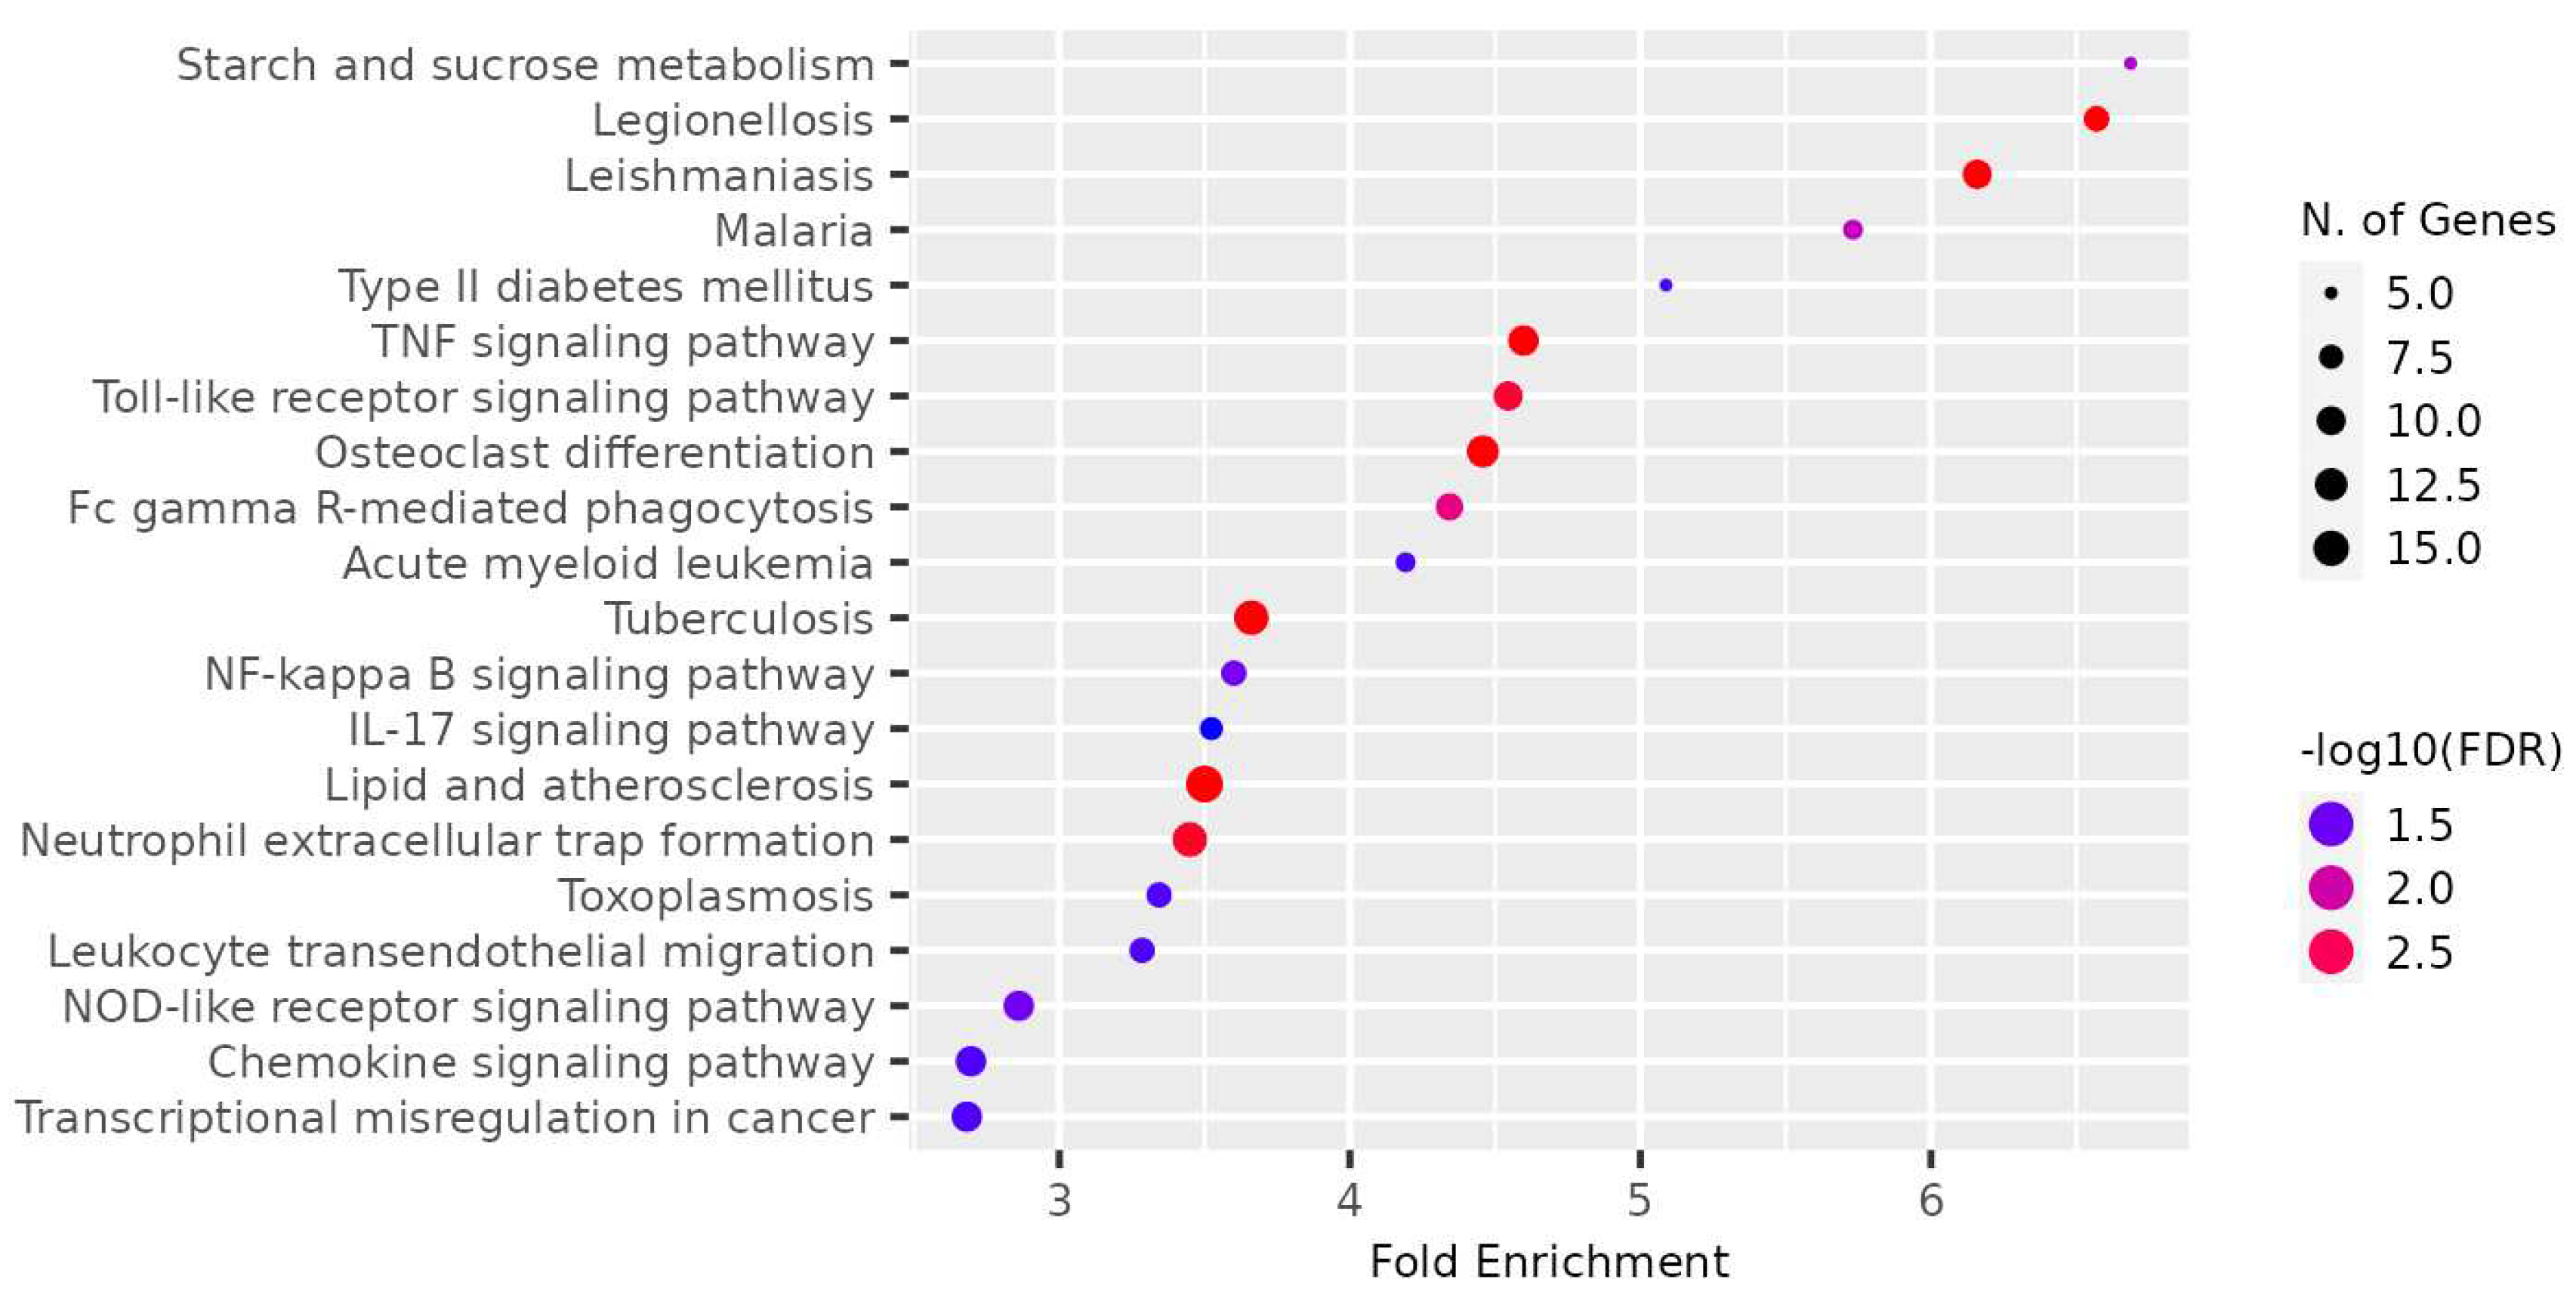
Figure 12). Additionally, they were found to be enriched in signaling pathways such as Tumor Necrosis Factor (TNF) signaling, cytokine signaling, toll-like receptor signaling, and Interleukin-17 (IL-17) signaling pathway, based on KEGG pathway (
Figure 13). Additionally, several investigations have also confirmed our AI/ML based predictive outcomes demonstrating that these gene clusters were closely associated with immune signaling and response pathways that help combat viral infections [
38,
39,
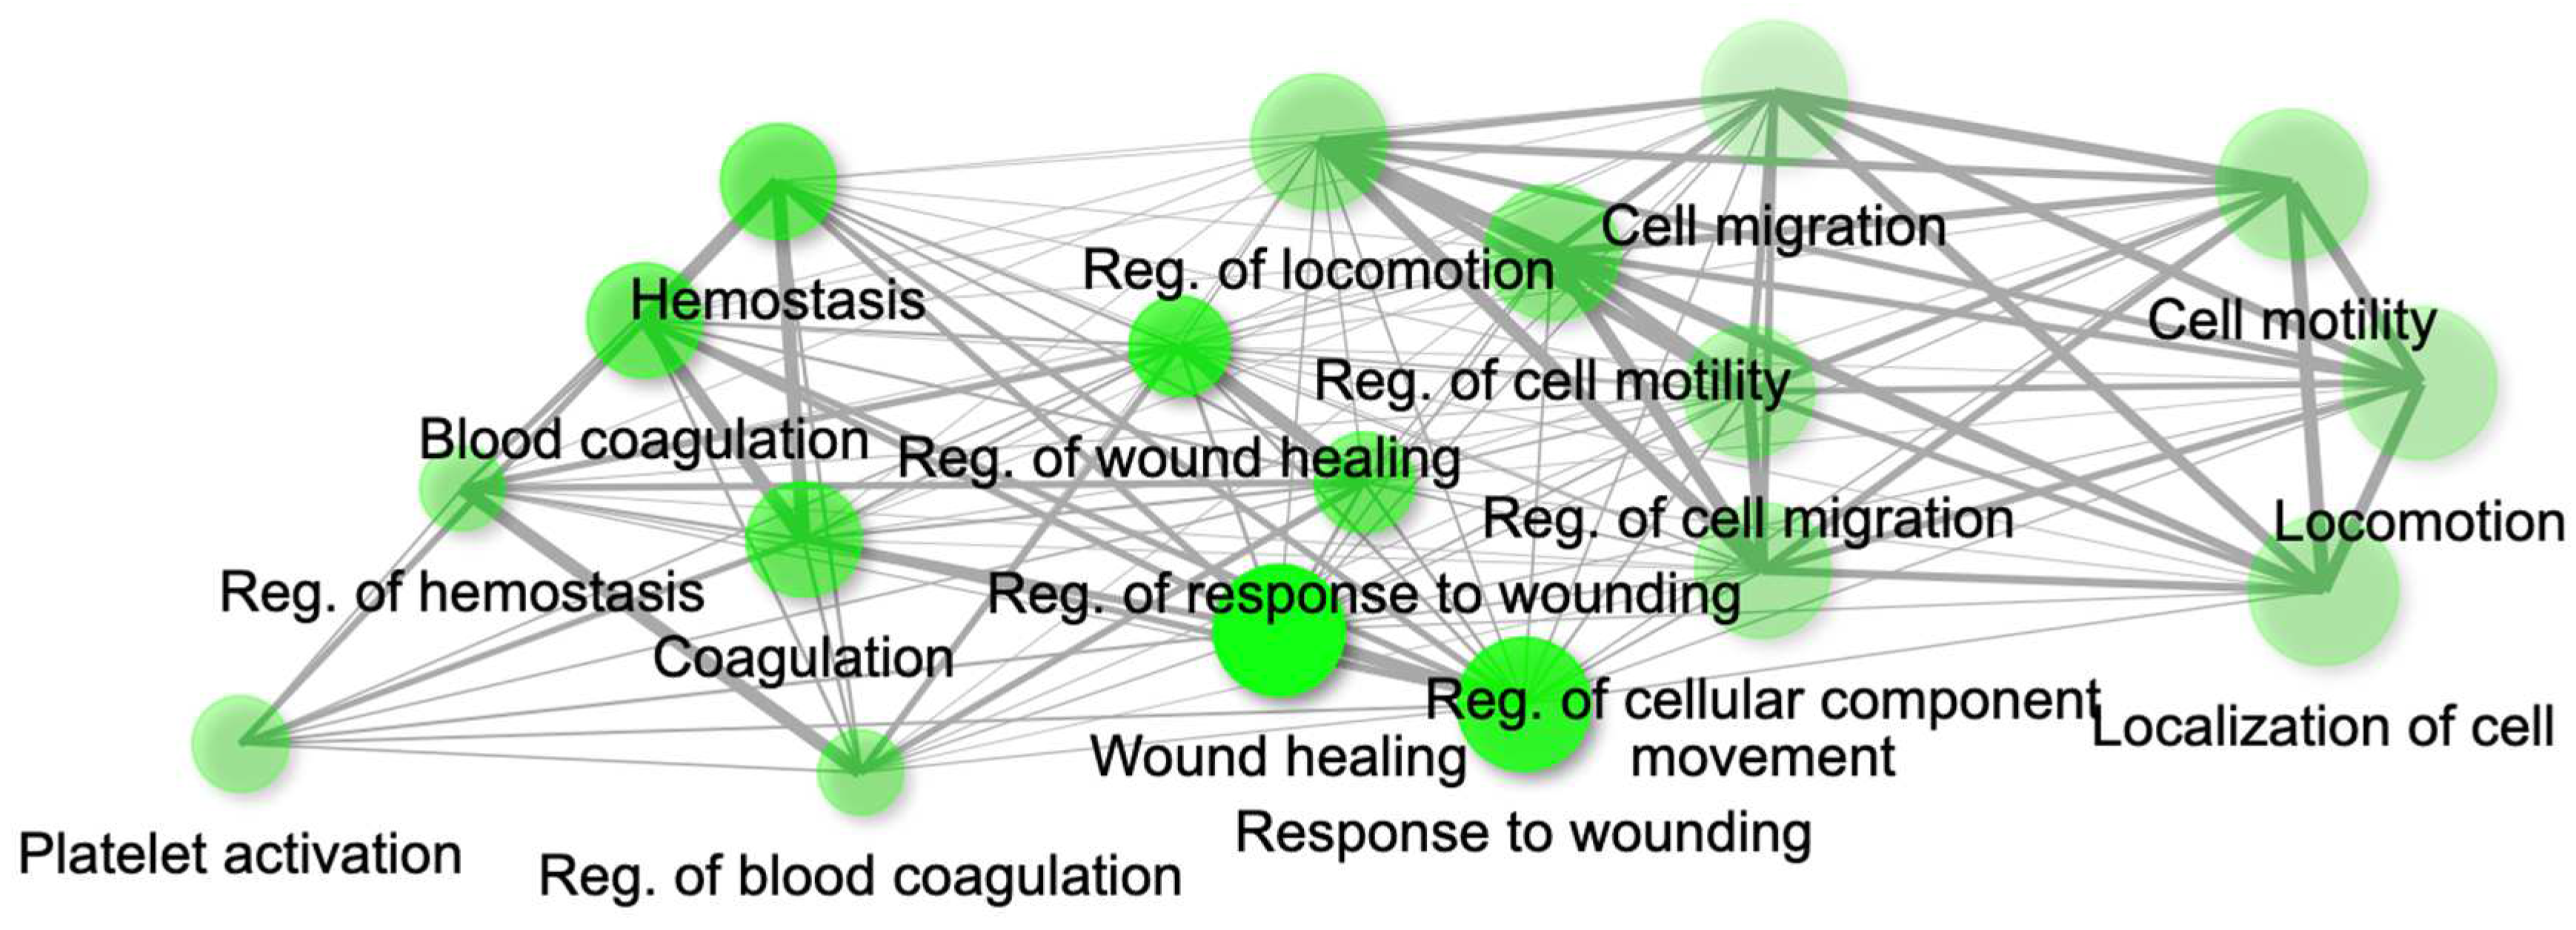
40]. The MEdarkred module's overrepresented pathways included platelet activation, regulation and response to blood coagulation, wound healing pathway, cell motility, and hemostasis for its genes. Those were considered important as the gene module results showed negative correlations with heart failure, chronic artery disease, and liver disease in patients (
Figure 11 and
Figure 14).
The estimated GS and MM genes are indications of how biologically significant such genes are in the enriched pathways in relation to the traits of interest (
Supplementary Table S9). Our findings suggest that MEcyan modules harbor genes that exhibit a favorable association with COVID-19 severity markers, such as EOD, SOFA score, LDH, and BUN, while showing an unfavorable association with comorbidities like heart failure and kidney disease (
Supplementary Figure S21). MEdarkred modules show genes with a negative correlation with EOD, BUN, and SOFA, but a positive correlation with LDH. By applying our AI/ML modeling, based on both high significance and high intramodular connectivity, several noteworthy biomarkers were identified in the MEcyan and MEdarkred modules that are associated with traits like EOD, SOFA, LDH, with GS > 0.3, and MM > 0.8. These gene-biomarkers (
Supplementary Table S10) could be investigated in more detail for their potential use as drug targets or diagnostic tools. In addition, the analysis of patient OMICS datasets using AI/ML modeling has identified specific genes, including P2Y12, ECE1, MSANTD3-TMEFFI, PLEKHA8P1, NUTF2, SAV1, CXCR2P1, and MSANTD3, within the MEdarkred gene module that exhibit high GS and MM for clinical biomarkers such as SOFA score, BUN, EOD, and serum creatine. These genes are involved in biological pathways associated with blood coagulation and wound healing and have been implicated in the regulation of clinical biomarkers in patients with COVID-19.
4. Discussion
We have developed a robust AI/ML-based model that links OMICS datasets to clinical biomarkers for stratification of patients and accurate predictions of disease severity and survival in a given cohort of COVID 19 patients. The LightGBM model architecture incorporates missing value handling logic that minimizes loss on the training dataset in the most effective way possible. The internal decision trees within the model itself represent missing values in such a way that it aligns most with the training data. However, it maintains the assumption that the value is unknown rather than inferring an actual value. The robustness of the modeling logic allows for missing data as input, suggesting that clinicians do not need to provide all biomarker levels seen within the columns of the clinical training dataset to get a valid prediction from the trained model. Given the high ROC-AUC score for both models, it can be inferred that the clinical features were sufficient to be an indicator for both COVID-19 severity and survival. However, the impact of each feature on the disease development and severity remains unclear. ML modeling was proposed as one of the promising approaches to identify the role of biomarker pathways in the infection disease development.
Model explainability has transformed how ML can be applied, especially in the biomedical domain. Through model explainability methods, like SHAP, inferences can be gathered on whether higher or lower feature values contribute to a higher probability of a given predictive class. SHAP was used to determine the most impactful clinical features and feature value ranges contributing highly to COVID-19 severity and survival. To determine the significant biomarkers for each use case, the top 20 most influential features were identified. Interestingly, age, body weight, and BMI appeared in the top 20 impactful features for both cases, suggesting that clinicians may want to focus on patients falling in the high impact ranges for these categories. Comorbidities for coronary artery disease and diabetes were seen within the top 20 impactful clinical features (conditions) for survival. However, comorbidities did not seem to have a significant impact when predicting for COVID-19 severity as there were not in the top 20 factors influencing disease severity. It is possible that comorbidities could exacerbate with COVID-19, resulting in fatalities even in cases where the severity of the illness is not high. The presence of methylprednisolone as a medication for patients with COVID-19 was seen as an impactful clinical feature for both severity and survival. There is no conclusive evidence to suggest that the medication itself increased severity or reduced survival. Subsequently, this may suggest the low efficiency of steroid therapy in COVID-19 patients. Therefore, it is probable that the medication’s effect on certain biological pathways differs in different patient cohorts, which may influence significant biomarkers modulations found among this investigation. Another group of clinical features present in the top 20 impactful features for both models were blood biomarkers, namely BUN, LDH, serum creatinine, and albumin. The SOFA score indicating a clinical organ damage measure, was seen as a highly impactful feature for both use cases as well. The clinical biomarkers and SOFA score impact were translated to the gene analysis, where highly correlated gene groups were identified in the dysregulation of clinical biomarkers in COVID 19 patients.
We conducted a weight co-expression gene network analysis in addition to our ML prediction. This allowed us to approximate the patient gene expression and pinpoint the genes that display a noteworthy correlation with COVID-19 severity, disease comorbidity, and the most critical clinical biomarkers. Our predictive analysis results suggest that there is functional enrichment in pathways related to inflammation, cytokine response, toll-like and interleukin signaling in the genes network that are correlated positively with COVID-19 patients having high BUN, LDH, serum creatinine levels, elevated SOFAscore, and EOD. Within the MEcyan modules, several crucial genes display characteristics such as interleukin receptors (IL8RBP, IL10RB, IL17RA) and toll-like receptors (TLR1, TLR5, TLR4, TLR6, TLR8, TLR2) alongside MYD88. These genes are intricately associated with activating pro-inflammatory cytokines, signaling pathways, and sensing the SARS-COV-2 envelope protein [
40,
41]. In addition, TLR2 and MYD88 have been shown to be associated with COVID-19 disease severity. It is important to acknowledge that cytokines, despite being integral to the innate immune response to viral infections, can cause significant harm to organs and tissues when dysregulated or overly-inflamed, leading to the onset of cytokine storms [
38,
39,
40]. Hence, patients with hyperinflammation are often placed on immunosuppression, immunomodulation and selective cytokine blocking drugs to improve their [
38,
42,
43]. Also, interleukin 10 receptor, IL10RB, identified to be significant to patients’ severity, has been previously noted as regulator of host susceptibility to COVID-19 severity and potential drug target [
44,
45].
Our AI/ML platform demonstrated that most disease comorbidities exhibited minimal correlation, except for alcohol/non-alcoholic liver disease, diabetes, chronic kidney disease, and heart failure, which showed moderately significant negative correlation in the co-expression MEdarkred gene modules. These genes were enriched in pathways related to wound healing, blood coagulation, hemostasis, and cell motility, as shown in
Figure 11 and
Figure 14. This biological insight strengthens our previous observations regarding the link between hyper-inflammation, cytokine reactions, cytokine storms, and tissue and organ damage. This understanding may clarify the moderate correlation observed in gene modules for chronic kidney disease, heart failure, and liver disease with functional annotation enriched in wound healing, hemostasis, blood clotting control, and coagulation. Identifying significant gene-clinical biomarkers with high GS and MM scores can facilitate the selection of key genes for potential drug targeting based on their repositioning and druggability in the context of personalized medicine.
5. Conclusions
A robust AI/ML-based model was created to stratify COVID-19 patients using OMICS, and clinical biomarker datasets, which enables accurate prediction of disease severity and outcomes. Accuracy of both models were 98.1% and 99.9%, respectively. The stratification module is based on the ML/DL algorithms with built-in classification and regression models. Clinical biomarkers and OMICS dataset were used as primary inputs, and their multi-dimensional unified analysis helped identify, with high accuracy, critical transcriptomic and clinical biomarkers for prediction of disease severity and outcomes. Our AI/ML driven platform also demonstrated that comorbidities such as alcohol/non-alcoholic liver disorders, diabetes, chronic kidney disease and heart failure could impact the severity of the disease and the outcomes of COVID 19 patients. The genomic analysis of the patients as a whole revealed the pathways implicated in the development of the disease along with related clinical biomarkers. Our research has demonstrated that patient stratification models, driven by AI/ML modeling, can be expanded to other viral infections and could be used to precisely identify the manifestation of clinical biomarkers, resulting in more accurate diagnosis and treatment options in the context of personalized medicine.
Supplementary Materials
The following supporting information can be downloaded at the website of this paper posted on Preprints.org. Figure S1-S24. Table S1-S10.
Author Contributions
B.B. – data curation and evaluation, data analysis; Y.N.B. – development of the ML model and generation of the simulation results; R.B. – development of ML descriptors, data upload, and database infrastructural work; M.K. – study design, evaluation of the results, text writing and submission of the manuscript; S.W.B. – scientific accuracy and advising; K.C – conceptualization of the study and clinical data review; J.V. – general project management. All authors have read and agreed to the published version of the manuscript.
Funding
This research received no external funding.
Data Availability Statement
Conflicts of Interest
The authors are all employees of VeriSIM Life and used a proprietary AI/ML-driven platform to generate the outcomes for the manuscript.
References
- Lee, B.; Lewis, G.; Agyei-Manu, E.; Atkins, N.; Bhattacharyya, U.; Dozier, M.; Rostron, J.; Sheikh, A.; McQuillan, R.; Theodoratou, E., et al. Risk of serious COVID-19 outcomes among adults and children with moderate-to-severe asthma: a systematic review and meta-analysis. Eur Respir Rev 2022, 31. [CrossRef]
- Song, C.Y.; Xu, J.; He, J.Q.; Lu, Y.Q. Immune dysfunction following COVID-19, especially in severe patients. Sci Rep 2020, 10, 15838. [CrossRef]
- Whiteside, T.; Kane, E.; Aljohani, B.; Alsamman, M.; Pourmand, A. Redesigning emergency department operations amidst a viral pandemic. Am J Emerg Med 2020, 38, 1448-1453. [CrossRef]
- Sipior, J.C. Considerations for development and use of AI in response to COVID-19. Int J Inf Manage 2020, 55, 102170. [CrossRef]
- Basu, K.; Sinha, R.; Ong, A.; Basu, T. Artificial Intelligence: How is It Changing Medical Sciences and Its Future? Indian J Dermatol 2020, 65, 365-370. [CrossRef]
- Hartzband, P.; Groopman, J. Physician Burnout, Interrupted. N Engl J Med 2020, 382, 2485-2487. [CrossRef]
- Kannampallil, T.G.; Goss, C.W.; Evanoff, B.A.; Strickland, J.R.; McAlister, R.P.; Duncan, J. Exposure to COVID-19 patients increases physician trainee stress and burnout. PLoS One 2020, 15, e0237301. [CrossRef]
- Zhang, K.; Liu, X.; Shen, J.; Li, Z.; Sang, Y.; Wu, X.; Zha, Y.; Liang, W.; Wang, C.; Wang, K., et al. Clinically Applicable AI System for Accurate Diagnosis, Quantitative Measurements, and Prognosis of COVID-19 Pneumonia Using Computed Tomography. Cell 2020, 182, 1360. [CrossRef]
- Liang, W.; Liang, H.; Ou, L.; Chen, B.; Chen, A.; Li, C.; Li, Y.; Guan, W.; Sang, L.; Lu, J., et al. Development and Validation of a Clinical Risk Score to Predict the Occurrence of Critical Illness in Hospitalized Patients With COVID-19. JAMA Intern Med 2020, 180, 1081-1089. [CrossRef]
- Xu, Z.; Su, C.; Xiao, Y.; Wang, F. Artificial intelligence for COVID-19: battling the pandemic with computational intelligence. Intell Med 2022, 2, 13-29. [CrossRef]
- Williams, R.D.; Markus, A.F.; Yang, C.; Salles, T.D.; Falconer, T.; Jonnagaddala, J.; Kim, C.; Rho, Y.; Williams, A.; An, M.H., et al. Seek COVER: Development and validation of a personalized risk calculator for COVID-19 outcomes in an international network. medRxiv 2020, 10.1101/2020.05.26.20112649, 2020.2005.2026.20112649. [CrossRef]
- Rapsang, A.G.; Shyam, D.C. Scoring systems in the intensive care unit: A compendium. Indian J Crit Care Med 2014, 18, 220-228. [CrossRef]
- Fan, G.; Tu, C.; Zhou, F.; Liu, Z.; Wang, Y.; Song, B.; Gu, X.; Wang, Y.; Wei, Y.; Li, H., et al. Comparison of severity scores for COVID-19 patients with pneumonia: a retrospective study. Eur Respir J 2020, 56. [CrossRef]
- Su, Y.; Tu, G.W.; Ju, M.J.; Yu, S.J.; Zheng, J.L.; Ma, G.G.; Liu, K.; Ma, J.F.; Yu, K.H.; Xue, Y., et al. Comparison of CRB-65 and quick sepsis-related organ failure assessment for predicting the need for intensive respiratory or vasopressor support in patients with COVID-19. J Infect 2020, 81, 647-679. [CrossRef]
- Yang, H.S.; Hou, Y.; Vasovic, L.V.; Steel, P.A.D.; Chadburn, A.; Racine-Brzostek, S.E.; Velu, P.; Cushing, M.M.; Loda, M.; Kaushal, R., et al. Routine Laboratory Blood Tests Predict SARS-CoV-2 Infection Using Machine Learning. Clin Chem 2020, 66, 1396-1404. [CrossRef]
- Calzari, L.; Zanotti, L.; Inglese, E.; Scaglione, F.; Cavagnola, R.; Ranucci, F.; Di Blasio, A.M.; Stefanini, G.; Carlo, G.; Parati, G., et al. Role of epigenetics in the clinical evolution of COVID-19 disease. Epigenome-wide association study identifies markers of severe outcome. Eur J Med Res 2023, 28, 81. [CrossRef]
- Tsiftsoglou, S.A.; Gavriilaki, E.; Touloumenidou, T.; Koravou, E.E.; Koutra, M.; Papayanni, P.G.; Karali, V.; Papalexandri, A.; Varelas, C.; Chatzopoulou, F., et al. Targeted genotyping of COVID-19 patients reveals a signature of complement C3 and factor B coding SNPs associated with severe infection. Immunobiology 2023, 228, 152351. [CrossRef]
- Moreno, R.; Rhodes, A.; Piquilloud, L.; Hernandez, G.; Takala, J.; Gershengorn, H.B.; Tavares, M.; Coopersmith, C.M.; Myatra, S.N.; Singer, M., et al. The Sequential Organ Failure Assessment (SOFA) Score: has the time come for an update? Crit Care 2023, 27, 15. [CrossRef]
- Thompson, R.C.; Simons, N.W.; Wilkins, L.; Cheng, E.; Del Valle, D.M.; Hoffman, G.E.; Cervia, C.; Fennessy, B.; Mouskas, K.; Francoeur, N.J., et al. Molecular states during acute COVID-19 reveal distinct etiologies of long-term sequelae. Nat Med 2023, 29, 236-246. [CrossRef]
- Laposata, M. Clinical Laboratory Reference Values. In Laboratory Medicine: The Diagnosis of Disease in the Clinical Laboratory, Laposata, M., Ed. McGraw-Hill Education: New York, NY, 2014.
- Langfelder, P.; Horvath, S. WGCNA: an R package for weighted correlation network analysis. BMC Bioinformatics 2008, 9, 559. [CrossRef]
- Ritchie, M.E.; Phipson, B.; Wu, D.; Hu, Y.; Law, C.W.; Shi, W.; Smyth, G.K. limma powers differential expression analyses for RNA-sequencing and microarray studies. Nucleic Acids Res 2015, 43, e47. [CrossRef]
- Ashburner, M.; Ball, C.A.; Blake, J.A.; Botstein, D.; Butler, H.; Cherry, J.M.; Davis, A.P.; Dolinski, K.; Dwight, S.S.; Eppig, J.T., et al. Gene ontology: tool for the unification of biology. The Gene Ontology Consortium. Nat Genet 2000, 25, 25-29. [CrossRef]
- Gene Ontology, C. The Gene Ontology resource: enriching a GOld mine. Nucleic Acids Res 2021, 49, D325-D334. [CrossRef]
- Kanehisa, M.; Furumichi, M.; Sato, Y.; Ishiguro-Watanabe, M.; Tanabe, M. KEGG: integrating viruses and cellular organisms. Nucleic Acids Res 2021, 49, D545-D551. [CrossRef]
- Ge, S.X.; Jung, D.; Yao, R. ShinyGO: a graphical gene-set enrichment tool for animals and plants. Bioinformatics 2020, 36, 2628-2629. [CrossRef]
- Antontsev, V.; Jagarapu, A.; Bundey, Y.; Hou, H.; Khotimchenko, M.; Walsh, J.; Varshney, J. A hybrid modeling approach for assessing mechanistic models of small molecule partitioning in vivo using a machine learning-integrated modeling platform. Sci Rep 2021, 11, 11143. [CrossRef]
- Spooner, A.; Chen, E.; Sowmya, A.; Sachdev, P.; Kochan, N.A.; Trollor, J.; Brodaty, H. A comparison of machine learning methods for survival analysis of high-dimensional clinical data for dementia prediction. Sci Rep 2020, 10, 20410. [CrossRef]
- Lundberg, S.M.; Lee, S.-I. A Unified Approach to Interpreting Model Predictions. Nips'17 2017, 4768–4777.
- Guan, W.J.; Liang, W.H.; He, J.X.; Zhong, N.S. Cardiovascular comorbidity and its impact on patients with COVID-19. Eur Respir J 2020, 55. [CrossRef]
- Ssentongo, P.; Ssentongo, A.E.; Heilbrunn, E.S.; Ba, D.M.; Chinchilli, V.M. Association of cardiovascular disease and 10 other pre-existing comorbidities with COVID-19 mortality: A systematic review and meta-analysis. PLoS One 2020, 15, e0238215. [CrossRef]
- Chinta, S.; Rodriguez-Guerra, M.; Shaban, M.; Pandey, N.; Jaquez-Duran, M.; Vittorio, T.J. COVID-19 therapy and vaccination: a clinical narrative review. Drugs Context 2023, 12. [CrossRef]
- Yang, Z.; Hu, Q.; Huang, F.; Xiong, S.; Sun, Y. The prognostic value of the SOFA score in patients with COVID-19: A retrospective, observational study. Medicine (Baltimore) 2021, 100, e26900. [CrossRef]
- Li, C.; Ye, J.; Chen, Q.; Hu, W.; Wang, L.; Fan, Y.; Lu, Z.; Chen, J.; Chen, Z.; Chen, S., et al. Elevated Lactate Dehydrogenase (LDH) level as an independent risk factor for the severity and mortality of COVID-19. Aging (Albany NY) 2020, 12, 15670-15681. [CrossRef]
- Ok, F.; Erdogan, O.; Durmus, E.; Carkci, S.; Canik, A. Predictive values of blood urea nitrogen/creatinine ratio and other routine blood parameters on disease severity and survival of COVID-19 patients. J Med Virol 2021, 93, 786-793. [CrossRef]
- Kucukceran, K.; Ayranci, M.K.; Girisgin, A.S.; Kocak, S.; Dundar, Z.D. The role of the BUN/albumin ratio in predicting mortality in COVID-19 patients in the emergency department. Am J Emerg Med 2021, 48, 33-37. [CrossRef]
- Thorndike, R.L. Who belongs in the family? Psychometrika 1953, 18, 267-276. [CrossRef]
- Channappanavar, R.; Perlman, S. Pathogenic human coronavirus infections: causes and consequences of cytokine storm and immunopathology. Semin Immunopathol 2017, 39, 529-539. [CrossRef]
- Lucas, C.; Wong, P.; Klein, J.; Castro, T.B.R.; Silva, J.; Sundaram, M.; Ellingson, M.K.; Mao, T.; Oh, J.E.; Israelow, B., et al. Longitudinal analyses reveal immunological misfiring in severe COVID-19. Nature 2020, 584, 463-469. [CrossRef]
- Zheng, M.; Karki, R.; Williams, E.P.; Yang, D.; Fitzpatrick, E.; Vogel, P.; Jonsson, C.B.; Kanneganti, T.D. TLR2 senses the SARS-CoV-2 envelope protein to produce inflammatory cytokines. Nat Immunol 2021, 22, 829-838. [CrossRef]
- Pacha, O.; Sallman, M.A.; Evans, S.E. COVID-19: a case for inhibiting IL-17? Nat Rev Immunol 2020, 20, 345-346. [CrossRef]
- Shakoory, B.; Carcillo, J.A.; Chatham, W.W.; Amdur, R.L.; Zhao, H.; Dinarello, C.A.; Cron, R.Q.; Opal, S.M. Interleukin-1 Receptor Blockade Is Associated With Reduced Mortality in Sepsis Patients With Features of Macrophage Activation Syndrome: Reanalysis of a Prior Phase III Trial. Crit Care Med 2016, 44, 275-281. [CrossRef]
- Wang Dongsheng, X.X. A multi-center, randomized controlled clinical study on the efficacy and safety of tocilizumab in patients with novel coronavirus pneumonia (COVID-19). 2020.
- Voloudakis, G.; Hoffman, G.; Venkatesh, S.; Lee, K.M.; Dobrindt, K.; Vicari, J.M.; Zhang, W.; Beckmann, N.D.; Jiang, S.; Hoagland, D., et al. IL10RB as a key regulator of COVID-19 host susceptibility and severity. medRxiv 2021, 10.1101/2021.05.31.21254851. [CrossRef]
- Voloudakis, G.; Vicari, J.M.; Venkatesh, S.; Hoffman, G.E.; Dobrindt, K.; Zhang, W.; Beckmann, N.D.; Higgins, C.A.; Argyriou, S.; Jiang, S., et al. A translational genomics approach identifies IL10RB as the top candidate gene target for COVID-19 susceptibility. NPJ Genom Med 2022, 7, 52. [CrossRef]
Figure 1.
Overview of the workflow for an AI/ML-driven model that predicts the outcome of COVID-19 infection in patients, utilizing a set of clinical biomarkers and genomics dataset.
Figure 1.
Overview of the workflow for an AI/ML-driven model that predicts the outcome of COVID-19 infection in patients, utilizing a set of clinical biomarkers and genomics dataset.
Figure 2.
ROC curve on test set for COVID-19 severity prediction model
Figure 2.
ROC curve on test set for COVID-19 severity prediction model
Figure 3.
ROC curve on test set for COVID-19 survival prediction model
Figure 3.
ROC curve on test set for COVID-19 survival prediction model
Figure 4.
ROC curve on test set for COVID-19 severity prediction model with comorbidities re-moved from training set
Figure 4.
ROC curve on test set for COVID-19 severity prediction model with comorbidities re-moved from training set
Figure 6.
Top 20 most impactful features for COVID-19 severity predictive model. The red data points indicate higher values for the particular feature while blue data points indicate lower values for the particular feature. A higher feature impact score indicates a higher contribution to a “severe” case prediction while a lower feature impact score indicates a higher contribution to a “moderate” case prediction value.
Figure 7.
Top 20 most impactful features for COVID-19 survival predictive model. The red data points indicate higher values for the particular feature, while blue data points indicate lower values for the particular feature. A higher feature impact score indicates a higher contribution to a “no survival from COVID-19” prediction, while a lower feature impact score indicates a higher contribution to a “survival from COVID-19” prediction value.
Figure 8.
Range of impactful and validated biomarker values for COVID-19 severity prediction
Figure 8.
Range of impactful and validated biomarker values for COVID-19 severity prediction
Figure 9.
Range of impactful and validated biomarker values for COVID-19 survival prediction
Figure 9.
Range of impactful and validated biomarker values for COVID-19 survival prediction
Figure 10.
Heatmaps of module traits for severity and clinical biomarkers. The boxes indicate the correlation based on module eigengenes in the rows and traits in the column. The color legend – blue (negative correlation) and red (positive correlation). P-values represented by asterisks indicated significance.
Figure 11.
Heatmaps of module traits for severity and disease comorbidity. The boxes indicate the correlation based on module eigengenes in the rows and traits in the column. The color legend – blue (negative correlation) and red (positive correlation). P-values represented by asterisks indicated significance.
Figure 12.
Gene network for top 20 enriched pathways for genes module, MEcyan based on GO biological process annotation.
Figure 12.
Gene network for top 20 enriched pathways for genes module, MEcyan based on GO biological process annotation.
Figure 13.
Dot plot for top 20 enriched pathways based for gene module, MEcyan based on KEGG
Figure 13.
Dot plot for top 20 enriched pathways based for gene module, MEcyan based on KEGG
Figure 14.
Gene network for top 20 enriched pathways for genes module, MEdarkred based on GO biological process annotation.
Figure 14.
Gene network for top 20 enriched pathways for genes module, MEdarkred based on GO biological process annotation.
Table 1.
Evaluation metrics for COVID-19 severity and survival models
Table 1.
Evaluation metrics for COVID-19 severity and survival models
| |
Severity |
Survival |
| Balanced Accuracy |
91.6% |
99.1% |
| ROC-AUC |
98.1% |
99.9% |
Table 2.
Evaluation metrics for COVID-19 severity and survival models without comorbidities in the training data
Table 2.
Evaluation metrics for COVID-19 severity and survival models without comorbidities in the training data
| |
Severity |
Survival |
| Balanced Accuracy |
85.4% |
69.8% |
| ROC-AUC |
93.5% |
87.8% |
|
Disclaimer/Publisher’s Note: The statements, opinions and data contained in all publications are solely those of the individual author(s) and contributor(s) and not of MDPI and/or the editor(s). MDPI and/or the editor(s) disclaim responsibility for any injury to people or property resulting from any ideas, methods, instructions or products referred to in the content. |
© 2023 by the authors. Licensee MDPI, Basel, Switzerland. This article is an open access article distributed under the terms and conditions of the Creative Commons Attribution (CC BY) license (http://creativecommons.org/licenses/by/4.0/).
