1. Introduction
To counteract the rapid global spread of antibiotic-resistant pathogenic bacteria, some solutions have been proposed including the prudent use of conventional antibiotics, the consistent application of infection control procedures, and the development of new antibiotics [
1,
2]. However, the current pace of development of new antibacterial therapeutics is slow due to economic and regulatory barriers. Most recently found candidate antibiotics are merely derivatives of antibiotics already in clinical use [
3,
4,
5], which makes the emergence of bacterial resistance almost inevitable. Therefore, antimicrobials with novel structural properties exploiting different mechanisms of action are the hope for a way out of this conundrum.
Antimicrobial peptides (AMPs) are a class of molecules found in the innate immune system of living organisms [
6,
7]. Many of them have shown broad-spectrum activity, rapid killing action, and remarkable potency against bacteria, yeasts, fungi, viruses and parasites. Some AMPs also exhibited promising
in vivo activity against multidrug-resistant pathogens [
8]. Because their mechanism of action differs from that of general antibiotics, they are thought to lead to bacterial resistance only to a limited extent and thus represent an option for the next generation of antibiotics [
9].
Key Points:
We propose MBC-Attention to regress the experimental MIC values of AMPs against the Gram-negative bacteria Escherichia coli. MBC-Attention is based on an ensemble of CNNs via multiple input branches, integrated with a local attention module within each CNN branch and a global attention module between CNN branches. MBC-Attention performs with higher accuracy and more stable than traditional machine learning methods on a test set of 393 peptides.
|
Biological experiments have been the mainstream method to discover new AMPs from isolates of living organisms. However, these wet-lab procedures are both labor-intensive and cost-intensive. With recent advances in the field of artificial intelligence and the availability of public AMP databases, the scientific community has made intense efforts to develop more accurate prediction tools to aid in the detection and design of AMP sequences. Based on our recent review of the computational studies on machine learning and deep learning of AMPs [
10], we found that most of the prediction methods only focused on the binary classification of AMPs. Since the fundamental goal in early-stage drug discovery is to identify lead molecules with high potency and specificity, predictive tools that can provide the experimental biological activity value of molecules are critical for the selection of the most promising (and successful) candidates.
Toward the
de novo sequence design of AMPs, Nagarajan et al. [
11] trained a Bi-LSTM regression model on 501 sequences from the YADAMP database against
E. coli. They normalized the MIC values to the range of 0 and 1 so that the predictions also fell within this range. The regression model was used to sort the predicted sequences generated by an LSTM model previously trained with 1011 known AMP sequences. The paper did not include an evaluation of the regression model, but using the data reported in this study for the 17 synthesized peptides, we calculated a correlation of 0.56 between the predicted and experimental MIC values. Along the same line of thought, Dean et al. [
12] developed another peptide generation framework, PepVAE, based on a variational autoencoder to sample new sequences from different regions of the learned latent space and on a gradient boosting regressor to predict the MIC of the new sequences. The regressor model was constructed from
E. coli data, obtained by comparing eight different models (CNN, Elastic Net [
13], Gradient Boosting [
14], Kernel Ridge [
15], Lasso [
16], RF [
17], Light Gradient Boosting Machine [
18], and Extreme Gradient Boosting [
19]). The best model was achieved by the Gradient Boosting algorithm with an R
2 value of 0.73 and an RMSE of 0.5.
Instead of predicting MIC values, some works exploited the MIC values to create positive and negative datasets for AMP classification. For example, in the studies of Vishnepolsky et al.[
20] and Soylemez et al.[
21], they partitioned AMPs with experimentally known MIC values against a bacterial target into the positive sets (with low MIC values of <25 µg/mL) and the negative sets (with high MIC values of >100 µg/mL). Subsequently, Vishnepolsky
et al. constructed a semi-supervised machine learning method with density-based clustering algorithm (DBSCAN) using Physical-Chemical features as input. Their
E. coli classification model achieved an accuracy of 80% on the validation set. On the other hand, Soylemez
et al. [
21] utilized RF with Physico-Chemical features as input and finally achieved an accuracy of 98% and 95% for the Gram-negative and Gram-positive datasets respectively.
Predicting the activity of AMPs in relation to other medically important properties, such as anticancer activity, is also critical, and the techniques could be applicable to AMP prediction. Chen
et al. [
22] developed xDeep-AcPEP, a powerful regression model that predicts the anticancer activity of six tumor cells (including breast, cervix, colon, lung, skin, and prostate cancers). They used Multitask Learning strategy to supplement the shortage of small datasets of cancer-specific peptides. The best models with the applicability domain defined obtained an average Pearson correlation coefficient of 0.8086.
Accurate prediction of the MIC of AMPs therefore remains challenging due to limited data, the wide range of activity measurements using different experimental methods and under different experimental conditions, and the presence of noise in the data. Nevertheless, as a step toward accurate quantitative prediction of the activity of AMPs, we present MBC-Attention, a regressive model for predicting the MIC value of AMPs against
E. coli, the Gram-negative bacterium with the most data available in databases. MBC-Attention exploits the Multi-Branch-CNN (MBC) architecture [
23], a deep learning architecture with multiple parallel CNN branches at the input level and single prediction at the output level concatenated from independent predictions of CNNs to classify biological activity of peptides. In this work, two attention mechanisms were introduced into MBC to improve its regressive power: one that localizes within each CNN branch (attention-local) and another that links the different CNN branches (attention-global). The MBC-Attention model was developed based on MBC that performed well in classifying ion channel interacting peptides. Here, we modified MBC to handle a regression task by adding the attention mechanisms mentioned above and showed that it also performed well in regression.
For model construction, optimization, and error estimation, we divided the dataset into train, validation, and test sets. The test set was used for final testing, while the train and validation sets were used for model building and optimization. To obtain a more reliable estimate of model performance, the data splitting procedure was repeated to generate three sets of train, validation, and test sets. Finally, the proposed model was compared to two traditional machine learning methods, namely RF [
17] and SVM [
24], which showed to have best performance in our preliminary tests (data not shown). To show that the proposed MBC-Attention method also performs better than MBC in classification tasks, we compare MBC-Attention and the MBC method with all the datasets in our previous MBC work [
23]. A series of ablation tests were performed to confirm the necessity of the designed components in MBC attention, including MBC alone, MBC with attention-global, and MBC with attention-local.
2. Results
2.1. Single feature selection
Prior to training a machine learning model, the peptide sequences in the dataset were converted into numerical values called
features, which represent different properties of the sequence at the peptide level or at the amino-acid level. To select the most informative feature types for encoding AMP sequences, a total of 4481 different feature types was examined. These include the ’OneHot’ feature type, 53 feature types that were generated by different feature encoding methods (e.g., ’AAC’, ’CKSAAP’ [
25], ’KSCTRiad’ [
26], etc.), and 4427 feature types generated by the Pseudo K-tuple Reduced Amino Acids Composition (PseKRAAC) encoding method [
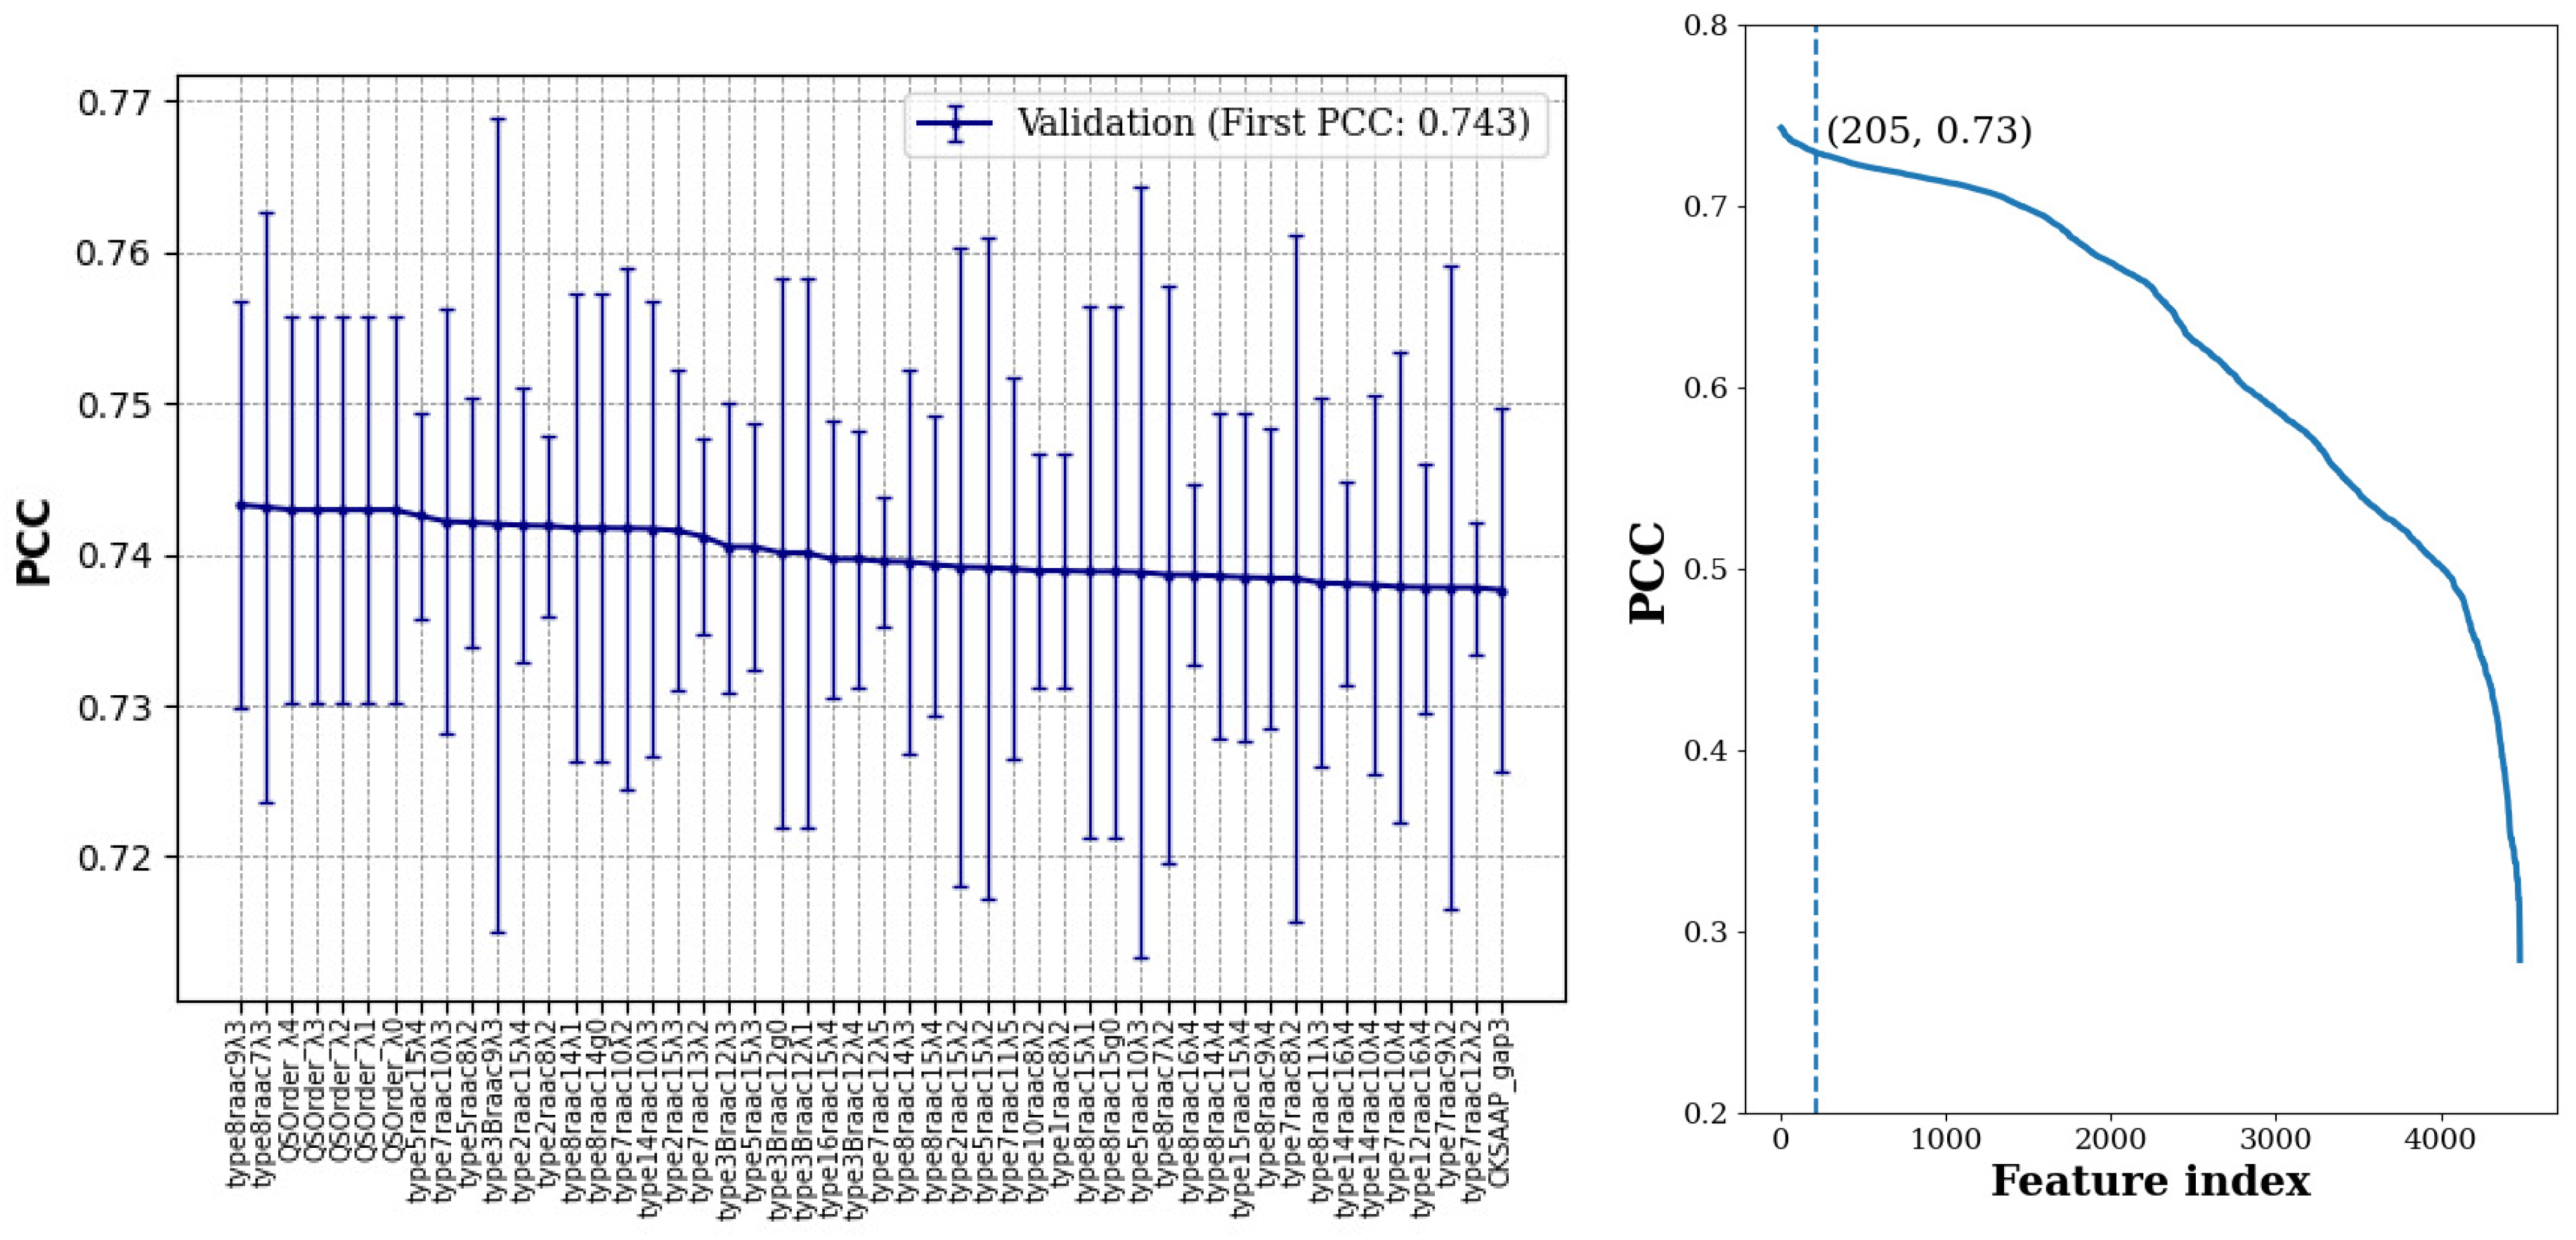
27]. For each feature type, we constructed an RF using 400 trees and computed its predictive performance in terms of the Pearson Correlation Coefficient (PCC). Each experiment was repeated 3 times and the average of PCC values in the three validation sets was computed for each feature type.
As shown in
Figure 1, about half of the features achieved average PCC values between 0.55 and 0.75, while for about 200 of the feature types (i.e., about 4.5%), their average model performance in the validation sets was within one standard deviation of the best model. For training a MBC model with this large number of features is still a formidable task with limited computational resources. Hence, we kept the top 30 feature types to proceed with the Best-K feature combination selection.
2.2. Best-K features combination selection
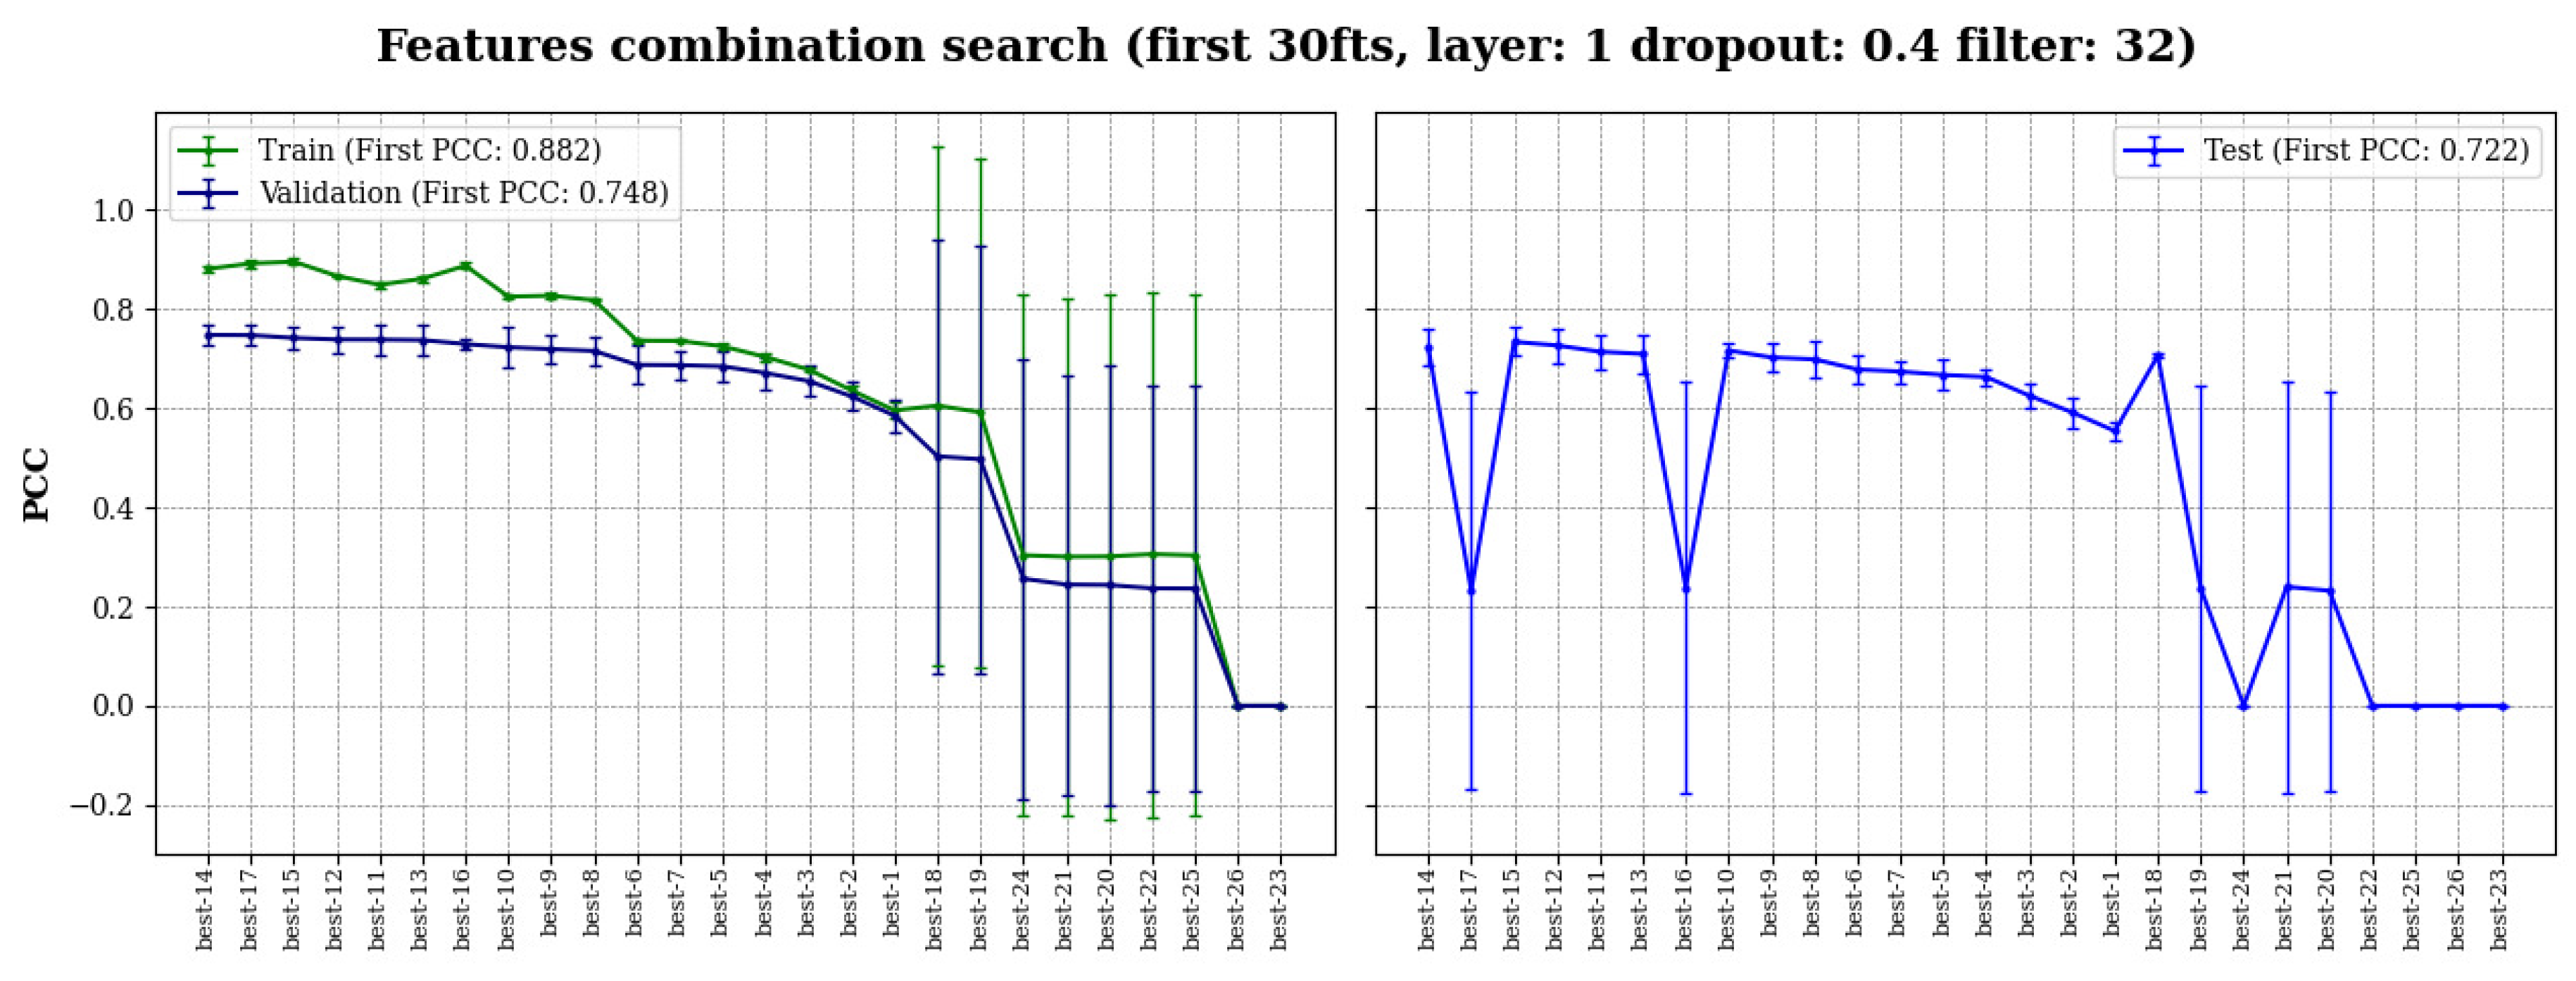
To obtain the best possible predictive performance, it is necessary to determine the combination of feature types for the multiple branch inputs of MBC. For this purpose, we evaluated the feature combinations best-1, best-2, and so on, up to best-26 using the MBC-Attention architecture to predict the experimental MIC values of AMPs against
E. coli. Best-
K features combination means the combination of the top-1, top-2, …, top-
K feature types obtained in the single feature selection. In the best-
K features combination selection, MBC-Attention was run using the parameters identified for MBC for sodium ion channel binding peptides prediction in the previous work [
23]. Training an MBC-Attention model was feasible up to best-26, larger architectures with more CNN branches failed to train due to insufficient computational resources.
Figure 2 showed the performance of the best-1 to best-26 MBC-Attention models; the results were presented in descending order of the average PCC value in validation. The PCC values of models in the test sets were also recorded to confirm the appropriateness of the model selection, which was primarily based on the validation performance. According to the results, the best-1 to best-15 models showed stable performance in the train, validation, and test experiments consistently. Conversely, best-16 to best-26 models showed poor performance with substantially reduced PCC values and exhibited large standard deviation. Although the best-16 and best-17 models produced reasonable results in validation, they showed exceptionally poor predictions in the test sets for unknown reasons. With the exception of the best-16 and best-17 models, all models in the test showed a similar performance trend as in the validation, indicating that model selection based on the validation result is reliable.
As a result, the best-14 features combination was selected for final model optimization where the included feature types were listed in
Table 1. It is worth noting that most of the best feature types are from the PseKRAAC and QSOrder features, differing by the sequence encoding parameters such as the number of reduced amino acid clusters, and the
value (the positional distance between two amino acids along the sequence).
2.3. Traditional machine learning model selection
To establish the baseline performance for MIC regression of AMPs, we set out to identify the optimal traditional machine learning model based on RF and SVM. For this purpose, we evaluated a range of RF and SVM models with different model parameters. All experiments were repeated three times using the best-14 features combination (refer to
Table 1) selected in the Best-
K features combination selection work, and the average PCC value of each model on the three validation datasets was computed.
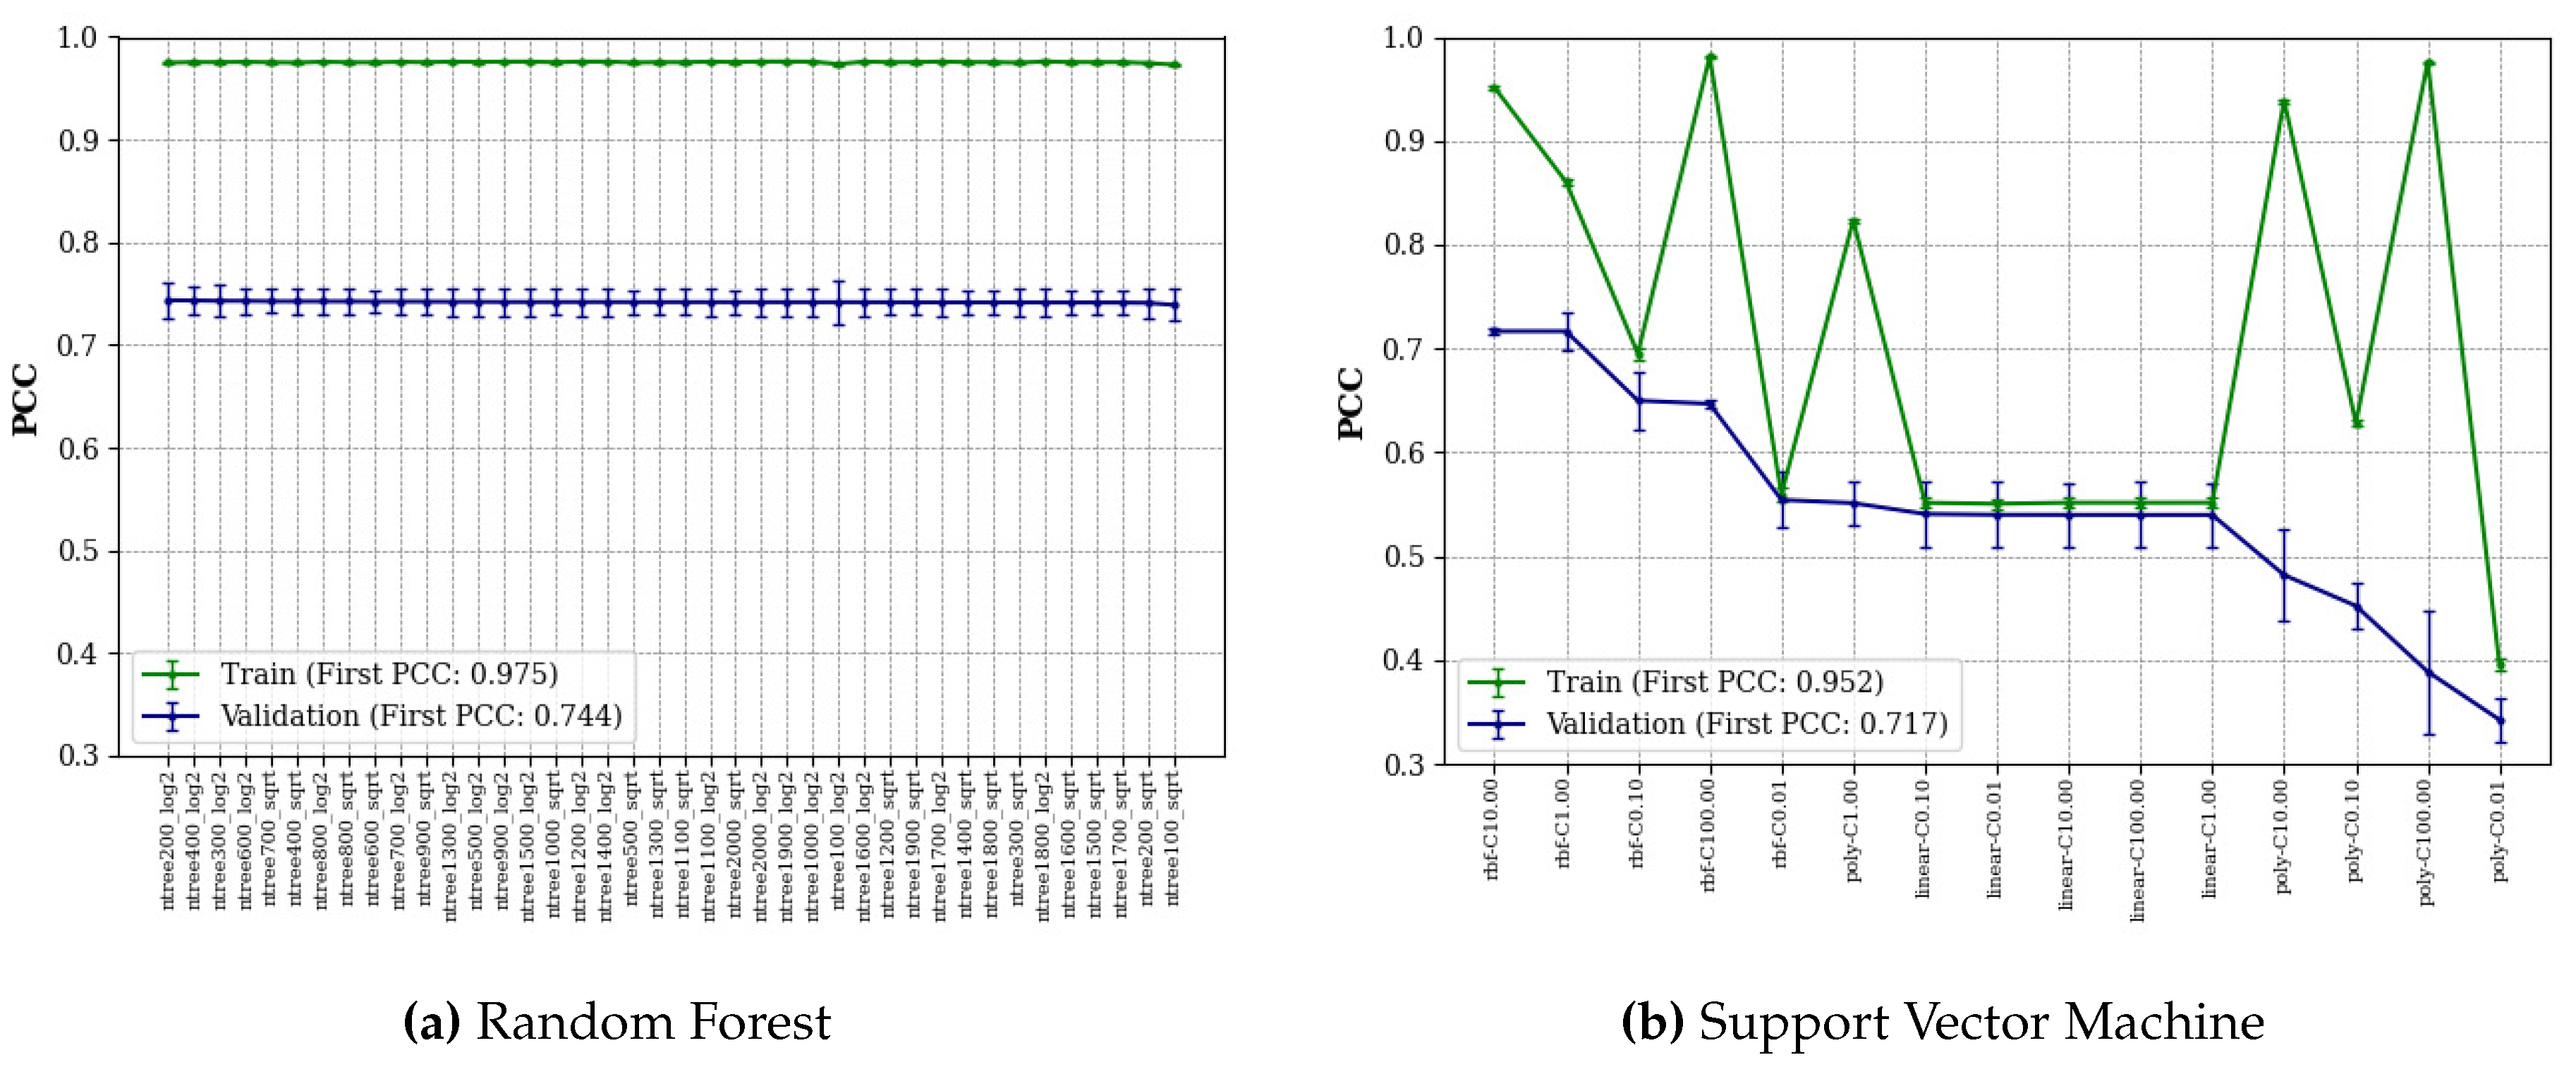
Figure 3 shows the average PCC of the validation and training datasets, and all algorithms are sorted by the average PCC of the validation datasets.
RF models with different numbers of trees (from 100 to 2000 with an interval of 100) and different functions for the maximum features ("log2" or "sqrt") were searched by the grid search algorithm. As can be seen in
Figure 3(a), all RF models performed similarly showing high stability of the algorithm for this regressive task, with the small trees (< 700) and "log2" performing better than the other selections. We found that RF performed best with 200 trees and the maximum feature function of "log2". Meanwhile, SVM models with different kernels ("rbf", "linear", "poly") and regularization parameters (
C=0.01, 0.1, 1, 10, 100) were searched by the grid search algorithm. The result in
Figure 3(b) shows that SVM performed best with the kernel "rbf" and
C of 10 on validation datasets. Overall, for validation datasets, the kernel "rbf" performed better than "linear" and most "poly" performed worst. For the training datasets, average PCCs change only slightly when RF parameters change, and conversely, average PCCs change greatly when SVM parameters change.
To evaluate the best-14 features combination as the optimal choice, we also searched all the above parameters of RF and SVM based on the best-1 features combination and obtained the best average PCCs of RF and SVM of 0.738 and 0.715, respectively, on validation datasets. They are worse than the average PCCs of RF and SVM based on the best-14 features combination. Finally, the best RF model and the best SVM model were selected as the baseline models for deep learning model comparison.
2.4. Comparison between MBC-Attention and traditional machine learning methods
Once the best 14 features were identified, we tuned the MBC-Attention model using grid search to find the optimal hyperparameters for the CNN including the number of filters, dropout rate, number of layers, and loss function. Based on the best hyperparameters, we then manually tuned the early stopping parameters, including learning rate, decay rate, decay steps, patience, monitoring, and so on.
To confirm the effectiveness of MBC-Attention in learning AMP data for MIC regression, the optimized model was compared to the two most widely used traditional machine learning methods, RF and SVM. The two selected models - RF with 1800 trees and max features of "log2" and SVM with the "rbf" kernel – were utilized. All models used the best-14 features combination as input features.
As shown in
Table 2, six criteria were used to evaluate the proposed models. Here, the higher the average PCC, CCC and R
2 are, the better the models perform (↑). Conversely, the lower the average MAE, MSE, and RMSE, the better the models perform (↓). Also, mean stands for average, and std denotes standard deviation. Differences in model performance in the triplicate test experiments were indicated by the standard deviation (sd) in the Table. The results showed that our proposed MBC-Attention performed best on all criteria compared to RF and SVM. Furthermore, MBC-Attention achieved an average PCC of 0.775, which is 5.4% and 12.2% better than the RF and SVM models, respectively.
To test the influence of duplicated features in the best-14 feature combination, we performed an experiment in which all duplicated features were removed, using the same procedure described in Yan
et al. [
23] before constructing the MBC-Attention model. As shown in
Table 2, MBC-Attention with reduced features performed slightly worse (average PCC 1.4% lower) than MBC-Attention, but still provided an improved PCC measure, 3.9% and 10.6% higher than those of RF and SVM, respectively.
It is noteworthy that MBC-Attention showed higher stability than the other three models compared. The standard deviation values obtained for MBC-Attention in all the measures are relatively low (e.g., for PCC, it is 66.7% lower; for RMSE, it is 93.8% to 94.3%) than those for RF and SVM. Reducing input features to MBC-Attention also weakened the stability of the model suggesting that some information was missed if certain features were discarded.
2.5. Ablation study
An ablation study was performed to understand the importance of each component, namely MBC, global attention, and local attention, in the MBC-Attention architecture. As shown in
Table 3, MBC alone performed the worst among all four models. The use of local attention increased PCC by 2.97%, meanwhile the use of global attention produced 3.37% improvement. Together, the two attention schemes increased the performance of MBC by 4.59%, suggesting the importance of attention in learning AMP sequences. Furthermore, MBC-Attention has the highest stability among all four models given the lower standard deviation results in triplicate test experiments.
2.6. Comparison between MBC-Attention and MBC on ion channel datasets
To evaluate the ability of the attention modules on classification problems, we compared MBC-Attention to MBC in predicting ion channel binding of peptides. In [
23], we proposed the MBC method for ion channel binding peptides classification for the sodium (Na-pep), potassium (K-pep), and calcium (Ca-pep) ion channels. For each channel, two different test sets were developed: The ’test set’ consisted of peptides with moderate similarity to those in the training set, whereas the ’novel-test’ set contained peptides that were dissimilar or with low similarity to the training peptides. We added the attention-local module in the middle of the 2D convolutional layer and the max-pooling layer for each CNN layer of all CNN branches and the attention-global module at the end of each CNN branch. MBC-Attention has the same hyperparameters as the MBC method used in the work of MBC for Na-pep, K-pep, and Ca-pep. As shown in
Figure 4, It can be observed that the MBC-Attention performed better than the MBC method for all the three channels (Na-pep, K-pep, and Ca-pep) on both test and novel-test data sets.
3. Conclusion
We proposed an MBC-Attention model to regress the experimental MIC values of AMPs against
E. coli. The MBC-Attention model was developed based on our previous MBC model [
23], which is a multiple CNN branch architecture that performs well in classifying ion channel interacting peptides. We used the MBC architecture for regression tasks and improved its predictive power by adding two attention mechanisms. To evaluate the regressive performance of MBC-Attention, we divided the entire dataset into the train, validation, and test sets. The validation set was used for model tuning and the test set was used to evaluate the generalizability of the final model and for model comparision with the best traditional machine learning models.
Overall, the optimal MBC-Attention model achieved an average PCC of 0.775, R
2 of 0.588, and RMSE of 0.533 (log µM) in three repeated tests using 393 sequences randomly selected from the dataset. The optimal MBC-Attention model achieved on average 5.4% and 12.2% higher PCCs and the best stability compared to RF and SVM, respectively. While MBC performed slightly better than RF, the use of attention, particularly local attention, increased the performance of the MBC model by more than 2.9%, resulting in a better quantitative model for AMP activity prediction for
E. coli. Moreover, we showed that the performance of MBC-Attention on classification tasks was improved compared to MBC evaluated on ion channel peptide classification test datasets [
23]. In future work, we will apply MBC-Attention for antibacterial activity prediction of peptides for other pathogenic bacterial species.
4. Materials and Methods
4.1. Dataset Preparation
We downloaded a total of 7861 data entries of AMP monomers from the DBAASP v3 database [
34] with antibacterial activity against
E. coli. To prepare for ML, the data entries with unnatural amino acids (
’B’, ’J’, ’O’, ’U’, ’Z’, ’X’) in the sequence or entries without experimental MIC values were removed; sequences that are too long (> 60 aa) and too short (< 5 aa) were discarded. For the remaining entries, their MIC values were converted into the same measurement unit (µM) and then converted to pMIC by Eq.
1. For a sequence that has multiple MIC values, these values were averaged to obtain the mean activity measure for the peptide. Finally, the processed dataset of AMP sequence and MIC for
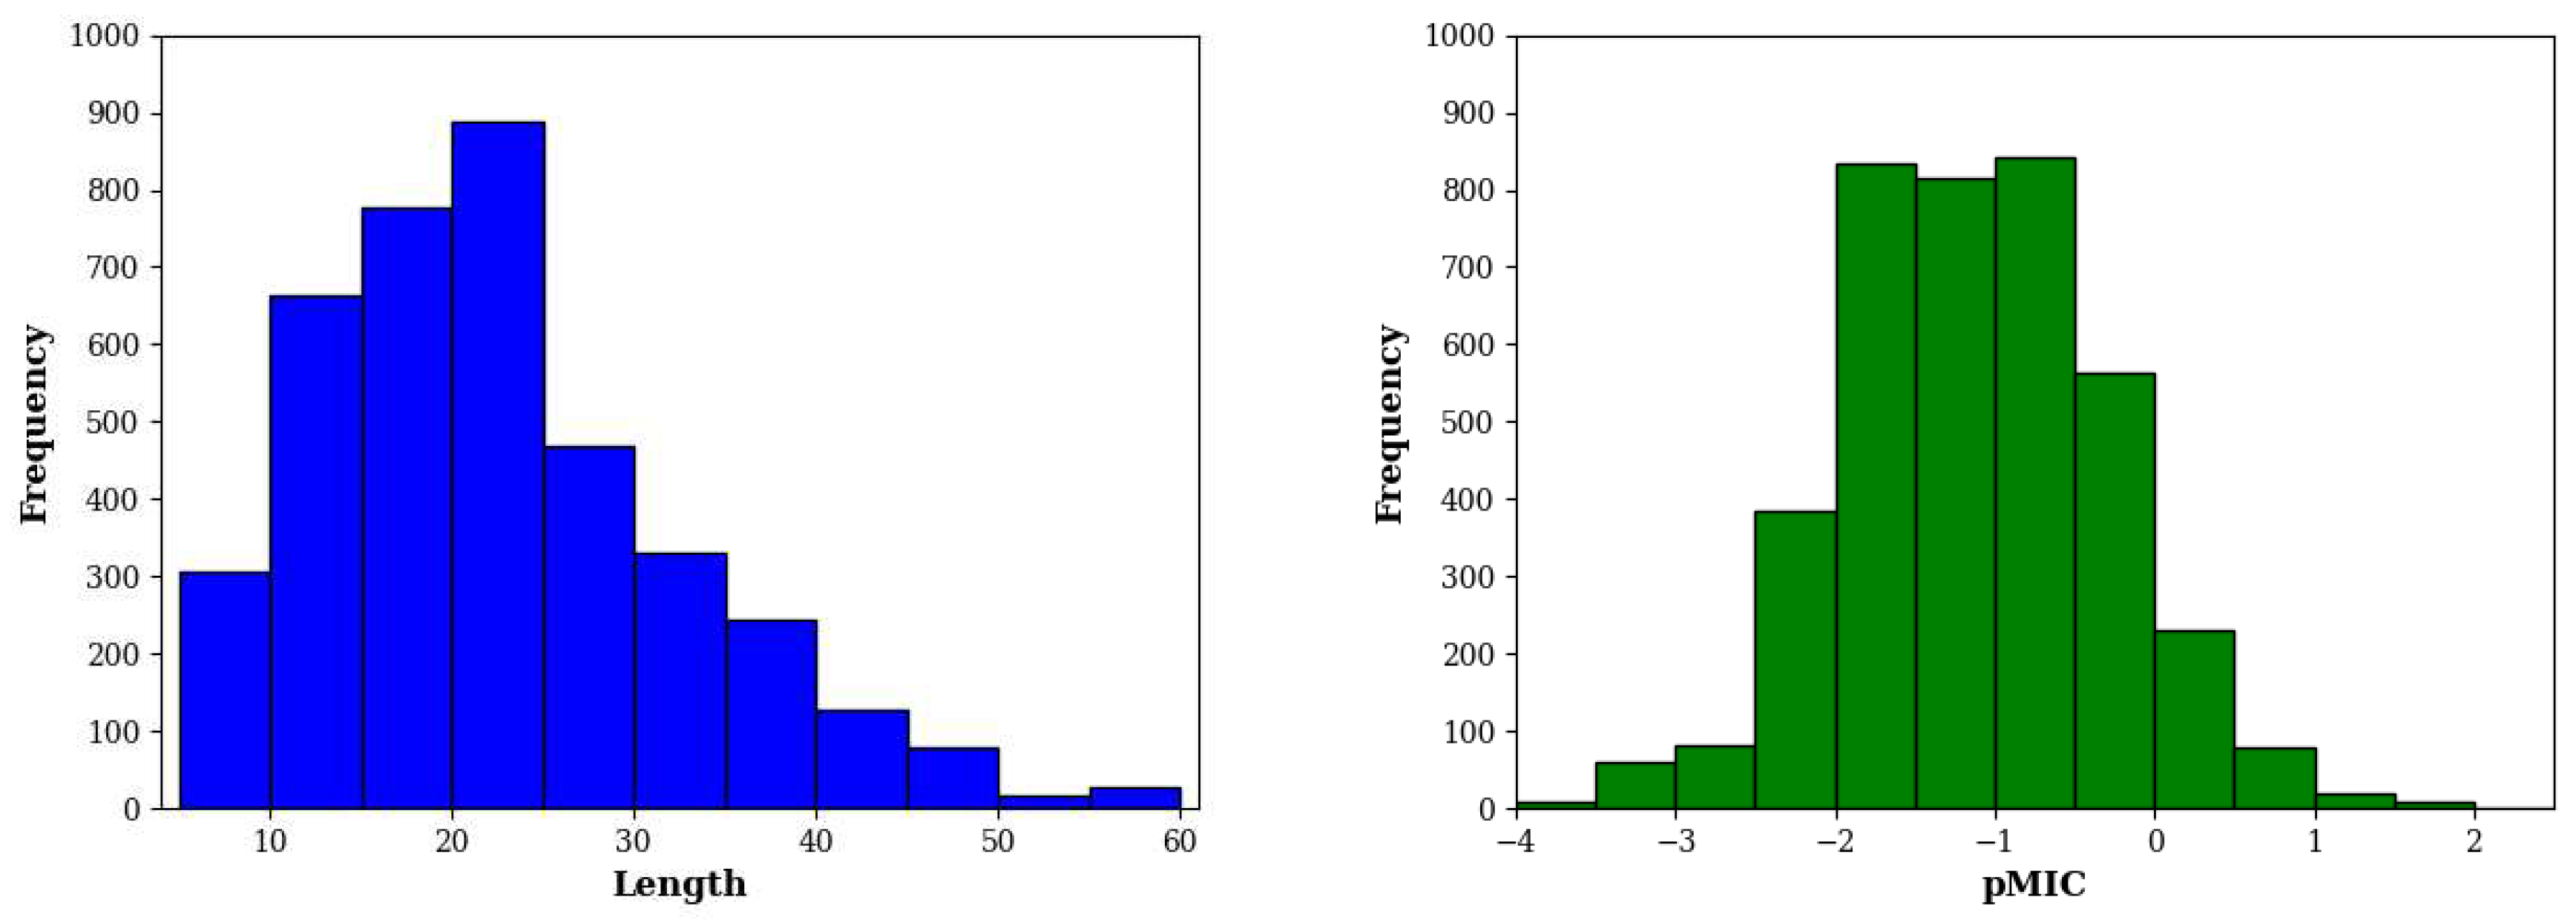
E. coli contains 3929 entries. As shown in
Figure 5, these sequences have a median length of 20 residues and antibacterial activity of 14.8 µM (equivalent to pMIC of -1.17).
For model construction and evaluation, the dataset was randomly split into a train, validation, and test sets. The test set consisted of 10% of the entire dataset, while the validation set consisted of 10% of the remaining set after removal of the test data. To ensure reliable error estimation, the dataset splitting procedure was repeated three times. All experiments were performed on each of the three replicates and the average performance values were reported.
Table 4.
Summary of the AMP data against the Gram-negative bacteria E. coli and data partition for predictive modeling.
Table 4.
Summary of the AMP data against the Gram-negative bacteria E. coli and data partition for predictive modeling.
| Name |
Description |
No. of entries |
| EC of all subtypes |
Downloaded from DBAASP (as of August 2021) |
7861 |
| Whole |
After removing incomplete and duplicate entries |
3929 |
| Test |
Randomly select 10% from the Whole set |
393 |
| Validation |
Randomly select 10% from the Whole set after removing Test |
354 |
| Train |
Data not included in Test and Validation |
3182 |
4.2. Regressive predictive target
In this work, the negative logarithmic MIC (pMIC) against the bacteria is the regressive predictive target. The pMIC can be represented as follows:
4.3. Performance Metrics
We used Pearson Correlation Coefficient (PCC), Concordance Correlation Coefficient (CCC), mean absolute error (MAE), mean squared error (MSE), root mean squared error (RMSE), and coefficient of determination () as metrics to measure the performance of the regressive models. Note that the lower the value of MAE, MSE, or RMSE, the better the regression models. Conversely, the higher the value of PCC, CCC, and , the better the regressive models.
The formula of
or
is shown as follows:
where
i denotes the
sample and
N is the sample number;
y represents a true target value and
the predicted target value by the regressive model;
, and
represent the average of the true and predicted regressive target values, respectively.
The formula of
or
is shown as follows:
where
and
denote the corresponding variances of true and predicted regressive target value, respectively.
The formula of
MAE is shown as follows:
where
i denotes the
sample of prediction target value of regressive models (
);
y represents true target value of regressive models;
N is the sample number.
The formula of
MSE is presented as follows:
The formula of
RMSE is defined as follows:
The formula of
is shown as follows:
4.4. Feature encoding of peptide sequences
We examined a total of 4481 different features to find the optimal combination of AMP sequence encoding methods. The encoding for 4480 features was generated using the iFeature package [
35] while the oneHot feature encoding was implemented ourselves. oneHot produces a
feature matrix (
is the maximum length of all given peptides) which represents the position of each amino acid in the sequence. Among the different features from iFeature, 53 of them were generated by 21 feature types (such as AAC, CKSAAP, KSCTriad, SOCNumber, etc.) using different parameters. But a majority of features (totally 4427) were from PseKRAAC, which generates encodings based on a set of user-defined parameters including ktuple, g-gap and
-correlation.
Table 5 shows all feature types and corresponding parameters used in sequence encoding.
4.5. MBC-Attention
MBC is short for Multi-Branch-CNN, which is a deep learning architecture for peptide activity prediction based on amino acid sequences. It was proposed in our previous study of machine learning for ion channel interacting peptides prediction [
23]. MBC accepts multiple square matrices as input in a parallel fashion to multiple CNNs via independent branches. Each CNN branch contains 2 CNN blocks. Each block in turn consists of a batch normalization layer, a 2D convolutional layer with 64 filters, and a max pooling layer. Subsequently, outputs from all CNN branches are flattened, concatenated, and passed to a dense, fully connected layer with 64 nodes. The output layer contains 2 nodes to generate classification outcomes. All nodes use
relu as the activation function except for the last output nodes which use the
sigmoid function.
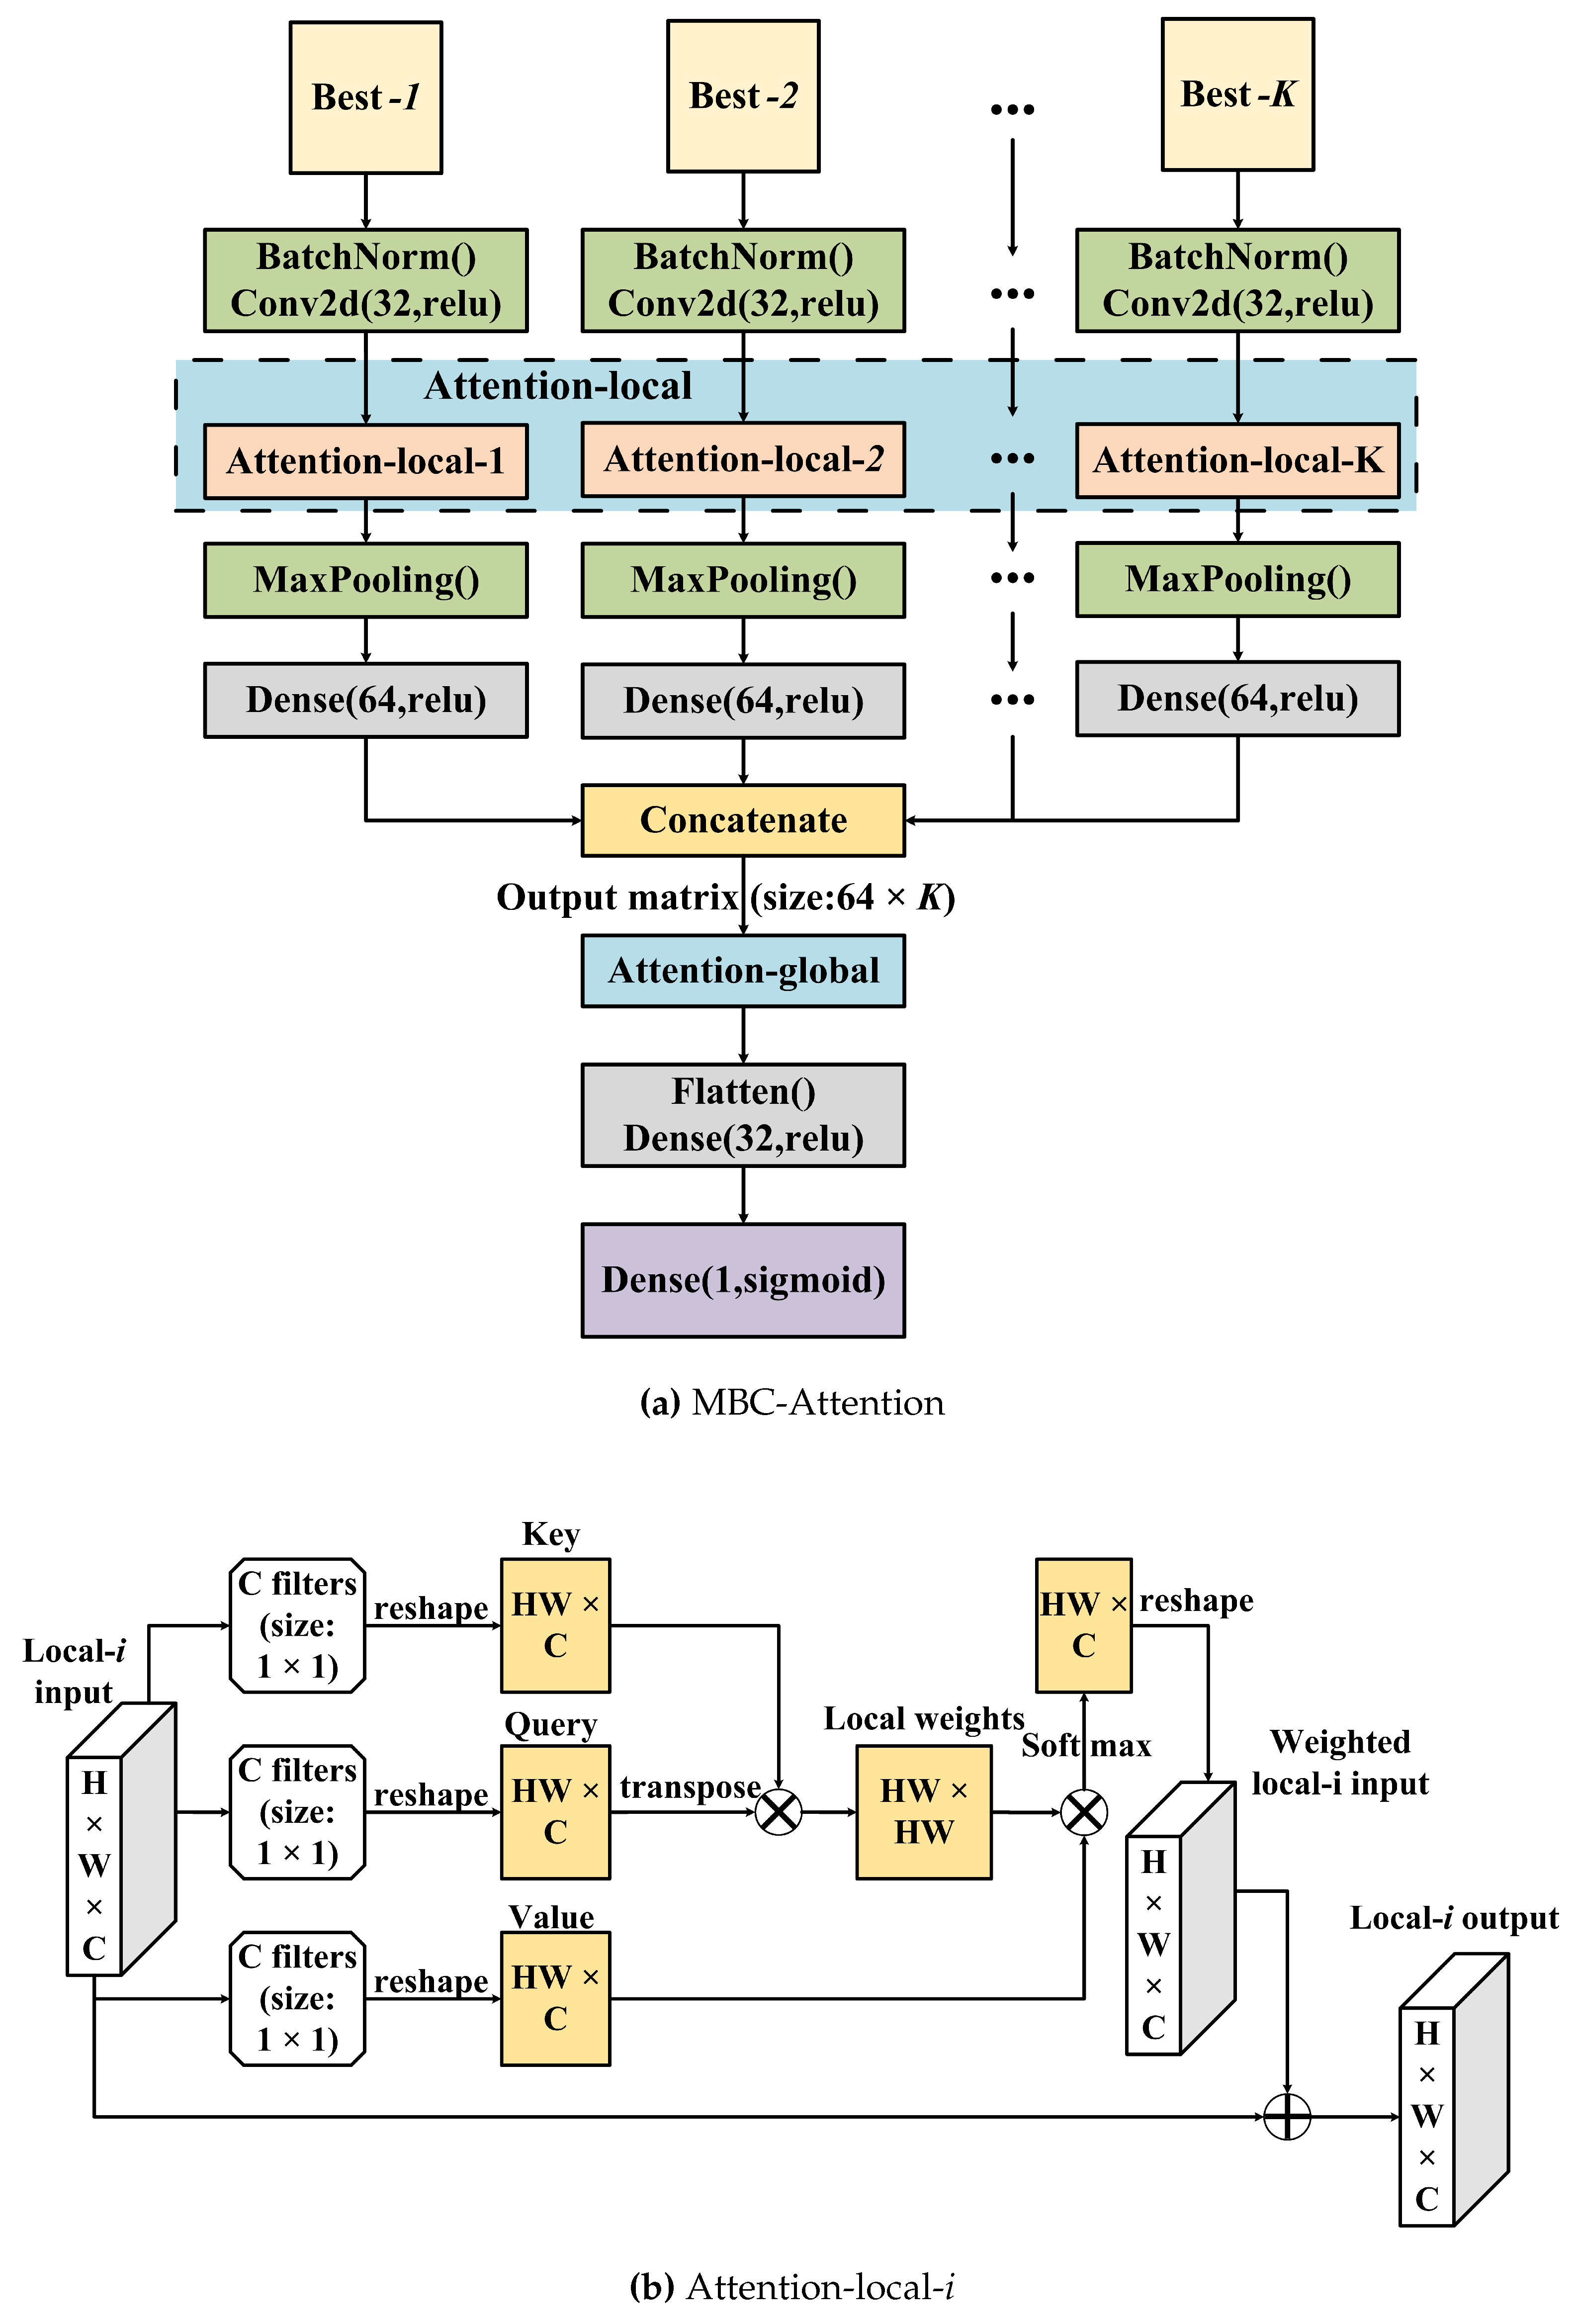
MBC was designed to solve classification tasks for peptide sequences. Here, modifications were required to accommodate the more challenging regression modeling and to improve predictive performance. The final architecture of MBC-Attention is shown in
Figure 6. Unlike MBC, MBC-Attention contains only one output node that generates the regressive target (pMIC). Each CNN branch contains a batch normalization layer, a 2D convolutional layer, an attention-local layer, the max-pooling layer, and a dense layer. Then, all 1D outputs of the dense layer were concatenated into a 2D matrix and passed to the global attention layer. Then, the output of the attention-global layer was flattened and another dense layer was run. Finally, a dense layer with a node was created as the final regressive output. The network was updated by back-propagation. After the tuning procedure (as detailed below), the optimal MBC-Attention was determined with the following hyperparameters: 14 CNN branches, 1 convolutional layer with 32 filters in each CNN branch, a dense network with 32 nodes, the
relu activation function for the internal nodes, and the
sigmoid function for the output node.
For extracting the whole information in each branch and the correlation between the different branches, we proposed two modules: attention-local and attention-global. Attention has three elements – key, query, and value. It aims to use the similarity of a query and a key to weigh and adjust the value accordingly. As shown in
Figure 6, the attention-local module is introduced in each CNN branch to improve the regressive performance. In the attention-local-
i layer (
), the local-
i input is a
matrix, where
H,
W, and
C stand for height, width, and channel, respectively, where C corresponds to the filter number of the previous convolution layer (
Figure 6(b)). Furthermore, ⨂ denotes matrix multiplication and ⨁ denotes matrix addition. First, three convolutional layers with the same blocks of 50 filters whose size is
were utilized to generate three equal 3D matrices and reshape them into three 2D matrices (
) to mimic the key, query, and value terms. We then used the transposed query and key by matrix multiplication to compute their similarity, and the output was processed by a softmax function for each row to obtain the local weights. Then, the local weights were multiplied by the value and transformed into the same dimension of the input of the attention-local-
i module. Finally, matrix addition of the local-
i weighted input and the local-
i input was performed to adjust the original inputs. As can be seen in
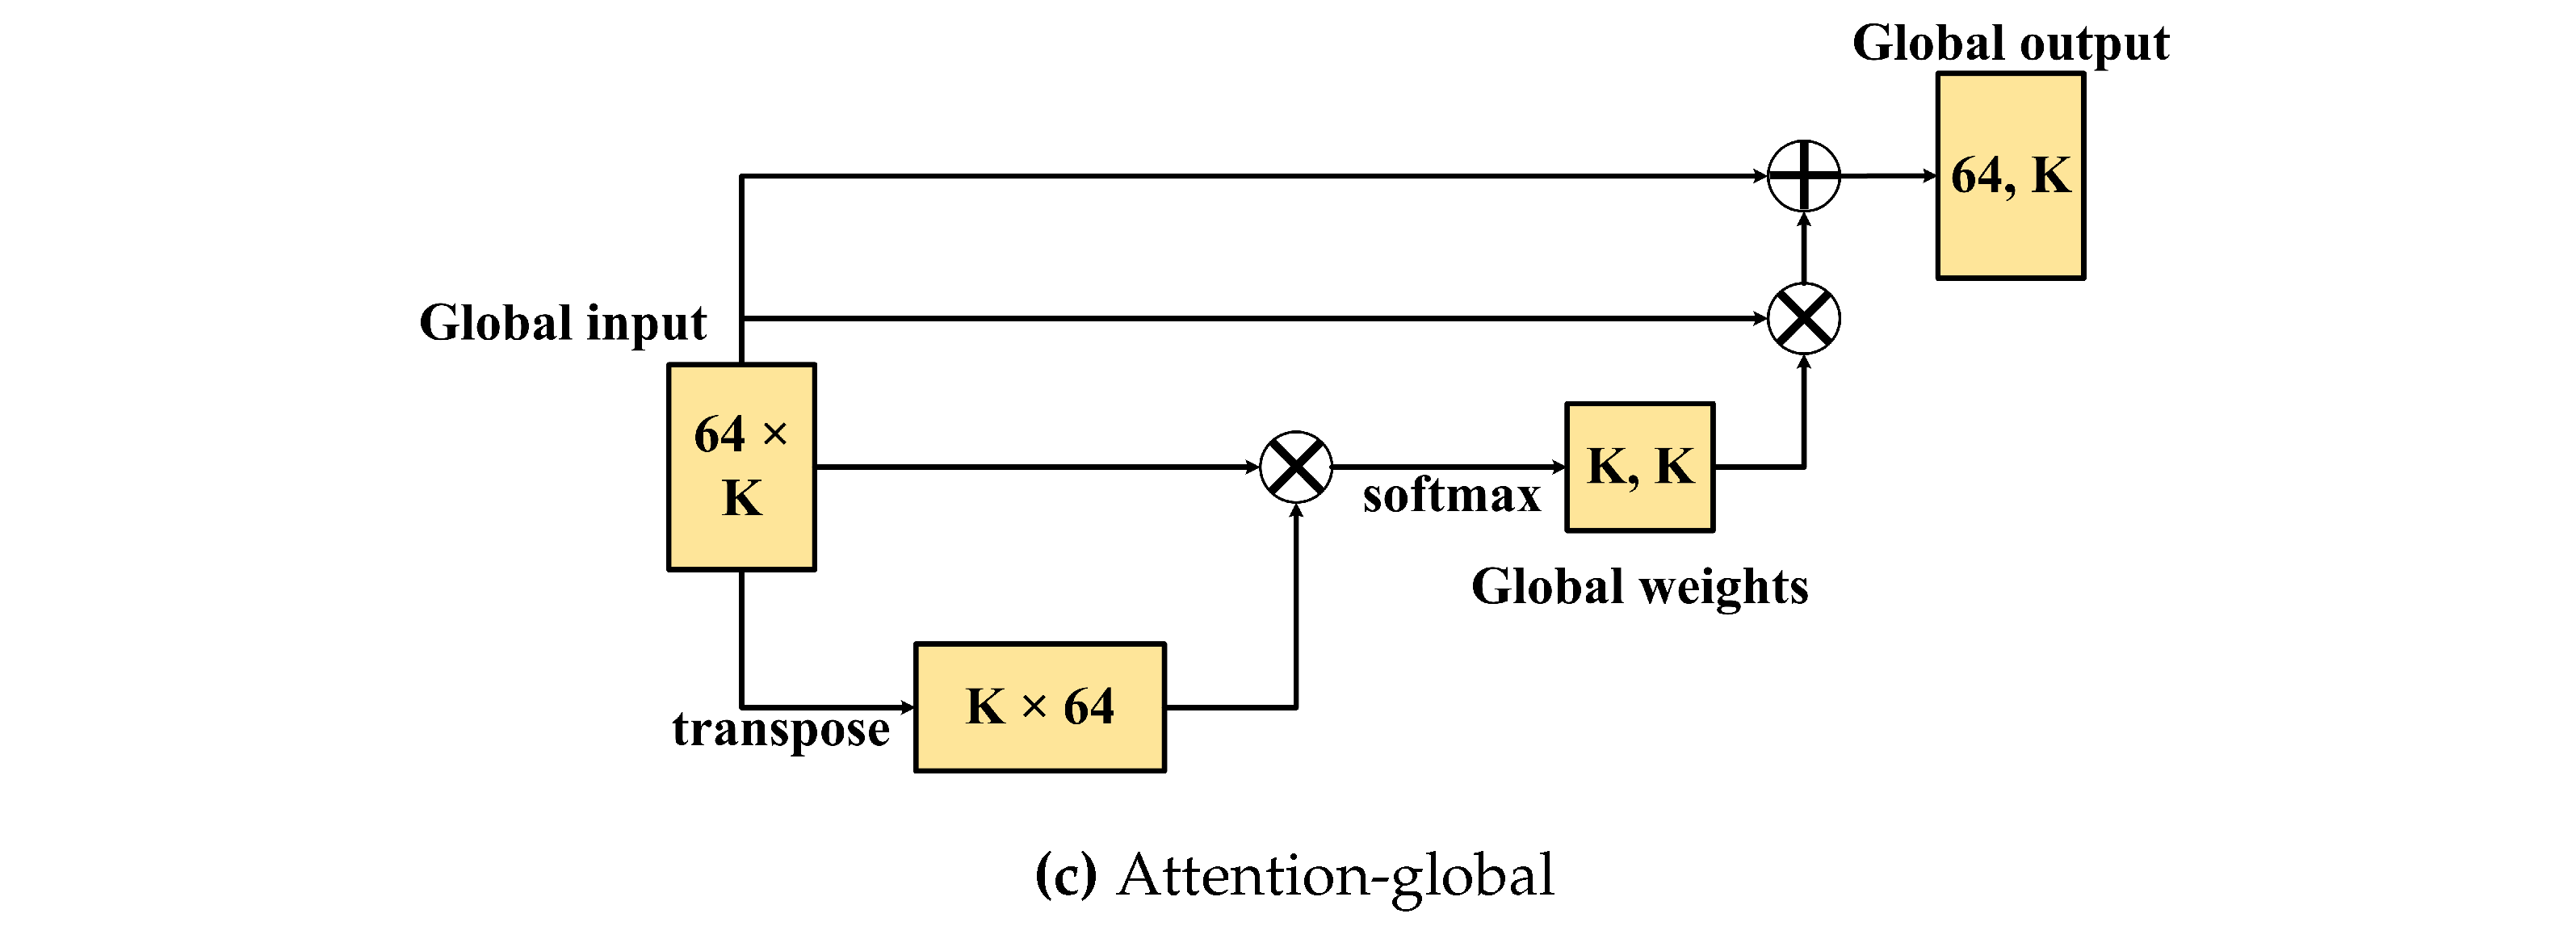
Figure 6(c), the attention-global module aims to adjust the information of the global/branches by transposing its input and then multiplying it by the global-input. After that, softmax was used to generate the global/branch weights, and the global weights were then multiplied by the global inputs. Finally, matrix addition of the global-input and the previous output was used to obtain the fitted information of the branches.
In summary, the main change in MBC-Attention compared to the previous MBC is the introduction of attention mechanisms. Within each CNN branch, an attention-local module was added to compute the importance of local features, and in addition, an attention-global module was integrated to extract the relationship between different CNN branches.
4.6. Feature selection
Inherited from the MBC architecture, MBC-Attention can accept multiple feature types as input and learn each of the feature types independently via multiple branch CNN. To determine a set of informative feature types for the regressive task at hand, a two-step feature selection was performed similarly to the previous study [
23]. In the first step, each feature type had a quick evaluation for regressive performance using RF with 400 trees. The top-performing feature types were identified based on the average PCC value of the model. In the second step, all the best-
K feature combinations were evaluated using MBC-Attention, where best-
K is the top
K feature types from the sorted list returned in the first step. Due to limited computational resources, the largest
K features combination examined was 26.
4.7. MBC-Attention parameter tuning
To find the best CNN architecture in MBC-Attention, we tested the model performance using 1, 2, or 3 convolutional layers and setting the dropout rate to 0, 0.1, 0.2, 0.3, 0.4, or 0.5; the number of filters in each layer to 16, 32, 48, 64, 80, 96, 112, or 128; and the loss functions to MSE (mean square error) or MSLE (mean square logarithmic error). Note that all the training stopped at 200 epochs for reducing the time for tuning. Furthermore, each experiment was repeated 3 times. The parameter search was performed by grid search and the results were sorted by average PCC values in validation. In total, there were 3 × 3 × 6 × 8 experiments to find the best hyperparameters of the final MBC-Attention model. The final hyperparameters are as follows: CNN layer = 1, filter = 32, dropout = 0.4. To obtain a stable performance in the prediction model, we manually tested the use of an early stopping criterion over different settings of the parameters ’patience’ and ’monitor’, as well as training using different learning rates, decay rates and numbers of decay steps. Finally, we found that early stopping monitored with ’loss’, via a learning rate of 0.0005 and patience of 15, decay rate of 0.92, and decay steps of 25 were the best combination.
