1. Introduction
Currently, the development of larger and more complex underground spaces has become a trend for future underground space development [
1]. Underground space has the characteristics of "deep, large, clustered, and hidden". Once an accident occurs, it can easily cause a catastrophic impact [
2,
3]. However, the existing safety perception and prediction technology for underground space structures cannot guarantee the safety of underground space structure construction and operation. In particular, urgent problems still need to be solved in terms of state perception, disease identification, and mechanistic analysis [
4]. In addition, the working environment of underground space detection equipment is complex, spatio-temporal monitoring data are unusually diverse, and the quality is uneven, which often causes problems such as "unclear detection, inaccurate measurement, and inaccurate judgment" of the underground space, thus leading to an incorrect estimation of the safety status of the underground space, which may endanger the safety of the underground space [
5]. Therefore, improving the global awareness of underground spaces and the quality of data detection has become an urgent problem to be solved in the construction of underground spaces.
The detection objects of underground space information include the detection of underground tangible objects and intangible material parameters; however, the essence of realizing their information data detection quality lies in improving the detection accuracy of information data and the strength of signal transmission. The tangible objects in the underground space include the underground space structure, object contour shape, production equipment position, and moving object trajectory. At present, the detection methods of underground space are mainly based on ground-penetrating radar [
6], and the portability and high-resolution characteristics of GPR [
7,
8] make GPR widely used in subgrade surveys and underground space pipeline detection [
9]. However, the penetration depth of ground-penetrating radar is limited, and the effective detection depth generally does not exceed 10m [
10,
11], it can only detect shallow urban facilities and has no detection capability for underground targets below 30m. The existing shallow surface wave method [
12,
13,
14] has difficulty meeting the detection requirements of urban geophysical exploration owing to its weak anti-jamming capability. Reference [
15,
16] proposed a load differential radiation pulse on a transient electromagnetic high-performance radiation source for pulse scanning detection to solve the problems of urban electromagnetic interference and insufficient harmonic components emitted by radiation sources. However, the detection method of pulse scanning alone is incomplete and a corresponding imaging method is required. More importantly, the above methods can only be applied to the detection of information tens of meters below the ground, and they cannot be applied to underground spaces hundreds of meters deep.
The objects of detection of intangible substances in underground spaces include gas, pressure, temperature, humidity, noise, and stress. At present, the detection methods for the parameters of underground intangible substances are still the same as those for intangible substances in above-ground space. Reference [
17,
18,
19] designed a hardware system based on radar and realized the real-time detection function of underground space related information by enlarging the detection information. However, the measurement error cannot be eliminated and applied to underground spaces with tortuous paths. Reference [
20] proposed a three-frequency resonance transmission scheme to solve the problems of low efficiency in the conventional single-frequency transmission method and high voltage stress in the multifrequency pseudorandom transmission method. However, the scheme only solves the problem of signal transmission efficiency and does not improve the quality of information data. Reference [
21,
22]The self-developed rotary drilling system and three-dimensional flexible boundary loading device were developed to carry out the rotary drilling model and realize the detection technology of stress betteen rocks in underground space. However, they have limitations in the application space and cannot be used for remote detection of information data. ZhengXuezhao et al.[
23] studied a multi-information drilling detection device based on key technologies, such as multimedia information collection, synchronous transmission, and underground explosion-proof facilities, and realized the collection function of key information data of underground space. However, this method is based on drilling from the ground to the underground space and placing the equipment in the underground space for later detection, so there are shortcomings of low efficiency and information lag. Bin Sun et al. [
24] proposed a bionic artificial intelligence algorithm driven by temperature data to detect a fire source in the three-dimensional space of an underground pipe gallery. However, this method can be used only for fire prevention in underground pipelines.
More importantly, the above methods have the following shortcomings in the information collection of underground spaces:
They are mainly used to detect the position and shape of tangible objects, and there are shortcomings in the field of high-precision remote detection that cannot be applied to object performance parameters. Therefore, there are limitations in the application field.
Their essence is to highlight the difference between information data to improve the detection accuracy of the difference data, It fails to eliminate the detection error caused by various factors in the process of long-distance transmission of in-formation data fundamentally.
In the detection process, because the detection object is in a random transformation state, the above information detection system does not have the ability to adjust the technical parameters with the changes in the tested object in a timely manner. Therefore, it affects the accuracy and real-time detection of the information.
In the detection of underground space information data, the above methods have the disadvantage of large energy loss in application, which restricts the depth and data accuracy of detection information; therefore, there are limitations in the application space.
Therefore, to date, no detection method that can be applied to various types of detection objects in underground spaces with high precision over long distances has been found. To solve these problems, our team has engaged in research on methods using fractional-order calculus theory in data processing for many years and found that the fractional-order differential operator has the dual function of improving the signal strength and reducing the variability between information data. Therefore, it can effectively improve the transmission distance and detection accuracy of information [
25,
26,
27,
28,
29,
30,
31]. Based on previous research, in this study, we applied fractional calculus theory to the detection of underground space information data.
5. High-Precision and Long-Distance Detection Method for Under-Ground Space Information Based on Fractional Differential Algorithm
5.1. Fundamental Principle
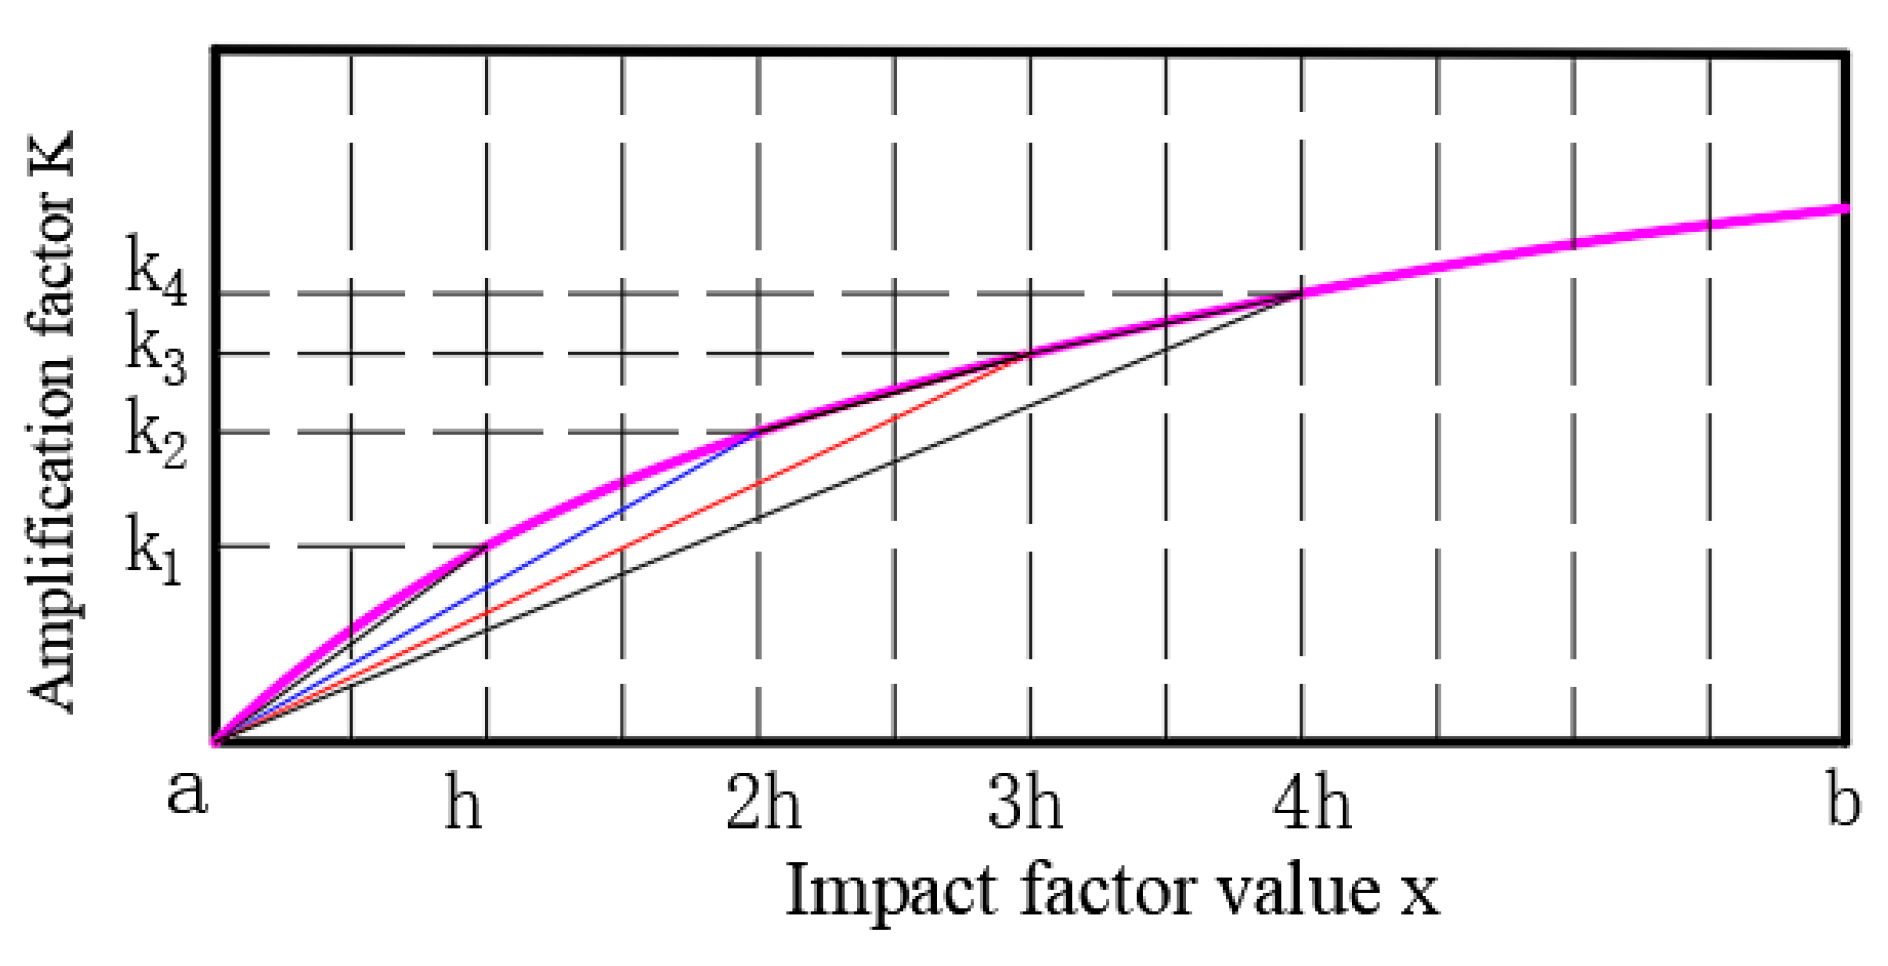
The remote and high-precision detection of data by a detection system is essentially a dual function achieved through the processing of the detection data. As mentioned previously, the transmission of data over a desired distance can be achieved by setting the number of iterations j of the differential operator for data processing based on the amplification factor K of the fractional-order differential operator and the established amplification factor KG of the detection system. The detection accuracy of the data can be achieved by comparing the established accuracy SG of the system and the accuracy S of the fractional-order differential operator, and gradually adjusting the step value h of the fractional-order differential operator so that SG can be approximately achieved. Therefore, obtaining the step value h and amplification factor K required by the fractional-order differential operator in data processing under the established conditions is a prerequisite for achieving the research objectives. From the results of the above study, it is known that the accuracy of data detection at the same fractional order depends on the step value h of the fractional-order differential operator, which is independent of the amplification factor K. The calculation of the amplification factor k of the fractional-order differential operator must be based on the fact that step value h is known. Therefore, in the implementation of the long-range, high-precision acquisition method for detecting data, the method of calculating the step value h required to satisfy the established target and then applying it to calculate the amplification coefficient K of the fractional-order differential operator can be sequentially used.
5.2. Mathematical Model
The analysis system is intended to transmit an energy signal
H(
t) to a location at distance
L, and the accuracy of the acquired data must not be lower than
SG. To ensure the reliability of the data detection system, the detection signal must be amplified, and the enhancement factor must not be lower than
KG. The data
H(
xi) of signal
H(
t) at different time points
ti are collected. The main influencing factor of the obtained data is
x and its value interval [
a, b]. A function
H(
x) relating the detection data value
H(
xi) to
xi is fitted. According to the signal characteristics of the signal
H(
t) and the spectral characteristics of the fractional-order differential operator, the proposed method of applying the differential operator at fractional order
v for the long-range, high-precision detection of data was used. With reference (1), the fractional-order differential processing equation of data under known conditions is
In (21),
is a binomial coefficient, defined as
According to the above theory for long-distance and high-precision transmission of data, the standard deviation of the data is calculated after the fractional-order differential operator is applied as follows:
If the detection accuracy target set by the system is to be achieved, the following conditions must be satisfied:
As mentioned above, if the step value of the fractional-order differential operator is
h, the system can be calculated using a stepwise approximation method to meet the system accuracy target
SG. Then,
h is introduced into (23) to obtain the amplification factor of the detection data after processing by the
v-order differential operator, as follows:
By combining the required data enhancement factor
KG of the detection system and referring to (19), the number of fractional-order differentiations
m required to detect the data is.
The number of fractional order differentiation processes for the detection data is m.
5.3. Implementation Steps
Suppose the underground space information detection system detects an energy signal H(t), where t∈ (t1, t2). Referring to (7), we can get the corresponding equation G(x), x∈ (a, b). The signal characteristics of the data to be detected and its usage requirements are analyzed. The data accuracy SG and the amplification factor KG required to achieve the data detection target are set. According to the above fundamental principle, The remote and high-precision detection methods of underground space information data are as follows:
A data processing scheme is developed for underground space information data based on fractional calculus theory, according to the set data accuracy SG and signal amplification coefficient KG.
The collected data H(xi) of underground space information is applied to analyze the important influence factor x, and the functional relationship between the data and the influence factor H(x) is obtained by fitting.
The appropriate fractional order v for the processing of data is selected based on the characteristics of the detection data signal and the amplitude and frequency characteristics of the fractional-order differential operator.
The step value h required to achieve the required accuracy SG of the system is calculated based on the mathematical model shown in (12) and (14).
The amplification factor K of the fractional-order differential operator is calculated based on the data, and the number of iterative cycles j required to achieve the data amplification factor KG is determined.
Through the integration of high-precision detection method and long-distance transmission method of underground space information data, the high-precision remote transmission function of a signal in underground space is realized. It not only successfully solves the problem that the two functions of the current method cannot be considered, but also realizes the detection technology of information data under the established detection target.
6. Application Examples
6.1. Experimental Environment
Therefore, controlling the gas concentration at the working face is a key issue, and it is difficult to ensure safe mine production. To realize the effective control of the gas concentration at the working surface, we first need to accurately measure the gas concentration at the working surface and transmit the detection data in real time. However, the transmission distance and accuracy of the detection data are limited by the performance of the detection instruments, working environment, signal interference, and other factors. Therefore, achieving accurate measurement and long-distance transmission of gas concentration at the working surface has always been a technical problem in the safety management of high-gas coal mines.
To test the application of fractional-order calculus theory in data detection, the 151302 working surface of a mine in Huainan City was considered, which is located approximately 100 m from the surface and 2 km from the main shaft. The test required real-time accurate detection of the gas concentration at the working site under existing conditions. The experiment required a real-time accurate gas concentration detection function for the operation site under existing conditions. Owing to the long distances and dynamic changes in the operation site at the coal mine working face, the experiment required a wireless network to realize the real-time long-distance transmission of the collected data. To ensure the normal production of the working surface and the safety of the experiment site, after considering various factors, we designed a structural diagram of the gas concentration detection system, which is shown in Figure 5, and developed the corresponding data detection scheme. The data sensed by the gas concentration sensor were first transmitted to the gas concentration detection system near the working face by Wi-Fi wireless network transmission, and then the data processed by fractional-order differentiation were transmitted to the underground data center by an optical fiber transmission method. Finally, the data collected by the underground data center were transmitted to the surface data management center using a Controller Area Network (CAN). Owing to the complex structure of underground space, there are many interference sources in the process of data detection.
Owing to the complex spatial environment of the underground structure and the twists and turns of the fiber arrangement path, the traditional calculation of the fiber energy attenuation coefficient is not suitable for this case. To ensure the accuracy of the experimental results, this study adopted an experimental method to calculate the energy attenuation coefficient during signal transmission under existing working conditions. In the experiment, we chose an information transmission distance of 100 m and found its energy attenuation coefficient to be 0.63 after testing. Therefore, the data management center needs to amplify the signal strength by more than 6.25 times to achieve effective sensing and high-precision collection of data on the operating surface 2 km away. To ensure the detection quality of the collected data, the standard deviation should not exceed 0.005.
To improve the accuracy of the data, six working 3-2.3V LEL combustible gas sensors were used to measure the gas concentration at the working site of the working face. The six sensors worked simultaneously and were measured once every 5 s, and the data collection center collected five gas concentration measurements from the six sensors. Therefore, we can extract 30 data points at the same location in real time as the experimental samples, as shown in
Table 1.
6.2. Pre-processing of Data
6.2.1. Analysis of Data
In the experiment, the average value of five measurements of each sensor,
, was considered to be the true value, and the average value of all measurements,
, was considered to be the true value,
E. A summary of gas concentration detection data for the working face is presented in
Table 2. The detection data exhibited an irregular distribution around the measured true values. Therefore, influenced by multiple factors, such as the performance of the detection equipment and the working environment, the initial detection value of the gas concentration at the coal mine working surface had a large detection error, which created difficulties in providing accurate detection values for the safety management of the coal mine and significantly affected the decision-making of the safety management system.
6.2.2. Influence Factor of Data
Owing to the harsh environment and complex working conditions of the underground structural space, the detection data in the transmission process will inevitably be affected by a variety of factors, which results in a large data detection error. Six sensors were applied in the same working environment, and they operated at the same time and frequency to detect the gas concentration at the location. Thus, the effects of the environment and energy losses on the transmission of data are essentially the same. The variability of the detection data between the sensors was mainly due to differences in the performance of the detection equipment. Because the standard deviation is the best parameter for measuring the performance of the testing equipment, it was used as the influencing factor of the measured values of the sensor to analyze the correlation between the performance of the testing equipment and the measured value.
6.2.3. Equation Relating Concentration Data and Impact Factor
Because the least squares method has the advantage of not requiring a priori data in the data processing, it is widely used to fit polynomials to relate data and its influencing factors, and it can achieve ideal data processing accuracy. Thus, the least-squares method was used in this case to fit the function
E(x) between the measured value
Ei of each sensor and its influence factor
xi. According to the parameter values of each sensor's measured value
Ei and its influence factor
xi (standard deviation) shown in
Table 2, the mathematical expression of the function
E(x) is assumed to be:
To obtain the function E(x), the polynomial order n and the coefficients ai (i = 0, 1, … n).
For least-squares fitting, the order of the fitted polynomial should be smaller than the number of data samples. Thus, the order of the function
E(
x) is sought when n < 6. Because the fitting accuracy of the function
E(
x) does not necessarily improve with an increase in the order
n, the best order value was found between 0 <
n < 6 to minimize the error between the function
E(
x) and the measured true value. The Polyfit function in the MATLAB software was applied, and the total errors of the fitted values of (27) at different orders are shown in
Table 3. Based on these results, we can conclude that, when
n=3, the total error between the fitted and measured true values of each sensor is 0.012, which is the smallest. The equation for the
E(
x) function is:
6.3. High-precision Detection of Data Based on Stepwise Approximation Method
According to the working principle of the stepwise approximation method and the characteristics of the data in this case, the implementation process of the method is as follows:
The corresponding mathematical treatment under fractional-order differentiation was modeled based on the available experimental conditions and data.
The appropriate differential order v is selected based on the detection data characteristics and fractional-order differential operator properties.
The established mathematical model was applied to set the initial step value h and the initial standard deviation Ss was calculated under known conditions.
The step value h was continuously adjusted by comparing it with the set system threshold SG until the accuracy met the set system accuracy threshold SG.
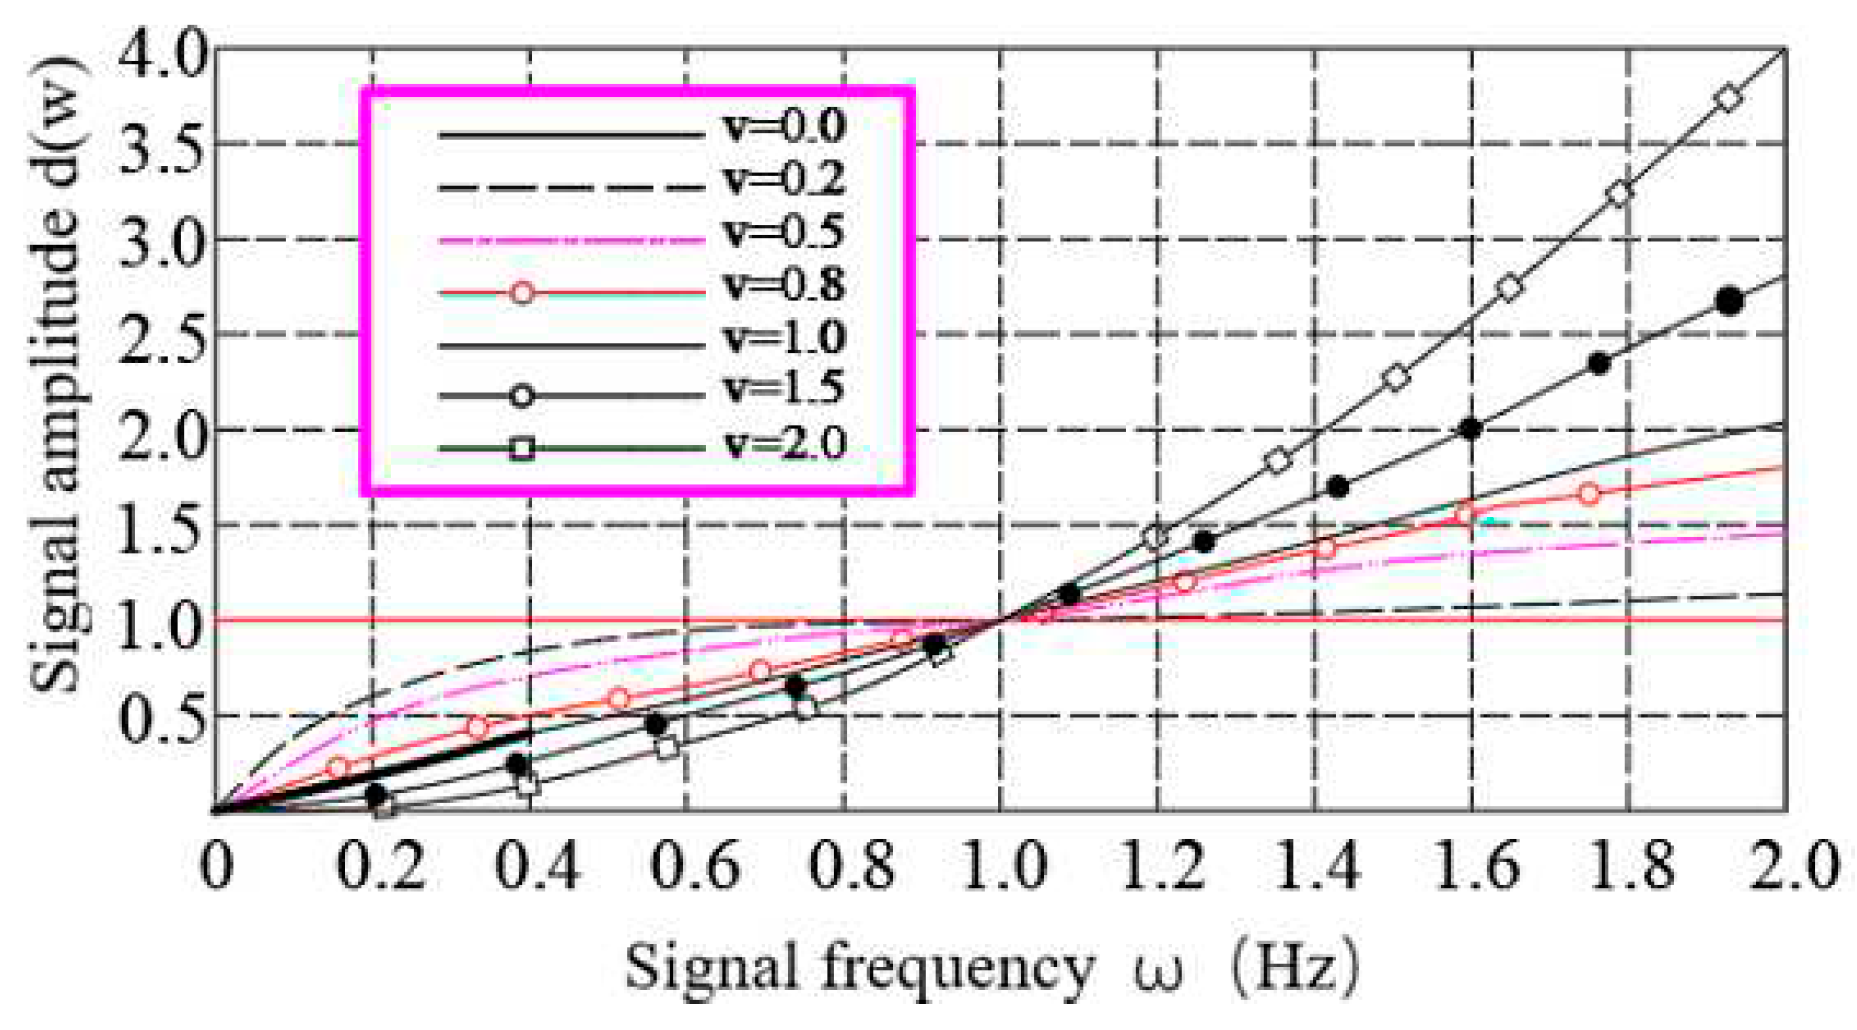
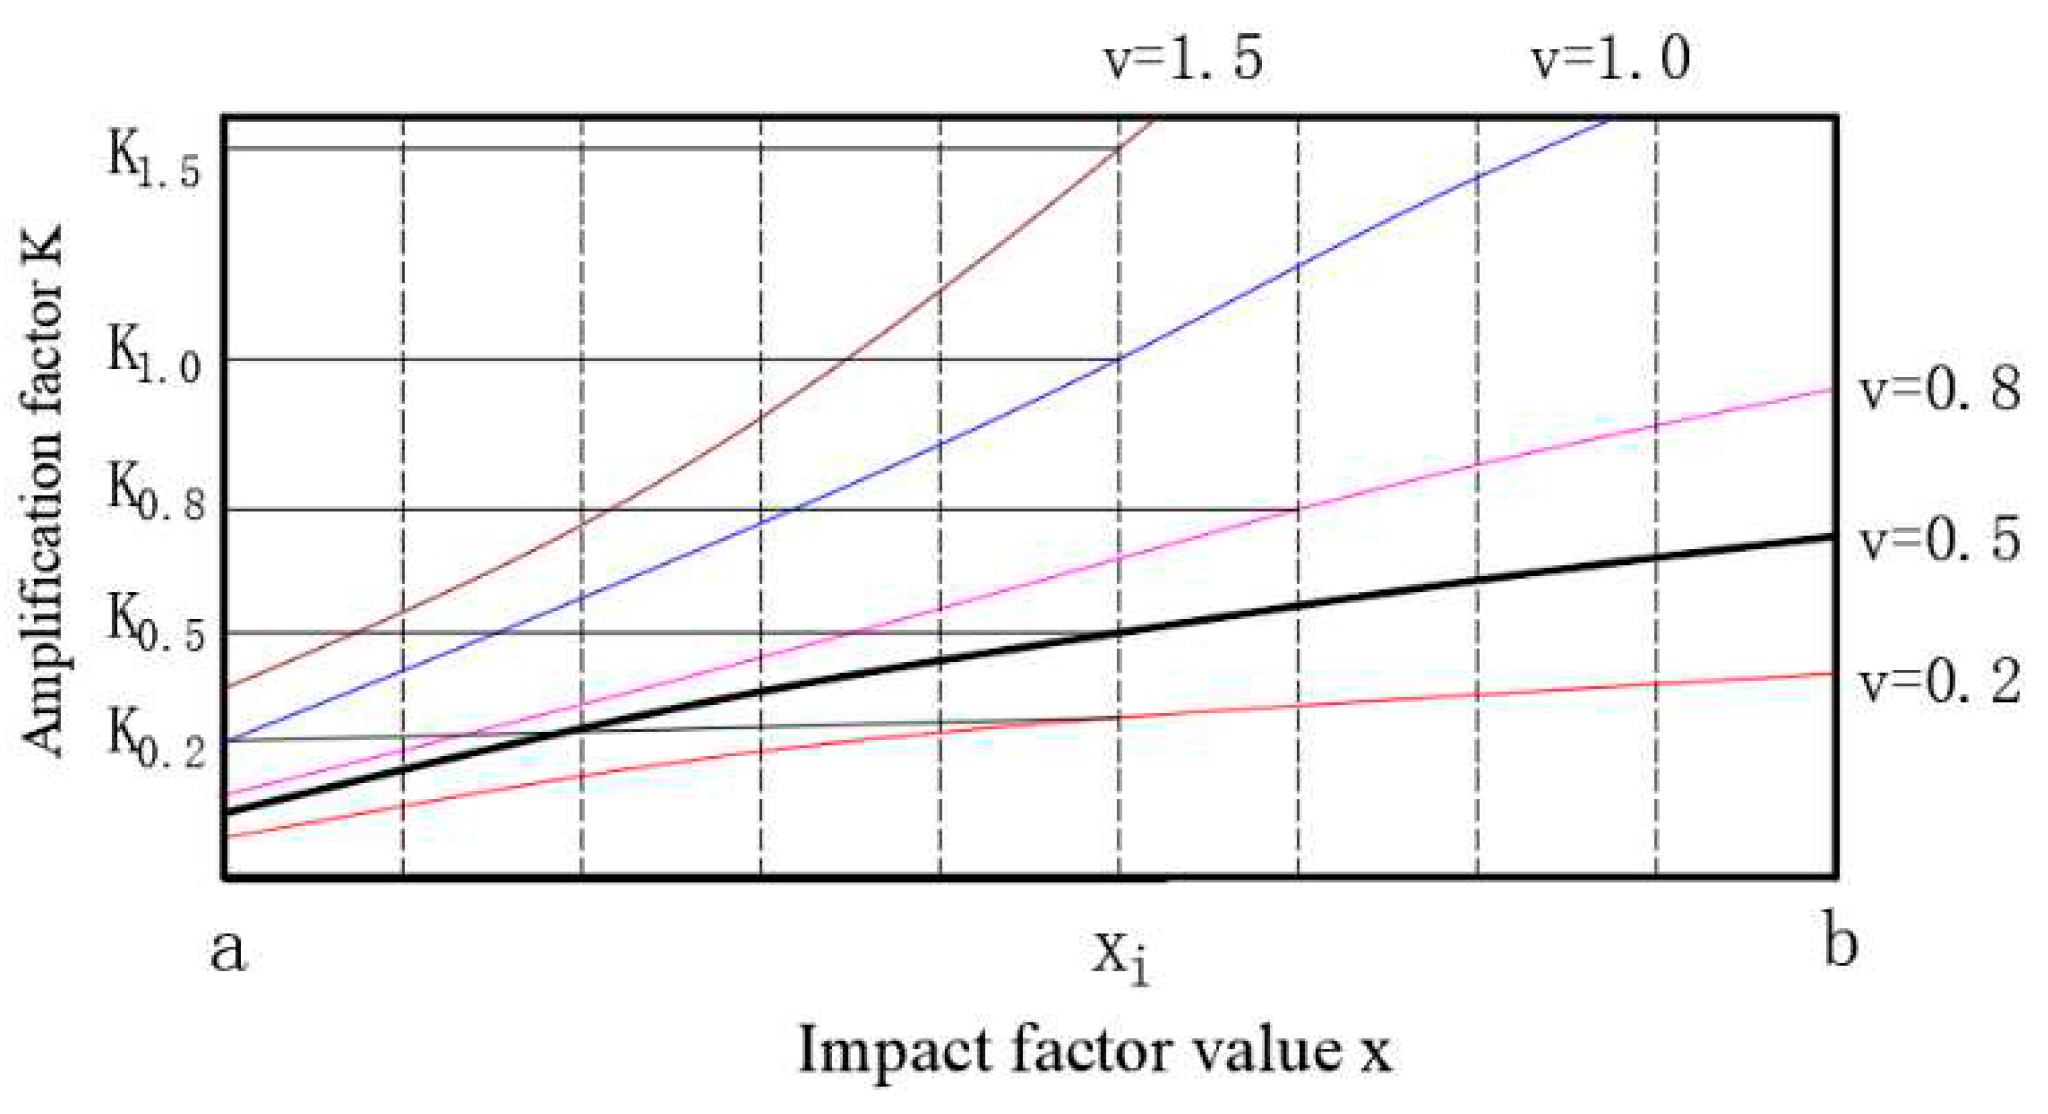
Based on the properties of the fractional-order differential operator shown in
Figure 1, the fractional-order differential operator has a certain enhancement effect on the signal when the differential order is 0 <
v < 1. The enhancement effect becomes more significant as the order decreases, and it has the effect of nonlinear retention of the low-frequency components of the signal. Thus, the middle value of
v= 0.5 was selected in this case to explore the application of the stepwise approximation method for improving the accuracy of the gas concentration detection.
6.3.1. Mathematical Model of Data accuracy Calculation Based on Fractional-order Differential Operator
According to (7), the formula for the standard deviation of the data in this case can be obtained as follows:.
where
Combined with (28), the data shown in the table were processed by the 0.5-order differential operator, and the result was:
where
.
6.3.2. Calculation of Ttep Size h Based on Step-by-Step Approach Method
To improve the efficiency of the system, a step-by-step method was used to adjust the step value
h to achieve a continuous improvement in the accuracy of the system data and select the best step value in terms of data accuracy and efficiency. The detection accuracy of the system was calculated by initially selecting
h= 0.01. The data processing model for the detection data with step
h = 0.01 and order
v= 0.5, was obtained according to (29) and (31):
According to the data shown in
Table 2 and (32), the experimental data shown in
Table 4 were obtained for the fractional order
v= 0.5, and step size
h=0.01.
To facilitate a comparison of the standard deviation between the data before and after data processing, the processing results shown in
Table 4 were divided by the amplification factor K
0.01, and the results are shown in
Table 5.
When
h = 0.01, the accuracy of the fused data was significantly lower than the threshold value of 0.005. Based on the error between the two values, the step value was adjusted to
h= 0.005. From (31), we determined that the data-processing model at this time is
The processing results shown in
Table 6 can be obtained based on the data presented in Tables 2 and (33).
To compare the standard deviations of the data before and after data processing, the data processing results shown in
Table 6 were divided by the amplification factor k
0.005 to obtain the data values shown in
Table 7.
When
h= 0.005, the accuracy of the fused data was slightly lower than the threshold value, which was selected to improve the efficiency. Next,
h= 0.003 was selected, and we obtained the following processing model of the data:
To compare the standard deviations of the data before and after data processing, the data processing results shown in
Table 4 were divided by the amplification factor
k0.003 to obtain the values shown in
Table 8.
The data obtained by this process met the system accuracy requirement after being processed by the differential operator with fractional order v= 0.5 and step value h= 0.003.
6.4. Long-distance Data Transmission Based on Cyclic Iteration Method
6.4.1. Value of Parameter h and Amplification Factor k
Because the strength of the signal depends on its step value
h and the number of fractional differential processing iterations, the original data were processed for the first iteration using the differential results with
h= 0.003,
v=0.5, and
x ∈ [0.27, 0.42]. Before and after the iterations, the applied parameters were the same as those in the mathematical model. The various data points before the iterations are presented in
Table 4.
By combining the fractional-order differential operator shown in Eq.(35) with the data processing model, the data shown in
Table 9 were processed by the first fractional-order differential operator iteration to obtain the values shown in
Table 10. The amplification coefficient and data accuracy before the iterations were essentially equal between the data after iterative processing by the fractional-order differential operator, thus verifying the correctness of the above assertion regarding the relationship between the accuracy and amplification coefficient in the data processing and the fractional-order differential parameters. When
v = 0.5 and
h= 0.003, the amplification factor
K≈ 1.47 for the data before and after the iteration of the fractional-order differential operator.
6.4.2. Values of Amplification Factor K and Number of Iterations m
From the above discussion on fractional-order calculus theory, data processing accuracy, and amplification coefficient, combined with the results for this exam ple, the amplification coefficient
k of the fractional-order differential operator on the data was obtained based on the relationship between the data accuracy
S and the number of iterations. The relationships are as follows:
q is the number of fractional-order differential processing iterations of the data.
For the detection system given in and (19), to meet the amplification factor set for the detection system, it was necessary to satisfy the following equations:
By solving for q in (36), we can see that under the above detection conditions, when the fractional-order differential operator step h = 0.003, the number of fractional-order differential processing cycles q = 5. The amplification coefficient of the detection signal K = 6.86, which satisfies the set system requirements.
6.5. Experimental results and their analysis
According to the above research results, it can be concluded that when the fractional order
v=0.5 and the step size
h=0.003, the detection accuracy of the information data in
Table 1 is 0.0019 after the experimental data are processed by fractional order differentiation, as shown in
Table 9. After processing five times by the fractional-order differentiation operator, the amplification coefficient of the information data was 6.86 after 5 times processing by fractional order differentiation operator. The final information data processing results are shown in
Table 11, from which it can be seen that the detected information data can completely satisfy the detection target set by the system.
Because the experimental site in this study was located in a structural space more than 500 m underground, it was a harsh experimental environment. The experiments were conducted by simplifying the calculation steps and selecting typical parameter values to analyze and process the experimental data. In practical applications, the corresponding fractional order v can be selected based on the data characteristics, and the detection system can arbitrarily achieve the detection distances and data accuracies by adjusting the step value h and processing number n of the fractional-order differential operator.
