Introduction
Diabetes is a complex metabolic disease associated with disorders of glucose or lipid metabolism, with chronic hyperglycemia as the main feature. The number of adults with diabetes worldwide reached 537 million in 2021, and it is estimated that this number will reach 642 million by 2040, with type 2 diabetes mellitus (T2DM) accounting for the vast majority[
1]. Diabetes has become a major challenge for people’s health and brought economic burden worldwide. Currently, dietary intervention, intensive exercise programs, insulin and oral hypoglycemic agents are the most common approaches to combat T2DM, while dietary intervention and lifestyle modification are considered to be more conducive to alleviate T2DM[
2]. The theory of “medicine and food homology” was formally proposed in the 1920s and 1930s[
3]. Medicinal and food homologous plants are often developed into functional foods due to being rich in bioactive compounds which have health-promoting effects with minimal side effects. As a low glycemic index product,
Pueraria thomsonii.
Radix has been used for food and medicine for thousands of years in Asian countries such as China, Thailand, Vietnam, Japan, and others countries. Furthermore, modern studies have emphasized that the bioactive components derived from
Pueraria thomsonii Radix can help to improve T2DM in
db/db mice, with limited side effects[
4,
5]. In previous studies, many monomer compounds extracted from
Pueraria thomsonii Radix, such as puerarin, daidzein, and genistein, have been shown to regulate animal insulin resistance [
6,
7], but there is no evidence that the effect of a single monomer component is better than the overall effect of
Pueraria thomsonii Radix. Consequently, there is still a limitation to a comprehensive understanding of the integrative mechanism underlying the intake of
Pueraria thomsonii Radix to prevent the development of T2DM.
Mounting evidence has demonstrated the combination of metabolism and gut microbiota may serve as a potentially crucial factor in T2DM diagnosis, pharmaceutical discovery, as well as therapeutic response monitoring[
8,
9]. In the present study, we compared PTR with metformin on meliorating the clinical pathological feature of
db/db mice, and then explored the gut microbiota and host metabolomic reactions through UPLC-IM-Q-TOF-MS[
10,
11] and 16S rRNA gene sequencing to understand the comprehensive antidiabetic mechanism of PTR. We further proposed the potential mechanism that PTR participates in metabolic regulation through the microbiota-gut-brain axis (MGB).
Materials and methods
Preparation of PTR.
Pueraria thomsonii Radix, purchased from Jiangzhong Traditional Chinese Medicine Co., Ltd. (Nanchang, Jiangxi) was identified as the dried root of the legume plant Pueraria Thomsonii Benth by Professor Fei Ge and Professor Ronghua Liu of Jiangxi University of Chinese Medicine.PTR was extracted by Jiangxi Xinglin Baima Pharmaceutical Co., Ltd. Raw material of 200 kg was extracted three times continuously with 15 times the amount of water each time, filtered in a basket, combined with the filtrate, and concentrated under reduced pressure. After vacuum drying, 29.4 kg of PTR(yield: 14.70%) was obtained by crushing, which was used for subsequent animal experiments and preparation of test solution. In our previous experiments, UPLC-Q-TOF/MS technique was used to analyze the absorbed components of PTR in rat blood, mainly including 15 polyphenols(
Supplementary Table S1)[
12], and Elisa was used to analyze the content of total polysaccharides in PTR, these polyphenols and polysaccharides are the main functional components of PTR.
Animals and sample collection. Db/db mice and db/m mice with half female at 7-8 weeks old in an SPF environment were obtained from Nanjing Cavins Biotech, LTD. [Animal Certificate Number: SCXK (Su) 2016-0013] and were raised in the protective environment of the Animal Science and Technology Experimental Center of Jiangxi University of Chinese Medicine (humidity: 50±5%, temperature: 22±2 °C, and light-dark cycle for 12 hours). The treatment of animals during the experiment was in accordance with the eighth edition of the Regulations on the Management of Laboratory Animals of China and was approved by the Ethics Committee of the Laboratory Animal Science and Technology Center of Jiangxi University of Chinese Medicine (Approval No. JZLLSC20210075). After 3 days of adaptive feeding, 11 db /m mice were used as the normal control group (Normal group), 39 db /db mice were modeled for T2DM and randomly divided into 3 groups with 13 mice in each: Model group, PTR group, and Metformin group.
The clinical dosage of Pueraria thomsonii Radix ranges from 10 to 60 g, with 40 g being the most commonly used dosage for human administration. According to the formula of human and mouse body surface area and the yield of extract powder prepared from raw drug, the calculated dose of PTR group was 0.89 g/kg/d.
Each group was respectively given the corresponding drugs by intragastric administration, namely, the mice in Normal group and Model group were intragastrically administered with distilled water, the mice in PTR group were intragastrically administered with PTR 0.89 g/kg/d, and Metformin group was intragastrically administered with the original drug of metformin 0.364 g/kg/d (Sino American Shanghai Squibb Pharmaceutical Co., Ltd.). The mice were given intragastric administration strictly according to their body weight, once a day for 8 consecutive weeks, and the changes of body weight and blood sugar were recorded weekly.
The mice were fasting without water after 18:00 on the night before sampling. The next morning, about 50 uL of blood was collected from the orbital venous plexus of mice and put into common EP tubes for the determination of fasting blood glucose and fasting insulin levels of mice. One hour after the last administration, mice were anesthetized by intraperitoneal injection of 1% Pentobarbital sodium. Whole blood was collected from abdominal aorta into common EP tubes and centrifuged at 8000 r/min for 15 min in a cryogenic centrifuge at 4 ℃. After centrifugation, the supernatant was collected and stored at -80 ℃ for serum metabolomics study. Under aseptic operation, tissues and organs such as pancreas, colon and intestinal contents were carefully collected, and then flash-frozen in liquid nitrogen and stored at -80 ℃ for subsequent experimental analysis.
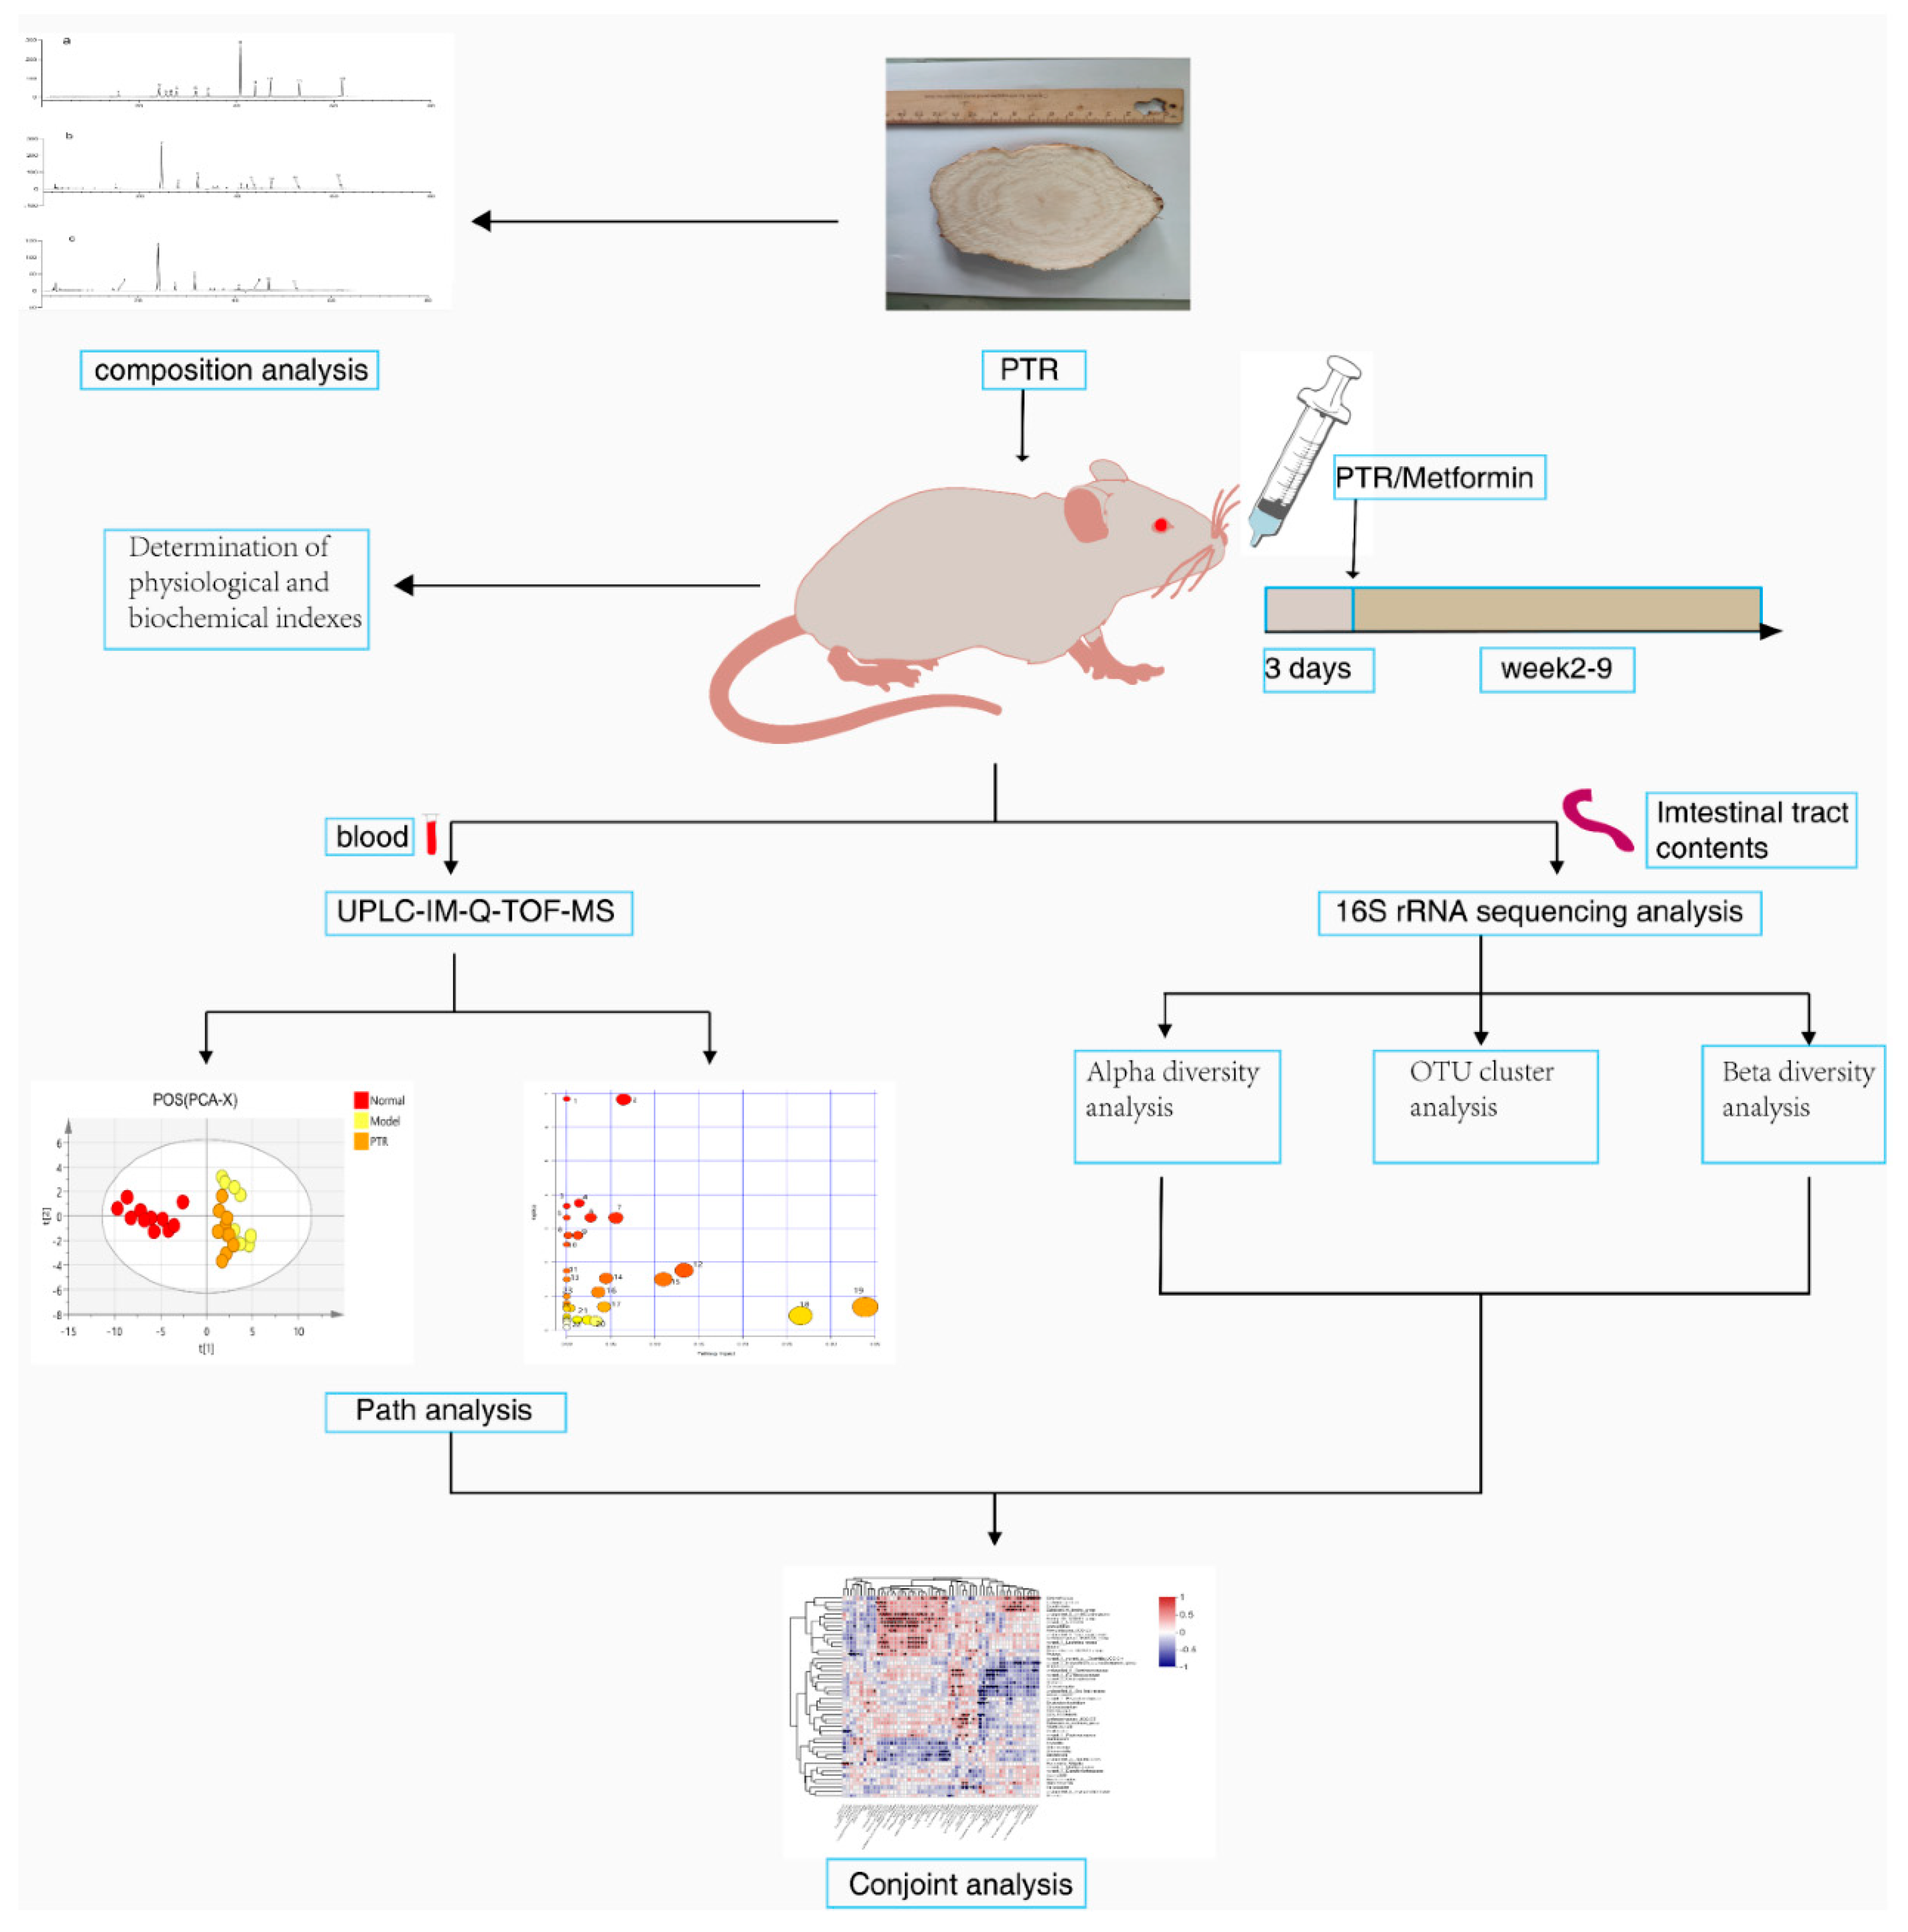
Figure 1 summarizes the schematic diagram of the study.
Analysis of physiological and Biochemical Indexes. The weekly body weight of mice was measured using an electronic analytical balance (Beijing Sartorius Scientific Instruments Co., LTD.). The levels of fasting blood glucose (FBG) were measured weekly using a blood glucose meter and a blood glucose strip (Roche Blood Glucose Health Care). Fasting insulin levels were measured using Mouse Insulin (INS) Elisa kit (Nanjing Jiancheng Bioengineering Institute). Homeostasis model assessment insulin resistance(HOMA-IR) was calculated using the following formula: fasting blood glucose× fasting insulin / 22.5. Urinary glucose(UGLU) was measured using a 7180 automatic biochemical analyzer (Hitachi). Urinary microalbumin was measured using an A15 automatic protein analyzer (Biosystems) and the urinary albumin/creatinine ratio(UACR) was calculated.
Observation of pancreatic hematoxylin-eosin (HE) staining. After tissue sampling, paraffin embedding machine and microtome (Leica) were used to embed and slice the tissue with a thickness of 4 μm. The sections were routinely stained with HE, sealed with neutral gum, and observed by light microscopy and the corresponding images were taken.
Untargeted metabolomics analysis. Thawed the frozen serum samples naturally, taken 50 μL serum, added 200 μL methanol working solution (containing 10.06 µg/mL 2-chloro-L-phenylalanine), mixed them with MTV-100 vortex mixer (Hangzhou Aosheng Group Co., Ltd.) for 30 s, and after standing for 10 min, centrifuged at 12000 r/min for 15 min at 4 °C. The supernatant was taken for untargeted metabolomic analysis in UPLC-IM-Q-TOF-MS (UPLC I-CLASS liquid chromatography system and SYNAPT G2-Si mass spectrometer, Waters, USA). In addition, quality control (QC) samples were prepared by taking an equal amount from each frozen serum sample, vortexed and mixed according to the above method.
Liquid chromatographic separation of the samples was achieved using an ACQUITY UPLC BEN C18 column (2.1ITY UPLC BEm, Waters Corporation). The injection volume was 2 µL, the column temperature was 40 °C, the flow rate was 0.35 mL/min, the eluent A was water containing 0.1% formic acid, and the eluent B was acetonitrile. Solvent gradient setting in positive ion mode: 0-0.2 min, 5% B; 0.2-2 min, 5-20% B; 2-7 min, 20-50% B; 7-17 min, 50-65% B; 17-22 min, 65-80% B; 22-23 min, 80-95% B; 23-26 min, 95-5% B; negative ion mode: 0-0.2 min, 5% B; 0.2-3 min, 5-20% B; 3- 5 min, 20-45% B; 5-7 min, 45-55% B; 7-13 min, 55-65% B; 13-16 min, 65% B; 16-21 min, 65-80% B; 21-23 min, 80-95% B; 23-26 min, 95-5% B.
ESI ion source was used to carry out data acquisition in positive and negative ion mode respectively in HDMSE mode. The mass range (m/z) was 50-1200 Da, ion source temperature was 120°C, curtain rate cone gas flow rate was 50 L/h, desolvation gas flow rate was 800 L/h, desolvation temperature was 400°C, cone voltage was 40 V, collision energy was 20-40 V, scan time and inter scan delay were 0.3 s and 0.015 s, capillary ESI+ was 3 kV, and ESI- was 2.3 kV. In order to ensure the accuracy and reproducibility of the experimental data, the standard product sodium formate was used to establish the mass axis standard curve, and at the same time, leucine enkephalin was used for real-time mass correction, and polyalanine (purchased from Sigma p/n P9003) was used to perform CCS Correction.
In this experiment, in order to ensure the stability of the analysis system as a whole, method validation was performed using quality control (QC) samples. Before collecting each group of samples, QC samples were advanced 5 times to balance the instrument. After stabilization, 1 QC sample was injected for every 5 experimental samples to monitor the operation of the system in real-time. The real-time monitoring system should run to analyze the data in real-time and evaluate the data quality. Finally, the peak intensities of 10 typical mass spectrometry peaks were analyzed, and the value of relative standard deviation (RSD) was used to confirm that the instrument injection was stable and the method was reproducible.
The mass spectrometry raw data obtained by UPLC-IM-QTOF-MS was imported into Progenesis QI V2.0 software (QI, Waters, USA) for normalization processing, and then the data matrix was exported and saved. After grouping the data, exported the data to EZinfo3.0 (Waters, USA) software to establish labels (VIP>1 and p<0.05) to screen differential metabolites. The SIMCA14.1 (Swedish Umetrics Company) software was used to perform principal component analysis (PCA) and orthogonal partial least squares discriminant analysis (OPLS-DA) on the data obtained in the previous step. According to the data of mass-to-charge ratio, retention time, CCS value, and secondary mass spectrometry fragment of the differential metabolites, they were matched and identified in the HMDB database, and then were analyzed by Pathway Analysis in the Metabo Analyst 5.0 (
https://www.metaboanalyst.ca) online database. The identified differential metabolites were enriched for metabolic pathways, and the differential metabolites were finally determined to obtain metabolic pathways and conduct pathway analysis.
Gut microbiota analysis. Gut microbiota analysis was performed by Shanghai Magi Biomedical Technology Co., LTD. (Shanghai, China). DNA was extracted from differential intestinal content samples using E.Z.N.A.
® Soil DNA Kit (Omega Biotek, Norcross, GA, U.S.). The quality of DNA extraction was examined using 1% agarose gel electrophoresis, and the concentration and purity of DNA were determined using a NanoDrop2000 ultramicro spectrophotometer (Thermo Scientific, Wilmington, USA). The hypervariable region V3-V4 of the bacterial 16S rRNA gene was amplified with primer pairs 338F (5’-ACTCCTACGGGAGGCAGCAG-3’) and 806R (5’-GGACTACHVGGGTWTCTAAT-3’) by an ABI GeneAmp
® 9700 PCR thermocycler (ABI, CA, USA). There were three replicates for each sample. The PCR products of each sample were mixed in triplicate and then the PCR products were recovered on 2% agarose gel. AxyPrep DNA Gel Extraction Kit (Axygen Biosciences, Union City, CA, USA) was used to purify the recovered product and detect it by 2% agarose gel electrophoresis. Quantus™ Fluorometer (Promega, USA) was used to detect and quantify the recovered products. The NEXTflexTM Rapid DNA-Seq Kit (Bioo Scientific, USA) was used for library construction. Sequencing was performed using Illumina’s Miseq PE300 platform. The fastp software (
https://github.com/OpenGene/fastp, version 0.20.0) was used to quality control of original sequencing sequence. FLASH software (
http://www.cbcb.umd.edu/software/flash, version 1.2.7) was used to pick up the fight. UPARSE software (
http://drive5.com/uparse/,Version 7.1) was used to cluster OTU sequences according to 97% similarity. RDP classifier (
http://rdp.cme.msu.edu/, version 2.2) was used to annotate each sequence for species classification. The comparison threshold was set to 70% for Silva 16S rRNA database (V138).
Statistical analyses. These values were defined as mean ± standard deviation (SD). The difference between the two groups of metabolites was calculated using student’s t-test by GraphPad prism 9 (GraphPad Software Inc., La Jolla, CA, USA). The difference between the two groups of gut microbiota was calculated using the Wilcox rank sum test. Compared with Normal group or Model group, the significance of the difference was described as * P < 0.05, ** P < 0.01, and *** P < 0.001.
Results
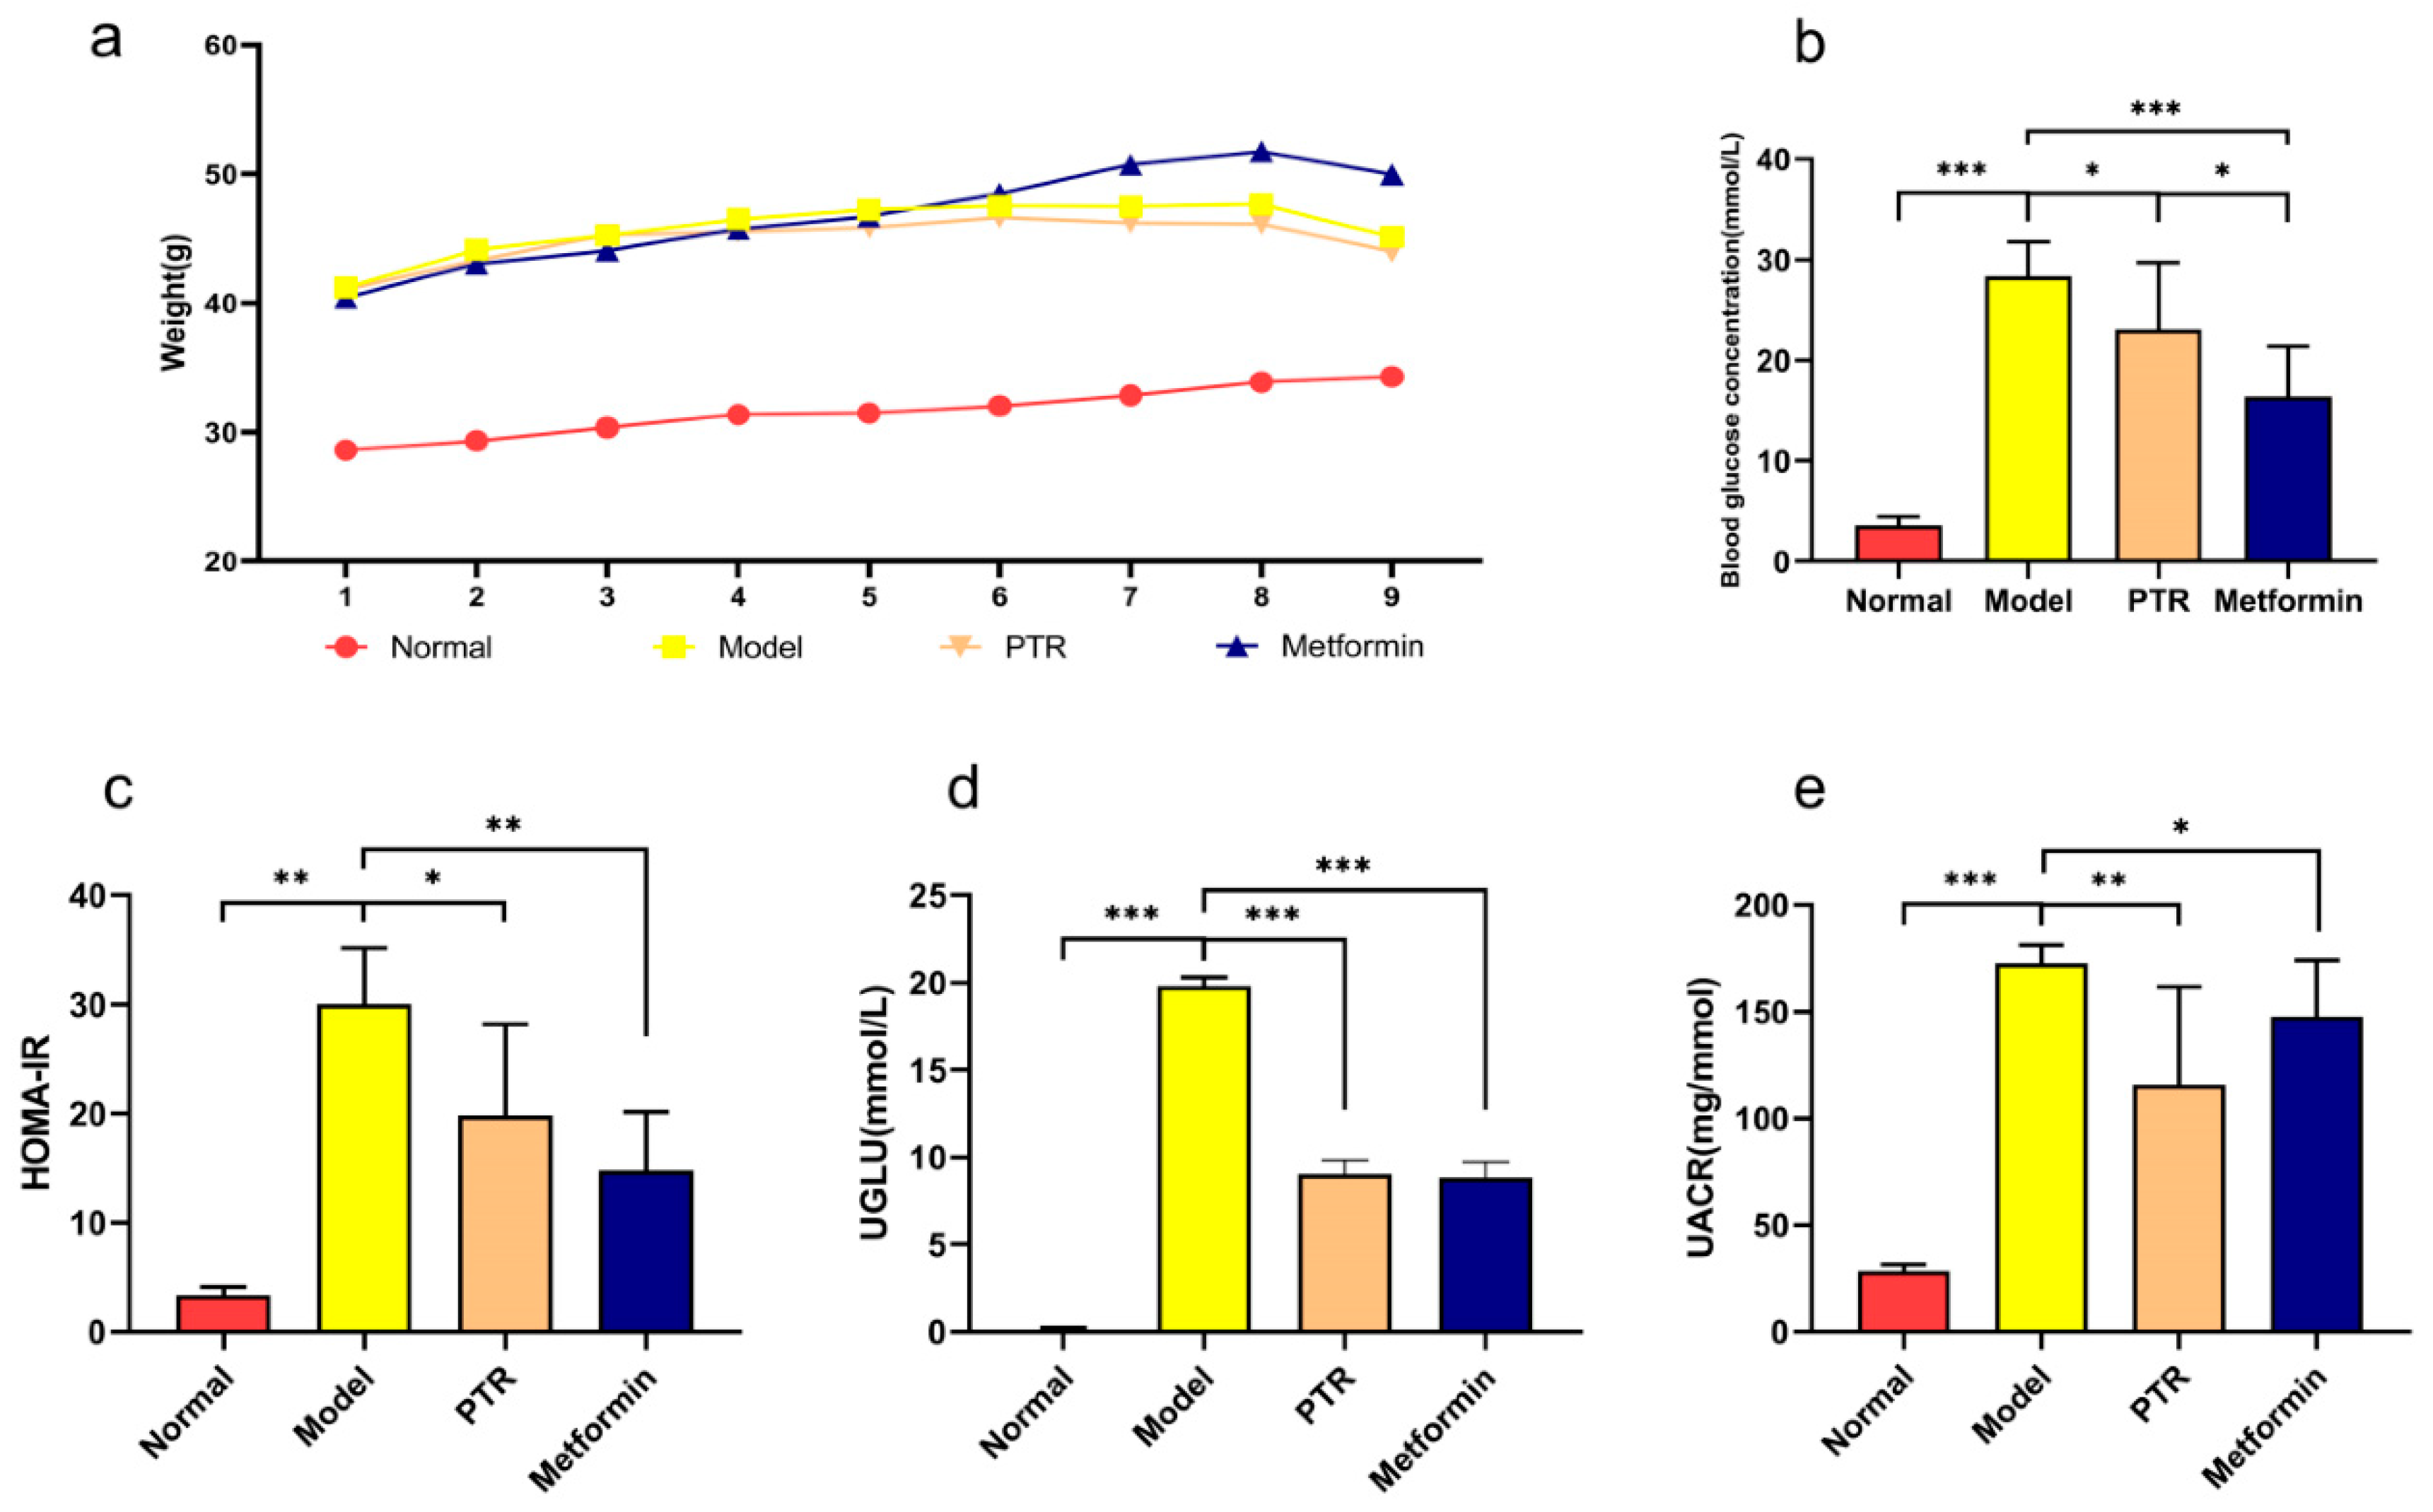
PTR improves major physiological and biochemical Indexes in db/db mice. Obesity provokes the impairment of insulin sensitivity, ultimately developing into diabetes. To study the modulatory effects of PTR on diabetes, the
db/db mice were applied in this study. Due to deficient leptin receptor gene,
db/db mice can spontaneously develop the obesity and chronic hyperglycemia. As shown in
Figure 3a, the body weight of Model group was significantly higher than that of the group taken normal diet, indicating
db/db mice have developed obesity. Although the body weight of mice in PTR group was higher than that of Normal group, while PTR group was lower than (
Figure 2a). Compared with Normal group, Model group significantly increased the level of FBG and HOMA-IR of the mice, indicating that
db/db mice developed T2DM in the present study. However, FBG and HOMA-IR were significantly decreased in mice after administration of PTR and metformin (
Figure 2b, c). Compared with Normal group, UGLU and UACR of the mice in Model group were significantly increased, and both UGLU and UACR were significantly decreased after administration of PTR and metformin (
Figure 2d, e). In summary, the role of PTR in improving key physiological and biochemical parameters in
db/db mice was comparable to that of metformin.
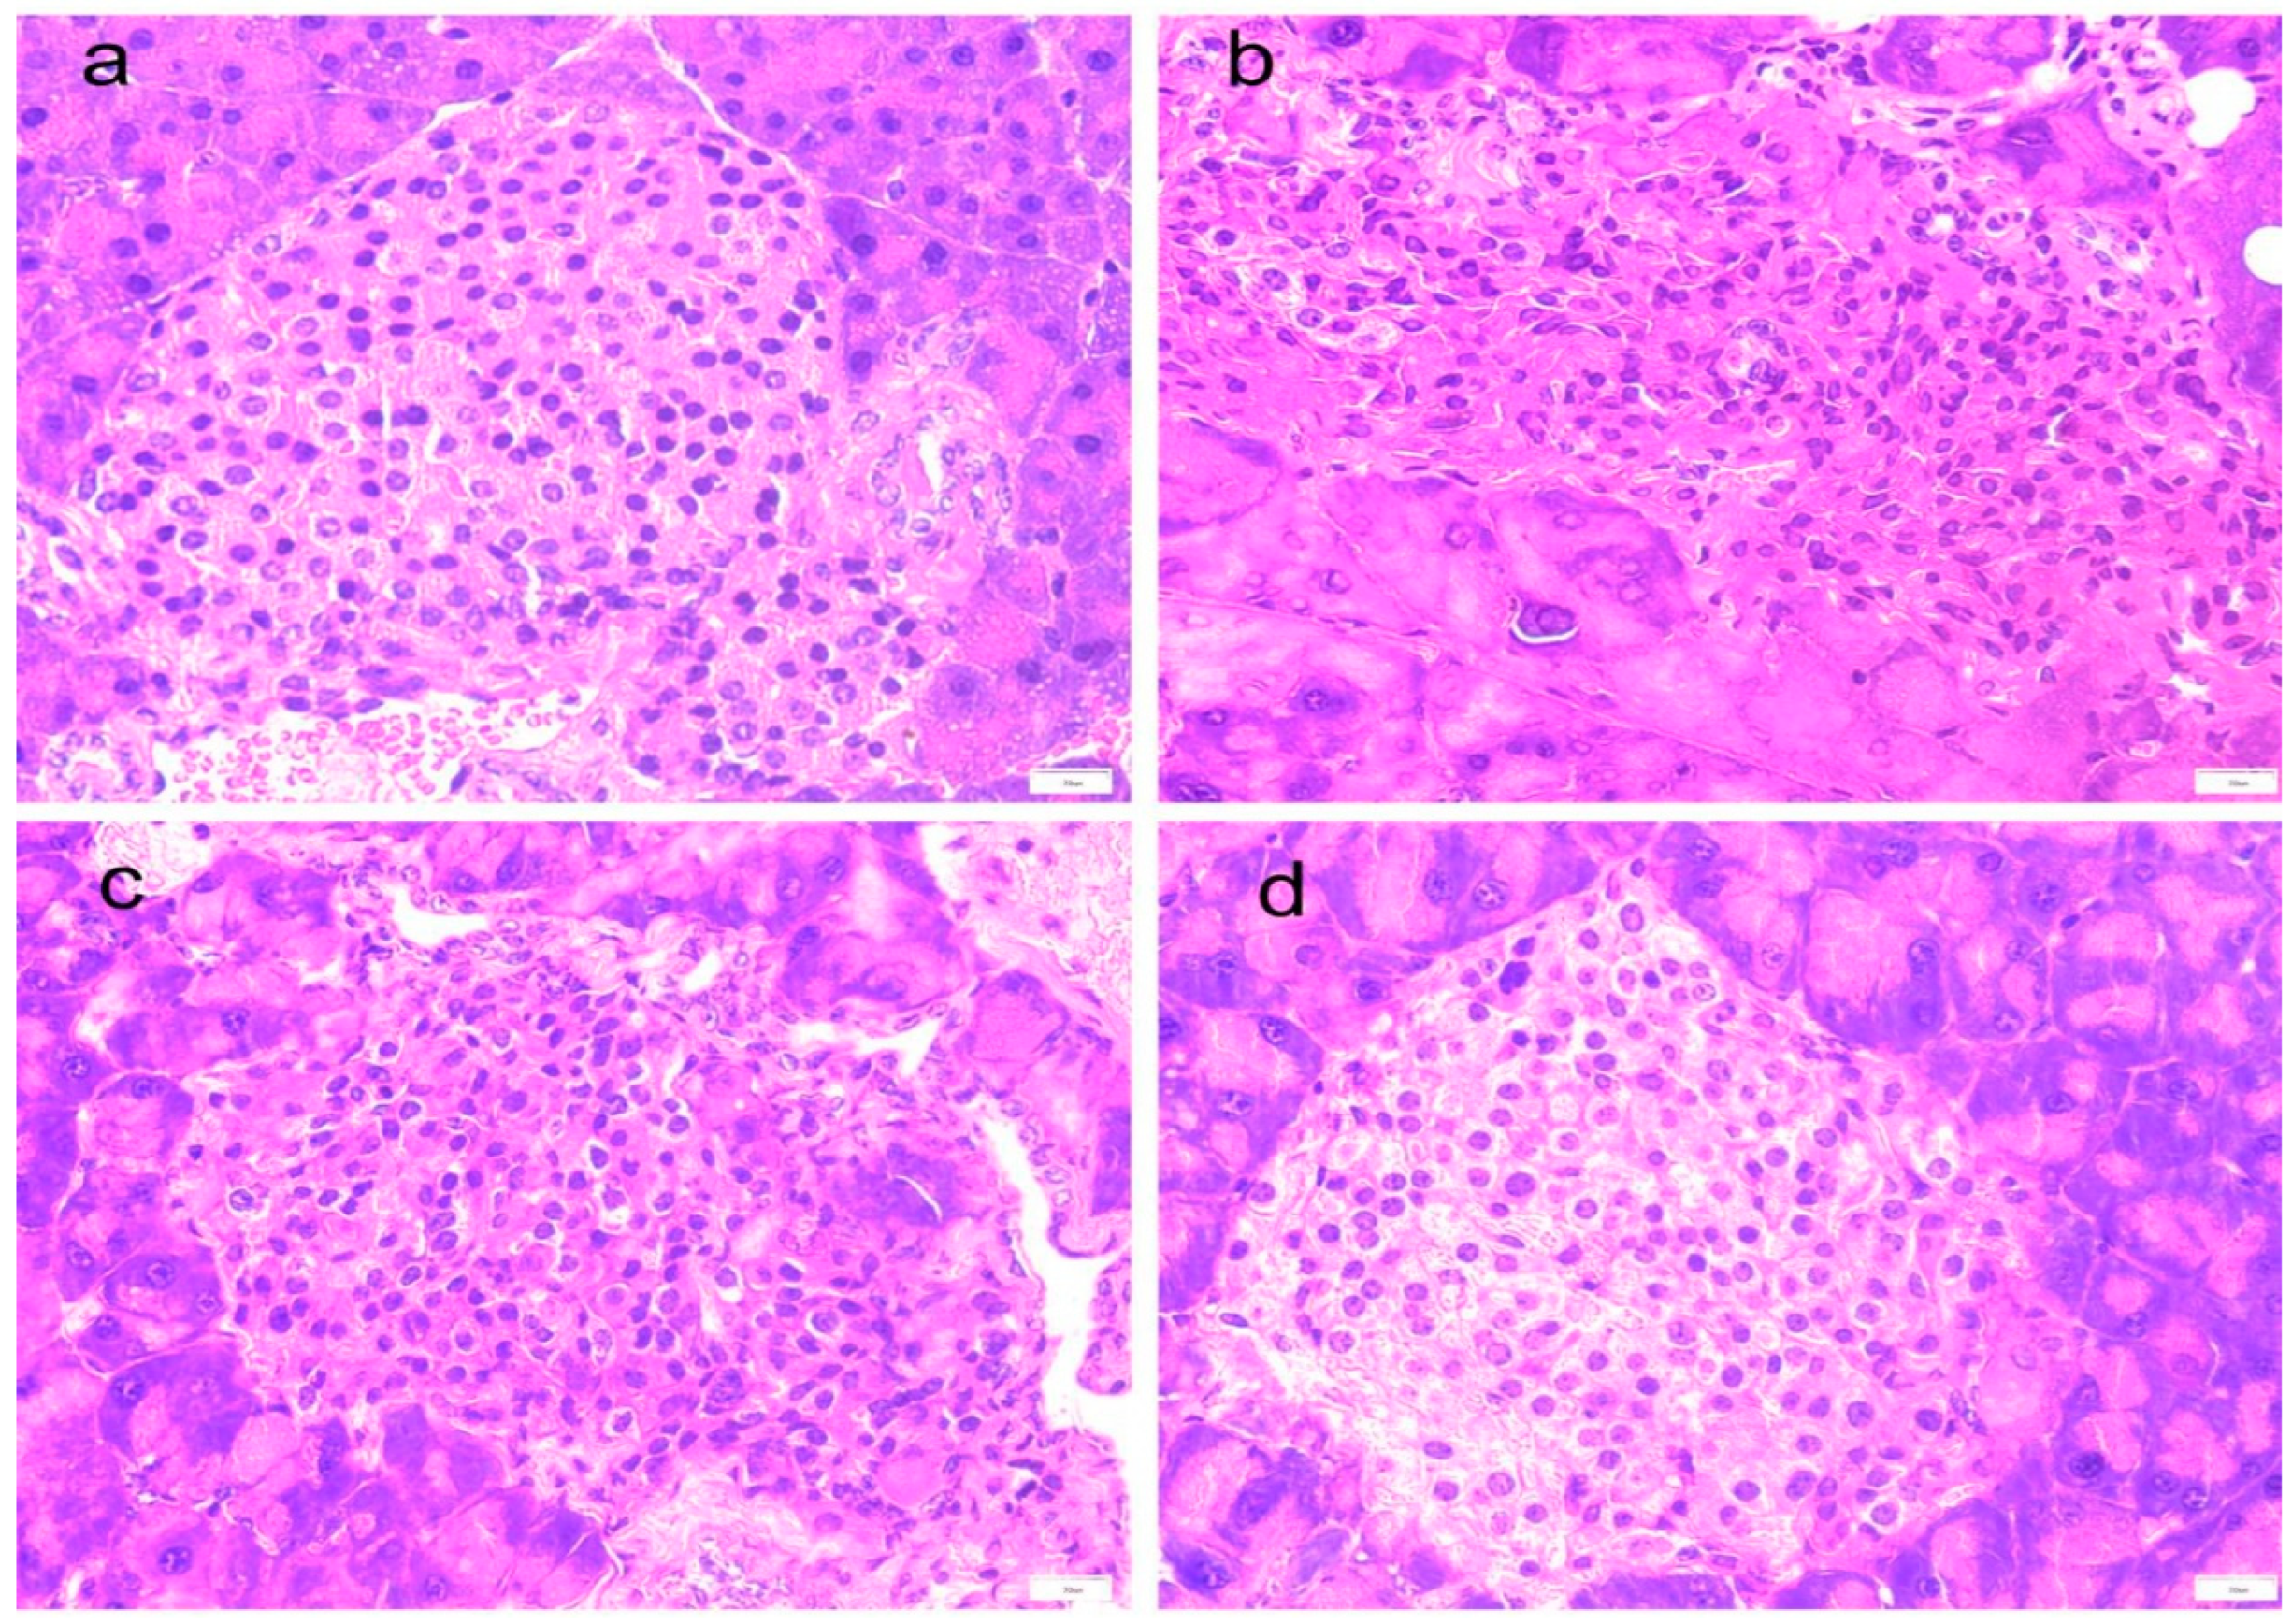
PTR alleviates pancreatic tissue damage in db/db mice. The observation of mouse pancreas HE staining (
Figure 3a–d) showed that compared with Normal group, the islets in Model group were atrophied, the diameter was reduced, the number of islet cells was reduced, and the boundary with pancreatic acinar cells was unclear. Moreover, a large number of pancreatic acinar cells were necrotic and degenerative. After administration of PTR and metformin, a clear boundary of islet cells and increased numbers from the treatment groups were observed in the present study. It suggested that the pancreatic tissue damage of
db/db mice can be potentially alleviated by the administration of PTR and metformin.
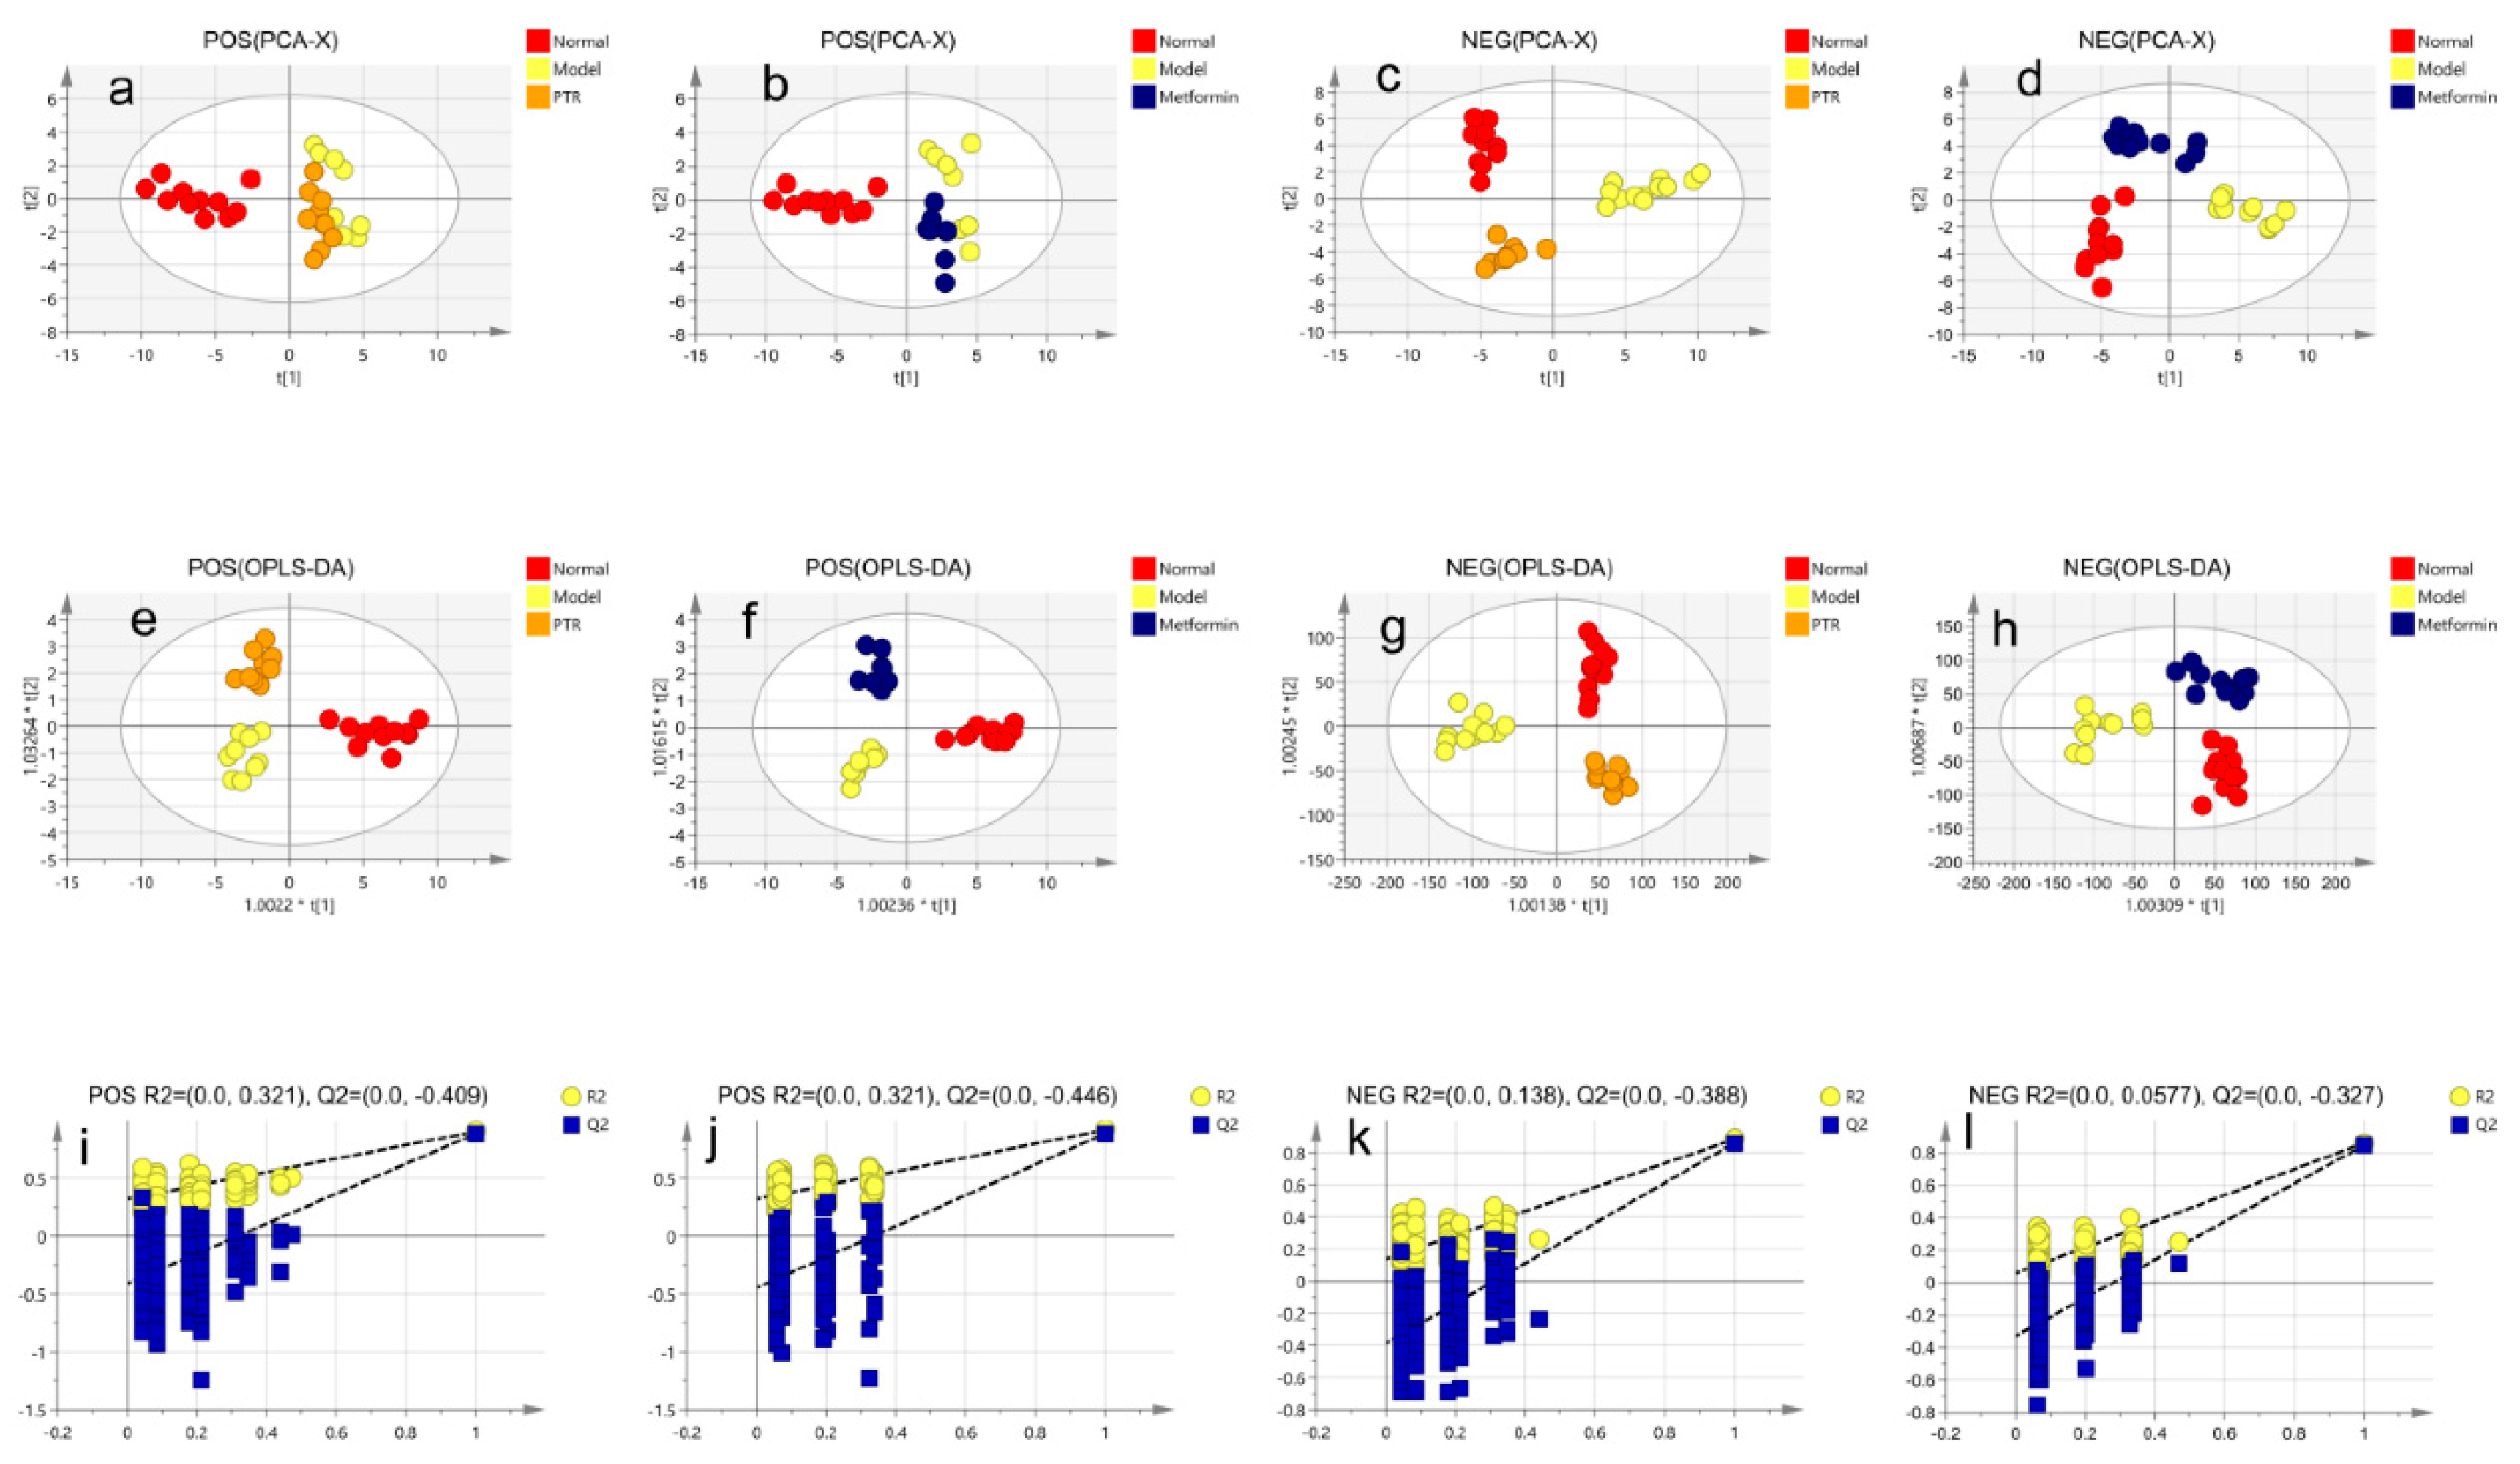
The modulatory effects of PTR on serum metabolites in db/db mice. A significant separation was observed among Normal group, Model group, PTR, or Metformin groups in the PCA and OPLS-DA score graphs. The R
2 and Q
2 values in OPLS-DA were smaller than the original values, indicating that the established discriminant model was reliable. The above results indicated that PTR and metformin could significantly alter the composition of serum metabolites in
db/db mice (
Figure 4). VIP > 1 and
p < 0.05 have been set up to determine the potential biomarkers. In this study, 13 kinds of substances were mainly assessed, including lipids, lipid-like molecules, bile acids, alcohols and their derivatives, glycerol phospholipids, nucleosides, nucleotides and analogues, steroids and steroid derivatives, organic oxygen compounds, and organic heterocyclic compounds. There was a total of 109 differential metabolites among the above categories of compounds identified in this study (
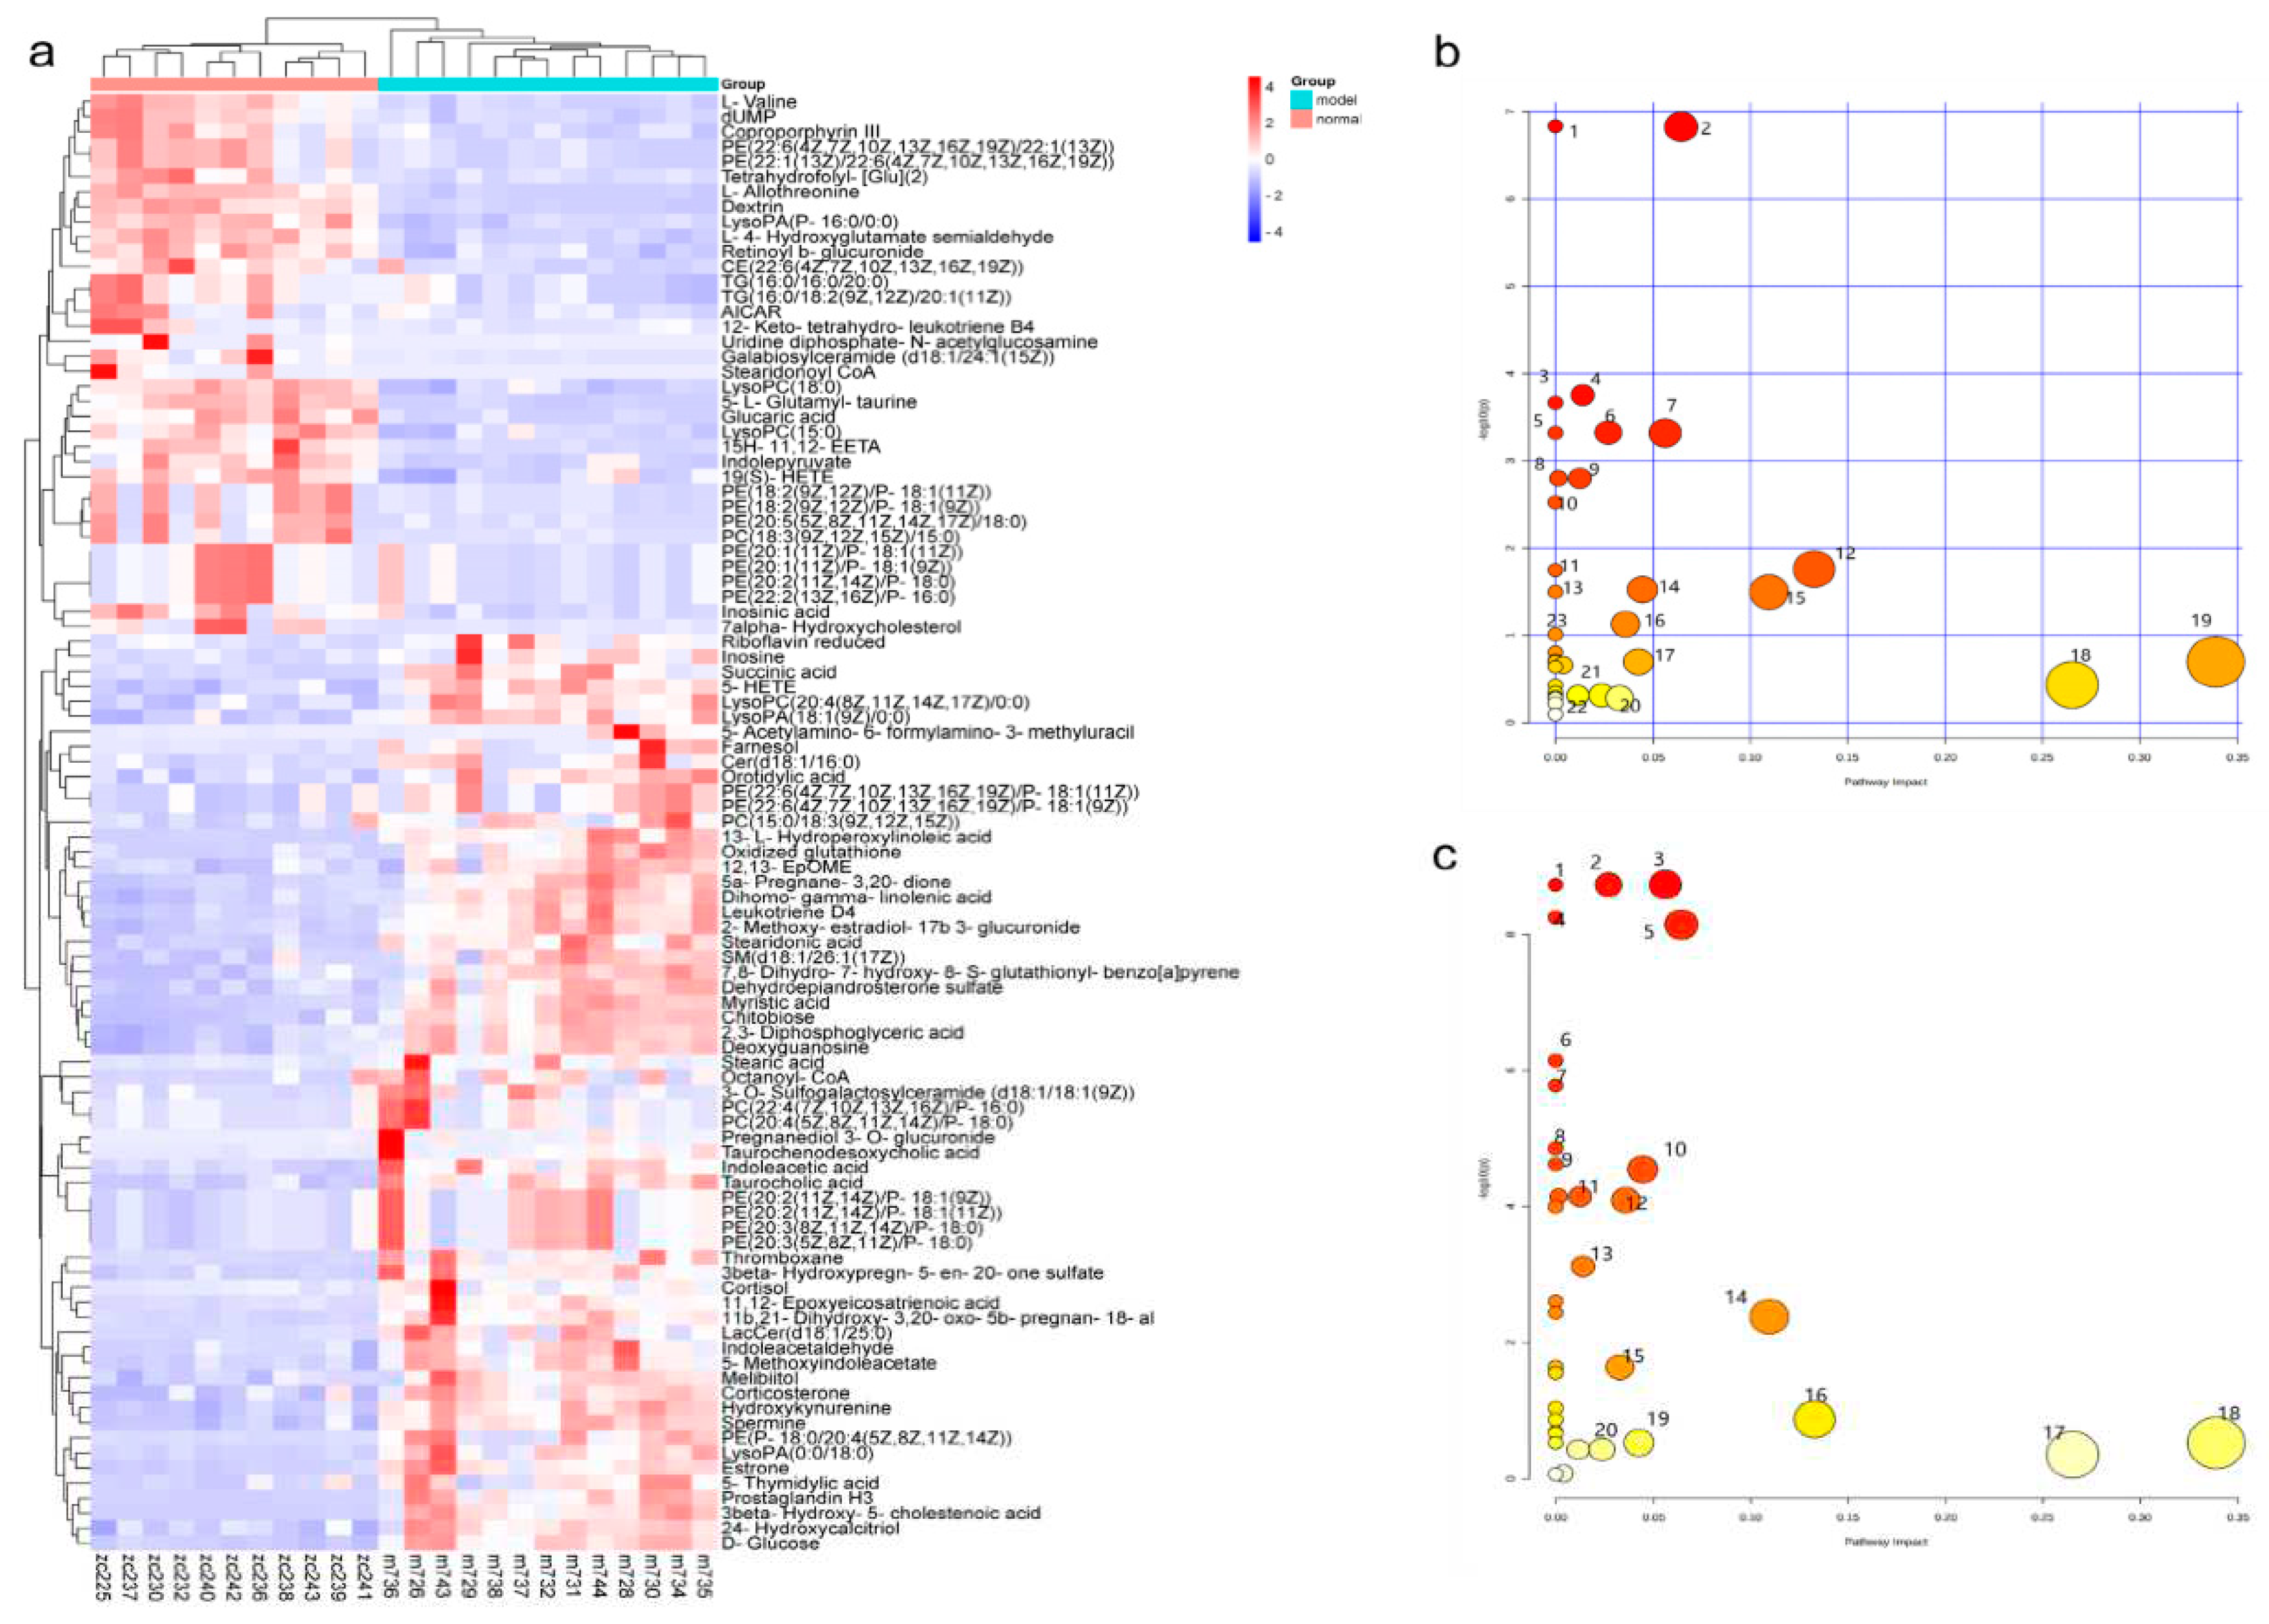
Supplementary Table S2). Heat map analysis of these relative metabolites were shown in
Figure 5a. The results of analysis of differential metabolites with callback after administration of
db/db mice showed that there were 74 callback differential metabolites after administration of PTR, and their abundance values were shown in
Supplementary Table S3. In addition, there were 49 callback differential metabolites after administration of metformin, and their abundance values were shown in
Supplementary Table S4. To determine the difference between PTR group and Metformin group, the concentration table of differential metabolites introduced into PTR and metformin was used to analyze the enrichment path of their differential metabolites in MetaboAnalyst Path analysis and KEGG (
https://www.metaboanalyst.ca/). Finally, 40 metabolic pathways (
Supplementary Table S5) were particularly enriched by PTR, and 26 metabolic pathways are enriched by metformin (
Supplementary Table S6). There are 24 main metabolic pathways overlapped between PTR and metformin, as shown in the Bubble Diagram (
Figure 5b,c).
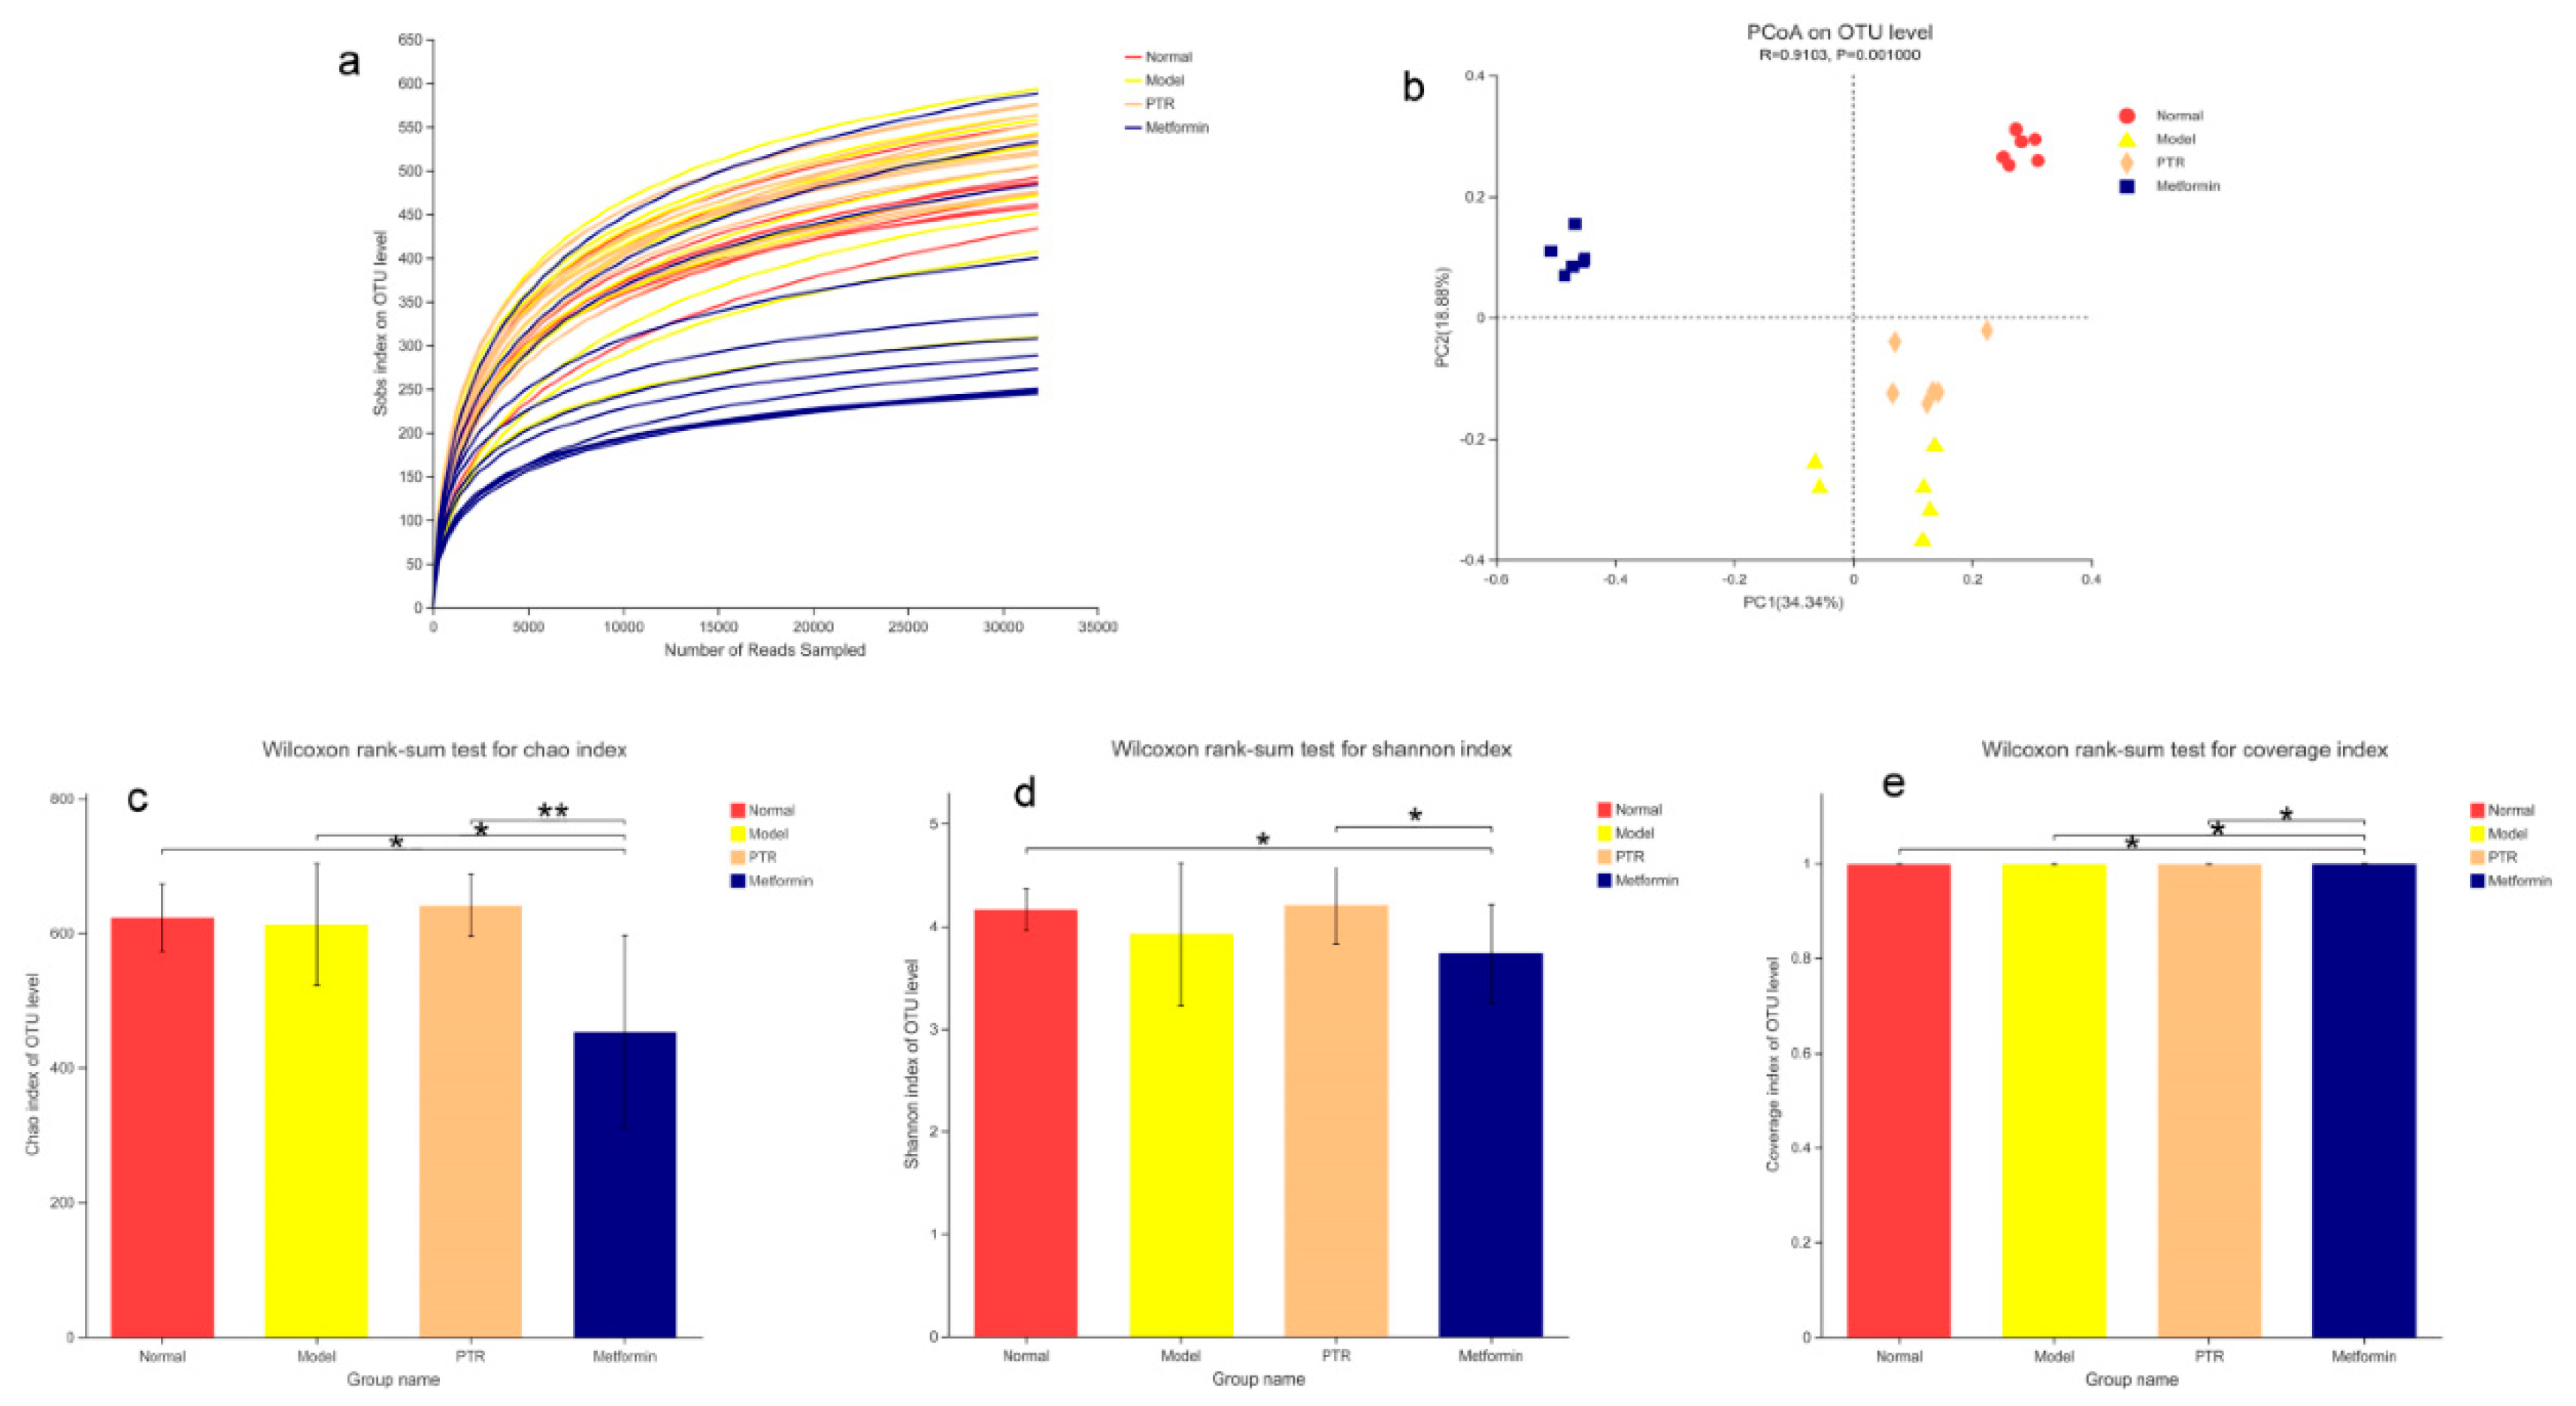
PTR improved the gut microbiota in db/db mice. A total of 2,866,188 colon content sequences were detected by 16S rRNA gene sequencing in this study. The dilution curve was close to the saturation plateau and the sequencing was reasonable (
Figure 6a). Based on the 16S rRNA gene sequencing assessment, Chao index reflects the richness of gut microbiota, Shannon index reflects community diversity, and Coverage index refers to the coverage of the sample library. The higher the value, the higher the probability of detecting sequences in the sample. The indexes of each group of gut microbiota were analyzed as shown in
Figure 6c–e. Compared with Normal group, there was no significant difference in the Chao index and Shannon index of Model group, indicating that there was no significant change in the richness and diversity of gut microbiota in
db/db mice. Compared with Model group, the Chao index and Shannon index of PTR group were increased but no significant difference being detected. Furthermore, a significant decrease of Chao index and a moderate decrease of Shannon index were identified in Metformin group. Compared with Metformin group, a significant increase of Chao index, Shannon index and Coverage index were identified in PTR group, suggesting that intake of PTR contributes to restoring the gut microbiota structure.
In the Beta diversity analysis, the Bray Curtis distance matrix PCoA analysis based on the OTU level showed a clear separation between Model group and Normal group. Furthermore, we observed that all groups tend to be a distinct cluster, suggesting that each group in our study had a distinct gut microbiota composition at the OTU levels (
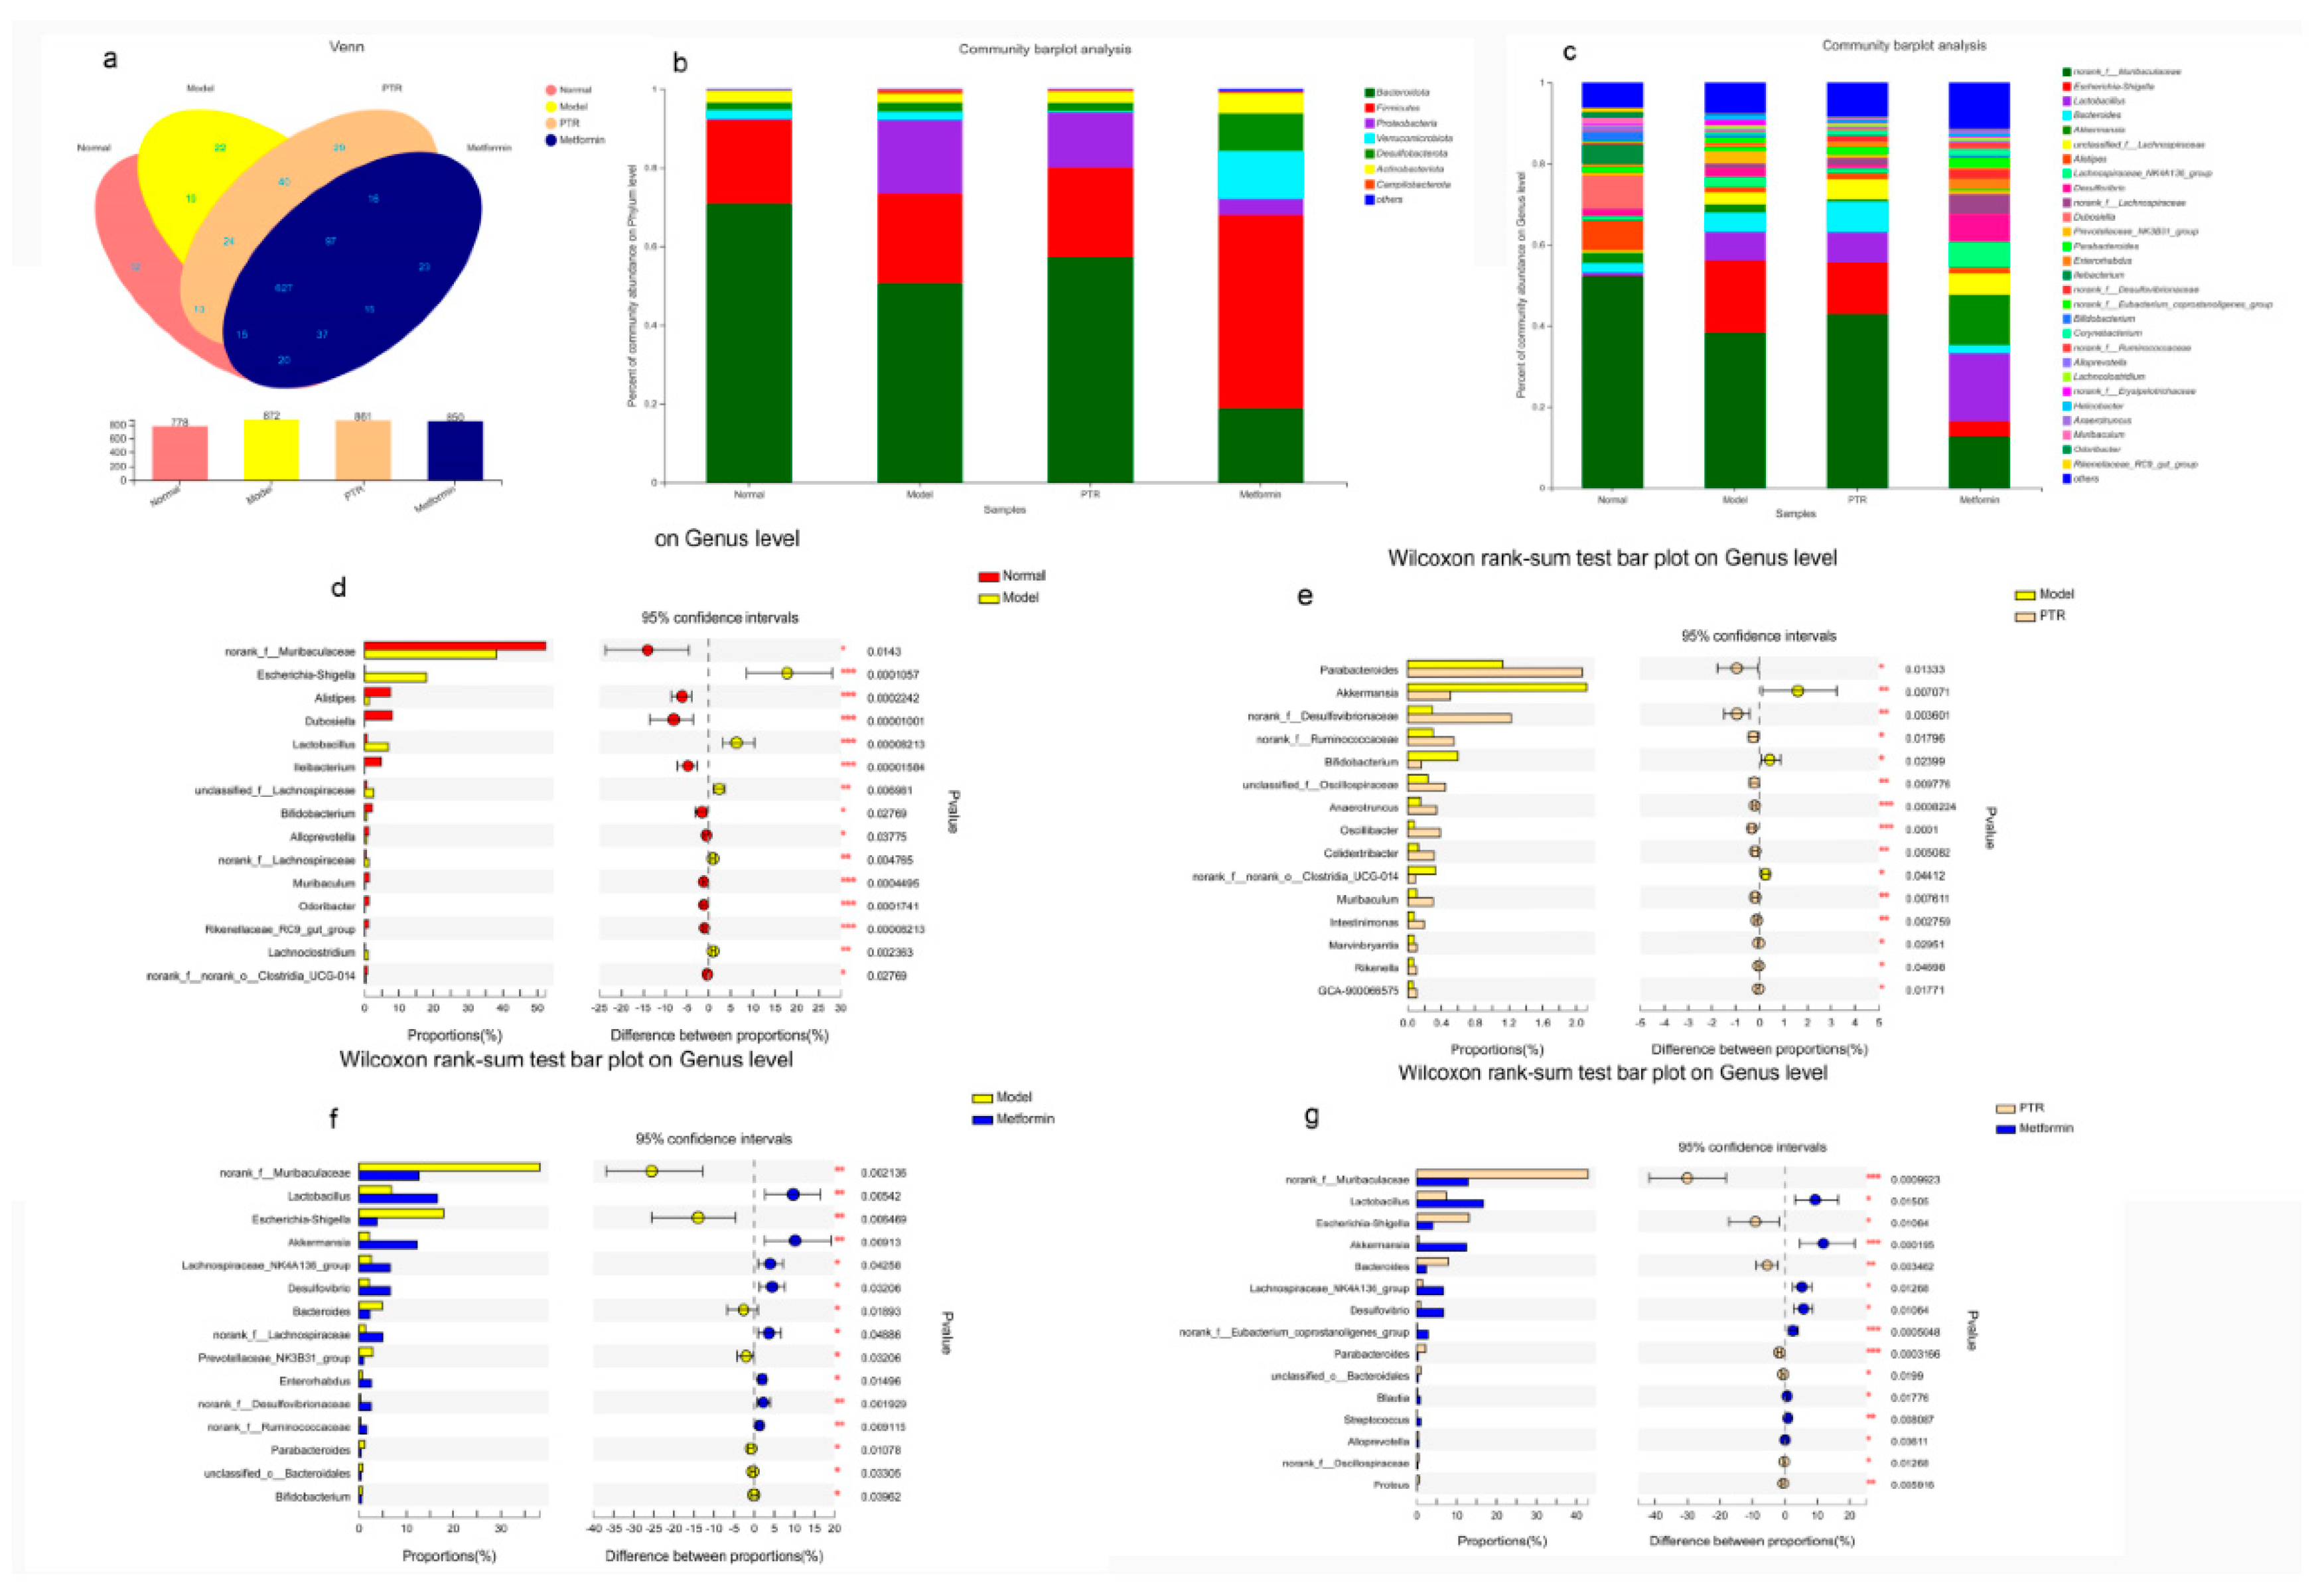
Figure 6b). Based on OTU sequence analysis at 97% similarity level, 778 OTU sequences were found in Normal group, 872 in Model group, 861 in PTR group, and 850 in Metformin group (
Figure 7a). At the phylum level, the dominant bacteria in the gut microbiota of the four groups of samples were
Bacteroidota,
Firmicutes,
Proteobacteria,
Desulfobacterota,
Actinobacteriota,
Verrucomicrobiota, and
Campilobacterota (
Figure 7b). According to the histogram of the gut microbiota at the phylum level, the relative abundance of
Firmicutes increased and that of
Bacteroidetes decreased in Model group, leading to the increase of the
Firmicutes/Bacteroidetesratio(F/B) without a significant difference. Compared with Model group, no significant difference of F/B was found in PTR group. However, the F/B of Metformin group was significantly increased (
P≤0.01) compared to Model group. Likely, the F/B of Metformin group was significantly increased (
P≤0.01) compared with PTR group.
As shown in
Figure 7c, the dominant bacteria in the gut microbiota of the four groups of samples at the genus level were
norank_f__Muribaculaceae,
Escherichia-Shigella,
Lactobacillus,
unclassified_f__Lachnospiraceae,
Akkermansia,
Alistipes. The Wilcox rank sum test was performed at the genus level to obtain the corresponding different bacterium. The different bacterium between Normal group and Model group included
norank_f__Muribaculaceae, Escherichia-Shigella,Alistipes, Dubosiella, Lactobacillus, Ileibacterium, unclassified_f__Lachnospiraceae, Bifidobacterium, Alloprevotella, norank_f__Lachnospiraceae, Muribaculum,
Odoribacter, Rikenellaceae_RC9_gut_group, Lachnoclostridium, norank_f__norank_o__Clostridia_UCG-014, etc. (
Figure 7d). The differential bacterium between PTR and Model groups included Parabacteroides, Akkermansia, norank_f__Desulfovibrionaceae, norank_f__Ruminococcaceae, Bifidobacterium,
unclassified_f__Oscillospiraceae, Anaerotruncus, Oscillibacter, Colidextribacter,
norank_f__norank_o__Clostridia_UCG-014, Muribaculum, Intestinimonas, Marvinbryantia,
Rikenellagca-900066575 etc. (
Figure 7e). The differential bacterium between Meltormin group and Model group included norank_f__Muribaculaceae, Lactobacillus, Escherichia-Shigella, Akkermansia, Lachnospiraceae_NK4A136_group, Desulfovibrio, Bacteroides, norank_f__Lachnospiraceae,Prevotellaceae_NK3B31_group, Enterorhabdus, norank_f__Desulfovibrionaceae, norank_f__Ruminococcaceae, Parabacteroides,unclassified_o__Bacteroidales, Bifidobacterium etc. (
Figure 7f). The differential bacterium between Metformin group and PTR group included norank_f__Muribaculaceae, Lactobacillus, Escherichia-Shigella, Akkermansia, Bacteroides, Lachnospiraceae_NK4A136_group, Desulfovibrio, norank_f__Eubacterium_coprostanoligenes_group, Parabacteroides, unclassified_o__Bacteroidales, Blautia, Streptococcus, Alloprevotella, norank_f__Oscillospiraceae, Proteus, muribaculum, etc. (
Figure 7g).
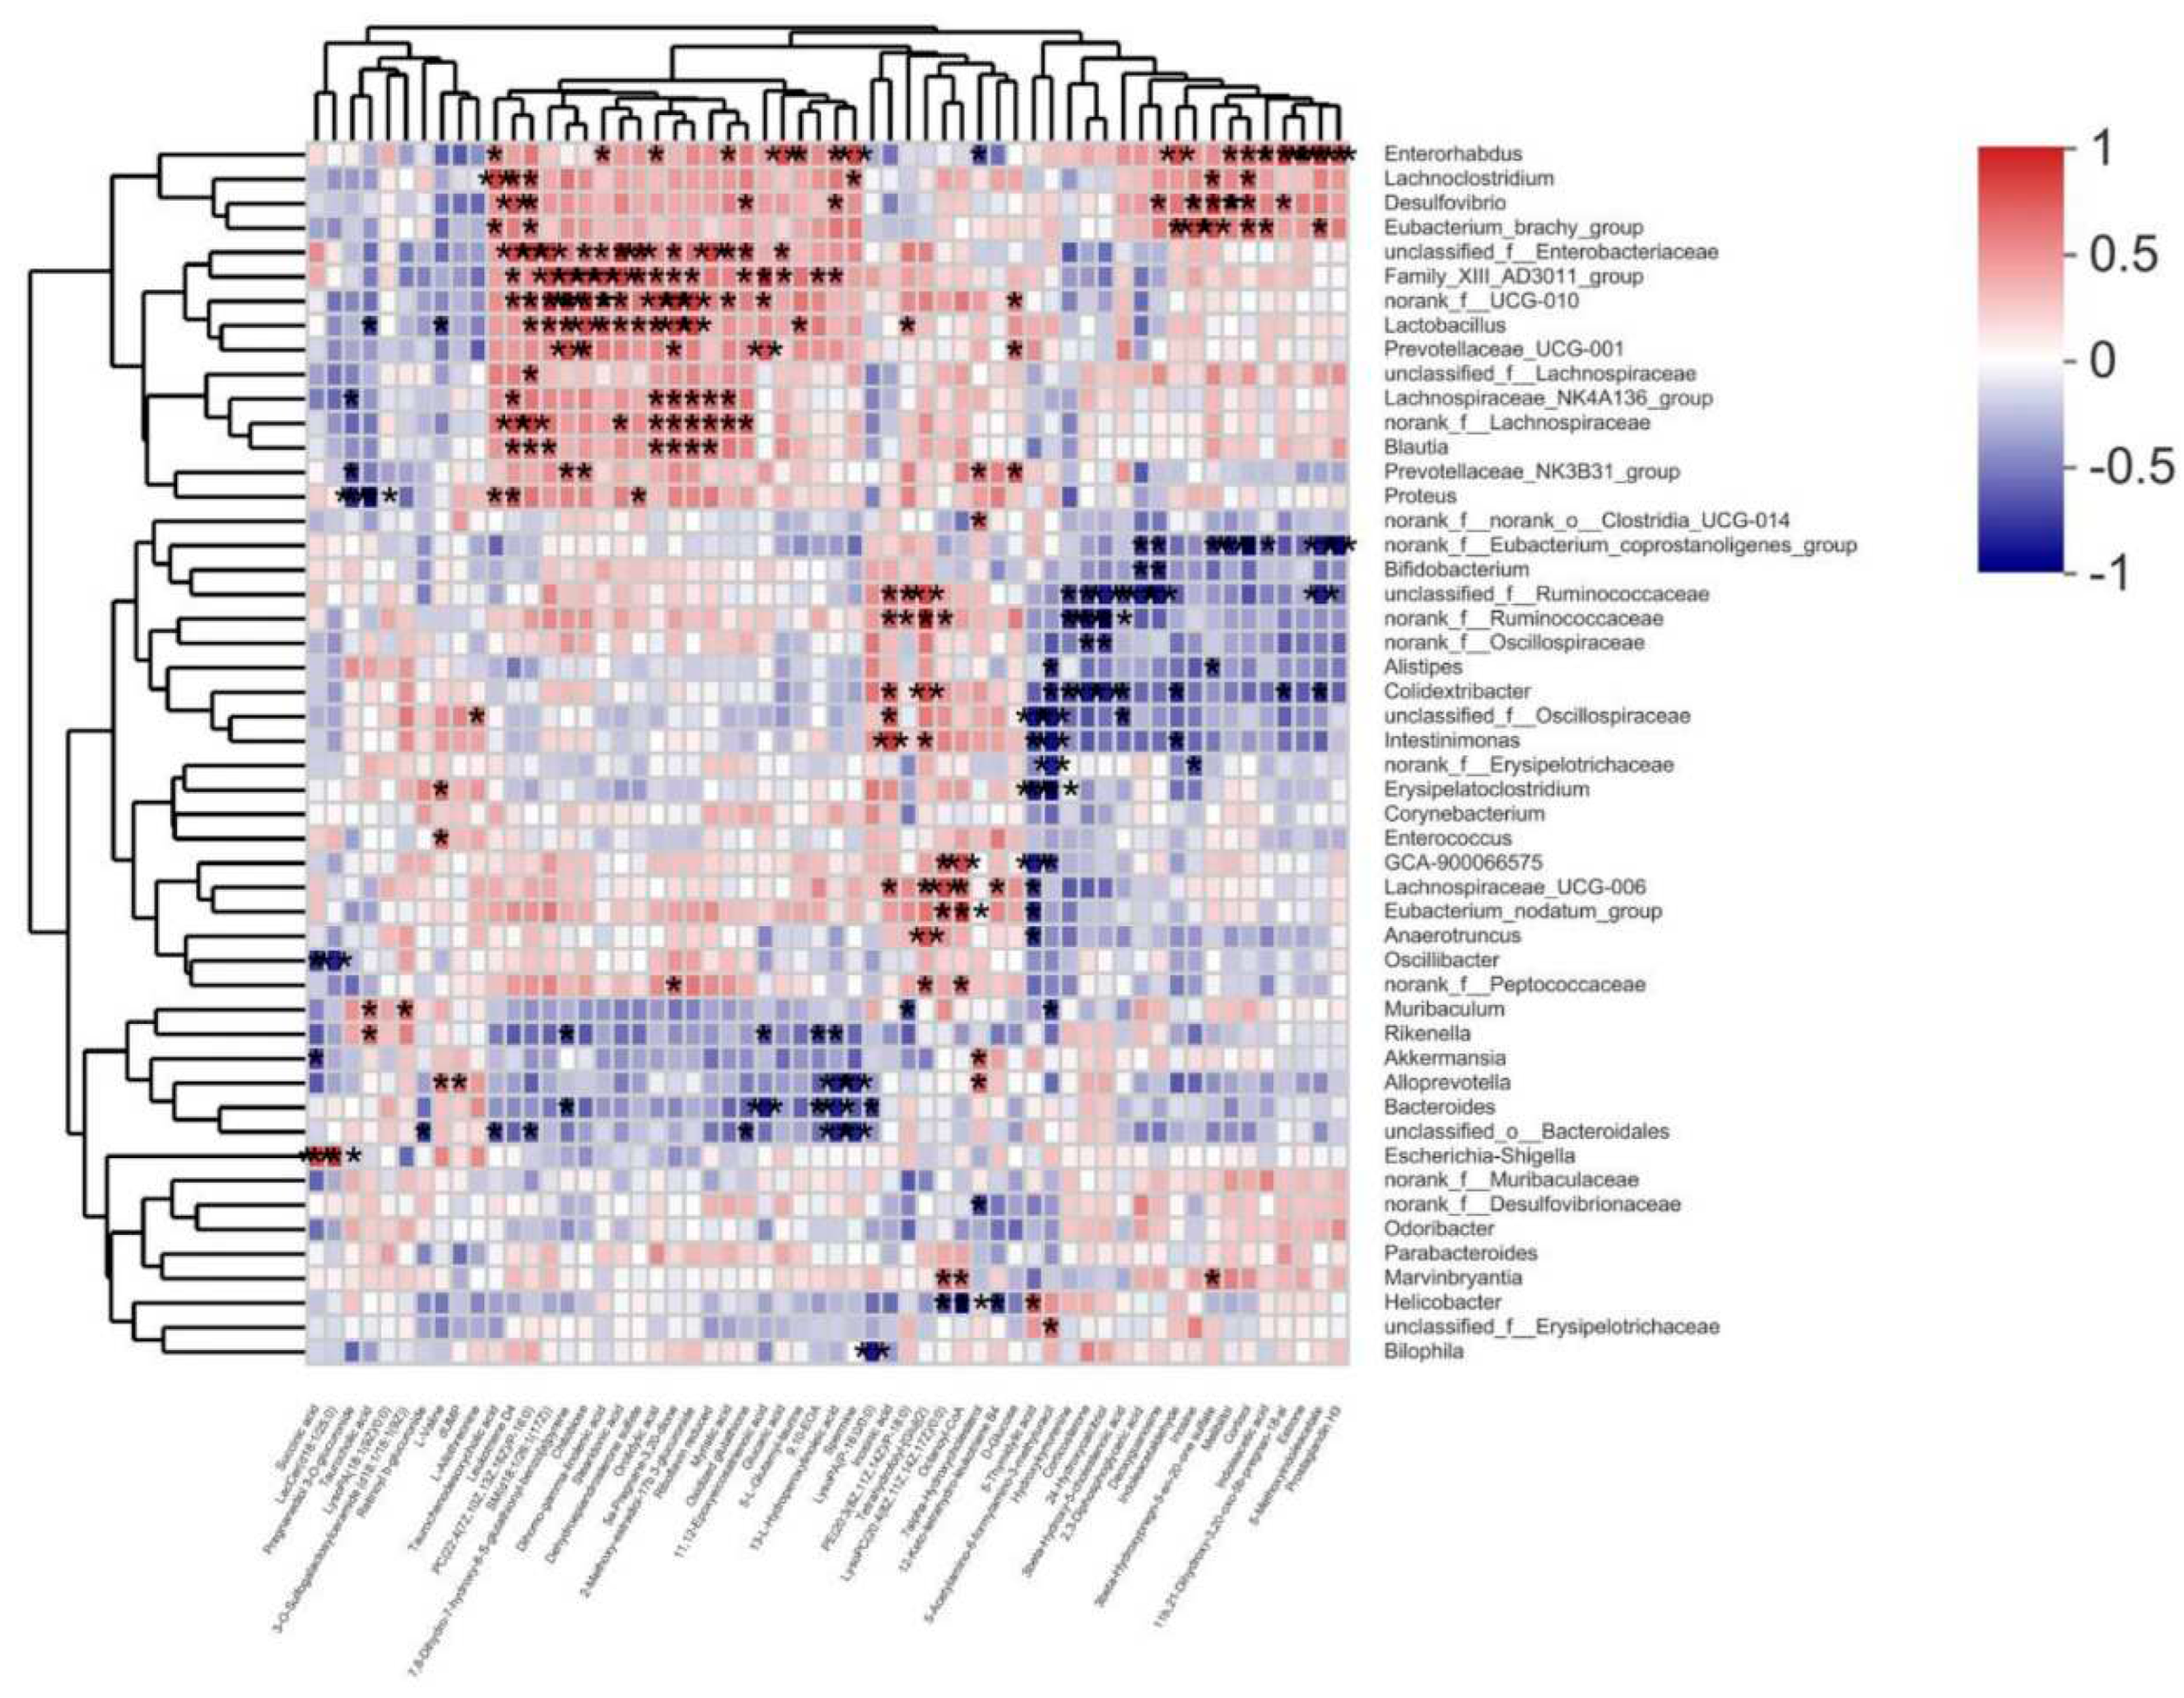
Correlation analysis of gut microbiota and differential metabolites. Spearman correlation analysis was used to calculate the correlation between gut microbiota and differential metabolites in serum collected from
db/db mice after treated with PTR (
Figure 8). Among them,
Muribaculum was positively correlated with 3 - O-Sulfogalactosylceramide ( d18: 1 / 18 : 1 ( 9Z ) ) and Taurocholic acid, while negatively correlated with 5 - Acetylamino-6 - formylamino-3 - methyluracil and PE ( 20 : 3 ( 8Z, 11Z, 14Z ) / P-18 : 0 ) ( | r | > 0.5,
p < 0.05, 0.01, 0.001 ). Additionally,
Desulfovibrio was positively correlated with 3beta-Hydroxypregn-5-en-20-one sulfate, 11b,21-Dihydroxy-3,20-oxo-5b-pregnan-18-al,13-L-Hydroperoxylinoleic acid, Leukotriene D4, Deoxyguanosine, Oxidized glutathione, Melibiitol, Cortisol, Inosine, PC (22:4(7Z,10Z,13Z,16Z)/P-16:0) (|r|>0.5,
p<0.05,0.01,0.001). Lastly,
Blautia was positively correlated with 5a-Pregnane-3, 20-dione, Riboflavin reduced, 2-Methoxy-estradiol-17b 3-glucuronide, Leukotriene D4, SM(d18:1/26:1(17Z)), Orotidylic acid, PC (22:4(7Z,10Z,13Z,16Z)/P-16:0) (|r|>0.5,
p<0.05,0.01,0.001). The above results indicated that the changes of serum metabolites were closely linked to the changes of gut microbiota after PTR supplementation.
Discussion
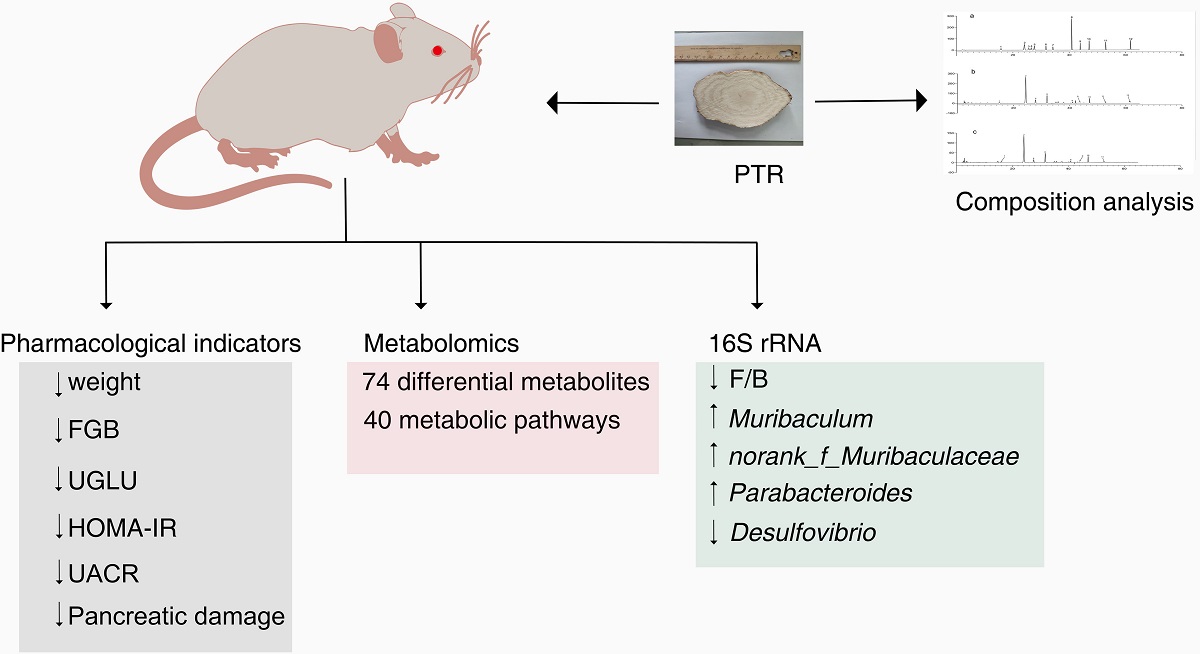
Since ancient times, Pueraria thomsonii Radix is known as “Asian Ginseng”, and is recognised as a medicinal and food homologous plant. In this study, the therapeutic effects on db/db mice were firstly demonstrated, and then the gut microbiota and host metabolomic responses were explored to understand the integrative mechanism underlying PTR ameliorating T2DM and the interplay between the host and microbial.
Metformin is often used in T2DM patients who are unsatisfied with dietary control alone, especially those who are obese and hyperinsulinemic, not only for its hypoglycaemic effect but also for its effect on weight loss and hyperinsulinemia. Metformin is also commonly used in the development of new anti-diabetic drugs to evaluate the efficacy of new drugs against diabetes. In experimental diabetes models, metformin was effective in downregulating blood glucose levels and improving insulin resistance in diabetic mice and rats. In this study, we demonstrated for the first
time that PTR has therapeutic effects in the treatment of T2DM, improving body weight, reducing FBG, UGLU, HOMA-IR and UACR in mice, and reducing pancreatic tissue damage. We found that PTR was comparable to metformin in down-regulating blood glucose levels and improving insulin resistance. This further suggests that the anti-diabetic potential of PTR is in urgent need of further clinical studies, or the use of dietary therapy to control diabetes.
Regulating metabolism is an effective measure for the treatment of diabetes. In this study, PTR reversed 74 of the 109 differential metabolites in
db/db mice, mainly including purines, pyrimidines, glycerophospholipids, and steroids. Purine and pyrimidine metabolism are central to the adenosine system and play a key role in the regulation of glucose homeostasis as well as the pathophysiology of diabetes[
13,
14].In this study, PTR affected the purine metabolic pathway by regulating the levels of Inosine, Inosinic acid and Deoxyguanosine in
db/db mice, and the pyrimidine metabolic pathway by regulating the concentrations of Orotidylic acid, dUMP and 5-Thymidylic acid, thereby improving T2DM. Triglycerides are a clinically important feature of adult-onset T2DM[
15].In this study, PTR could modulate PE (20:3(8Z,11Z,14Z)/P-18:0), PC (22:4(7Z,10Z,13Z,16Z)/P-16:0) and LysoPA (18:1(9Z)/0:0) concentrations in
db/db mice. Two biomarkers, cortisol and cortisone, which play an important role in steroid hormone regulation, affect the energy metabolism associated with T2DM[
16].In this experiment, PTR effectively regulated 5a-Pregnane-3,20-dione, Corticosterone, 11b,21-Dihydroxy-3, 20-oxo-5b-pregnan-18-al, Dehydroepiandrosterone sulfate Cortisol, Estrone, and 2-Methoxy-estradiol-17b 3-glucuronide concentrations. In conclusion, PTR was effective in alleviating T2DM by regulating metabolism.
There is growing evidence that dysbiosis of the intestinal flora is a typical feature of the pathogenesis of diabetes. Clinical studies have found that
Bifidobacterium,
Bacillus spp.,
Clostridium pretense and
Ackermannia spp. are negatively associated with T2DM, and that
Clostridium tumefaciens,
Clostridium perfringens, and
Braunschweiger spp. are positively associated with T2DM. In animal models of experimental diabetes, the species and number of beneficial bacteria were significantly lower, while pathogenic bacteria were significantly higher[
17].In this study,we found that PTR significantly upregulated the abundance of
Muribaculum,
norank_f__Muribaculaceae, and
Parabacteroides in
db/db mice while significantly reducing the abundance of the harmful bacterium
Desulfovibrio. A study has demonstrated that Plukenetia volubilis L. leaf significantly increased
Muribaculum abundance in
db/db mice, a beneficial bacterium that can improve inflammation, dyslipidemia, and glucose intolerance[
18,
19].
Norank_f_Muribaculaceae was a beneficial dominant bacterium in the mouse intestine and was negatively correlated with the glucose levels of postprandial blood[
20].
Parabacteroides is a beneficial bacterium that significantly improves insulin resistance and has been shown in vitro to activate the intestinal gluconeogenic pathway through the conversion of succinate, thereby exerting a hypoglycaemic effect[
21].
Desulfovibrio is a harmful bacterium whose increased abundance can cause inflammation and insulin resistance[
22]. Moreover, it is well known that an increase of the F/B has been considered as a marker of obesogenic flora[
23,
24].In this study, we also found an increased F/B in
db/db mice. In a word, this study provides a basis for further investigation of the anti-obesity role of key PTR-dependent bacteria.
In addition, Spearman’s correlation analysis further revealed a positive correlation between
Desulfovibrio and Cortisol in
db/db mice. Cortisol is an important product of the steroid hormone biosynthetic pathway and is considered an active indicator of the Hypothalamic-pituitary-adrenal(HPA)axis. A recent study has shown that cortisol is associated with dyslipidemia and impaired glucose metabolism[
25]. Desulfovibrio has been reported to be negatively correlated with γ-aminobutyric(GABA)[
26], which can inhibit glucagon secretion and enhance insulin secretion[
27]. Notably, hypothalamic Cortisol concentrations are influenced by GABA, and reduced GABA levels lead to over-activation of the HPA axis, resulting in increased Cortisol levels[
28,
29]. Recent research hotspots have reported a stronger bidirectional communication between the gut and brain through the nervous, endocrine, and immune systems, i.e., MGB[
30,
31]. In this experiment, PTR reduced the abundance of
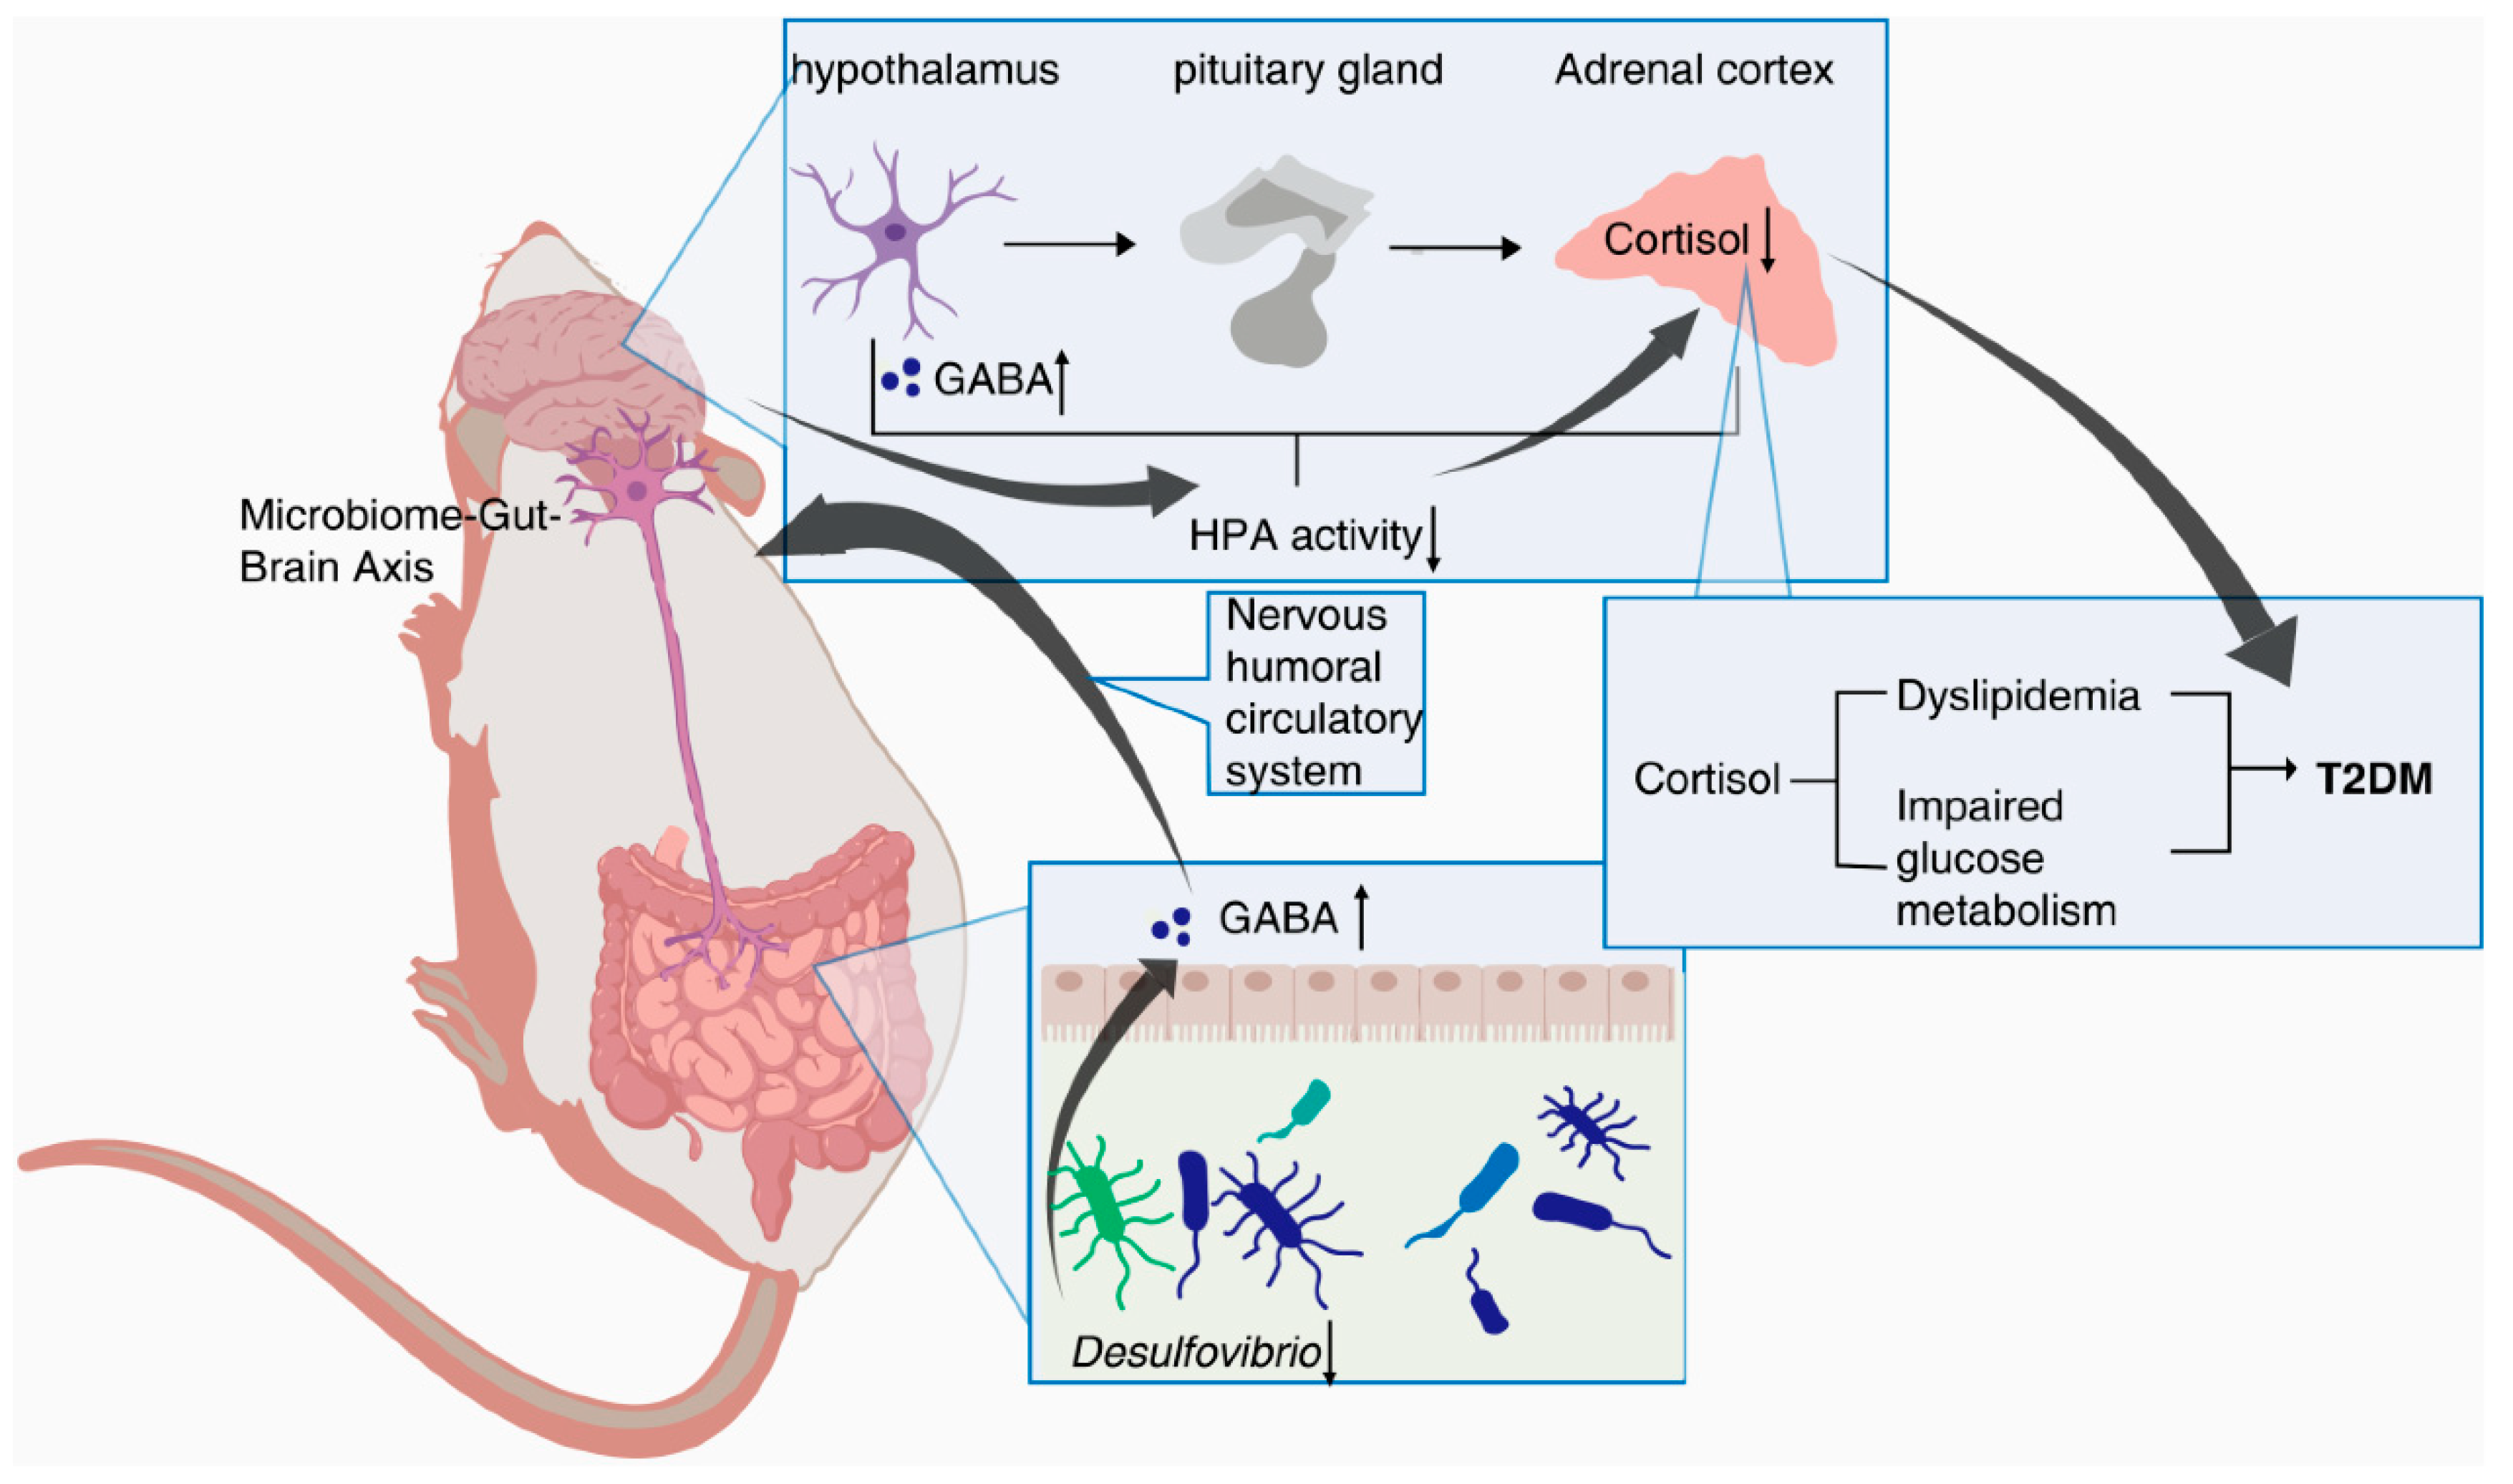
Desulfovibrio and the levels of Cortisol metabolism. Therefore, we speculate that PTR administration resulted in a decrease in
Desulfovibrio abundance, leading to an increase in GABA levels in the gut, which in turn inhibited HPA axis activation via the enteric nervous system (ENS) via the MGB pathway, contributing to a decrease in Cortisol metabolism levels (
Figure 9). This is the focus of our subsequent studies, and perhaps related studies will be reported in the near future.
