Preprint
Article

Fluid-Structure Interaction: Numerical Analysis of Biomagnetic Flow Inhibition on a Plaque in a Stenosed Bifurcation Artery

Altmetrics

Downloads

189

Views

36

Comments

0

This version is not peer-reviewed

Submitted:

05 March 2023

Posted:

07 March 2023

You are already at the latest version

Alerts
Abstract
To investigate the impact of a magnetic field on plaque development in a stenotic bifurcated artery, a finite element method is utilized. The blood flow is modelled as a stable, incompressible, Newtonian, biomagnetic, and laminar fluid. Furthermore, the arterial wall is assumed to be linear elastic. The Arbitrary Lagrangian Eulerian (ALE) method is employed to describe the hemodynamic flow in a bifurcated artery under the influence of an asymmetric magnetic field, taking into account two-way fluid-structure interaction coupling. A stable $P_2P_1$ finite element pair discretizes a nonlinear system of partial differential equations that requires a solution. The Newton-Raphson method is utilized to find a solution to the resulting nonlinear algebraic equation system. Numerical modelling is used to simulate the presence of magnetic fields, and the resulting displacement, velocity magnitude, pressure, and wall shear stresses are shown for a range of Reynolds numbers ($Re = 500$, $1000$, $1500$, and $2000$). The results of the numerical analysis demonstrate that the presence of a magnetic field has a significant effect not only on the magnitude of displacement but also on the velocity of the flow. The application of a magnetic field reduces flow separation, extends the recirculation area near the stenosis, and increases wall shear stress.
Keywords: 
Subject: Computer Science and Mathematics  -   Computational Mathematics

1. Introduction

The use of biomagnetic fluid flow as a treatment for atherosclerosis and other cardiovascular disorders has garnered interest in recent years [1,2]. Atherosclerosis is the accumulation of fatty acids, insulation, and other surpluses on the walls of veins, which can decrease blood flow and is a major cause of death in industrialized nations [1,2]. While the early stages of atherosclerosis may not have visible impacts, advanced stages can hinder blood flow and cause ischemia [3,4,5]. Atherosclerosis is closely associated with the carotid arteries, which are important for transporting oxygenated blood from the brain to the heart [6,7,8,9,10,11]. Computational fluid dynamics and numerical research of fluid-structure interaction have been used to study the relationship between hemodynamic effects and atherosclerotic infection [12,13,14].
The presence of a carotid sinus is associated with a higher risk of stroke due to easier recirculation and lower wall shear stress [15]. The size of the carotid sinus is a risk factor for atherosclerosis, with larger sinuses associated with higher Oscillatory Shear Index (OSI) [16,17]. High OSI is commonly found near bifurcations and can lead to atherosclerosis [18]. The use of a magnetic field can impact rheological models of blood control and flow, and has been shown to be useful in cases of hypertension [31]. A finite difference approach has been used to analyze non-isothermal flow in stenosed arteries exposed to a magnetic field [31]. Turbulent magnetohydrodynamic behavior of blood as it flows through narrowing arteries has also been investigated [32,33,34,35].
In this paper, we investigate the behavior of a Newtonian, viscous, steady, incompressible, laminar biomagnetic fluid passing through a two-dimensional stenotic bifurcated artery, incorporating an elastic wall model into the set of equations [36,37]. The problem is solved numerically using the ALE technique and strong coupling approaches, which are validated against the FSI-benchmark problem [38,40].
The upcoming content will follow this layout: Section 5 will focus on mathematical modeling and problem formulation, while Section 6 will provide a brief overview of the results and discussion. The conclusion will be presented in Section 7.

2. Problem Formulation

A typical Fluid-Structure Interaction (FSI) problem involves modeling the fluid and solid domains, imposing interface conditions, and enforcing boundary constraints. This study focuses on the interaction of an incompressible Newtonian fluid with a vertical elastic flap and elastic boundary.

2.1. Fluid Model

The characteristics of a Newtonian fluid are represented by the velocity  v f and pressure p f , where the fluid’s density is denoted by ρ f , and its kinematic viscosity is symbolized by ν f . The balance equation is then expressed as follows [40]:
div œ f = ϱ f v f t + ϱ f ( v f ) ( v f u f t ) in Ω t f , 0 = d i v v f in Ω t f
To solve the balance equation, it is important to establish the fundamental relationship for the stress tensor. In this case, a Newtonian fluid with constant density is being utilized:
œ f = p f I + μ ( v f + ( v f ) T ) ,
the constant dynamic viscosity of the Newtonian fluid is represented by μ , and the identity matrix is denoted by I . In addition, the Lagrangian multiplier related to the incompressibility constraint in (1) is identified as p f , and the stress tensor is denoted by œ f . The term p f I represents the inviscid reactive component of the Cauchy stress tensor.

2.2. Structure Model

Structure properties
Suppose the solid object has an elastic property and its density varies. Let u s represent its displacement and v s represent its velocity. The balance equation can then be expressed as follows:
ρ s v s t + ρ s ( v s ) v s div σ s = 0 + ρ s g , in Ω t s .
The above equation can be expressed in a Lagrangian framework with respect to a specific initial state Ω s . More information can be found in [40]
ρ s 2 u s t 2 div ( J σ s F T ) = 0 + ρ s g , in Ω s .
Here, F T = ( F 1 ) T , F 1 represents the inverse deformation gradient, and J = d e t F . The equations for the stress tensor can be applied to both compressible and incompressible structures using the same approach. The undeformed structure density is denoted by ρ s , while the elasticity of the structure is defined by the Poisson ratio ν s and Young’s modulus E.
ν s = λ s 2 ( μ s + λ s ) E = μ s ( 2 μ 2 + 3 λ s ) ( λ s + μ s )
μ s = E 2 ( ν s + 1 ) λ s = E ν s ( ν s + 1 ) ( 1 2 ν s ) ,
The Poisson ratio is 1 / 2 for incompressible structures, while it is less than 1 / 2 for compressible structures. The relationship between stress and strain is expressed in terms of the 2 nd Piola-Kirchhoff stress tensor S and the Green-Lagrangian strain tensor E. The 2 2 nd Piola-Kirchhoff stress tensor can be derived from the Cauchy stress tensor σ s , as
S s = J F 1 σ s F T ,
and E can be written as
E = 1 2 ( F T F I ) .
In this present work, the Cauchy stress tensor σ s for the St.Venant-Kirchhoff material model is defined as follows
σ s = 1 J F ( λ s ( t r E ) I + 2 μ s E ) F T , S s = λ s ( t r E ) I + 2 μ s E .
where, J represent the determinant of the deformation gradient tensor F, described by
F = I + u s .

2.3. Fluid Structure Interaction Set of Equations

The technique of constructing the fluid structure interaction problem is through the application of a pseudo-solid mapping method. The dimensionless system, which incorporates the mentioned material relation, is presented in the following manner:
u t = Δ u in Ω f , v in Ω s ,
v t = ( v u t ) F 1 ( Grad v ) + Div J p f F T + J μ Grad v F 1 F T in Ω f , 1 β Div J p s F T in Ω s ,
0 = Div ( J v F T ) in Ω f , J 1 in Ω s ,
the solid to fluid density ratio, denoted by β , is defined as β = ϱ s ϱ f , where ϱ s and ϱ f are the densities of the solid and fluid, respectively. To ensure that the no-slip conditions are maintained at the fluid structure interface, the following Neumann and Dirichlet constraints are applied:
œ f n = œ s n v f = v s .

3. The Finite Element Method (FEM) Discretization

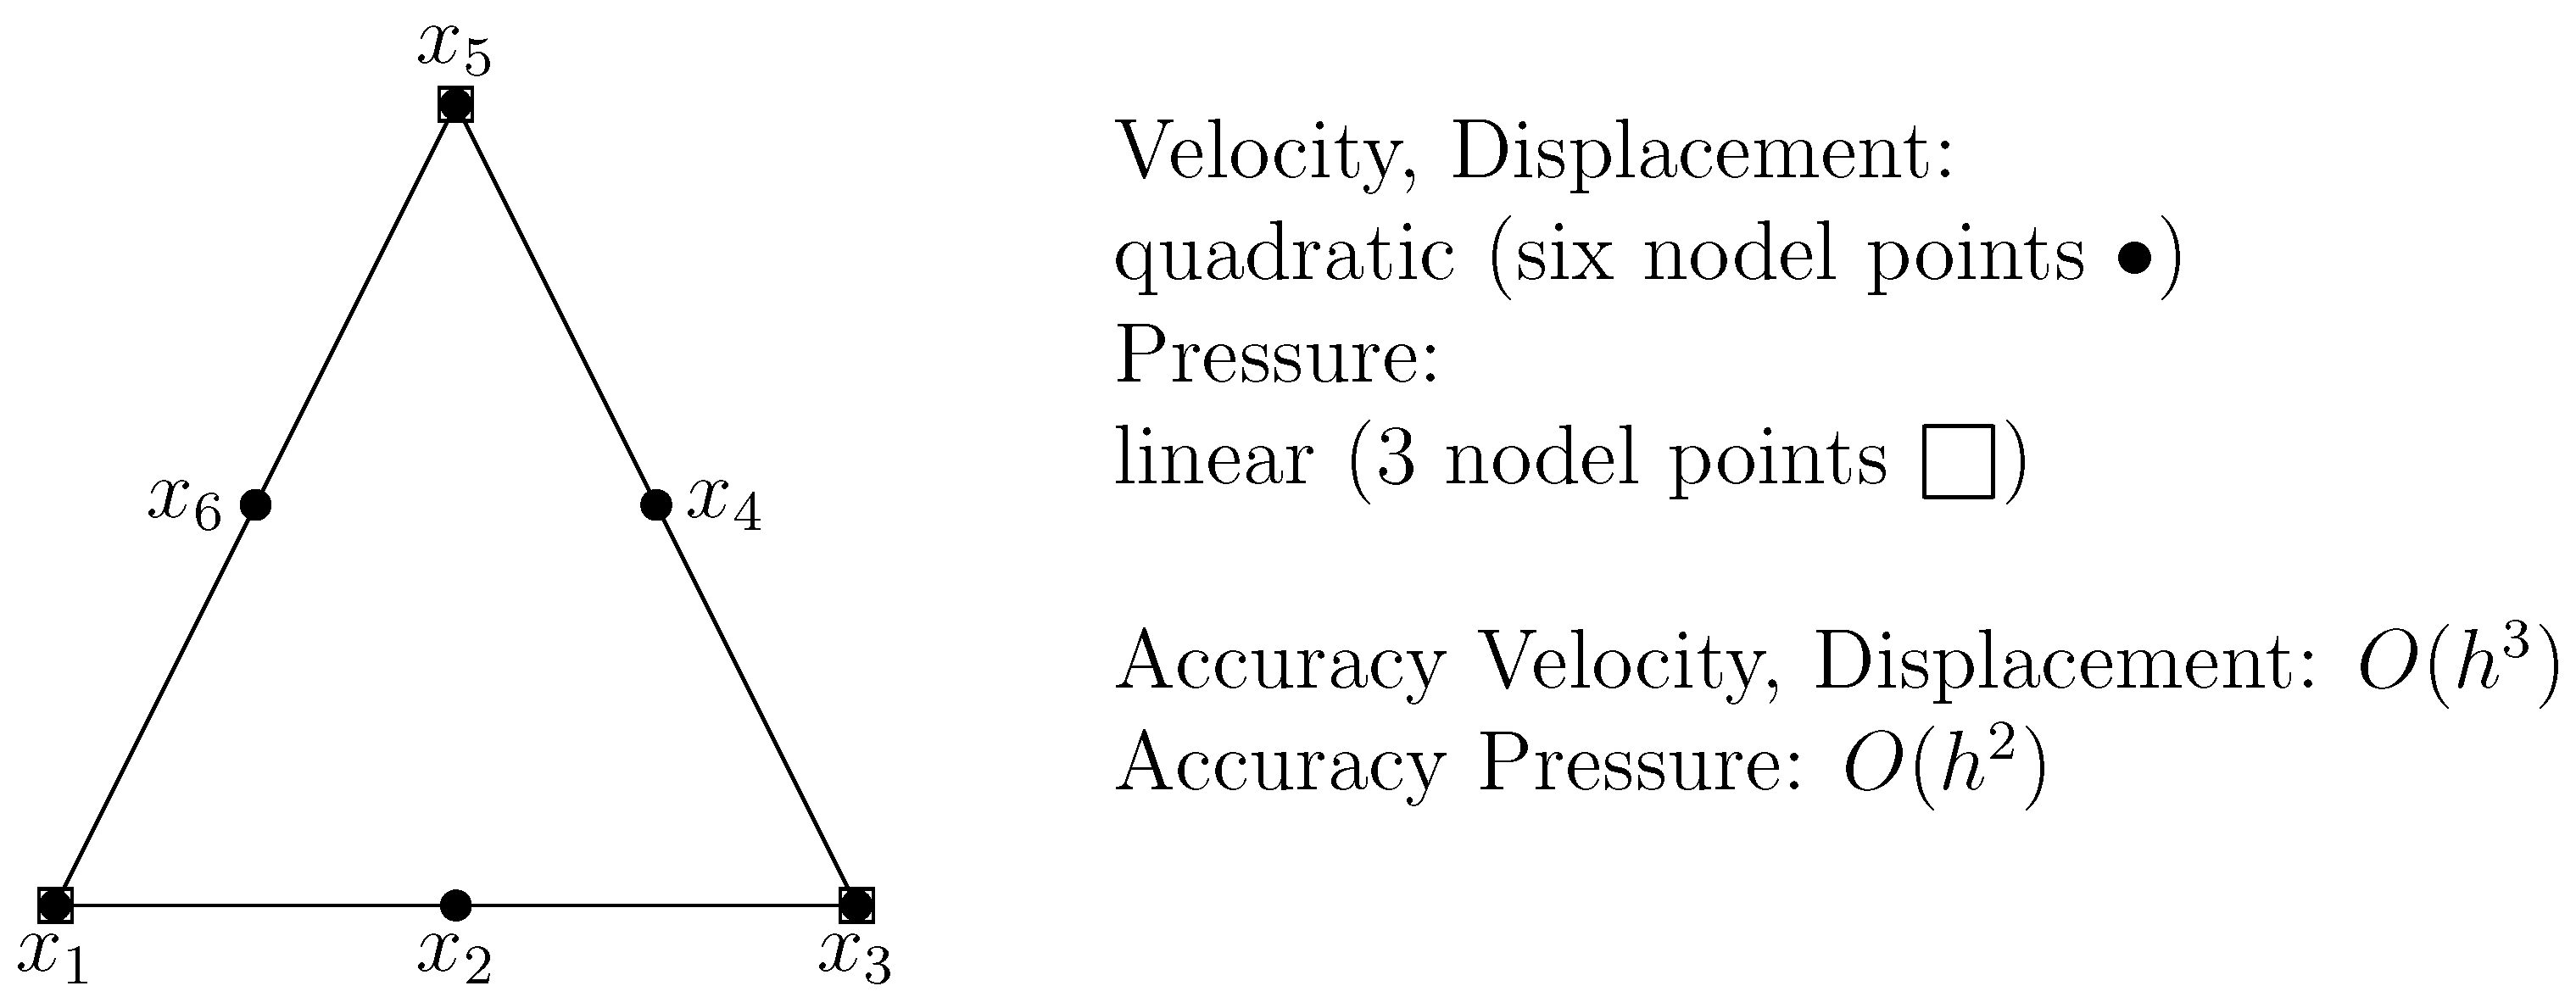
The Taylor-Hood pair P 2 P 1 is a widely used finite element space for fluid-structure interaction problems. This choice of element is optimal in terms of convergence, and it also satisfies the LBB stability condition [41]. The Ladyzhenskaya–Babuska–Brezzi (LBB) condition is a stability condition for mixed finite element methods that is necessary to ensure convergence of the numerical solution to the correct solution of the partial differential equation being solved. By transitioning from a a discontinuous to a continuous space, the dimension of the pressure space is reduced, which leads to a reduction in the number of degrees of freedom required for the simulation. The degrees of freedom for this element are illustrated in Figure 1.
The basis function ϕ i of P 1 element is given by:
ϕ i ( x ) = a i + b i x + c i y
and basis vector set is
1 , x , y .
For P 2 element, we have
ϕ i ( x ) = a i + b i x + c i y + d i x 2 + e i y 2 + f i x y
and basis vector set is
1 , x , y , x 2 , x y , y 2
The weak formulation of the problem is obtained using the standard Galerkin finite element method, which involves discretizing the space over the time interval I = [ 0 , T ] . To achieve this, the equations given in Equations 11–13 are multiplied by the test functions ı , ¸ , γ , and then integrated over the space and the time interval I. Integration by parts is then applied to some of the terms, and the boundary conditions are used to obtain a final expression.
0 T Ω u t · ı d V d t = 0 T Ω s v · ı d V d t 0 T Ω f Grad u · Grad ı d V d t ,
0 T Ω f J v t · ¸ d V d t + 0 T Ω s β J v t · ¸ d V d t = 0 T Ω f J Grad v F 1 ( v u t ) · ¸ d V d t + 0 T Ω J p F T · Grad ¸ d V d t 0 T Ω f J μ Grad v F 1 F T · Grad ¸ d V d t ,
0 = 0 T Ω s ( J 1 ) γ d V d t + 0 T Ω f Div ( J v F T ) γ d V d t .
After applying FEM space discretization, we obtained a nonlinear algebraic system of equations as follows:
S u u S u v 0 S v u S v v k B c u B s T c v B f T 0 u h v h p h = rhs u rhs v rhs p ,
The nonlinear algebraic system of equations involves the diffusive, reactive, and convective operator denoted by S from the governing equations, as well as the discrete gradient and the discrete divergence operators represented by B and B T , respectively.

4. Solution Algorithm

In order to obtain a solution for the system of nonlinear algebraic equations of saddle point type presented in (22), the Newton iteration method is employed. This method is known for its quadratic convergence property when the solution is sufficiently close. The ultimate goal is to find a root of the residual.
R ( X ) = 0 ,
The Newton iteration method with damping is utilized, which involves using the function value and its first derivative that are already known. The corresponding formula for this iteration is as follows:
X n + 1 = X n + ω n R ( X n ) X 1 R ( X n )
Here, X = ( u h , v h , p h ) , and the Jacobian matrix R ( X n ) X is calculated through finite differences, using the residual matrix R ( X ) .
R ( X n ) X i j [ R ] i ( X n + α j e j ) [ R ] i ( X n α j e j ) 2 α j ,
The coefficients α j > 0 correspond to increments at each iteration step n, and e j represents the unit basis vectors in R n for Equation 24. For more detailed explanations, refer to [42]. The parameter ω n ( 1 , 0 ) is chosen such that the error measure decreases.
R ( X n + 1 ) · X n + 1 R ( X n ) · X n ,
The Newton iteration algorithm in Algorithm 1 is used to solve the nonlinear algebraic system of equations of saddle point type in (22). To improve the robustness of the Newton iteration, damping is used when the current approximation X n is not sufficiently close to the final solution. The damping parameter ω n ( 1 , 0 ) is chosen to decrease the error measure. Further details on this technique can be found in [38,44]. A direct solver for sparse systems, such as MUMPS [31], is employed in this 2 D problem.
Algorithm 1 Newton iteration and line search
1:
Input the nonlinear tolerance parameter
2:
Initialize n to zero and take a starting guess X n
3:
Compute the residual vector R ( X n ) = A X n b
4:
Compute the Jacobian matrix J ( X n ) = R X ( X n )
5:
Solve the linear system for the correction of δ X :
J ( X n ) δ X n = R ( X n )
6:
Find an optimal step length ω n ( 1 , 0 ] using line search
7:
Update the solution as X n + 1 = X n + ω n δ X n

5. Mathematical Modeling

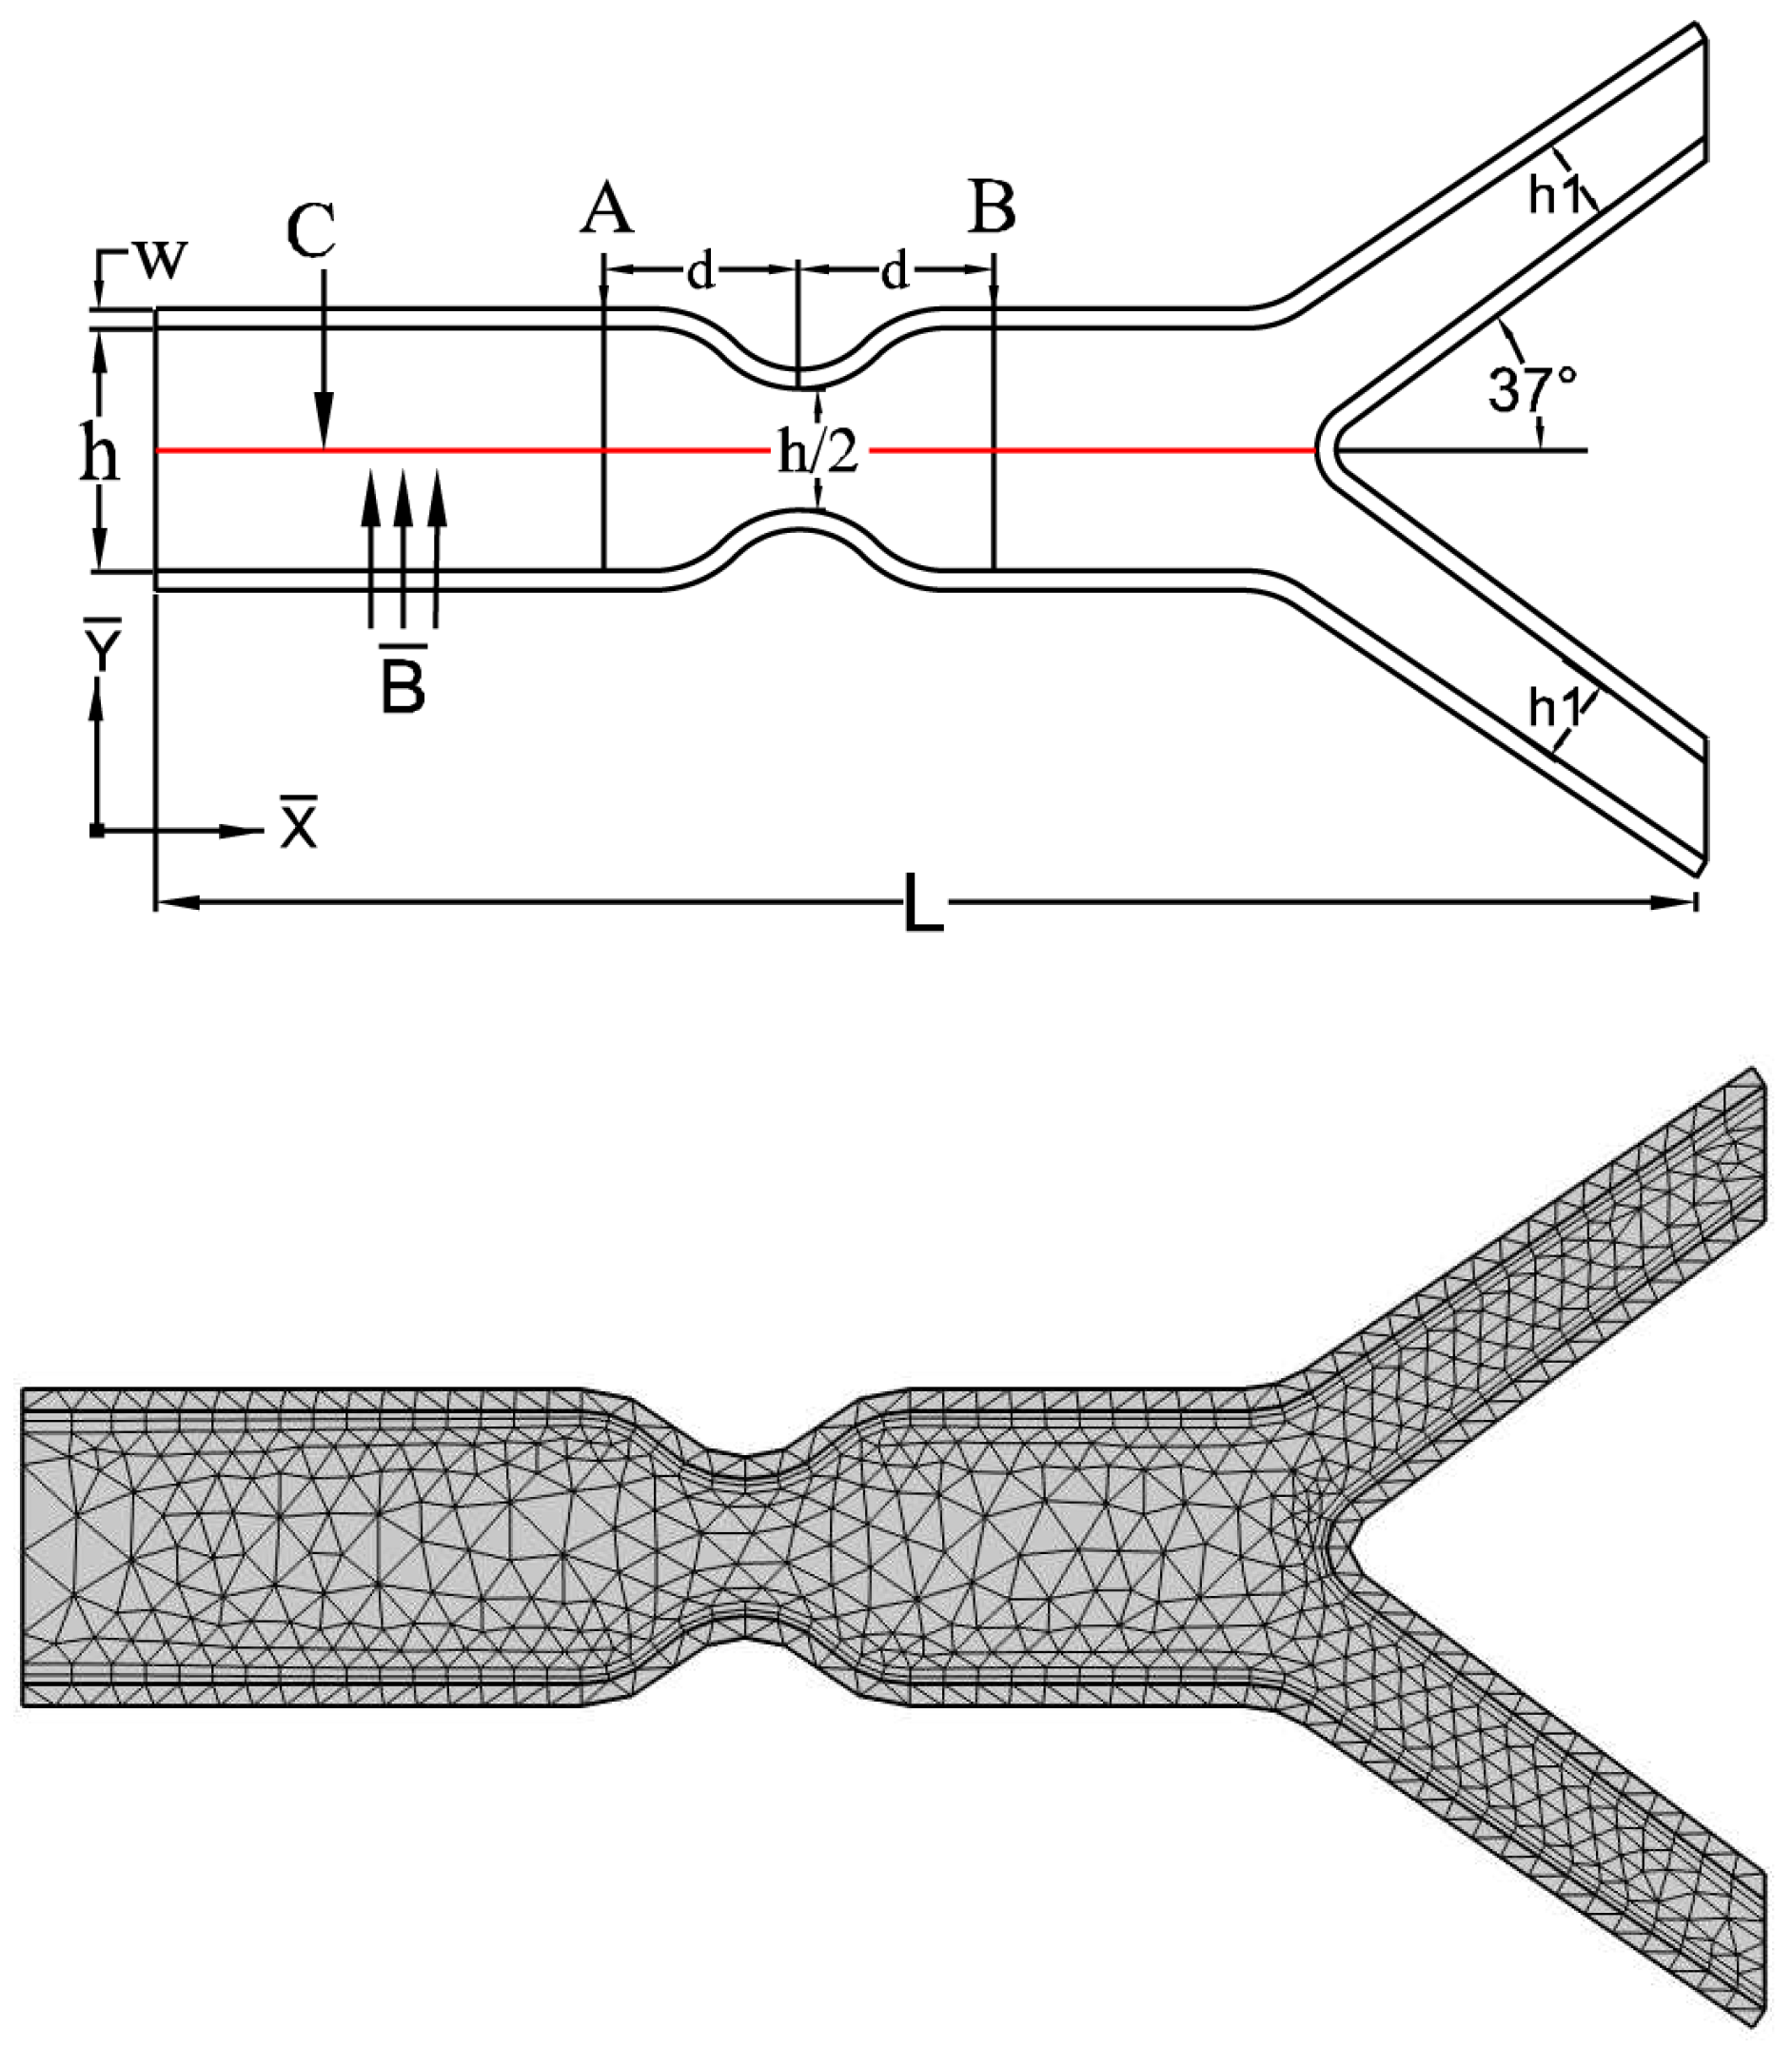
The focus of the study is on the flow of biomagnetic fluid through a stenosis in a bifurcated artery. The fluid has a two-dimensional structure, is viscous, stable, and non-compressible. The researchers assumed that the magnetic field has a negligible impact on fluid viscosity, and that the geometry being studied has insulating walls with a relatively weak electric field. It is generally accepted that the walls of arteries have some degree of linear flexibility. The problem geometry and a coarse mesh are presented in Figure 2.
To analyze the flow of biomagnetic fluid, a constant magnetic field is applied along the Y ¯ axis. The inflow velocity profile and the outflow pressure are assumed to follow a parabolic shape, with the outflow pressure expected to remain at zero. The governing equations for flow are formulated using the Arbitrary Lagrangian Eulerian (ALE) approach.
In summary, the study focuses on the flow of biomagnetic fluid through a stenosis in a bifurcated artery. The fluid is assumed to be two-dimensional, viscous, stable, and non-compressible. The researchers assume that the magnetic field has a negligible effect on fluid viscosity and that the walls of the artery being studied are insulating with a weak electric field. A constant magnetic field is applied along the Y ¯ axis, and the inflow velocity profile and outflow pressure are assumed to follow a parabolic shape. The governing equations are derived using the ALE formulation. The problem geometry and mesh are shown in Figure 2.
Conservation of mass
u * x * = v * y * ,
conservation of momentum
p * x * σ * u * ( B * ) 2 + μ * 2 u * ( x * ) 2 + 2 u * ( y * ) 2 = ρ f ( u * w * ) u * x * + ρ f ( v * w * ) u * y * ,
p * y * + μ * 2 v * ( x * ) 2 + 2 v * ( y * ) 2 = ρ f ( u * w * ) v * x * + ρ f ( v * w * ) v * y * ,
The velocity components in different dimensions are represented by u * and v * , while w * denotes velocity in the mesh coordinate system. The electrical conductivity of the biomagnetic fluid is denoted by σ * . The Lorentz force per unit volume generated by the fluid’s electric conductivity is represented by σ * u * ( B * ) 2 in equation 27.
The governing equations for dimensional solid displacement can be expressed as follows: conservation of Momentum:
σ * = F v ,
Now that we have reached this point, we are able to define the strain tensor by assuming that the wall is linearly elastic:
σ = ( 1 / J ) F S F T ,
The value J of the determinant is employed in the equation F = 1 + u S , where F is the value of the determinant. The equation S = C : ϵ describes the relationship between the second Piola-Kirkhoff stress tensor, S, and the strain, ϵ and
ϵ = 1 2 ( u s ) T + u s + ( u s ) T . u s .
To simplify the numerical solution of the system, the first step is to convert it into a dimensionless form by introducing the following non-dimensional variables:
x * h = x , y * h = y , u * u 0 * = u , v * u 0 * = v , w * u 0 * = w , p * ρ f u 0 * 2 = p ,
where, h is the shortest distance between two walls of the artery and u 0 * is the maximum velocity of the blood at the inlet and the non dimensional parameters:
R e = h ρ f * u 0 * μ * Reynolds number ,
H a = σ * h 2 ( B * ) 2 μ * Hartmann number .
The system is transformed into a dimensionless form for simplicity by introducing the aforementioned non-dimensional parameters and variables, resulting in the following set of equations:
· u = 0 ,
p x H a 2 R e u + 1 R e 2 u x 2 + 2 u y 2 = ( u w ) u x + ( v w ) u y ,
p y + 1 R e 2 v x 2 + 2 v y 2 = ( u w ) v x + ( v w ) v y ,
σ = F v .

5.1. Problem Configuration

The mesh serves as a common 2-dimensional representation of the model, which can be observed in Figure 2. The computational domain can be viewed as a symmetrical bifurcation and stenosis. The walls are constructed using an isotropic linear elastic material with a known Poisson ratio and Young’s modulus. The group of Lame coefficient, λ , and shear modulus, μ , are used to define the walls and have the following responsibilities:
ν = λ 2 ( λ + μ ) , E = μ ( 3 λ + 2 μ ) λ + μ , μ = E 2 ( 1 + ν ) , λ = ν E ( 1 + μ ) ( 1 2 ν ) ,
Materials with a Poisson ratio ν < 0.5 are considered compressible, while materials with ν = 0.5 are considered incompressible, as explained in [39]. In the present analysis, a Young’s modulus of E = 5 × 10 5 and a Poisson ratio of ν = 0.49 were utilized.
Figure 2. A schematic diagram of the problem and coarse mesh
Preprints 69435 g002
Figure 2 displays a computational domain with stenosis. The parent artery diameter is h = 1 , and the diameter of the stenosis site is reduced by 50 % while the daughter artery diameter is h 1 = 0.37 . The elastic wall width of this artery is w = 0.08 , and the bifurcation artery angle is 37 . Line A starts at the coordinates ( 1.8 , t ) for t = 0 and t = 1 . The centerline for pressure measurements is line C, and the distance between line A and the stenosis is d = 0.8 .
The coarse mesh, shown in Figure 2, has 1478 domain elements and 338 boundary elements. Table 1 shows the absolute error of the WSS with respect to the mesh refinement level and the number of elements. The WSS on the upper elastic wall is also provided in the table. In Level 1 computation, 1922 finite elements are used.
Assuming a parabolic shape for the inlet velocity profile, the following equation is used:
u f ( x , y ) = 2 y ( 1 y ) .
The pressure conditions at the outflow boundaries are determined by the pressure being zero at the discharge point.

6. Results and Discussion

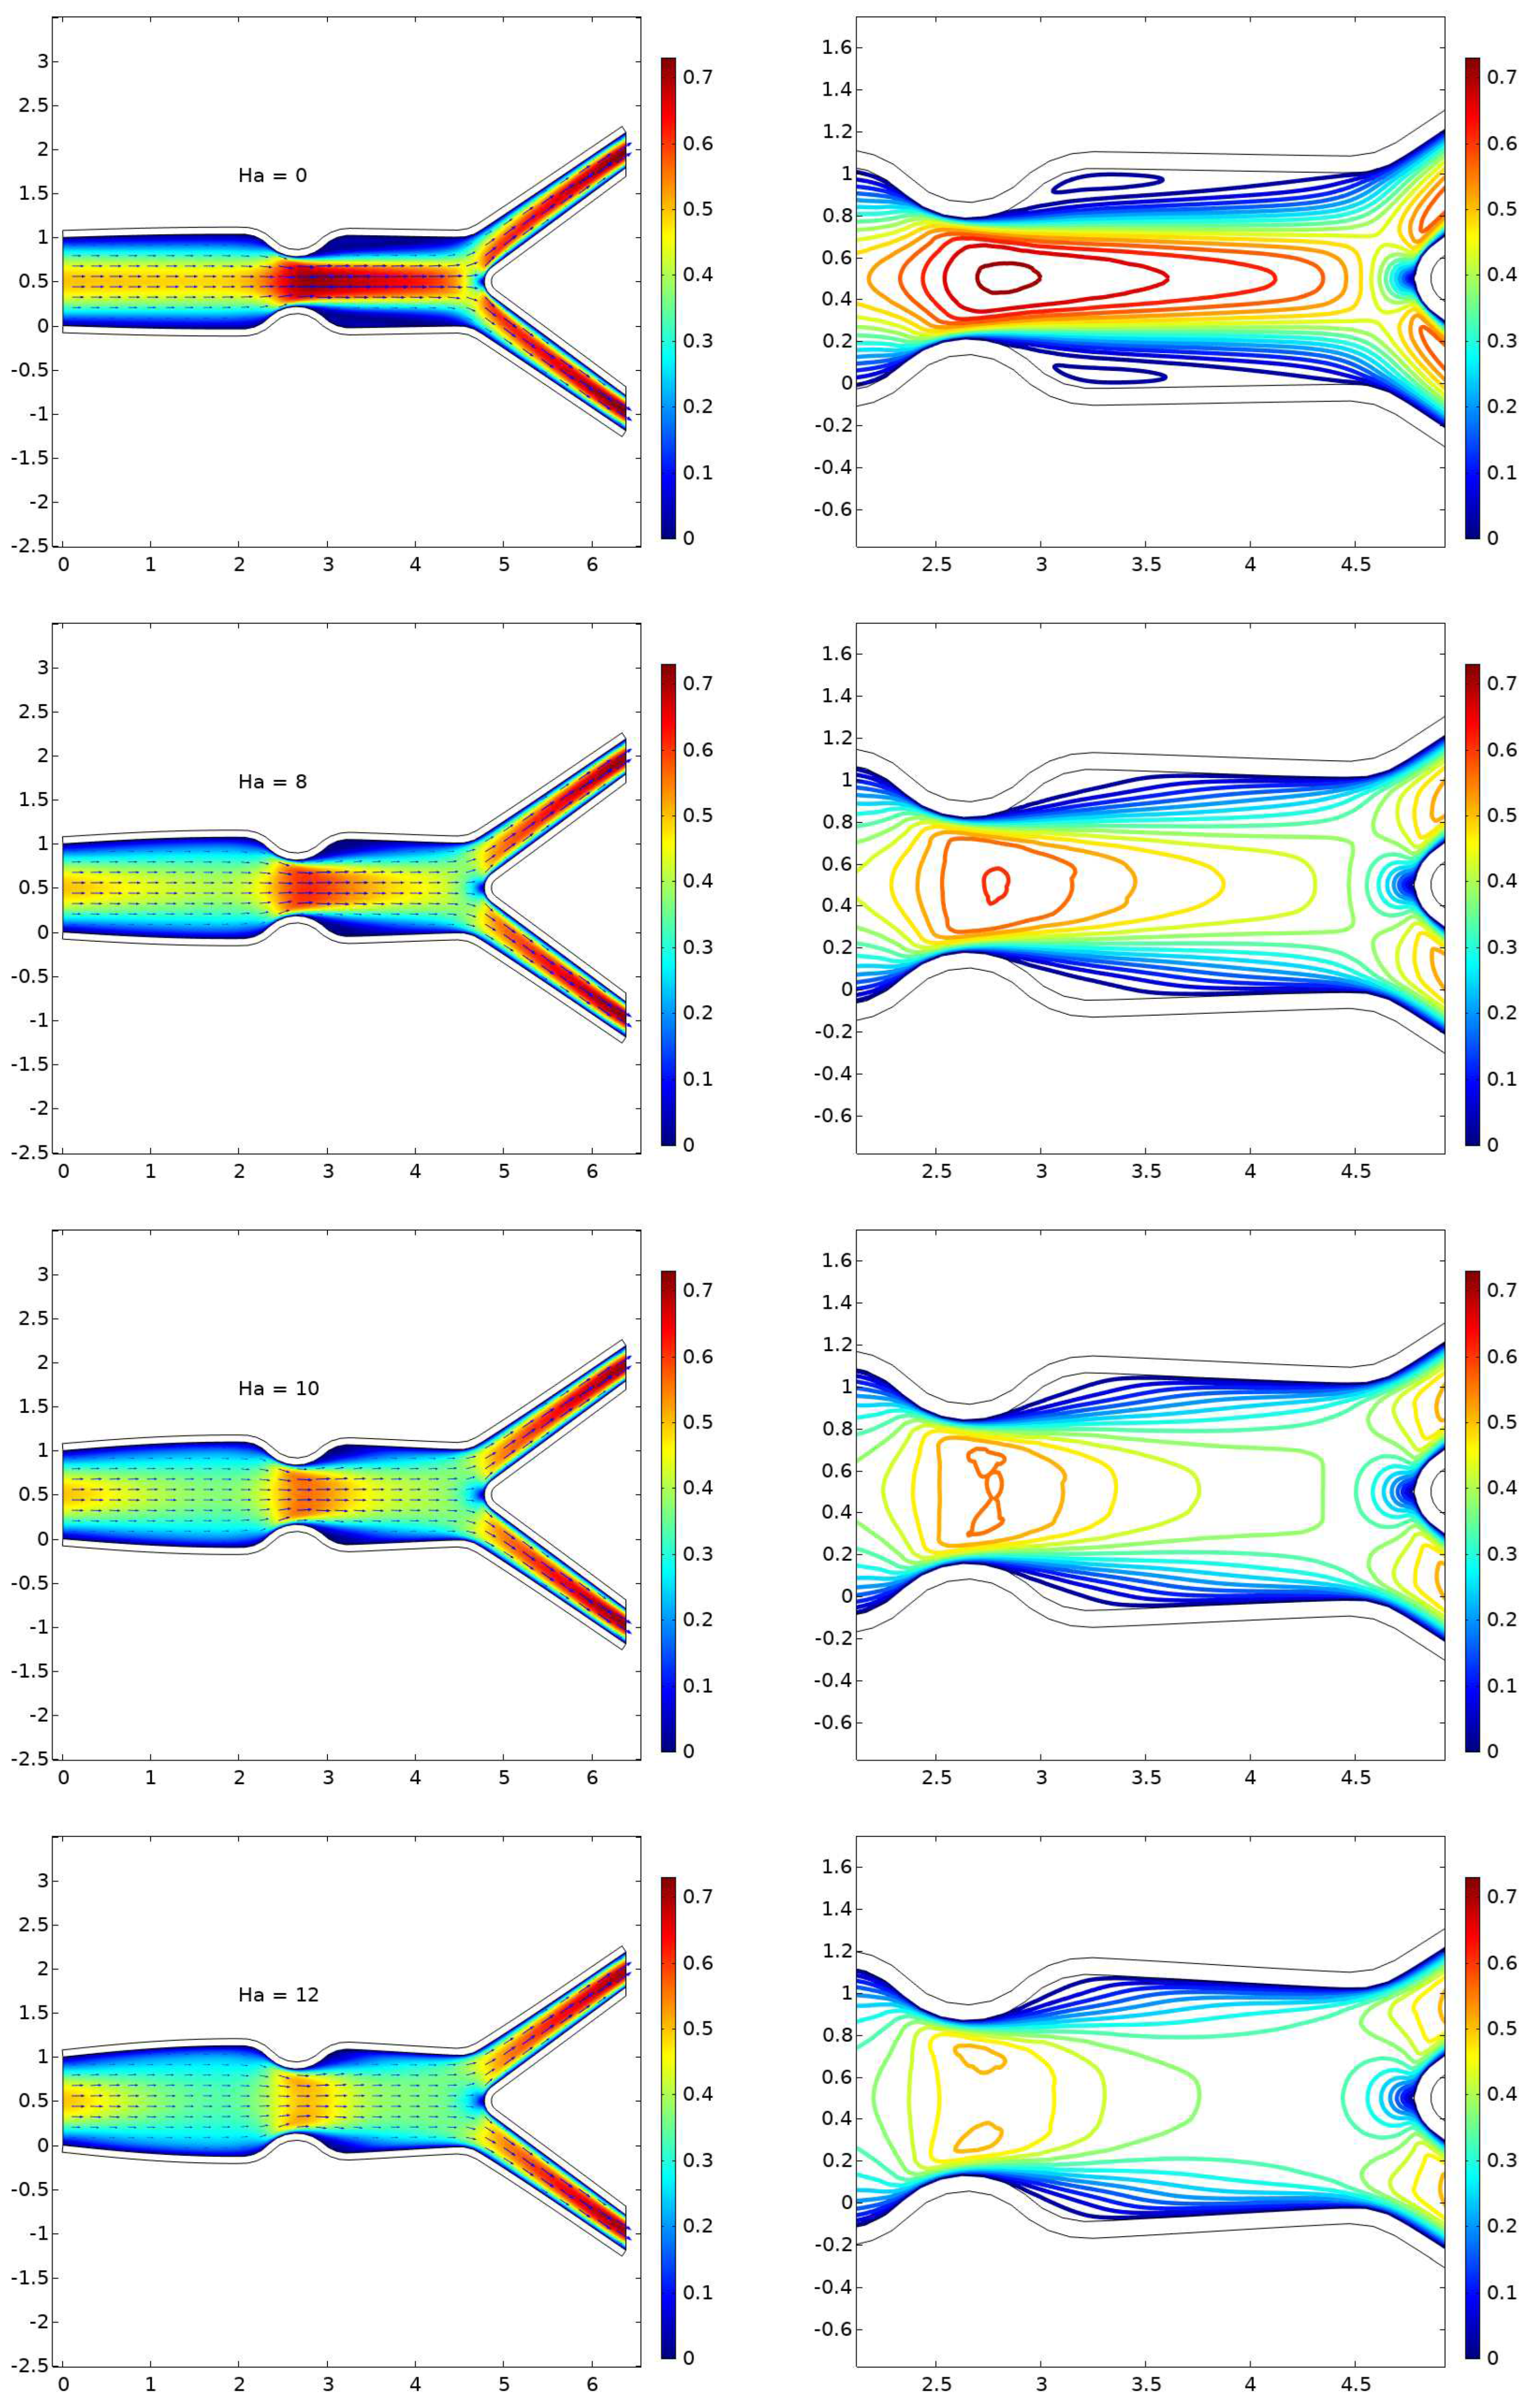
To obtain a solution for the formulated system of equations, the ALE approach is utilized along with appropriate boundary conditions, which helps to gain a better understanding of the problem. The governing nonlinear PDEs are transformed into a dimensionless form using well-known parameters like the Reynolds number and Hartmann number ( H a ). The Reynolds number ranges from 500 to 2000, and the Hartmann number ranges from 0 to 12 for the fluid flow simulation within the domain. At low Reynolds numbers, such as R e 300 for the magnetic parameter values examined by Ha, significant wall deformation occurs due to the dominance of viscous forces. The study utilizes various parameters like displacement, velocity, pressure, and Wall Shear Stress (WSS) to provide more clarity about the results. Moreover, plotting the velocity magnitude profile at points A and B before and after the stenosis is performed to analyze the primary impact of the stenosis on the fluid flow velocity.
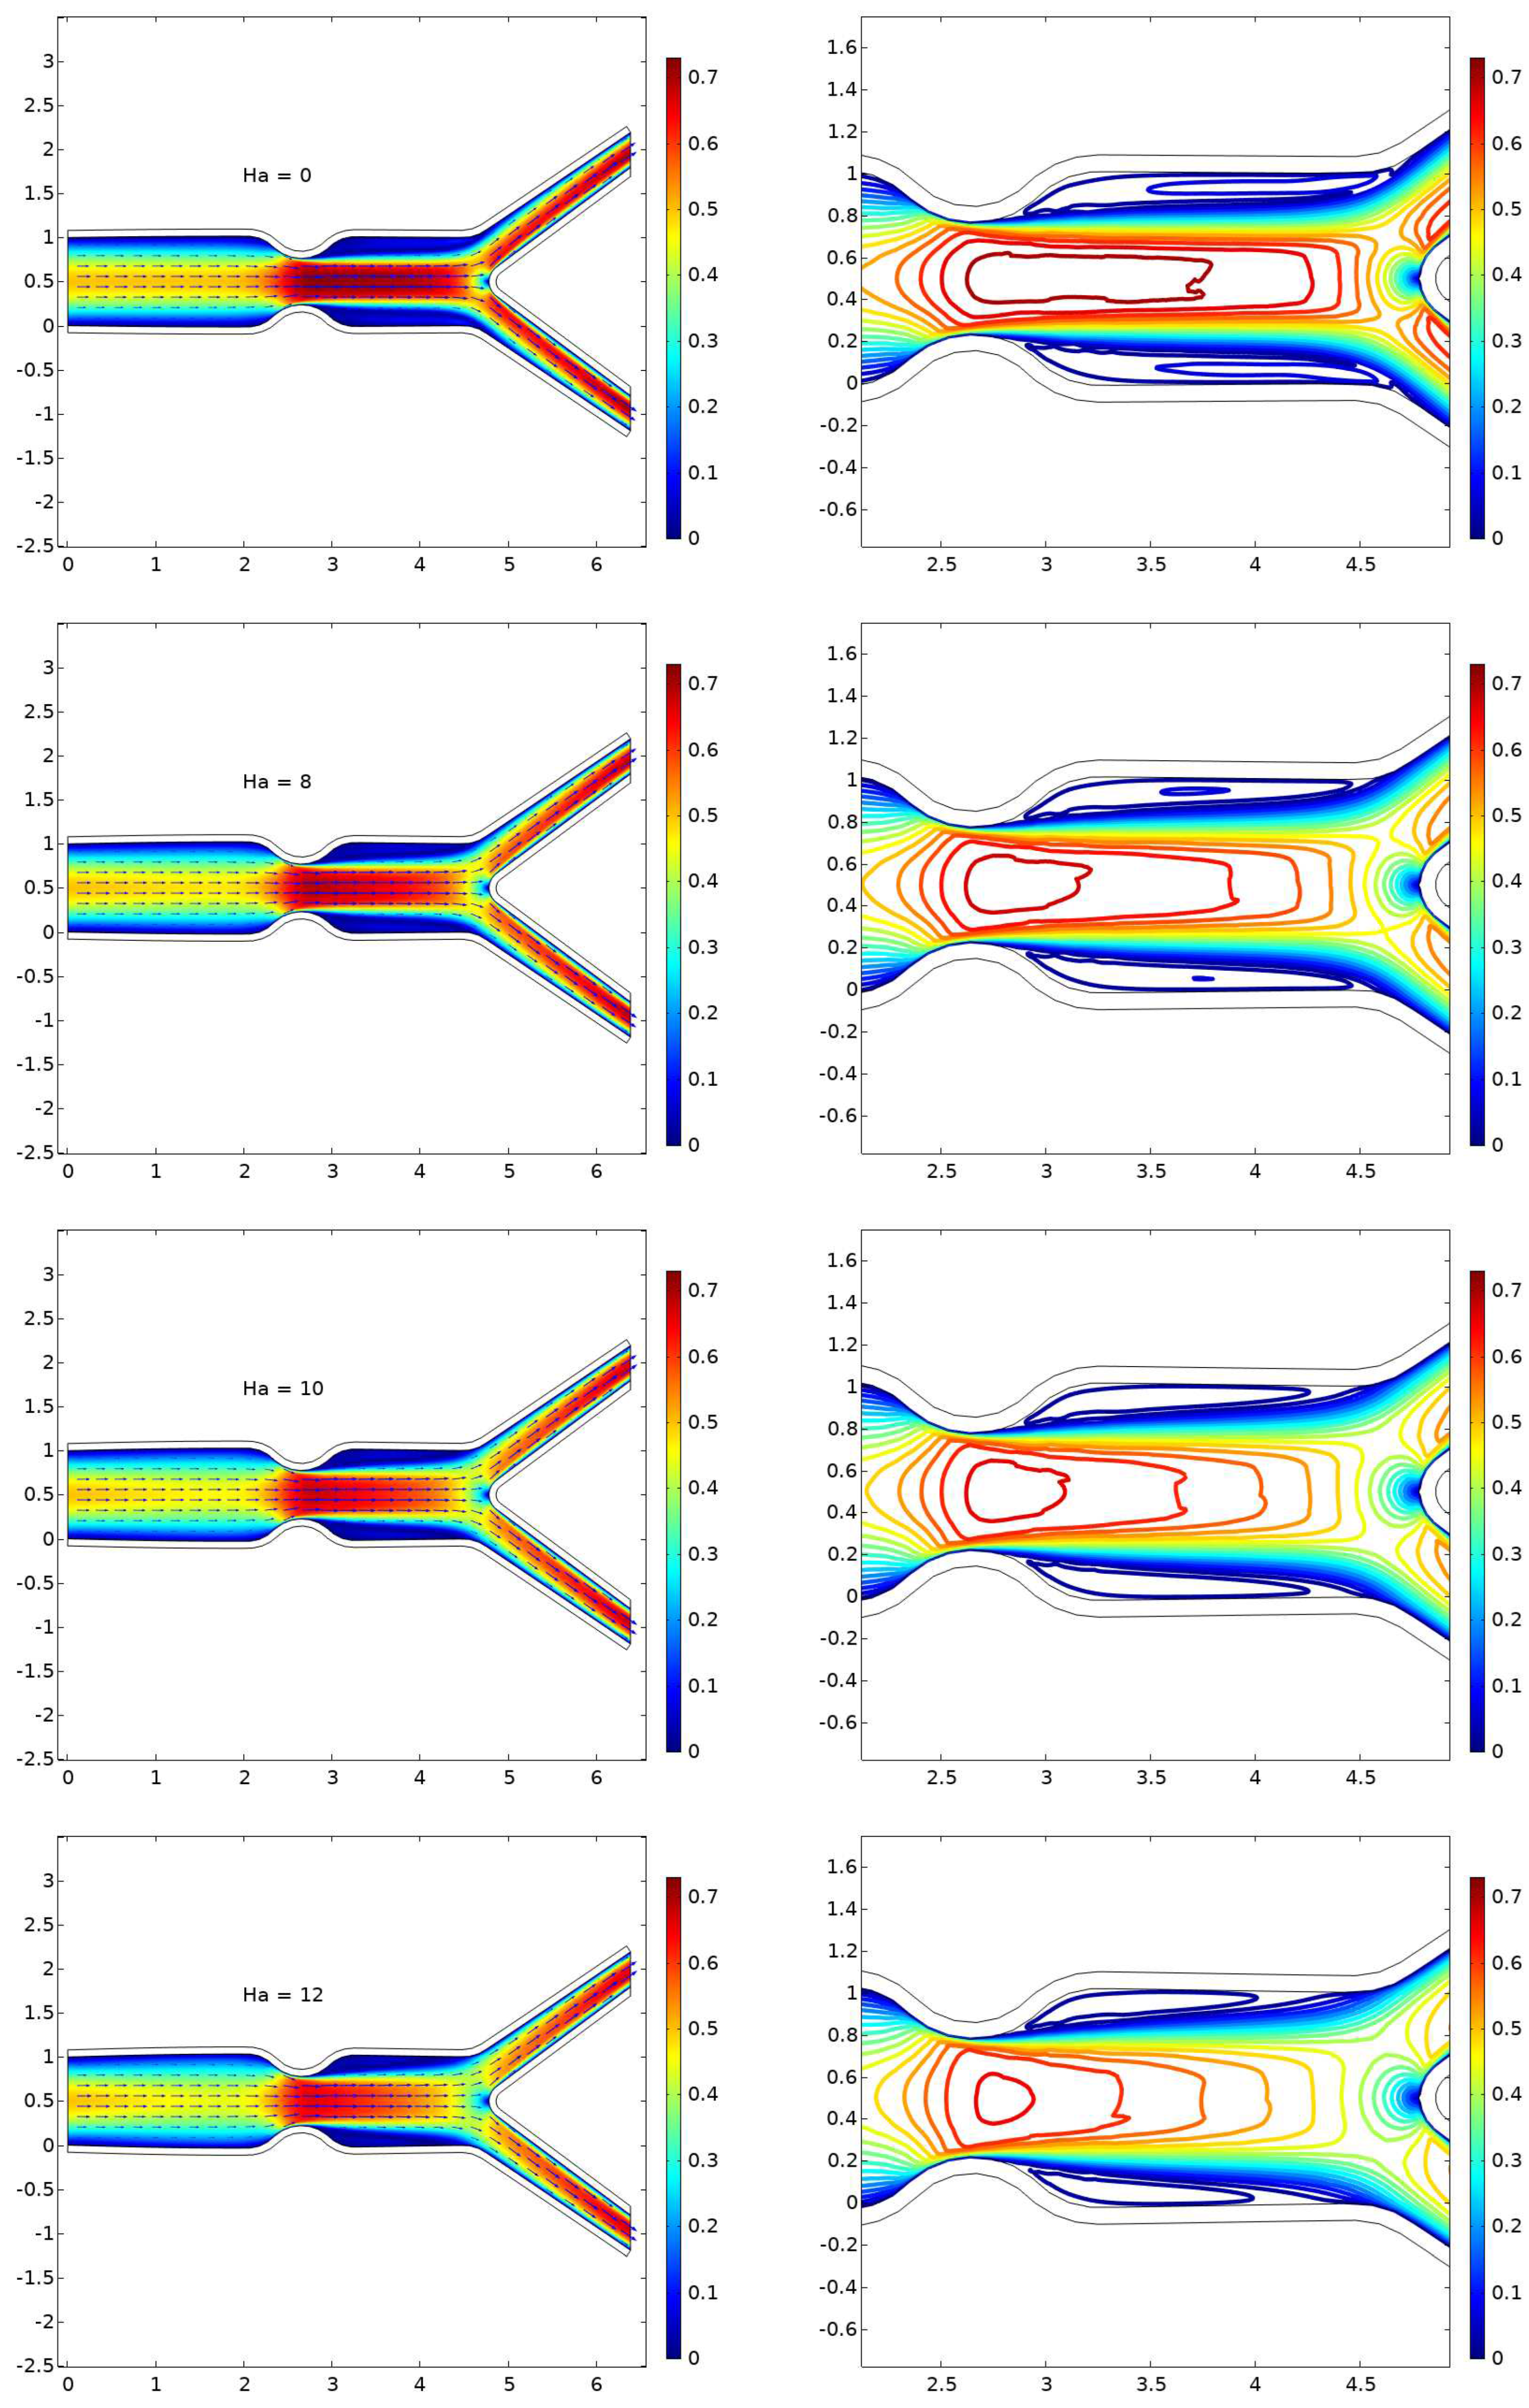
The dimensionless velocity distribution of the blood flow in a symmetric stenosed bifurcated artery subjected to an asymmetric magnetic field with linearly elastic walls is analyzed in Figure 3. The effect of the magnetic field on the flow behavior is assessed. In the absence of a magnetic field, the flow reaches its maximum speed but separates almost immediately after the stenosis, indicating a decrease in wall shear stress. This separation can lead to the development of atherosclerosis. However, the elastic walls show minimal deformation. Upon introducing an external magnetic field, the separation area decreases, resulting in a decrease in velocity and a less noticeable hollow. With an increase in magnetic field strength, the separation zone reduces, leading to the management of thrombosis. In the presence of MHD flow, significant wall deformation may occur, leading to the creation of Wall Shear Stress (WSS).
The velocity profile along the artery at a Reynolds number of 1000 is depicted in Figure 4. When there were no hydrodynamic forces ( H a = 0 ) , a stable cavity was formed. However, when a magnetic field was applied, the cavity contracted, resulting in a smaller size. As the magnetic parameter Ha increased from 8 to 10 and then to 12, the cavity disappeared altogether. Increasing the value of Ha led to a considerable amount of wall deformation, which reduced the amount of flow separation.
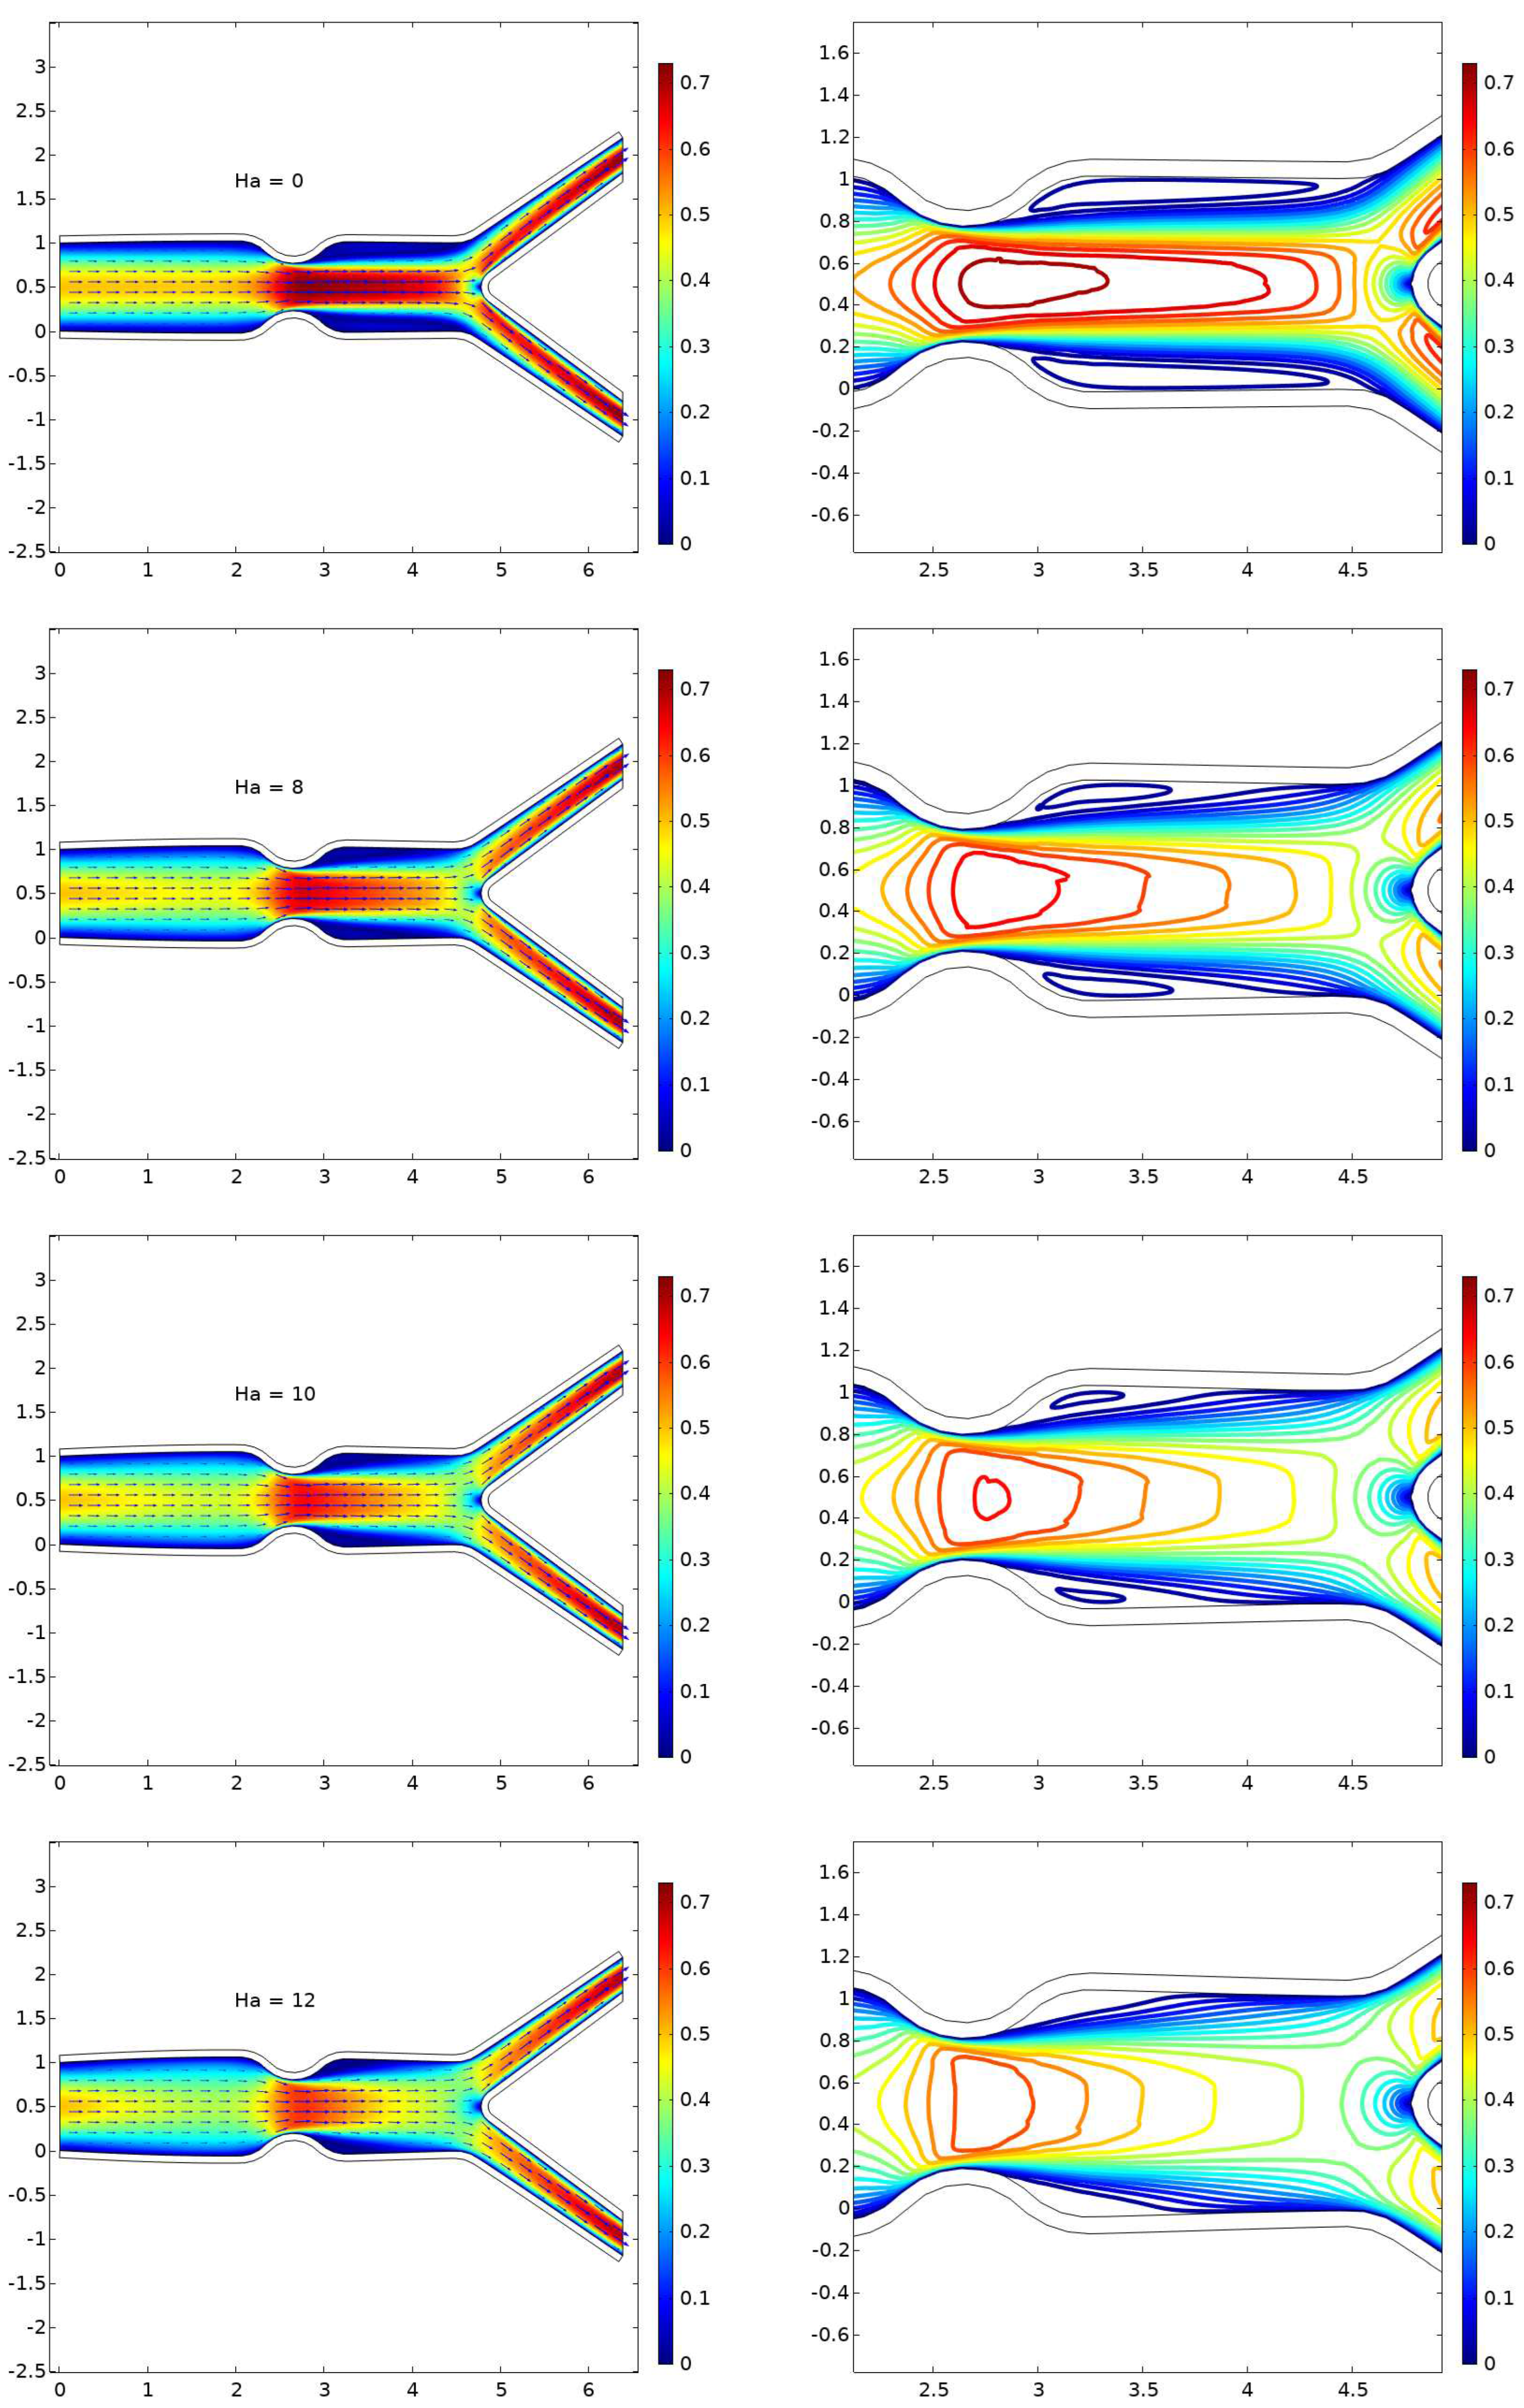
In Figure 5, one can observe the velocity patterns as they relate to a Reynolds number of 1500. A large recirculation can be seen soon after the stenosis forms at position 11 in the purely hydrodynamic scenario where H a = 0 . With Reynolds at 1500, as the value of Ha is increased, the size of the cavity gradually reduces. This implies that the amount of recirculation is directly proportional to the Reynolds number of 1500, while it is inversely related to the Hartmann number of n.
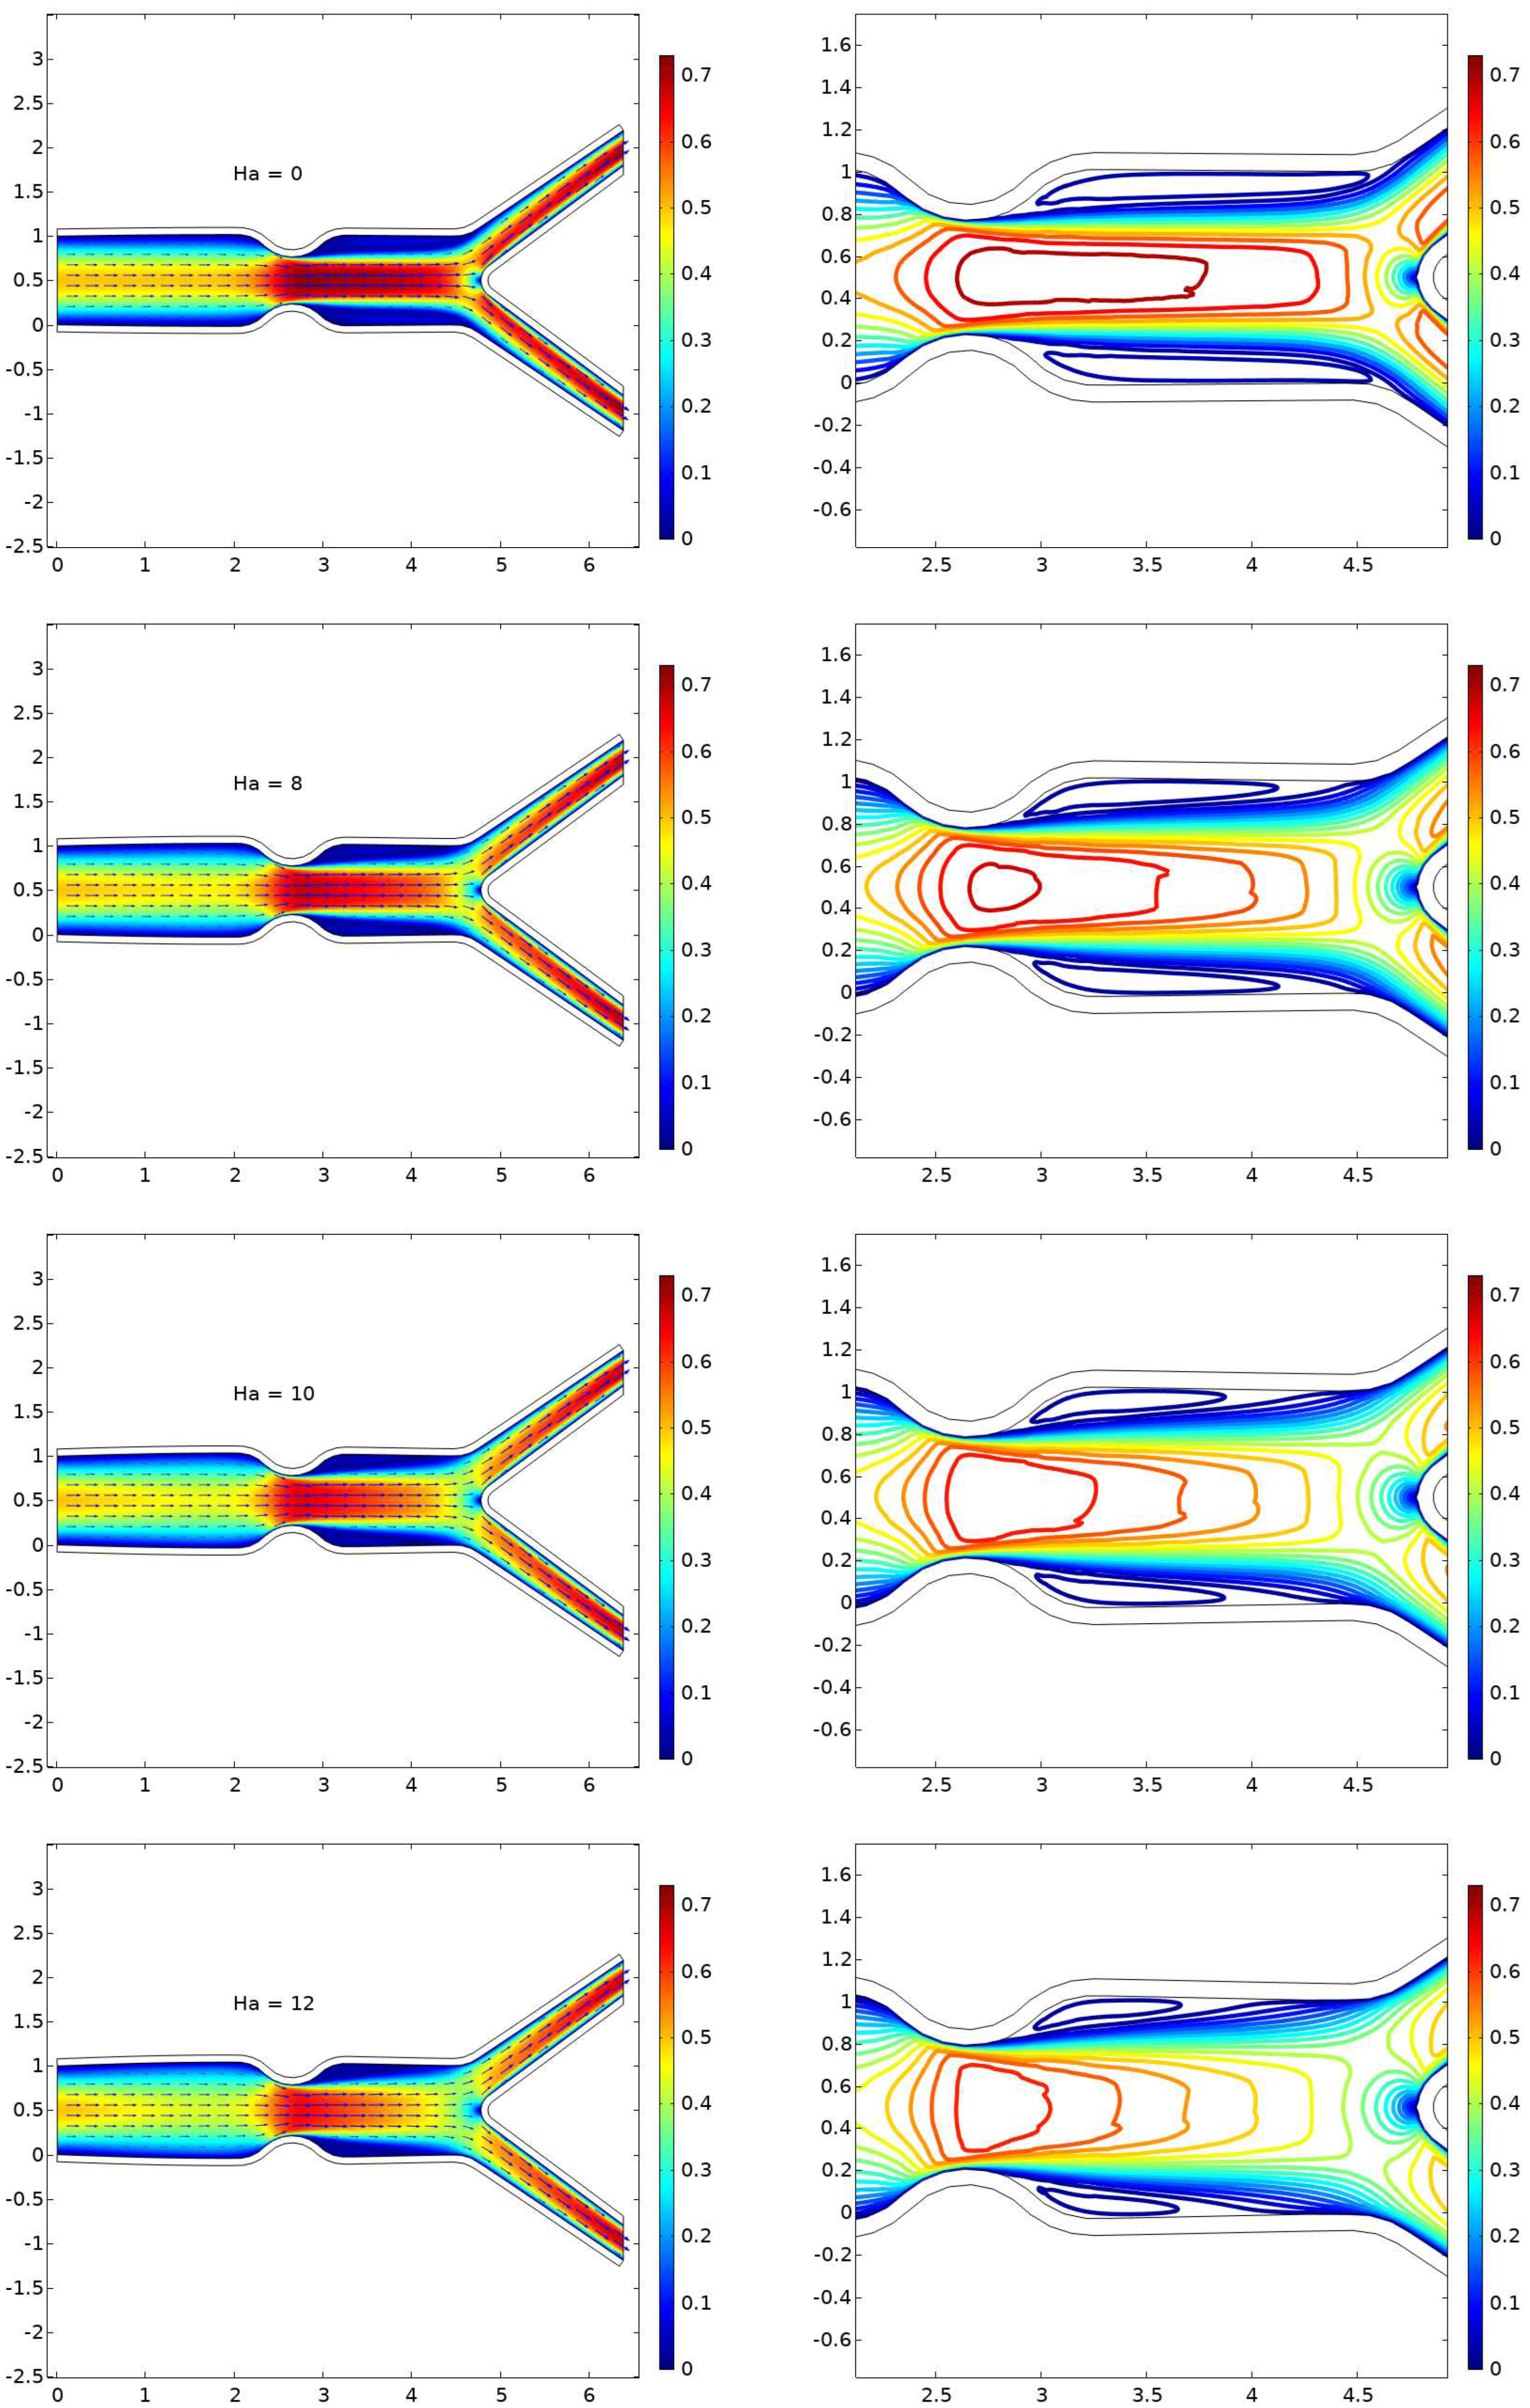
Figure 6 demonstrates the change in arterial velocity as Re is set to 2000. In a fully hydrodynamic scenario where Ha equals zero, a large and extended cavity is created shortly after the stenosis. However, the cavity shrinks when a magnetic field is introduced. Even with increasing values of the magnetic parameter, such as Ha equal to 8, 10, and 12, the cavity persists due to the high value of Re equaling 2000 in comparison to Re values of 500 and 1000. As the magnetic parameter Ha approaches values of 8, 10, and 12, the cavity area decreases and wall deformation is minimized. This suggests that the size of the cavity area is directly proportional to the Reynolds number, which is 2000 in this case, whereas the Hartmann number is inversely proportional to the wall deformation and cavity size.
Figure 3. Velocity magnitude for R e = 500 and H a = 0 , 8 , 10 , 12
Preprints 69435 g003
Figure 4. Velocity magnitude for R e = 1000 and H a = 0 , 8 , 10 , 12
Preprints 69435 g004
Figure 5. Velocity magnitude for R e = 1500 and H a = 0 , 8 , 10 , 12
Preprints 69435 g005
Figure 6. Velocity magnitude for R e = 2000 and H a = 0 , 8 , 10 , 12
Preprints 69435 g006

6.1. Displacement

The results shown in Figure 7 provide insight into the total displacement of the upper wall (and lower wall, due to the symmetric nature of the geometry) of a bifurcated artery when subjected to different Hartmann numbers, specifically H a = 0 , 8 , 10 , 12 . It can be observed that as the Reynolds number, R e , increases, there is a decreasing trend in the total displacement. The maximum displacement is seen just before the stenosis, and it begins to decrease after the stenosis. This reduction in the total displacement is a result of the contraction of the recirculation cavity caused by the application of the magnetic field. As the Hartmann number is increased, the wall deformation is reduced, leading to a decrease in the size of the recirculation cavity and a subsequent reduction in the total displacement.

6.2. The Velocity Profile at Position A and B
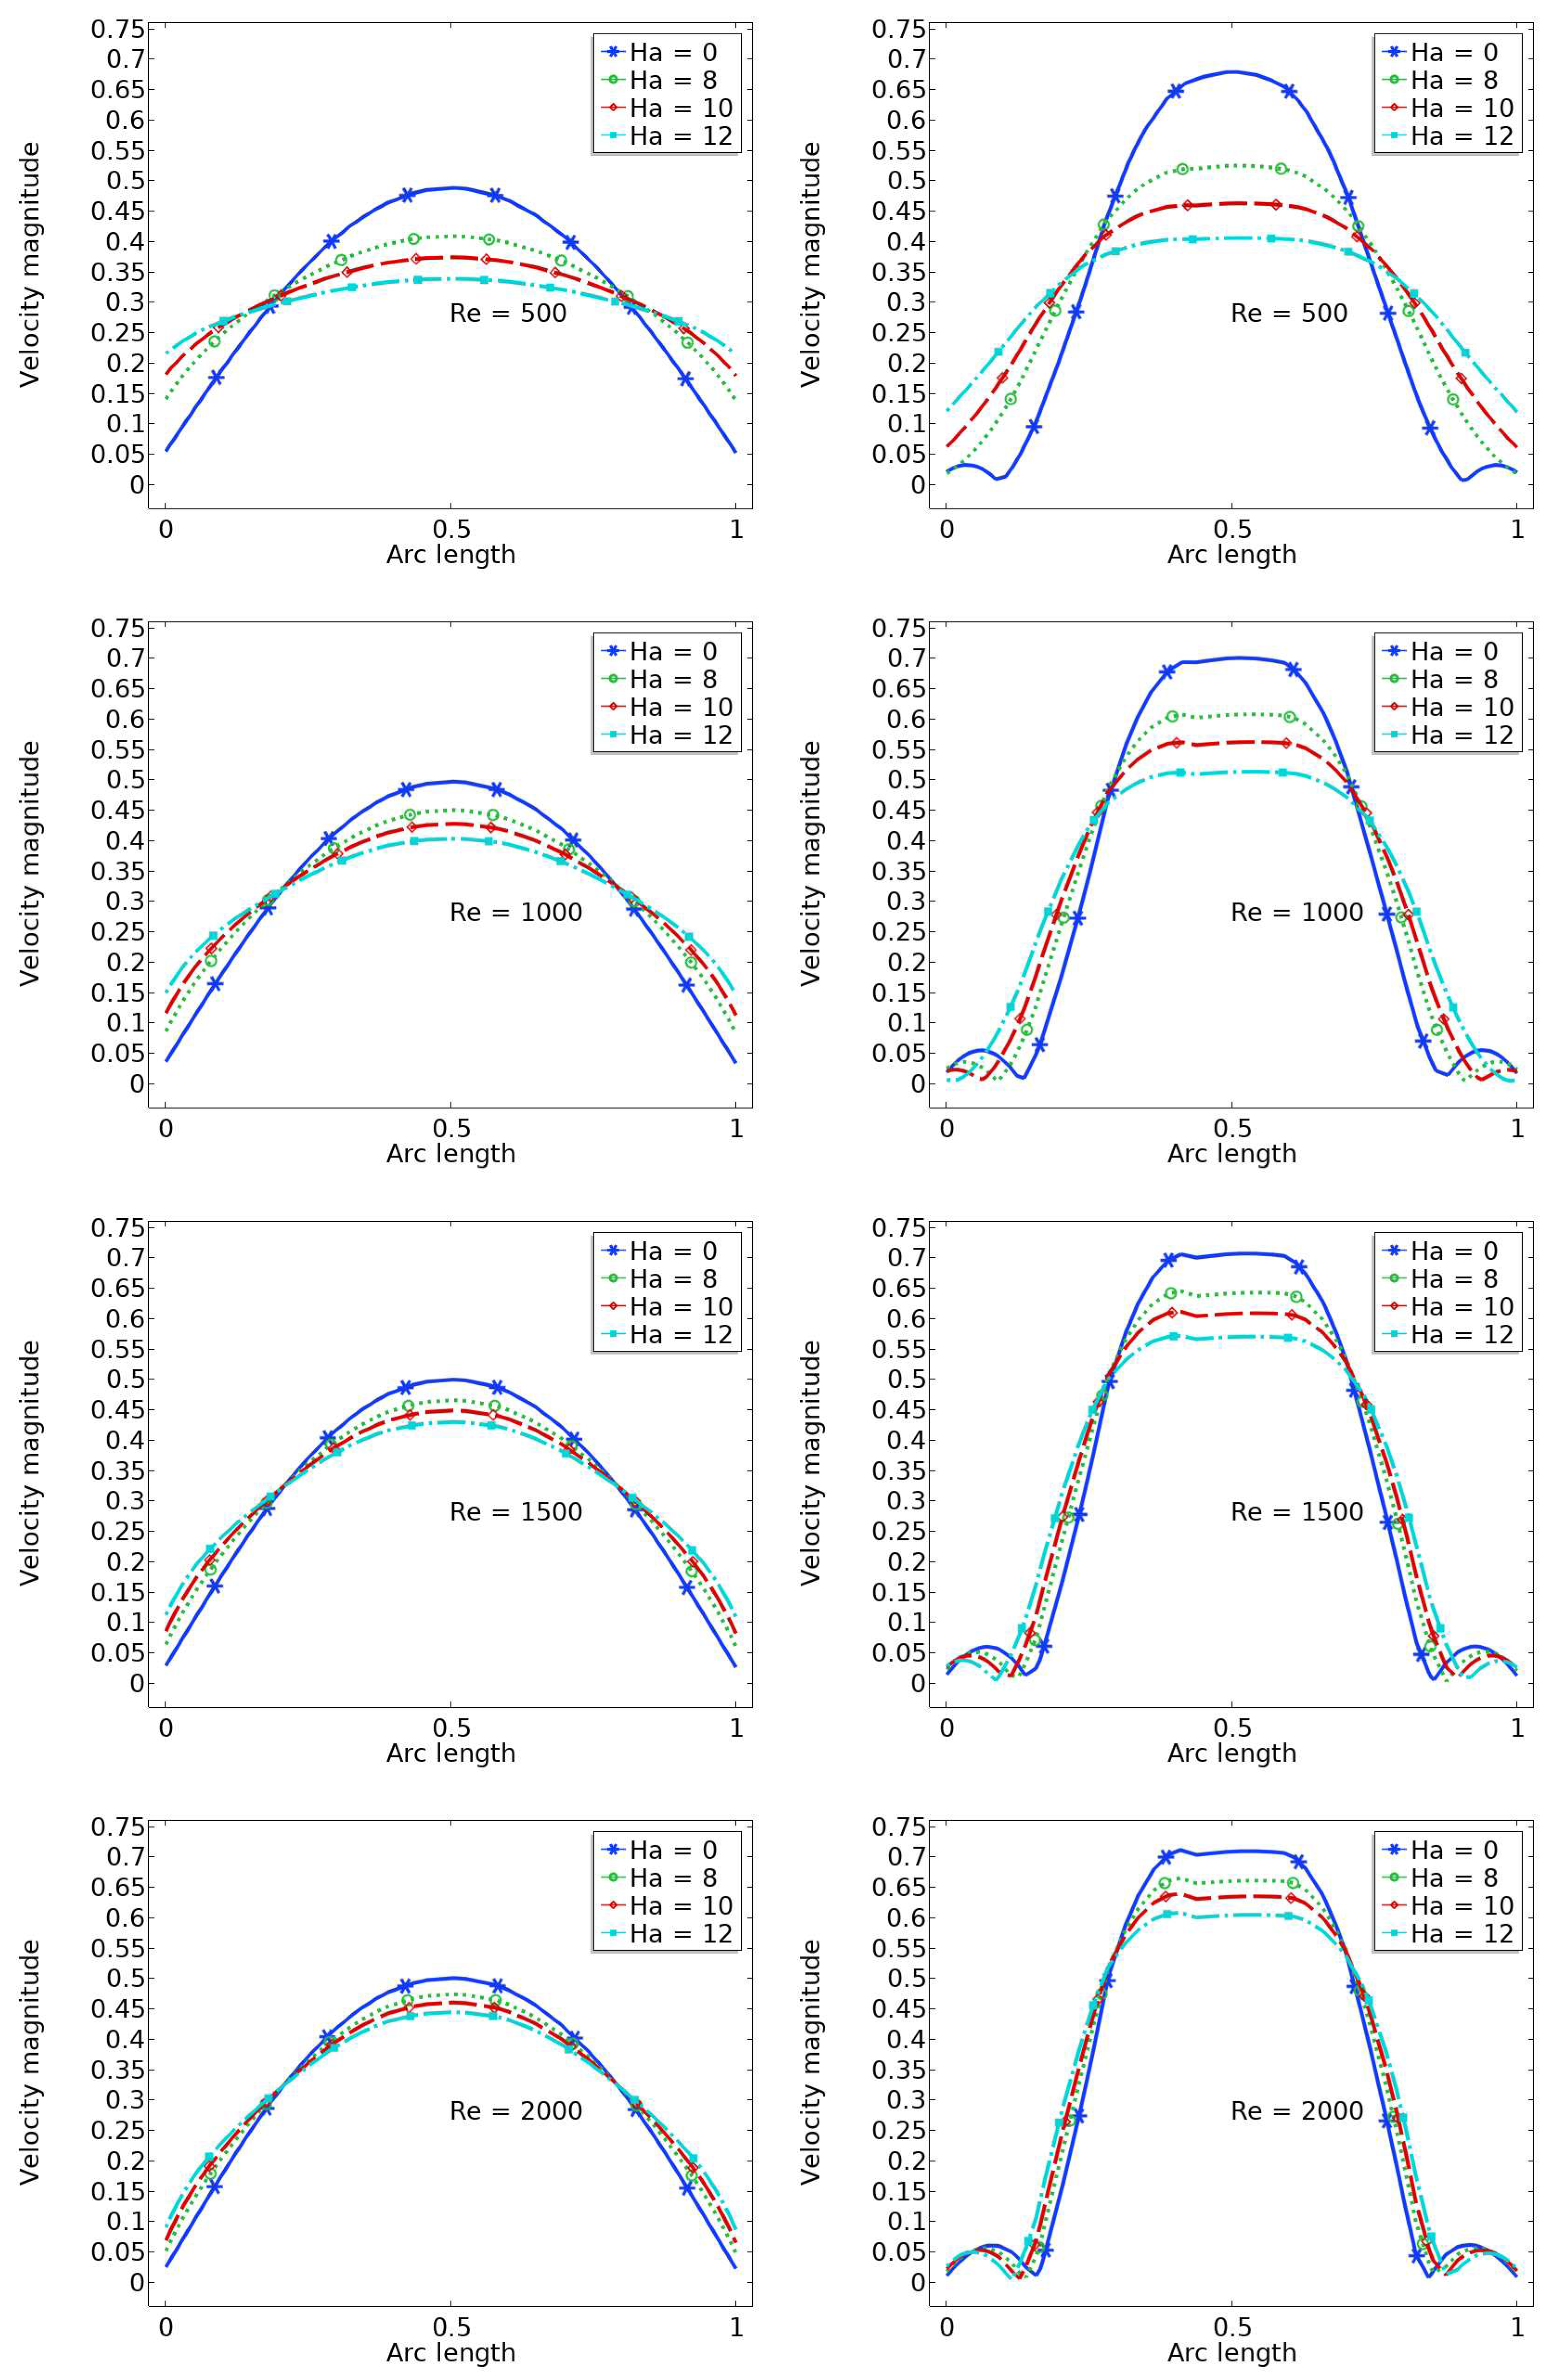
This section focuses on the velocity profile behavior at positions A and B. Comparing the relative velocities of points A and B shows a significant discrepancy. When the Reynolds number is constant, the velocity profile is inversely proportional to the magnetic field parameter, while the magnetic field parameter is directly proportional to the velocity profile. Table 2 summarizes the maximum velocity at location A before stenosis and location B after stenosis, along with the percentage increase, for various Reynolds numbers. The results demonstrate that the maximum velocity at location A before stenosis increases with increasing Reynolds number, while the maximum velocity at location B after stenosis decreases with increasing Reynolds number. This trend indicates that high Reynolds numbers tend to induce a more uniform velocity profile, whereas low Reynolds numbers tend to create a larger discrepancy between the velocity profiles at positions A and B.
Figure 8. The velocity magnitude profile at location A (left) and B (right)
Preprints 69435 g008

6.3. Pressure at the centre

The pressure behavior in the bifurcated artery is an important aspect of studying its fluid dynamics. In Figure 9, the pressure attitude is analyzed against the magnetic field parameter, H a = 0 , 8 , 10 , 12 , and the values are plotted against different Reynolds numbers, i.e., R e = 500 , 1000 , 1500 , 2000 .
The pure hydrodynamic scenario with H a = 0 yields the minimum pressure in the artery. As the value of H a increases, the pressure in the bifurcation region increases as well. This indicates a direct relation between the magnetic field parameter and the pressure.
In addition, the pressure behavior is also related to the Reynolds number. As the Reynolds number increases, the pressure decreases for a fixed value of the magnetic field parameter. This shows an inverse relation between the Reynolds number and the pressure in the bifurcation region.
Moreover, it is observed that at a lower Reynolds number, i.e., R e = 500 , the maximum pressure occurs for a higher value of the magnetic field parameter, i.e., H a = 8 , 10 , 12 . This result is particularly interesting as it suggests that the behavior of the pressure in the bifurcation region is affected by both the Reynolds number and the magnetic field parameter.
Figure 9. Pressure values at the centre C of parent artery
Preprints 69435 g009

6.4. Wall Shear Stress

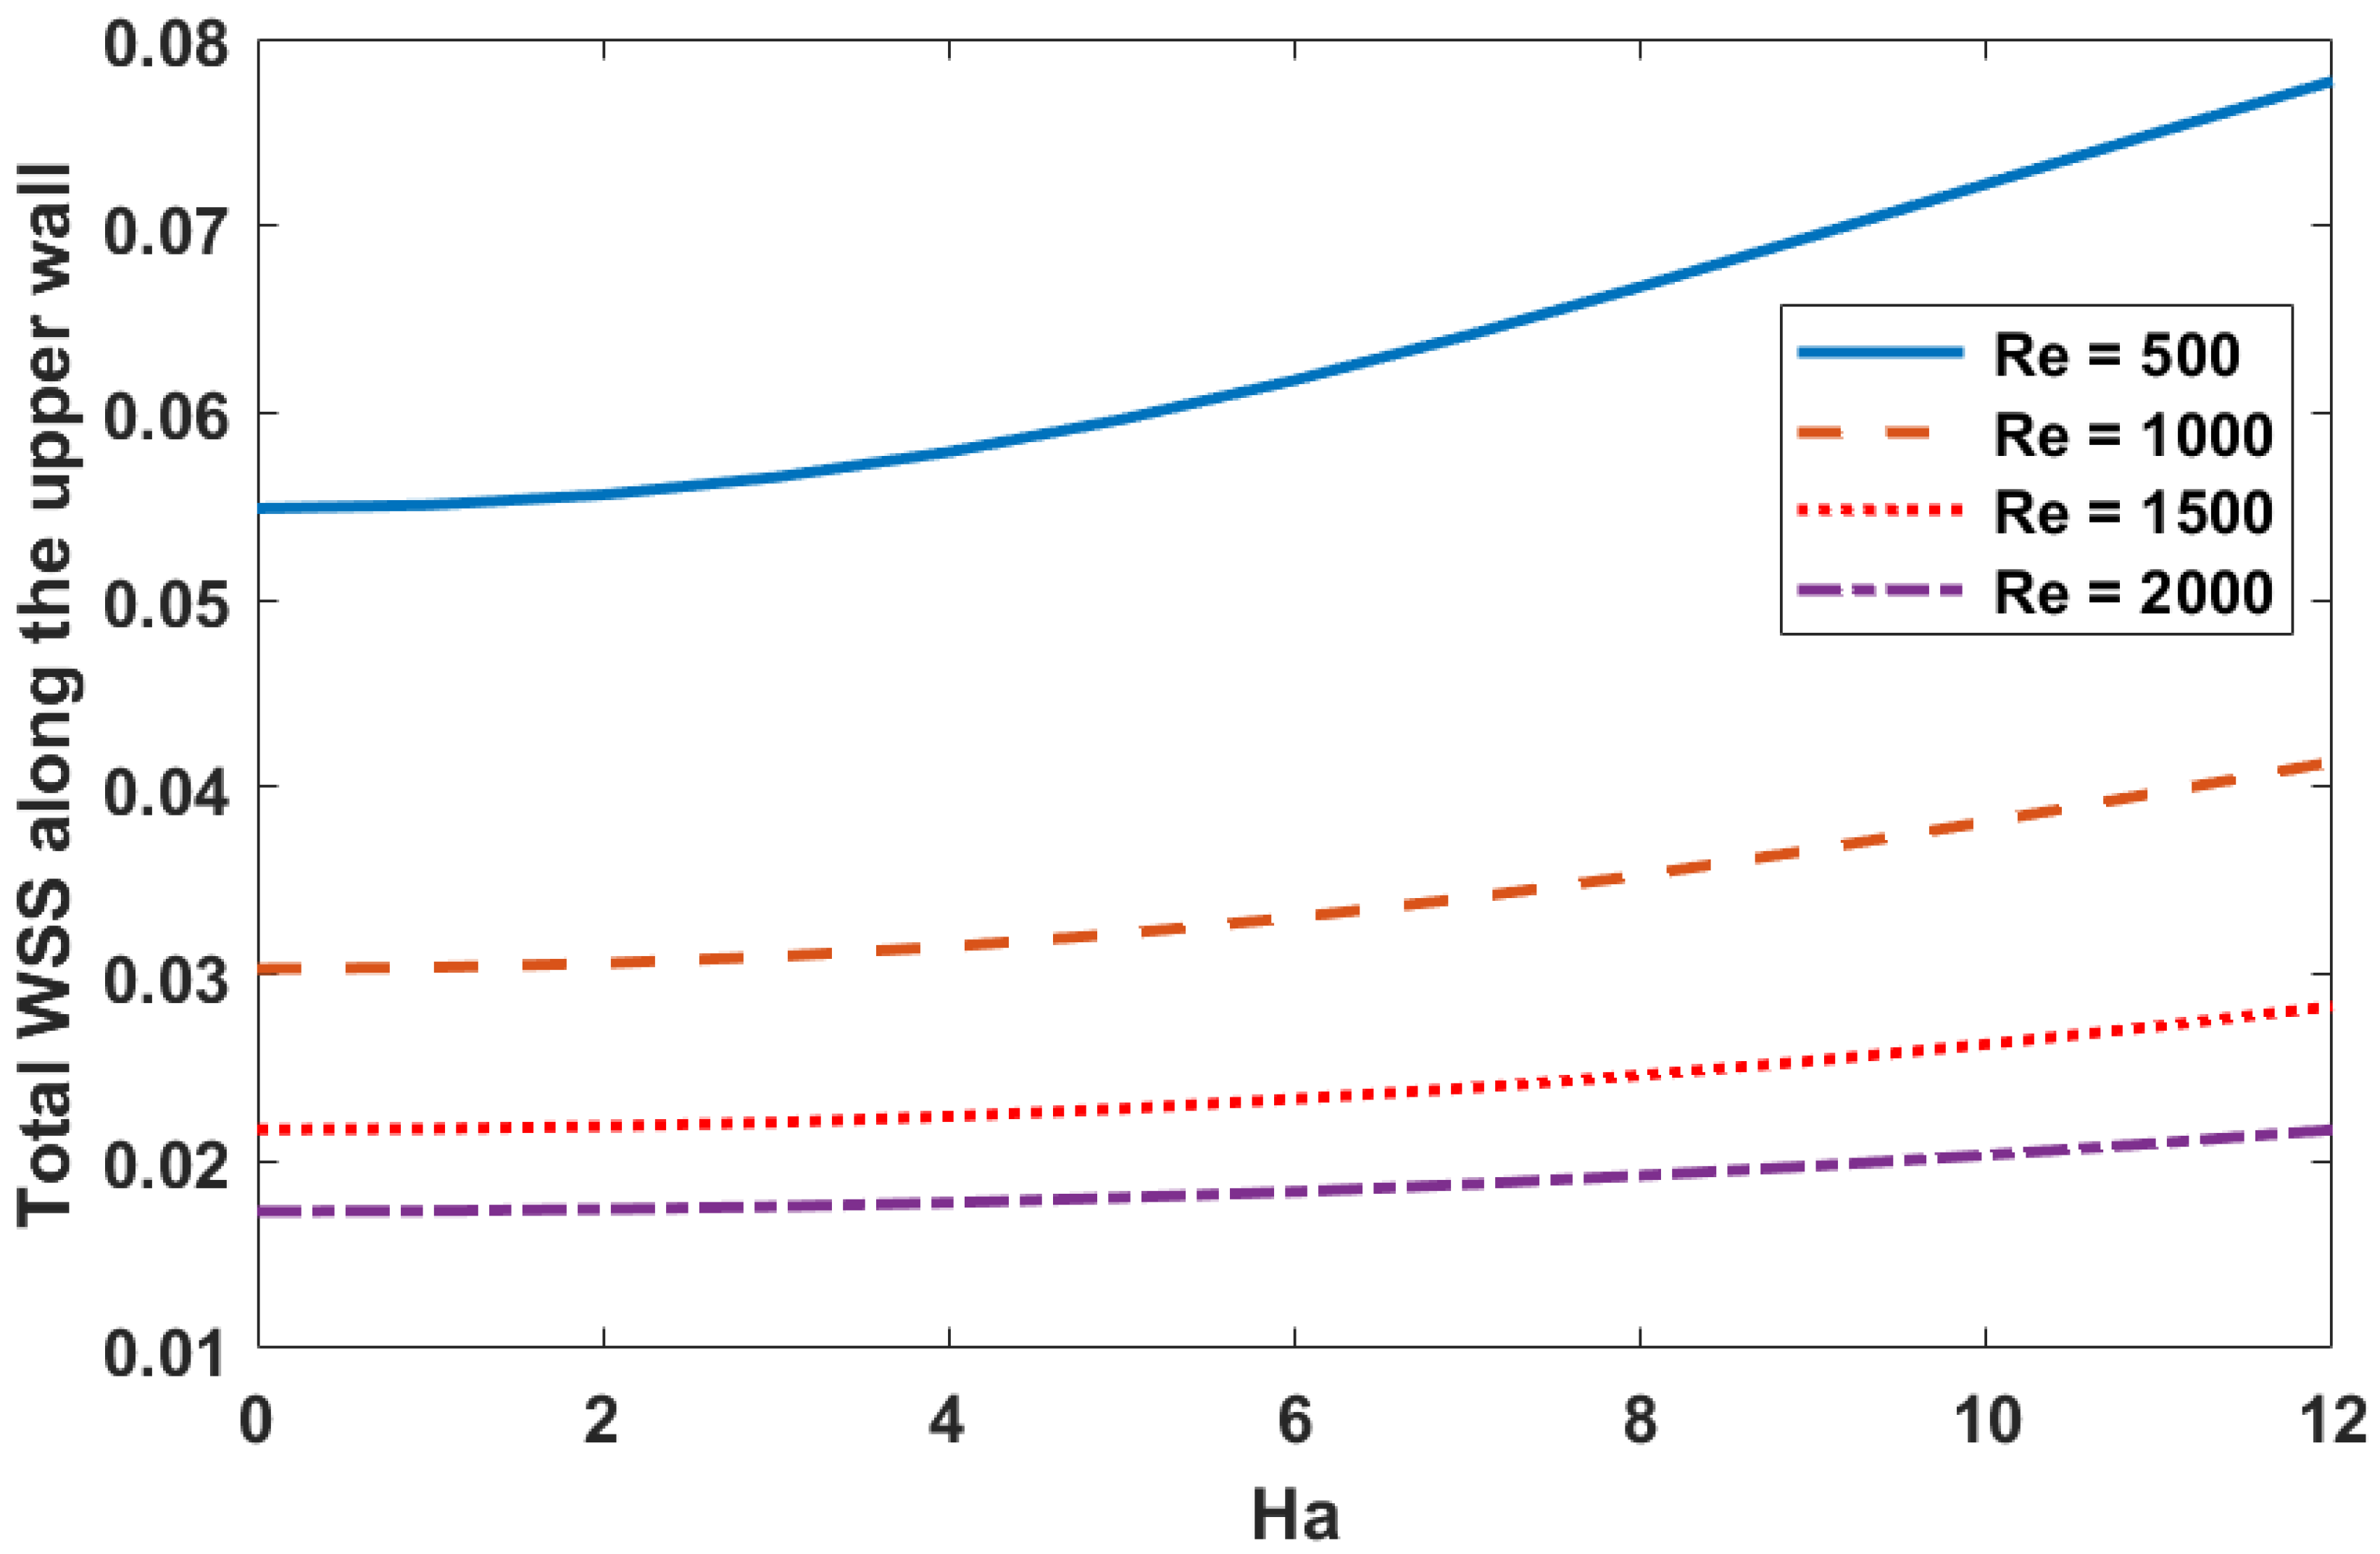
In this study, we have investigated the effects of the magnetic field and Reynolds number on the wall shear stress in a stenosed bifurcated artery. Our results, presented in Table 3 and Figure 10, show that the wall shear stress is directly influenced by the magnetic parameter H a and has an inverse relation with the Reynolds number R e .
Interestingly, we found that for small values of R e , an increasing behavior can be observed for higher values of H a . Specifically, our results suggest that an artery with a small Reynolds number flow, i.e., R e = 500 , may experience significant stress in the presence of a higher value of the magnetic field parameter, i.e., H a = 12 .
It is important to note that wall shear stress is closely associated with the growth of atherosclerosis. The wall shear stress affects the endothelial cell, which causes a change in the gene pattern [43]. The plaque formation occurs due to the wall shear stress or endothelial cells. Low wall shear stress is a relevant factor for the formation of the plaque. Usually, atherosclerosis appears in the bifurcated area.
Additionally, we observed that the values of wall shear stress remain the same for the upper wall and lower wall due to the symmetric nature of the considered geometry in Figure 10. Therefore, our results for wall shear stress are valid for both the upper and lower walls of the bifurcated artery. Overall, our study provides important insights into the effects of magnetic field and Reynolds number on wall shear stress and their potential implications for the development of atherosclerosis in stenosed bifurcated arteries.
Figure 10. The relationship between the Hartmann number and the total wall shear stress (WSS) along the upper wall
Preprints 69435 g010

7. Conclusions

This computational study investigated the flow of a biomagnetic fluid through a two-dimensional, stable, incompressible, and laminar arterial stenosis with elastic wall surfaces. To solve the governing nonlinear partial differential equations of fluid and solid (elasticity), an arbitrary Lagrangian Eulerian method was used in combination with a bi-quadratic linear stable finite element pair. The nonlinear algebraic problem was solved using the Newton-Raphson method. Charts and tables were included and analyzed to investigate the key features of the obtained solutions. The following are some concluding remarks based on the numerical analysis findings:
  • The presence of a magnetic field parameter, H a , in increasing order reduces the size of the cavity adjacent to the stenosis.
  • A higher value of the magnetic field parameter decreases the velocity gain after the stenosis compared to the purely hydrodynamic case ( H a = 0 ). For example, when R e = 500 , the velocity gain is 41
  • The pressure increases with higher values of Hartmann number ( H a = 0 , 8 , 10 , 12 ).
  • A flow with a small Reynolds number ( R e = 500 ) and a higher magnetic field parameter value ( H a = 12 ) results in a significant increase in wall shear stress.
  • The wall displacement is larger when R e = 500 and H a = 12 , and the maximum wall displacement is observed just before the stenosis.
In conclusion, this numerical analysis suggests that the magnetic field has significant effects on blood flow behavior. This suggests that magnetic fields could potentially be implemented in a wide range of treatments for conditions such as plaque, atheroma, hypertension, blood pressure, and other similar conditions. However, to further validate these findings, more research based on patient-specific data is needed. Hence, further investigations are always necessary to ratify the conclusions drawn in this study.

Acknowledgments

The author Z. Raizah wishes to thank the King Khalid University,Saudi Arabia, for supporting this work, through a grant KKU/RCAMS/22, at the Research Center for Advance Materials (RCAMS).

Conflicts of Interest

The authors declare no conflict of interest in this study.

References

  1. World Health Organization. Global Health Estimates 2016: Death by Cause, Age, Sex, by Country and by Region, 2000–2016; World Health Organization: Geneva, Switzerland, 2018. [Google Scholar]
  2. Xu, S.; Jaroslav, P.; Zheng, G.J. Atherosclerosis is an epigenetic disease. Trends in Endocrinology & Metabolism 2018, 29, 739–742. [Google Scholar]
  3. Oberoi, S.; Schoepf, U.J.; Meyer, M.; Henzler, T.; Rowe, G.W.; Costello, P.; Nance, J.W. Progression of arterial stiffness and coronary atherosclerosis: longitudinal evaluation by cardiac CT. American journal of roentgenology 2013, 200, 798–804. [Google Scholar] [CrossRef]
  4. Vlachopoulos, C.; Aznaouridis, K.; Stefanadis, C. Prediction of cardiovascular events and all-cause mortality with arterial stiffness: a systematic review and meta-analysis. Journal of the American College of Cardiology 2010, 55, 1318–1327. [Google Scholar] [CrossRef]
  5. Palombo, C.; Kozakova, M. Arterial stiffness, atherosclerosis and cardiovascular risk: pathophysiologic mechanisms and emerging clinical indications. Vascular pharmacology 2016, 77, 1–7. [Google Scholar] [CrossRef]
  6. Song, P.; Xia, W.; Zhu, Y.; Wang, M.; Chang, X.; Jin, S.; Wang, J., An. Prevalence of carotid atherosclerosis and carotid plaque in Chinese adults: A systematic review and meta-regression analysis. Atherosclerosis 2018, 276, 67–73. [Google Scholar] [CrossRef]
  7. Gharahi, H.; Zambrano, B.A.; Zhu, D.C.; DeMarco, J.K.; Baek, S. Computational fluid dynamic simulation of human carotid artery bifurcation based on anatomy and volumetric blood flow rate measured with magnetic resonance imaging. International journal of advances in engineering sciences and applied mathematics 2016, 8, 46–60. [Google Scholar] [CrossRef]
  8. Caro, C.G. Discovery of the role of wall shear in atherosclerosis. Arteriosclerosis, thrombosis, and vascular biology 2009, 29, 158–161. [Google Scholar] [CrossRef]
  9. Zhang, B.; Gu, J.; Qian, M.; Niu, L.; Ghista, D. Correlation between quantitative analysis of wall shear stress and intima-media thickness in atherosclerosis development in carotid arteries. Biomedical engineering online 2017, 16, 137. [Google Scholar] [CrossRef]
  10. Siasos, G.; Sara, J.D.; Zaromytidou, M.; Park, K.H.; Coskun, A.U.; Lerman, L.O.; Oikonomou, E.; Maynard, C.C.; Fotiadis, D.; Stefanou, K.; et al. Local low shear stress and endothelial dysfunction in patients with nonobstructive coronary atherosclerosis. Journal of the American College of Cardiology 2018, 71, 2092–2102. [Google Scholar] [CrossRef]
  11. Chiastra, C.; Gallo, D.; Tasso, P.; Iannaccone, F.; Migliavacca, F.; Wentzel, J.J.; Morbiducci, U. Healthy and diseased coronary bifurcation geometries influence near-wall and intravascular flow: a computational exploration of the hemodynamic risk. Journal of biomechanics 2017, 58, 79–88. [Google Scholar] [CrossRef]
  12. Luo, K.; Jiang, W.; Yu, C.; Zhou, Z.; Ding, Y. Fluid–Solid Interaction Analysis on Iliac Bifurcation Artery: A Numerical Study. International Journal of Computational Methods 2019, 16, 18501. [Google Scholar] [CrossRef]
  13. Li, Z.Y.; Howarth, S.; Trivedi, R.A.; U-King-Im, J.M.; Brown, A.; Wang, L.; Gillard, J.H. Stress analysis of carotid plaque rupture based on in vivo high resolution MRI. Journal of biomechanics 2006, 39, 2611–2611. [Google Scholar] [CrossRef]
  14. Tang, D.; Yang, C.; Zheng, J.; Woodard, P.K.; Saffitz, J.E.; Sicard, G.A.; Pilgram, T.K.; Yuan, C. Quantifying effects of plaque structure and material properties on stress distributions in human atherosclerotic plaques using 3D FSI models. J. Biomech Eng. 2005, 127, 1185–1194. [Google Scholar] [CrossRef]
  15. Saho, T.; Onishi, H. Quantitative analysis of effects of hemodynamic stress on temporal variations of cardiac phases in models of human carotid bulbs. Radiological physics and technology 2017, 10, 475–482. [Google Scholar] [CrossRef]
  16. Bijari, P.B.; Wasserman, B.A.; Steinman, D.A. Carotid bifurcation geometry is an independent predictor of early wall thickening at the carotid bulb. Stroke 2014, 45, 473–478. [Google Scholar] [CrossRef]
  17. Sharma, S.; Singh, U.; Katiyar, V.K. Magnetic field effect on flow parameters of blood along with magnetic particles in a cylindrical tube. Journal of Magnetism and Magnetic Materials 2015, 377, 395–401. [Google Scholar] [CrossRef]
  18. Tashtoush, B.; Magableh, A. Magnetic field effect on heat transfer and fluid flow characteristics of blood flow in multi-stenosis arteries. Heat and Mass transfer 2008, 44, 297–304. [Google Scholar] [CrossRef]
  19. Abdolmaleki, F.; Hayat SM, G.; Bianconi, V.; Johnston, T.P.; Sahebkar, A. Atherosclerosis and immunity: a perspective. Trends in cardiovascular medicine 2019, 29, 363–371. [Google Scholar] [CrossRef]
  20. Dutra, R.F.; Zinani, F.S.; Rocha, L.A.; Biserni, C. Effect of non-Newtonian fluid rheology on an arterial bypass graft: A numerical investigation guided by constructal design. Computer Methods and Programs in Biomedicine 2021, 201, 105944. [Google Scholar] [CrossRef]
  21. De Nisco, G.; Hoogendoorn, A.; Chiastra, C.; Gallo, D.; Kok, A.M.; Morbiducci, U.; Wentzel, J.J. The impact of helical flow on coronary atherosclerotic plaque development. Atherosclerosis 2020, 300, 39–46. [Google Scholar] [CrossRef]
  22. Hoogendoorn, A.; Kok, A.M.; Hartman, E.M.; de Nisco, G.; Casadonte, L.; Chiastra, C.; Coenen, A.; Korteland, S.-A.; Van der Heiden, K.; Gijsen, F.J.H.; et al. Multidirectional wall shear stress promotes advanced coronary plaque development: comparing five shear stress metrics. Cardiovascular Research 2020, 116, 1136–1146. [Google Scholar] [CrossRef]
  23. Pinto, S.I.S.; Campos, J. Numerical study of wall shear stress-based descriptors in the human left coronary artery. Computer methods in biomechanics and biomedical engineering 2016, 19, 1443–1455. [Google Scholar] [CrossRef]
  24. Jayendiran, R.; Nour, B.; Ruimi, A. A fluid–structure interaction analysis of anisotropic Dacron fabric used for aortic replacement. Journal of Fluids and Structures 2020, 97, 103108. [Google Scholar] [CrossRef]
  25. Jayendiran, R.; Nour, B.; Ruimi, A. Computational fluid–structure interaction analysis of blood flow on patient-specific reconstructed aortic anatomy and aneurysm treatment with Dacron graft. Journal of Fluids and Structures 2018, 81, 693–711. [Google Scholar] [CrossRef]
  26. Varshney, G.; Katiyar, V.; Kumar, S. Effect of magnetic field on the blood flow in artery having multiple stenosis: a numerical study. International Journal of Engineering, Science and Technology 2010, 2, 967–982. [Google Scholar] [CrossRef]
  27. Varshney, G.; Katiyar, V.; Kumar, S. Effect of magnetic field on the blood flow in artery having multiple stenosis: a numerical study. International Journal of Engineering, Science and Technology 2010, 2, 967–982. [Google Scholar] [CrossRef]
  28. Tashtoush, B.; Magableh, A. Magnetic field effect on heat transfer and fluid flow characteristics of blood flow in multi-stenosis arteries. Heat and Mass transfer 2008, 44, 297–304. [Google Scholar] [CrossRef]
  29. Javadzadegan, A.; Moshfegh, A.; Afrouzi, H.H.; Omidi, M. Magnetohydrodynamic blood flow in patients with coronary artery disease. Computer Methods and Programs in Biomedicine 2018, 163, 111–122. [Google Scholar] [CrossRef]
  30. Sharifzadeh, B.; Kalbasi, R.; Jahangiri, M.; Toghraie, D.; Karimipour, A. Computer modeling of pulsatile blood flow in elastic artery using a software program for application in biomedical engineering. Computer methods and programs in Biomedicine 2020, 192, 105442. [Google Scholar] [CrossRef]
  31. Xenos, M.A.; Tzirtzilakis, E.E. MHD effects on blood flow in a stenosis. Advances in Dynamical Systems and Applications 2013, 8, 427–437. [Google Scholar]
  32. Ali, N.; Zaman, A.; Sajid, M.; Nieto, J.J.; Torres, A. Unsteady non-Newtonian blood flow through a tapered overlapping stenosed catheterized vessel. Mathematical biosciences 2015, 269, 94–103. [Google Scholar] [CrossRef] [PubMed]
  33. Zaman, A.; Ali, N.; Bég, O.A. Unsteady magnetohydrodynamic blood flow in a porous-saturated overlapping stenotic artery—numerical modeling. Journal of Mechanics in Medicine and Biology 2016, 16, 1650049. [Google Scholar] [CrossRef]
  34. Zaman, A.; Ali, N. Effects of peripheral layer thickness on pulsatile flow of Herschel–Bulkley fluid through a stenotic artery. Canadian Journal of Physics 2016, 94, 920–928. [Google Scholar] [CrossRef]
  35. Fetecau, C.; Shah, N.A.; Vieru, D. General solutions for hydromagnetic free convection flow over an infinite plate with Newtonian heating, mass diffusion and chemical reaction. Communications in Theoretical Physics 2017, 68, 768. [Google Scholar] [CrossRef]
  36. Berger, S.A.; Jou, L.D. Flows in stenotic vessels. Ann. Rev. Fluid. Mech. 2000, 32, 347–382. [Google Scholar] [CrossRef]
  37. Pedley, T.J. The fluid mechanics of large blood vessels; Cambridge University Press: Cambridge, UK; p. 1980.
  38. Turek, S.; Hron, J.; Razzaq, M.; Wobker, H.; Schäfer, M. Numerical benchmarking of fluid-structure interaction: A comparison of different discretization and solution approaches. In Fluid Structure Interaction II; Springer: Berlin/Heidelberg, Germany, 2011; pp. 413–424. [Google Scholar]
  39. Razzaq, M.; Turek, S.; Hron, J.; Acker, J.F.; Weichert, F.; Wagner, M.; Grunwald, I.Q.; Roth, C.; Romeike, B.F. Numerical simulation of fluid-structure interaction with application to aneurysm hemodynamics. Technical University, Fakultat fur Mathematik 2009, 283–294. [Google Scholar]
  40. Razzaq, M. Numerical techniques for solving fluid-structure interaction problems with applications to bio-engineering. Ph.D. Thesis, TU Dortmund, to appear, 2009. [Google Scholar]
  41. Ervin, V.J.; Jenkins, E.W. The LBB condition for the Taylor-Hood P2-P1 and Scott-Vogelius P2-discP1 element pairs in 2-D. Technical Report TR2011 04 EJ, Clemson University. 2011. [Google Scholar]
  42. Kelly, C.T. Iterative methods for optimization. Society for Industrial and Applied Mathematics 1999. [Google Scholar]
  43. Amaya, R.; Pierides, A.; Tarbell, J.M. The interaction between fluid wall shear stress and solid circumferential strain affects endothelial gene expression. PloS ONE 2015, 10, e0129952. [Google Scholar] [CrossRef]
  44. Turek, S.; Hron, J.; Razzaq, M.; Wobker, H.; Schäfer, M. Numerical benchmarking of fluid-structure interaction: A comparison of different discretization and solution approaches. In Fluid Structure Interaction II; Springer: Berlin/Heidelberg, Germany, 2011; pp. 413–424. [Google Scholar]
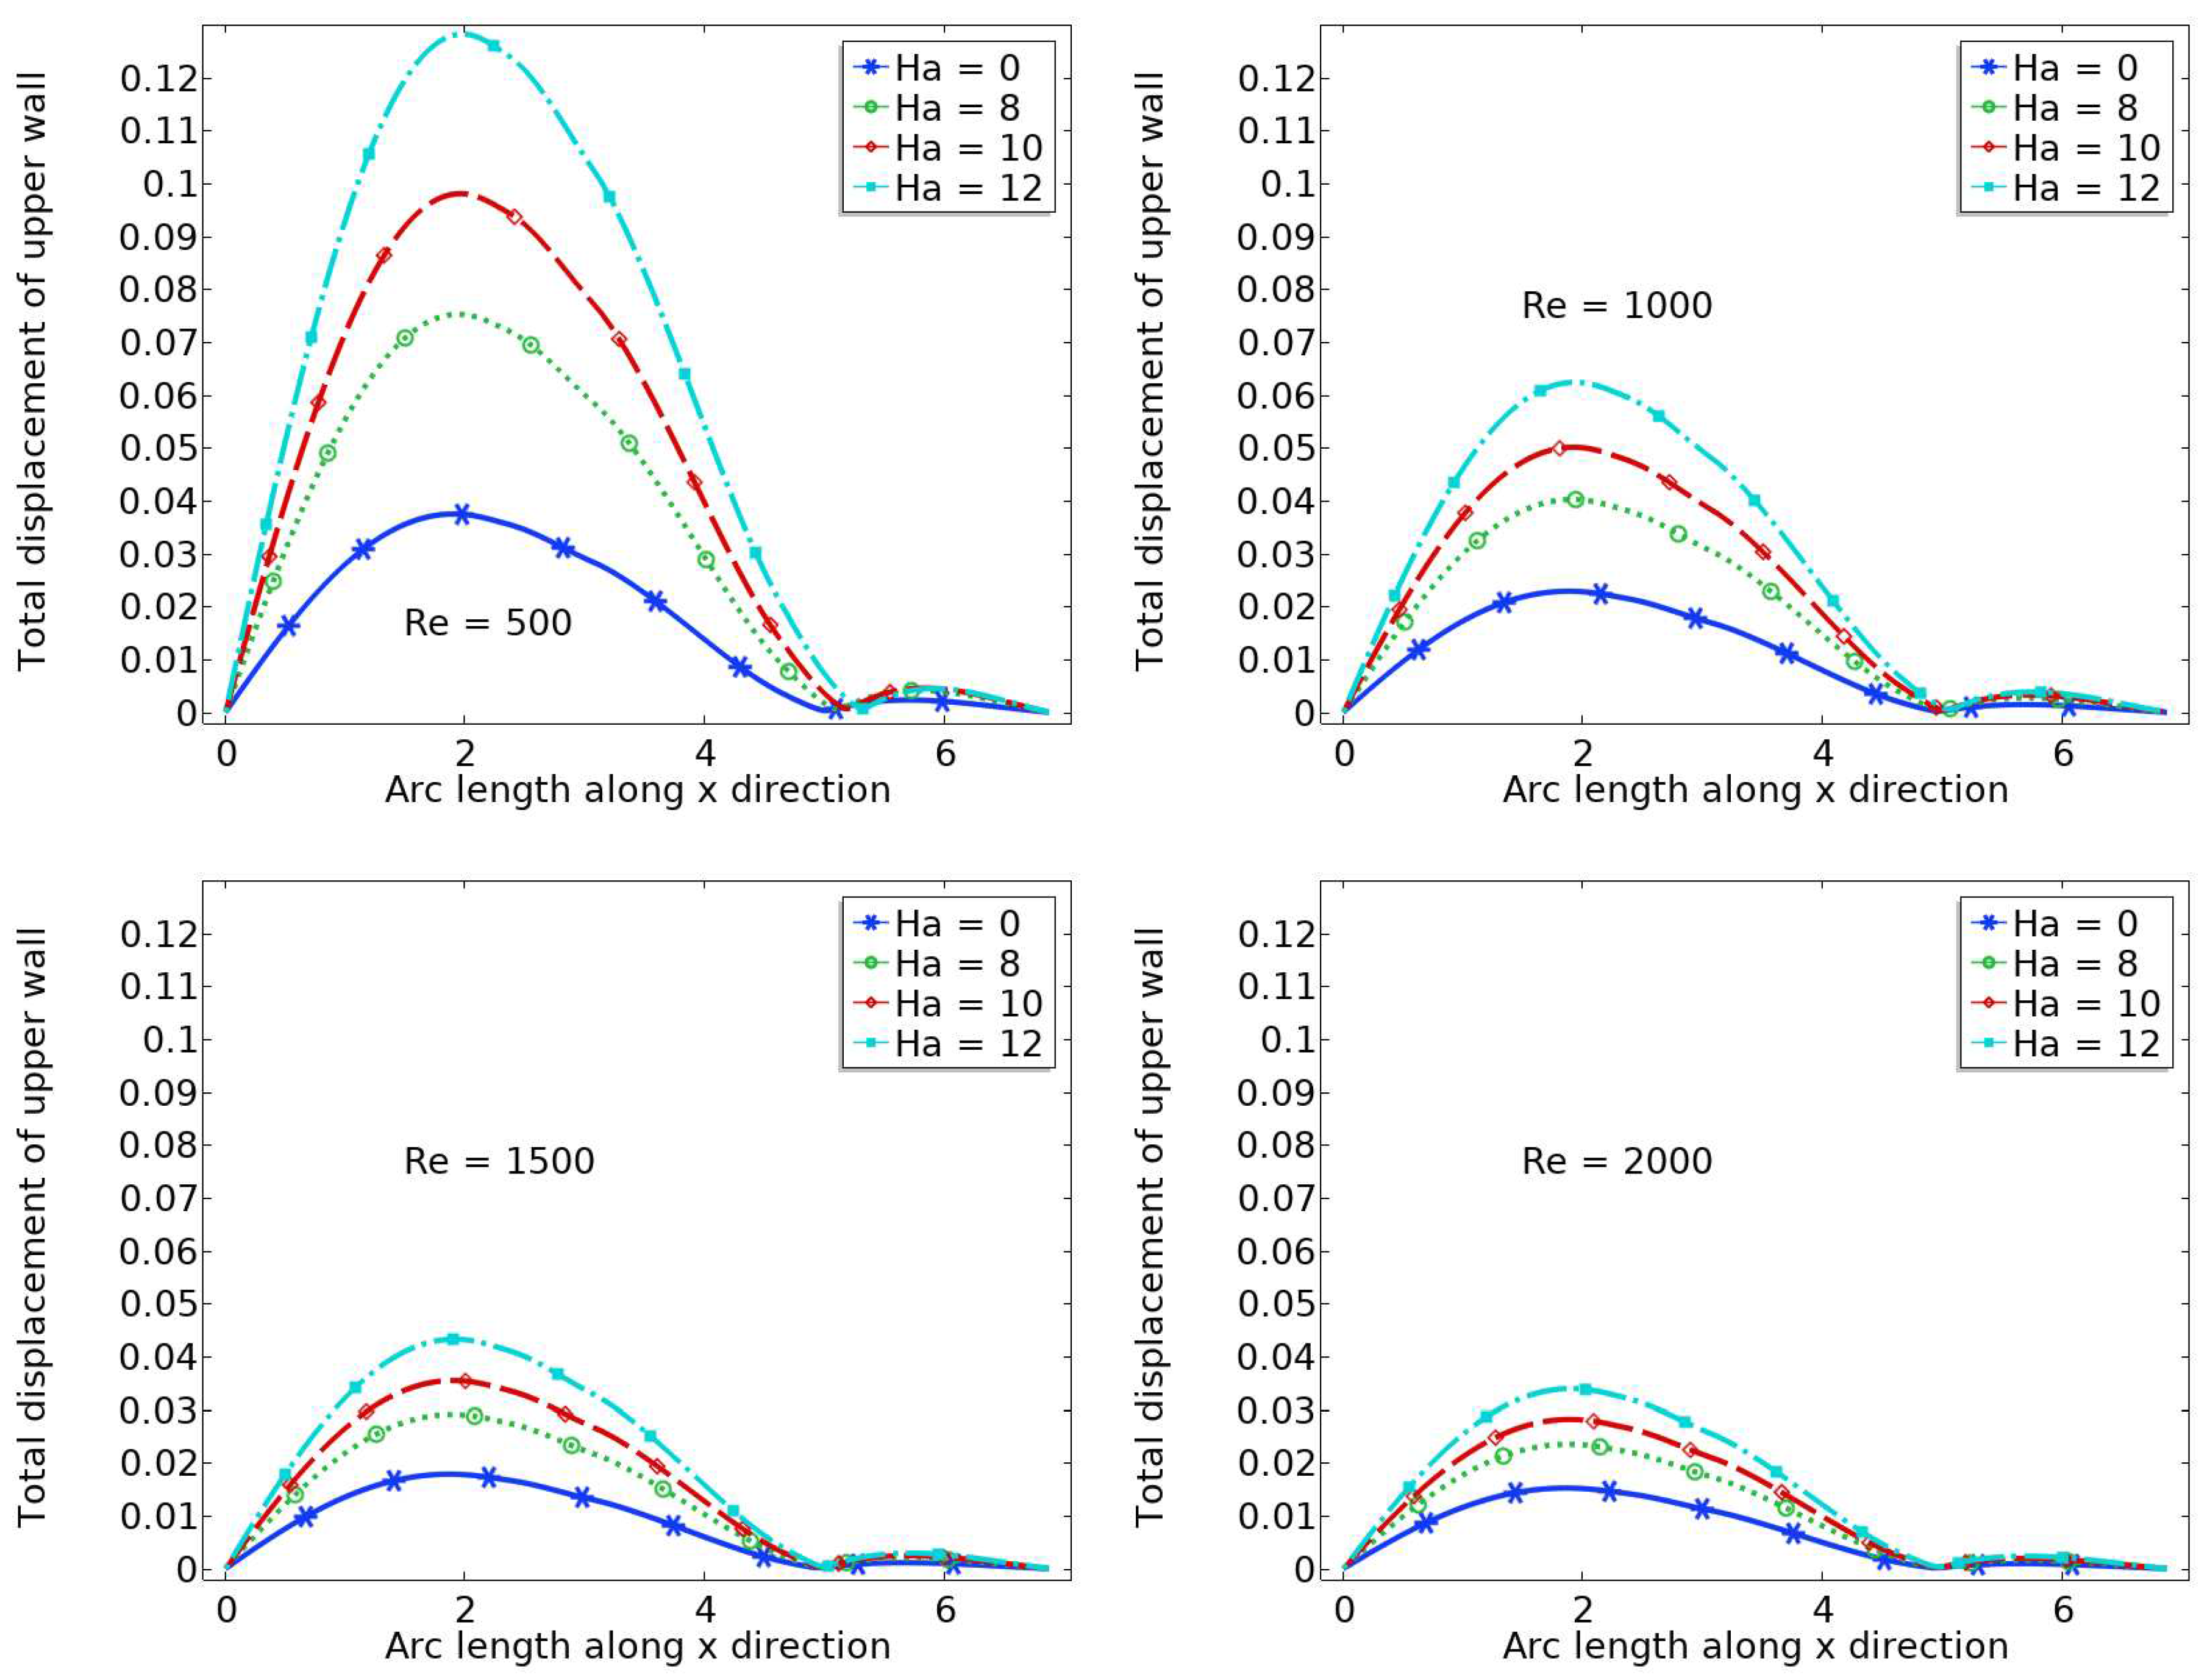
Figure 1. The positions of the degrees of freedom in the P 2 P 1 element.
Preprints 69435 g001
Figure 7. The displacement of the upper wall for various values of R e
Preprints 69435 g007
Table 1. A correlation exists between the number of components and wall shear loads and the refinement levels of the mesh.
Mesh Level Mesh Elements Wall Shear Stresses Abs. error
0 1478 0.072341 -
1 1922 0.072244 0.000097
2 2432 0.072347 0.000103
3 7528 0.072557 0.00021
4 22153 0.072601 0.00004
5 24322 0.072600 0.000001
Table 2. Maximum velocity magnitude at location A, B and gain in velocity at B.
R e = 500 R e = 1000 R e = 1500 R e = 2000
Ha A B gain % A B gain% A B gain % A B gain%
0 0.49 0.69 41 0.50 0.70 40 0.50 0.71 42 0.51 0.72 39
8 0.42 0.52 24 0.45 0.61 36 0.46 0.65 41 0.47 0.66 40
10 0.37 0.46 23 0.42 0.56 33 0.45 0.61 36 0.46 0.64 39
12 0.34 0.40 18 0.37 0.51 38 0.42 0.57 36 0.43 0.60 40
Table 3. Total wall shear stress (WSS) at the lower wall.
Ha R e = 500 R e = 1000 R e = 1500 R e = 2000
0 0.05476 0.03018 0.02161 0.01716
8 0.06673 0.03522 0.02457 0.01918
10 0.07223 0.03807 0.02623 0.02030
12 0.07776 0.04128 0.02824 0.02165
Disclaimer/Publisher’s Note: The statements, opinions and data contained in all publications are solely those of the individual author(s) and contributor(s) and not of MDPI and/or the editor(s). MDPI and/or the editor(s) disclaim responsibility for any injury to people or property resulting from any ideas, methods, instructions or products referred to in the content.
Copyright: This open access article is published under a Creative Commons CC BY 4.0 license, which permit the free download, distribution, and reuse, provided that the author and preprint are cited in any reuse.
Prerpints.org logo

Preprints.org is a free preprint server supported by MDPI in Basel, Switzerland.

Subscribe

© 2024 MDPI (Basel, Switzerland) unless otherwise stated