Preprint
Article

Numerical Simulation of a Model Describing Plaque Rupture Phenomena in Elastic Arteries with Bifurcated Stenosis

Altmetrics

Downloads

183

Views

64

Comments

0

This version is not peer-reviewed

Submitted:

04 March 2023

Posted:

07 March 2023

You are already at the latest version

Alerts
Abstract
The buildup of plaque in the arteries characterizes atherosclerosis, which causes the walls of the arteries to thicken, the lumen to narrow, and the wall to thin in certain areas. These changes can lead to alterations in blood flow, potentially resulting in aneurysms and heart attacks if left untreated. This paper presents a phenomenological model to explain the mechanics of plaque rupture in stenosed bifurcated elastic arteries. The model considers the interaction between the plaque and artery wall, blood flow, mechanical properties of the artery wall and plaque, and hemodynamic forces in the system. Using the Navier-Stokes equations to describe blood flow and elastic properties of artery walls, our study shows that blood flow can become turbulent, leading to backflow, vortices, and possible stagnation. Certain regions can become highly vulnerable and result in elevated heat transfer between blood and arterial walls, which can lead to the rupture of the plaque cap. The study focuses on blood flow features such as velocity profiles and wall displacement on fluid-structure interaction, which are consistent with the literature. Finally, we calculate the wall shear stress (WSS) for minimum and maximum times while considering elastic walls. Our findings may provide valuable insights into the mechanisms of plaque rupture and inform the development of improved diagnostic and therapeutic approaches.
Keywords: 
Subject: Computer Science and Mathematics  -   Applied Mathematics

1. Introduction

Atherosclerosis is a disease that can be caused by various risk factors, such as high blood pressure, diabetes, smoking, hypercholesterolemia, infections, and modified lipoproteins. Researchers have been investigating atherosclerosis for over a century, with a specific focus on the role of cholesterol in its development, which was first reported by Anitschkow and Chalatov. Although it was initially believed to be a simple lipid storage disease, recent advances in cellular and molecular research have provided new insights into its pathogenesis. The subendothelial space of large and medium-sized arteries contains a monolayer of cells and matrix proteins, with smooth muscular cells occasionally present. As the diseased blood cell thickens over time, focal lesions of lipid accumulation known as fatty streaks develop in the intima. These fatty streaks are believed to be the precursor to advanced atherosclerotic plaques or atheroma, which can lead to clinical symptoms. Advanced lesions occupy a widespread intima region and are characterized by a lipid core with no growth in fibrous tissue at this stage of the disease. Atherosclerotic plaques can be classified as either ’vulnerable’ or ’stable,’ with vulnerable plaques having a significant lipid core and a thin bottom cap that separates tissue factor thrombogenic macrophages from the blood.
According to [1], the stenosis geometry of some cardiovascular patients cannot be represented by a vertically symmetric function across the stenosis. Consequently, they investigated blood flow through vertically asymmetric stenosis and compared flow volumes in asymmetric and vertically symmetric stenoses. However, a vertically symmetric function, such as an exponential function in a bell shape or a cosine function in a cosine shape, can be used to explain vertically symmetric stenosis.
Zuhaila et al. [2] conducted a study on the dynamic response of blood flow heat transmission in stenotic conditions through a bifurcated artery with a stiff wall (2D) and Newtonian, incompressible, laminar, and constant blood flow. Their findings revealed that minor changes in stenosis and Reynolds number significantly affected velocity, temperature distribution, and reverse flow recirculation. Diviya et al. [3] explored the hemodynamics of variable liquid characteristics with heat and mass transmission in the Jeffrey fluid MHD peristaltic mechanism. They observed the effects of an increased variable viscosity parameter on fluid flow and size, as well as on heat transfer to variable thermal conductivity. Li et al. [4] investigated the impact of various computational models on hydrodynamic factors when an incompressible fluid interacts with two symmetric elastic or poroelastic structures. They performed numerical experiments on blood flow, using the Carreau-Yasuda model to simulate viscosity and examine the influence of non-Newtonian blood rheology and poroelasticity on a benchmark vessel. They also presented a two-dimensional simulation of blood flow in an axisymmetric stenosis artery that considered both non-Newtonian fluid properties and fluid-structure interaction. The results indicated that blood flow exhibits non-Newtonian behavior in small vessels and in settings with complicated geometry.
Sohail et al. [5] conducted a study on Bingham fluid peristaltic flows with inclined magnetic fields or canals to analyze their impact on heat and mass transfer. Bourhan et al. [6] developed a mathematical model of multi-stenosis to investigate the effects of heat and blood flow in multi-stenosis arteries. They employed a finite difference scheme to solve the governing equations related to the vorticity-stream function and examined the effects of magnetic fields and stenosis on wall shearing stress and nutrient quantities. The study found that magnetic fields can alter flow patterns and enhance heat transfer, and the severity of stenosis affects wall shear stress. Hayat et al. [7] presented a model of tangent hyperbolic liquid peristaltic, considering chemical processes, magnetohydrodynamics, and thermophoretic deposition analysis in a curved channel and imposing restrictions on speed, temperature, and concentration for slips. Using a magnetohydrodynamics-based mathematical model, Xenos et al. [8] investigated blood flow in a stenosis channel under a permanent magnetic field and predicted a decrease in blood velocity, stenosis-based circulation, and a decline in blood pressure with increasing magnetic field intensity. Finally, Ogulu and Abbey [9] simulated heat transfer in a porous artery with oscillatory blood flow and explored the effects of parameters like porosity, amplitude, and frequency of oscillation on heat transfer mechanisms.
Sen and Chakravarty [10] proposed a mathematical model to study the transport of heat and mass in blood flows under stenotic conditions across bifurcated arteries. Obdulia Ley et al. [11] explored the impact of arterial geometry and inflammatory cell distribution on hot spots and blood flow in the plaque region, calculating the averaged temperature distribution of atherosclerotic plaques during the inflammatory process. Golam et al. [12] numerically investigated the effects of non-Newtonian models on unsteady periodic flows in a 2D pipe with two idealized stenoses, comparing various non-Newtonian blood constitutive equations with the Newtonian viscosity model. Wang [13] proposed a mathematical model for heat-to-blood flow conversion in a narrow tube, while Liu et al. [14] studied the modeling of blood flow in pulmonary arterial fluid-structure interactions. They developed a general framework for patient-specific simulations for blood flow fluid-structure interaction, including medical image mesh production, low-order VMS finite element, and boundary conditions. Additionally, they identified five crucial parameters that affect blood concentrations: plasma viscosity, hematocrit, red blood cell adhesion, accumulation of red blood cells, and temperature. The physiological parameters hematocrit and erythrocytes are influenced by changes in blood composition and are significant for non-Newtonian shearing and dilatancy. Khaled and Vafaei [15] developed a biological heat model for tissue heat transmission based on porous media theory, utilizing thermal transport theory and examining the equation of thermal biology in the transport theory of living tissue. Arterial stiffness has emerged as an important tissue biomarker for cardiovascular risk stratification and biological age, with non-invasive methods available for assessing large artery rigidity [16]. Understanding the distortion of temperature distribution as a function of vessel diameter is crucial for creating adequate bioheat transport models [17]. Blood flow can create localized areas of cooling in heated hyperthermic tissues, which is important to note [18,19]. High temperatures can lead to irreversible harmful effects on blood proteins and cell death [20]. Intraoperative monitoring is essential for safe and successful open surgery. Numerical simulations are used by some researchers to track heat transfer and the flux of atherosclerotic plaque in a real physiological system, with or without an atherosclerotic plaque, due to their blood viscosity dependence. Xuelan Zhan et al. [21] conducted research to investigate the effects of hematocrit (H) and operational ambient temperatures on viscosity, velocity, temperature, and wall shear stress (WSS). Their findings indicate that a plaque in the carotid artery increases blood flow, lowers pressure, WSS, and oscillation, and decreases viscosity and temperature variations. A decrease in ambient temperature lowers the WSS region and increases the risk of atherosclerosis and hypothermia. Foong et al. [22] conducted a continuous heat flow study and used Newton and other non-Newtonian biomedical approaches to analyze the numerical sequence of blood flow within an artery. The recharging of fluids and electrolytes in bodily capillaries can transform blood flow from non-Newtonian to Newtonian, increase heat transmission into the bloodstream, and lower blood flow. The maximum temperature for non-Newtonian fluid flow is 310,007 K, while the Newtonian fluid flow maximum is 310,0045 Kin for this investigation. These findings illustrate the thermal behavior within the body vessels of the Newtonian and non-Newtonian liquid models. As any change in body temperature from the norm can have adverse health effects, medical science centers, vaccination, and serum institutions must carefully monitor any mechanical design of blood fluid medications.

2. Mathematical Modeling

In this study, we are examining the two-dimensional laminar flow of an incompressible viscous fluid in a bifurcated artery with stenosis. To account for the non-Newtonian effect in our analysis, we are utilizing the Casson-Papanastasiou model, which includes an exponential term proposed by Papanastasiou [27] to remove the requirement for a stress threshold. The regularized Casson model can be expressed as follows:
τ = α T μ p + τ y γ ˙ ( 1 e m p γ ˙ ) 2 .
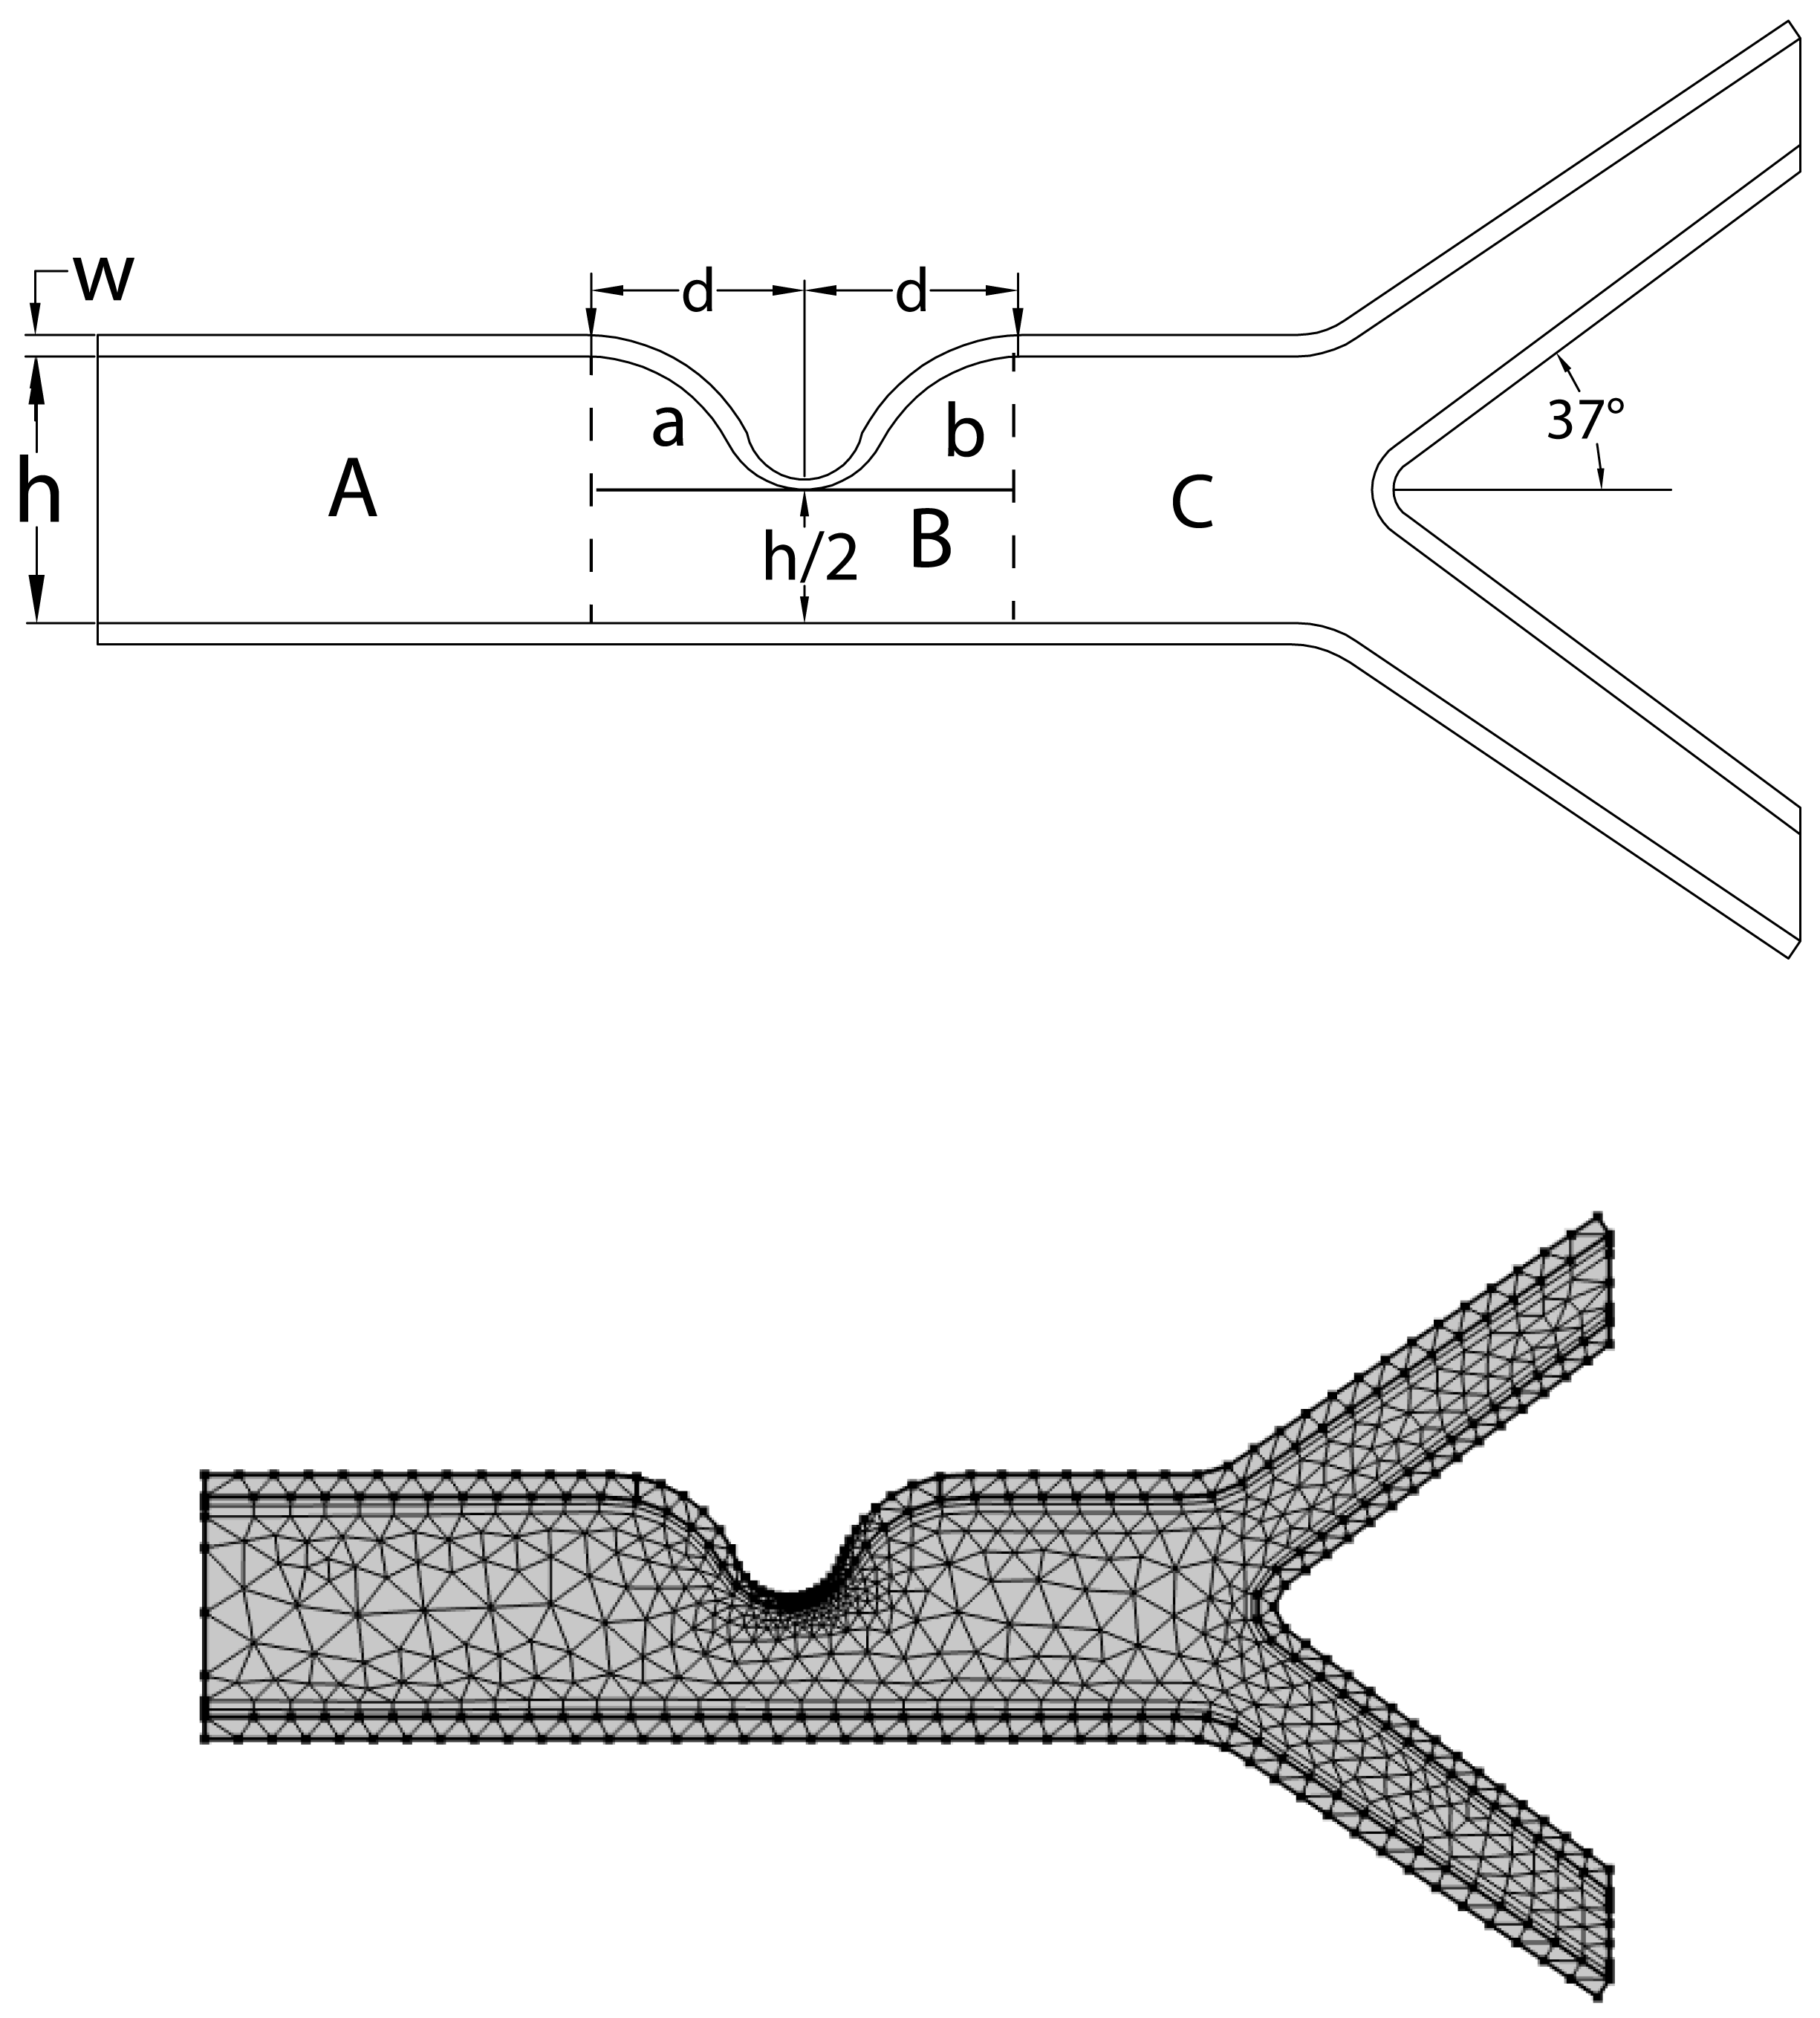
The linearly elastic wall of the arteries is assumed in this study, and the problem geometry and coarse mesh used are depicted in Figure 1. A parabolic flow inlet is considered, and the pressure at the exit is set to zero. Under these assumptions, the governing equations for flow are expressed in Arbitrary Lagrangian-Eulerian (ALE) formulation, and the conservation of mass is the first equation. Further details on this topic can be found in [24,28].
u * x * + v * y * = 0 ,
The conservation of momentum is represented by the second equation in the ALE formulation as follows:
( u * w * ) u * x * + ( v * w * ) u * y * = 1 ρ f p * x * + ν * 2 u * ( x * ) 2 + 2 u * ( y * ) 2 ,
( u * w * ) v * x * + ( v * w * ) v * y * = 1 ρ f p * y * + ν * 2 v * ( x * ) 2 + 2 v * ( y * ) 2 ,
The velocity components in dimensional form are represented by u * and v * , and the dimensional mesh coordinate velocity is represented by w * . The volumetric thermal expansion coefficient is denoted by β . The equations that govern the solid component in dimensional form can be expressed as follows:
σ * + F v * = 0 ,
The stress tensor in its dimensional form is denoted by σ * , and any external body force acting on the solid is represented by F v * . The equations governing the blood vessel wall interface are subject to no-slip boundary conditions, which can be mathematically expressed as follows:
σ * · n = P * + μ u * ,
the normal component of the stress tensor at the wall interface is represented by σ * · n , while P * denotes the pressure, μ is the dynamic viscosity of the fluid, and u * indicates the gradient of the velocity components with respect to the spatial coordinates. Considering a linearly elastic wall, the strain tensor can be expressed as:
σ = J 1 F S F T ,
The determinant of F, denoted by J, can be defined as F = 1 + d S . The strain tensor, denoted by ϵ , is related to the second Piola-Kirchhoff stress tensor S through S = C : ϵ , where C is the elasticity tensor. The strain tensor ϵ is expressed as follows:
’where F is the deformation gradient tensor, d S is the displacement vector, and δ is the Kronecker delta symbol.
ϵ = 1 2 ( d s ) T + d s + ( d s ) T . d s .
The non-dimensional variables can be obtained from their dimensional counterparts by scaling them with appropriate characteristic quantities as follows:
σ = σ s * E * , E = E * h ρ f v 0 2 , ( x , y ) = ( x * h , y * h ) , ( u , v , w ) = ( u * v 0 , v * v 0 , w * v 0 ) , u s = u s * h , p = p * ρ f v 0 2 , R e = ρ f h v 0 μ ,
the maximum velocity of blood at the inlet is represented by v 0 , while the diameter of the artery is denoted as h. The Reynolds number, denoted by R e , is a dimensionless parameter used to describe the flow of a fluid. Using the dimensionless parameters given in equation (9), we can express equation (5) as:
σ = 0 ,
In the context of linearly elastic walls, the strain tensor, denoted by σ , can be expressed as:
σ = J 1 F S F T ,
the determinant value of F is represented by J, where F is defined as F = 1 + u s . The second Piola-Kirchhoff stress tensor S can be related to the strain ϵ using the equation S = C : ϵ , where C = C ( E , ν ) , with E representing Young’s modulus and ν representing the Poisson ratio of the solid wall. The strain tensor ϵ is defined as:
ϵ = 1 2 ( u s ) T + u s + ( u s ) T . u s .
Equations (1) to (3) can be expressed using dimensionless parameters as follows:
u x + v y = 0 ,
( u w ) u x + ( v w ) u y = p x + 1 R e 2 u x 2 + 2 u y 2 ,
( u w ) v x + ( v w ) v y = p y + 1 R e 2 v x 2 + 2 v y 2 ,
σ = 0 .
The boundary condition for the inlet velocity profile is given by equation (17), where
u i n = 8 y ( 1 y )
The outlet boundary conditions are prescribed based on pressure, where the pressure is set to zero at the outlet. The solid domain has a fixed point constraint at the start and end, meaning that those points do not move due to flow, while other parts of the domain are free to move. Initially, the velocity and displacement are set to zero.

2.1. Geometrical Configuration

The computational domain considers a prototype geometric model with stenosis and a bifurcation that has a symmetrical arrangement, as illustrated in Figure 1. The walls are assumed to be composed of linear elastic and isotropic materials that are characterized by Young’s modulus and Poisson’s ratio. The Lame coefficients λ and ν , as well as the shear modulus μ , are related through the following equations:
ν = 1 2 . λ ( μ + λ ) , λ = E ν ( 1 + μ ) ( 1 2 ν ) ,
The value of Poisson’s ratio ν determines the compressibility of a structure, with ν = 0.5 representing incompressible structures, while ν < 0.5 representing compressible structures [29]. Unless otherwise stated, the Young’s modulus E is set to 1 × 10 10 and the Poisson’s ratio ν is set to 0.49 . The diameter of the artery is 1 mm and it shrinks to 50 % at the region of stenosis, indicating that stenosis restricts the artery about 50 % of the time. The elastic wall’s width is estimated to be 0.1 cm. The bifurcation artery has an inclination of 37 . The central line along which pressure is recorded is denoted by C, while points A and B are chosen to anticipate the behavior of the velocity profile prior to and following stenosis. Additionally, a coarse mesh consisting of triangular components, as shown in Figure 1, is used to represent the geometry.

3. Results and Discussions

In this section, the ramifications and importance of the results are elucidated and interpreted with respect to the research hypotheses. The study’s constraints are deliberated upon, and possible avenues for future research are proposed. Additionally, if relevant, the findings are juxtaposed and distinguished from prior research or theories.

3.1. Velocity profile

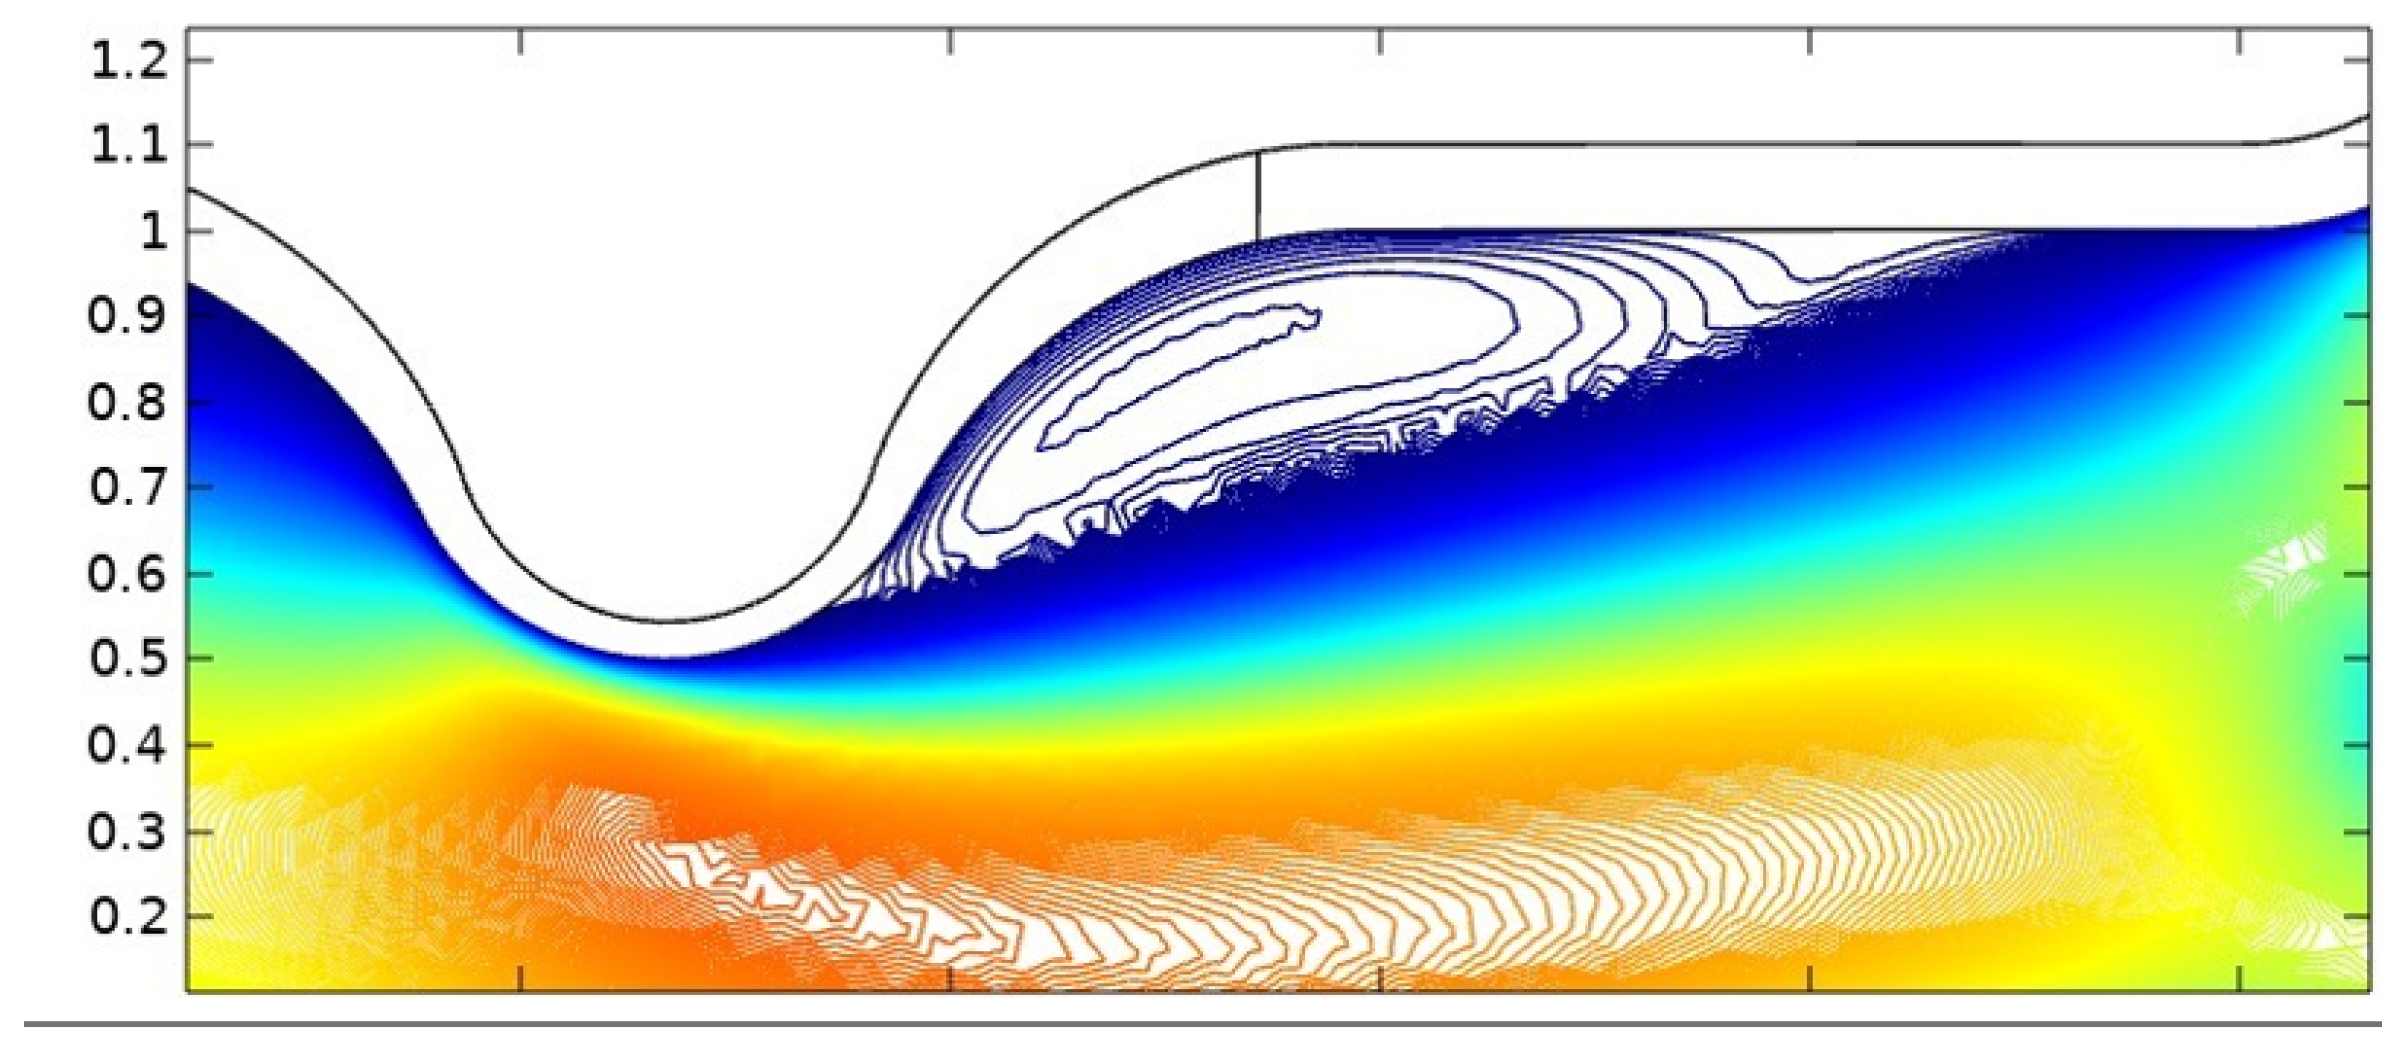
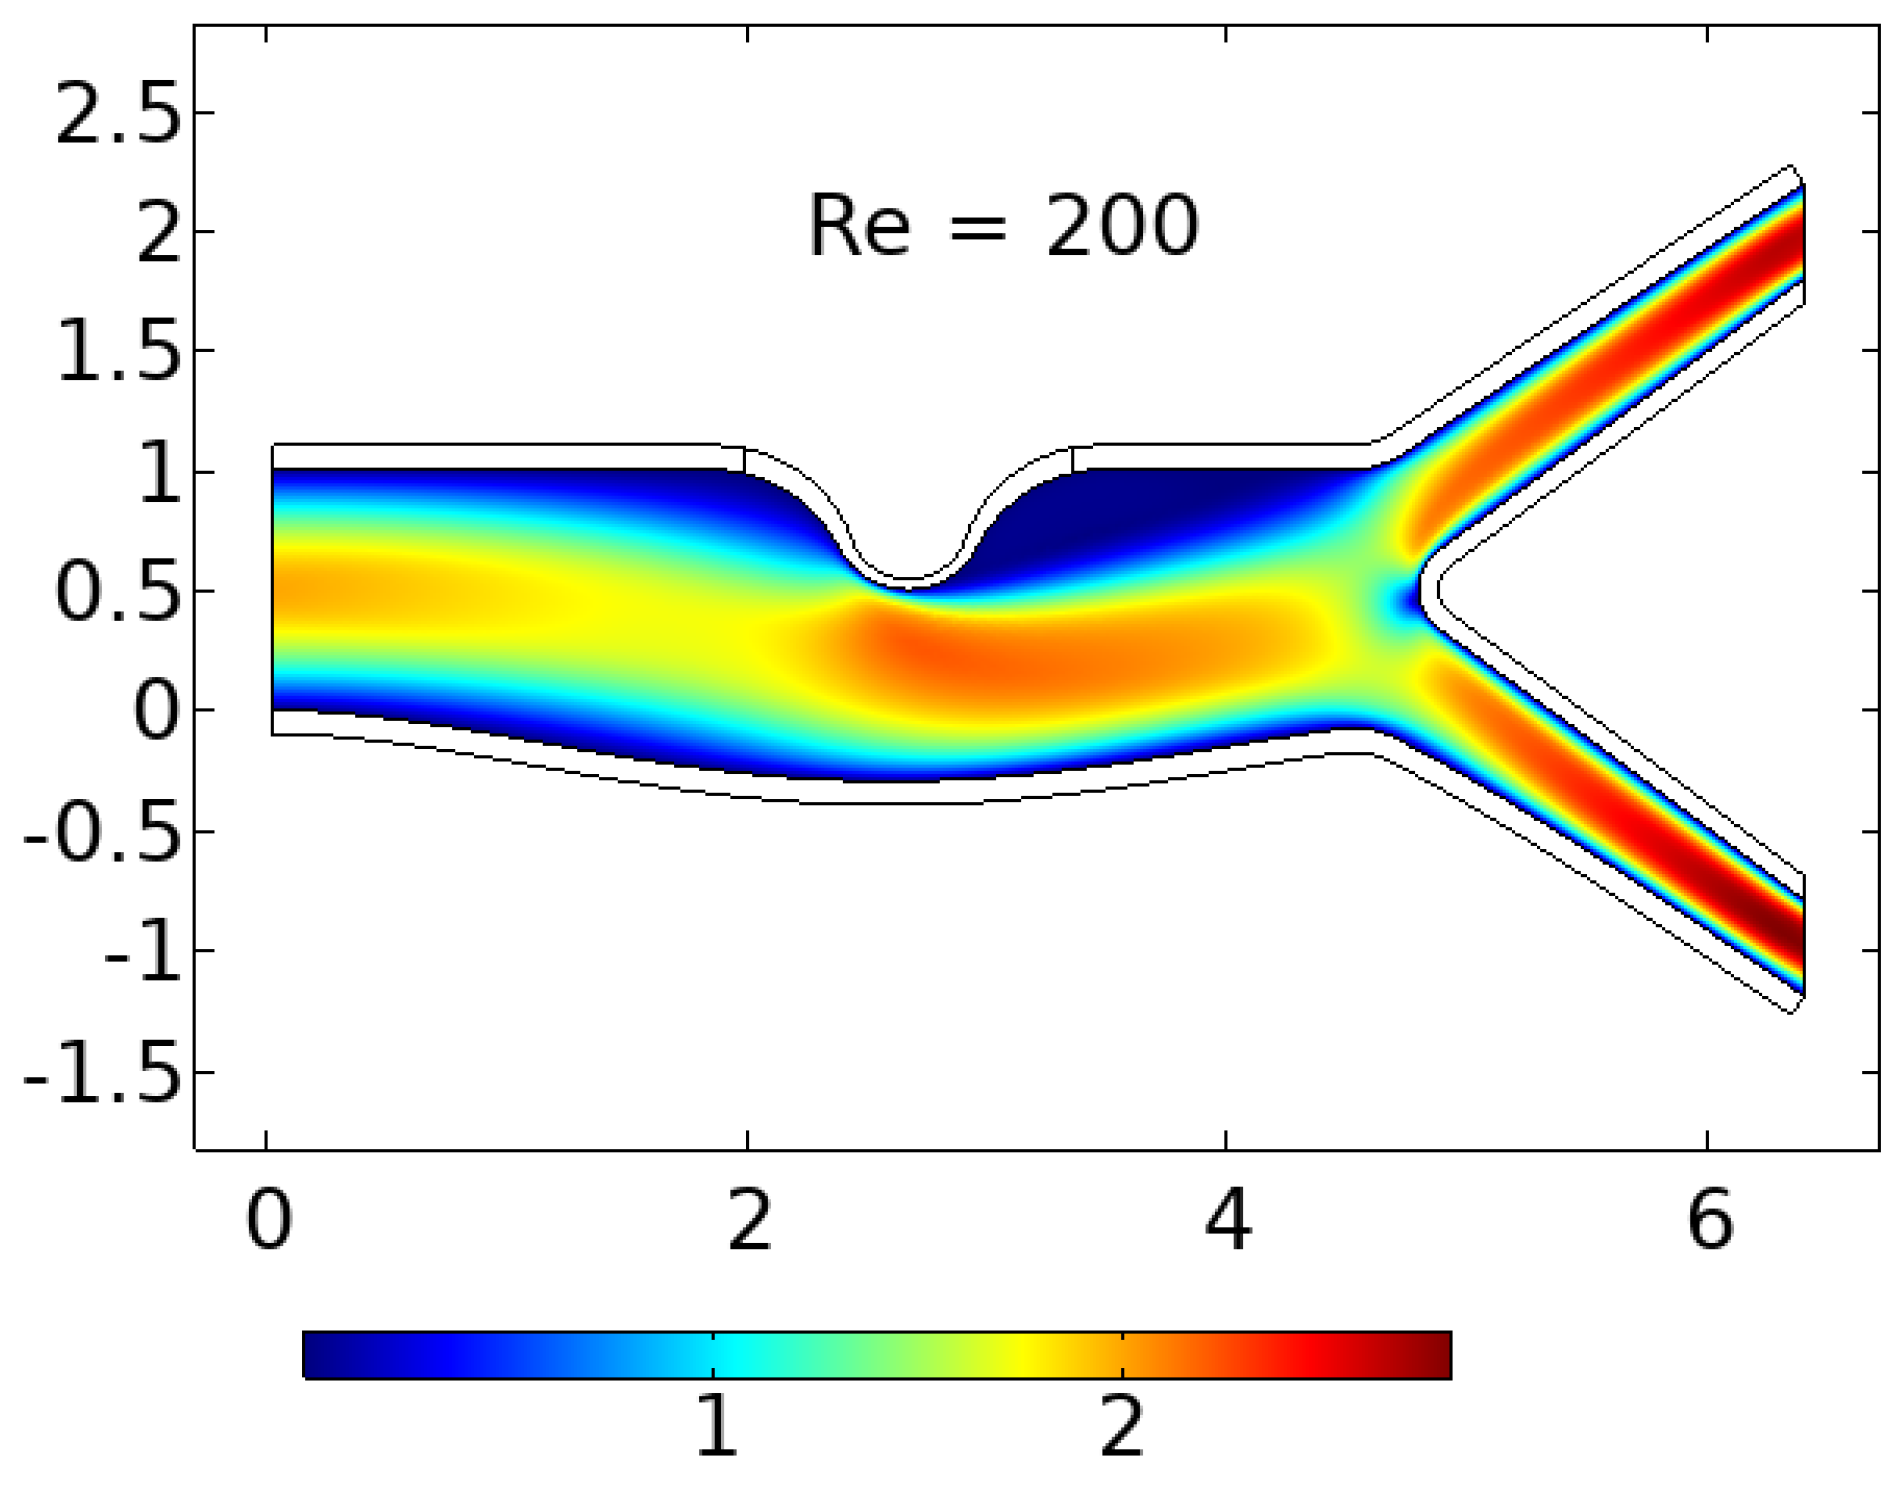
Figure 2 illustrates the blood flow behavior at R e = 200 non-turbulent flow [?]. The blood flow velocity experiences a decrease of approximately 26 % , dropping from around 2.3 units to 1.7 units as it approaches the stenotic region marked as ’B’. This drop in velocity is caused by the gradual increase in arterial diameter by about 31.5 % at the beginning of the stenotic region. Furthermore, the lower wall of the artery experiences greater expansion than the upper wall due to the lower wall’s Young’s modulus being around 25 % less than the upper wall, which is more rigid because of the plaque’s inherent property. As a result, the decrease in blood velocity in the expanded lower wall generates a region of relatively high pressure normal to the wall surface, resulting in arterial wall expansion.
It is noteworthy that backflow nucleation occurs at the bifurcation point as the blood divides into smaller branches with smaller diameters, causing an increase in velocity by approximately 30 % compared to the main artery. These findings provide insight into the effects of stenosis on blood flow behavior and arterial wall expansion. The results also highlight the importance of considering the heterogeneous properties of arterial walls when analyzing blood flow behavior in stenotic arteries. Additionally, the implications of the study are significant for improving our understanding of the physiological and pathological aspects of blood flow in stenotic arteries, which could lead to the development of more effective diagnostic and treatment strategies in the future.

3.2. Blood Backflow

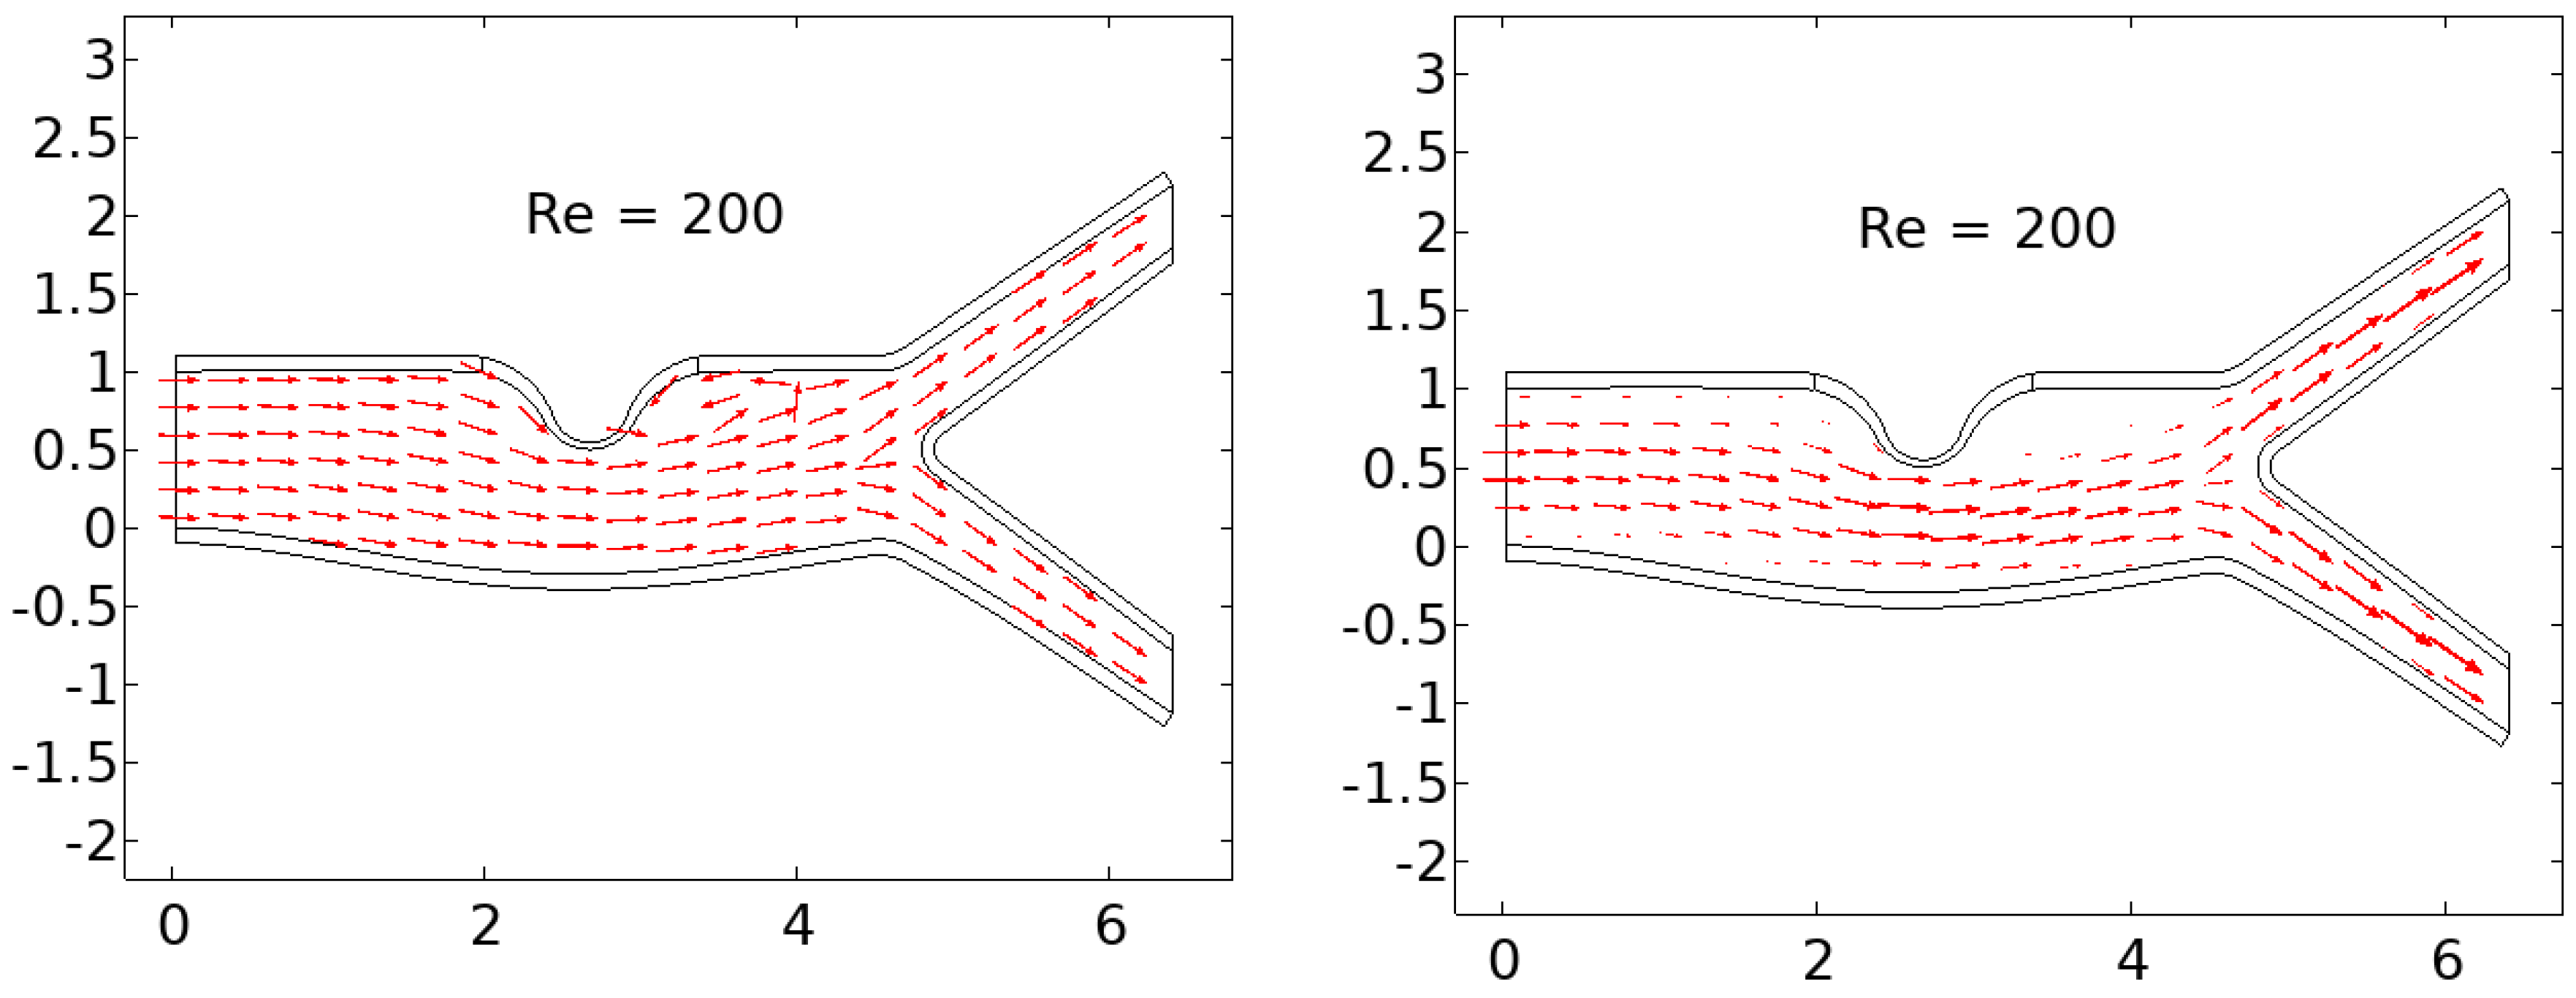
The findings of the velocity-vector simulation of blood flow at Reynolds number R e = 200 are illustrated in Figure 4. The normalized velocity vectors of the blood flow are presented in the left image, displaying backflow in the trailing edge of the plaque, even at low Reynolds numbers. Nonetheless, this image does not reveal any stagnation or other abnormalities in the blood flow patterns.
The results in the right image of Figure 4 indicate that blood flow velocity in the trailing edge of the plaque is significantly lower, by over 90 % , than the velocity in the non-stenotic region. This decrease in flow velocity can result in stagnation and the formation of micro-vortices, which can lead to platelet activation and stress, exacerbating the progression of atherosclerosis. Moreover, these changes in flow patterns can increase the probability of blood particle deposition at the stenosis region and eventual thrombosis.

3.3. Higher Reynold Number

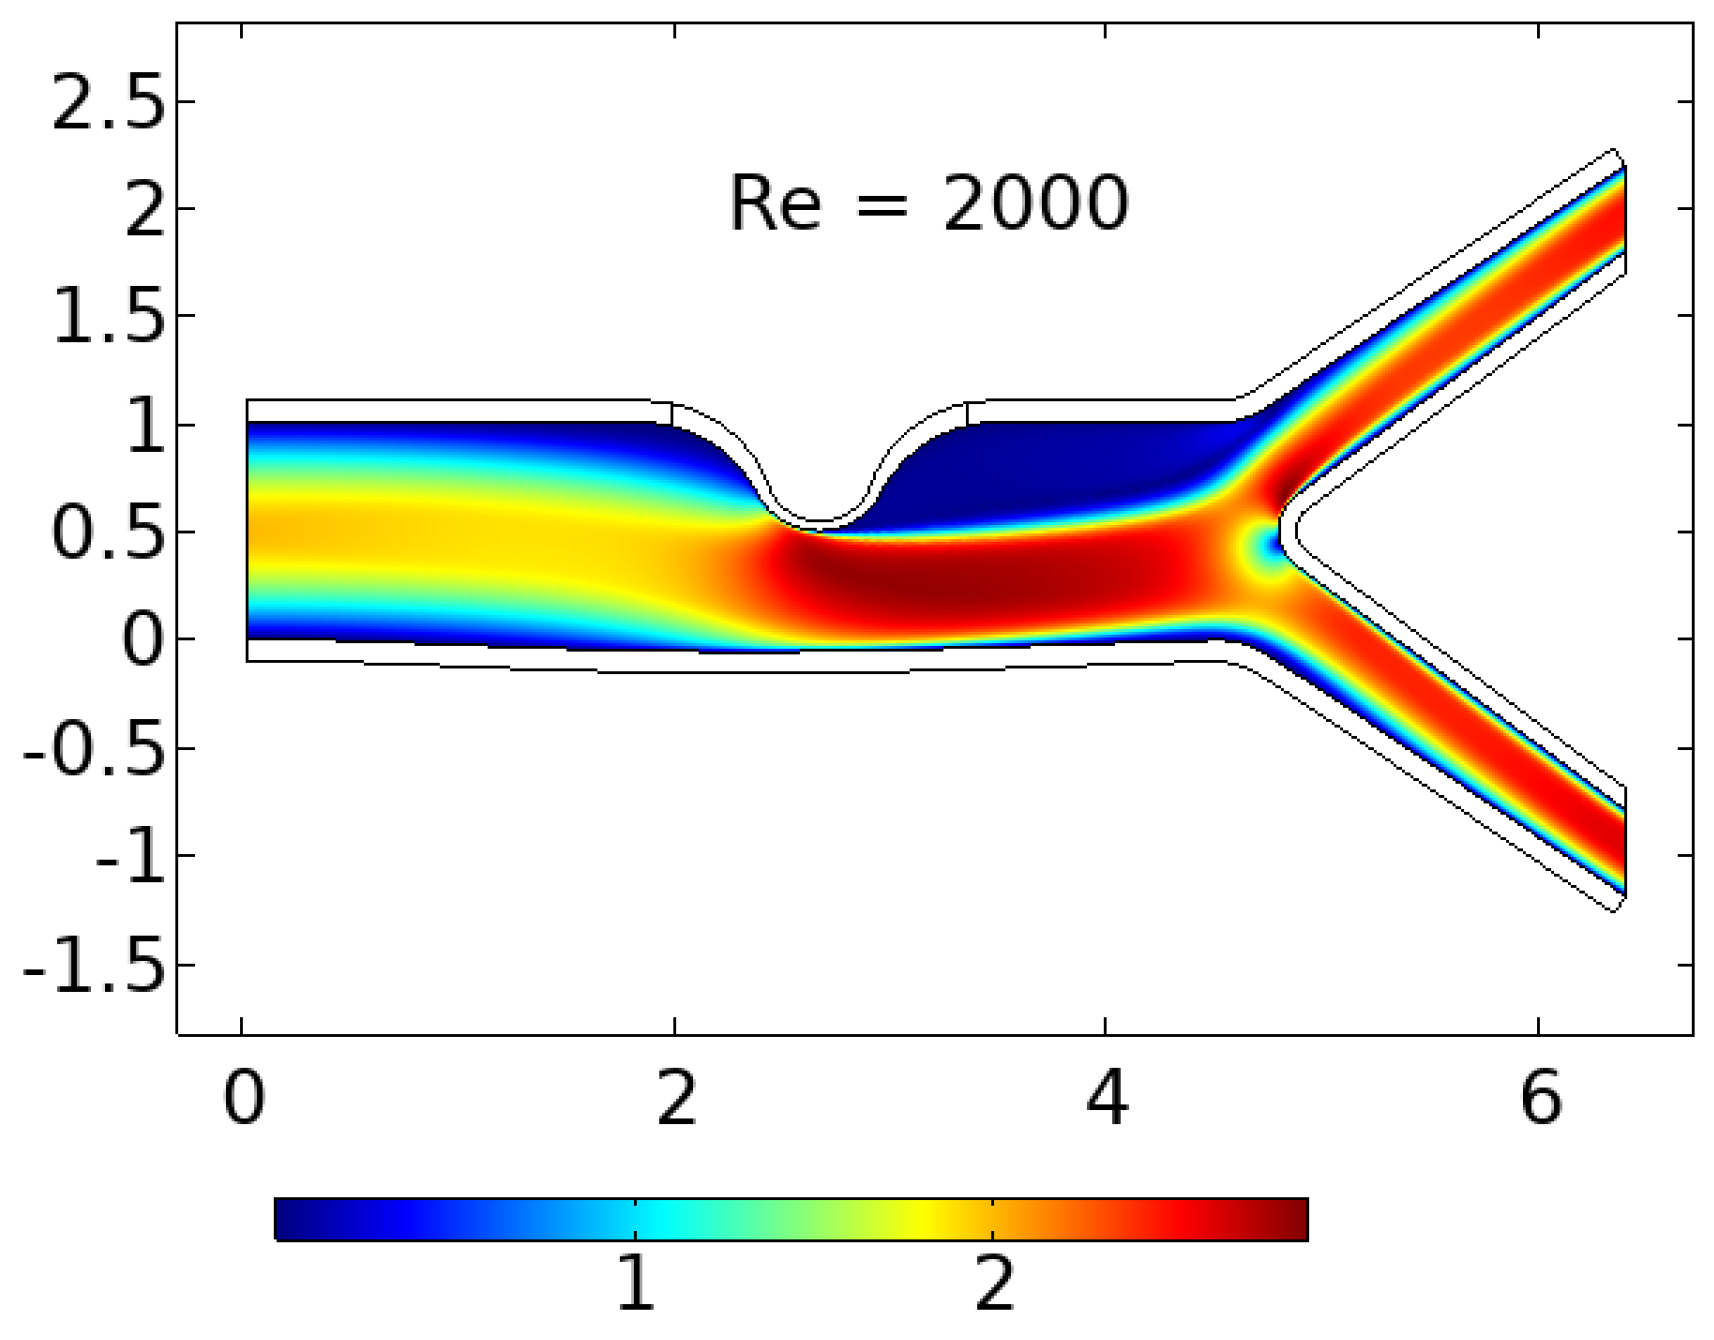
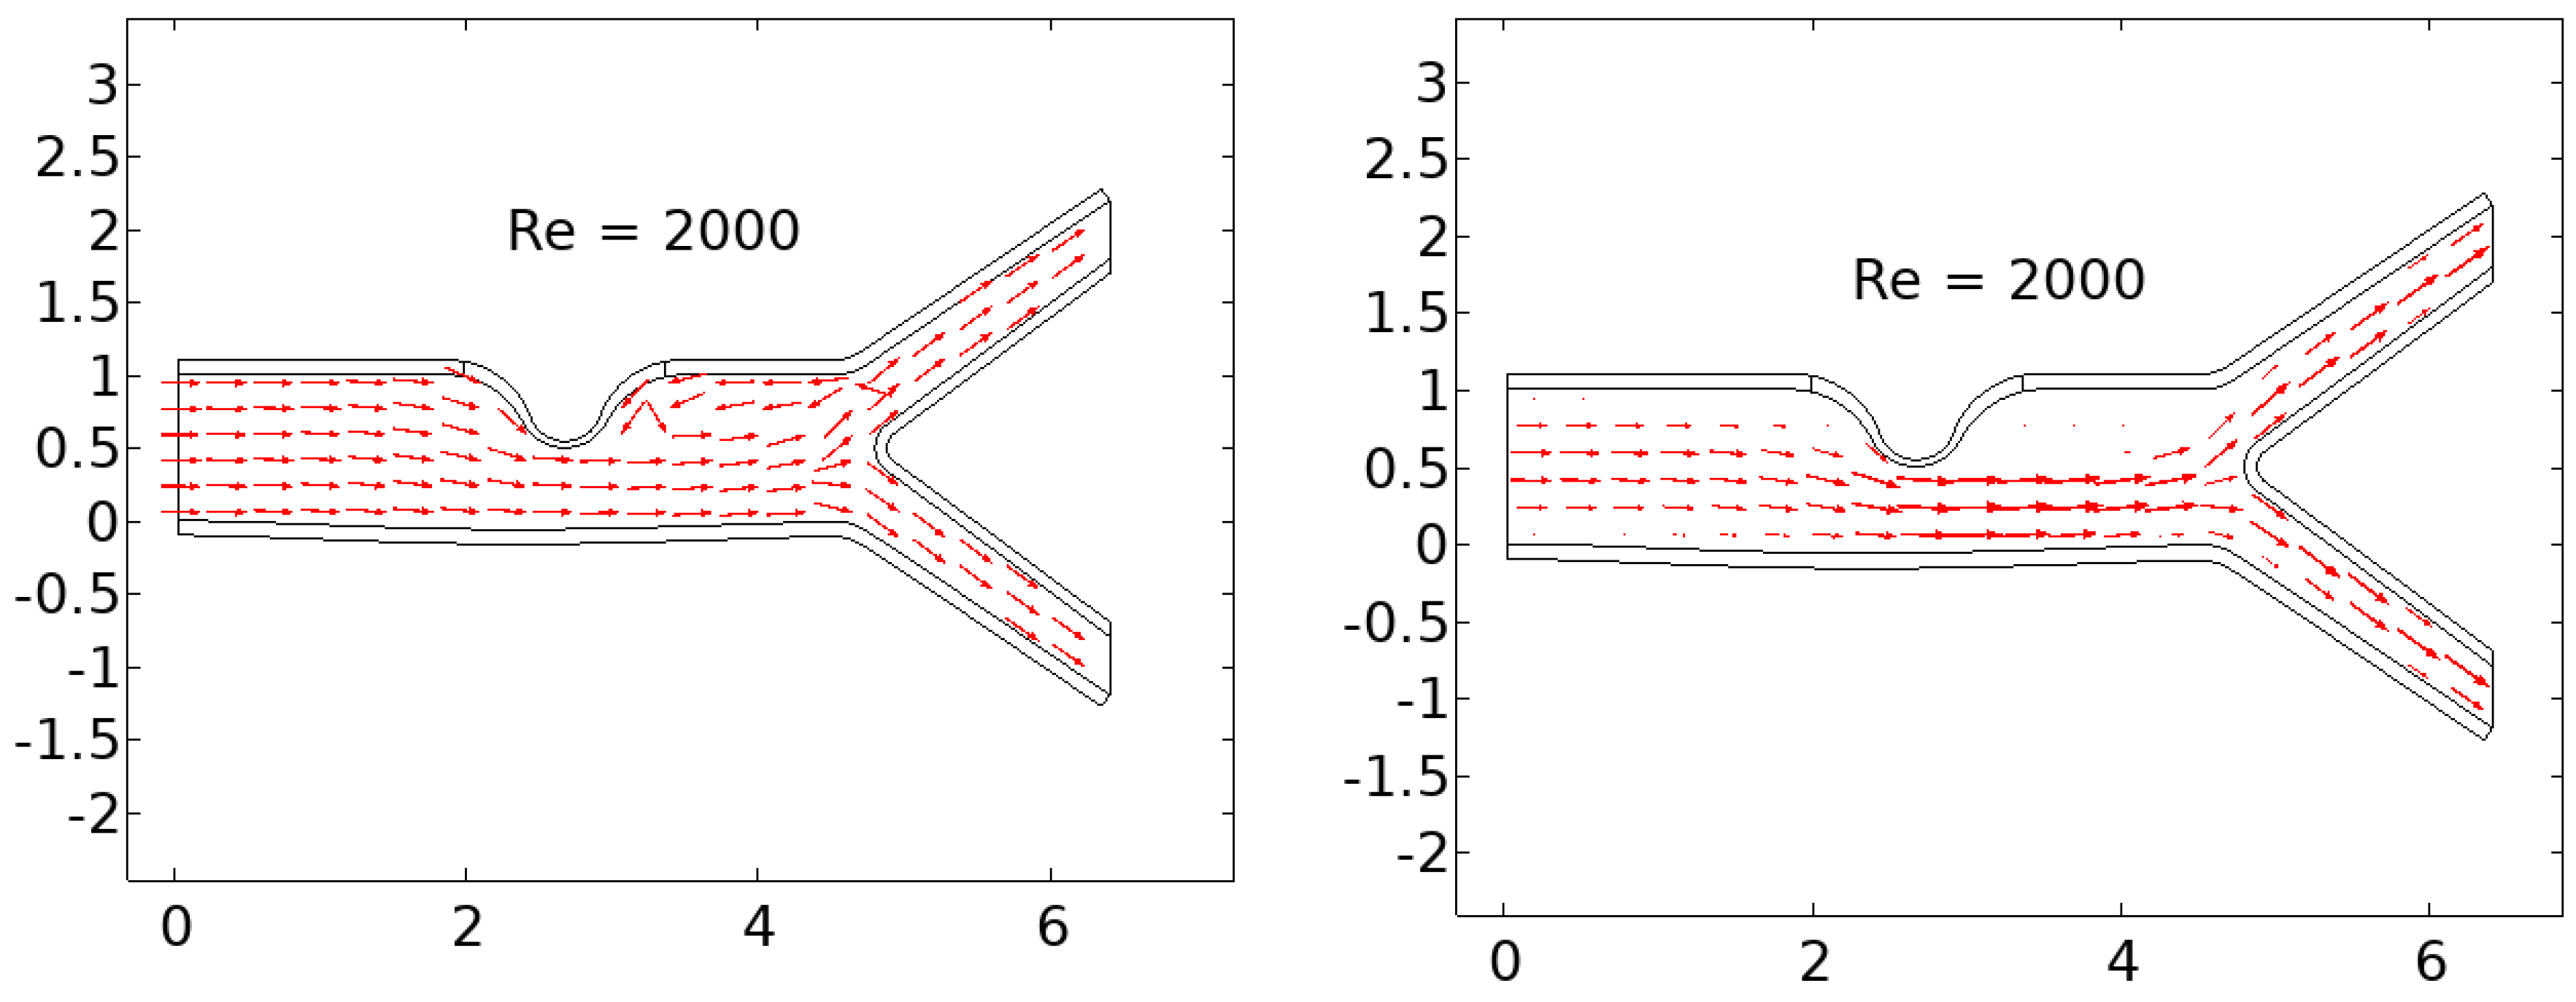
Figure 5 depicts the lower wall deformation for R e = 2000 , which is relatively small due to the high velocity and low normal pressure. As the Reynolds number increases from R e = 200 to 2000, the effects of backflow, stagnation, vortices, and low lateral velocities become more pronounced, as expected. These effects are illustrated in Figure 5 and Figure 6.
In addition, the increase in blood flow velocity causes a decrease in normal pressure on the arterial wall, leading to a small deformation of the arterial wall. This is evident when comparing Figure 2 with Figure 5 and Figure 6.
Furthermore, Figure 6 demonstrates that the stagnation region has significantly grown with R e = 2000 .

3.4. Dynamic Energized Hotspots

The blood flow characteristics at the backflow region labeled ’H’ in Figure 7 can create an environment that favors the formation of highly Dynamic Energized Hot Spots (DEHS).
DEHS, also known as Dynamic Energized Hot Spots, are small vortices with low lateral speed and high rotational inertia that are formed in the backflow region labeled as ’H’ in Figure 7. These vortices can increase both normal and shear stress, leading to further lesion formation in the plaque. This activation of platelets can recruit more blood cells to the plaque, causing it to grow larger. Additionally, the low lateral speed of the vortices can cause severe damage to the artery wall and plaque. If these DEHS frequently come into contact with a vulnerable region of the plaque, it can cause rupture and lead to thrombosis. Therefore, it is essential to comprehend the dynamics of blood flow and fluid mechanics associated with atherosclerotic arteries. Figure 7 provides a more magnified view of the trailing end of the artery, where significant backflow occurs, serving as a breeding ground for DEHS formation.

3.5. Shear Stress

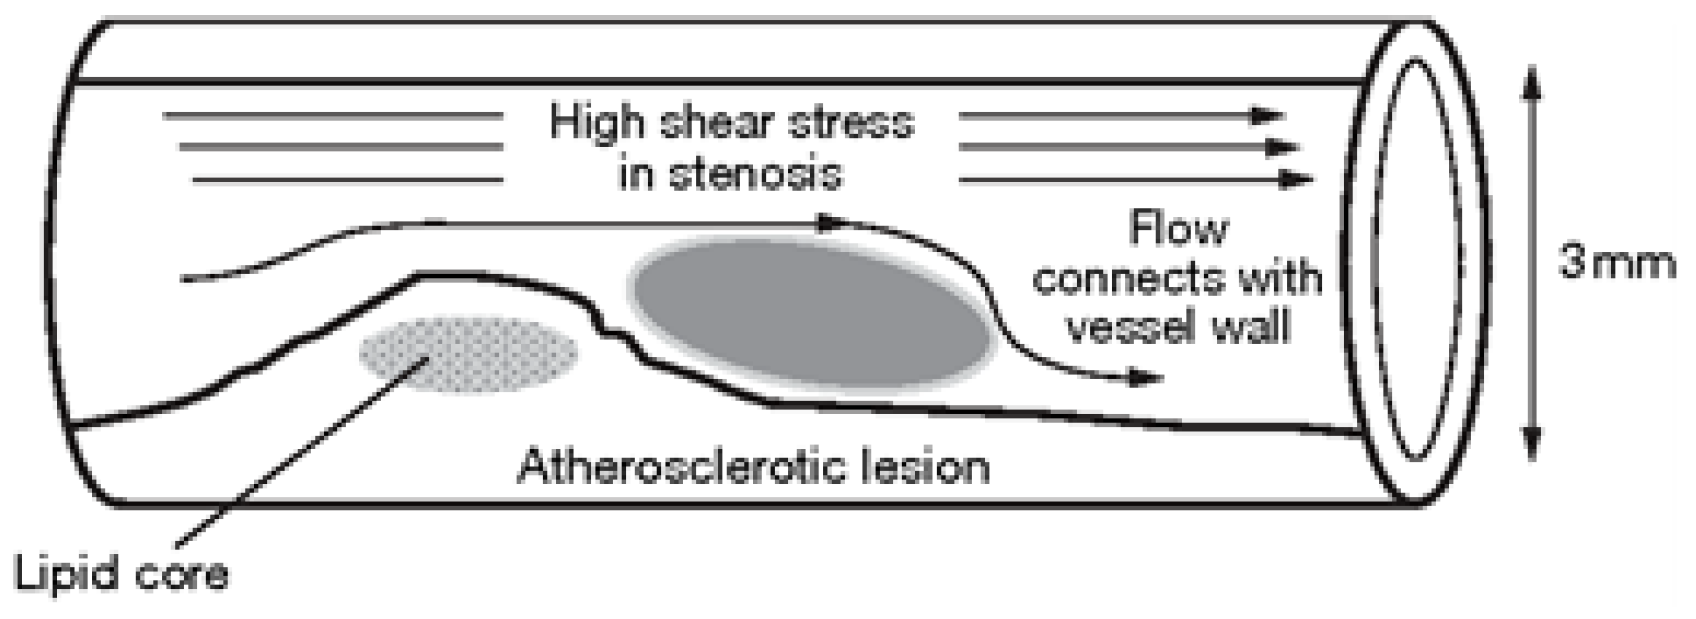
The stenotic region of the arterial wall has a slight narrowing effect on the blood flow velocity. This can be observed in Figure 2, where the average velocity changes from high (2.2) to low (1.6) and then high (2.5) as the blood flows across the artery. The higher velocity in the stenotic region results in increased shear stress at the plaque region, which can be seen in Figure 8.
Comprehending the impact of shear stress on plaque vulnerability is crucial in preventing and managing atherosclerosis-related complications, as high shear stress levels can result in the fracture of the plaque cap, ultimately leading to thrombus formation and myocardial infarction. To this end, Figure 8 underscores the significance of evaluating and monitoring shear stress levels in patients with stenotic plaques.

3.6. Wall Shear Stress

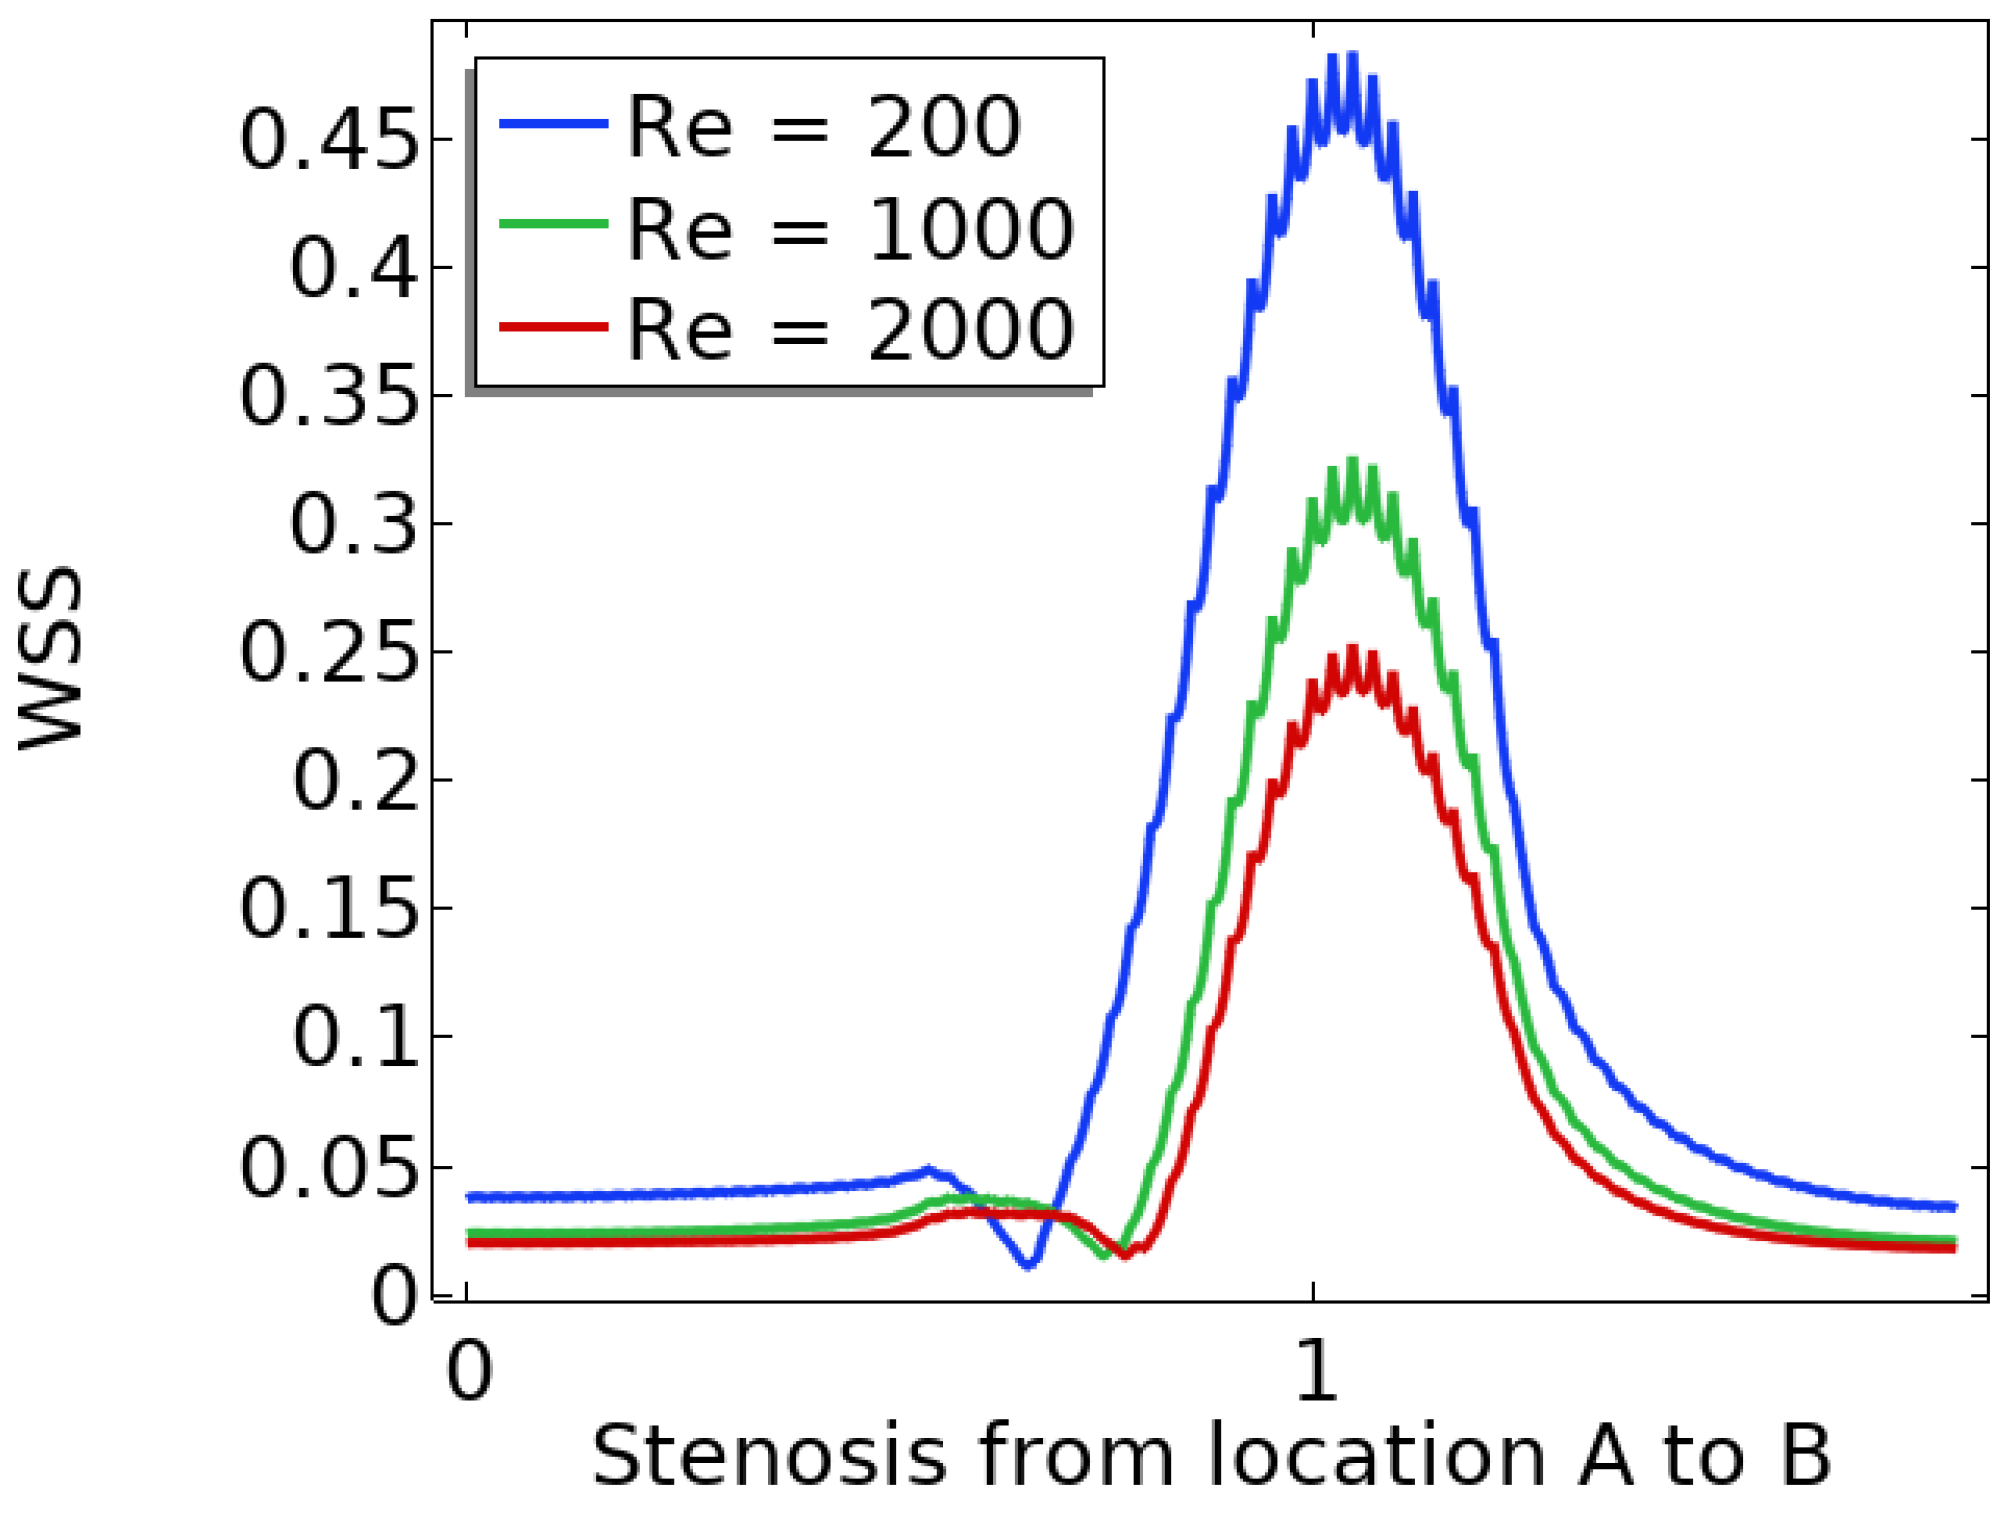
To lower the risk of atherosclerosis in stenosed arteries, it is crucial to monitor the wall shear stress (WSS) and minimize recirculation areas. Figure 9 demonstrates the behavior of WSS in stenosis at various Reynolds numbers ( R e ). The graph displays an increase in WSS magnitude as R e decreases. This suggests that decreasing R e can elevate the total WSS experienced by the stenosis, thereby reducing the likelihood of atherosclerosis in the stenosed region.
Additionally, research has shown that wall shear stress (WSS) is a critical factor in the formation and progression of atherosclerotic plaques. When WSS is low or disturbed, it can impair endothelial function and contribute to the onset of atherosclerosis. Conversely, high and uniform WSS can preserve endothelial health and prevent atherosclerosis. As such, monitoring and analyzing WSS levels can offer important information for the diagnosis and management of cardiovascular diseases.

3.7. Wall Displacement

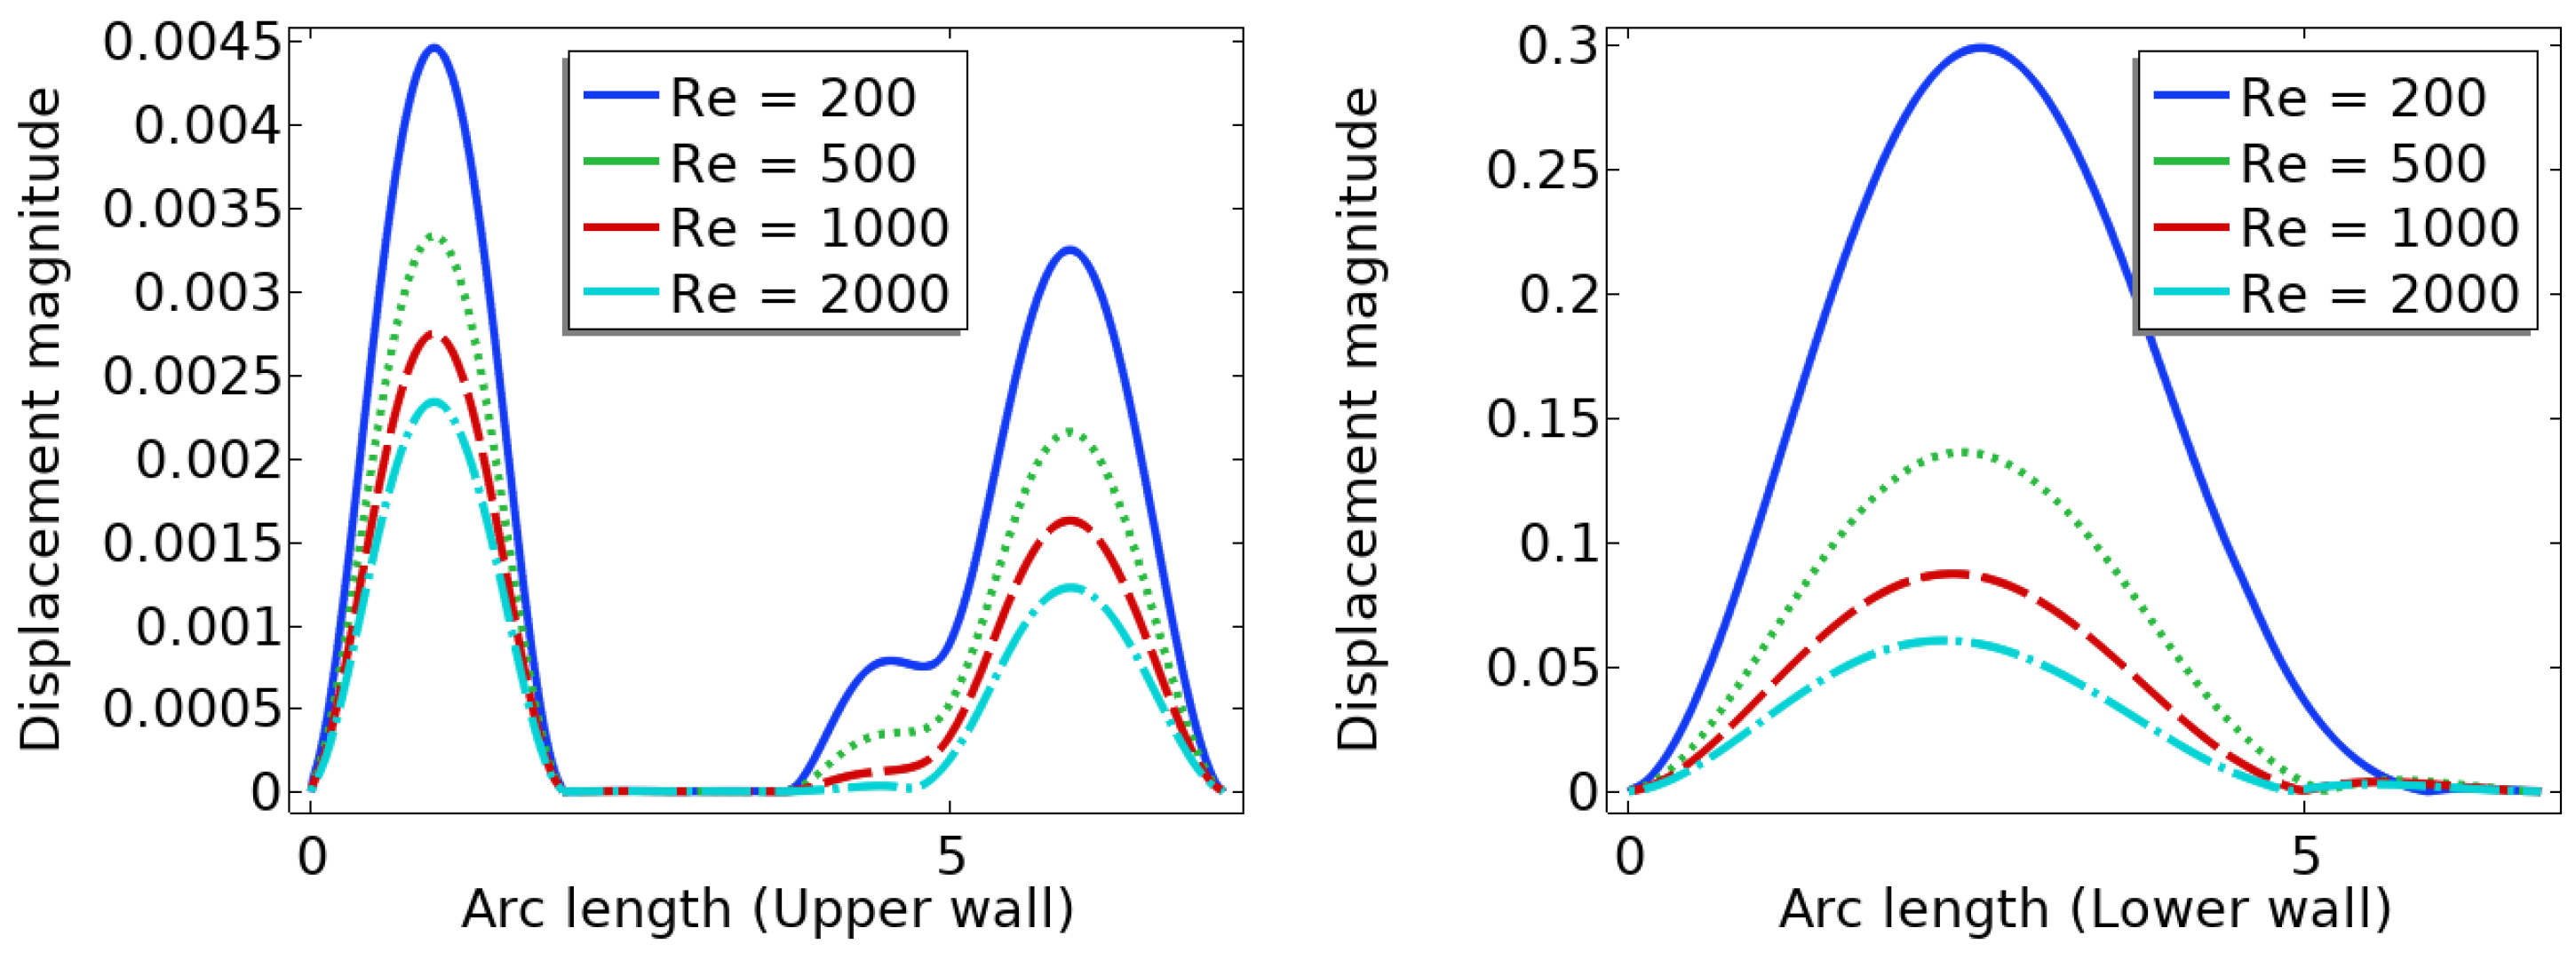
The health of an artery is significantly influenced by the deformation of its wall. Figure 10 illustrates the behavior of wall displacement, showing that the stenotic region experiences comparatively small deformation due to the difference in elastic modulus between the stenotic and non-stenotic walls. As the Reynolds number ( R e ) increases, the wall deformation decreases. It is crucial to consider arterial wall deformation in the analysis and diagnosis of cardiovascular diseases.
Observing the deformation of the arterial wall is crucial as it can impact the artery’s overall health. In Figure 10, the behavior of wall displacement is depicted, revealing a relatively minor deformation at the stenosis location due to the distinct elastic modulus between stenotic and non-stenotic walls. As the Reynolds number R e increases, the wall displacement or deformation reduces. Excessive deformation of the arterial wall can result in plaque rupture, causing further damage to the artery. Therefore, monitoring wall displacement can provide valuable insights into the artery’s overall health and act as an early warning sign for potential health issues. However, more research is needed to determine the optimal range of wall displacement for healthy arterial function.

4. Summary and Conclusion

In summary, the blood flow in a stenosed artery can significantly impact the development and progression of atherosclerosis. Key factors to observe when analyzing blood flow behavior are high shear stress and wall displacement. Shear stress caused by the high blood flow velocity in the narrowest region or cap of the plaque can cause the cap to fracture, leading to thrombosis. Wall displacement or deformation caused by different elastic modulus at the stenosis and other wall can decrease as the Reynolds number increases. Wall shear stress can also help reduce the recirculation area in a stenosed artery. As the Reynolds number decreases, the magnitude of WSS increases, reducing the chance of atherosclerosis.
The computer model and simulation results demonstrated significant changes in blood flow dynamics as it moves through the stenotic region of the artery. These changes include the expansion of the arterial wall, modifications in the velocity profiles, and the presence of blood stagnation and backflow. These changes may lead to the formation of highly dynamic energized hot spots (DEHS), leading to the development of a larger plaque, further narrowing the artery lumen. Additionally, the simulation results revealed that high shear stress at the narrowest part of the artery, located at the cap of the plaque, may cause it to rupture.
In conclusion, understanding the behavior of blood flow in a stenosed artery can aid in the prevention and treatment of atherosclerosis. Factors such as shear stress and wall displacement should be considered when analyzing the risk of atherosclerosis in a patient. Future research could focus on developing more accurate and comprehensive models of blood flow behavior in a stenosed artery, as well as investigating new methods for preventing and treating atherosclerosis.
Acknowledgments

The authors did not receive any financial support for conducting the research, writing the article, or publishing it.

Conflicts of Interest

The authors stated that they did not have any conflicts of interest related to this study.

References

  1. Owasit, P., Sriyab, S. Mathematical modeling of non-Newtonian fluid in arterial blood flow through various stenoses. Adv Differ Equ 2021, 340 (2021). [CrossRef]
  2. Muhammad Sabaruddin Ahmad Jamali and Zuhaila Ismail. “Simulation of Heat Transfer on Blood Flow through a Stenosed Bifurcated Artery”. Journal of Advanced Research in Fluid Mechanics and Thermal Sciences 60 (2019) : 310-323.
  3. B.B. Divya, G. Manjunatha , C. Rajashekhar, Hanumesh Vaidya and K.V. Prasad. “The hemodynamics of variable liquid properties on the MHD peristaltic mechanism of Jeffrey fluid with heat and mass transfer.” Alexandria Engineering Journal 59 (2020) : 693–706. [CrossRef]
  4. Tongtong Li, Xing Wang and Ivan Yotov. “Non-Newtonian and poroelastic effects in simulations of arterial flows.” physics.flu-dyn. arXiv:2010.14072. (2020).
  5. Safia Akram, S. Nadeem and Anwar Hussain. “Effects of heat and mass transfer on peristaltic flow of a Bingham fluid in the presence of inclined magnetic field and channel with different wave forms”. Journal of Magnetism and Magnetic Materials 362 (2014) : 184-192.
  6. Bourhan Tashtoush and Ahmad Magableh. “Magnetic field effect on heat transfer and fluid flow characteristics of blood flow in multi-stenosis arteries.” Heat and Mass Transfer 44 (2008) : 297–304.
  7. S.Farooq, M. IjazKhan, T.Hayata, M.Waqas and Alsaedi . “Theoretical investigation of peristalsis transport in flow of hyperbolic tangent fluid with slip effects and chemical reaction.” Journal of Molecular Liquids 285 (2019) : 314 – 322. [CrossRef]
  8. M. A. Xenos and E. E. Tzirtzilakis. “MHD Effects on Blood Flow in a Stenosis.” Advances in Dynamical Systems and Applications 8 (2013) : 427 – 437. [CrossRef]
  9. Ogulu, A., and Tamunoimi M. Abbey. "Simulation of heat transfer on an oscillatory blood flow in an indented porous artery." International communications in heat and mass transfer 32 (2005): 983-989.
  10. Santabrata Chakravarty and Subir Sen. "Dynamic response of heat and mass transfer in blood flow through stenosed bifurcated arteries." Korea-Australia Rheology Journal 17 (2005): 47-62. [CrossRef]
  11. Obdulia Ley and Taehong Kim. “Calculation of arterial wall temperature in atherosclerotic arteries: effect of pulsatile flow, arterial geometry, and plaque structure” .BioMedical Engineering OnLine 6:8 (2007) : 1-18.
  12. Mir Golam Rabby, Sumaia Parveen Shupti, Md. Mamun Molla, "Pulsatile Non-Newtonian Laminar Blood Flows through Arterial Double Stenoses", Journal of Fluids, 2014 (2014). [CrossRef]
  13. C. Y. Wang. “Heat Transfer to Blood Flow in a Small Tube.” Journal of Biomechanical Engineering, 130 (2008) : 024501-1 – 024501-3.
  14. Ju Liu, Weiguang Yang , Ingrid S. Lan and Alison L. Marsden. “Fluid-structure interaction modeling of blood flow in the pulmonary arteries using the unified continuum and variational multiscale formulation.” Mechanics Research Communications 107 (2020) : 103556-103563. [CrossRef]
  15. A.-R.A. Khaled and K. Vafai. “The role of porous media in modeling flow and heat transfer in biological tissues.” International Journal of Heat and Mass Transfer 46 (2003) : 4989–5003. [CrossRef]
  16. Palombo, Carlo, and Michaela Kozakova. "Arterial stiffness, atherosclerosis and cardiovascular risk: pathophysiologic mechanisms and emerging clinical indications." Vascular pharmacology 77 (2016): 1-7. [CrossRef]
  17. Zhang, Bo, et al. "Correlation between quantitative analysis of wall shear stress and intima-media thickness in atherosclerosis development in carotid arteries." Biomedical engineering online 16.1 (2017): 137. [CrossRef]
  18. Chinyoka, T., and O. D. Makinde. "Computational dynamics of arterial blood flow in the presence of magnetic field and thermal radiation therapy." Advances in Mathematical Physics2014 (2014). [CrossRef]
  19. Siegel, R., and M. Perlmutter. "Heat transfer for pulsating laminar duct flow." Journal of Heat Transfer 84 (1962) : 111-122. [CrossRef]
  20. David Chato. "Heat transfer to blood vessels." Journal of biomechanical engineering 102 (1980) : 110-118. [CrossRef]
  21. Xuelan Zhang , Liancun Zheng , Erhui Wang and Chang Shu. “Numerical investigations of temperature and hemodynamics in carotid arteries with and without atherosclerotic plaque during open surgery.” Journal of Thermal Biology 91 (2020) : 622-632. [CrossRef]
  22. Lokei Kok Foong , Nima Shirani, Davood Toghraie, Majid Zarringhalam and Masoud Afrand. “Numerical simulation of blood flow inside an artery under applying constant heat flux using Newtonian and non-Newtonian approaches for biomedical engineering”. Computer Methods and Programs in Biomedicine 190 (2020) : 105375-105381. [CrossRef]
  23. Razzaq, M., et al. "Numerical simulation of fluid-structure interaction with application to aneurysm hemodynamics." Technical University, Fakultat fur Mathematik (2009).
  24. Anwar, Adnan, Kaleem Iqbal, and Mudassar Razzaq. "Analysis of biomagnetic blood flow in a stenosed bifurcation artery amidst elastic walls." Physica Scripta (2021). [CrossRef]
  25. Turek, Stefan, et al. "Numerical simulation and benchmarking of a monolithic multigrid solver for fluid-structure interaction problems with application to hemodynamics." Fluid Structure Interaction II. Springer, Berlin, Heidelberg, 2011. 193-220. [CrossRef]
  26. Razzaq, M. Numerical techniques for solving fluid-structure interaction problems with applications to bio-engineering. Diss. PhD Thesis, TU Dortmund, to appear, 2009.
  27. Papanastasiou, Tasos C. "Flows of materials with yield." Journal of Rheology 31.5 (1987): 385-404. [CrossRef]
  28. Ghalambaz, Mohammad, et al. "Fluid-structure interaction study of natural convection heat transfer over a flexible oscillating fin in a square cavity." International Journal of Thermal Sciences 111 (2017): 256-273. [CrossRef]
  29. Razzaq, M., et al. "Numerical simulation of fluid-structure interaction with application to aneurysm hemodynamics." Technical University, Fakultat fur Mathematik (2009).
Figure 1. A schematic diagram of the problem and coarse mesh.
Preprints 69414 g001
Figure 2. Velocity contour maps with Reynold number Re = 200.
Preprints 69414 g002
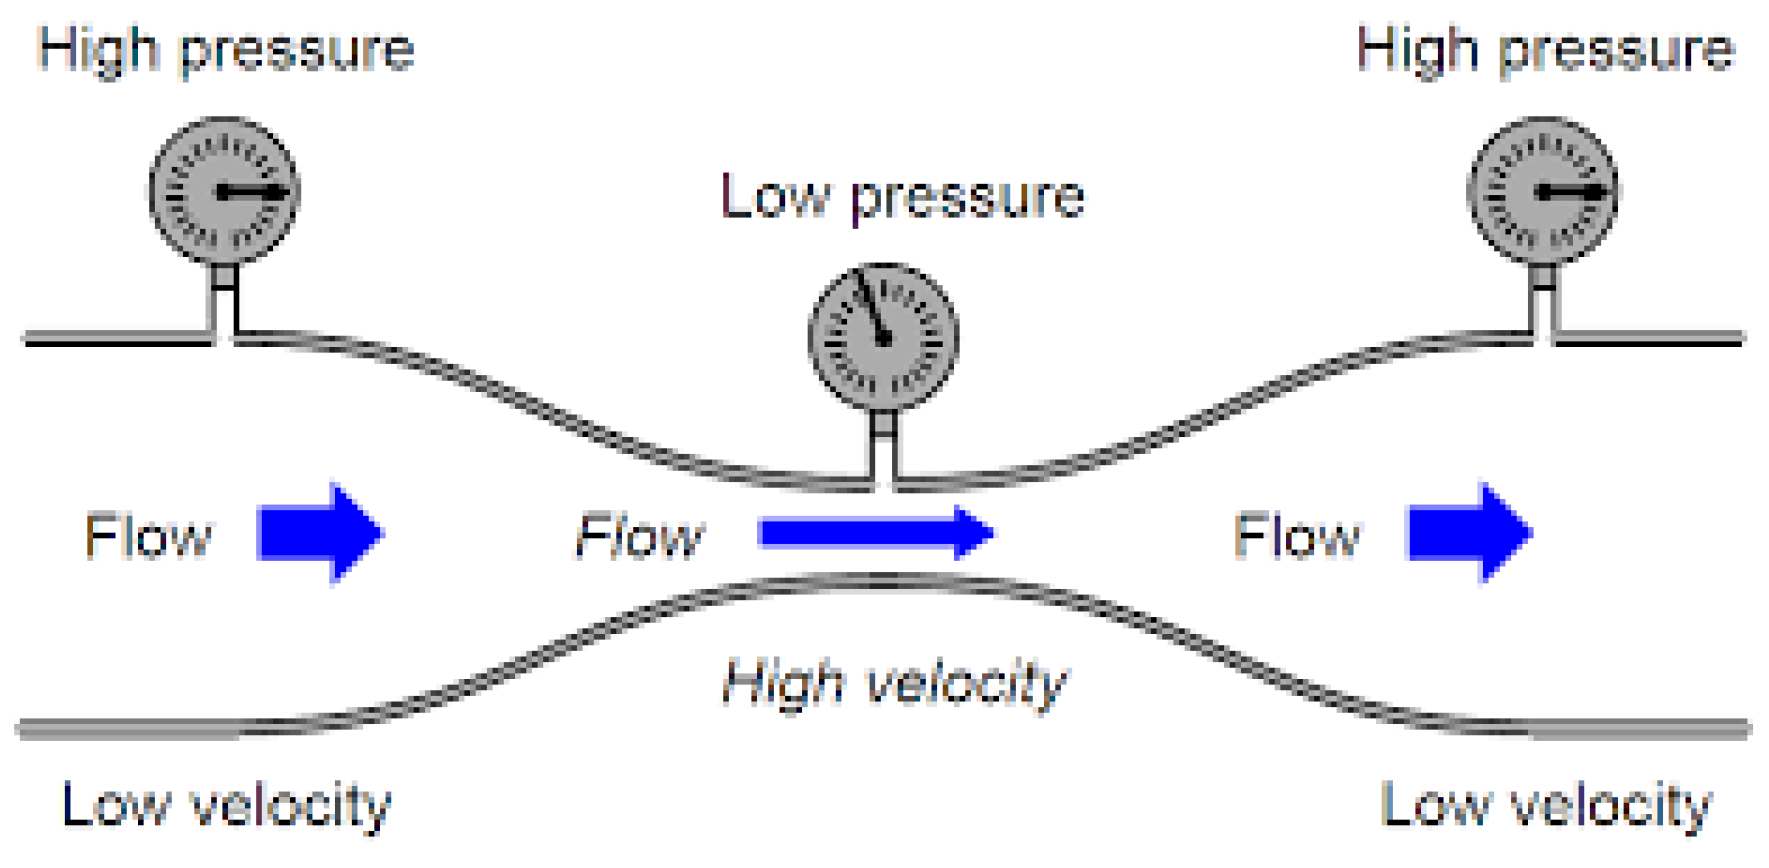
Figure 3. Low -velocity-high-pressure effect causing the arterial wall to expand.
Preprints 69414 g003
Figure 4. Normalized and actual velocity-vector results showing blood backflow in the trailing end of the plaque.
Preprints 69414 g004
Figure 5. R e = 2000 lower wall deformation is very small due to high velocity and low normal pressure.
Preprints 69414 g005
Figure 6. With R e = 2000 the stagnation region has grown significantly.
Preprints 69414 g006
Figure 7. Higher magnified region of the trailing end of the artery where there is significant backflow.
Preprints 69414 g007
Figure 8. High shear stress can result in the fracture of the cap of the plaque.
Preprints 69414 g008
Figure 9. Total wall shear stress experienced by the stenosis from A to B.
Preprints 69414 g009
Figure 10. Total displacement of the upper wall.
Preprints 69414 g010
Disclaimer/Publisher’s Note: The statements, opinions and data contained in all publications are solely those of the individual author(s) and contributor(s) and not of MDPI and/or the editor(s). MDPI and/or the editor(s) disclaim responsibility for any injury to people or property resulting from any ideas, methods, instructions or products referred to in the content.
Copyright: This open access article is published under a Creative Commons CC BY 4.0 license, which permit the free download, distribution, and reuse, provided that the author and preprint are cited in any reuse.
Prerpints.org logo

Preprints.org is a free preprint server supported by MDPI in Basel, Switzerland.

Subscribe

© 2024 MDPI (Basel, Switzerland) unless otherwise stated