Preprint
Article

Characteristic Analysis and Structural Design of Photonic Crystal Fibers for Gas Sensing Applications

Altmetrics

Downloads

180

Views

41

Comments

0

This version is not peer-reviewed

Submitted:

06 March 2023

Posted:

07 March 2023

You are already at the latest version

Alerts
Abstract
A total internal reflection photonic crystal fiber (PCF) based on hexagonal core is proposed for gas sensing in a specific wavelength range. The higher sensitivity and lower confinement loss were realized by the structure of the proposed PCF consists of two layers with circular holes rotated hexagonally around a core region and six slotted air-hole in the cladding based on numerical analysis. The simulation results show that the enhancement of the relative sensitivity has been done by enhancing the diameter of the hexagonal shape air-hole cladding (d1) and the hexagonal arranged holes around the central solid core (d0) in this design. Also, the confinement loss has been reduced by enhancing the ratio of length to width of slotted holes (l/w) and decreasing the cladding air-hole diameters (d1). As the refractive index increases, the wavelength shifts toward the long wavelength. And in a certain temperature range, the transmission characteristics of the device does not change with the temperature. The results are helpful for designing high performance PCF for gas sensing applications.
Keywords: 
Subject: Physical Sciences  -   Optics and Photonics

1. Introduction

Photonic crystal fibers (PCFs) are composed of periodic or random holes. [1,2]. PCFs not only overcomes the shortcomings of traditional optical fiber, but also has some special characteristics [3]. Excellent light guiding characteristics can be achieved through some special structures, such as elliptical [4], hexagonal [5], octagonal [6], spiral [7] and circular cladding [8,9,10]. By controlling the size and spacing of holes, excellent characteristics can be fulfilled, such as strong confinement field [11], improved sensitivity [12], low confinement loss [13], ultra-flattened dispersion [14,15], higher birefringence [16], and enhanced nonlinear effects [17]. Sensors-based PCF with their unique properties brings some new opportunities to the multi-purpose sensors such as pressure sensors [18], refractive index sensors [19], biosensors [20] and chemical sensors [21]. According to the different light guiding mechanism, PCFs can be classified into two types, namely, refractive index guided photonic crystal fiber (IG-PCF) [5] and photonic band gap photonic crystal fiber (PBG-PCF) [22]. For PBG-PCFs, it uses the photonic band gap effect to make light propagate in the air hole of PCF instead of in the quartz, so the sensitivity is significant. But it can only transmit light in a certain frequency range and need for strict requirements in the shape and arrangement of air holes to form a forbidden band in the cladding [23,24,25]. IG-PCFs is considered as a potential candidate to settle these problems. It just has to meet the numerical conditions of refractive index in total internal reflection, which is relatively easy to implement. By changing the shape, size, spacing and arrangement of hollow pores in PCFs, the special function PCFs with different requirements can be realized. But the low sensitivity of this fiber can be determined by the poor interaction between light in the cladding and the gas into the holes [26].
Several designs of hexagonal PCFs with air core were proposed in [2,12,25,27,28,29,30], which were able to overcome the limitations of PBG-PCF and IG-PCF. Zhang et al. [27] shown that IG-PCFs with hollow core greatly improves the gas sensitivity compared with the traditional PCFs. Soon after, Hoo et al. [28] performed a core PCF with depressed refractive index, where the relative sensitivity and normalized effective mode area were improved by more than 3700% (from 0.0065 to 0.25) and 680% (from 3.85 to 30), respectively. In 2011, Park et al. [25] proposed a new index-oriented PCF in which a hollow high-index ring defect was embedded, which consisted of a central air hole surrounded by a high-index GeO2-doped SiO2 glass ring. This PCF with optimal parameters provided a high relative sensitivity of 5.09% significantly, and a low confinement loss of 1.25 × 10⁻² dB/cm at λ = 1.5 μm. Monir et al. [2] obtained a new PCF structure with four non-circular air holes around a hollow high index GeO2-doped silica ring in 2015. The enhancement of the relative sensitivity is more than 27.58% (0.1323 to 0.1688) at the wavelength λ = 1.33μm that is the absorption line of methane ( C H 4 ) and hydrogen fluoride ( H F ) gases. In 2016, Asaduzzaman et al. [29] improved the relative sensitivity to 48.26% using a highly sensitive gas sensor based on slotted-core PCF. In 2018, Shadidul Islam et al. [30] presented a rhombic shape core PCF structure. The sensor achieves sensing responses of 69.70% for the targeted analytes ethanol. Although their design has improved the relative sensitivity and limiting loss of optical fiber to some extent, it cannot show its value in practical gas sensing applications.
In this article, a hexagonal microstructure core is introduced in place of the central air core of PCFs to achieve a higher relative sensitivity for gas sensing. This is because the appearance of hexagonal core can be used to transmit gas and limit the transmission of light in the core, which will further increase the interaction between light and gas and improve the gas sensing performance. At the same time, we further simulate the changes of light transmittance and light field in optical fiber under different backgrounds, which provides certain guiding significance for the practical application of PCF.

2. Structures of the proposed HSC-PCF

Figure 1 shows the cross section of the proposed PCF, which contains four air hole rings and six slotted air holes in the cladding and two layers of hexagonal microstructure cores. The innermost part of PCF is solid core around two layers of hexagonal microstructure air-hole in Figure 1b. There are 18 and 24 holes in the first and second layers, respectively. In Figure 1a, the part outside the central core of an optical fiber is its cladding region. Four layered air holes and six slotted air holes in this area are used as dielectrics to reduce leakage loss or commonly called confinement loss. In the proposed design, the angular displacement of two adjacent air holes in the cladding and core regions is maintained at 60 deg to form a hexagonal structure. In our PCF, the diameter of the central holes, cladding holes, length and width of slotted holes are respectively denoted as d0, d1, l, w. Also, pitches in the microstructure core and microstructure cladding are defined by Ʌ0, Ʌ1. In [12], it was shown that using circular lattice air holes in the core area and hexagonal lattice air holes in the cladding region achieve significantly higher sensitivity. We use hexagonal lattice air holes instead of circular lattice air holes to improve the relative sensitivity. Beside this, for proper taking pure silica as the base material, it is necessary to fit the refractive index distribution by Sellmeier equation in FDTD simulation to improve the simulation accuracy [31].

3. Related theories and principles

3.1. The introduction of FDTD simulation

The simulation software used in this paper is Ansys Lumerical FDTD. FDTD method using Yee-mesh-based finite difference algorithms is properly used in the full-vector modes solution of optical waveguide to achieve higher numerical accuracy [32,33]. The finite difference eigenmode solver of MODE in the related module is used to analyze its mode. Firstly, the setting of PML is an extremely important factor. The purpose of PML boundary is to absorb all incident radiation leaving the photonic crystal (PC) cavity. It is possible to absorb the non-propagating local evanescent fields existing in the PC cavity when the boundary is next to the PC cavity. A simple rule can be followed, that is, the upper and lower sides of the structure should keep a distance of at least half a wavelength. The second factor to pay attention to is grid accuracy. Generally speaking, the grid with λ/10 will have reliable accuracy, while there are fourteen grids in each period in the X direction in Figure 2, and we can get the grid size of 1533 nm ÷ 20 = 76.65 nm (<λ/10). The grid in Y direction will be smaller than that in X direction due to the lattice constant in Y direction is 1533×sin (60) nm. In this way, more reliable accuracy can be obtained.

3.2. Principles and formulas

Although the hollow holes in PCF cladding have the ability to limit light, some energy still inevitably leaks into the cladding when light waves propagate, which is called limiting loss. The confinement loss can be calculated by the following formula, namely [5,34,35].
L c = 8.686 × K 0 I m n e f f ,
where K 0 ( = 2 π λ ,   λ   i s   t h e   w a v e l e n g t h ) is the wave number in vacuum, and Im[neff] is the imaginary part of the effective refractive index of the corresponding mode of the optical fiber. The theoretical results show that increasing the number of air holes and the duty ratio of air holes can greatly reduce the confinement loss of optical fiber [25,36,37]. This is because the increase of the number of air holes and the duty ratio of air holes can both reduce the equivalent refractive index of cladding, thus increasing the difference of equivalent refractive index between core and cladding. For IG-PCF, the increase of the equivalent refractive index difference between the core and the cladding can increase the binding ability of the end face of the fiber structure to light waves, thus effectively reducing the confinement loss of the fiber.
Compared with traditional sensors, PCF sensors have the characteristics of anti-electromagnetic interference, electrical insulation, corrosion resistance, good light guiding performance, high sensitivity, light weight, small size, etc. They are easy to form an optical fiber sensor network and can be connected to the Internet and wireless networks. The performance of the PCF sensors can be improved by increasing the relative sensitivity of the sensors, which also contributes to the absorption of molecules such as acetylene. Each gas has its own absorption line at a particular wavelength. Table 1 shows the absorption wavelength and line strength of some gases [2,12].
The absorption of gas samples can be expressed by the Beer-Lambert law. r is the relative sensitivity coefficient that defined as [5]
r = n s R e [ n e f f ]   f ,
where ns is the refractive index of gas, it almost equals 1, Re[neff] is the real part of effective mode index, and f is the fraction of the total power located in the holes (that is, transmittance) that defined as [5]
f = h o l e s   ( E x H y E y H x ) d x d y t o t a l   ( E x H y E y H x ) d x d y   ,
Here Ex, Ey, and Hx, Hy are the transverse electric and magnetic fields of the modes, respectively.

4. Effect of parameters

4.1. Fundamental optical field distribution of proposed HSC-PCF

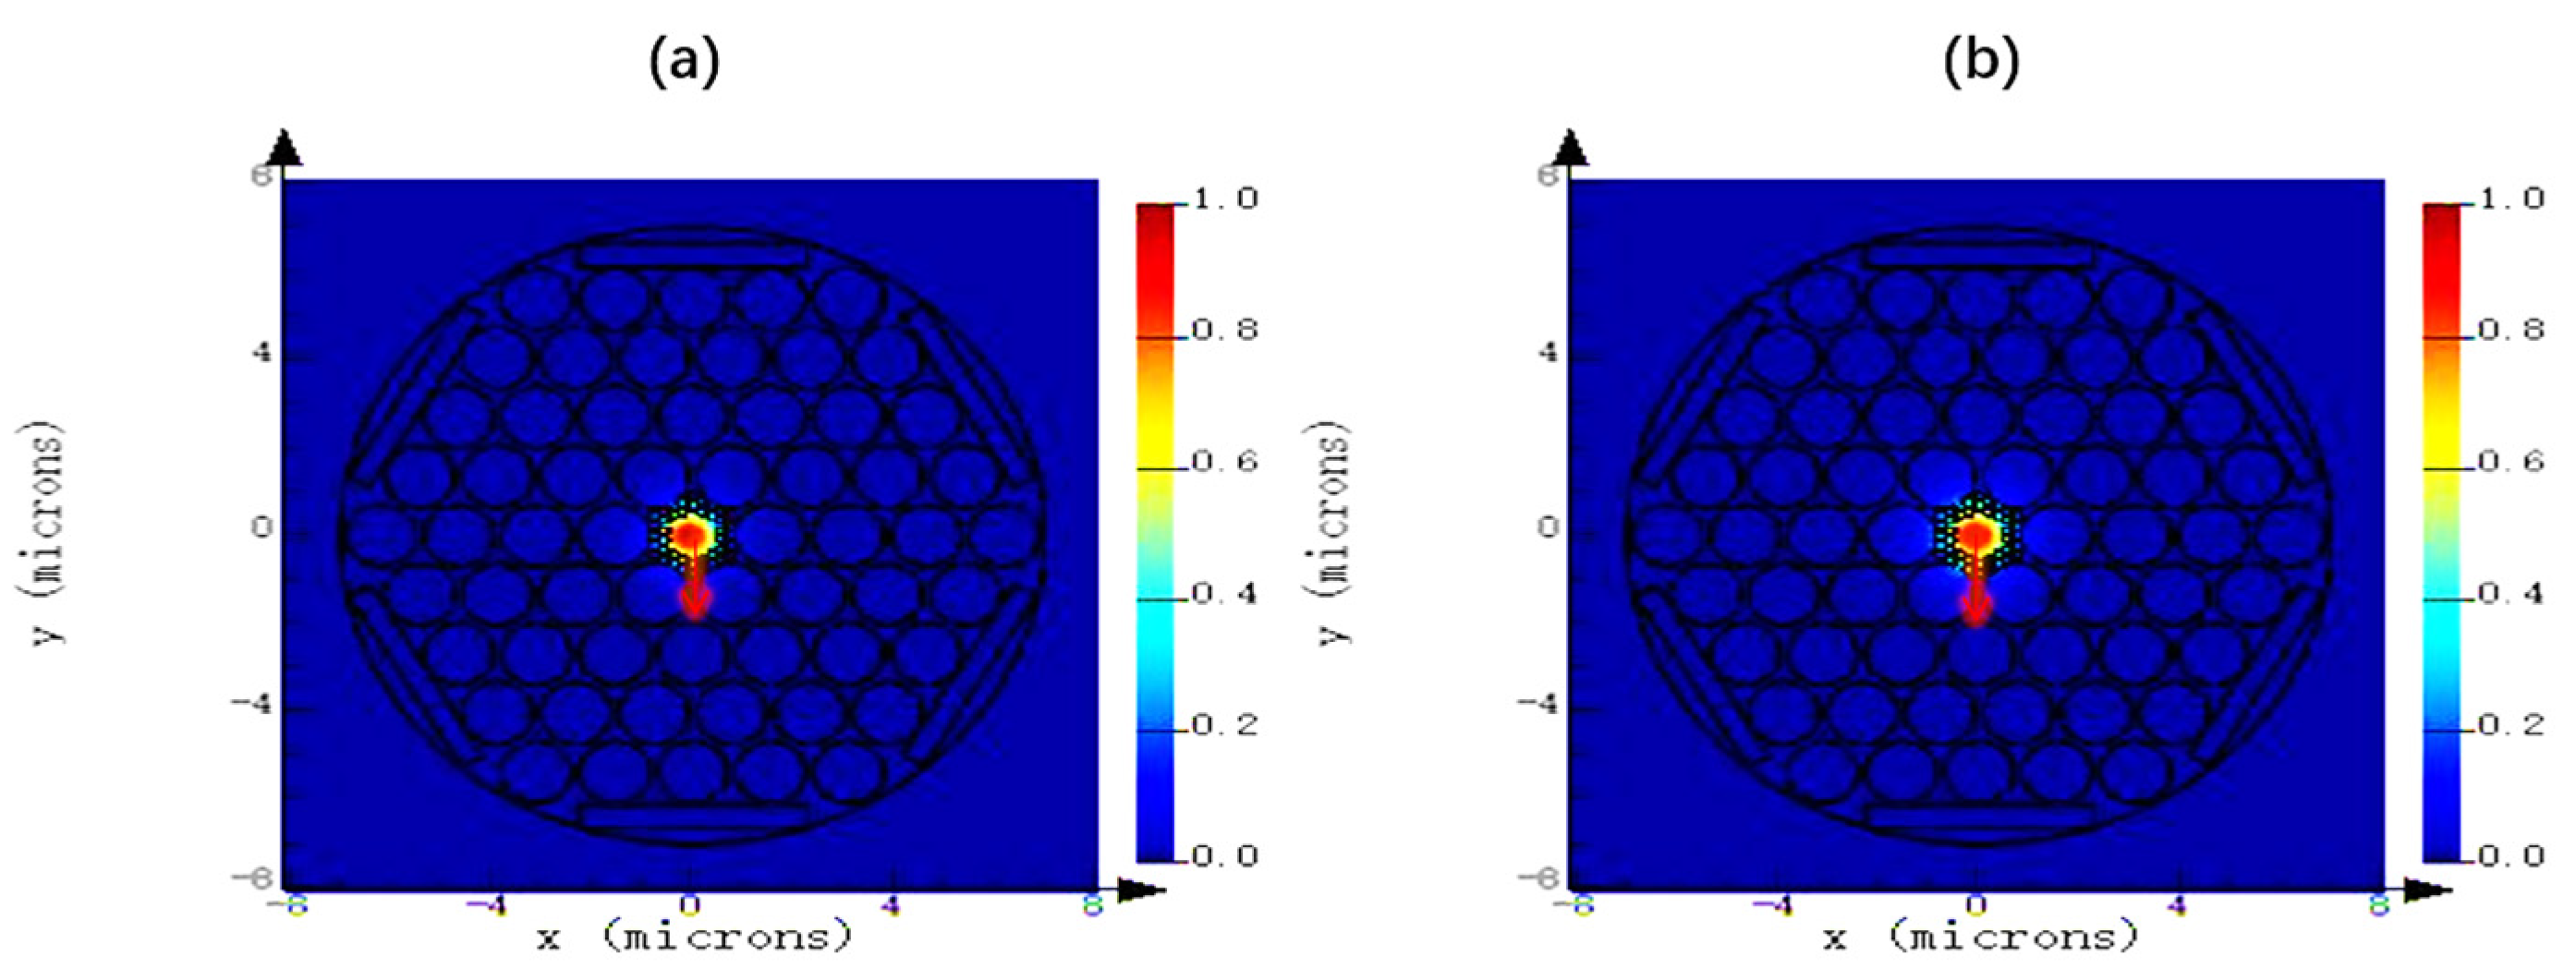
In this article, we focus on methane and acetylene gases as target to be measured, and the absorption line of the two gases are 1.33 μm and 1.533 μm [12]. Figure 3 shows fundamental optical field distribution of proposed HSC-PCF for y polarization at the operating wavelength of 1.33μm and 1.533 μm. The red arrow in the Figure 3 indicates the polarization direction of the electric field at the corresponding wavelength. It is clearly viewed that the energy is tightly bound in the core area of the fiber, which is helps to increase the sensitivity. From the perspective of wave optics, the light guiding principle of this kind of fiber can be interpreted as that light always tends to exist in high refractive index materials, that is, refractive index light guiding.

4.2. Variation of the confinement loss and the relative sensitivity with wavelength for different values of d1, d0 and l/w

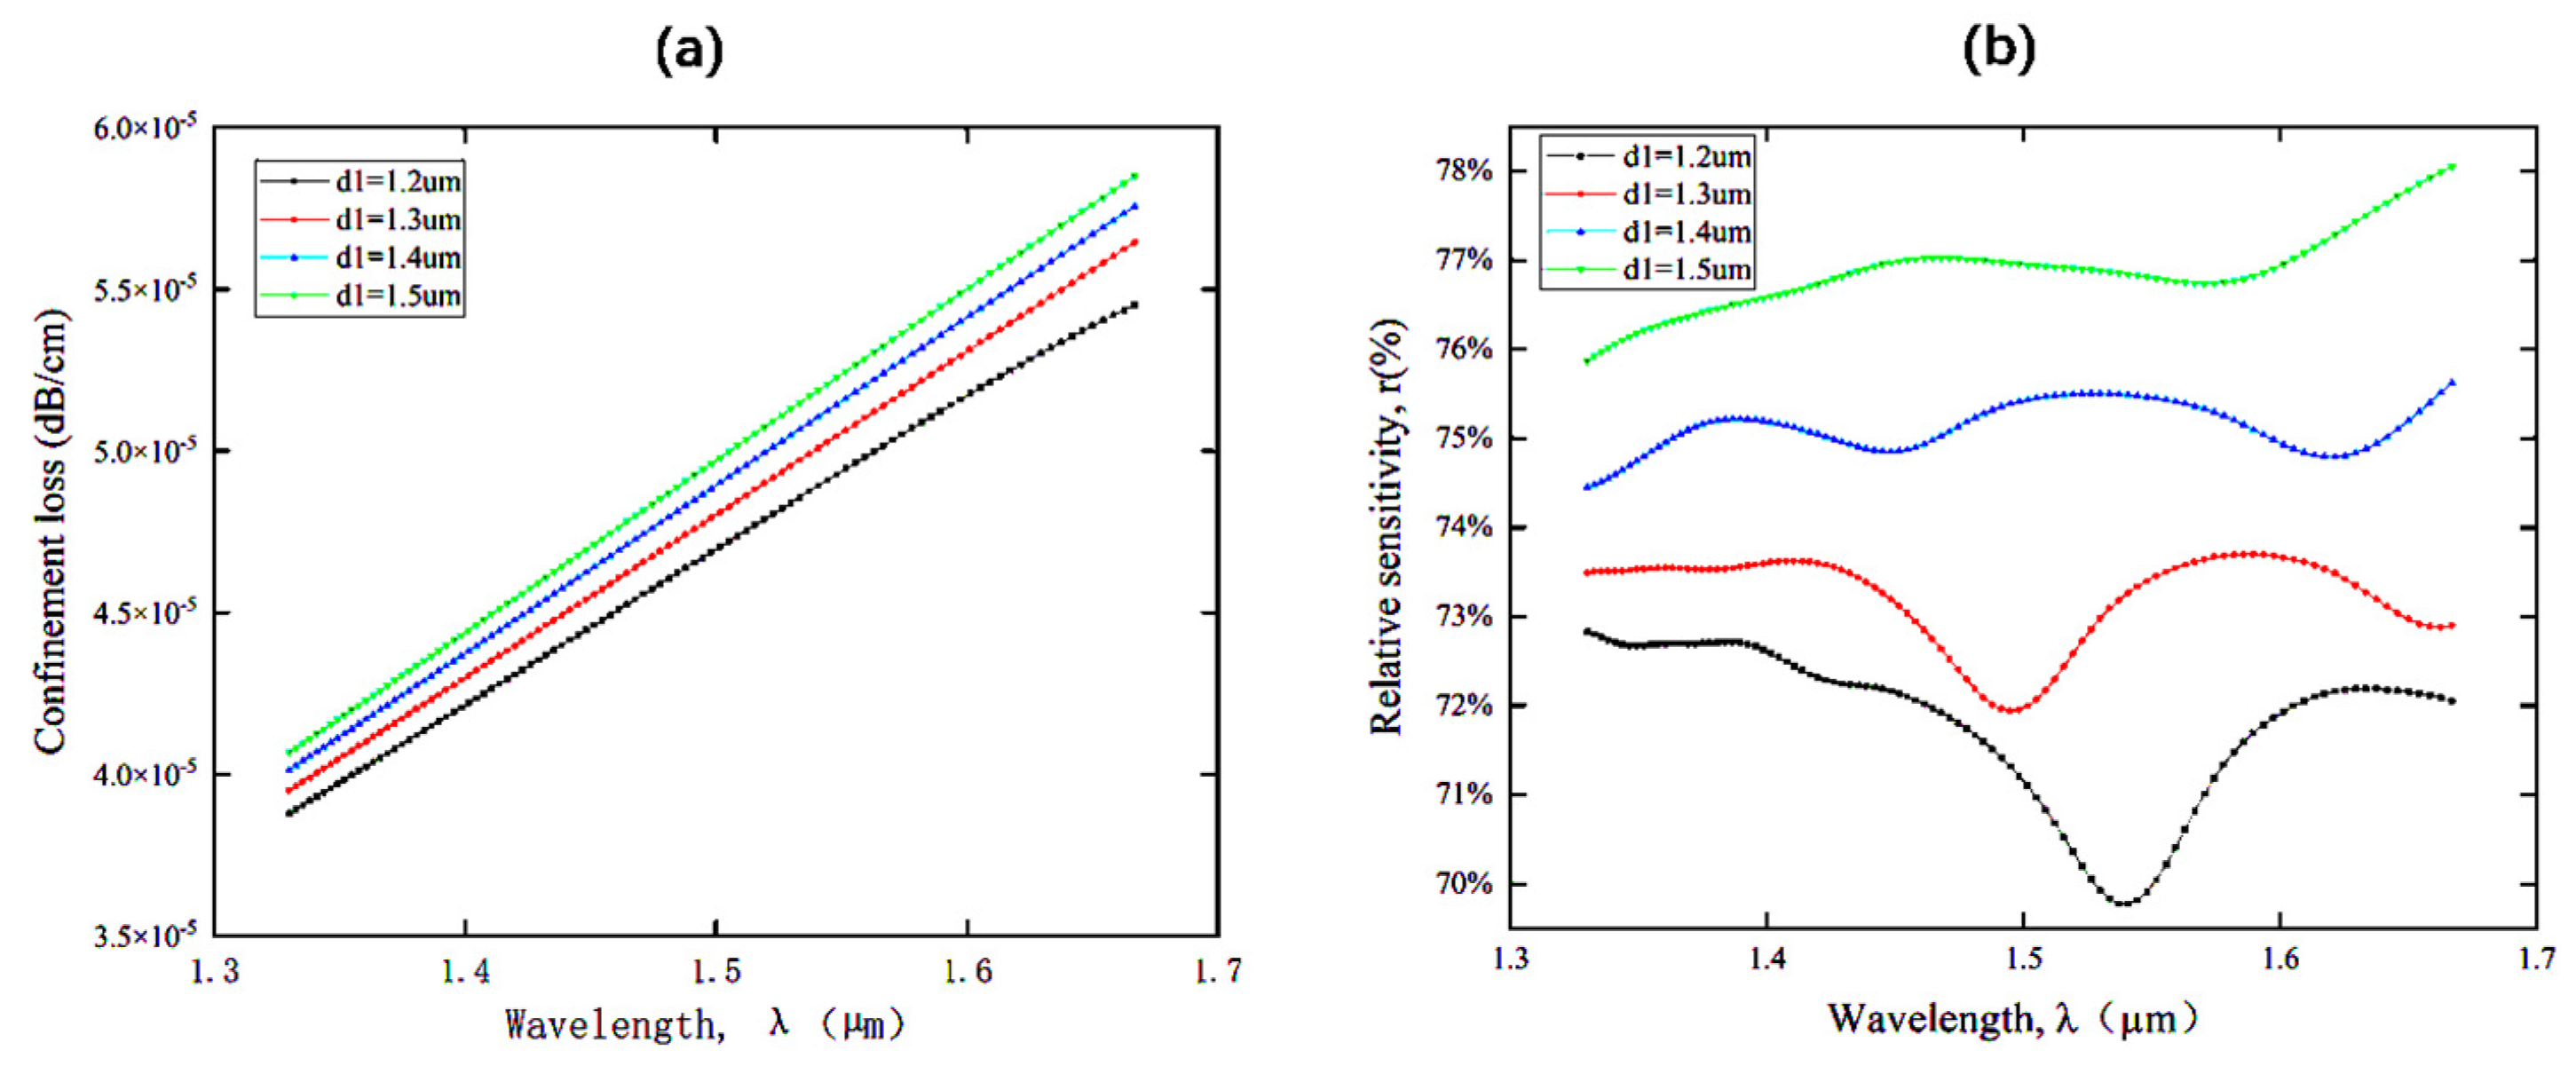
Figure 4 shows the relative sensitivity and confinement loss curves of the relevant parameters of the proposed structure and the comparison between the results. The original value of the proposed design is d0 = 0.16 μm, d1 = 1.4 μm, l = 4.5 μm, w = 0.5 μm, Λ0 = 0.22 μm, and Λ1 = 1.55 μm. It can be seen from the figure that both the confinement loss and the relative sensitivity increase with the cladding air hole diameter (d1). Generally speaking, with the increase of cladding holes diameter, the confinement loss of optical fiber will decrease. However, when the air hole diameter in the cladding compared with the core diameter of the fiber is too large, a large part of optical energy will leak into the cladding, which will greatly increase the confinement loss. With the increase of air hole diameter in cladding, the equivalent refractive index of fiber will also decrease. It can be seen that f will also increase with the increase of the diameter of air holes in the cladding from the definition of f [5]. From equations (2) and (3), we can see the relationship between the relative sensitivity and the effective refractive index and f, so the relative sensitivity will increase accordingly. Hence, d1 is varied by 1.2μm, 1.3μm, 1.4μm, and 1.5μm, the relative sensitivities are 69.83%, 73.09%, 75.50% and 76.87% and confinement losses are 4.86 × 10⁻⁵ dB/cm, 4.97 × 10⁻⁵ dB/cm, 5.07 × 10⁻⁵ dB/cm, and 5.15 × 10⁻⁵ dB/cm at the wavelength of 1.533μm (i. e. acetylene absorption wavelength), respectively. Also, the computed relative sensitivity at λ = 1.33 μm (i. e. methane absorption wavelength) is 72.83%, 73.50%, 74.45%, and 75.87%, respectively. The confinement loss of the fiber is 3.88 × 10⁻⁵, 3.95 × 10⁻⁵, 4.01 × 10⁻⁵, and 4.07 × 10⁻⁵ dB∕cm, respectively. It can be seen from Figure 4a that the confinement loss is strongly dependent on the wavelength, which can be verified from Equation (1). When d1 is kept constant, the relative sensitivity of the proposed structure does not increase linearly with the increase of wavelength in Figure 4b. This is due to the relationship between relative sensitivity and f in equation (2), and the fluctuation of relative sensitivity is due to the selectivity of the proposed structure to wavelength, that is, the structure has good transmittance for a specific wavelength. Therefore, the relative sensitivity relative to wavelength shows a special relationship as shown in Figure 4b. We can use this feature to detect gases that have strong absorption lines at specific wavelengths. It can be seen from the picture that when d1 = 1.5 um, the fiber has the maximum sensitivity and the maximum confinement loss. At the same time, when the air holes in the cladding are large and the hole spacing is small, it is not easy to manufacture PCFs, that is, it is easy to cause hole collapse. Considering comprehensively, we choose d1 = 1.4 μm as the optimization parameter of this step.
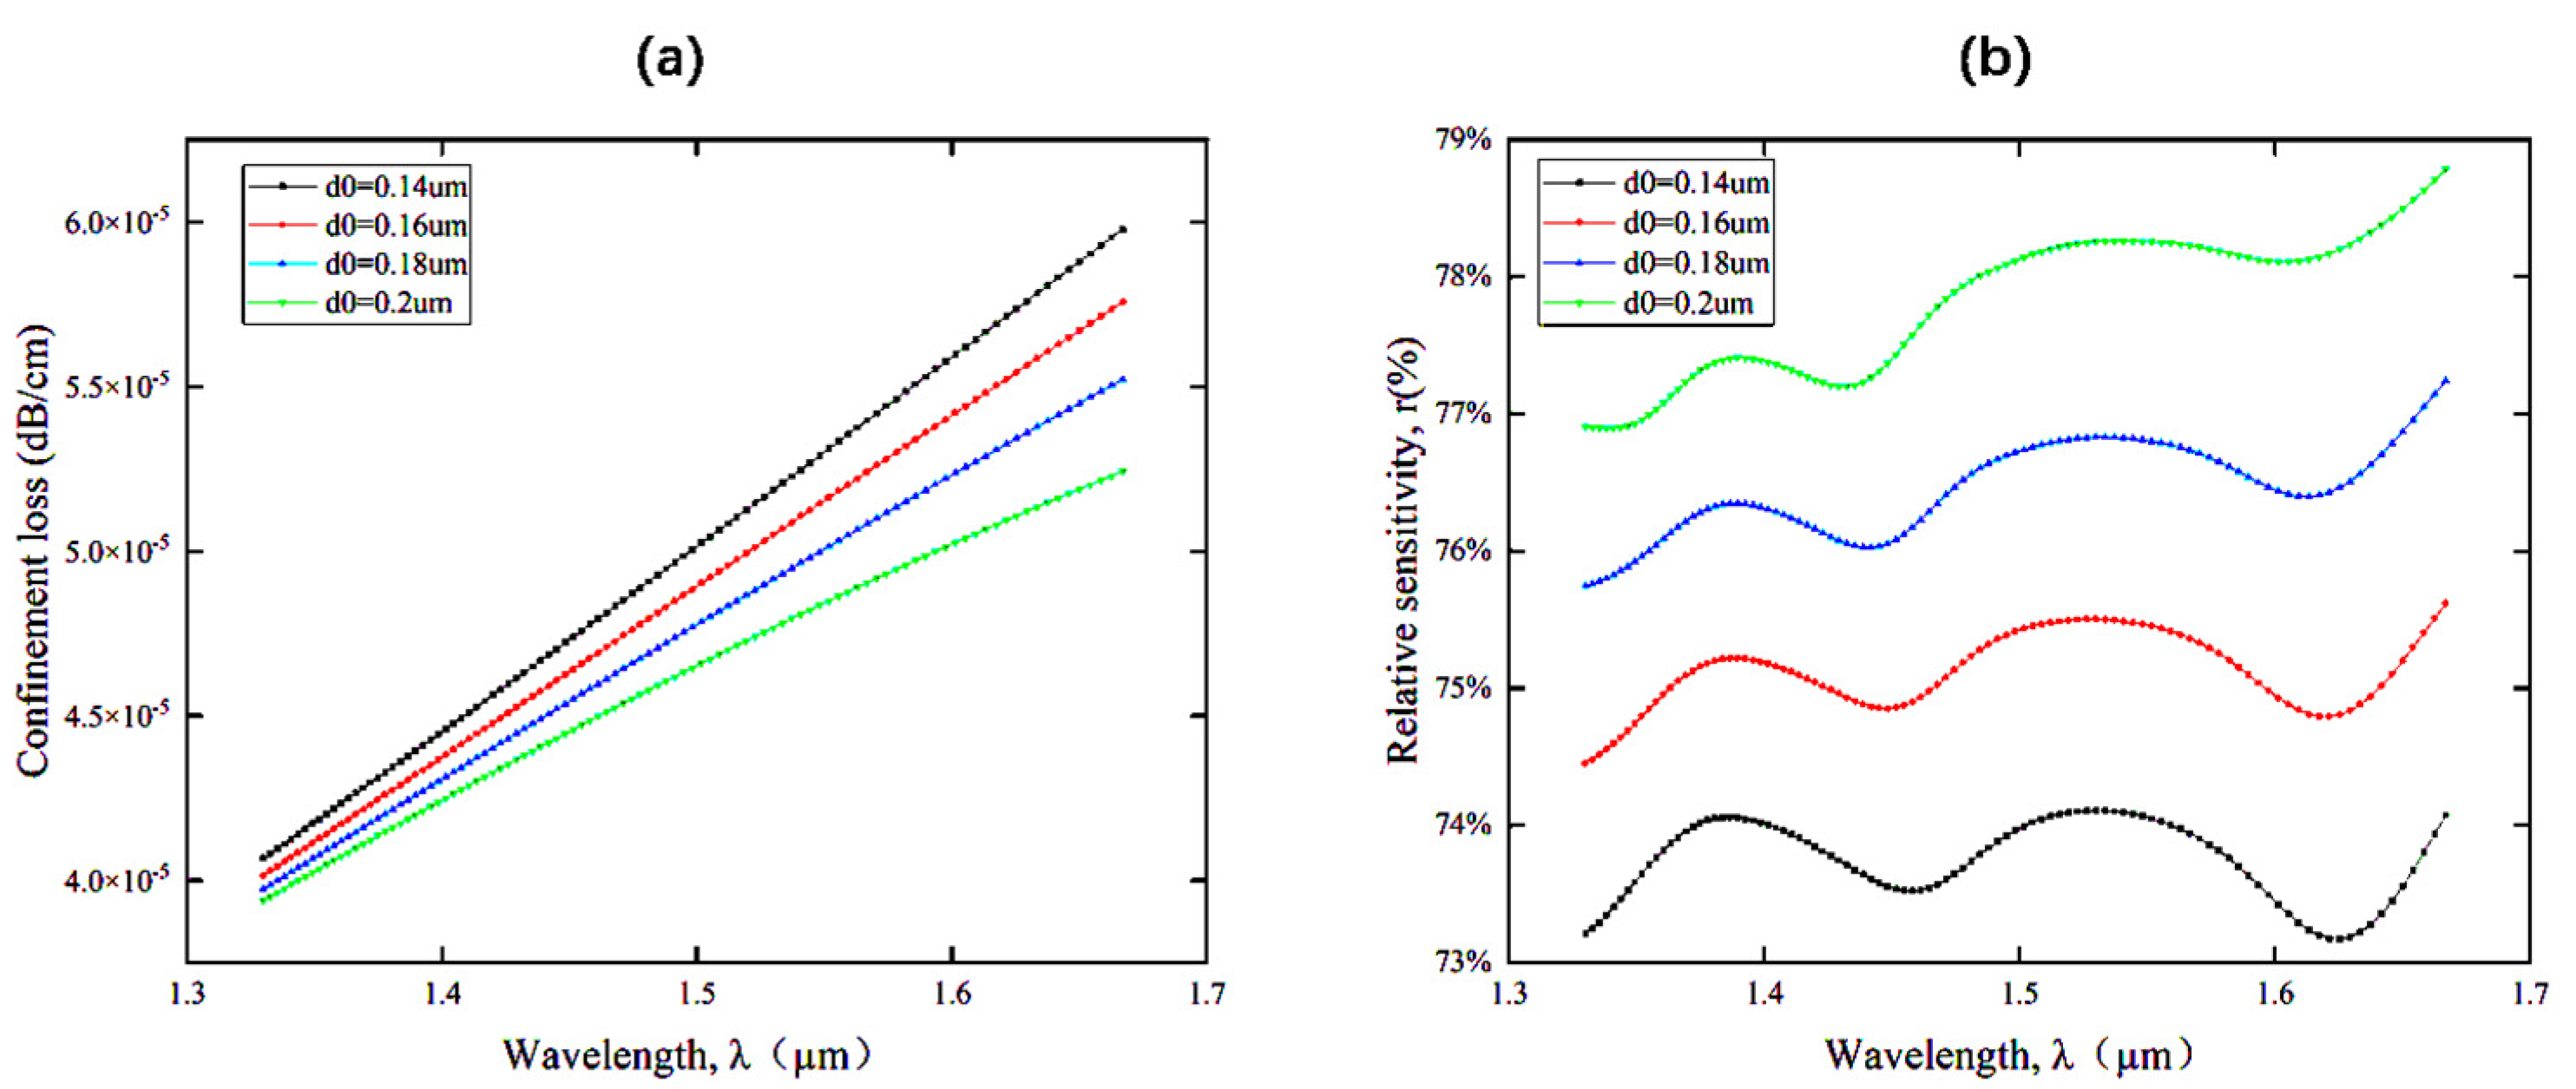
Figure 5 reveals the effect of d0 on the relative sensitivity and confinement loss, while other parameters are kept constant. Enhancing the size of air hole around the solid core (d0) can simultaneously improve the relative sensitivity and confinement loss of the optical fiber sensor. With the size of the central air-hole increases, the interaction between the detection gas and light can be enhanced, but the effective refractive index difference between the core region and the cladding region will enlarge the confinement loss [5,38]. However, with the increase of d0, the difference of refractive index between the cladding and the core increases, which will further increase the confinement ability of the core to light, thus further reducing the confinement loss. Because d0 increases, the light entering the hole increases, thus further increasing the transmittance f and increasing the relative sensitivity. So, the relative sensitivities for d0 values of 0.14 μm, 0.16 μm, 0.18 μm and 0.2 μm are 74.11%, 75.50%, 76.83% and 78.26% and confinement losses are 5.21 × 10⁻⁵ dB/cm, 5.07 × 10⁻⁵ dB/cm, 4.93 × 10⁻⁵ dB/cm and 4.78 × 10⁻⁵ dB/cm at λ = 1.533 μm (i. e. acetylene absorption wavelength). With these d0 values, the relative sensitivities at wavelength of 1.33μm (i. e. methane absorption wavelength) respectively are 73.21%, 74.45%, 75.75%, 76.91% and confinement loss is slightly varied as 4.07 × 10⁻⁵ dB/cm, 4.01 × 10⁻⁵ dB/cm, 3.97 × 10⁻⁵ dB/cm and 3.94 × 10⁻⁵ dB/cm, respectively. It can take the easy choice of d0 = 1.2um as an optimal parameter.
Figure 6 illustrates the effect of l/w on the relative sensitivity and confinement loss when other parameters, d0 = 0.2 μm, d1 = 1.4 μm, Λ0 = 0.22 μm, and Λ1 = 1.55 μm, are kept constant in this PCF. Now, l/w is changed by 7, 8, 9, and 10. When the l/w becomes smaller, the refractive index difference between the cladding and the core will be reduced, which will weaken the confinement ability of the core to light and increase the confinement loss. Among them, when l/w = 7, the curve fluctuation of confinement loss is related to the change of imaginary part of refractive index, but obviously, this has little influence on confinement loss because its magnitude is relatively small. As can be seen from Figure 6b, the change of l/w has little effect on the relative sensitivity. This is because the slotted holes are located at the outermost periphery of the cladding, and the energy of light propagating in it is very little. So, the relative sensitivity at the wavelength of 1.533μm for this HSC-PCF equals to 78.25%, 78.26%, 78.26% and 78.25% also the confinement loss is 5.26 × 10⁻⁵ dB/cm, 4.78 × 10⁻⁵ dB/cm, 4.78 × 10⁻⁵ dB/cm and 4.78 × 10⁻⁵ dB/cm. For λ = 1.33 μm, the evaluated relative sensitivities are 76.91%, 76.90%, 76.91%, and 76.93%, respectively. The limiting loss of optical fibers are all 3.94 × 10⁻⁵ dB/cm. After completing the optimization design of the proposed HSC-PCF structure, the impact of parameters observed.
Based on the all-sided consideration, to act as a highly sensitive fiber with lower confinement loss, the design parameter of the proposed PCF is found as d0 = 0.2 μm, d1 = 1.4 μm, l/w = 9, Λ0 = 0.22 μm, and Λ1 = 1.55 μm, at which the relative sensitivity coefficient is improved to 78.26% and 76.91% and also confinement loss is 4.78 × 10⁻⁵ dB/cm and 3.94 × 10⁻⁵ dB/cm at the wavelength of 1.533μm (i. e. acetylene absorption wavelength) and 1.33μm (i. e. methane absorption wavelength).

5. Characteristic analysis

5.1. Gas sensing characteristics

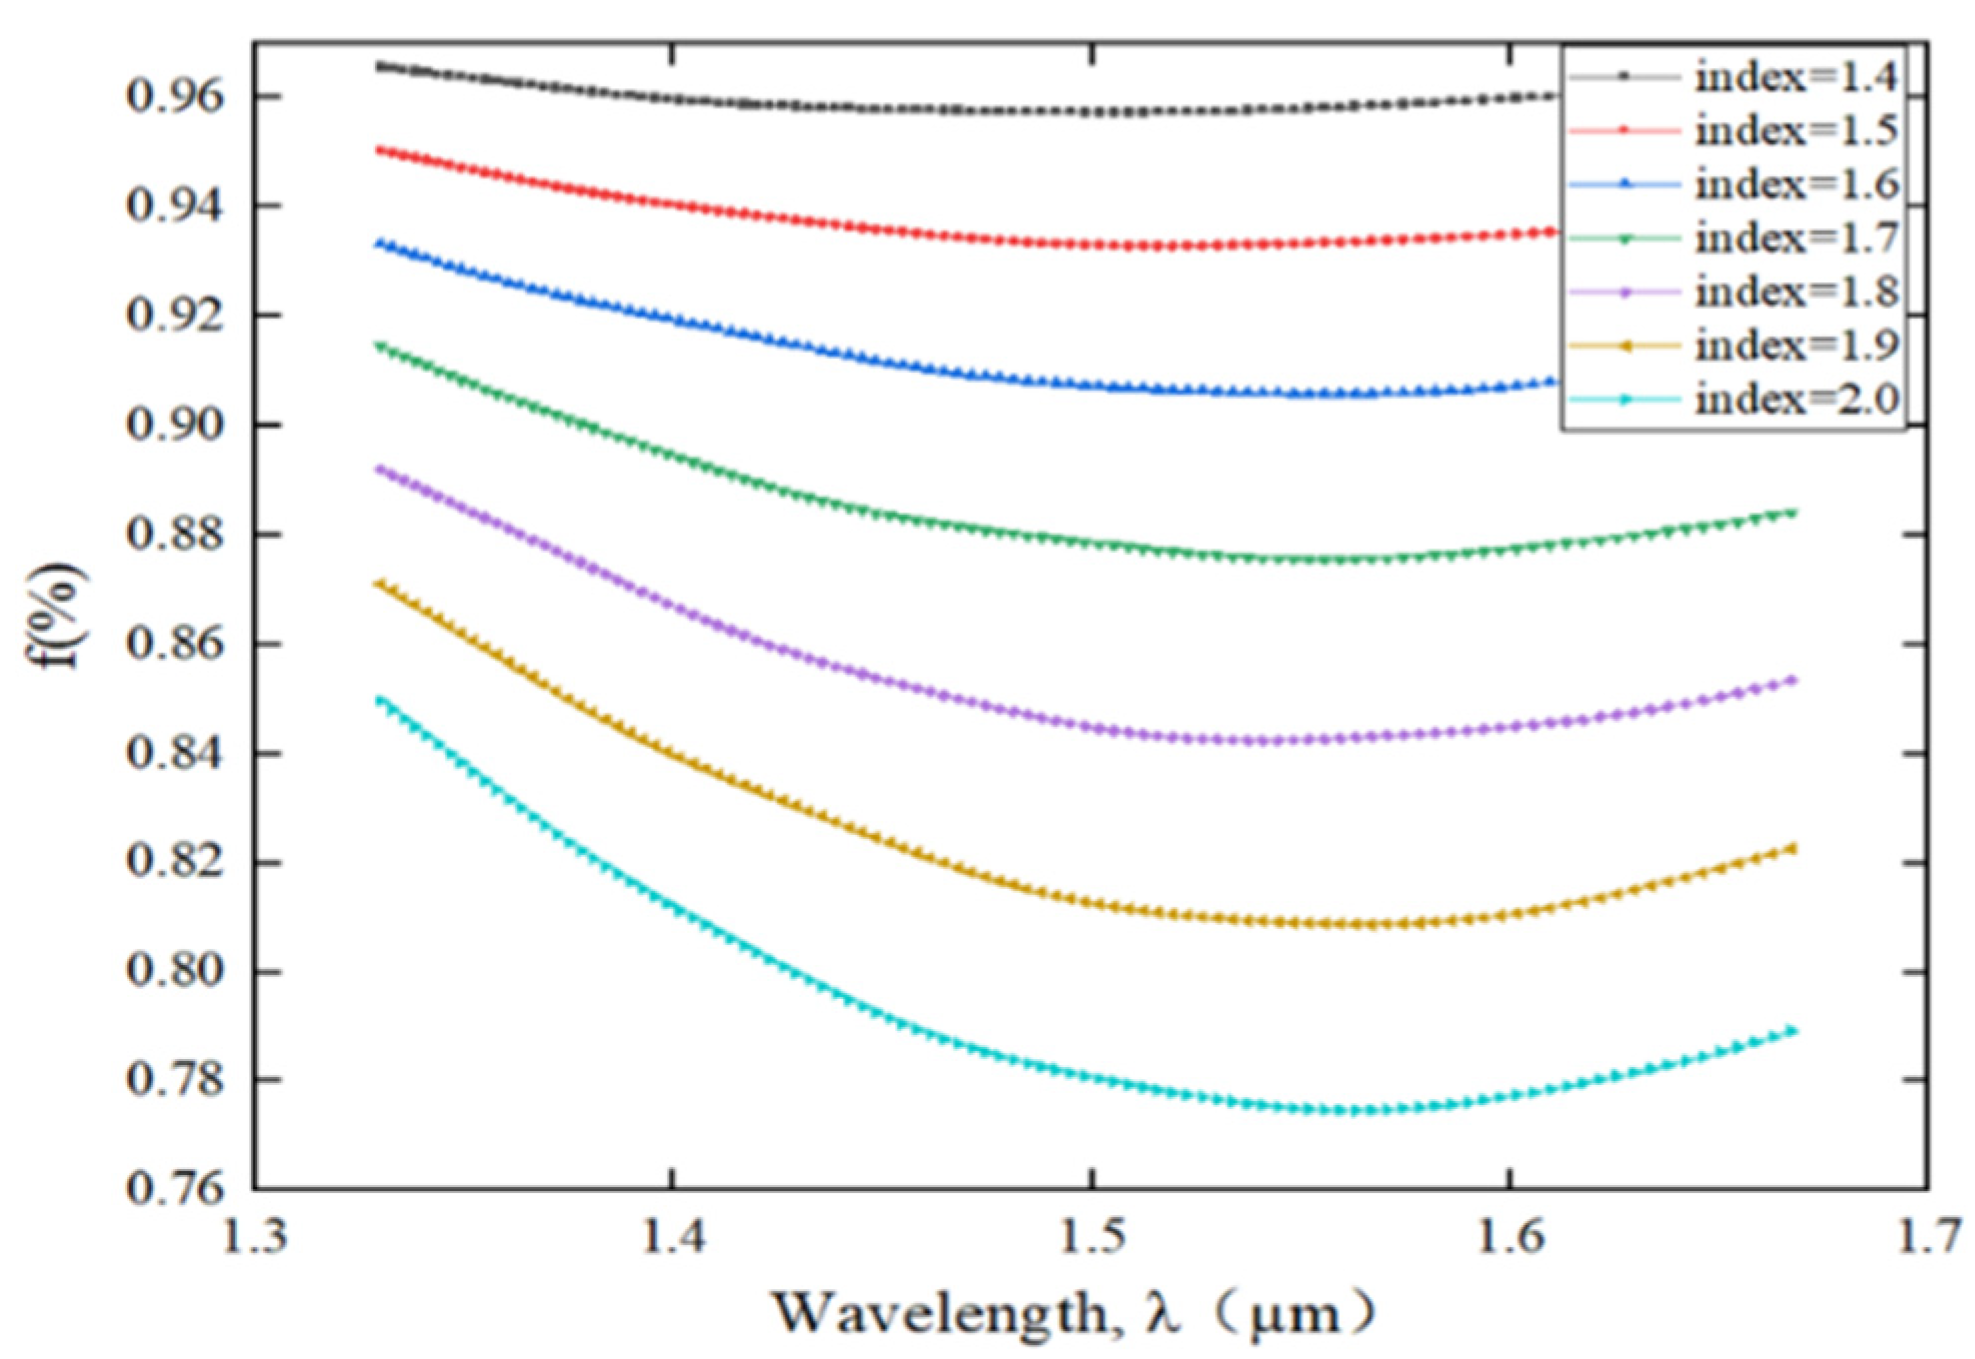
With the increase of wavelength, the transmittance of optical fiber structure has changed, and there is a certain dip. As shown in Figure 7, the dip will shift to the long wavelength direction with the change of background refractive index at the same structure and temperature by simulation experiments. With the increase of gas concentration, its refractive index will also increase accordingly. According to this principle, we can establish the relationship between gas concentration and refractive index. According to the above principles, there is a certain relationship between transmittance and relative sensitivity of optical fiber structure. Therefore, the sensitivity of optical fiber can be further obtained through the change of transmittance. Finally, the sensing performance of gas is well displayed.

5.2. Temperature resistance characteristics

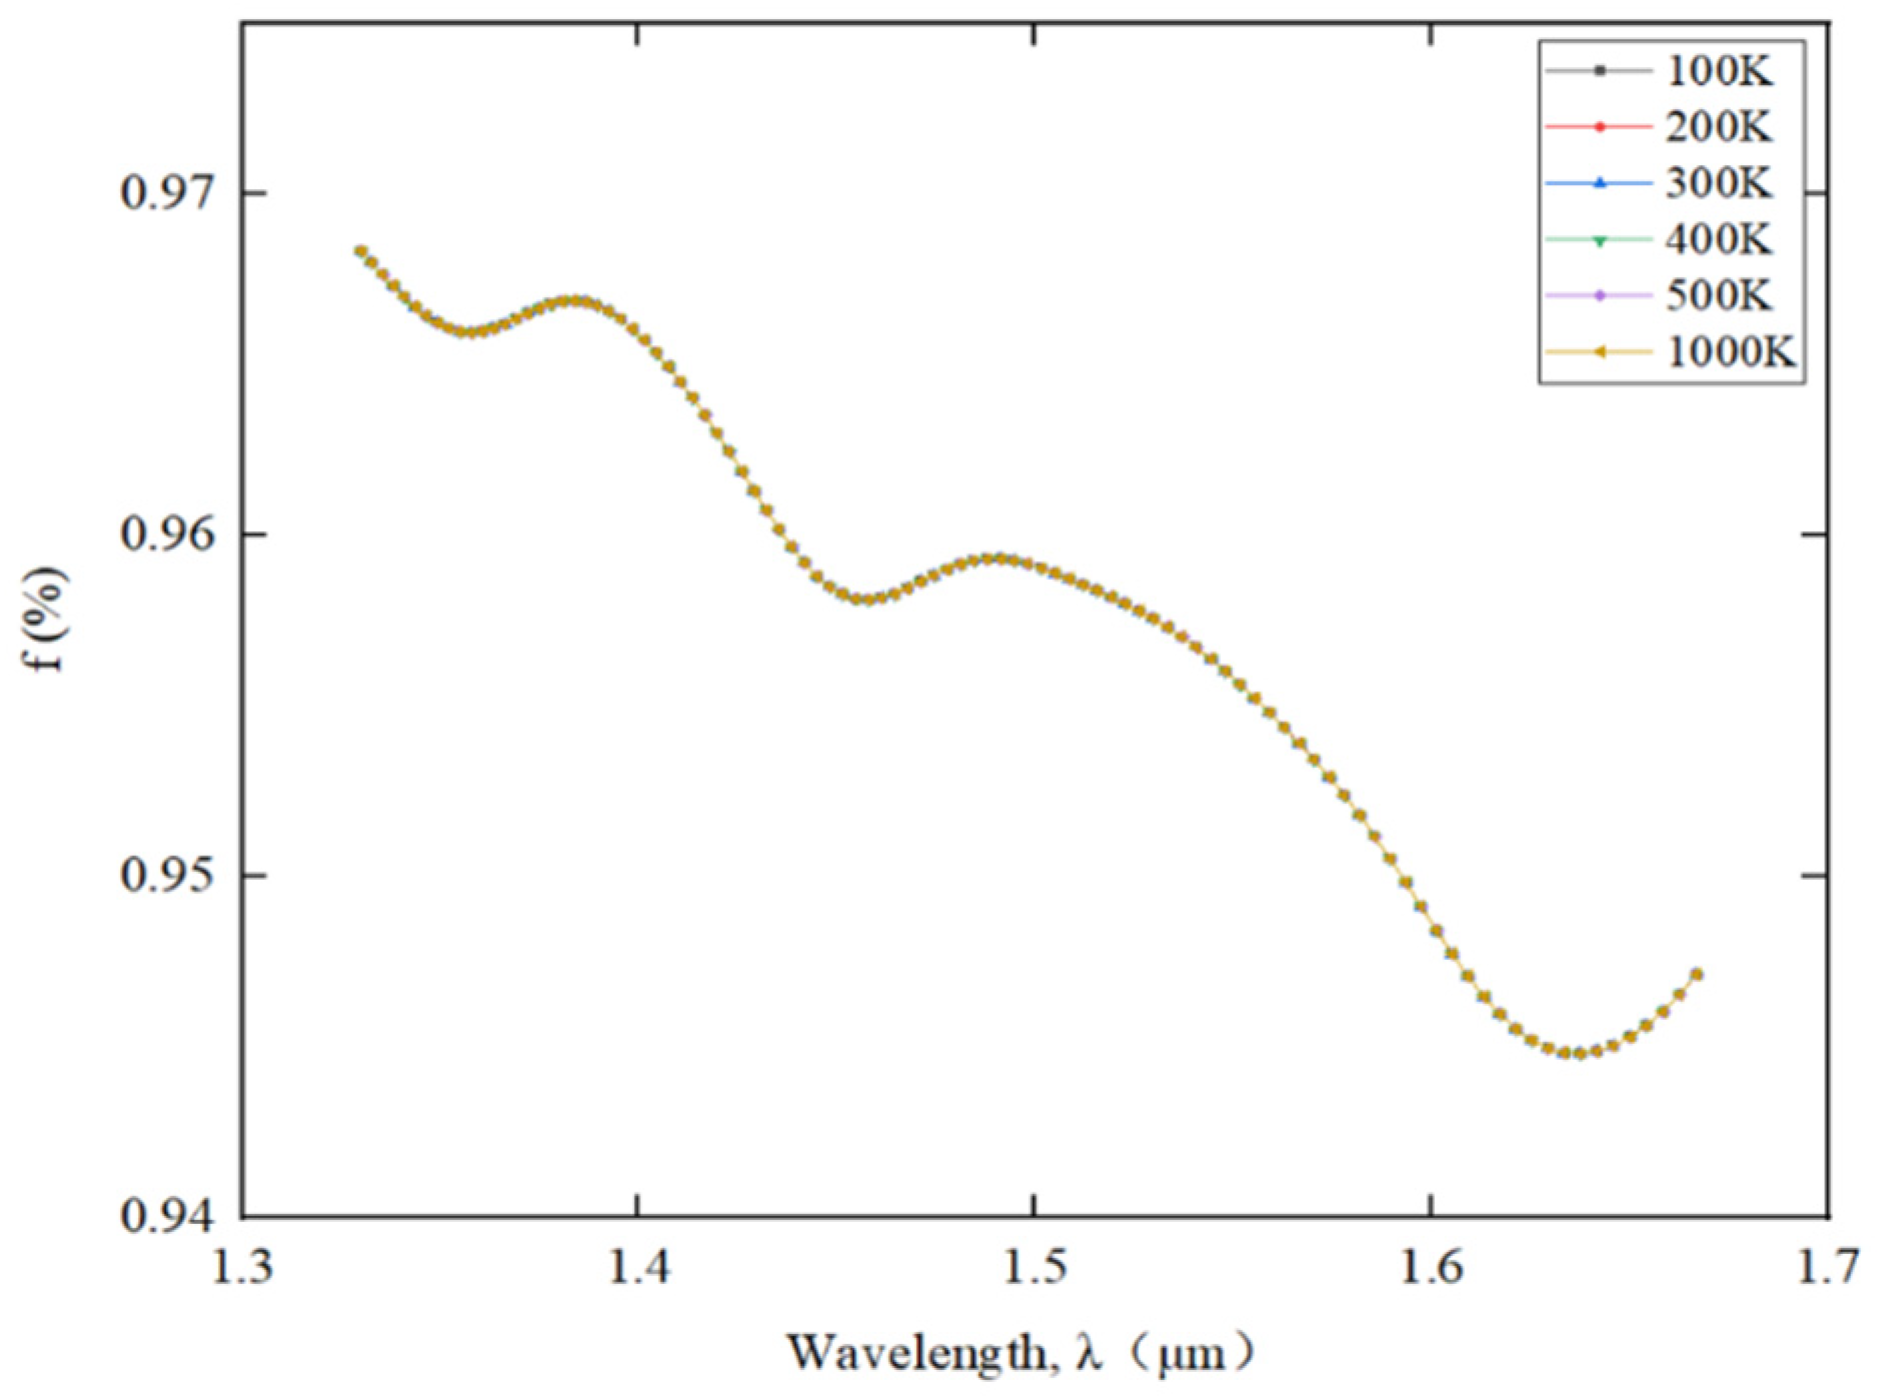
Here, we list the changes of transmittance with wavelength at different temperatures in the same environment, as shown in Figure 8. As can be seen from the figure, at different temperatures, the curves of transmittance versus wavelength are almost the same. This proves that our proposed structure has temperature resistance, which provides some reference for the design and research of high temperature gas sensors.

5.3. Comparison of different structural characteristics
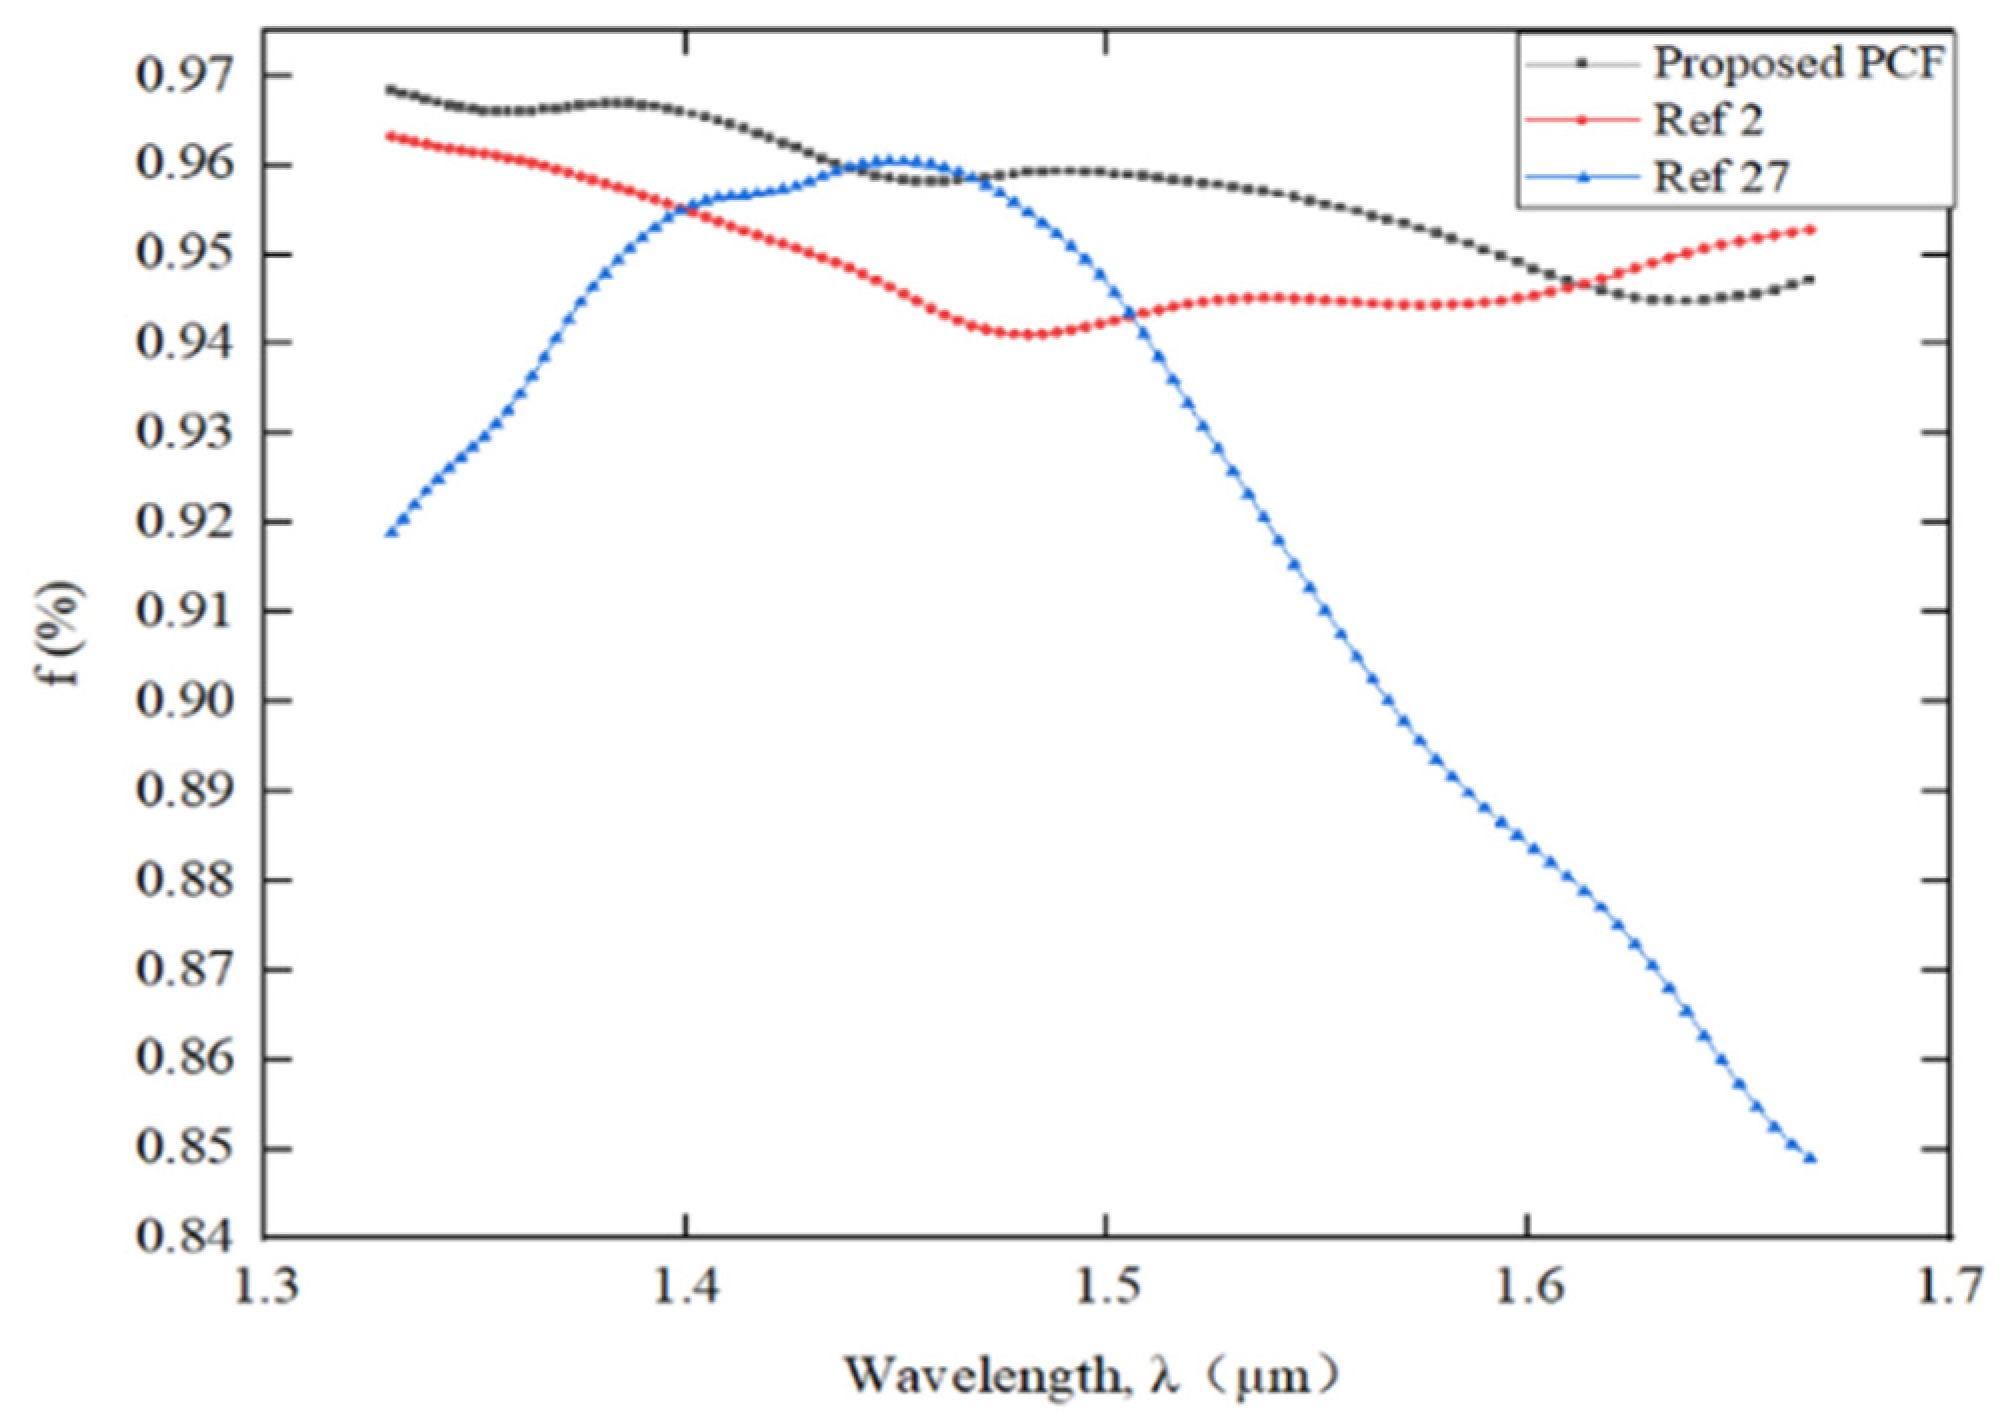
We simulated some structures according to the data of related papers and compared them with our proposed structures. We set the background refractive index to 1 and the temperature to 300K to match the actual sensing environment. In Ref 2, with the increase of wavelength, the transmittance curve appears a certain depression. the transmittance peaks at 1.4-1.5 microns in Ref 27. The structure of this paper is that with the increase of wavelength, the transmittance shows a certain downward trend. However, after comprehensive comparison, the structure proposed in this paper has great advantages in transmittance. As mentioned above, the transmittance has a great relationship with the relative sensitivity of the system, that is, it has good light transmission performance, which can make the light field fully communicate with the target gas, which is very important for the gas sensing characteristics.
Figure 9. Variation of transmittance with wavelength under different structures.
Preprints 69465 g009
In addition to the above characteristics, we have collected some relevant data of related papers and compared them with the relevant characteristics of this paper. It is easy to view that this structure has higher relative sensitivity and lower confinement loss. Table 2 shows the comparison results between the fibers, taking into account the relative sensitivity and confinement loss. Compared with existing PCFs, the proposed PCF provides high relative sensitivity and low confinement loss across the entire spectral range.

6. Conclusion

In this paper, a new index guiding photonic crystal fiber with hexagonal shape core and cladding has been proposed. The relative sensitivity coefficient and confinement loss characteristics are investigated numerically by FDTD for the proposed PCF structure. The simulation results show that in this design, the relative sensitivity is improved by increasing the diameter of hexagonal air hole cladding (d1) and the diameter of hexagonal holes arranged around the central solid core (d0). In addition, the limiting loss has been reduced by increasing the length-width ratio (l/w) of slots and reducing the diameter of cladding air holes (d1). Also, at the wavelength of 1.33μm, the relative sensitivity of 76.91% and the confinement loss of 3.94 × 10⁻⁵ dB/cm and at the wavelength of 1.533μm, the relative sensitivity of 78.26% and the confinement loss of 4.78 × 10⁻⁵ dB/cm is obtained. Through the analysis and comparison of the structural characteristics of this fiber, a new thinking is provided for the manufacture and research of optical fiber sensors in the field of gas sensing.

Funding

National Natural Science Foundation of China (61827825)

Data Availability Statement

Data underlying the results presented in this paper are not publicly available at this time but may be obtained from the authors upon reasonable request.

Acknowledgments

Authors thanks the support of National Natural Science Foundation of China under grant agreement No 61827825.

Conflicts of Interest

The authors declare no conflicts of interest.

References

  1. P. Russell, “Photonic Crystal Fibres,” Science 299(5605), 358–362 (2003). [CrossRef]
  2. Monir Morshed, Md. Imran Hassan, Tusher Kanti Roy, Muhammad Shahin Uddin, and S. M. Abdur Razzak, “Microstructure core photonic crystal fiber for gas sensing applications,” Appl. Opt. 54(29), 8637-8643(2015). [CrossRef]
  3. Aryan Abbaszadeh, Somayeh Makouei, and Saeed Meshgini, “A new photonic crystal fiber gas sensor with a hexagonal microstructure core suitable for a wide range of wavelengths,” J. Optoelectron. Adv. Mater. 23(11-12), 521-529(2021).
  4. Aryan Abbaszadeh, Somayeh Makouei, and Saeed Meshgini, “Ammonia gas detection using photonic crystal fiber with elliptical holes,” Opt. Eng. (Bellingham, WA, U. S.) 60(7), 077105(2021). [CrossRef]
  5. Amin Molaei Fard, Mohammad Javadian Sarraf, and Farzan Khatib, “Design and optimization of index guiding photonic crystal fiber-based gas sensor,” Optik 232, 166448(2021). [CrossRef]
  6. M. S. Habib, M. S. Habib, S. A. Razzak, and M. A. Hossain, “Proposal for highly birefringent broadband dispersion compensating octagonal photonic crystal fiber,” Opt. Fiber Technol. 19, 461–467 (2013). [CrossRef]
  7. Md. Ibadul Islam, Maksuda Khatun, Shuvo sen, Kawsar Ahmed, and Sayed Asaduzzaman, “Spiral Photonic Crystal Fiber for Gas Sensing Application,” in 9th International Conference on Electrical and Computer Engineering, Dhaka, Bangladesh, 238-242(2016). [CrossRef]
  8. Ahmed Saber, H. Rabee, Mohamed Farhat O. Hameed, Ahmed M. Heikal, S.S.A. Obayya, “Highly sensitive photonic crystal fiber gas sensor,” Optik 188,78-86(2019). [CrossRef]
  9. Aryan Abbaszadeh, Somayeh Makouei, and Saeed Meshgini, “New hybrid photonic crystal fiber gas sensor with high sensitivity for ammonia gas detection,” Can. J. Phys. 100, 129-137 (2022). [CrossRef]
  10. Md. Faizul Huq Arif, Kawsar Ahmed and Sayed Asaduzzaman, “A Comparative Analysis of Two Different PCF Structures for Gas Sensing Application,” in 3rd International Conference on Advances in Electrical Engineering, Dhaka, Bangladesh, 247-250(2015). [CrossRef]
  11. Sawrab Chowdhury, Shuvo Sen, Kawsar Ahmed, and Sayed Asaduzzaman, “Design of highly sensible porous shaped photonic crystal fiber with strong confinement field for optical sensing,” Optik 142, 541-549 (2017). [CrossRef]
  12. Gyan Prakash Mishra, Dharmendra Kumar, Vijay Shanker Chaudhary, and Santosh Kumar, “Design and Sensitivity Improvement of Microstructured-Core Photonic Crystal Fiber Based Sensor for Methane and Hydrogen Fluoride Detection,” IEEE Sens. J. 22, 1265-1272 (2022). [CrossRef]
  13. Hassan Arman and Saeed Olyaee, “Realization of low confinement loss acetylene gas sensor by using hollow-core photonic bandgap fiber,” Opt. Quantum Electron. 53:328 (2021). [CrossRef]
  14. W. Reeves, J. Knight, P. Russell, and P. Roberts, “Demonstration of ultra-flattened dispersion in photonic crystal fibers,” Opt. Express 10(14), 609–613 (2002). [CrossRef]
  15. M. S. Habib, M. S. Habib, M. I. Hasan, and S. A. Razzak, “A single mode ultra-flat high negative residual dispersion compensating photonic crystal fiber,” Opt. Fiber Technol. 20, 328–332 (2014). [CrossRef]
  16. A. Ortigosa-Blanch, J. Knight, W. Wadsworth, J. Arriaga, B. Mangan, T. Birks, and P. S. J. Russell, “Highly birefringent photonic crystal fibers,” Opt. Lett. 25, 1325–1327 (2000). [CrossRef]
  17. H. Ebendorff-Heidepriem, P. Petropoulos, S. Asimakis, V. Finazzi, R. Moore, K. Frampton, F. Koizumi, D. Richardson, and T. Monro, “Bismuth glass holey fibers with high nonlinearity,” Opt. Express 12(21), 5082–5087 (2004). [CrossRef]
  18. Jiajie Zhu, Pengyu Nan, Kok-Sing Lim, Xin Liu, Wenjie Dang, Zeren Li, Jinxiao Dan, Hangting Yang, Harith Ahmad, and Hangzhou Yang, “Double F-P Interference Optical Fiber High Temperature Gas Pressure Sensor Based on Suspended Core Fiber,” IEEE Sens. J. 21(23), 26805-26813 (2021). [CrossRef]
  19. Mingran Quan, Jiajun Tian, and Yong Yao, “Ultra-high sensitivity Fabry–Perot interferometer gas refractive index fiber sensor based on photonic crystal fiber and Vernier effect,” Opt. Lett. 40(21), 4891-4894 (2015). [CrossRef]
  20. S. Zheng, B. Shan, M. Ghandehari, and J. Ou, “Sensitivity characterization of cladding modes in long–period gratings photonic crystal fiber for structural health monitoring,” Measurement 72, 43–51 (2015). [CrossRef]
  21. A.M. Cubillas, S. Unterkofler, T.G. Euser, B.J. Etzold, A.C. Jones, P.J. Sadler, and P.S.J. Russell, “Photonic crystal fibres for chemical sensing and photochemistry,” Chem. Soc. Rev. 42 (22), 8629–8648 (2013). [CrossRef]
  22. Bowei Wan, Lianqing Zhu, Xin Ma, Tianshu Li, and Jian Zhang, “Characteristic Analysis and Structural Design of Hollow-Core Photonic Crystal Fibers with Band Gap Cladding Structures,” Sensors 21, 284 (2021). [CrossRef]
  23. G. A. Cárdenas-Sevilla, V. Finazzi, J. Villatoro, and V. Pruneri, “Photonic crystal fiber sensor array based on modes overlapping,” Opt. Express 19(8), 7596–7602 (2011). [CrossRef]
  24. K. Grattan and T. Sun, “Fiber optic sensor technology: an overview,” Sens. Actuators A 82, 40–61 (2000). [CrossRef]
  25. J. Park, S. Lee, S. Kim, and K. Oh, “Enhancement of chemical sensing capability in a photonic crystal fiber with a hollow high index ring defect at the center,” Opt. Express 19(3), 1921–1929 (2011). [CrossRef]
  26. Saeed OLYAEE and Alieh NARAGHI, “Design and optimization of index-guiding photonic crystal fiber gas sensor,” Photon. Sens. 3(2), 131–136 (2013). [CrossRef]
  27. Zhang Zhi-guo, Zhang Fang-di, Zhang Min, and Ye Pei-da, “Gas sensing properties of index-guided PCF with air-core,” Opt. Laser Technol. 40, 167–174 (2008). [CrossRef]
  28. Y.L. Hoo, W. Jin, J. Ju, and H.L. Ho, “Numerical investigation of a depressed-index core photonic crystal fiber for gas sensing,” Sens. Actuators, B 139, 460–465 (2009). [CrossRef]
  29. S. Asaduzzaman, K. Ahmed, and B. K. Paul, “Slotted-core photonic crystal fiber in gas sensing application,” Proc. SPIE. 10025, 100250O (2016). [CrossRef]
  30. Md. Shadidul Islam, Bikash Kumar Paul, Kawsar Ahmed, and Sayed Asaduzzaman, “Rhombic core photonic crystal fiber for sensing applications: Modeling and analysis,” Optik 157, 1357-1365 (2018). [CrossRef]
  31. G. Ghosh, “Sellmeier coefficients and dispersion of thermo-optic coefficients for some optical glasses,” Appl. Opt. 36 (7), 1540 (1997). [CrossRef]
  32. Qiu M, “Analysis of guided modes in photonic crystal fibers using the finite-difference time-domain method,” Microw Opt Technol Lett, 30 (5), 327-330 (2001). [CrossRef]
  33. Yu C P and Chang H C, “Yee-mesh-based finite difference eigenmode solver with PML absorbing boundary conditions for optical waveguides and photonic crystal fibers,” Opt. Express, 12 (25), 6165-6177 (2004). [CrossRef]
  34. S. Olyaee, A. Naraghi, and V. Ahmadi, “High sensitivity evanescentfield gas sensor based on modified photonic crystal fiber for gas condensate and air pollution monitoring,” Optik 125, 596–600 (2014). [CrossRef]
  35. K. Saitoh and M. Koshiba, “Leakage loss and group velocity dispersion in air-core photonic bandgap fibers,” Opt. Express 11(23), 3100–3109 (2003). [CrossRef]
  36. K. Ahmed, M. Morshed, S. Asaduzzaman, and M.F.H. Arif, “Optimization and enhancement of liquid analyte sensing performance based on square-cored octagonal photonic crystal fiber,” Opt. Int. J. Light Electron Opt. 131 (1), 687–696 (2017). [CrossRef]
  37. M. Morshed, M.I. Hasan, and S.A. Razzak, “Enhancement of the sensitivity of gas sensor based on microstructure optical fiber,” Photonic Sens. 5 (4), 312–320 (2015). [CrossRef]
  38. K. Ahmed and M. Morshed, “Design and numerical analysis of micro structured-core octagonal photonic crystal fiber for sensing applications,” Sens. Bio-Sens. Res. 7, 1-6 (2016). [CrossRef]
  39. H. Ademgil, “Highly sensitive octagonal photonic crystal fiber based sensor,” Opt. Int. J. Light Electron Opt. 125 (20) 6274–6278 (2014). [CrossRef]
  40. H. Ademgil, “Highly birefringent large mode area photonic crystal fiber-based sensor for interferometry applications,” Mod. Phys. Lett. B 30 (36) 1650422 (2016). [CrossRef]
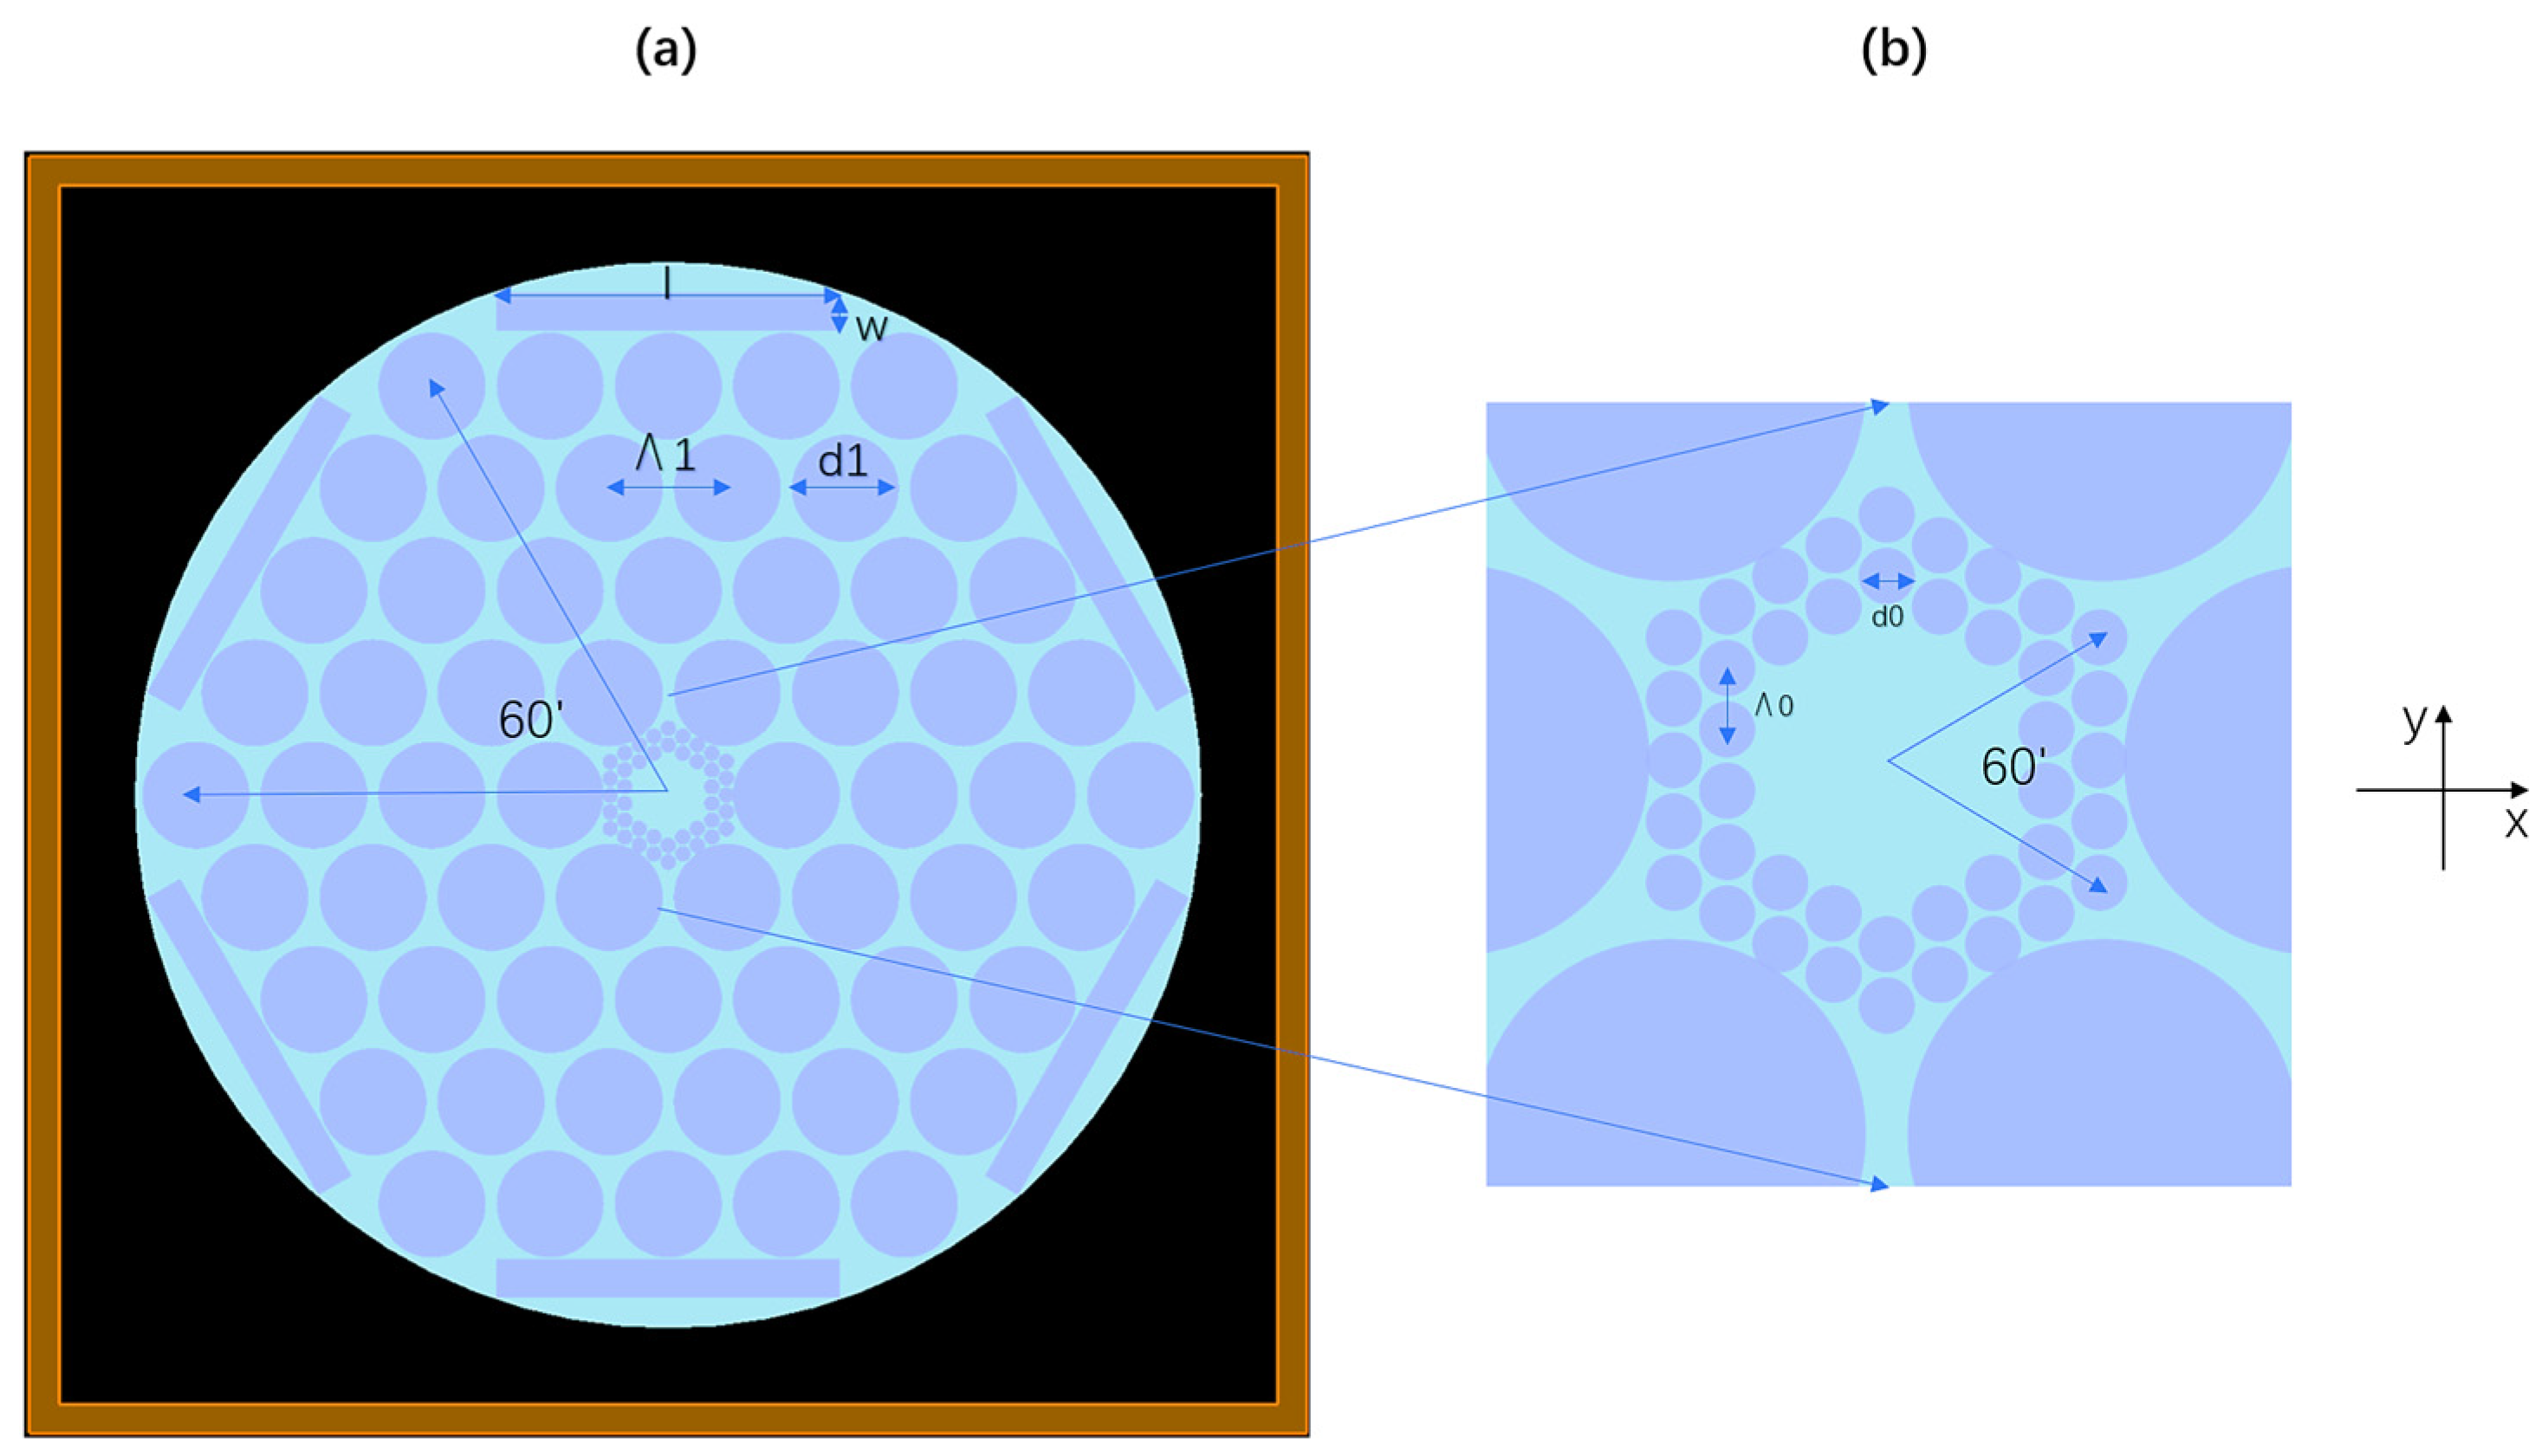
Figure 1. Transverse cross section of the proposed HSC-PCF.
Preprints 69465 g001
Figure 3. Fundamental optical field distribution of proposed HSC-PCF for y polarization at the operating wavelength of (a) 1.33 μm and (b) 1.533 μm.
Preprints 69465 g003
Figure 4. Variation of (a) the confinement loss and (b) the relative sensitivity with wavelength for different values of d1 while other parameters are kept constant.
Preprints 69465 g004
Figure 5. Variation of (a) the confinement loss and (b) the relative sensitivity with wavelength for different values of d0 while other parameters are kept constant.
Preprints 69465 g005
Figure 6. Variation of (a) the confinement loss and (b) the relative sensitivity with wavelength for different values of l/w while other parameters are kept constant.
Preprints 69465 g006
Figure 7. the transmittance varies with the wavelength at different refractive indices.
Preprints 69465 g007
Figure 8. Variation of transmittance with wavelength at different temperatures.
Preprints 69465 g008
Table 1. Absorption Wavelength and Line Strength of Some Gases.
Gas Absorption Wavelength (µm) Line Strength (cm−2atm−1)
Acetylene (C2H2) 1.533 20.00 × 10 2
Ammonia (NH3) 1.544 0.925 × 10 2
Carbon monoxide (CO) 1.567 0.0575 × 10 2
Carbon dioxide (CO2) 1.573 0.048 × 10 2
Hydrogen sulfide (H2S) 1.578 0.325 × 10 2
Methane (CH4) 1.667, 1.33 1.500 × 10 2
Hydrogen fluoride (HF) 1.33 32.50 × 10 2
Water (H2O) 1.365 52.50 × 10 2
Nitrogen dioxide (NO2) 0.800 0.125 × 10 2
Oxygen (O2) 0.761 0.0191 × 10 2
Table 2. Comparison between the Proposed PCF and Prior PCFs for Sensing Application at λ = 1.33 μm.
PCFs r (%) Lc(dB/cm) structure
Ref. [39] 21.55 5.65 × 10 11 Octagonal
Ref. [40] 22 - Hexagonal
Ref. [27] 29.8 4.50 × 10 3 Hexagonal
Ref. [2] 42.27 4.78 × 10 8 Hexagonal
Proposed PCF 76.91 3.94 × 10 5 Hexagonal
Disclaimer/Publisher’s Note: The statements, opinions and data contained in all publications are solely those of the individual author(s) and contributor(s) and not of MDPI and/or the editor(s). MDPI and/or the editor(s) disclaim responsibility for any injury to people or property resulting from any ideas, methods, instructions or products referred to in the content.
Copyright: This open access article is published under a Creative Commons CC BY 4.0 license, which permit the free download, distribution, and reuse, provided that the author and preprint are cited in any reuse.
Prerpints.org logo

Preprints.org is a free preprint server supported by MDPI in Basel, Switzerland.

Subscribe

© 2024 MDPI (Basel, Switzerland) unless otherwise stated