1. Introduction
The American Academy of Sleep Medicine defines consumer sleep technologies (CSTs) as “widespread applications and devices that purport to measure and even improve sleep” [
1]. Since the commercialization of wrist-based sleep trackers by large companies like Fitbit in 2013 [
2], CST use has exploded across the general consumer landscape. While CSTs can provide sleep information directly to individual users for their general knowledge and wellbeing, they are increasingly used and tested by sleep researchers working in operational fields [
3,
4,
5].
Commercially-developed CSTs are a promising resource for sleep researchers requiring data collected in the field [
6]. They provide an excellent way of remotely collecting large amounts of naturalistic sleep data, are readily accessible, and can remotely store data used by researchers looking to quantify sleep patterns across populations. In a recent review of expert field sleep researcher opinions, the researchers indicated that devices that can detect sleep, have adequate data security, remote data extractions, and long battery life were important features for facilitating their research [
7]. While designing CSTs that meet these targets would provide an excellent research tool, it is also important to focus on the features demanded by consumers; understanding the features they want increases the likelihood of them adopting CST use and in turn, may increase motivation for manufacturers to incorporate those features. An ideal solution would be the availability of CSTs that combine the type of sleep information required by field sleep researchers with features that encourage uptake and compliance in target populations.
One might expect sleep researchers and general consumers to have different desires and goals when using CSTs. While researchers might focus on data format types for extraction and analysis, consumers might focus on ease-of-use, comfort, and style. One vision that sleep experts and consumers seem to share is that of accuracy and device performance evaluation. The proposed accuracy of the sleep-scoring algorithms used by CSTs has spawned many performance evaluation papers and reviews that that have focused on the comparison of these algorithms again gold-standard polysomnography, or commentaries about the place of CSTs in sleep research [
8,
9]. Consumers are also interested in the accuracy of these devices; In 2015, a class-action lawsuit was brought against Fitbit claiming their sleep-tracking devices were not accurately measuring sleep [
10]. Fitbit eventually settled the case in 2018 and subsequently improved their sleep tracking algorithms [
8], but this case displays consumer interest in CST accuracy. Understanding the monetary value of device performance evaluation and accuracy can help CST companies better align their devices with both consumers and sleep researchers.
In this report, we analyze demand for CSTs based on how they are evaluated using behavioral economics tools of purchase tasks and demand curve analysis. These tools can help quantify the relative value of a product. Purchase tasks are surveys that provide a vignette describing a scenario in which a respondent is purchasing a commodity, and then asks the respondent how much of the product they would buy, or how likely they are to buy it, at a series of prices [
11,
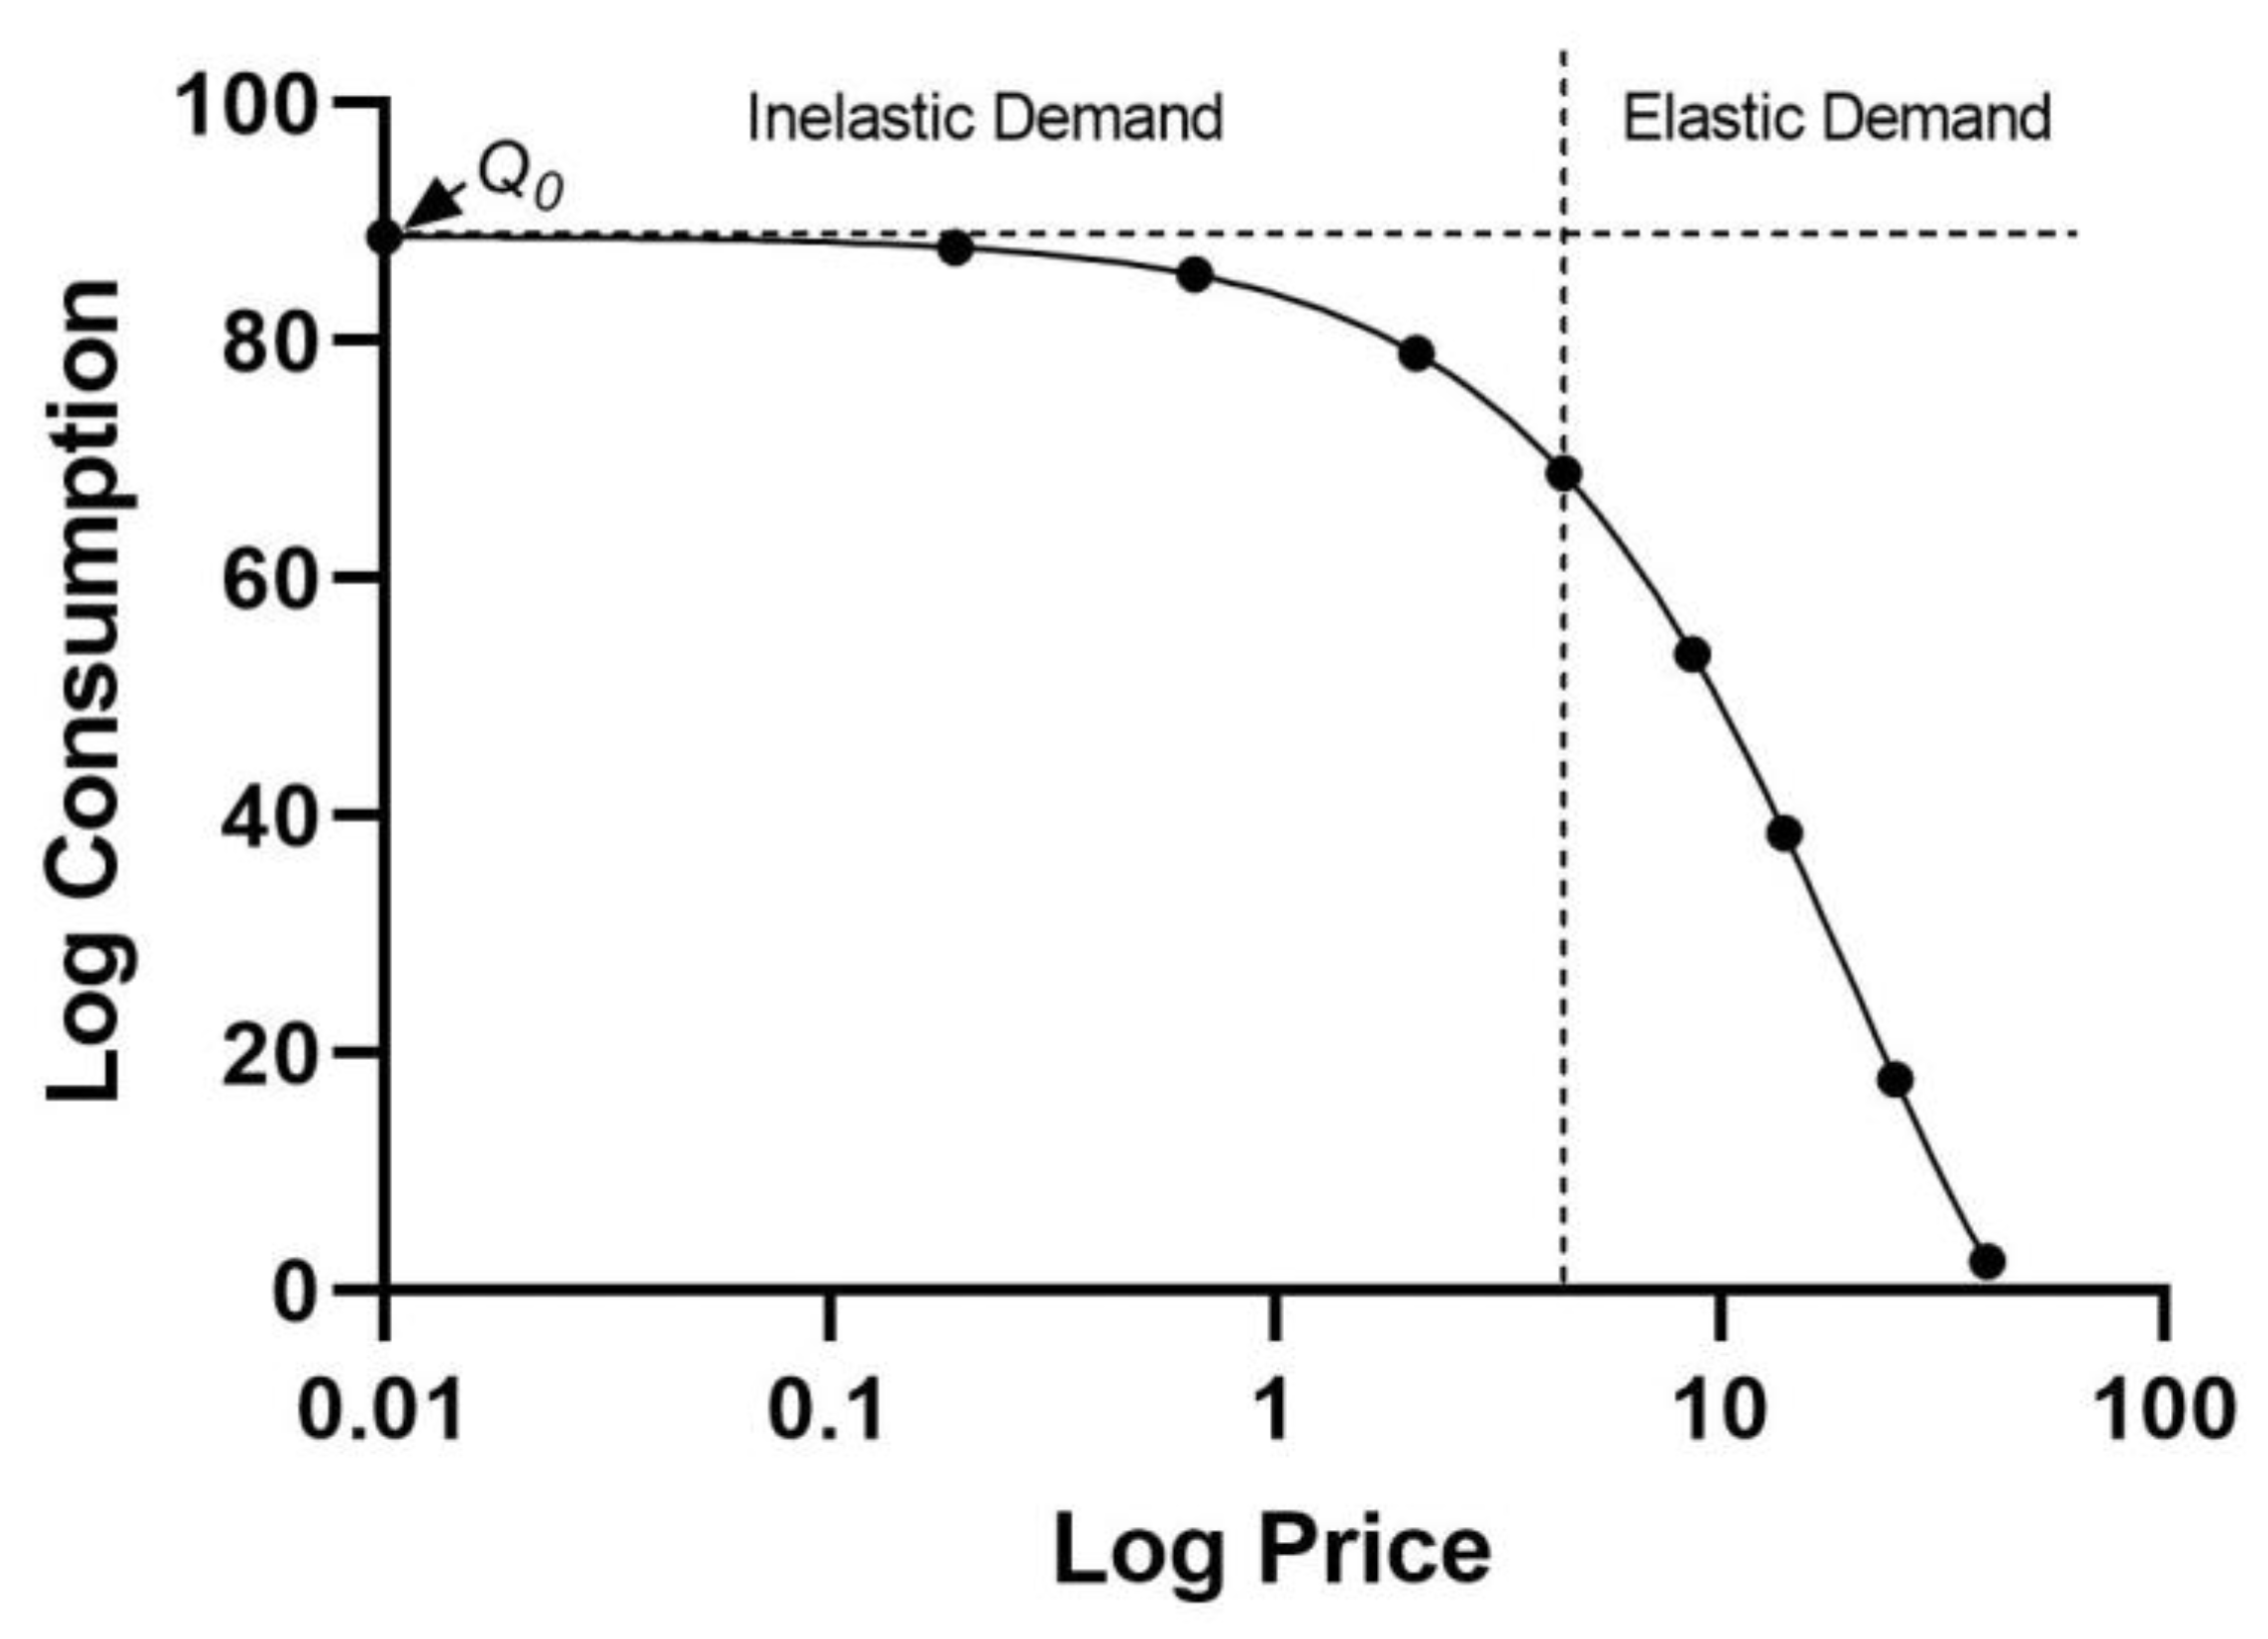
12]. Demand curves, a representation of consumption across a series of increasing prices (see example
Figure 1), are created from these purchase task data. The demand curves are then fit with one of multiple equations designed to provide parameters that describe unique measures of the value of the commodity [
13,
14,
15]. Demand curve analysis has been used, largely in the field of substance use disorders and policy, to index the value of goods, understand decision making behavior, and predict behaviors, especially health related behaviors such as drug use, condom use, and UV tanning [
16,
17,
18,
19]. In this report, we have applied this behavioral economics methodology to the task of understanding significant differences in the underlying value of CST performance evaluation. Our goal is to establish differences in demand for CSTs that were not evaluated against laboratory measures, those that were evaluated against laboratory measures, and those that were both evaluated against laboratory measures and endorsed by sleep-research professionals.
2. Materials and Methods
2.1 Participants
Participants were recruited from an online crowdsourcing platform (Amazon mTurk;
https://www.mturk.com). Amazon mTurk is an increasingly popular source of behavioral and social science survey data [
20] that allows independent account holders to perform brief Human Intelligence Tasks (HITs) for a pre-determined monetary reward. Amazon mTurk has been used in commodity purchase task studies [
17,
18,
21,
22], though it has been most extensively used in the area of addiction [
23]. Participants completed a screening task and if they passed, a full survey. Participants were compensated with a
$0.50 reward for the screening, and a
$3.00 reward for the full survey within 3 days of completing the task. This study has been approved by Salus IRB.
2.2 Procedure
A HIT was posted on Amazon mTurk and advertised as a “Smartwatch Survey”, with the description that it was “A survey about purchasing choices for smartwatches with sleep-tracking”. The terms “sleep tracker” or “smartwatch” were used in lieu of “CSTs” for the purposes of this survey since general consumers may not be familiar with the term “CST”. If the HIT was selected, participants were redirected to a Qualtrics-hosted web survey. They first completed a screening task that determined if their demand curve data was systematic. If data passed the trend criterion for systematic demand curve data [
24], which dictates that demand tends to decrease as prices increase, the participants were given access to the complete study survey. Our only eligibility criterion was that participants were located in the United States; no other criteria were established in order to solicit a wide range of responders.
2.3 Materials
Participants were asked to complete a screening question and a full survey. The screening question was a typical purchase task question [
11,
18]. The prompt told the participant to imagine they wanted to purchase a sleep tracker and provided details about a specific unbranded device, such as the battery life and sleep-tracking features. They were told to assume (1) the device was for their own personal use; (2) they had the same budget to purchase a sleep tracker as their current budget would allow; (3) they could not buy the device elsewhere; and (4) the device features remained the same across all prices. They were then asked to use a slider bar to indicate, from 0 – 100%, the probability of purchasing the watch at each listed price (
$0,
$50,
$100,
$150,
$200,
$300,
$500,
$1000,
$1200).
Participants who passed the screening were then allowed to complete the full survey. The survey included three purchase task questions identical to the screen question, but each with a key difference in how the sleep-tracking feature of the watch was evaluated. The survey used the previous term “validation” instead of the newly-preferred term “performance evaluation,” since general consumers may not yet be familiar with this term [
25]. In the No Validation [NV] condition, the prompt told participants that the sleep tracking algorithm “has not been independently tested for accuracy against sleep laboratory measures”. In the Validation condition [V], they were told the sleep tracking algorithm “has been independently tested for accuracy against sleep laboratory measures”. Finally in the Validation and Endorsement condition [VE], they were told the sleep tracking algorithm “has been independently tested for accuracy against sleep laboratory measures and has been endorsed by a group of sleep researchers”. In order to clearly differentiate between the three validation types, the prompts for each purchase task were accompanied by a visual cue that used different colors and text to indicate which watch the participant was responding for. In addition, attention check questions were included to ensure the participant understood which watch they were responding for – participants read the prompt, filled out the attention check question, and then read the prompt a second time while responding with their probability of purchase at each price.
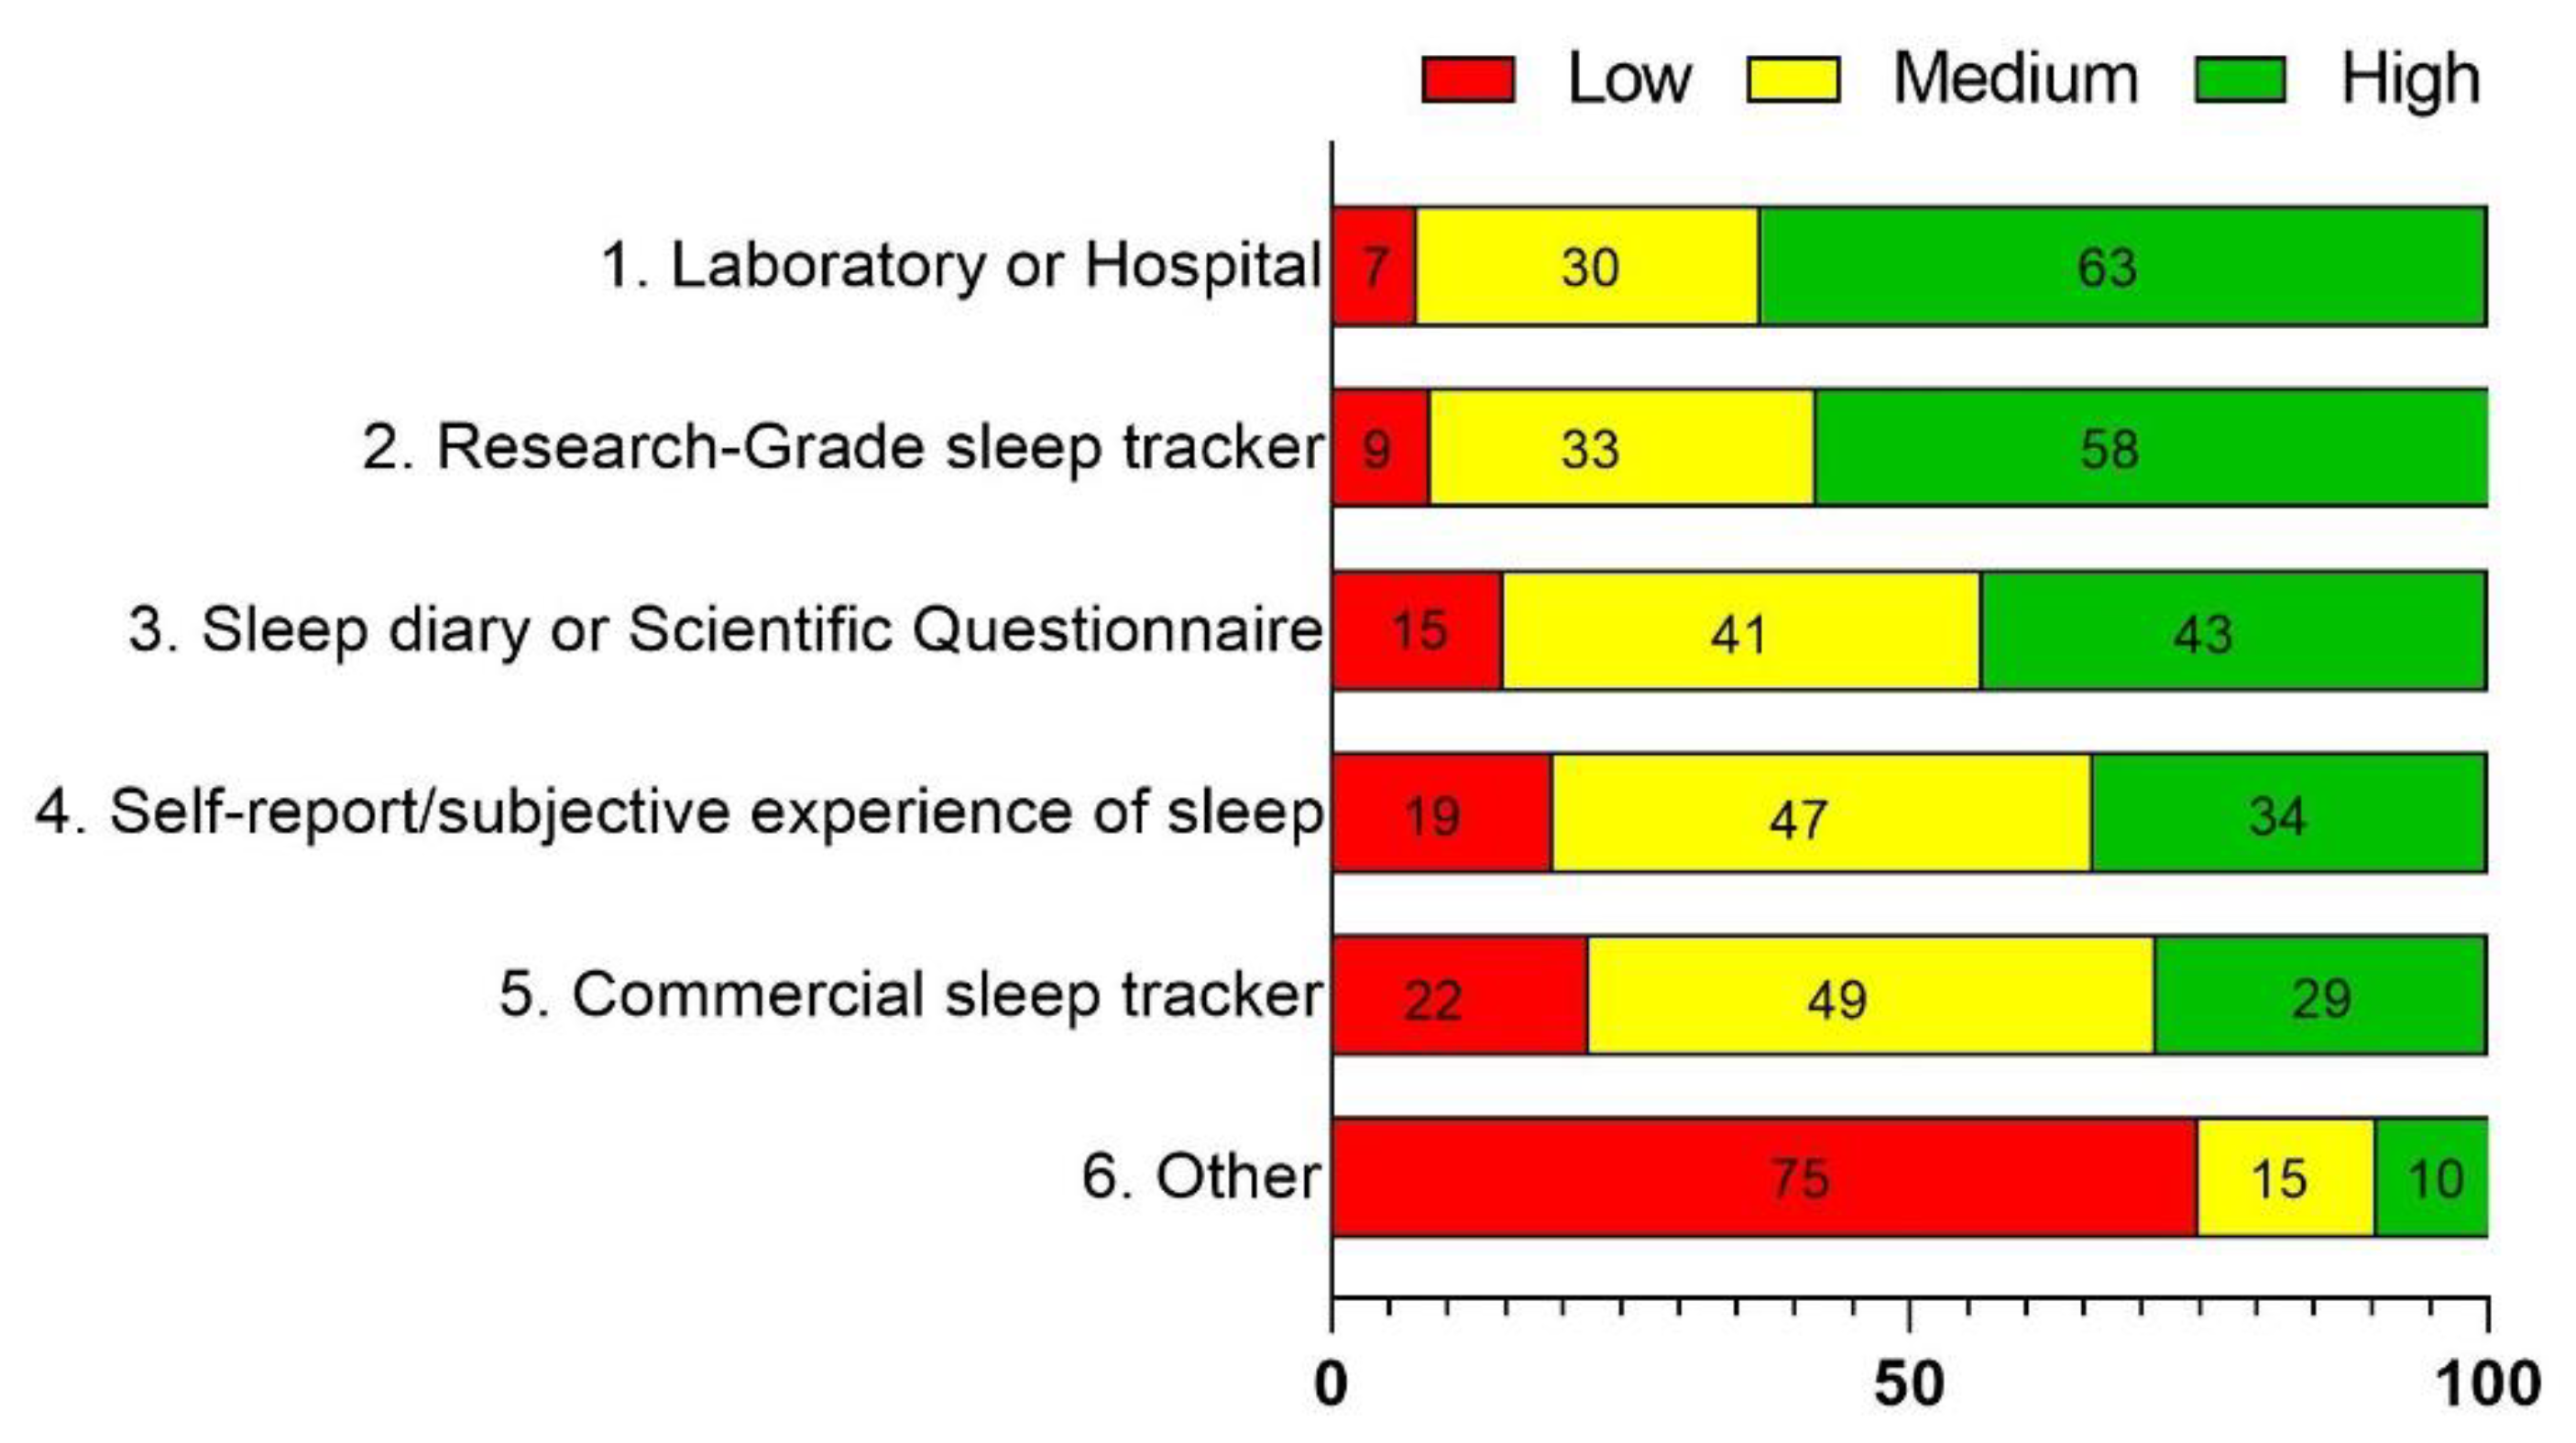
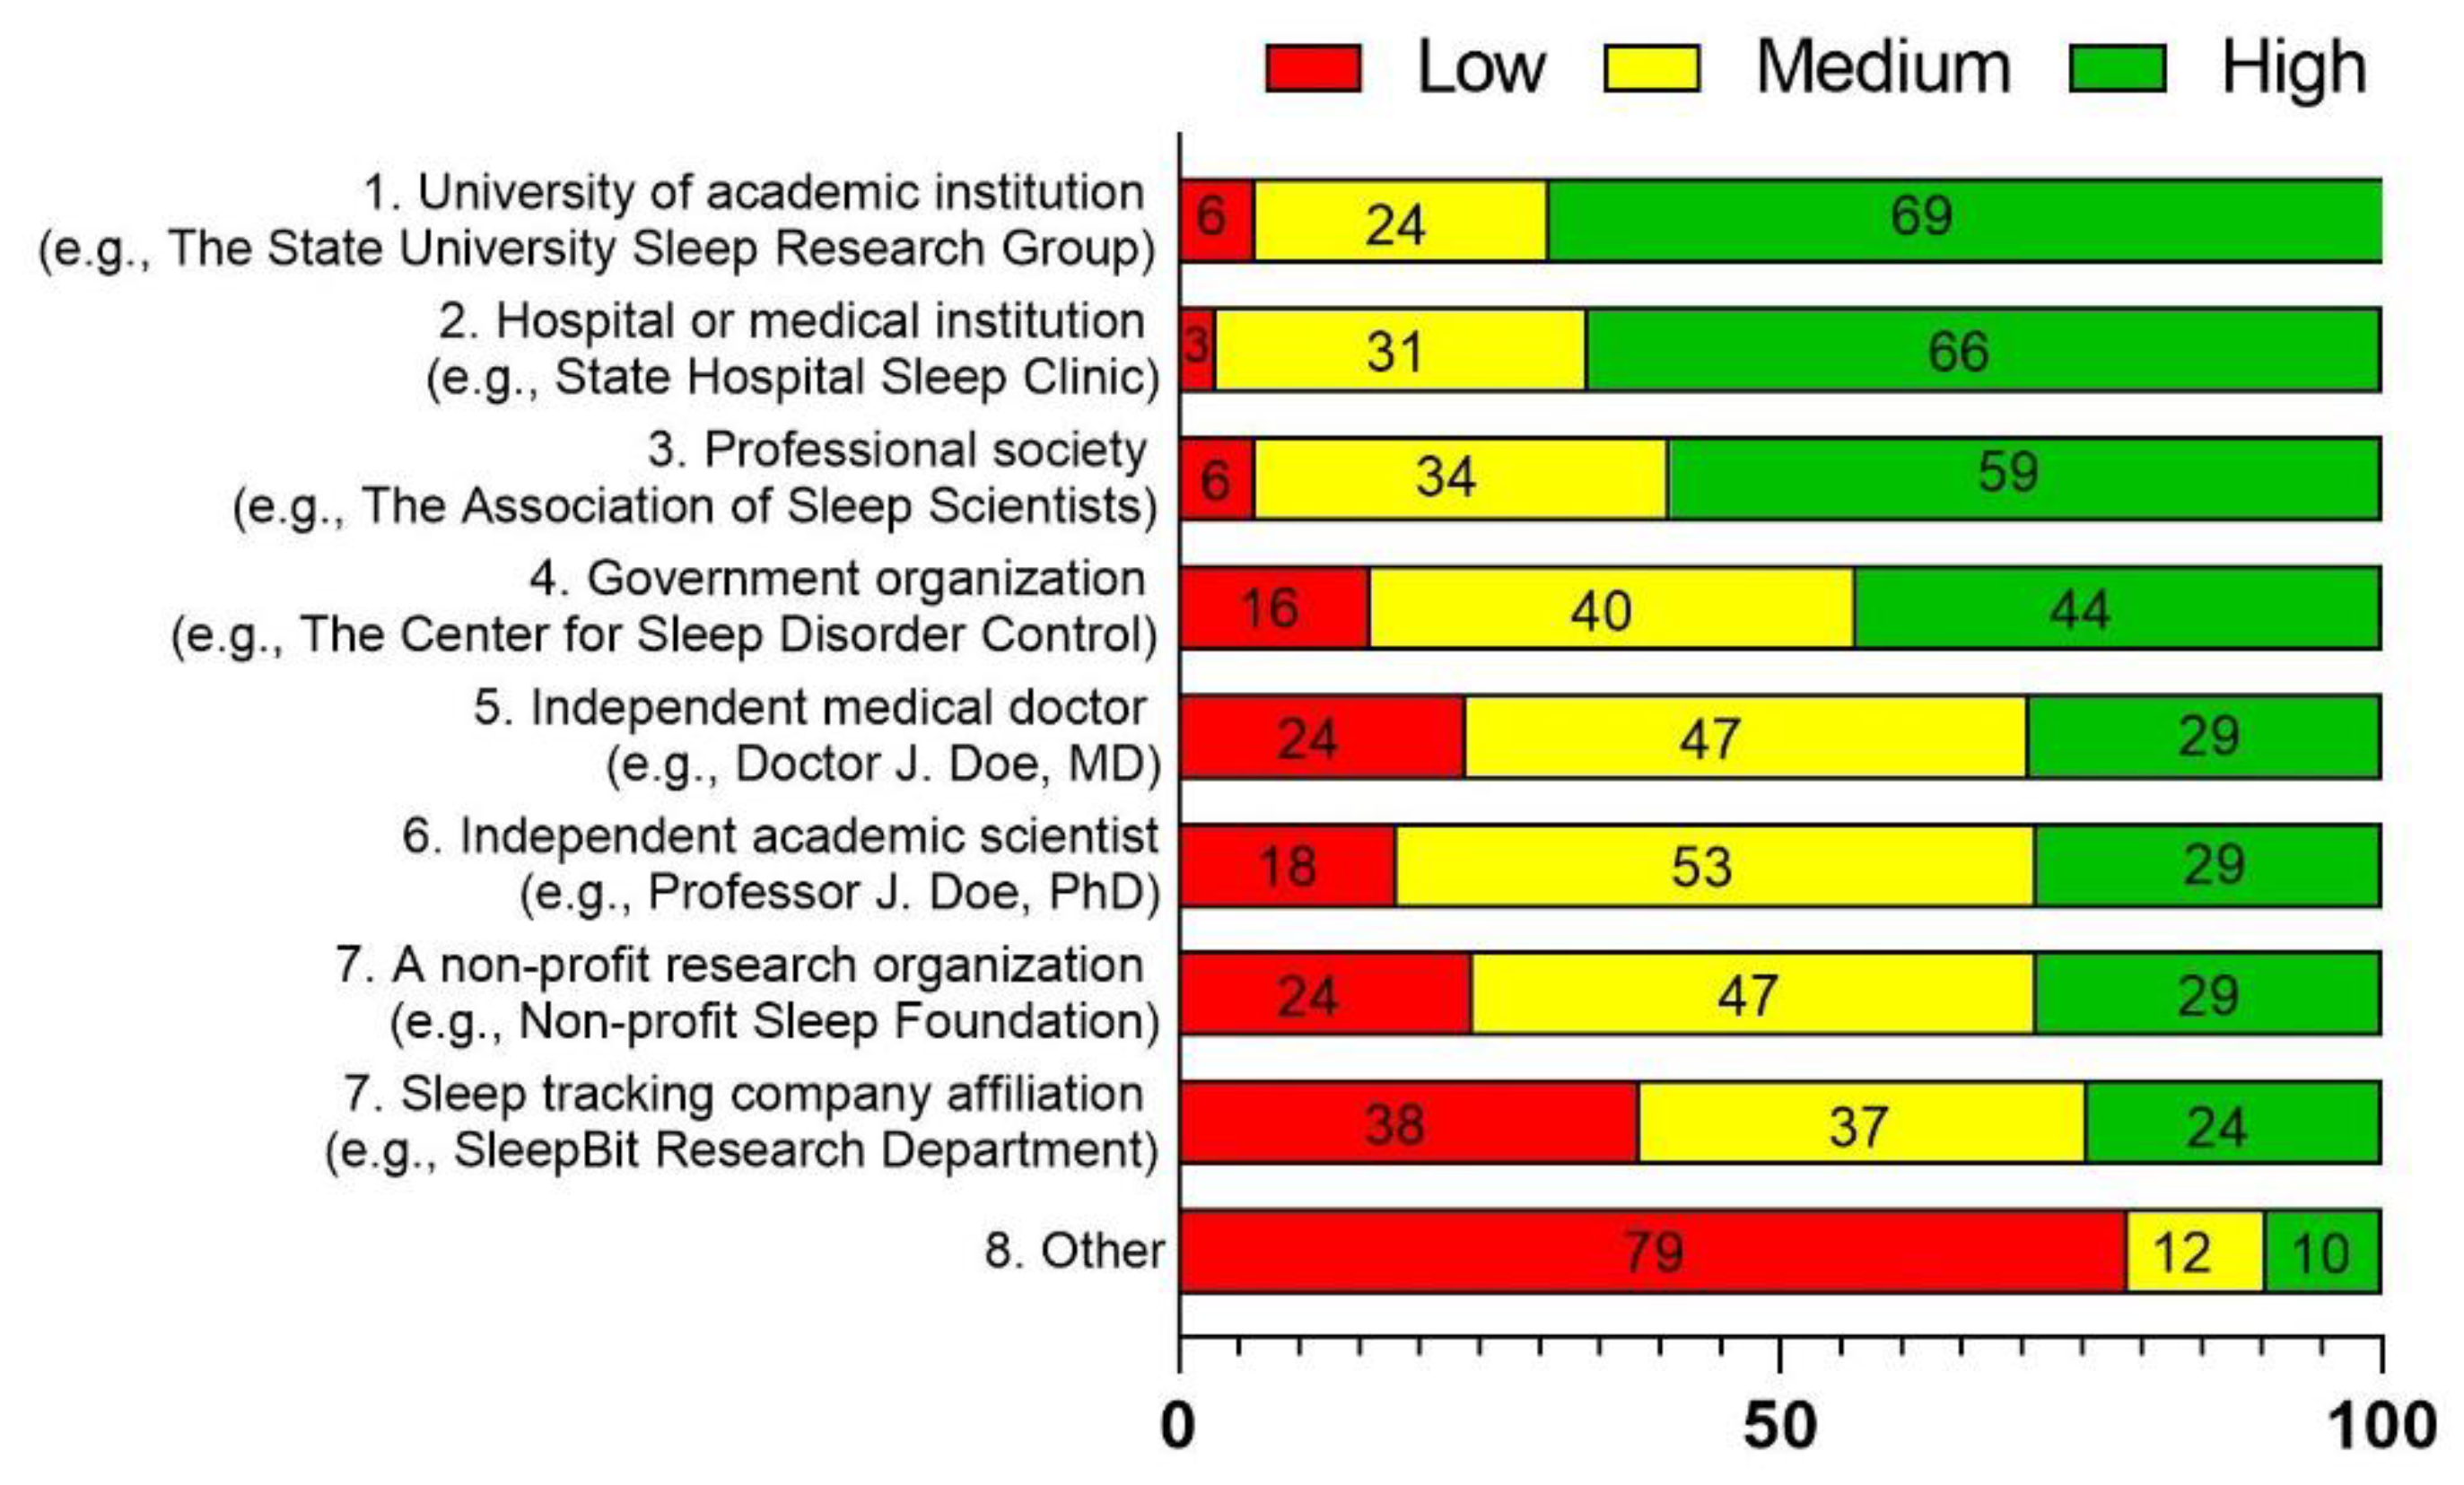
After completing the three purchase tasks, participants responded to three questions relating to the value and importance of validation: (1) Which information about sleep do you consider most valuable for a sleep tracker to report? For which they indicated low, medium, or high value for a number of features; (2) How important is the accuracy of a sleep tracker’s information compared to the following? For which they indicated low, medium, or high importance for a number of technologies; and (3) How much value would you place in endorsement of a wearable’s accuracy and usefulness from the following affiliations? For which they indicated low, medium, or high value for a number of individuals and organizations.
Finally, participants were asked their age, gender, if they had ever visited a sleep specialist or participated in an overnight sleep study, if they currently used a sleep tracking device or application, and if so, their primary reason for tracking their sleep. All survey questions are provided in
Table 1.
2.4 Data Analysis
The screening question was first analyzed using the trend algorithm24, which assumes non-negligible reduction in consumption from the first to last price. A total of 294 participants completed the screening procedures. Of those, 113 did not violate the trend assumption and were permitted access to the full survey. Full survey purchase task data were again analyzed with the trend algorithm, as well as two other algorithms used to determine non-systematic demand curve data [
24]. In addition to trend, we assessed bounces, which assumes that there are no or few price increments accompanied by increments in consumption; and reversals, which assumes that after a participant ceases consumption, they do not resume consumption at a higher price. Demand curve data violated the trend criterion if algorithm output was below 0.025, the bounce criterion if algorithm output was above 0.15, and reversal criterion if there were more than 0 reversals. Data that violated at least two of three criteria were removed from analyses.
Remaining demand curve data were analyzed using guidelines and equations from previous demand curve analyses [
13,
15] (see
supplemental materials for details). Two important parameters are extracted from fitting demand curves with these equations: Q0, which represents the amount of the commodity one would purchase without constraint (i.e., zero cost) and α, which represents the rate of change in elasticity of the demand curve. Demand curve elasticity refers to its slope – elastic demand occurs when goods have relatively low value and consumption of a commodity rapidly decreases as it gets more expensive. This would result in a large α, as the rate of change in the slope of the curve is fast and indicates that consumption is highly sensitive to increases in price. Inelastic demand occurs when goods are relatively valuable and consumption of the commodity does not rapidly decrease as it gets more expensive – consumption may stay the same or drop very little as pries increase, until eventually slowly decreasing. This would result in a small α, as the rate of change in the slope of the curve is slower and indicates that consumption is relatively insensitive to increases in price. As shown in
Figure 1, the typical demand curve transitions from an inelastic range to an elastic range as price increases and the α parameter is a gauge of how fast that transition occurs.
The Q0 values were constrained to a maximum of 100, which was the highest probability allowed on the survey; any Q0 values above 100 would not be possible due to the electronic-entry nature of the task. To evaluate the degree to which the watches shared the same α parameter, models were compared using the Akaike’s Information Criteria [
26] corrected for small sample sizes (AICc) as this provides a probability measure to describe the likelihood the data were generated from the same or different models.
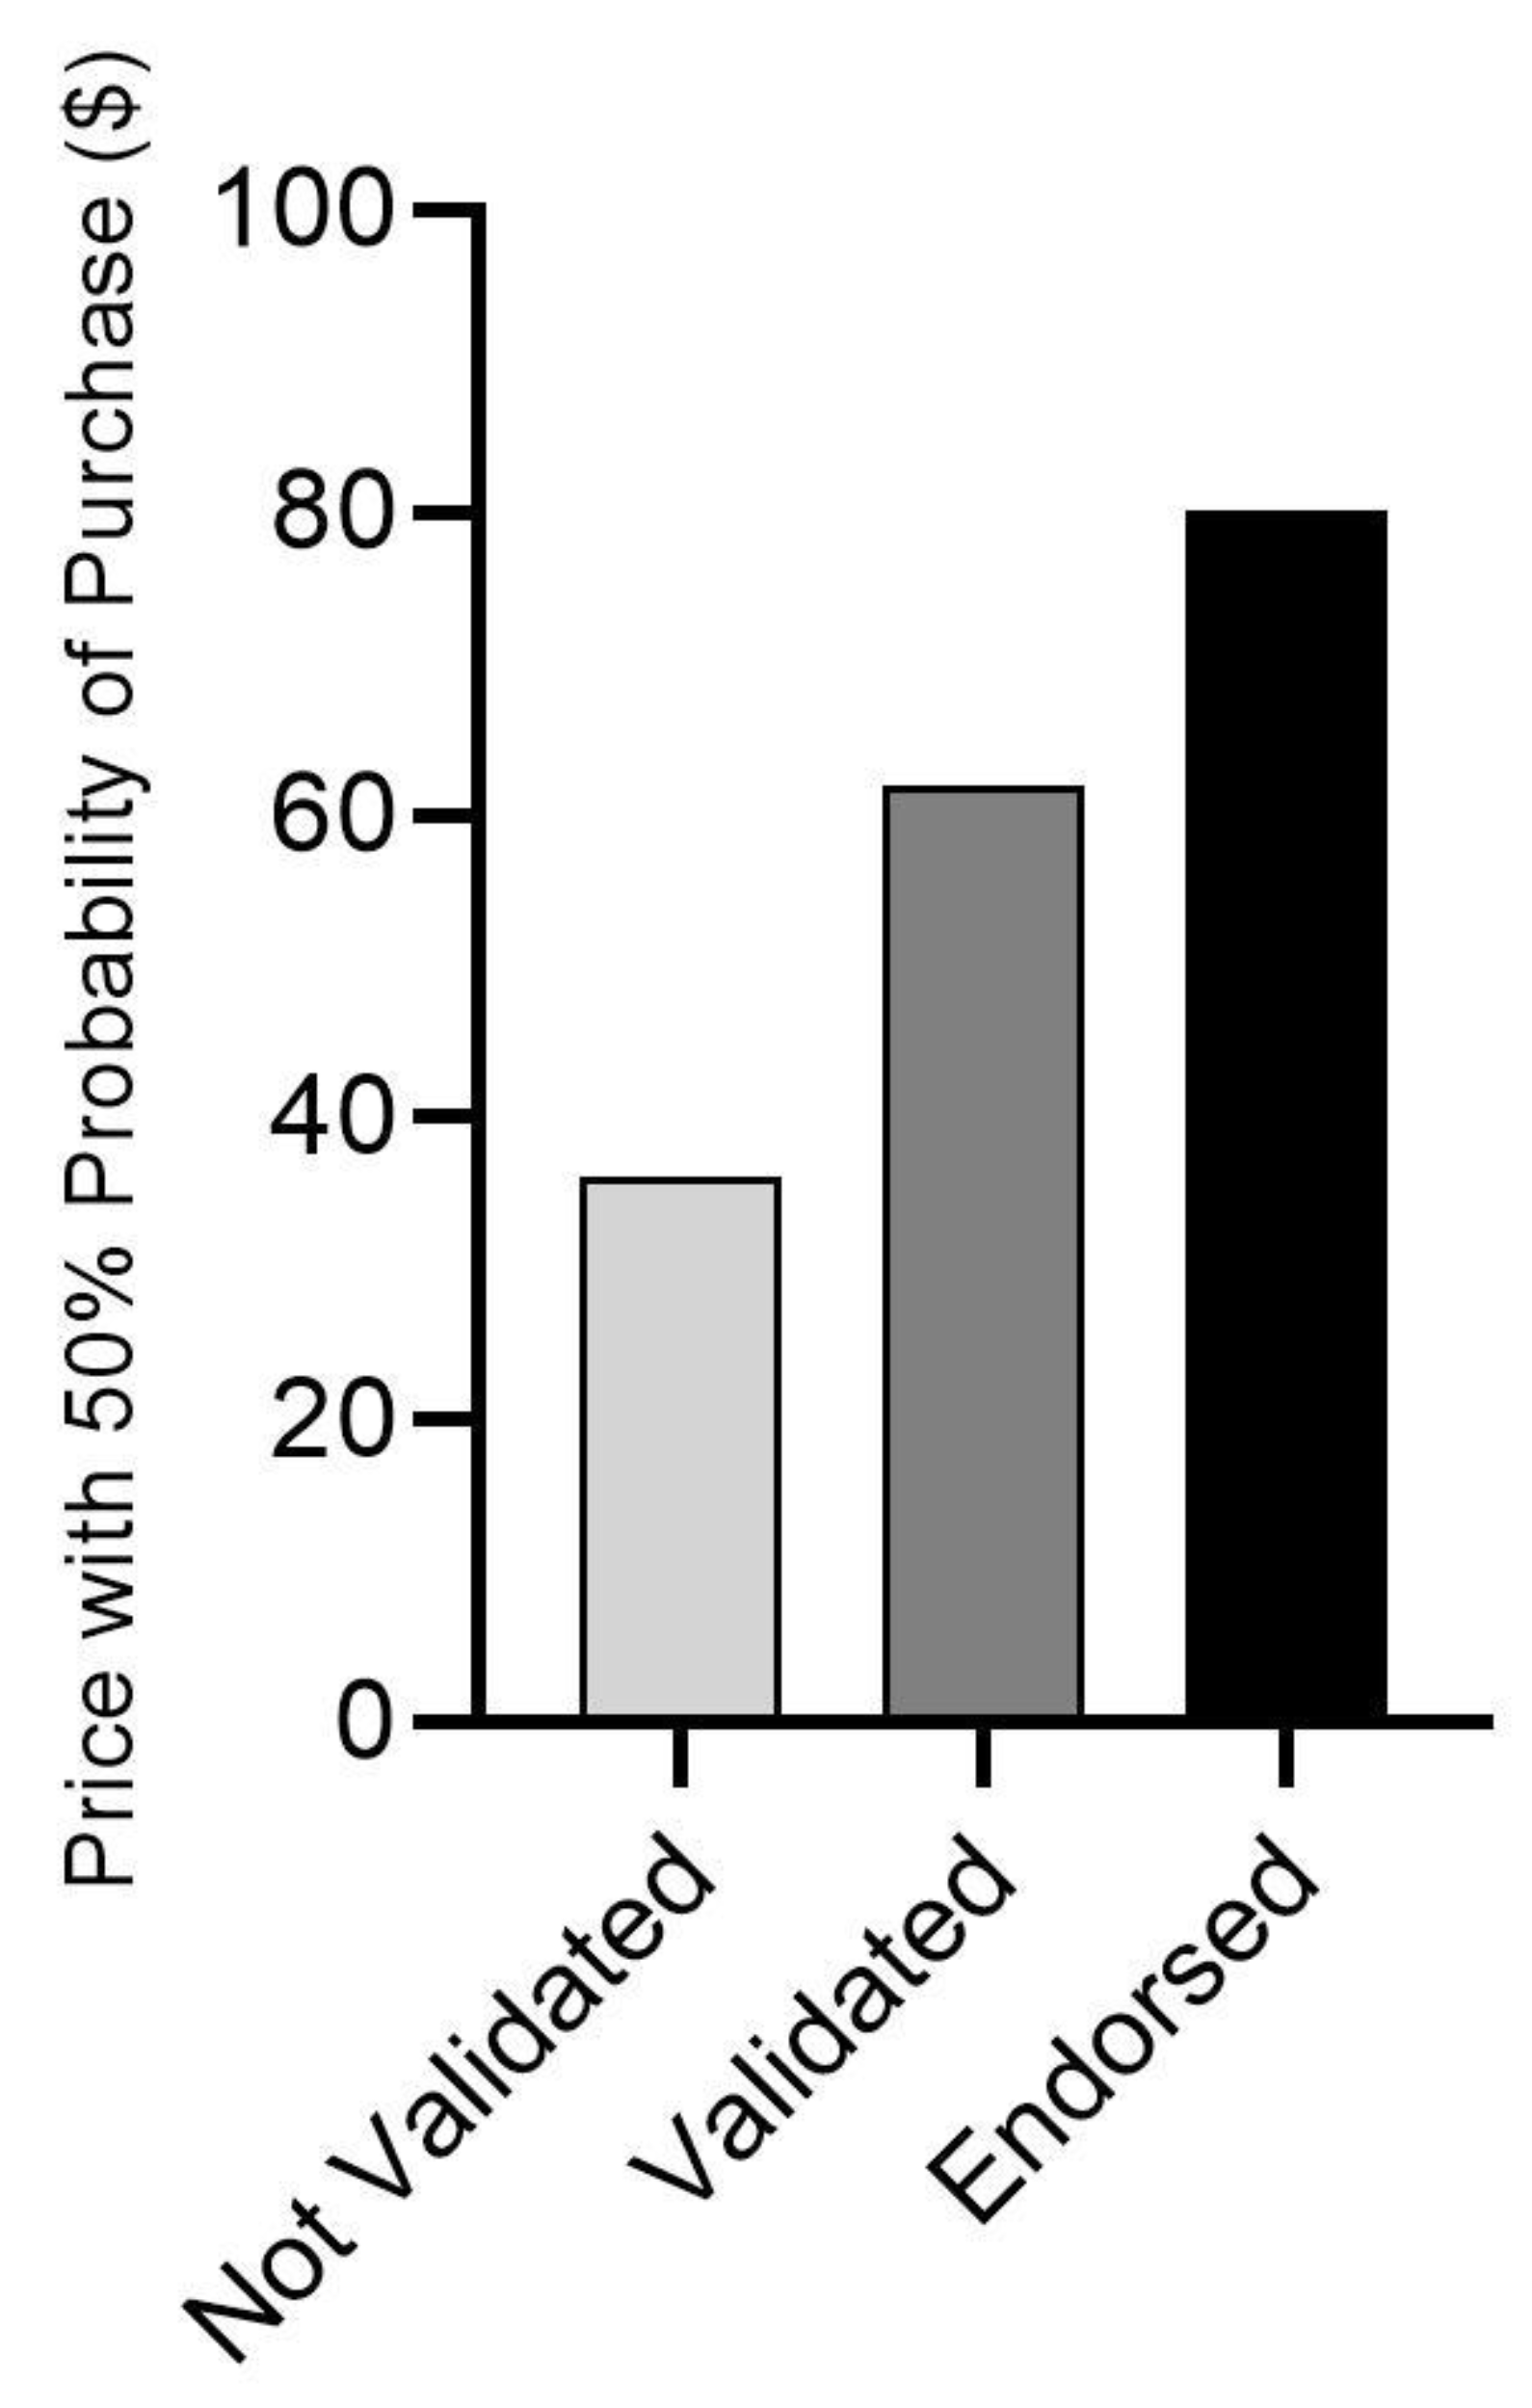
To compare the probability of purchase at different price points, the probability of purchase was estimated for a curve of 1000 data points. The price at which, on average, there was at least 50% probability of purchasing the device was determined for all three devices.
For the remaining questions, the percentage of participants indicating high, medium, and low value or importance was calculated. Percentages were calculated by total number of respondents per question, rather than the total survey takers. At least 92 of 94 participants recorded their value or importance level for each response value.
3. Results
A total of N=294 participants completed the screening questions. Of these, N=113 were given access to the full survey. A total of N=106 respondents completed the full survey. Twelve (N=12) participants failed at least one attention check question and were removed from the data set. Data analysis was conducted on the remaining N=94 participants data. Participant demographics for these N=94 respondents are displayed in
Table 2.
3.1 Demand Curve Analysis
The remaining N=94 participant’s purchase task data were then processed through the trend, bounce, and reversal algorithms. Twelve (N=12) cases were removed for the NV device data set and N=13 cases were removed from each the V and VE device data sets. Therefore, the final N for the NV device was N=82, and for the V and VE devices was N=81.
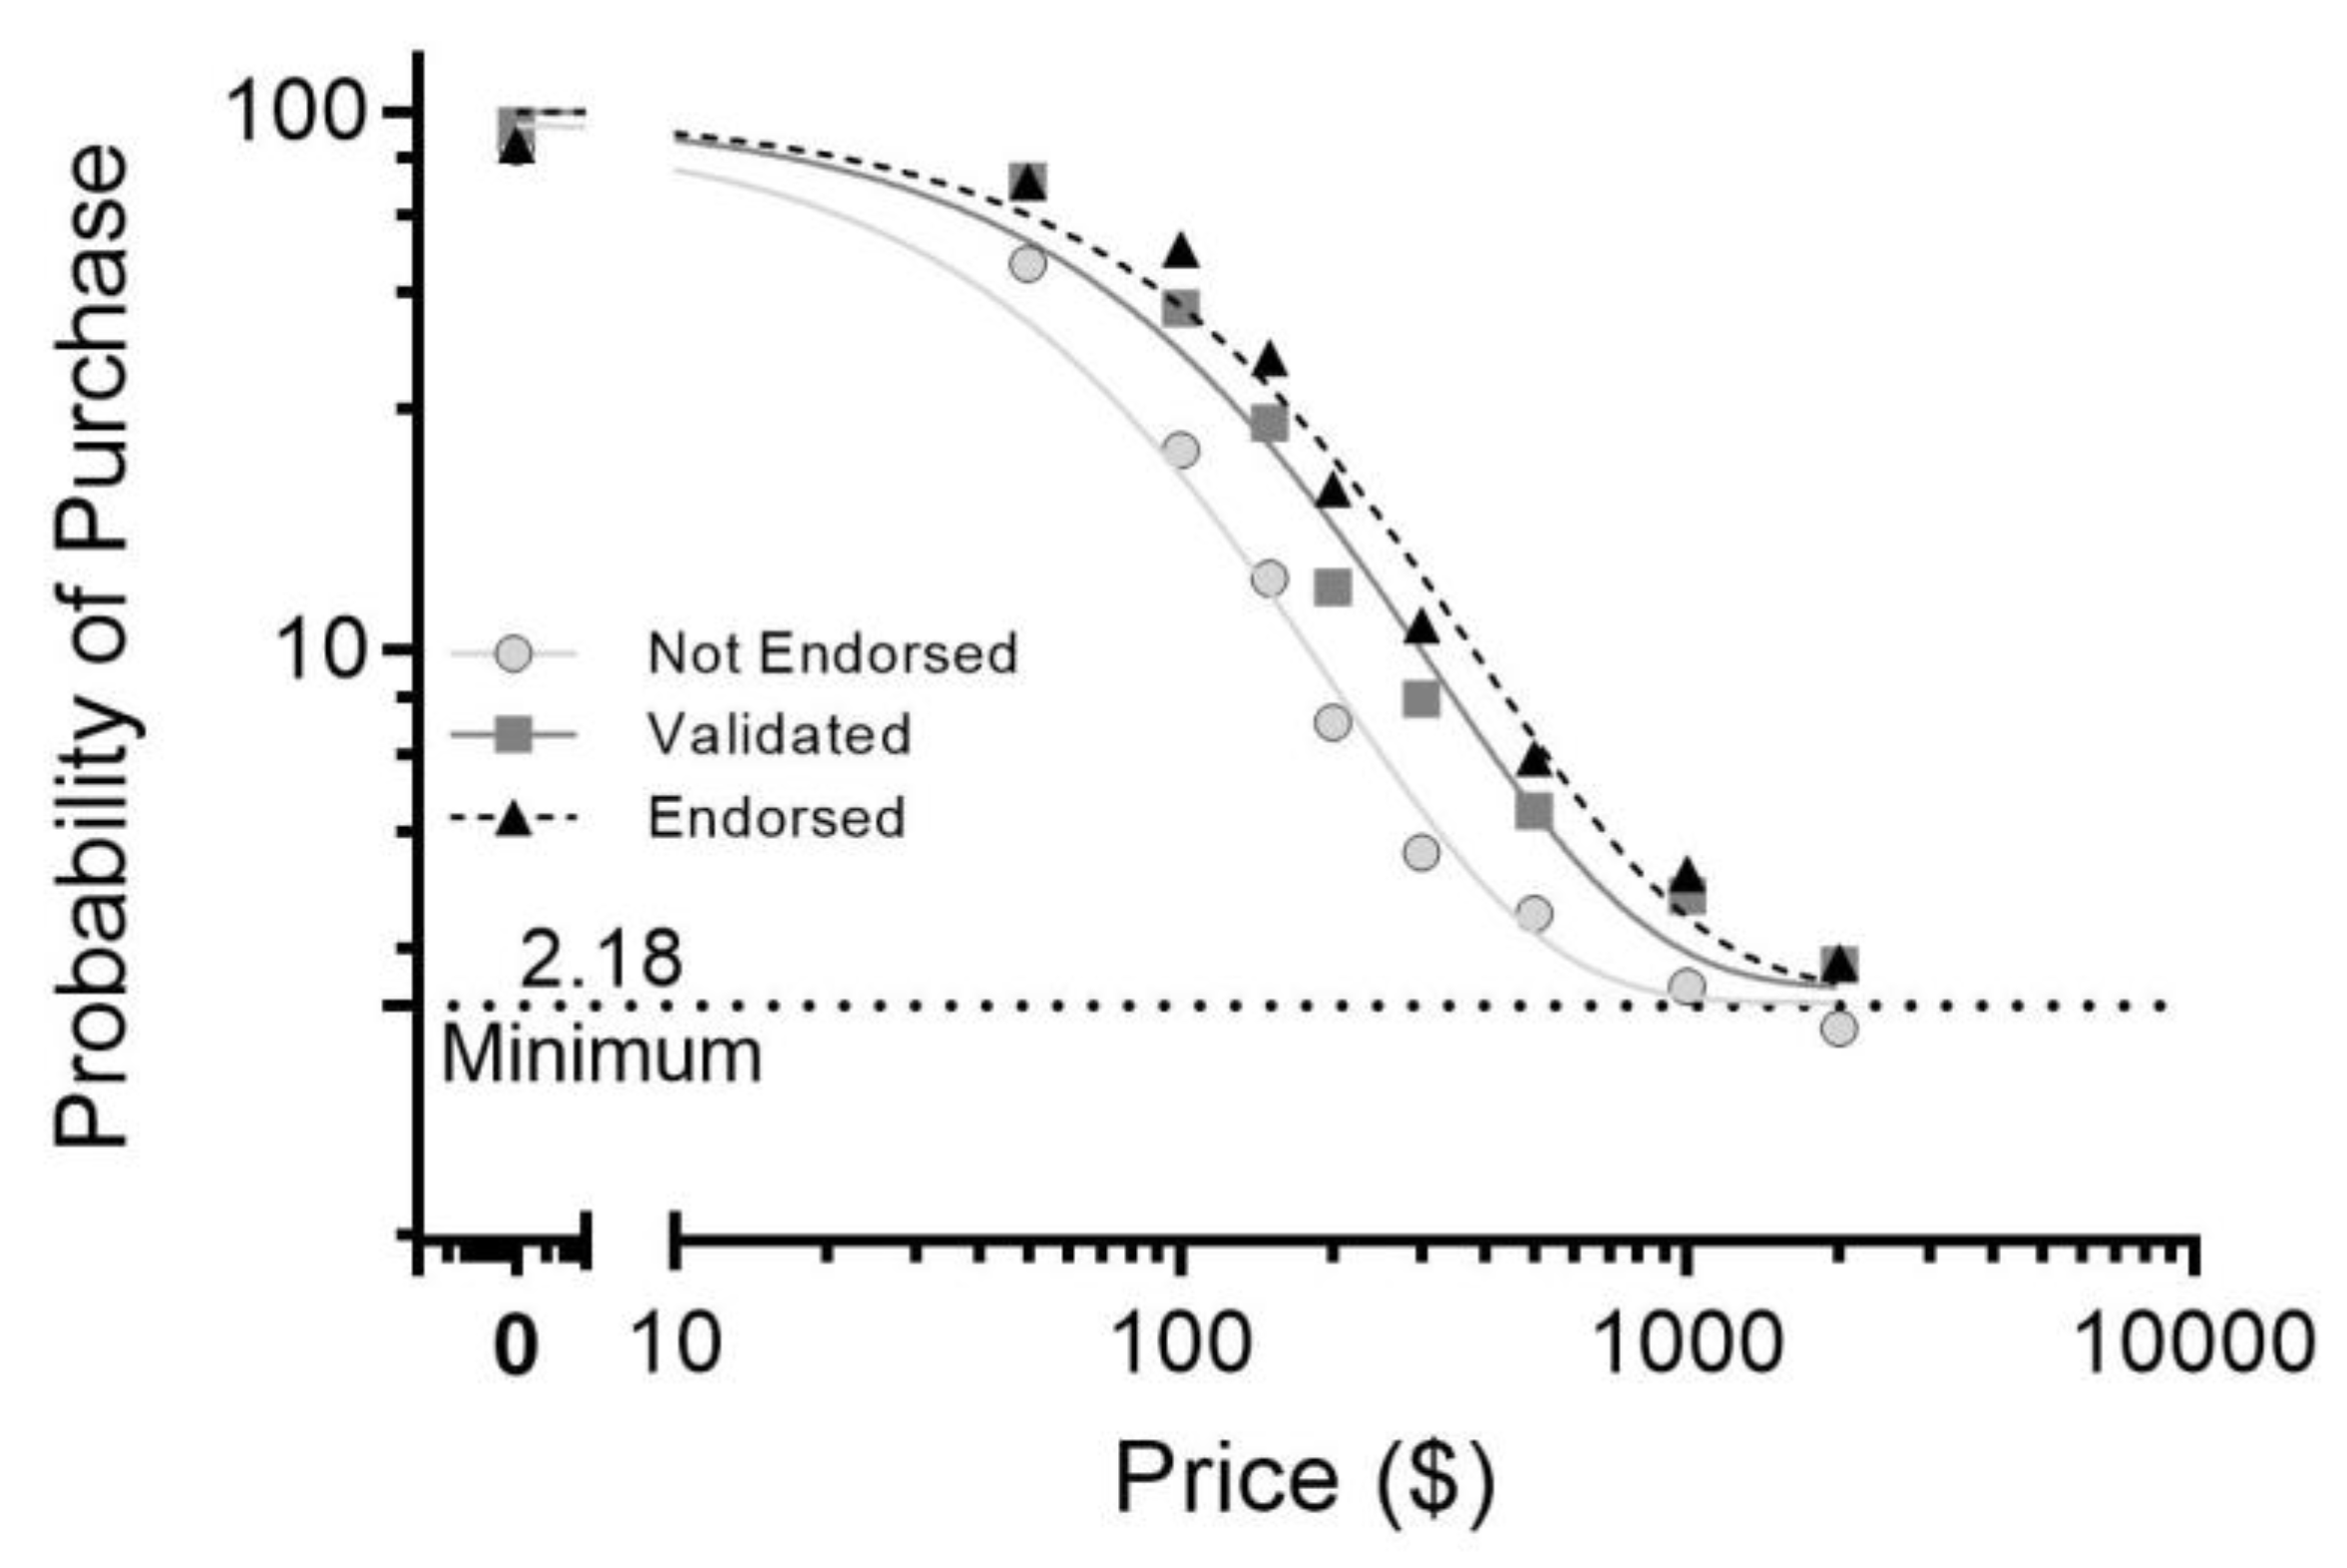
Figure 2 displays the demand curves for all three watch types. As expected, as the prices increased, the likelihood of purchasing any device decreased. The best-fitting models were significantly different across all three devices, and that differences were due to the α value, our measure of sensitivity of demand to increasing prices. Post hoc analyses determined significant differences between the NV and V device (AICc = 100%), the V and VE device (AICc = 73.3%), and the NV and VE device (AICc > 99.9%). The most price-elastic device was the NV device, followed by the V, and then the VE device.
Figure 3 displays a bar chart of the price at which there was at least 50% probability of purchase for each device. The probability of purchase was at least 50% at
$36.04 for the NV device,
$62.07 for the V device, and
$80.09 for the VE device.
3.2 Survey Responses
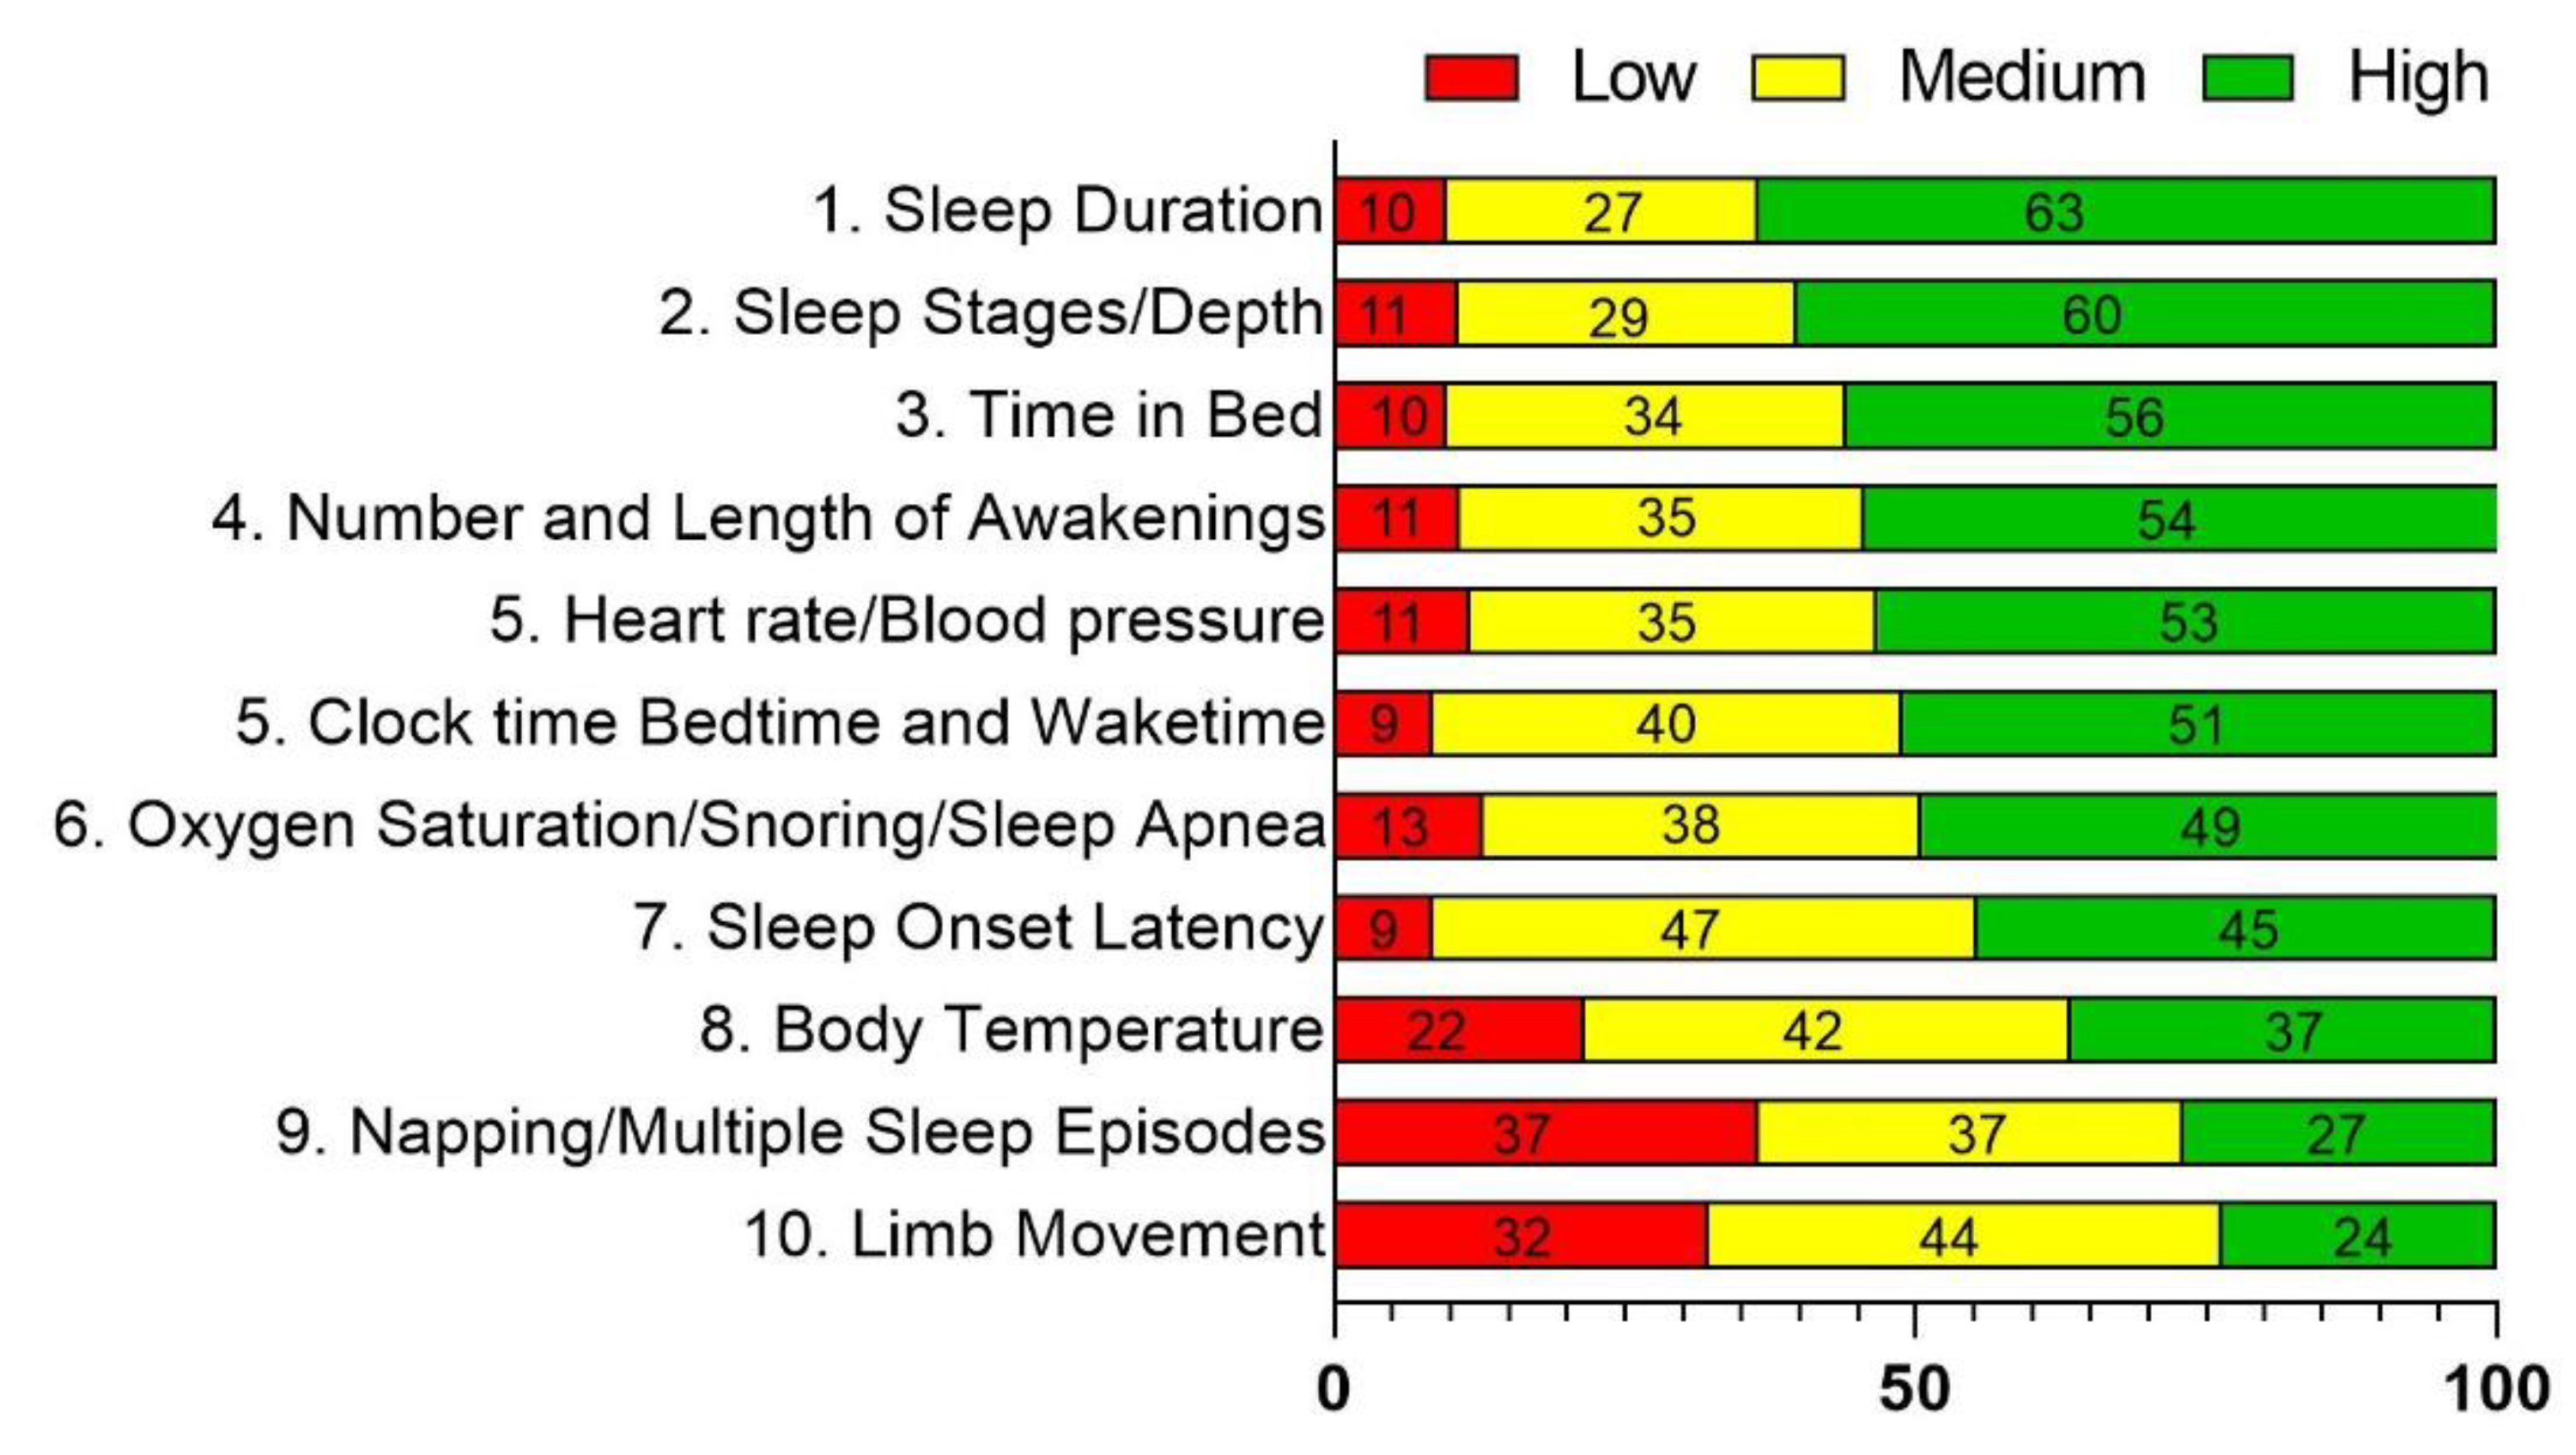
Participants responded the three questions related to the value or importance of validation for sleep-tracking devices. Responses to Q4-Q6 are depicted in
Figure 4,
Figure 5 and
Figure 6. On Q4, the top three most valuable features were a measure of sleep duration (63%), sleep staging/depth (60%), and time in bed (56%). On Q5, a majority participants indicated that it is of high importance that the sleep-tracker is accurate compared to measures of sleep from a laboratory or hospital (63%) and a research grade sleep tracker (58%). Finally, on Q6, A majority of respondents would put high value on sleep tracker endorsements from a university or academic institution (69%), a hospital or medical institution (66%), or a professional society (66%). For all three questions, some respondents gave some value or importance to the “Other” option, but only a few gave specific answers for Q5 (e.g., “sleep in daytime”, “CDC average of sleep factors”, and “consistency”) and Q6 (e.g., “consumer opinion” and “independent clinic”).
4. Discussion
The goal of this report was to establish if consumer demand for CSTs was sensitive to device performance evaluation and expert endorsement of devices. This is an important endeavor as it can guide both CST manufactures and sleep researchers in the development and use of devices that general consumers want to use. The addition of performance evaluation against laboratory measures and expert sleep researcher endorsement impacted demand in an orderly manner, with demand for a device with performance evaluation being significantly higher than demand for a device without performance evaluation, and demand for a device with expert sleep endorsement being significantly higher than demand for either the evaluated and non-evaluated devices. These results suggest that laboratory evaluation alone is important to consumers, but a clear endorsement provides even more value. Our findings indicate that there is a potential unit value increase of $25 for device evaluation and $44 for evaluation and endorsement. By that metric, the validated and endorsed device (VE) was more than twice as valuable as the non-validated device (NV), $80.09 versus $36.04.
Our survey also addressed the value and importance placed on how and by whom CSTs are validated. Respondents considered performance evaluation against laboratory sleep measures and research-grade actigraphy to be most important, and performance evaluation by academic institutions, hospitals, or professional societies to be most valuable. Opinions about the method of performance evaluation matches with the current state of CST evaluation studies – devices are most typically compared to PSG, the gold-standard laboratory sleep measure, and research-grade actigraphy. Further, these evaluation studies are typically done by researchers at universities, hospitals, and government-based research programs (e.g., Naval Health Research Center [
8]). The least-trusted organization for performance evaluation was the device manufactures themselves, indicating that independent evaluation may be more important than evaluations conducted through universities or hospitals that have publicized partnerships with CST companies.
It is important to consider that consumers may have preconceived notions of what they want in a CST even though they are unable to actually assess these features. For example, respondents indicated that accurate sleep measurement and performance evaluation was of high importance to them. However, without the CST companies advertising accuracy or the open-access availability of published independent lab evaluation studies, respondents likely do not have an objective method for determining device accuracy. Another point to consider is that the terms “accuracy” and “validation” may influence consumers’ perception of a device without providing the full scientific context. Sleep researchers are aware that “accuracy” refers to performance on specific measures against a standard and that validation refers to the testing procedure, not the outcome, but general consumers may not be aware or interested in these details. Scientific endorsement of a device could potentially supersede the influence of affirmative terms like “accuracy” or “validation” that are frequently used to describe performance evaluation by eliminating the need for the average consumer to interpret those terms.
In terms of device features that are desirable to the general consumer, sleep duration and sleep staging/depth estimation were ranked as most important to consumers. Sleep duration, or total sleep time (TST), was also ranked as most important in our previous survey evaluating demand for features within a sleep researcher population [
7]. However, sleep researchers ranked sleep staging/depth estimation second to lowest in that survey. It is beyond the scope of this analysis to directly examine why sleep researchers and consumers have such discordant opinions on the importance of sleep staging. Consumers’ high ranking of sleep staging may be related to the perception that it is a scientifically-relevant measure whereas sleep researchers’ low ranking of sleep staging may be related to the fact that sleep staging is not equivalent to PSG [
28]. It is possible that general consumers would rank sleep staging as less important if they were aware of the current shortcomings of this metric. As CST technology improves, however, it is possible that sleep staging can approach equivalence to PSG measures [
28], which may result in a change of opinion about CST sleep depth estimation within the sleep research community and the production of a device that satisfies both researchers and consumers.
5. Conclusions
In summary, general consumer demand is greatest for a device that has been evaluated by an independent laboratory for accuracy in measuring sleep and is endorsed by an academic, medical, or government institution. Consumers consider measurements of sleep duration (TST, TIB), sleep staging, and objective sleep quality as measured by number of awakenings as the most important device features in a CST. Consumers appear to value scientific evaluation and endorsement, but may over value certain features, such as sleep staging/depth, much more than sleep scientists or clinicians. The results for this survey contribute to an on-going project to quantify economic demand for CSTs in the context of scientific relevancy in order to encourage improvements to CST development from both a research and business perspective.
Supplementary Materials
Guidelines and equations from previous demand curve analyses with citations.
Author Contributions
Conceptualization, LPS, JKD, and SRH; methodology, LPS, JKD, JC, SRH; formal analysis, LPS, JKD, and JC; data curation, LPS and JC; writing—original draft preparation, LPS; writing—review and editing, JKD, JC, and SRH; supervision, SRH. All authors have read and agreed to the published version of the manuscript.
Funding
This research received no external funding.
Data Availability Statement
Data is available from the authors upon request.
Conflicts of Interest
The authors declare no conflict of interest.
References
- Khosla, S.; Deak, M.C.; Gault, D.; et al. Consumer Sleep Technology: An American Academy of Sleep Medicine Position Statement. J Clin Sleep Med. 2018, 14(05), 877–880. [Google Scholar] [CrossRef] [PubMed]
- Dolan, B. Fitbit unveils Flex: a wrist-worn activity, sleep tracker. Mobi Health News. https://www.mobihealthnews.com/19728/fitbit-unveils-flex-a-wrist-worn-activity-sleep-tracker/. 2013.
- Menghini, L.; Cellini, N.; Goldstone, A.; Baker, F.C.; de Zambotti, M. A standardized framework for testing the performance of sleep-tracking technology: step-by-step guidelines and open-source code. Sleep. 2021, 44(2), zsaa170. [Google Scholar] [CrossRef]
- Liang, Z.; Nishimura, T. Are wearable EEG devices more accurate than fitness wristbands for home sleep Tracking? Comparison of consumer sleep trackers with clinical devices. In: IEEE 6th Global Conference on Consumer Electronics (GCCE). IEEE, USA, October 25th 2017.
- Evenson, K.R.; Goto, M.M.; Furberg, R.D. Systematic review of the validity and reliability of consumer-wearable activity trackers. Int J Behav Nutr Phys Act. 2015, 12(1), 159. [Google Scholar] [CrossRef]
- Grandner, M.A.; Lujan, M.R.; Ghani, S.B. Sleep-tracking technology in scientific research: looking to the future. Sleep. 2021, 44(5), zsab071. [Google Scholar] [CrossRef] [PubMed]
- Devine, J.K.; Schwartz, L.P.; Choynowski, J.; Hursh, S.R. Expert Demand for Consumer Sleep Technology Features and Wearable Devices: A Case Study. IoT. 2022, 3(2), 315–331. [Google Scholar] [CrossRef]
- Chinoy, E.D.; Cuellar, J.A.; Huwa, K.E.; et al. Performance of seven consumer sleep-tracking devices compared with polysomnography. Sleep. 2021, 44(5), zsaa291. [Google Scholar] [CrossRef]
- Lujan, M.R.; Perez-Pozuelo, I.; Grandner, M.A. Past, Present, and Future of Multisensory Wearable Technology to Monitor Sleep and Circadian Rhythms. Front Digit Health. 2021, 3, 721919. [Google Scholar] [CrossRef]
- Comstock, J. Class action lawsuit alleges Fitbit misled buyers with inaccurate sleep tracking. Mobi Health News. https://www.mobihealthnews.com/43499/class-action-lawsuit-alleges-fitbit-misled-buyers-with-inaccurate-sleep-tracking. 2015.
- Jacobs, E.A.; Bickel, W.K. Modeling drug consumption in the clinic using simulation procedures: demand for heroin and cigarettes in opioid-dependent outpatients. Exp Clin Psychopharm. 1999, 7(4), 412–426. [Google Scholar] [CrossRef] [PubMed]
- Roma, P.G.; Hursh, S.R.; Hudja, S. Hypothetical purchase task questionnaires for behavioral economic assessments of value and motivation. Manage Decis Econ. 2016, 37(4-5), 306-323.
- Gilroy, S.P.; Kaplan, B.A.; Schwartz, L.P.; Reed, D.D.; Hursh, S.R. A zero-bounded model of operant demand. J Exp Anal Behav. 2021, 115(3), 729–746. [Google Scholar] [CrossRef]
- Koffarnus, M.N.; Franck, C.T.; Stein, J.S.; Bickel, W.K. A modified exponential behavioral economic demand model to better describe consumption data. Exp Clin Psychopharm. 2015, 23(6), 504–512. [Google Scholar] [CrossRef]
- Hursh, S.R.; Silberberg, A. Economic demand and essential value. Psychol Rev. 2008, 115(1), 186–198. [Google Scholar] [CrossRef] [PubMed]
- Strickland, J.C.; Alcorn, J.L.; Stoops, W.W. Using behavioral economic variables to predict future alcohol use in a crowdsourced sample. J Psychopharmacol. 2019, 33(7), 779–790. [Google Scholar] [CrossRef] [PubMed]
- Strickland, J.C.; Marks, K.R.; Bolin, B.L. The condom purchase task: a hypothetical demand method for evaluating sexual health decision-making. J Exp Anal Behav. 2020, 113(2), 435–448. [Google Scholar] [CrossRef] [PubMed]
- Reed, D.D.; Kaplan, B.A.; Becirevic, A.; Roma, P.G.; Hursh, S.R. Toward quantifying the abuse liability of ultraviolet tanning: A behavioral economic approach to tanning addiction. J Exp Anal Behav. 2016, 106(1), 93–106. [Google Scholar] [CrossRef]
- Mackillop, J.; Murphy, C.M.; Martin, R.A.; et al. Predictive validity of a cigarette purchase task in a randomized controlled trial of contingent vouchers for smoking in individuals with substance use disorders. NICTOB. 2016, 18(5), 531–537. [Google Scholar] [CrossRef]
- Bickel, W.K.; Johnson, M.W.; Koffarnus, M.N.; MacKillop, J.; Murphy, J.G. The behavioral economics of substance use disorders: reinforcement pathologies and their repair. Annu Rev Clin Psychol. 2014, 10(1), 641–677. [Google Scholar] [CrossRef] [PubMed]
- Schwartz, L.P.; Hursh, S.R. A behavioral economic analysis of smartwatches using internet-based hypothetical demand. Manage Decis Econ. 2022, 43(7), 2729–2736. [Google Scholar] [CrossRef]
- Brown, J.; Washington, W.D.; Stein, J.S.; Kaplan, B.A. The gym membership purchase task: early evidence towards establishment of a novel hypothetical purchase task. Psychol Rec. 2022, 72(3), 371–381. [Google Scholar] [CrossRef]
- Strickland, J.C.; Stoops., W.W. The use of crowdsourcing in addiction science research: amazon mechanical turk. Exp Clin Psychopharm. 2019, 27(1), 1-18.
- Stein, J.S.; Koffarnus, M.N.; Snider, S.E.; Quisenberry, A.J.; Bickel, W.K. Identification and management of nonsystematic purchase task data: toward best practice. Exp Clin Psychopharm. 2015, 23(5), 377–386. [Google Scholar] [CrossRef]
- de Zambotti, M.; Menghini, L.; Grandner, M.A.; et al. Rigorous performance evaluation (previously, “validation”) for informed use of new technologies for sleep health measurement. Sleep Health. 2022, 8(3), 263–269. [Google Scholar] [CrossRef]
- Akaike, H. A new look at the statistical model identification. IEEE Trans Automat Contr. 1974, 19(6), 716–723. [Google Scholar] [CrossRef]
- Hursh, S.R. Behavioral economics and the analysis of consumption and choice. In Wiley Blackwell Handbook of Operant Classical Conditioning; McSweeney, F.K., Murphy, E.S., Eds.; Wiley-Blackwell: West Sussex, UK, 2014; pp. 275–305. [Google Scholar]
- de Zambotti, M.; Cellini, N.; Goldstone, A.; Colrain, I.M.; Baker, F.C. Wearable Sleep Technology in Clinical and Research Settings. Med Sci Sport Exer. 2019, 51(7), 1538–1557. [Google Scholar] [CrossRef] [PubMed]
|
Disclaimer/Publisher’s Note: The statements, opinions and data contained in all publications are solely those of the individual author(s) and contributor(s) and not of MDPI and/or the editor(s). MDPI and/or the editor(s) disclaim responsibility for any injury to people or property resulting from any ideas, methods, instructions or products referred to in the content. |
© 2023 by the authors. Licensee MDPI, Basel, Switzerland. This article is an open access article distributed under the terms and conditions of the Creative Commons Attribution (CC BY) license (http://creativecommons.org/licenses/by/4.0/).

