I. Introduction
Manufacturing equipment is an important part of manufacturing system. The accuracy of information data generated in the production process directly affects the reliability of the whole manufacturing system. Therefore, real-time acquisition of accurate production information data of manufacturing equipment is a necessary condition for effective control of equipment operation, scientific maintenance and normal operation of manufacturing system. In order to improve the working reliability of the manufacturing system, in recent years, some experts have actively engaged in the research of improving the accuracy of information detection, and have achieved some research results Gianmarco Lazzini et al. [
1] proposed repeatability of a given process or feature theory to improve surface texturing and micro-machining processes precision. Chen Xin et al. [
2] proposed a differential evolution algorithm on Geographic Information Science (GIS) attribute data precision detection. Dai Yujia et al. [
3] proposed a spatial confinement combined with gradient descent on improvement of Fe element in aluminum alloy. Duan Zhenyun et al. [
4] proposed a subpixel-level edge detection algorithm based on the Gaussian integral model gear tooth high efficiency measurement. Liang Yan [
5] 3-D laser scanning technology in the field of improving the accuracy of 3D geographic information data detection. Guo Min [
6] apply sensitive data declassification technology to geographic information inspection. Wang Yu and Wu Wei xin [
7] apply fuzzy association rules in improve the accuracy of information data transmission field. These methods have two application features, one is the limitations of application objects, the other is they can only be applied to the field of fixed equipment, so they are cannot be applied to improve the detection accuracy of mobile equipment information data. Therefore, there is an urgent need for a method to improve the information detection accuracy of mobile equipment.
In recent years, integrated manufacturing systems have been used in industrial fields widely, It uses the transmission mode of a wireless network to realize a real-time detection function of the work information of mobile equipment. However, in practice, it is found that due to the influence of many factors, the application of wireless network in mobile device information detection will have the problem of insufficient reliability. The main influencing factors include detection equipment performance, equipment working environment, information signal interference, and energy loss in the transmission process. Under the separate or joint action of these factors, it is inevitable that there will be unpredictable errors in the information detection value. Therefore, the above methods is not suitable for improving the data accuracy of mobile device production information. To improve the accuracy of information detection data, most experts and scholars use data fusion to effectively process the detection error of information data under a wireless network. The common data fusion methods include neural networks, Bayesian estimation, Dempster-Shafer (D-S) theory, and fuzzy correlation [
8,
9,
10,
11]. Among them, the acquisition of the new probability of the Bayesian estimation method must be based on the prior probability, so there are limitations in the scope of application [
8]. the D-S evidence theory can fuse uncertain problems when the prior probability is unknown and use the basic probability assignment to represent the probability of uncertain problems [
9], but this method cannot be applied to high conflict evidence fusion. 2020, Murphy proposed a mean evidence combination rule, which can achieve good fusion effect when there is more evidence [
10], but it does not consider the correlation between multiple sources of evidence, so the fusion effect is not ideal when there is less evidence. 2016, Zhou Jian et al. [
11] proposed a multi-sensor data fusion water quality judgment method based on interval evidence theory. This method can judge the water quality grade by looking for abnormal values of individual sensors, but the algorithm has the dual shortcomings of poor fusion of extreme data and an excessive amount of interval number calculation. More importantly, in engineering applications, all the algorithms mentioned above have the following problems:
- (1)
they do not consider the problem of energy attenuation in the process of information propagation. Therefore, the processed information data is inevitably distorted.
- (2)
They do not take into account the variety and randomness of changes of information data influencing factors in engineering practice. Therefore, there is a problem of application reliability.
Because of these problems, they cannot fundamentally solve the problem of production information distortion of mobile manufacturing equipment in integrated manufacturing systems. Therefore, until today, we haven’t find a production information data processing method can be applied mobile manufacturing equipment of integrated manufacturing system.
To solve these problems, our team has engaged in research on methods using fractional-order calculus theory in data processing for many years, and found that the fractional order differential operator has the dual function of improving the signal strength and reducing the variability between information data, which can improve the transmission distance and detection accuracy of information data effectively [
12,
13,
14,
15,
16,
17,
18]. Based on previous research, in this study, we apply fractional calculus theory to data detection of production information of mobile manufacturing equipment in integrated manufacturing system.
2. Fractional Differential Definition and Its Application
2.1. Fractional Differential Definition
Fractional differentials, also named fractional derivatives, it extend the differential order of an integer-order differential equation to a fractional order. The concept of the fractional differential emerged in 1812 [
19]. In the hundreds of years of development of this theory, many scholars have proposed their own definition methods and theoretical systems based on their own understanding and application fields. Therefore, a strict definition of fractional differentials is not available to date. At present, the commonly used definitions are those of Grunwald–Letnikov (G-L), Caputo, and Riemann–Liouville (R-L) [
20,
21].
2.1.1. R-L fractional differential operator
According to the principle of mutual inverse operation of Cauchy’s indefinite integral formula with the fractional differentiation and fractional integration, can obtain the R-L definition of fractional differentiation:
In the equation above, 0 ≤ n-1 < n, Г is the gamma function.
The main advantage of this definition is that the initial value of its Laplace transform can be obtained only by using the integer order derivative. Its disadvantage is that it has stricter requirements on the function f(x) than other definitions, but its premise is the integer order derivative of the function f(x) is absolutely integrable.
2.1.2. G-L fractional differential operator
In the equation above, 0 ≤
n-1 <
n, and
According to the definition of integral derivative of function, this definition extends the order of differential from integer to fraction, which is suitable for numerical calculation.
2.1.3. Caputo fractional differential operator
In the equation above, 0 ≤ n-1 < n.
In order to simplify the calculation of fractional differential, this definition further improves the Grunwald letnikov definition on the basis of the basic properties of fractional calculus.
Among the definitions of above, the G-L definition is widely used in engineering because of its simple calculation process and high speed. Therefore, the G-L definition of fractional differentials was used in this work to study the fusion processing technology of mobile equipment detection information data in an integratedcontrol system.
2.2. Effect of Fractional Differential on Detection Signal
The detection data is obtained from the analysis and processing of detection information. Therefore, the measurement error generated in the acquisition and transmission of detection information directly affects the accuracy of the detection data. In terms of the mathematical properties of the signal and the characteristics of the signal structure, the detection signal contains the information of the fractional differential characteristics, but this kind of information is not suitable for processing by integer differential operators. For years, many mathematicians and scientists have tried to apply fractional calculus theory in signal processing and have achieved good application effects [
22,
23]. It is assumed that there is a detection signal
, where
, and its Fourier transform is
Let
be the
v-order differential of
. According to the properties of the Fourier transform, we can obtain the following equation:
Considering the problem of signal modulation, the physical meaning of the Fractional differential processing of a detection signal is equivalent to the generalized amplitude and phase modulation. According to signal modulation properties, the
v-order fractional calculus operation of the detected signal is equivalent to establishing a linear time invariant filtering system for the signal, and its filtering function is
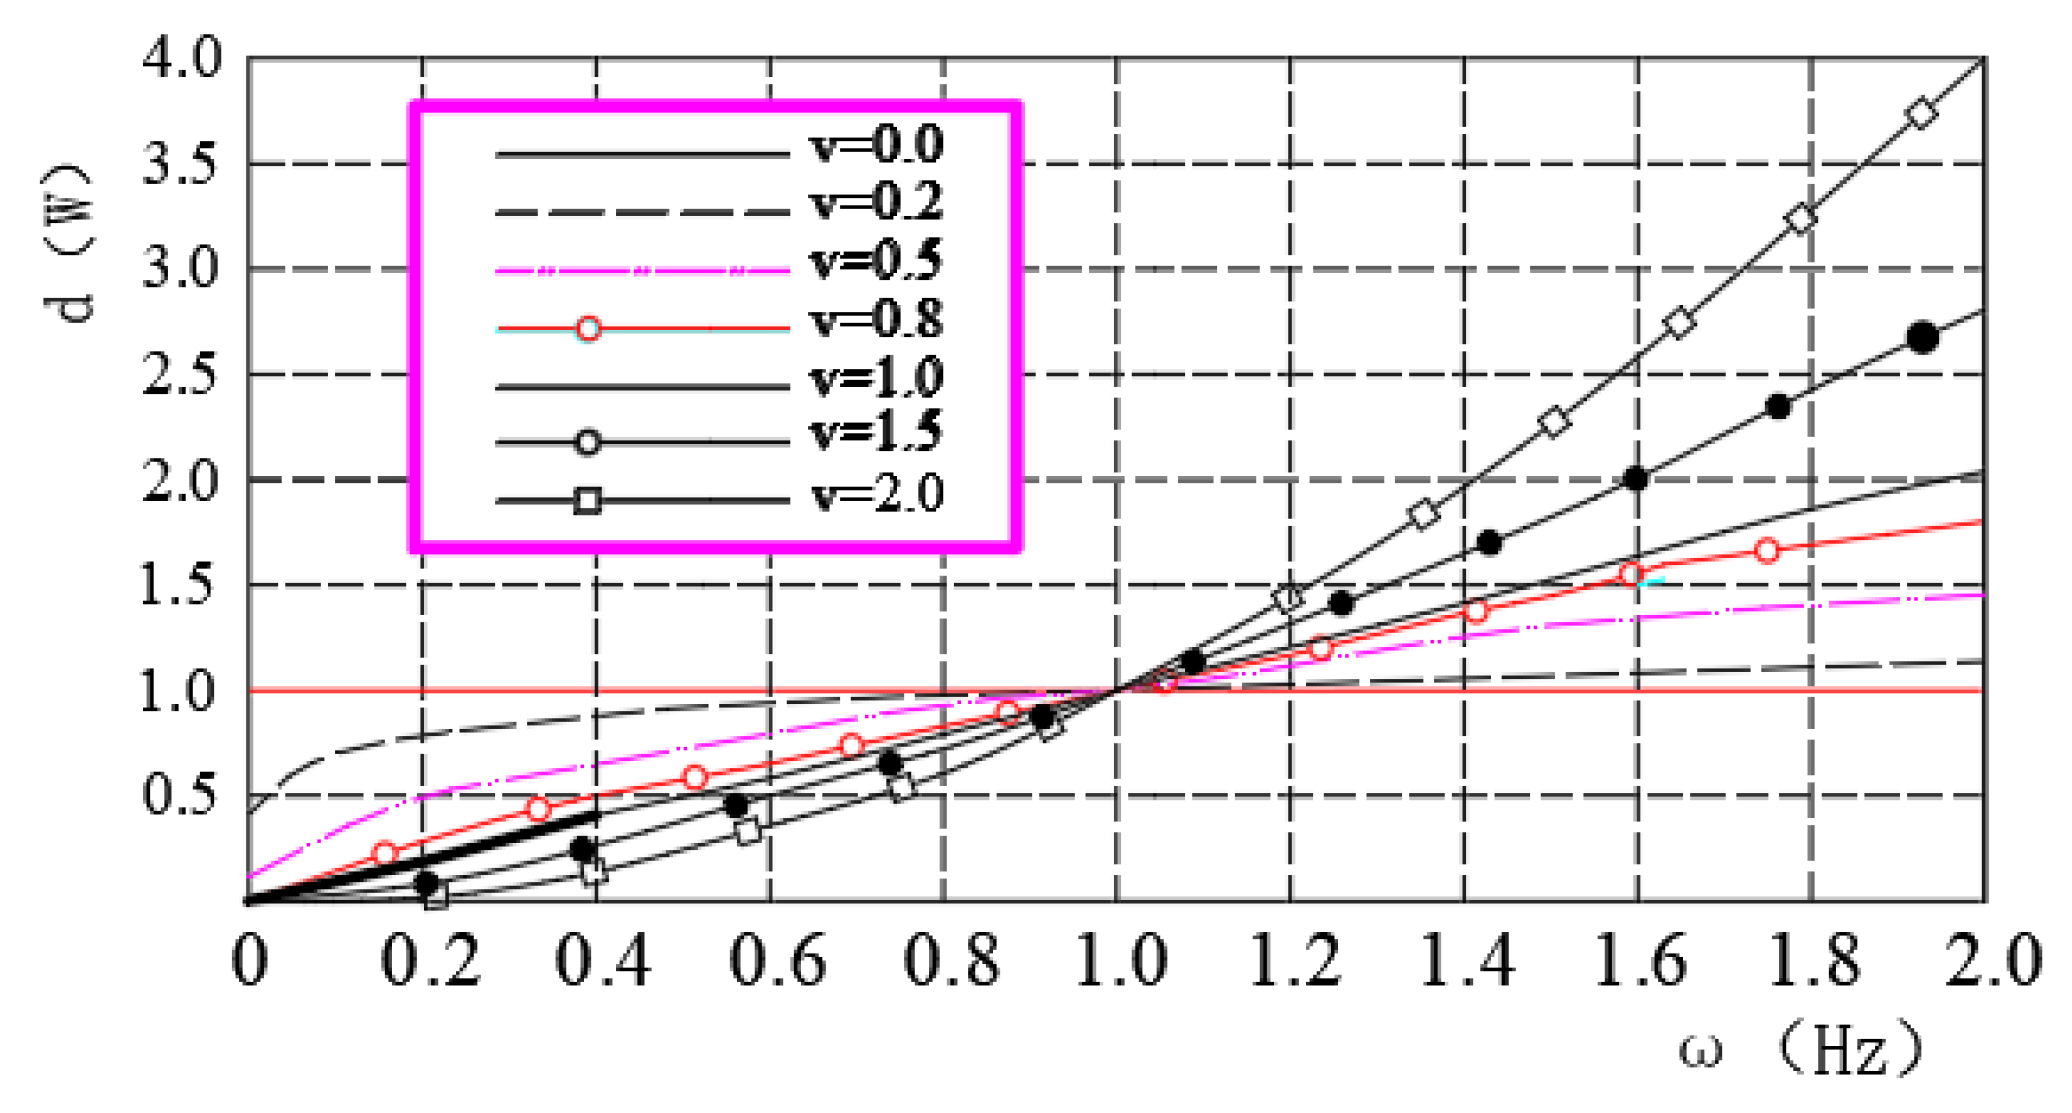
Referring to (7), we can draw the spectrum characteristic curve of fractional differential operator, as shown in
Figure 1.
From
Figure 1, we know that after fractional differential processing, the signal has the following characteristics:
The signal shows different levels of signal enhancement for different fractional differential operators, so that the VLF components of the signal can be preserved nonlinearly.
From the perspective of physics, signal processing by the fractional differential operator can be understood as the generalized amplitude phase modulation of the signal. In this way, the fractional differential operator can significantly improve the signal strength when processing the high-frequency part of the signal.
The fractional differential can improve the relatively high frequency signal strength significantly. It also has the function of improving low-frequency signals.
In recent years, many experts and scholars have studied the theory of fractional-order calculus and found that it is suitable for the study of signals with undesirable characteristics, such as nonlinearity, noncausality, and non-stationarity, and for various data applications.
2.3. Fractional Partial Differential Equation
According to the G-L definition of the fractional partial differential, In the expression of the fractional-order calculus under the G-L definition, the time
t in the signal
f(
t) is the influence factor of the signal amplitude, where
t∈[
t1,
t2]. If
ti =
tx, and [
t1,
t2] ⇔ [
a,
b], reference Equation (2), we can obtain the equation as follows:
In Equation (7), 0 <
n – 1 <
n,
is a binomial coefficient, defined as
In Equation (7), where , , and .
We extend it to two-dimensional space. Assuming that the information acquisition system collects any given two-dimensional energy signal
, and
, we can obtain the fractional partial differential equation
of the signal as follows:
2.4. Applications of Fractional Partial Differential Equations
Compared with an integer order partial differential equation, the outstanding advantage of fractional partial differential equation is that it can better simulate the physical process and dynamic system process of nature. Compared with fractional differential equations, a fractional partial differential equation can take the unknown quantity in the equation as the influence factor to realize the fractional differential treatment of multiple influence factors in the equation. Because fractional partial differential equations have the above advantages, in recent years, the research on the characteristics and applications of fractional partial differential equations has become the focus of many experts and scholars. Some research results have been widely used in the research of technical problems in the fields of temperature field distribution, image processing, mechanical analysis, and detection technology. For example, WANG Bao et al [
24] applied fractional partial differentials to achieve the research goal of thickness design of high-temperature protective clothing under actual limited conditions; ZHOU Shangbo et al [
25] applied them to prove their advantages in image denoising and reducing step effect and in denoising and super-resolution reconstruction. SHEN Tianlong [
26] applied fractional partial differentials in the research field of fluid mechanics; ZUO Yanhong et al [
16,
17,
18] applied it in test data fusion processing technology of a discrete manufacturing system.
3. Fusion Technology Mobile Device Detection Data Based on Fractional Partial Differential Operator
3.1. Fundamental Principle
The essence of the fractional-order calculus processing of the signal under the G-L definition is to apply the linear fit to the spectral characteristic curve obtained via fractional-order calculus, suppose the system detects an energy signal
F(t), takes the middle and high frequency part of the signal as the analysis object, where t∈ (
t1, t2). During the information detection, the detection data in the transmission process will inevitably be affected by a variety of factors, such as the equipment performance, working environment, and signal interference, thus bringing a large data detection error. Referring to Equation (7), consider
x as a detection value for the influence factor, we can get the corresponding equation F(x),
x∈ (
a, b),
h is the step value of the variation of
x between (
a, b), and the number of fitting steps is
n = [(b – a)/h]. According to Equation (2) and
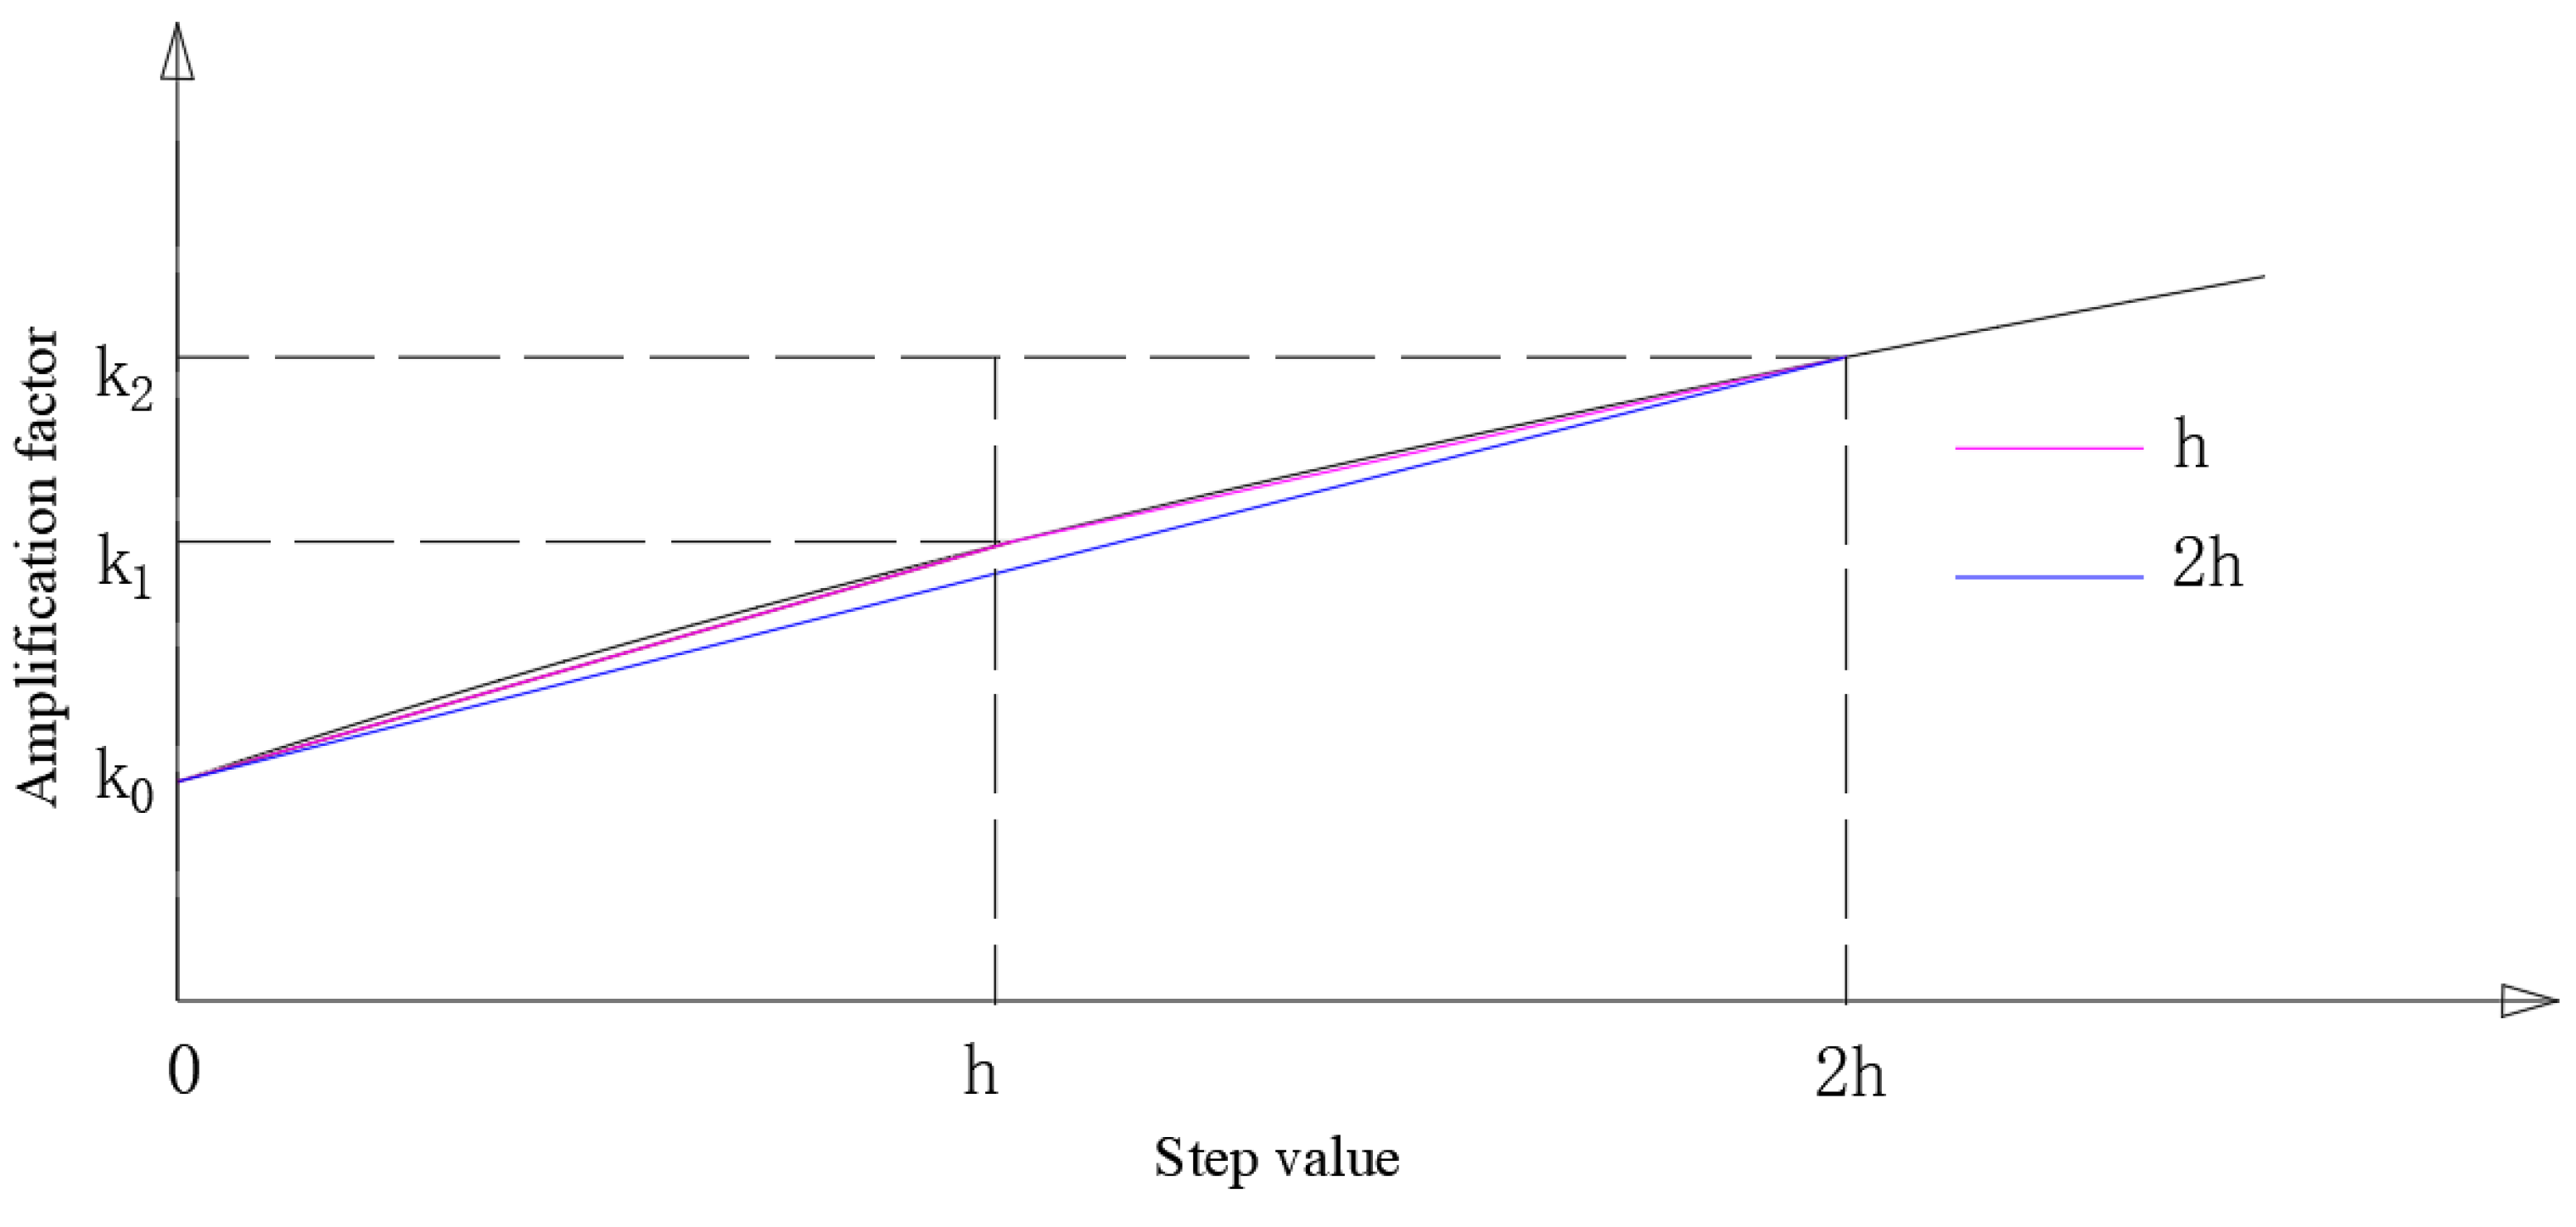
Figure 1, the spectral curve of the fractional order calculus under the definition of G-L when the value of
h is different is shown in
Figure 2. According to
Figure 2, We can see that when the step values are
h and
2h respectively, with the increase of step
h, the amplification factor and detection accuracy of information data will be improved accordingly.
3.2. Mobile Device Detection Data Fusion Algorithm Model Based on Fractional Partial Differentials
To keep our presentation concise, we assume that the monitoring information of mobile equipment collected by wireless network technology is mainly affected by factors
and
, and the functional relationship between the signal detection value and the influence factor is
J(x, y). Because the influences of the two influence factors
x and
y on the detected value are independent of each other, the calculation method of the function for influence factors
x and
y are interdependent . According to the spatial function
of differential detection data fusion, the model of mobile equipment monitoring information data fusion algorithm based on fractional partial differential equation under the IoT is as follows:
3.3. Mobile Device Detection Data Fusion Process Based on Partial Differential
With the increasing maturity of IoT technology, there is no technical problem in applying the wireless sensor network technology to realize the effective perception and real-time collection of mobile equipment monitoring information. When applying the data fusion method to realize the effective fusion processing of information detection data to improve the detection accuracy of monitoring information, refers to the implementation methods of other fusion algorithms, the fusion process of mobile device monitoring information and detection data based on fractional partial differential operator is divided into the following steps.
- a)
According to the type of monitoring information, the data acquisition system applies the corresponding sensors to effectively perceive the monitoring information generated by the mobile equipment in the operation process and uses the wireless network to realize the real-time acquisition of the required monitoring information and detection data.
- b)
The data acquisition center then judges the effectiveness of the detection data according to the detection error set by the system. If the error between the data is within the error range set by the system, the detection data will be directly transmitted to the data center of the detection system.
- c)
If the error within the data exceeds the error range set by the system, the fractional partial differential equation fusion is applied to process the detection data until the error within the fused data is within the error range set by the system.
- d)
Finally, the fused data are transmitted to the data center of the detection system, and the processing stage ends.
4. Application Experiment of Algorithm in Information Detection and Data Processing of Logistics Trolley in Computer Integrated Manufacturing System
4.1. Construction of Experimental Platform
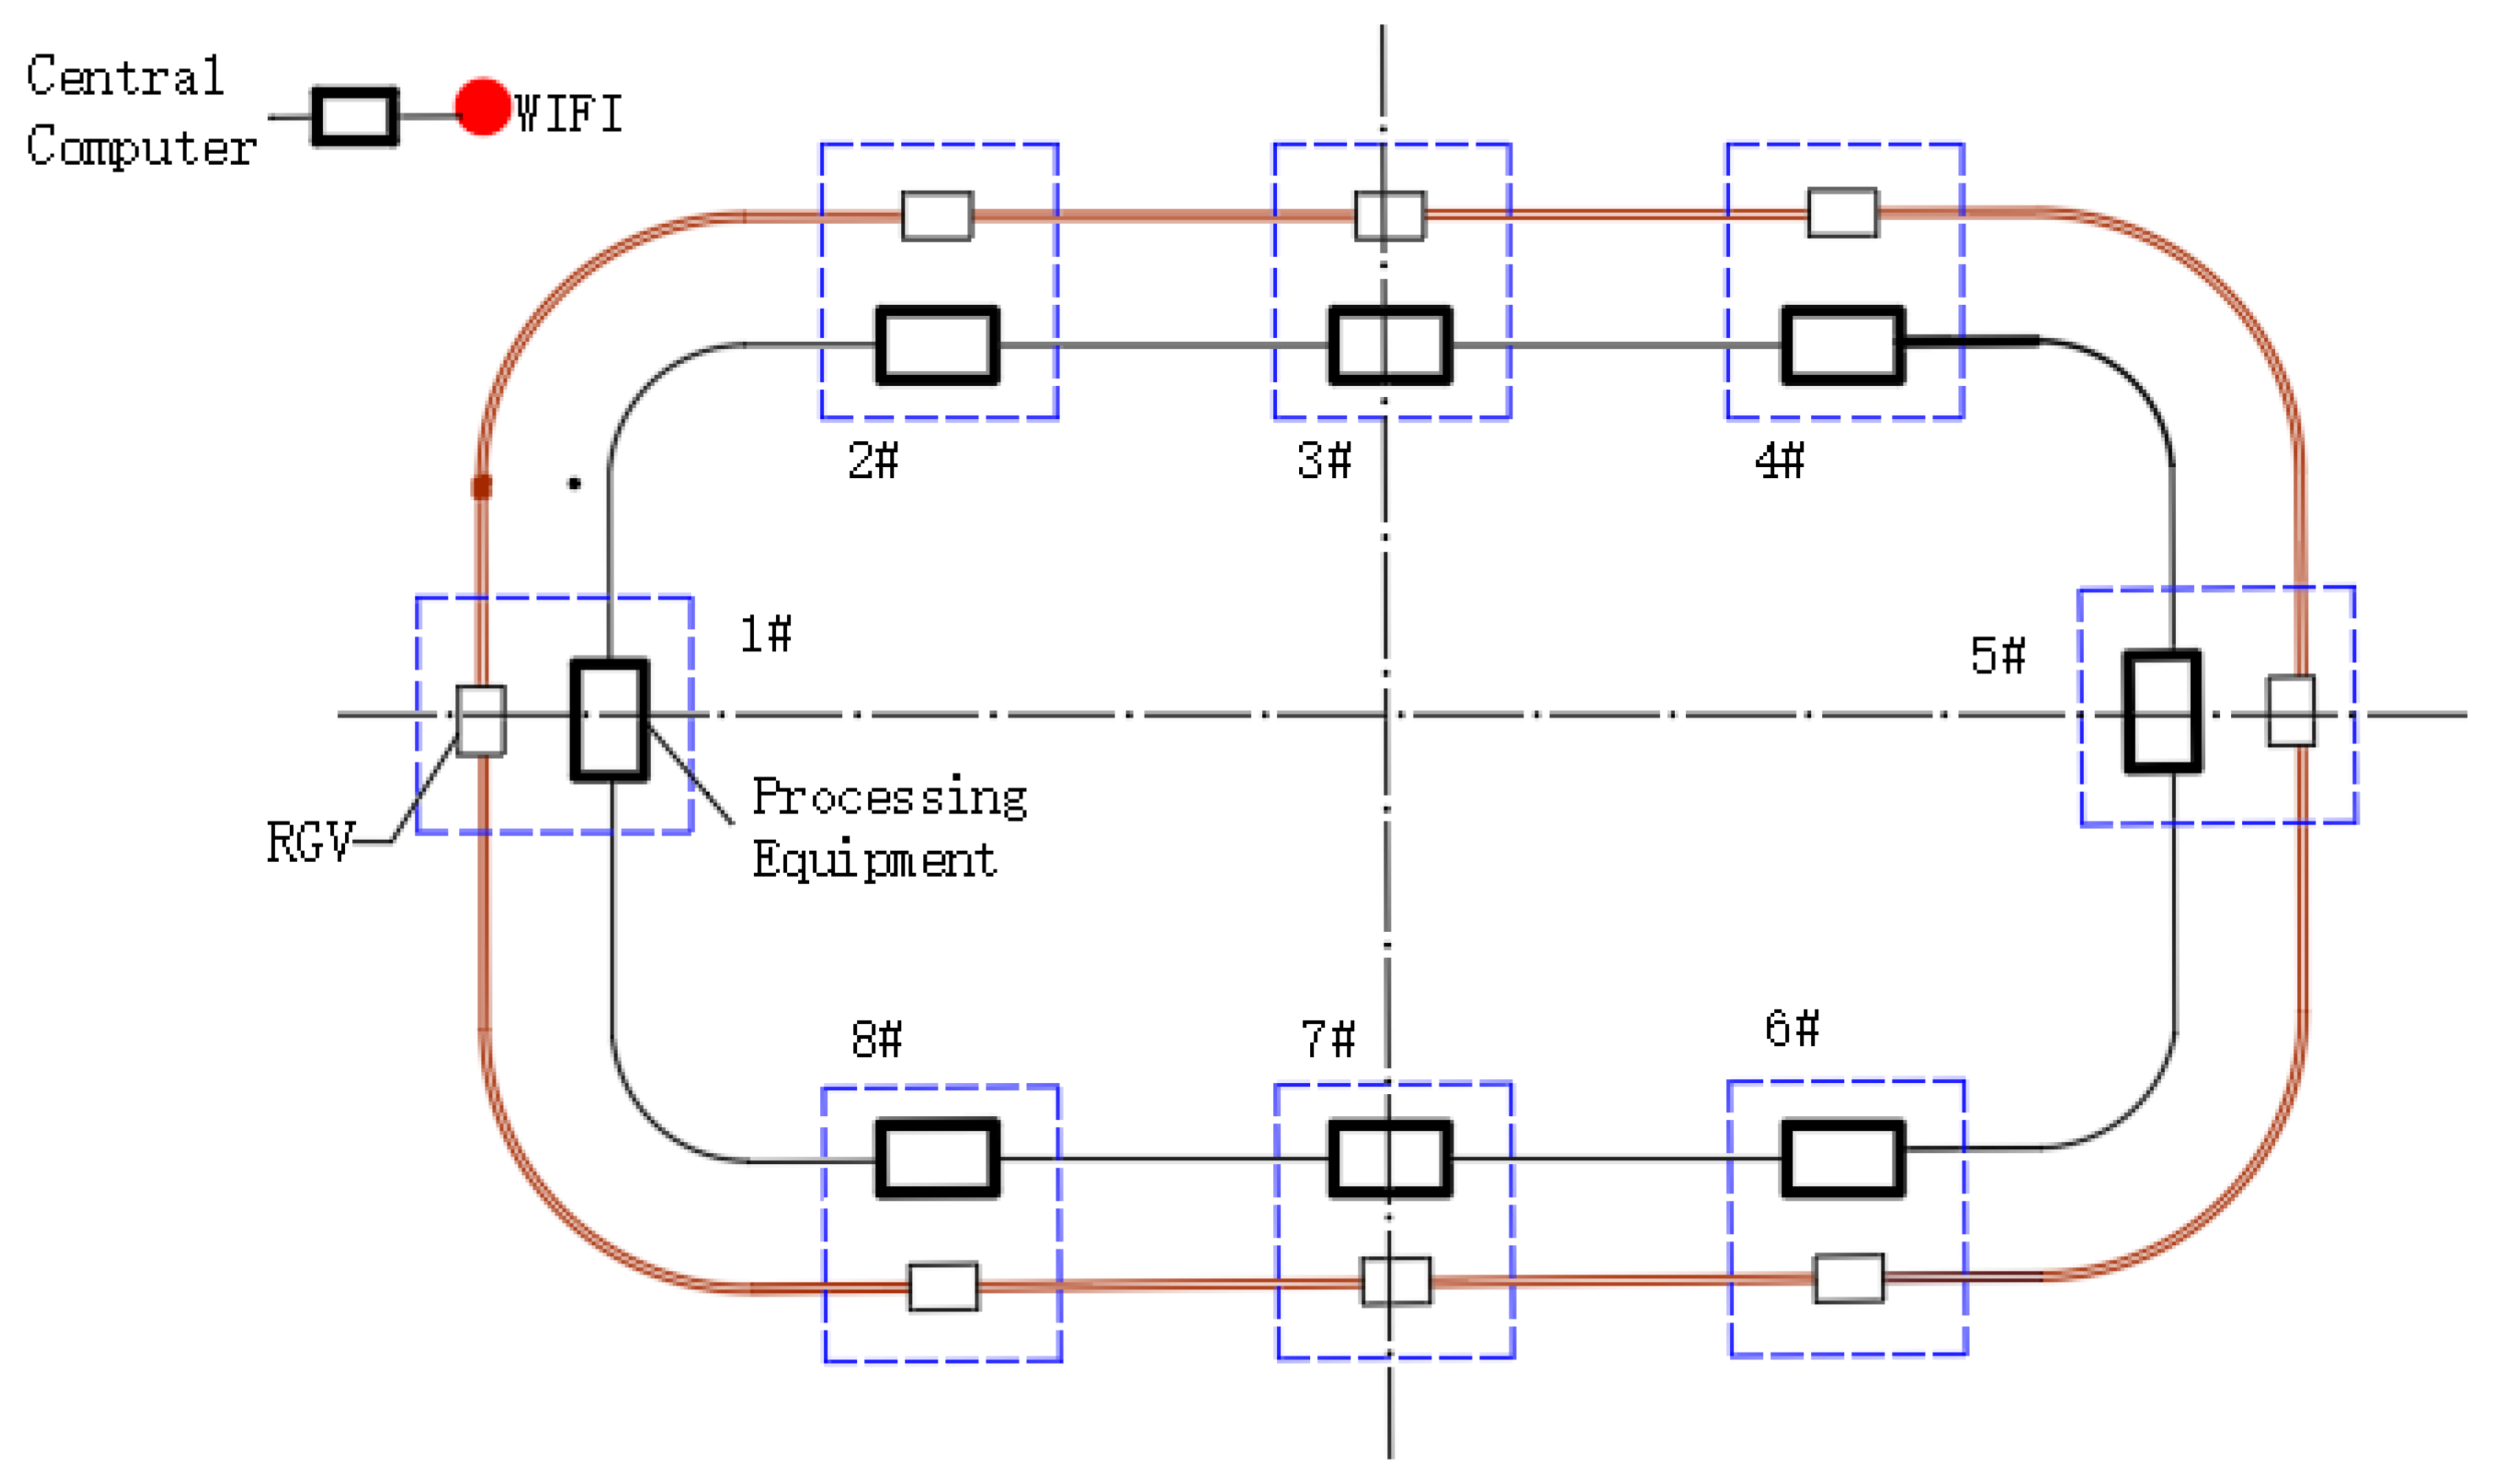
To explore the fusion effect of fractional partial differential operator in mobile equipment information detection data of an integrated manufacturing system, this paper uses the production line located in the engine machining workshop of Hitachi Construction Machinery (China) Co., Ltd. in the Hefei Economic and Technological Development Zone as the experimental platform. The mobile equipment work information monitoring experimental platform in the engine integrated manufacturing system of Hitachi Construction Machinery (China) Co., Ltd. is shown in
Figure 3.
To avoid affecting production, as shown in
Figure 3, the receiving device used in the collection of mobile equipment production information was placed in the northwest corner of the workshop. Because the traveling mechanism of the logistics trolley has the highest failure rate in the rail mobile equipment, and its common failure is that the bearing operation fails due to the high temperature of the traveling mechanism bearing. this experiment takes the temperature of the bearing of the logistics trolley in the engine integrated manufacturing system as the research object and uses the detection data fusion algorithm based on the fractional partial differential operator to fuse the measured information data, to prove the effectiveness of the fractional partial differential operator in the monitoring information data fusion of mobile equipment in the integrated manufacturing system.
4.2. Collection of Oil Temperature Information Data of Logistics Trolley by Information Detection System
In this experiment, we use the wireless network transmission mode based on 2.4GHz WiFi to send the monitoring information to the signal receiving device. In order to reduce the detection error, the measurement is carried out when the logistics trolley reaches each detection point shown in
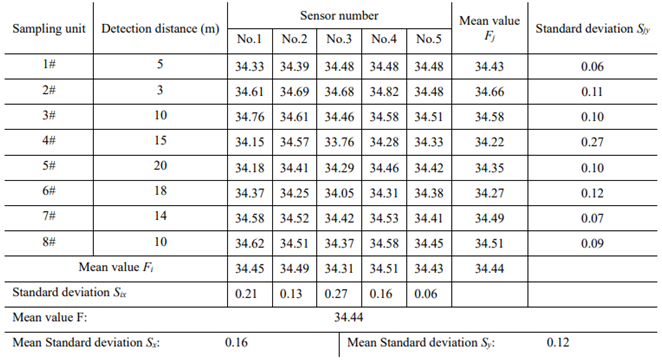
Figure 3, the distance from each measurement point to WiFi is shown in
Table 1. Five temperature sensors are used to collect the temperature data of each measuring point in a short time, and the average value of the detection values of five sensors at different positions is used as the detection value value is taken as the detected value of each measuring point of the bearing temperature of the traveling mechanism, as shown in
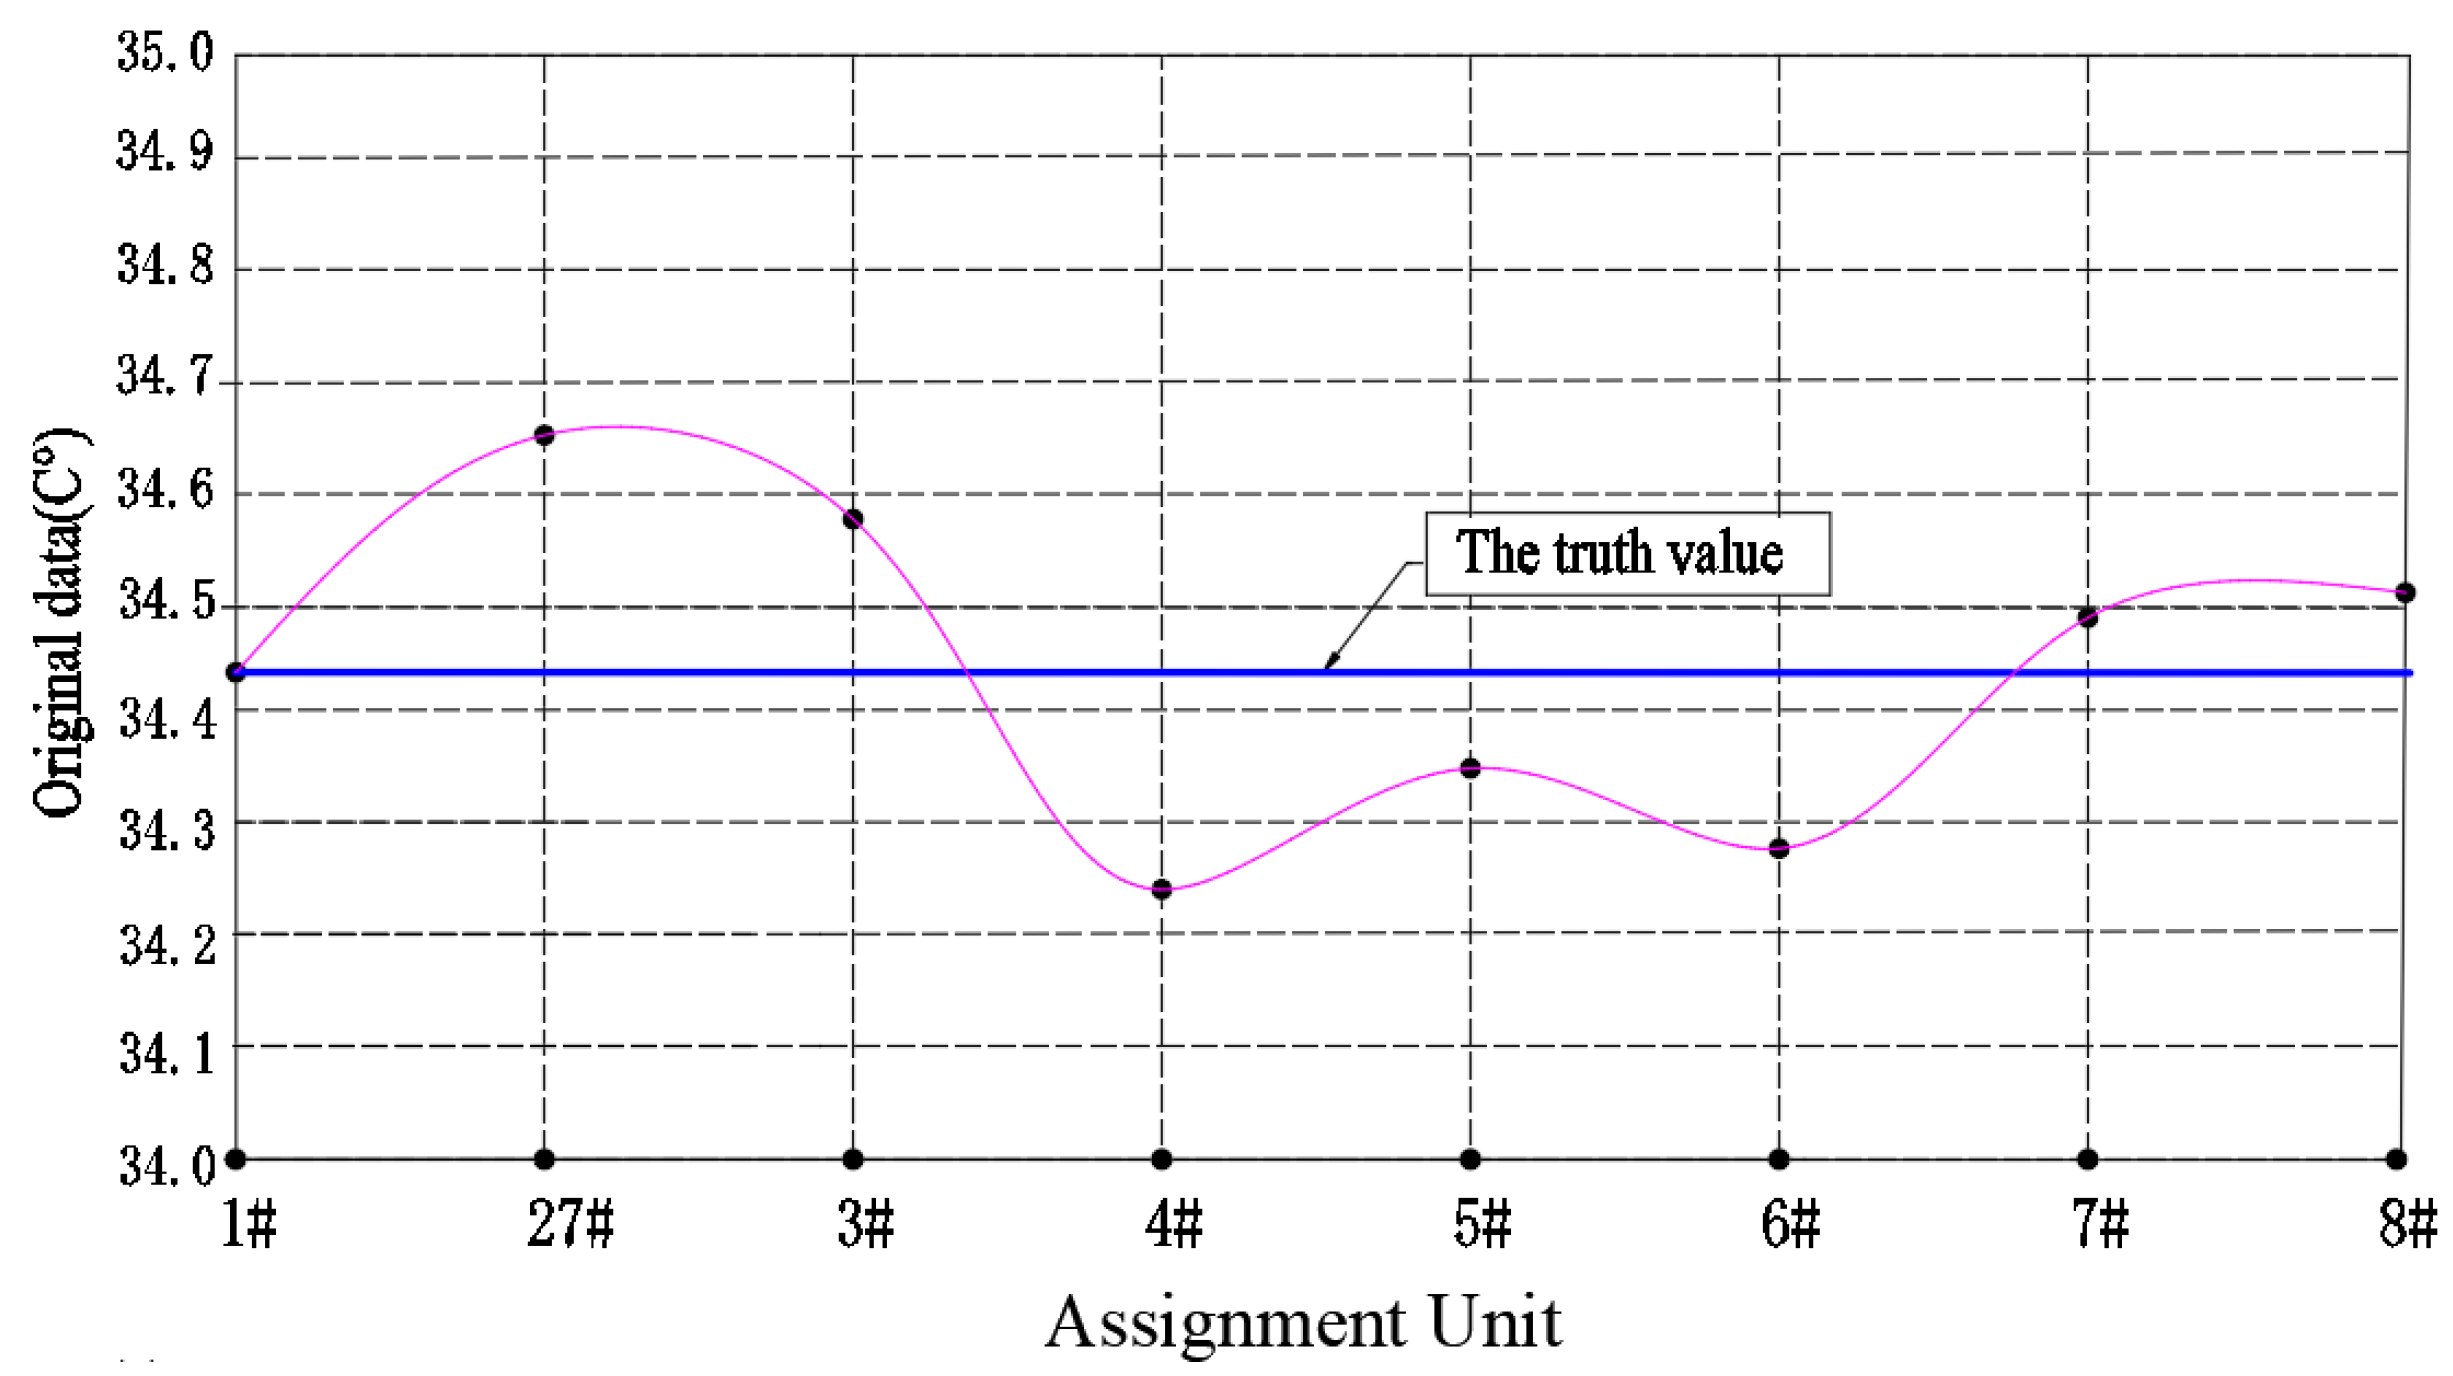
Table 1. According to the data shown in
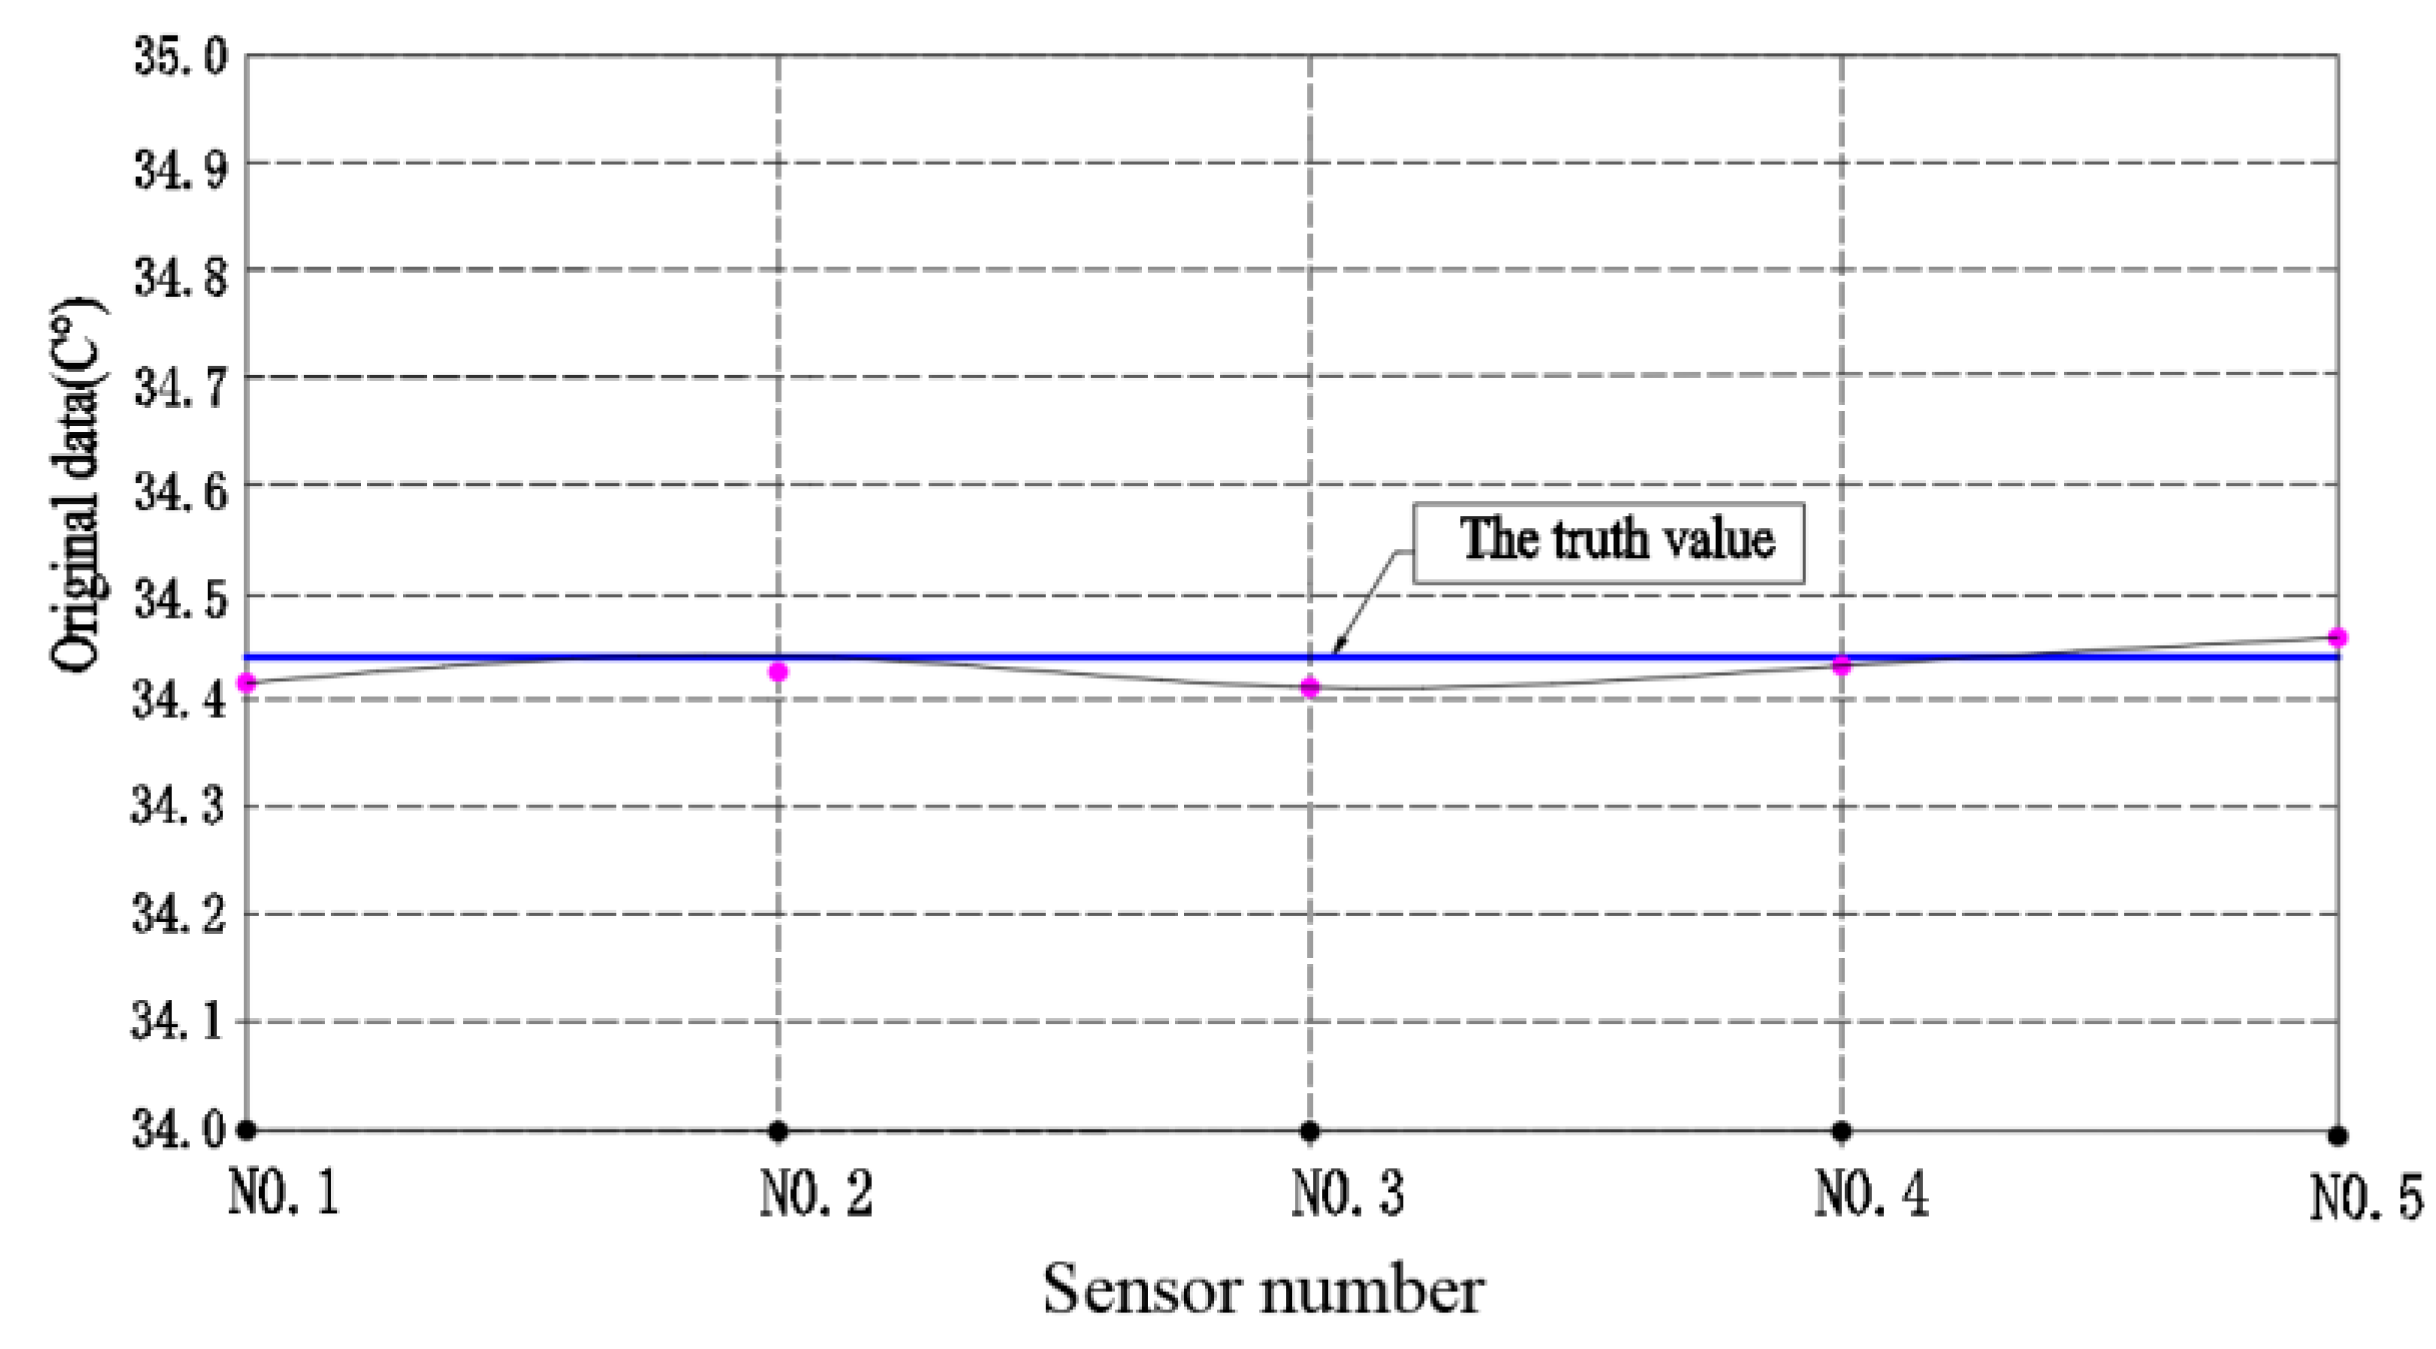
Table 1, the temperature distribution curves of the bearings of the traveling mechanism of the logistics trolley at different positions are drawn, as shown in
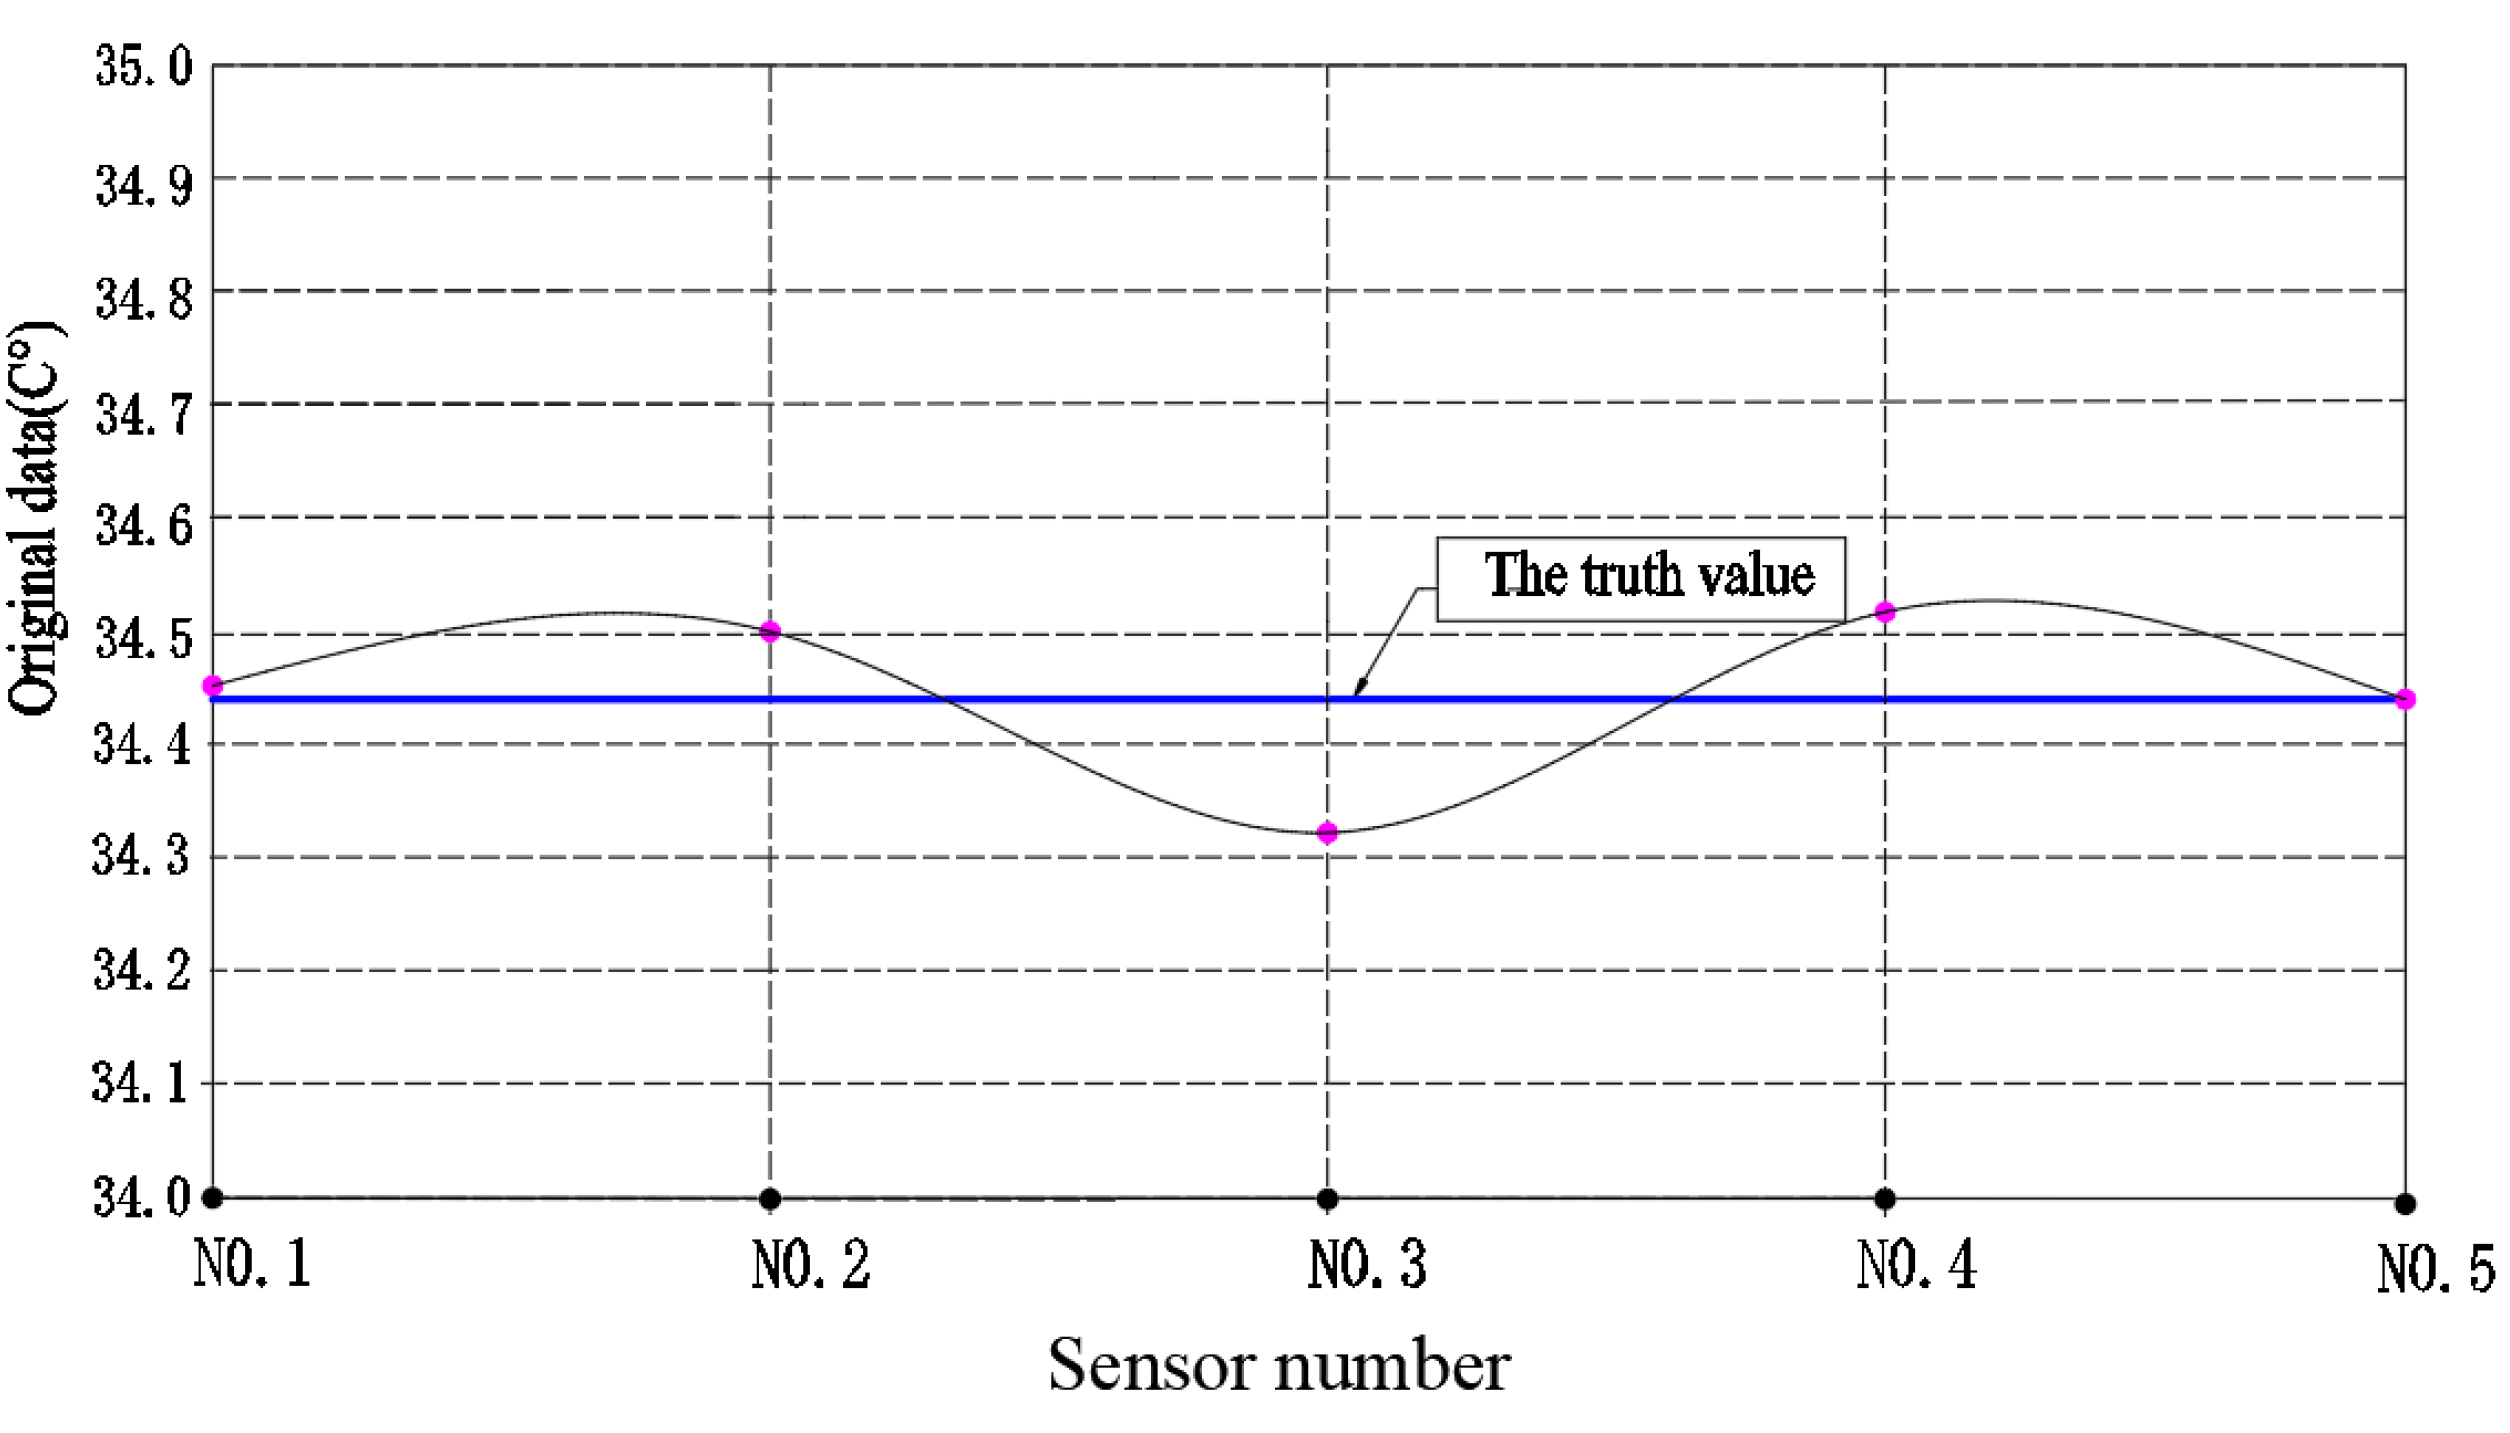
Figure 4, we found that the measured values of the bearing oil temperature at different positions of the logistics trolley show an irregular discrete distribution above and below the average value of 34.44°C, and the mean standard deviation
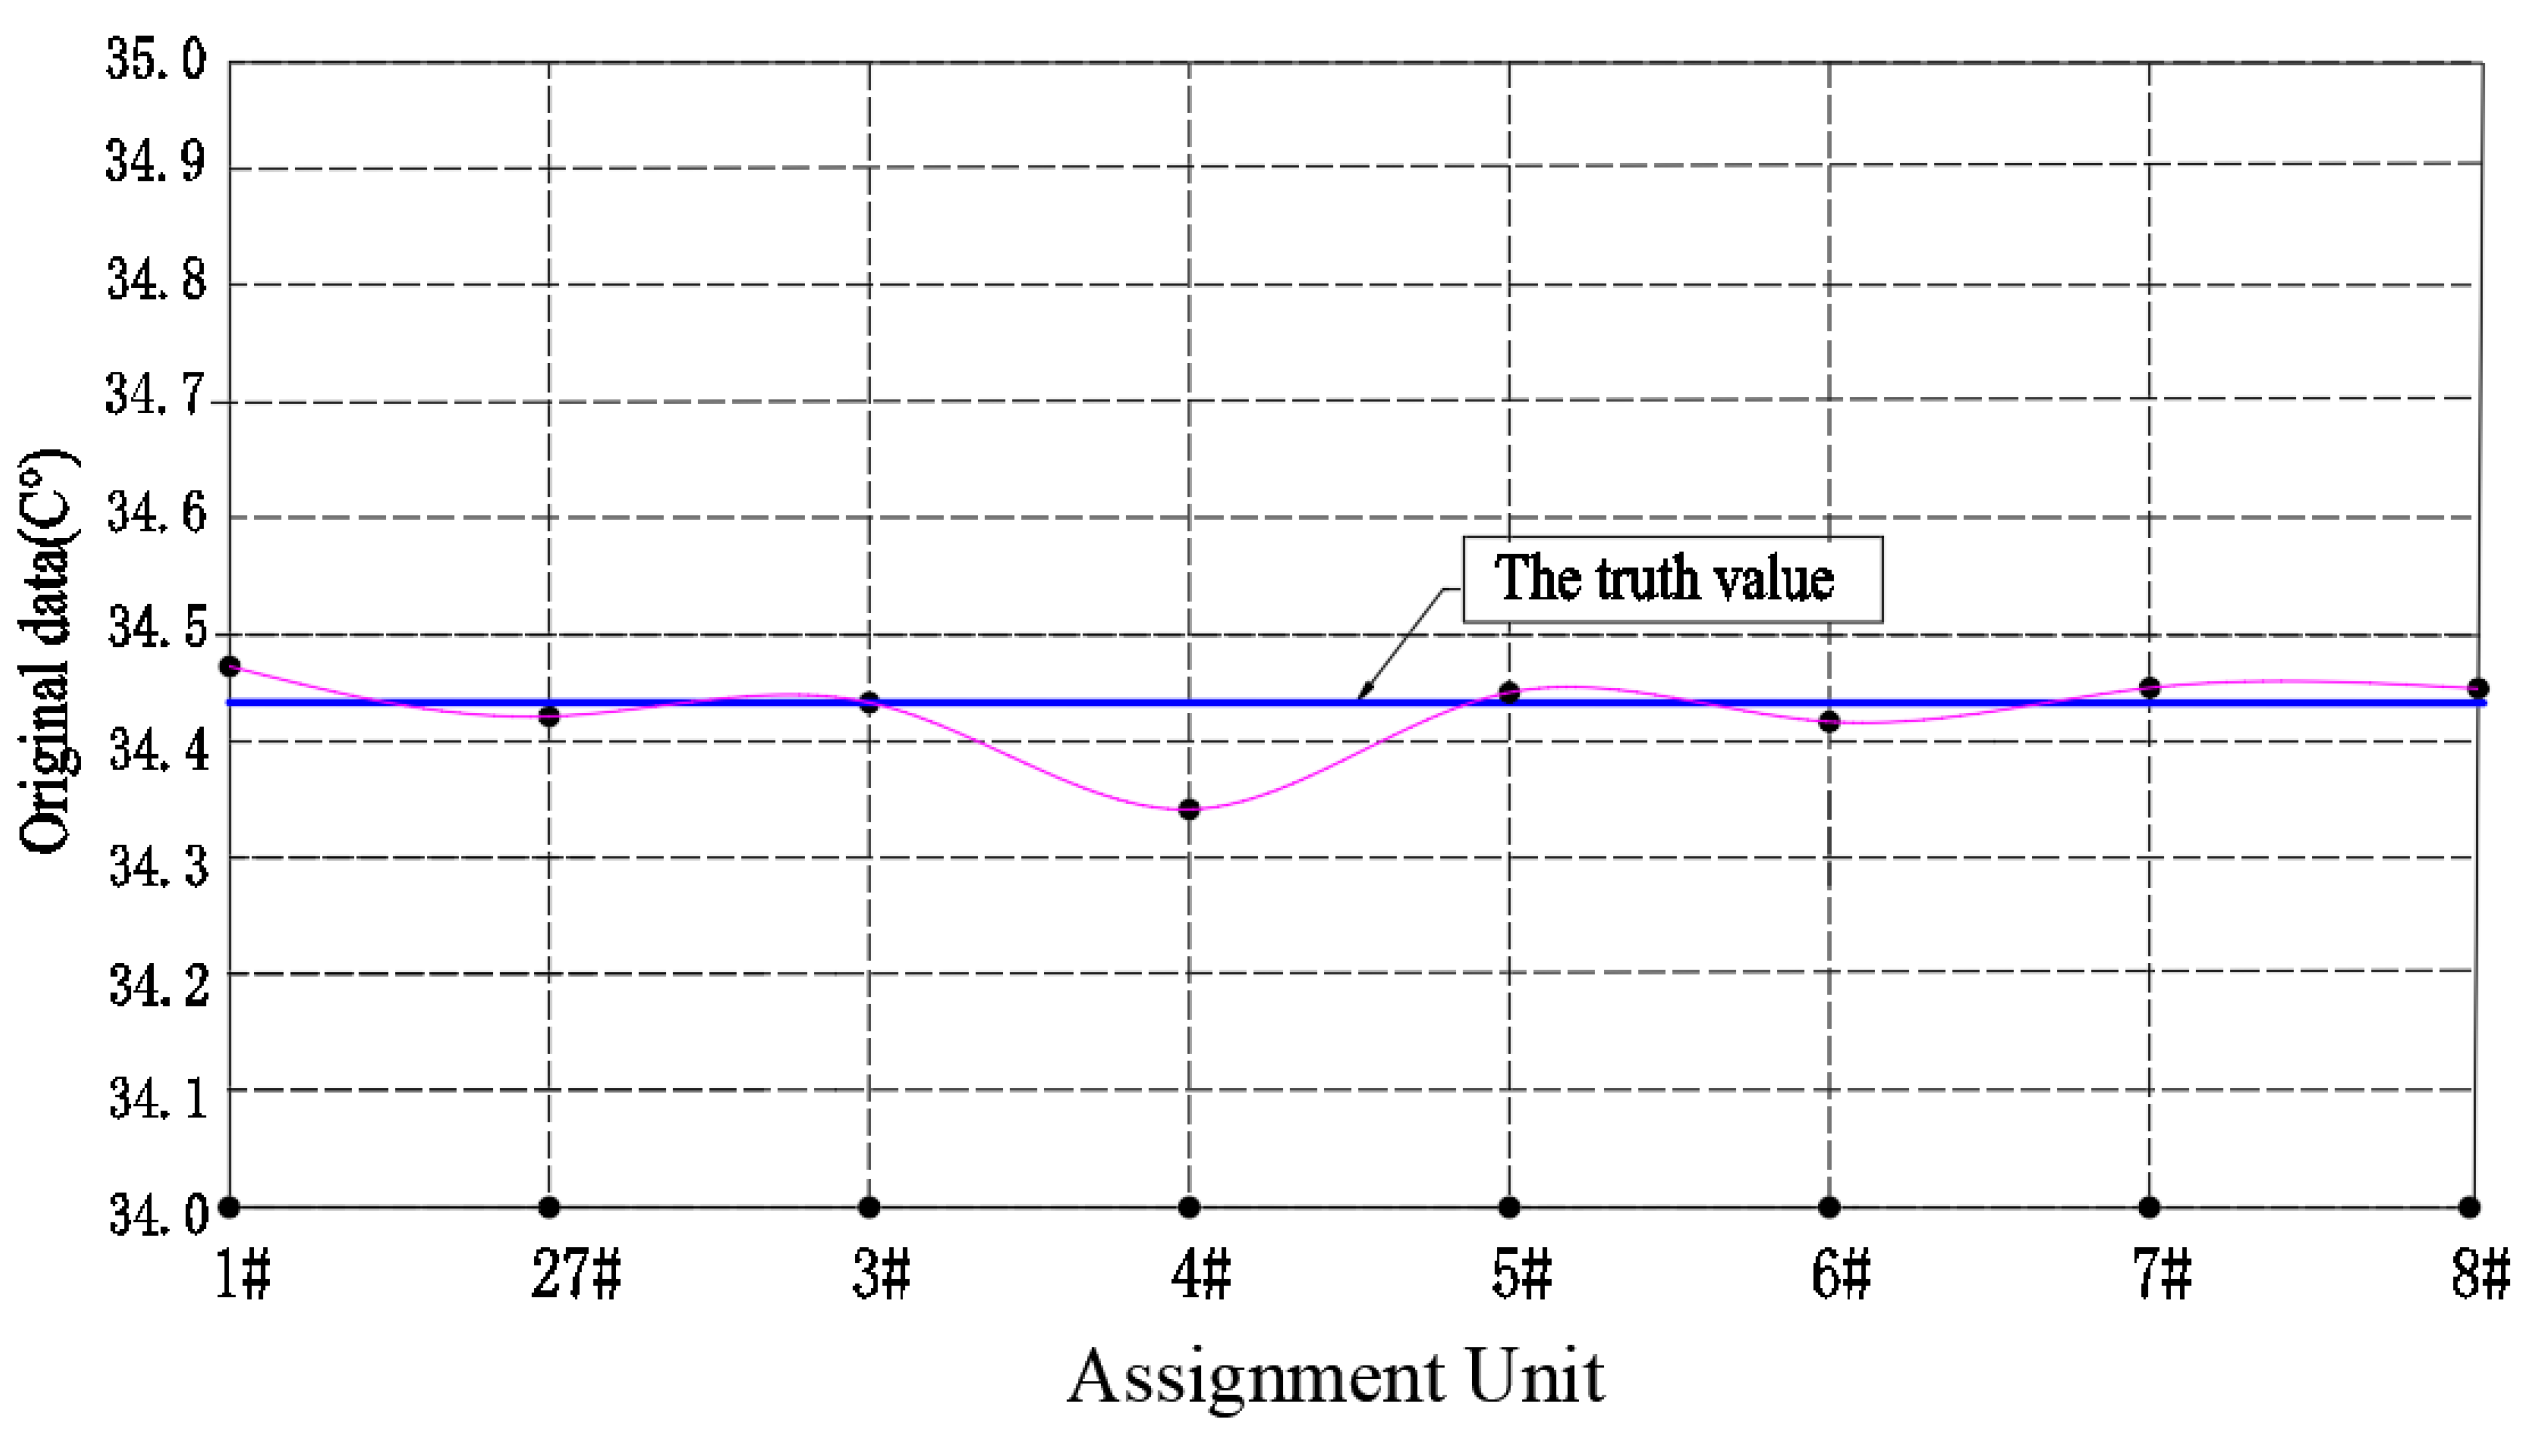
Sy = 0.12. The temperature distribution curves of the bearings of the logistics trolley traveling mechanism The temperature distribution curve of the logistics trolley running mechanism bearings when each sensor is detected in different working units, as shown in
Figure 5, we found that the measured values of the logistics trolley bearing oil temperature by different sensors showed an irregular discrete distribution above and below the average value of 34.44°C, and the average standard deviation is
Sx = 0.16.
4.3. Fusion Processing of Detection Data by Fractional Partial Differential Operator
4.3.1. Selection of influence factors of detection value
According to the introduction of the experimental platform above, it can be seen that the whole experiment is completed in a short time and in the same workshop, so the environmental factors have little impact on the difference between the bearing temperature detection data of the traveling mechanism. In the whole experiment, the equipment used have not changed, so the influence of equipment performance on the bearing temperature of the walking mechanism in different detection units can be ignored. When the logistics trolley operates in the same detection unit, the difference in the performance of the five sensors can cause a detection error in the detection data of the unit. Different working positions of detection units will lead to great differences in electromagnetic interference intensity, signal transmission obstruction, and transmission energy loss in the process of signal transmission, resulting in large detection errors in detection data between detection units. The above two factors are the main causes of signal distortion in WiFi acquisition. Thus, the performance and working environment of logistics trolley detection instrument are the main influencing factors of signal distortion in WiFi acquisition. Since the standard deviation is the best indicator to measure the quality of test data, this case uses the performance of the test equipment as the influence factor x and the working environment of the equipment as the influence factor y to effectively process the test value of bearing oil temperature.
4.3.2. Functional relationship between influence factors and detection value Fi
The least squares method does not need prior information on data and has good data fitting accuracy, so it is widely used in the fitting of function relations. in this case, the least squares method is used to fit the functional relationship
F(x, y) between the influence factors
(xi, yi) and the detected value
Fi. According to the standard deviation
Six of each sensor described above and the standard deviation
Siy of environmental impact factors of a logistics trolley in each detection unit shown in
Table 1, the least squares method was used to obtain the functional relationship
F (x) and
F (y) of the logistics trolley in the working process. It is assumed that the mathematical expressions of the functional relations
F(x) and
F(y) between the measured value
Fi and its two influence factors are as follows:
From the data in
Table 1, it can be seen that every experimental datum is equal to
F (xi) and
F (yj); so,
F(x) =
F(y); then, we obtain the following equation:
- a)
Functional relationship between influence factor y and detection value F
According to (12), the function
F(x) is obtained by calculating the values of coefficient a
i and order
n. According to the basic definition of the least squares method, the order of the polynomial shown in the equation of
F(x) should be less than the number of samples; so,
n < 8. According to the experimental data shown in
Table 1, using the polyfit function in MATLAB software, we can conclude that when the order of the polynomial
n = 1, The total error between the fitting value of the detection data
Fj of all sensors and the measured true value F is 0.343-the smallest one. In this case, the functional relationship between the detection data
Fi and the influence factor
xi is given by
- b)
Functional relationship between influencing factor x and detection value F
According to the above theory, the function
F(y) is obtained by calculating the values of coefficient b
i and of order m using (12). According to the basic definition of the least squares method, the order of the polynomial
F(y) shown in (12) should be less than the number of samples, so
m < 5. According to the experimental data shown in
Table 1 and the polyfit function in MATLAB software, we can conclude that when the order of the polynomial
m = 1, the total error between the fitting value of the detection data
Fi of all sensors and the measured F is 0.165-the smallest one. In this case, the functional relationship between the detection data
Fi and the influence factor
xi is given by
4.4. Selection of fractional order v and step h
- a)
Select the value of fractional order v
According to the amplitude and frequency characteristics of the fractional differential operator, we know that when the differential order is 0 < v < 1, the fractional differential operator has a nonlinear function retaining the very low frequency part of the signal and enhancing the low frequency part of the signal, and the enhancement effect becomes increasingly obvious with the reduction of the order. To save space, this case considers the fractional order v as the middle value of the range [0, 1] and studies the application effect of fractional partial differential equation in the data fusion processing of bearing oil temperature sampling under the Internet of things.
- b)
Select the value of discrete step h
In
Figure 2, it can be seen that the smaller step can obtain higher detection accuracy accurate fusion data, but it has the shortcoming of a low efficiency. In this case, the fusion speed and fusion accuracy are comprehensively considered. According to
Table 1., we can see that the value interval of the influencing factor
x is [0.06, 0.27], and the value interval of the influencing factor
y is [0.06, 0.27]. In order to verify that the fractional differential algorithm can obtain high-precision information data by adjusting the value of step
h, we selected the step value
h = 0.02 and
h = 0.01 to study the effect of the step value
h on the processing accuracy
S of information data.
4.5. Data Fusion and Results Analysis
Next, the related parameters
(v, h1, h2, m, n) are substituted into the mathematical model of mobile device detection data fusion processing based on the fractional partial differential equation shown in (8) and (9). We obtain the following calculation formula:
4.5.1. When the Step length h = 0.02
When the distance walk length
h = 0.02, and the number of steps to be calculated
nx = [(0.27-0.06)/0.02] = 11, and
ny = [(0.27-0.06)/0.02] = 11 according to the value range [0.016, 0.035] of the influence factor
y (information energy consumption loss) shown in
Table 1, In this way, the fusion calculation steps
nx and
ny of the influence factor
x and the influence factor
y are similar and can meet the requirements of calculation speed and accuracy at the same time. Combined (13), (14) and (15), we obtain the following equation:
According to (17), we can obtain
Combined (17), (18) and (19), we can calculate the oil temperature detection values
F(xi, yj) of each temperature sensor at different sampling points shown in
Table 1. processed by the fractional differential algorithm of
h=0.02,
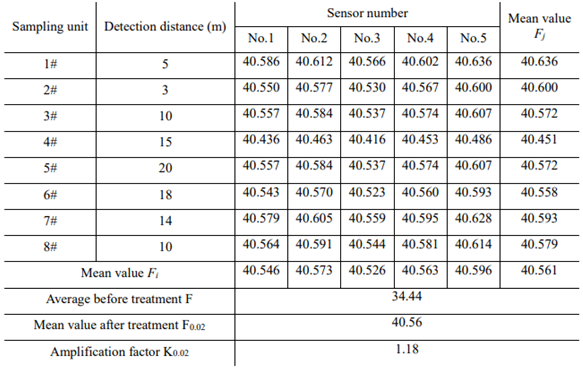
v=0.5 fractional order differentiation algorithm, The results of it are shown in
Table 2.
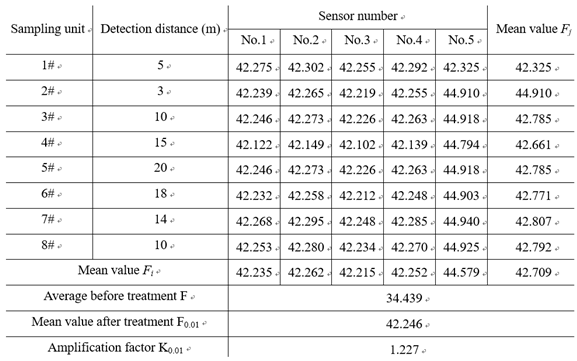
From the data shown in
Table 2, we can conclude that after
h = 0.02,
v = 0.5 fractional order differentiation algorithm fusion, the numerical magnification is K
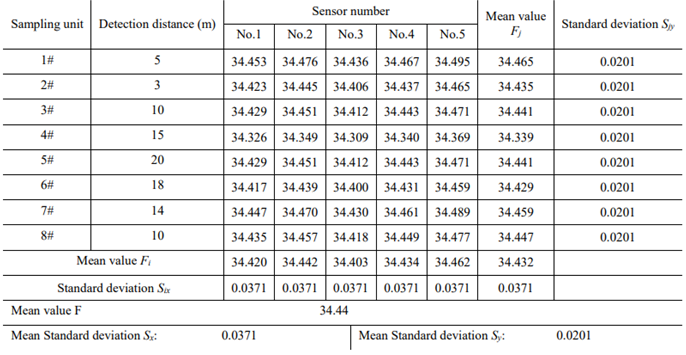
0.02= 1.18, this can improve the anti-interference ability of the signal and the reliability of information transmission. In order to compare the effect of data fusion with other algorithms, divide the data in
Table 2 by K
0.02 and calculate the final data processing result, as shown in
Table 3. From
Table 3, We can see after fused by fractional partial differential, the mean standard deviation
Sx= 0.037, nearly one-forth then the original accuracy, and the mean standard deviation
Sy = 0.0201, nearly one-sixth then the original accuracy. Therefore, it can be verified that the fractional differential operator has the function of enlarging the detection information strength and improving the detection accuracy of information data.
Apply the data in
Table 3 to draw the information data distribution diagram of the oil temperature data in each work unit after the information data is processed by
h = 0.02,
v = 0.5 fractional partial differential algorithm, as shown in
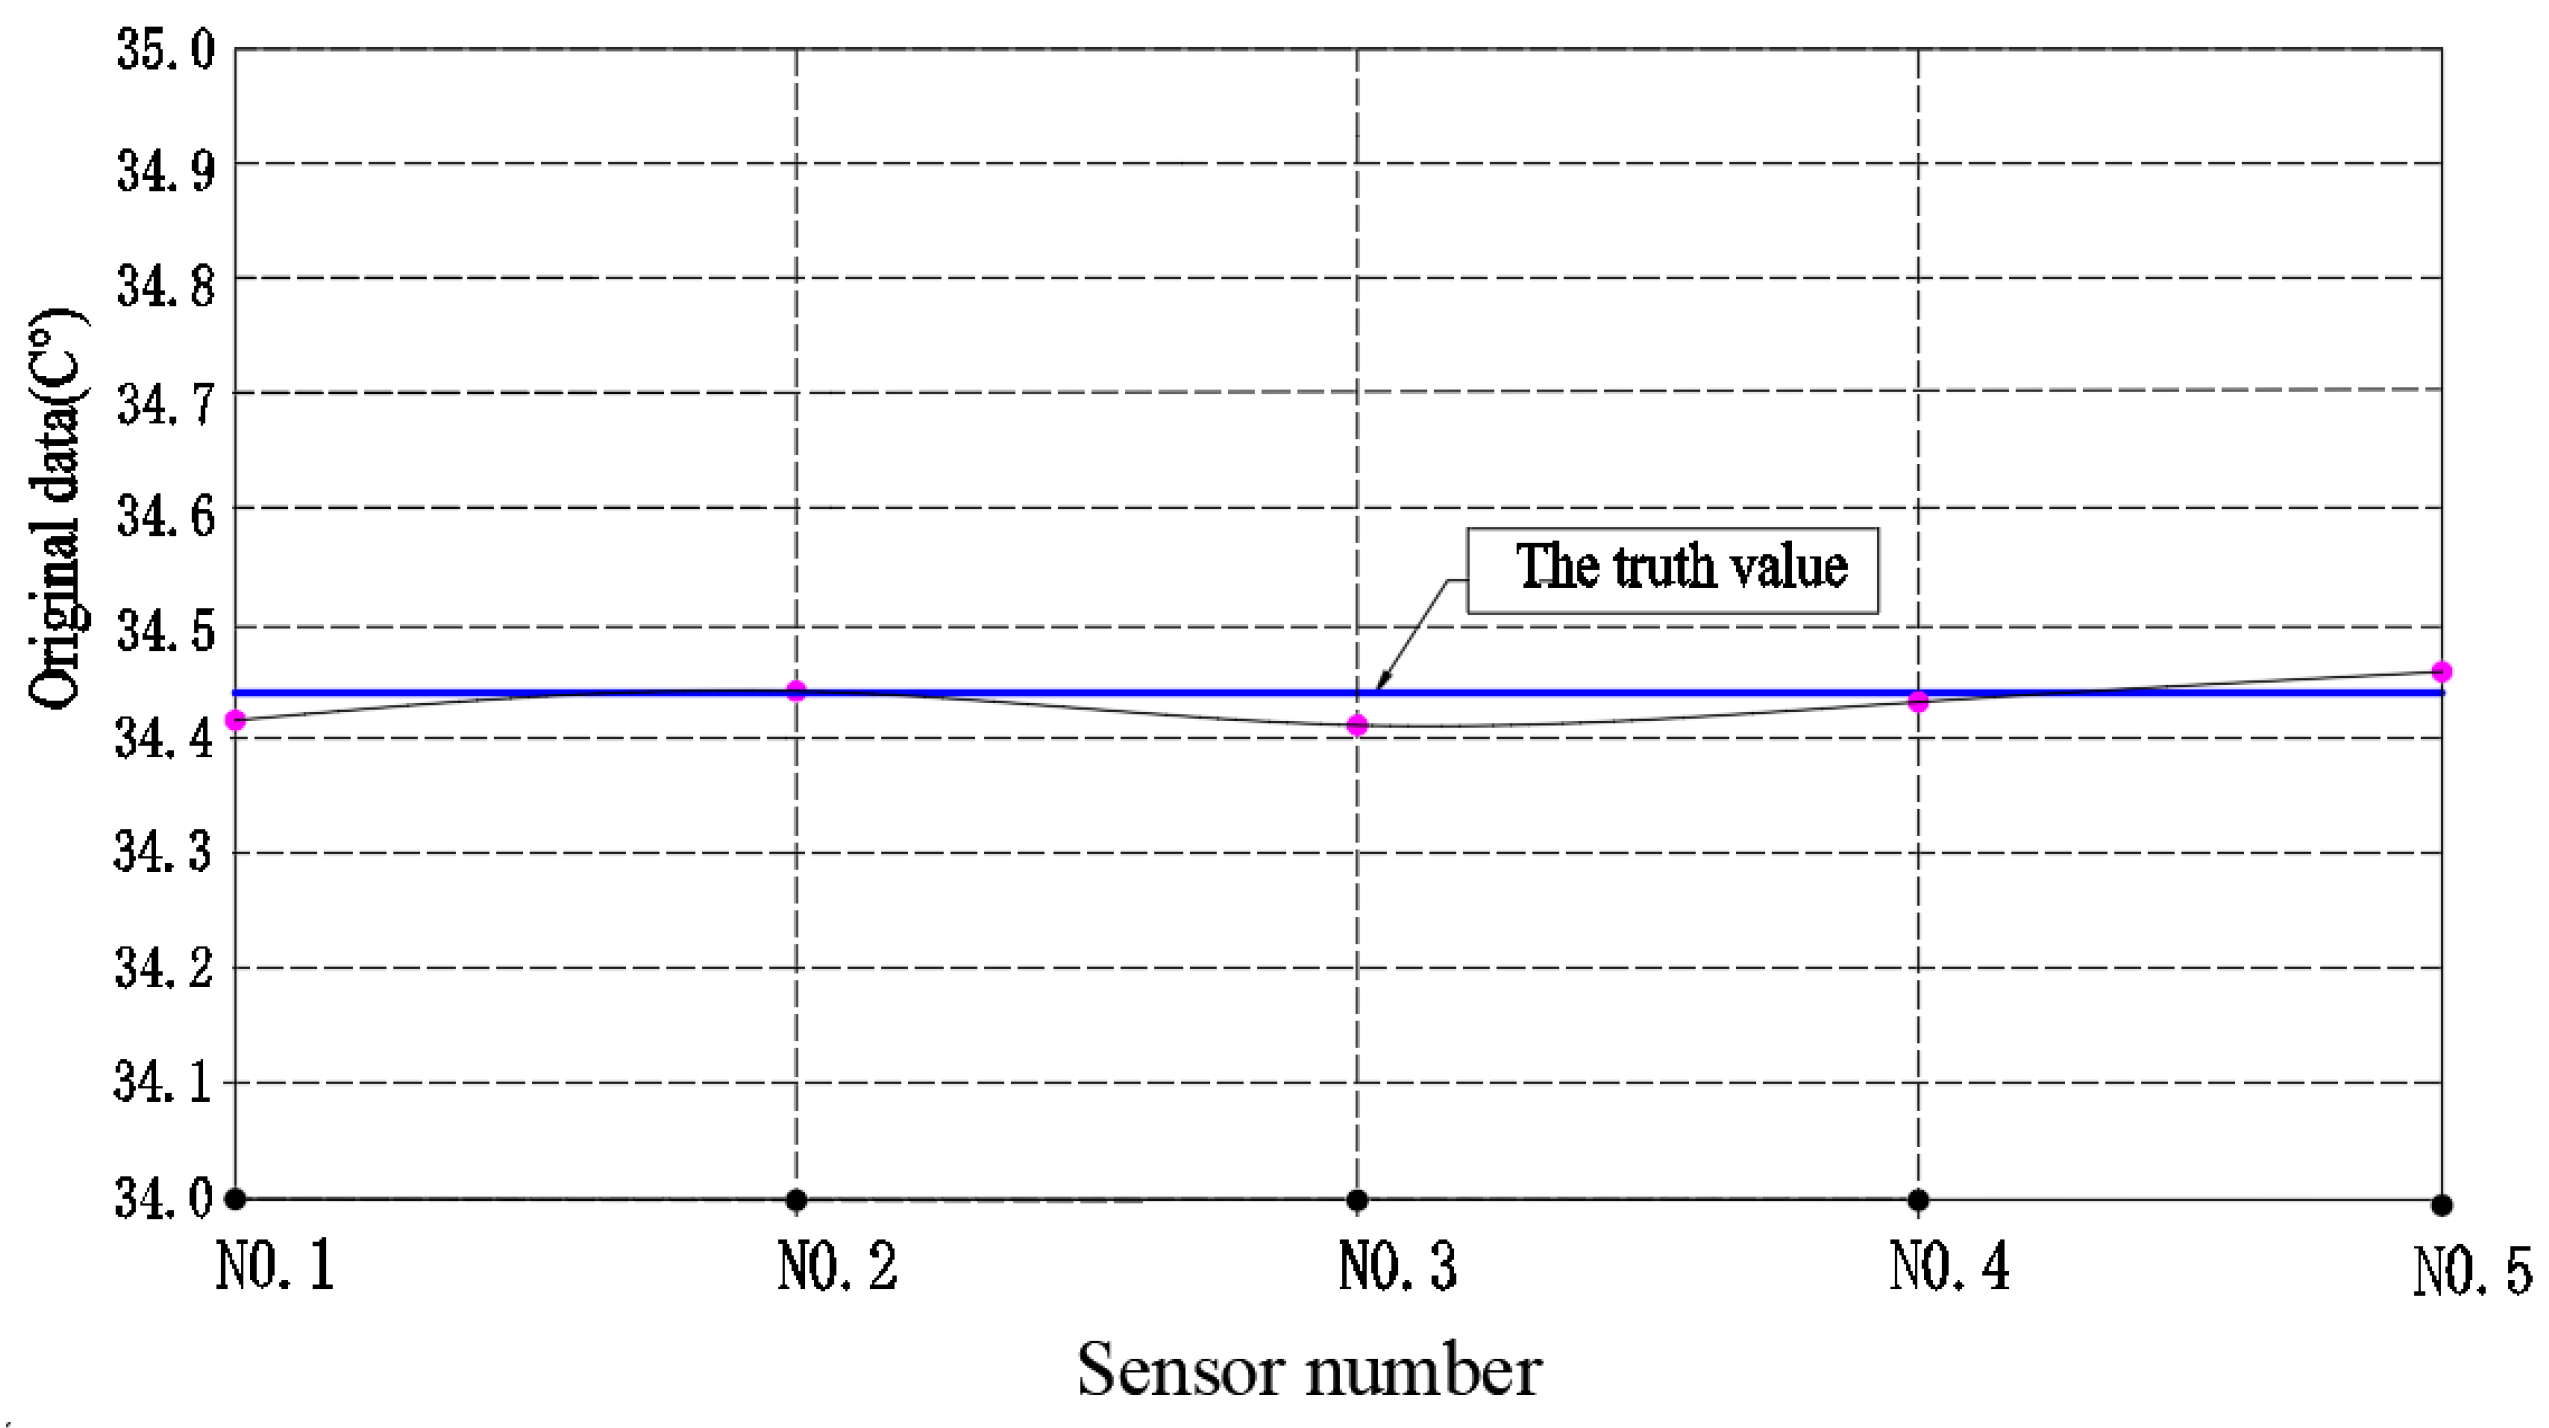
Figure 6. The information data distribution diagram of the oil temperature detected by different sensors as shown in
Figure 7. It can be seen from
Figure 6 and
Figure 7 that the distribution curve of oil temperature detection data is approximately a straight line after fractional partial differential processing. Therefore, it can be proved that the fractional differential operator has the function of fusing the difference between the information data to improve the detection accuracy of the detection system, and enhancing the information strength to improve the reliability of the production system.
4.5.2. When the Step length h=0.01
To explore the influence of fractional differential operator step
h on information strength and data accuracy. This time, we choose the step value
h = 0.01 and the number of steps to be calculated
mx = [(0.27-0.06)/0.01] = 21, and m
y = [(0.27-0.06)/0.01] = 21. According to (17), we can obtain the following equation:
Application (17), (18) and (20), we can calculate the test data
F (xi, yj) shown in
Table 1 processed by the fractional differential algorithm of
h=0.01,
v=0.5 Fractional order differentiation algorithm. The results of it are shown in
Table 4.
Divide the data shown in
Table 4 by the numerical magnification K
0.01 =1.227, and we can get the results of the original data shown in
Table 5. From the data shown in
Table 5, we can see that fused by
h=0.01,
v=0.5 fractional order differentiation algorithm, its numerical magnification is higher than 1.18 which fused by
h = 0.02,
v = 0.5 order partial differential algorithm obviously. The standard deviation between the fused data is
Sx = 0.0365,
Sy = 0.019, lower than the standard deviation
Sx = 0.0371,
Sy = 0.0201 fused by
h = 0.02,
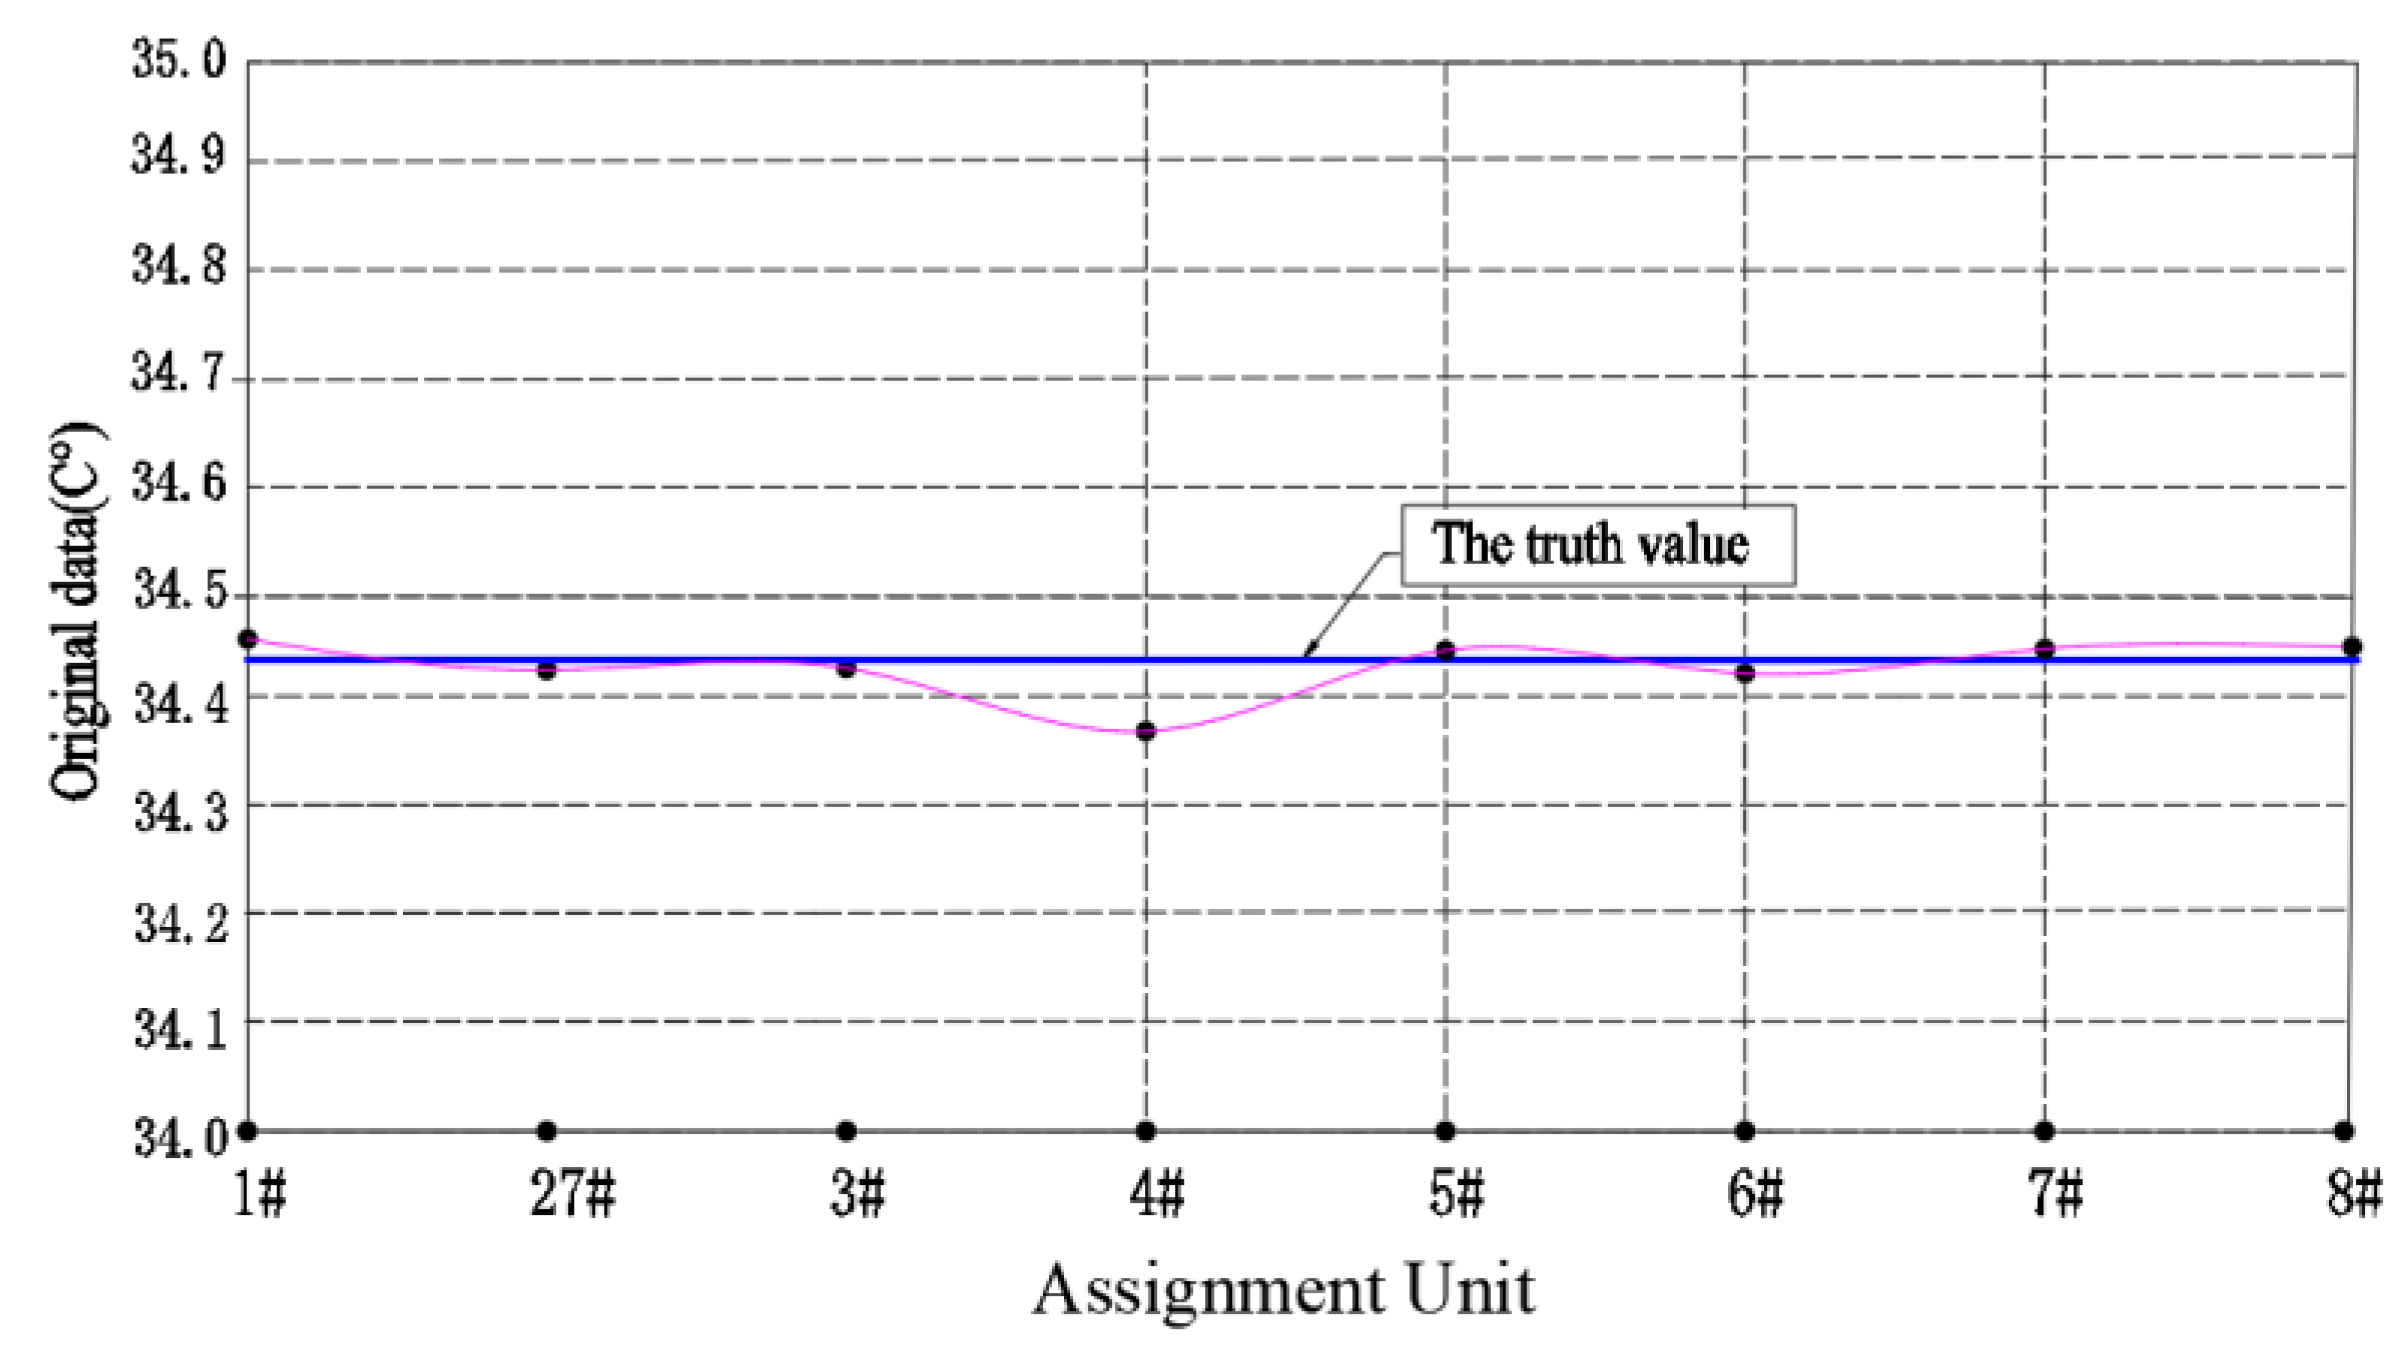
v = 0.5 order partial differential algorithm. Use the data shown in the
Table 5 to draw the information data distribution curve, as shown in
Figure 7 and
Figure 8. We can intuitively see the effect of step
h on data processing accuracy from
Figure 7 and
Figure 8.
4.5.3. Application effect analysis
According to the application results of the method in the case, it can be concluded that the fractional partial differential algorithm has three advantages in the inspection of mobile device production information data in integrated manufacturing systems.
It has high accuracy, and can eliminate the detection error of mobile device information data caused by multiple factors by adjusting the number of terms of fractional partial differential equation.
It can be realized by adjusting the step size h of fractional differential operator, Implement the detection technology of precision information data required by the production system.
It can improve the signal strength of detection information and avoid the problem of information data distortion caused by energy loss during the transmission of detection information.
For the above three advantages, the method used in this paper can solve the problems existing in the engineering practice of many current algorithms successfully, and realize the high-precision detection technology for the production information data of mobile devices in the integrated manufacturing system.
5. Conclusions
Mobile equipment is an important part of integrated manufacturing system, obtaining its accurate detection information data in real time is a prerequisite to ensure the normal operation of computer integrated manufacturing system. Wireless transmission is the main transmission mode of monitoring information, but in the process of wireless network transmission, transmission signal distortion is caused by detection equipment performance, signal interference and energy loss, and it is the main technical problem of the integrated manufacturing system. The mobile equipment monitoring information and detection data collected by the integrated manufacturing system production information management system under the IoT will inevitably have unpredictable measurement errors, so it becomes an urgent problem to be solved in the current integrated manufacturing system. Faced with the shortcomings of various current methods to solve problems, This paper, the use of fractional differential operators has the dual advantages of improving signal strength and detection accuracy, extends the fractional differential operator to the field of fractional partial differential and establishes a mobile equipment detection data fusion algorithm model based on fractional partial differential equation. Through application in the bearing oil temperature detection data fusion processing of a logistics trolley, which is an important production equipment in the integrated manufacturing system, we have verified the effectiveness of our method for mobile equipment detection in an integrated manufacturing system, and realized the research goal of using fractional partial differential equations to detect the mobile equipment monitoring information in an integrated manufacturing system rapidly and with high precision. It successfully solves the shortcomings of current methods in solving problems. The research results can provides technical support for ensuring the working reliability of integrated manufacturing system, and has great value to promote the development of integrated manufacturing technology.
Author Contributions
Zhang Miao performed the data analysis and wrote the manuscript; Fang Jigeng performed the formal analysis; Zuo Yanhong performed the validation. All authors have read and agreed to the published version of the manuscript.
Funding
Project supported by the National Natural Science Foundations, China (No.51878005 and No.51778004); Anhui Provincial Education Commission Foundation,China (No.KJ2020A0488).
Data Availability Statement
The datasets used and/or analyzed during the current study are available from the corresponding author on reasonable request.
Acknowledgments
We would like to express our gratitude to all those who helped us during the writing of this thesis. We gratefully acknowledge the help of the supervisor, Professor. Cheng Hua, who has offered us valuabe suggestoin in the acadmeic studies through each draft and provied us with inspiring advice.
Conflicts of Interest
No conflict of interest exits in the submission of this manuscript, and the manuscript is approved by all the authors for publication. I would like to declare on behalf of my co-authors that the work described isoriginal research that has not been published previously, and is not under consideration for publication elsewhere, in whole or in part. All the authors listed have approved the manuscript that is enclosed.
References
- Gianmarco Lazzini, Adrian Hugh Alexander Lutey, Luca Romoli, et al. High precision feature detection in laser texturing. Machinery Design & Manufacture Precision Engineering 2022; 73:183–194. [CrossRef]
- CHEN Xin, LIU Wenlong, LU Haihong. Research on GIS attribute data precision detection method based on differential evolution algorithm. AUTOMATION & INSTRUMENTATION 2020; 11:34-37.
- Dai Yujia, Li Mingliang, Song Chao. Accuracy improvement of Fe element in aluminum alloy by laser induced breakdown spectroscopy under spatial confinement combined with gradient descent. Acta Phys. Sin 2021; 70(20): 205204.1-205204.7.
- Duan Zhenyun, Wang Ning, FuJingshun, et al. High Precision Edge Detection Algorithm for Mechanical Parts Measurement Science Review, v 18, n 2, p 65-71, April 1, 2018. [CrossRef]
- Liang Yan. Study on the 3D Laser Scanning Point Cloud Data Simplification and Modeling Application. Ph.D. Geodesy and Surveying Engineering., China University of mining and technology, WuHan, 2020.
- Guo Lei. Research on declassification technology of sensitive data in GIS. Ph.D. Software engineering., North China University of Technology, BeiJin, 2019.
- Wang Yu, Wu Weixin. Simulation of Precision Monitoring for Data Transmission of Communication Information in Internet Users. Computer Simulation, 2018; 35(03): 373-376+406.
- MUIñOZ J, MOLERO-Castillo G, Benítez-Guerrero E, et.al. Data fusion as source for the generation of useful knowledge in context-aware systems. Journal of Intelligent & Fuzzy Systems 2018; 34(5):3165-3176. [CrossRef]
- SUN Quan, YE Xiuqing, GU Weikang. A new combination rules of evidence theory.ACTA Electronica Sinica 2000; 8: 117 -119.
- MURHY C, K. Combining belief functions when evidence conflicts. Decision Support Systems 2020; 29(1): 1-9. [CrossRef]
- ZHOU Jian, MA Chenhao, LIU Linfeng et.al. Multi-sensor data fusion method for water quality evaluation based on interval evidence theory. Journal on Communications 2016; 37(09): 20-29. [33] ZUO Yan-hong, ZHANG Ke-ren. (2014). Discrete Data Fusion with Integral Discrete Guidance in Internet of Things. Computer Science. 41(3), 149-152.
- ZUO Yan-hong, CHENG Hua, ZHU Yin-feng. (2019). The Algorithm for Multi-sensors Detection Data Fusion Based on Fractional Differential. Science Technology and Engineering. 19(11),189-194.
- ZUO Yanhong, CHENG Hua, CHENG Tangchun. (2020). Application of fractional differential operator in coal mine detection data fusion processing. Journal of China Coal Society. 45(2), 819-826.
- ZUO Yan-hong, ZUO Cheng-ji, FANG Ji-gen. (2021). Engine On-line Detection Data Fusion Technology Based on Fractional Integral. Science Technology and Engineering. 21(2), 644-650.
- ZUO Yanhong, CHENG Hua, ZHANG Keren. (2015). Fusion algorithm of discrete manufacturing system detection data based on fractional partial differential. Computer Integrated Manufacturing Systems, 21(12). 3256-3262.
- ZUO Yanhong. “Research on discrete manufacturing inspection data fusion technology based on fractional calculus,” Ph.D. dissertation, Dept. Mechanics Eng., Hefei University of technology, HeFei, China, 2019.
- ZUO Yanhong, CHENG Hua, CHENG Tangchun. (2021), On-Line Detection Data Fusion Algorithm of Underground Mobile Equipment Based on Fractional Order Partial Differential, 34(2), 237-243.
- ZUO Yanhong, YAO Yansheng, GENG Guoqing. Application of fractional partial differential in fault diagnosis of industrial robots. Computer Integrated Manufacturing Systems 2022 (04). [CrossRef]
- Vinagre B.M, Y.Q. Chen, “Fractional calculus applications in automatic control and robotics,”. Las Vegas:41st IEEE CDC, Tutorial workshop 2, 2002.
- X. Li, W. Lu, Z. Liao, et al. Applicated research of fractional calculus in sliding mode control. Transducer and Microsystem Technologies, 41(02) (2022) 46-49+57.
- L. Bai, D. Xue. High Precision Recursive Algorithm for Computing Fractional-Order Derivative and Integral. Journal of Northeastern University(Natural Science), 9(04) (2018) . 604-608. [CrossRef]
- Duan Xiaomeng, Yin Deshun,.(2013). AN Liyuan, et.al. Study on deformation of viscoelastic materials based on Fractional Calculus. SCIENCE CHINA: physics mechanics astronomy. 43 (8) : 971-977.
- Darling R, Newman J. (1997). On the short behavior of porous intercalation electrodes, J. Electrochem. Soc., 144(9), 3057-3063. [CrossRef]
- WANG Bao, ZHU Jiaming. Quantitative Analysis of High Temperature Protective Clothing Design Based on Fractional Partial Differential Equation Solution and Optimization Model. Journal of Sichuan University of Science & Engineering(Natural Sicence Edition) 2019; 32(04): 86 -93.
- ZHOU Shangbo, WANG Liping, YIN Xuehui. Applications of fractional partial differential equations in image processing. Journal of Computer Applications 2017; 37(2): 546 -552. [CrossRef]
- SHEN Tianlong. “Dynamics of stochastic Fractional Partial Differential Equations,” Ph.D. dissertation, Dept. Mathematical Theory., National Defense University of science and technology., ChangSha, China, 2017.
© 2023 by the authors. Licensee MDPI, Basel, Switzerland. This article is an open access article distributed under the terms and conditions of the Creative Commons Attribution (CC BY) license (http://creativecommons.org/licenses/by/4.0/).
