1. Introduction
Additive Manufacturing (AM) has emerged as a game-changer in the field of aerospace engineering, providing opportunities for the design and manufacture of complex structures with improved mechanical properties [
1]. One of the key challenges in aerospace engineering is the development of effective anti-ice systems, which are essential for ensuring safe and efficient operations in cold and icy conditions [
2,
3]. In recent years, lattice structures made of AlSi10Mg alloy have emerged as a promising candidate for the development of innovative anti-ice systems [
4,
5,
6]. However, being able to predict the fatigue strength under cyclic loading is one of the greatest challenges nowadays [
7,
8,
9]. A search of the literature revealed few studies, which experimentally evaluate the fatigue curves of lattice structures made of AlSi10Mg fabricated by AM [
10,
11]. This paper presents the results of an experimental study aimed at investigating the fatigue strength of lattice structures made of AlSi10Mg alloy fabricated by AM and to provide insights into the design and optimization of innovative anti-ice systems for aerospace applications [
12]. Fatigue strength is a crucial parameter in the design of aerospace components, especially those that are subjected to cyclic loading. Lattice structures, also known as cellular or honeycomb structures, are highly desirable due to their lightweight nature and high stiffness-to-weight ratio [
13,
14,
15]. They have been used in various applications, including heat exchangers, sandwich panels, and energy absorption systems [
16,
17,
18,
19]. AlSi10Mg is an aluminum alloy that has been extensively used in AM due to its excellent mechanical properties and good weldability [
20]. In the case of anti-ice systems, lattice structures made of AlSi10Mg have been proposed as a potential solution due to their ability to provide excellent anti-ice performance by allowing a continuous flow of hot air to pass through the structure, thus melting the ice on its surface [
12,
21]. However, the fatigue strength of these structures is not well understood, which poses a significant challenge in their design and optimization. The experimental study presented in this paper involves the testing of AlSi10Mg lattice structures fabricated by AM under cyclic loading to determine their fatigue strength. The results of this study will provide insights into the behavior of these structures under cyclic loading and will help in understanding their failure mechanisms. The findings of this study will also aid in the development of design guidelines for lattice structures made of AlSi10Mg and will enable the optimization of innovative anti-ice systems for aerospace applications [
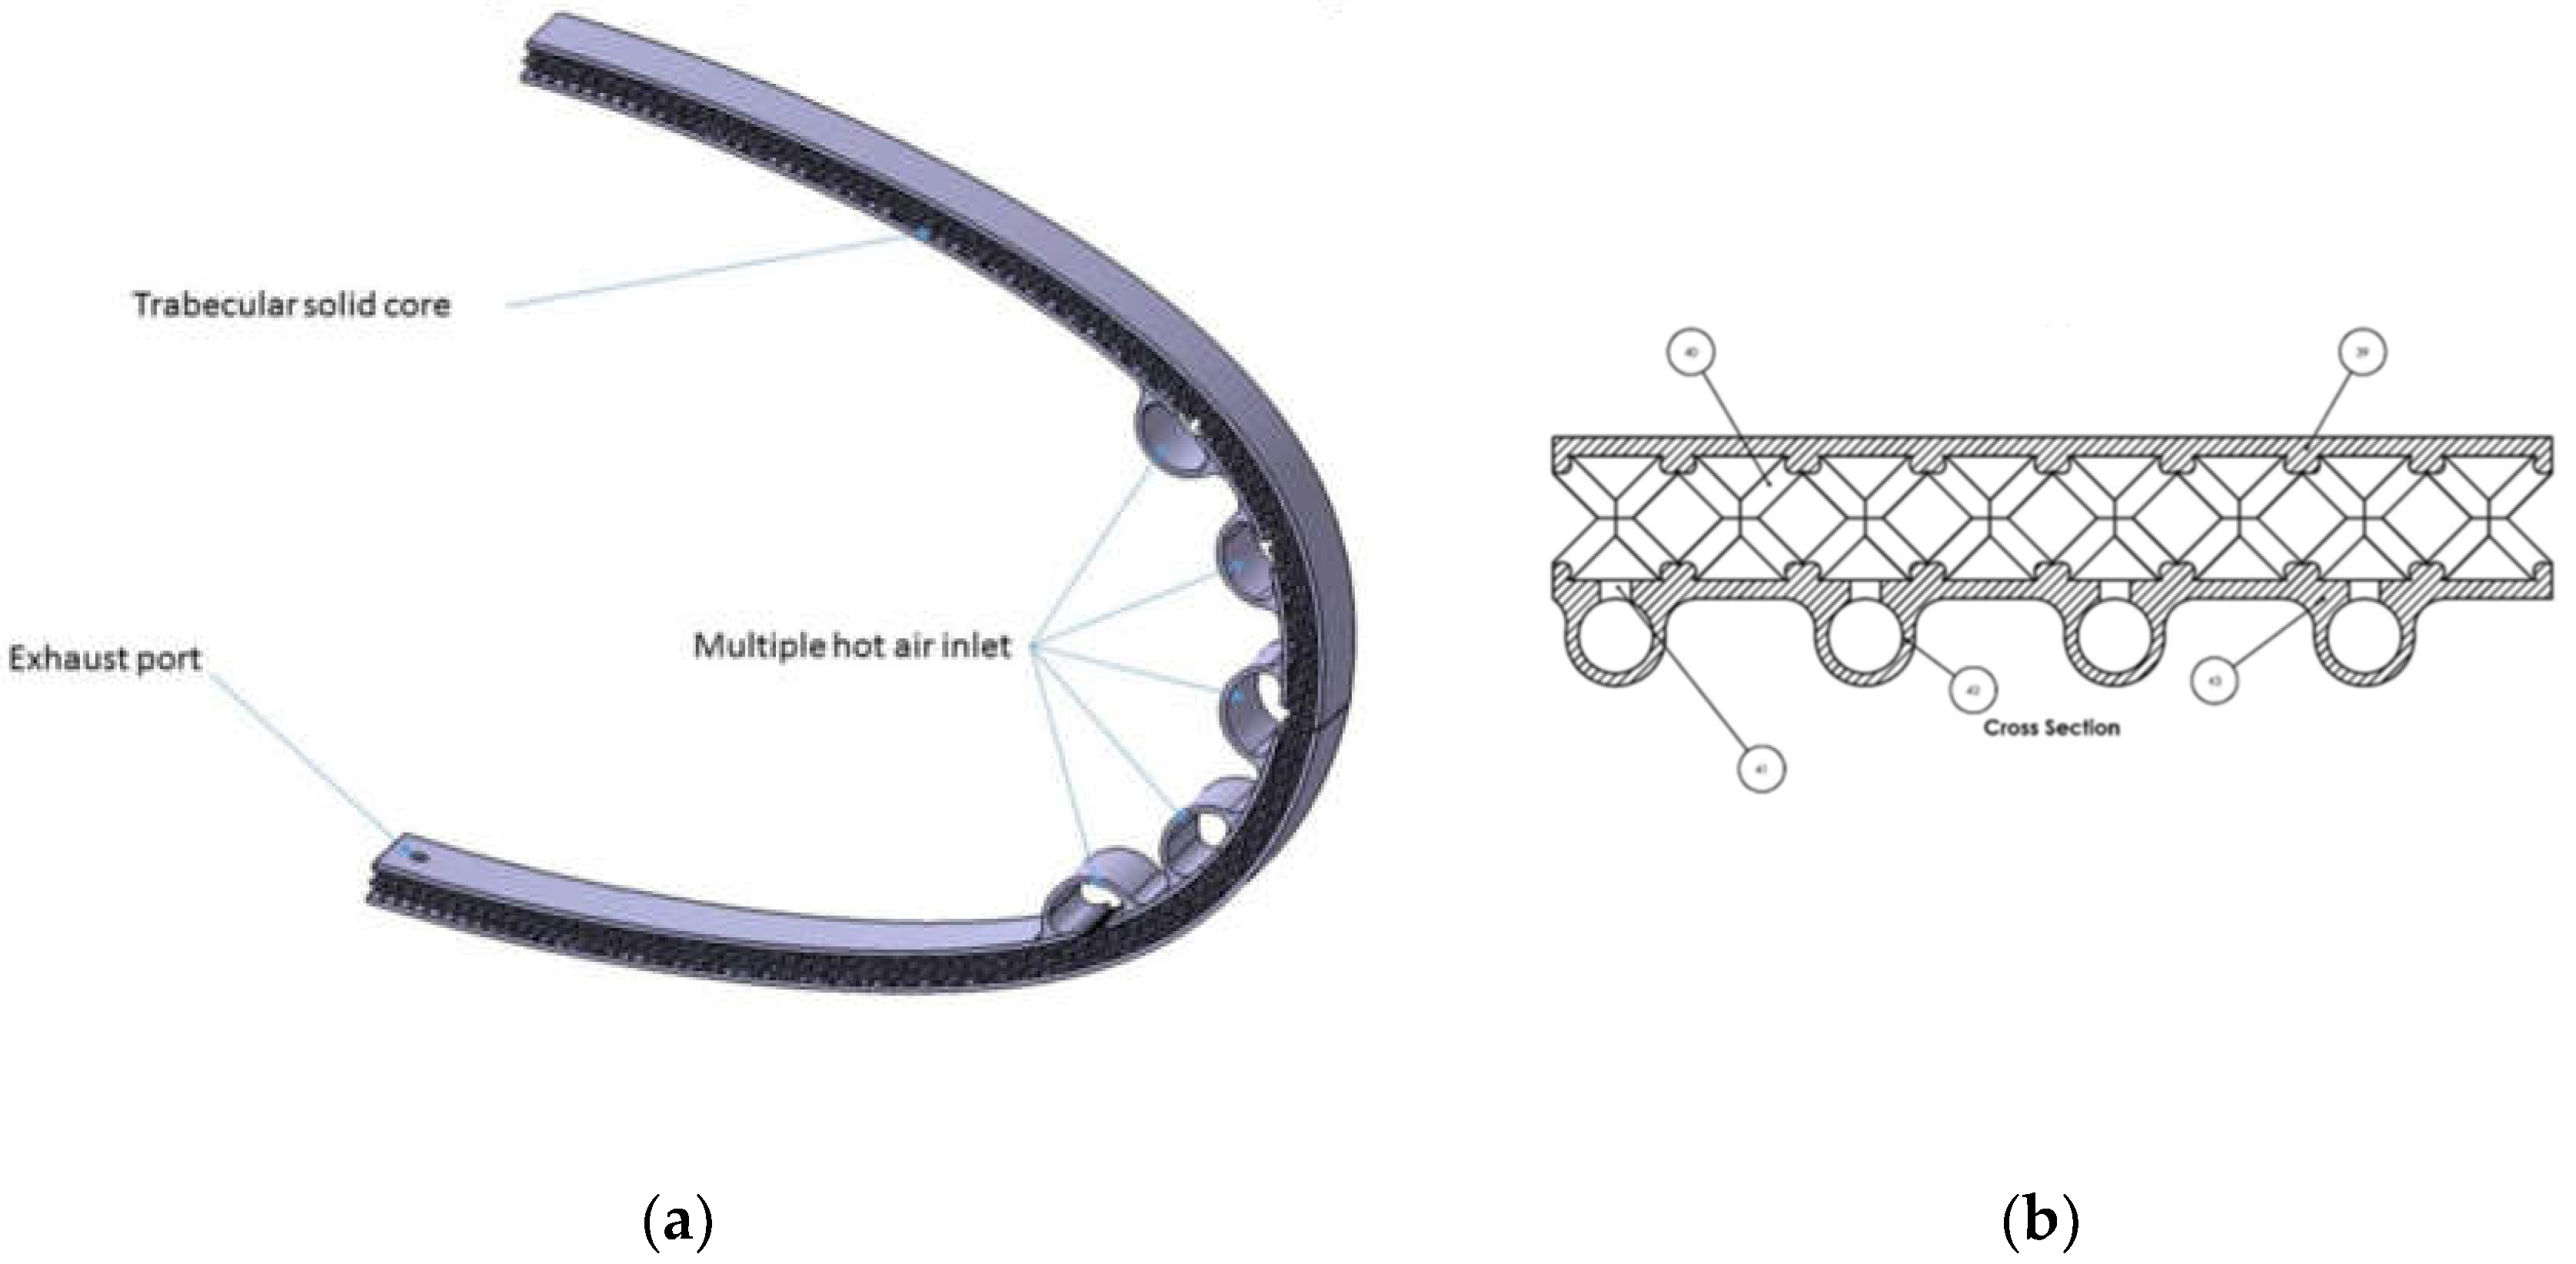
22]. In summary, the experimental evaluation of the fatigue strength of lattice structures made of AlSi10Mg fabricated by AM is of significant interest to the aerospace industry, especially in the development of innovative anti-ice systems (
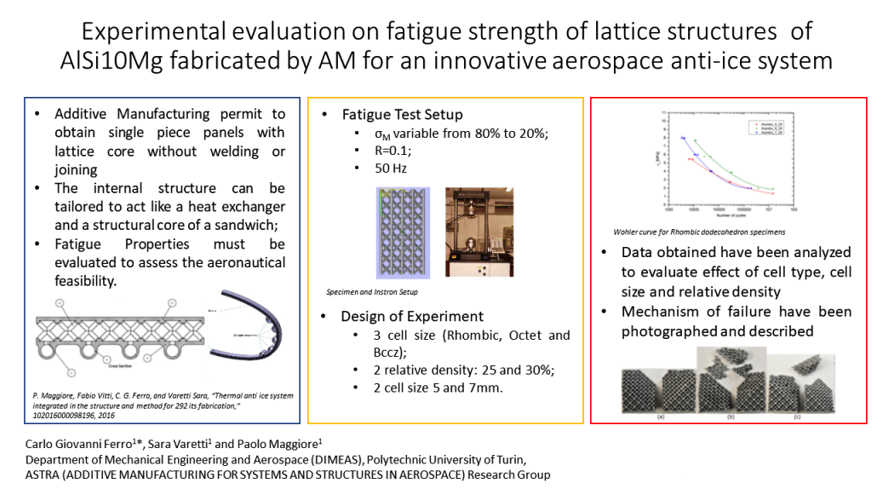
Figure 1). This study aims to fill the knowledge gap regarding the fatigue behavior of these structures and provide insights into their design and optimization for aerospace applications.
2. Materials and Methods
In this section, the Materials Adopted and the Methods selected will be presented.
2.1. Design of Experiment (DOE)
The fatigue tests on trabecular cores had the objective to experimentally characterize fatigue life curve of different types of non-stochastic foams built in AlSi10Mg by AM. Data for this study were collected using a DOE approach [
23] in order to provide new insights for what concerns the effects of design parameters on lattice fatigue performance [
24]. Although some research has been carried out on fatigue with this approach [
24], no studies have reported this wide investigation for AlSi10Mg.
Three different trusses have been selected: Bccz, Octet truss and rhombic dodecahedron. For each cell type two cells size, 5mm and 7mm have been adopted with two relative densities: 25% and 30%. In order to contain the number of specimens and the cost of the experimental campaign, the DOE with three factor and hybrid levels for each factor was executed in fractional factorial form. Details of the specimens produced for the fatigue test are reported in
Table 1.
2.2. Specimen Design
The trabecular specimens presented a double height compared to the base sides. Each specimen has a square bottom composed by 4x4 cells and a vertical side of 8 cells to avoid border effect, as shown in
Figure 2. The nominal dimensions for 5mm cells are 20x20x40 mm
3 and 28x28x56 mm
3 for the 7mm specimens. All specimens present two skins of 1mm thick at the square bases. This skin distributes uniformly the stresses on the different cells and avoid peak caused by manufacturing imperfections.
2.3. Fatigue Test Setup
Compression-compression fatigue tests were carried out according to scientific literature [
25,
26,
27,
28].
A variable maximum load of 80%, 60%, 40% and 20% of the static yield load has been imposed in order to obtain the Wohler curves. The ratio of R=0.1 implies that the compressive load on the specimens oscillates with a sinusoidal from 10% to 100% of the imposed load 50 times per second (50 Hz). The maximum value of the oscillation is defined as σ
M and obtained from the Equation 1; the parameter x corresponds to the values of 80%, 60%, 40% and 20% and σ
02 is the average result of the uniaxial compression tests on the corresponding trabecular specimens. This value has been separately calculated by other experimental compressive test on analogues specimens. The minimum value of the oscillation is reported as σ
m, obtained from the Equation 2, where R is maintained at 0.1. The median value between σ
M and σ
m is σ
a, calculated with the Equation 3. To evaluate the Wohler curve it is then necessary to evaluate for each specimen the median load, σ
a, e and the number of cycles (N) corresponding to the specimen failure.The chosen upper limit for the cycles is N equal to 1.5*10
7, suitable for airframes structure and systems life limit computation.
The values of σ
M, σ
m, σ
a and N are listed in
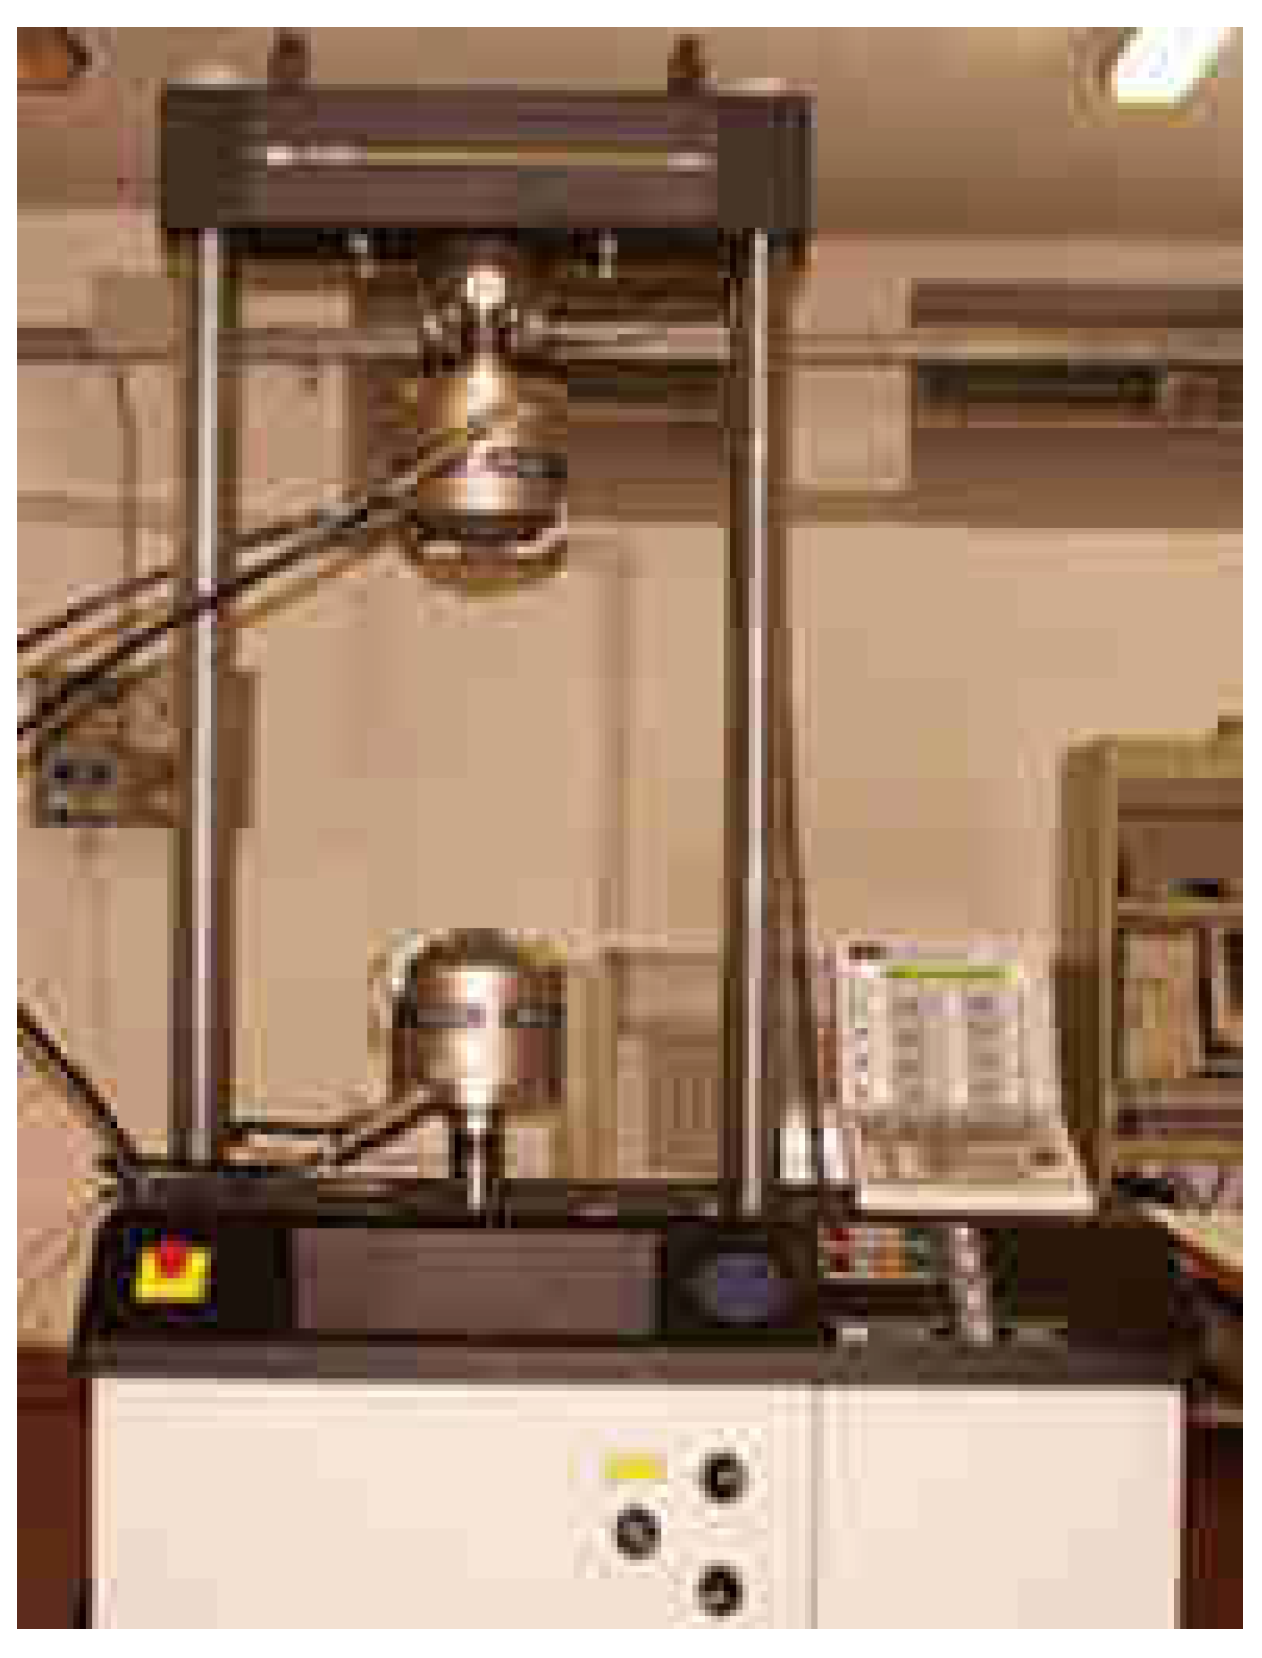
Appendix A. All specimens were processed with an Instron machine, as shown in
Figure 3, with three repetitions for each type.
3. Results
In this section, the result obtained from the fatigue tests will be provided. All the numerical evidences are reported in
Appendix A subdivided by cells type. For each cell type Wohler, curves will be provided and discussed. The Wohler curves correlates the amplitude of the load, σ
a, for each sample and the number of cycles at which the specimen failure occurs. Subsequently images of broken specimens will be reported to provide evidence on the failure mechanism.
3.1. Rhombic Dodecahedron
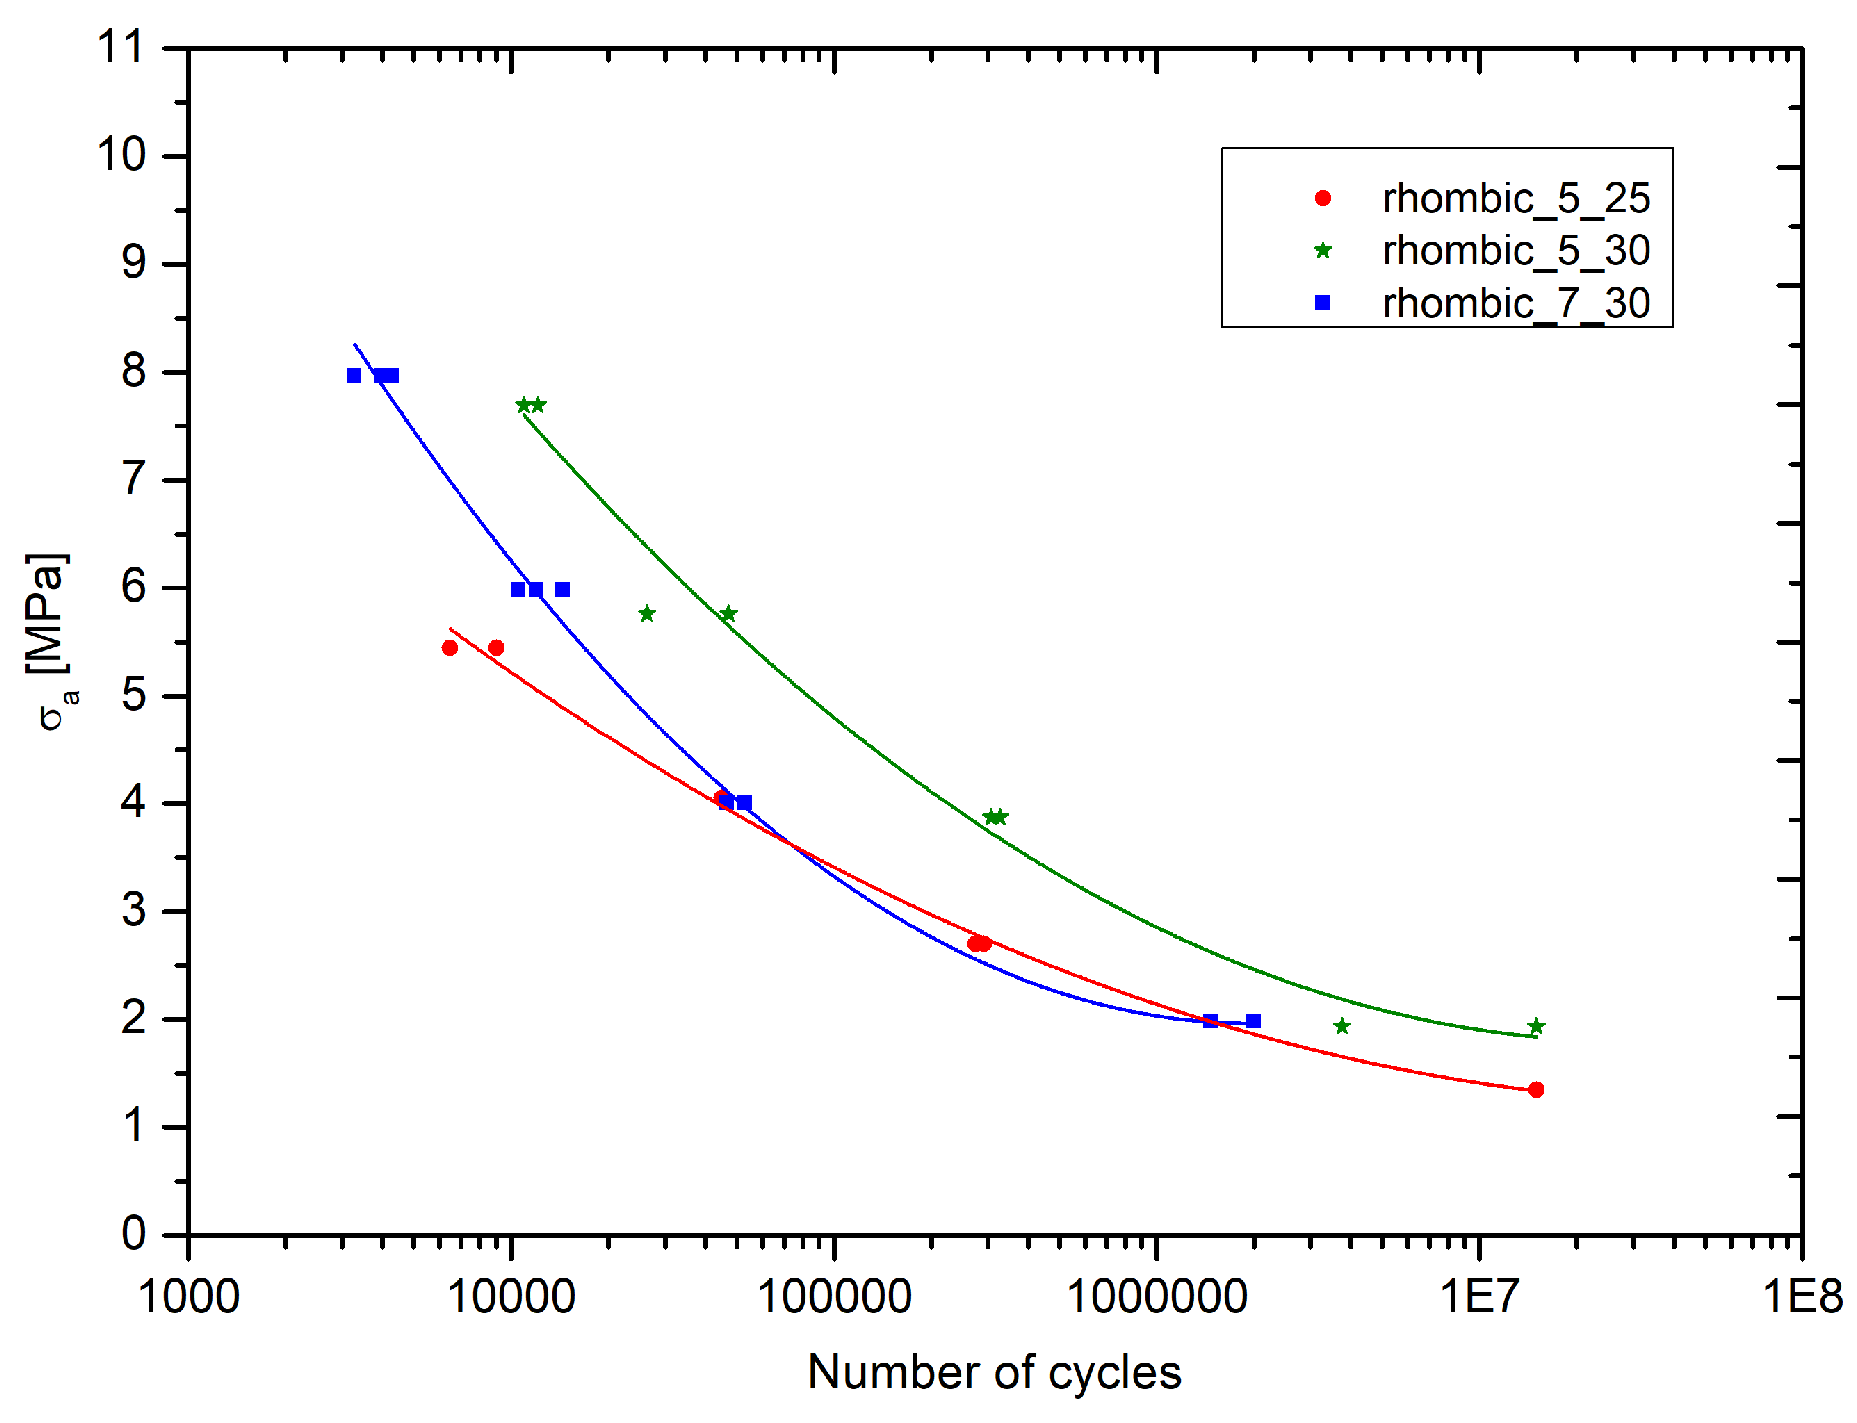
The graph in
Figure 4 reports Wohler curves for all the rhombic specimens tested. At equal σ
a (load amplitude) the longest fatigue life is that of specimens with lower cell size, 5mm and higher density, 30%. The second longest endurance is represented by cells with 7mm of cell size and 30% or relative density. The lowest fatigue life is witnessed by specimens with 5mm of cell size and 25% of relative density. The most interesting aspect of this graph is the effect of cell size. Increasing cell size, while maintaining fixed the relative density of the specimen (i.e. same amount material per cubic centimetre), reduces the fatigue life noticeably.
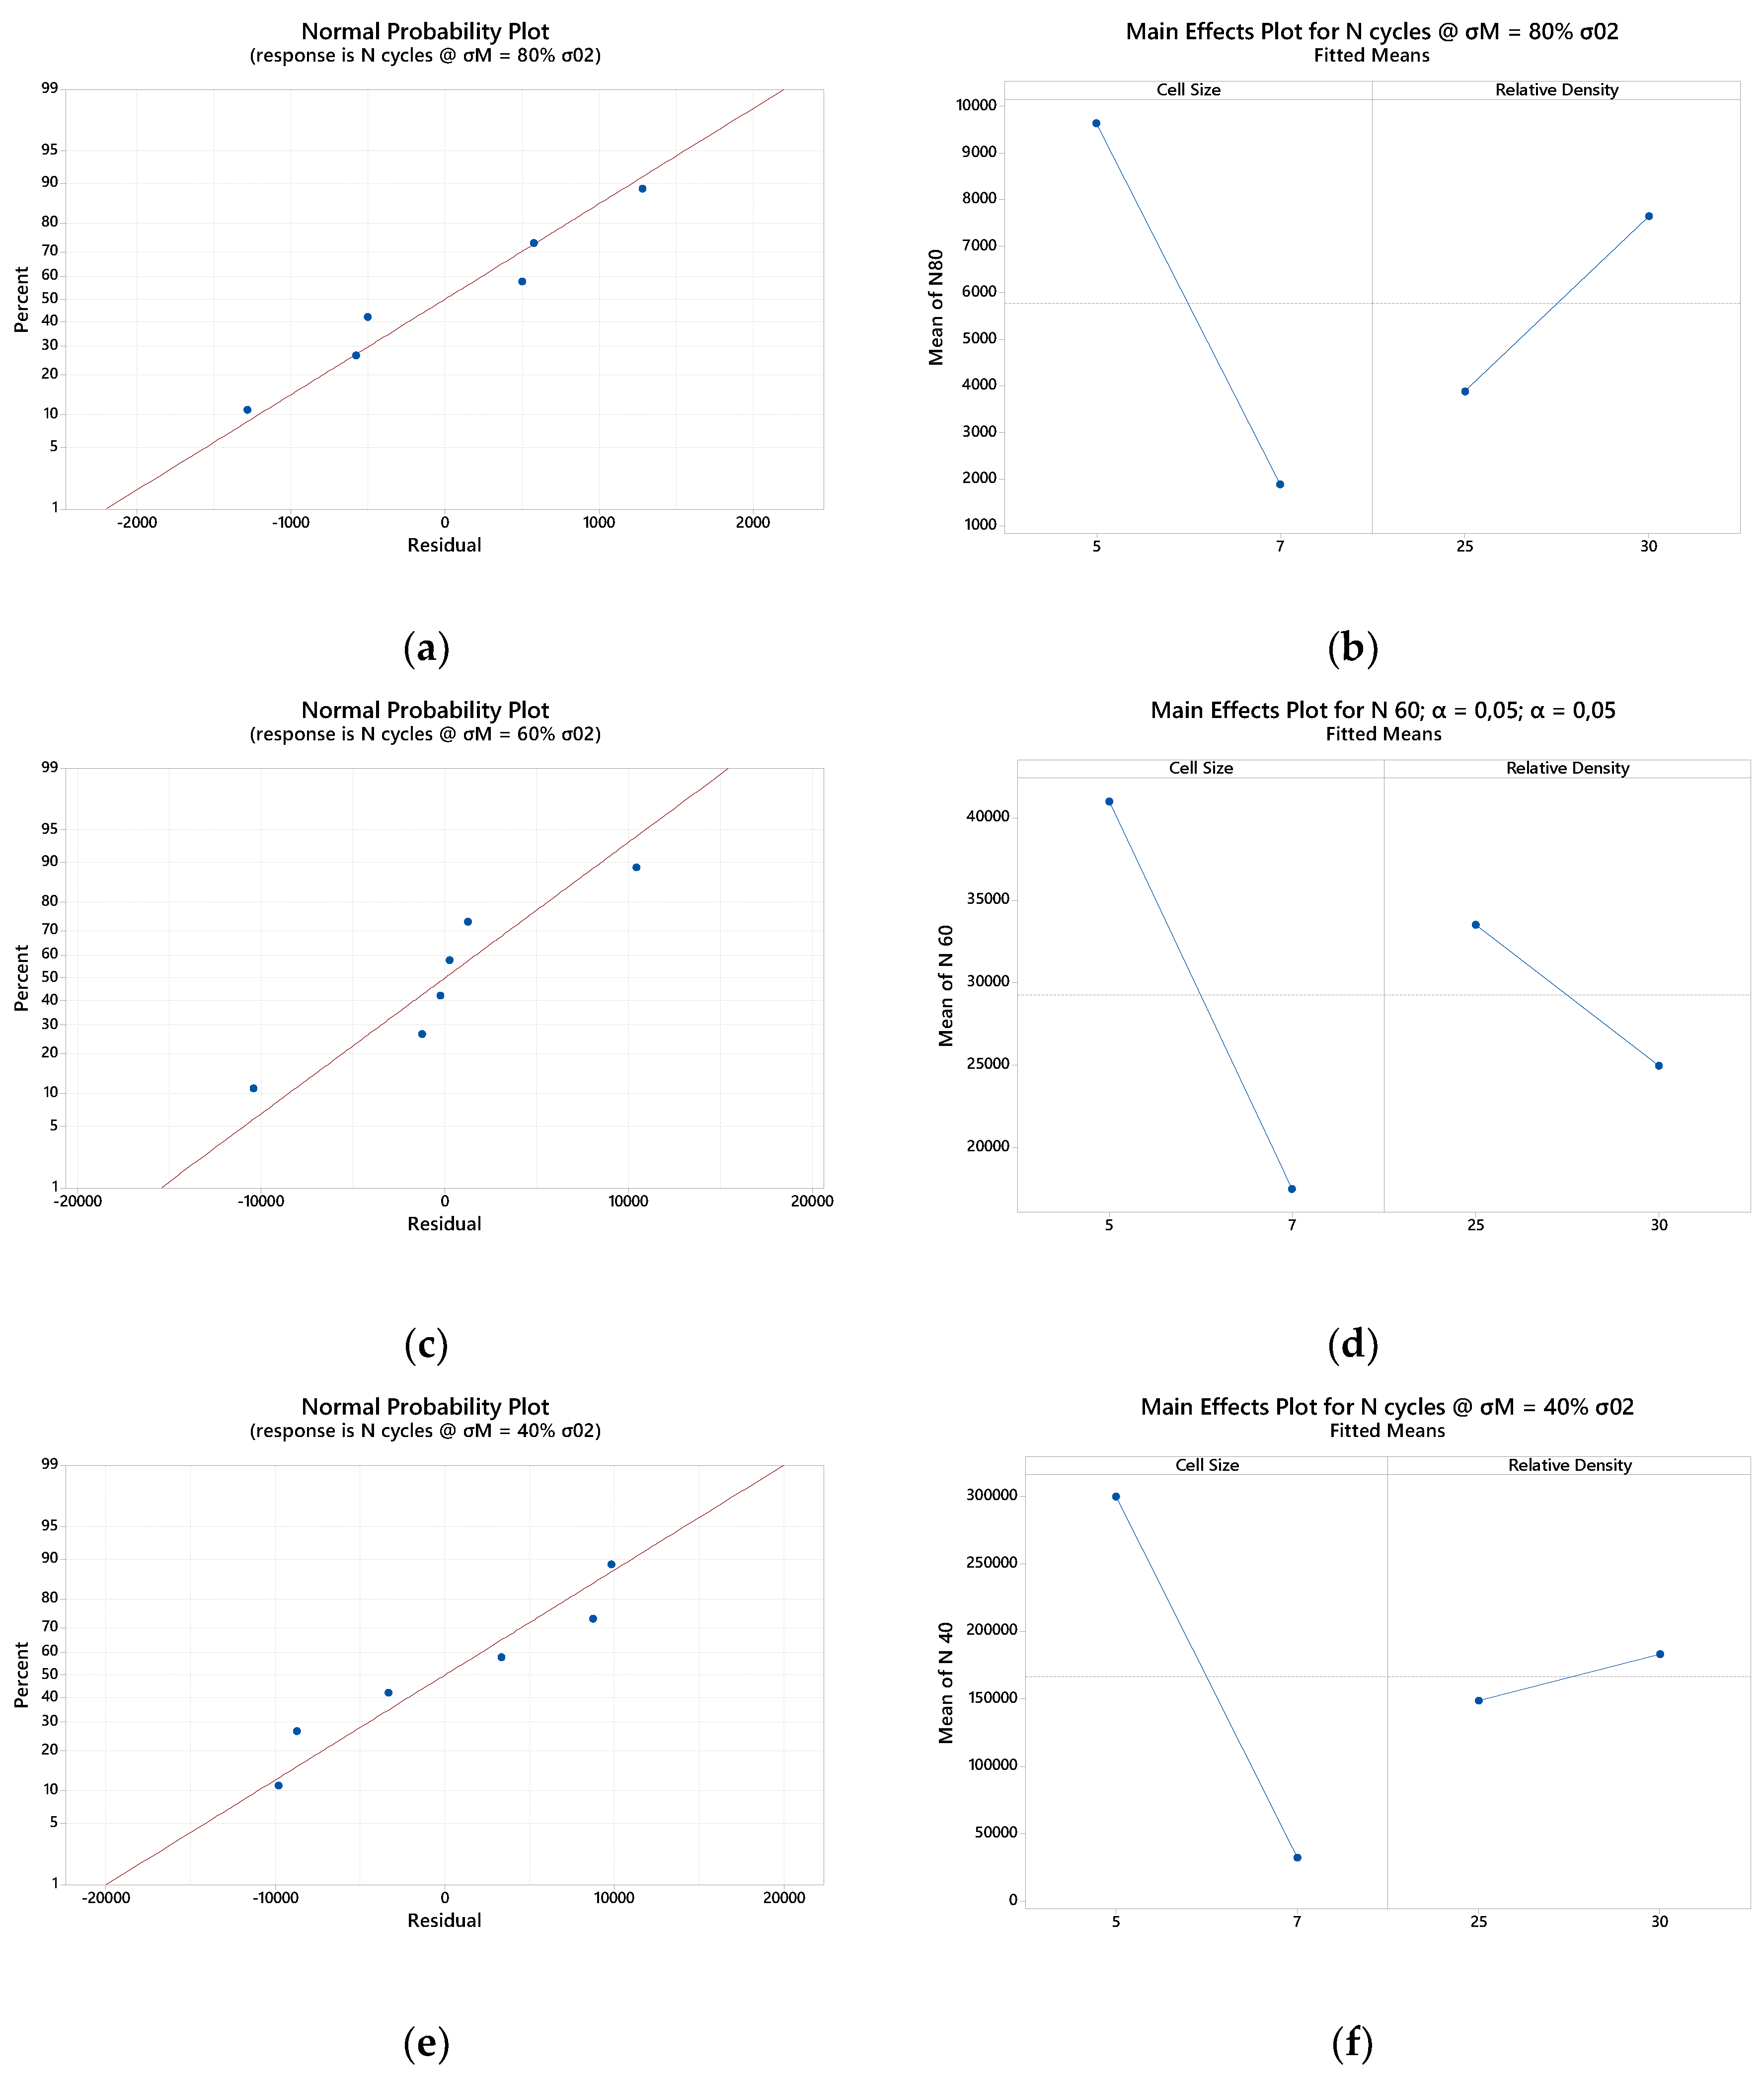
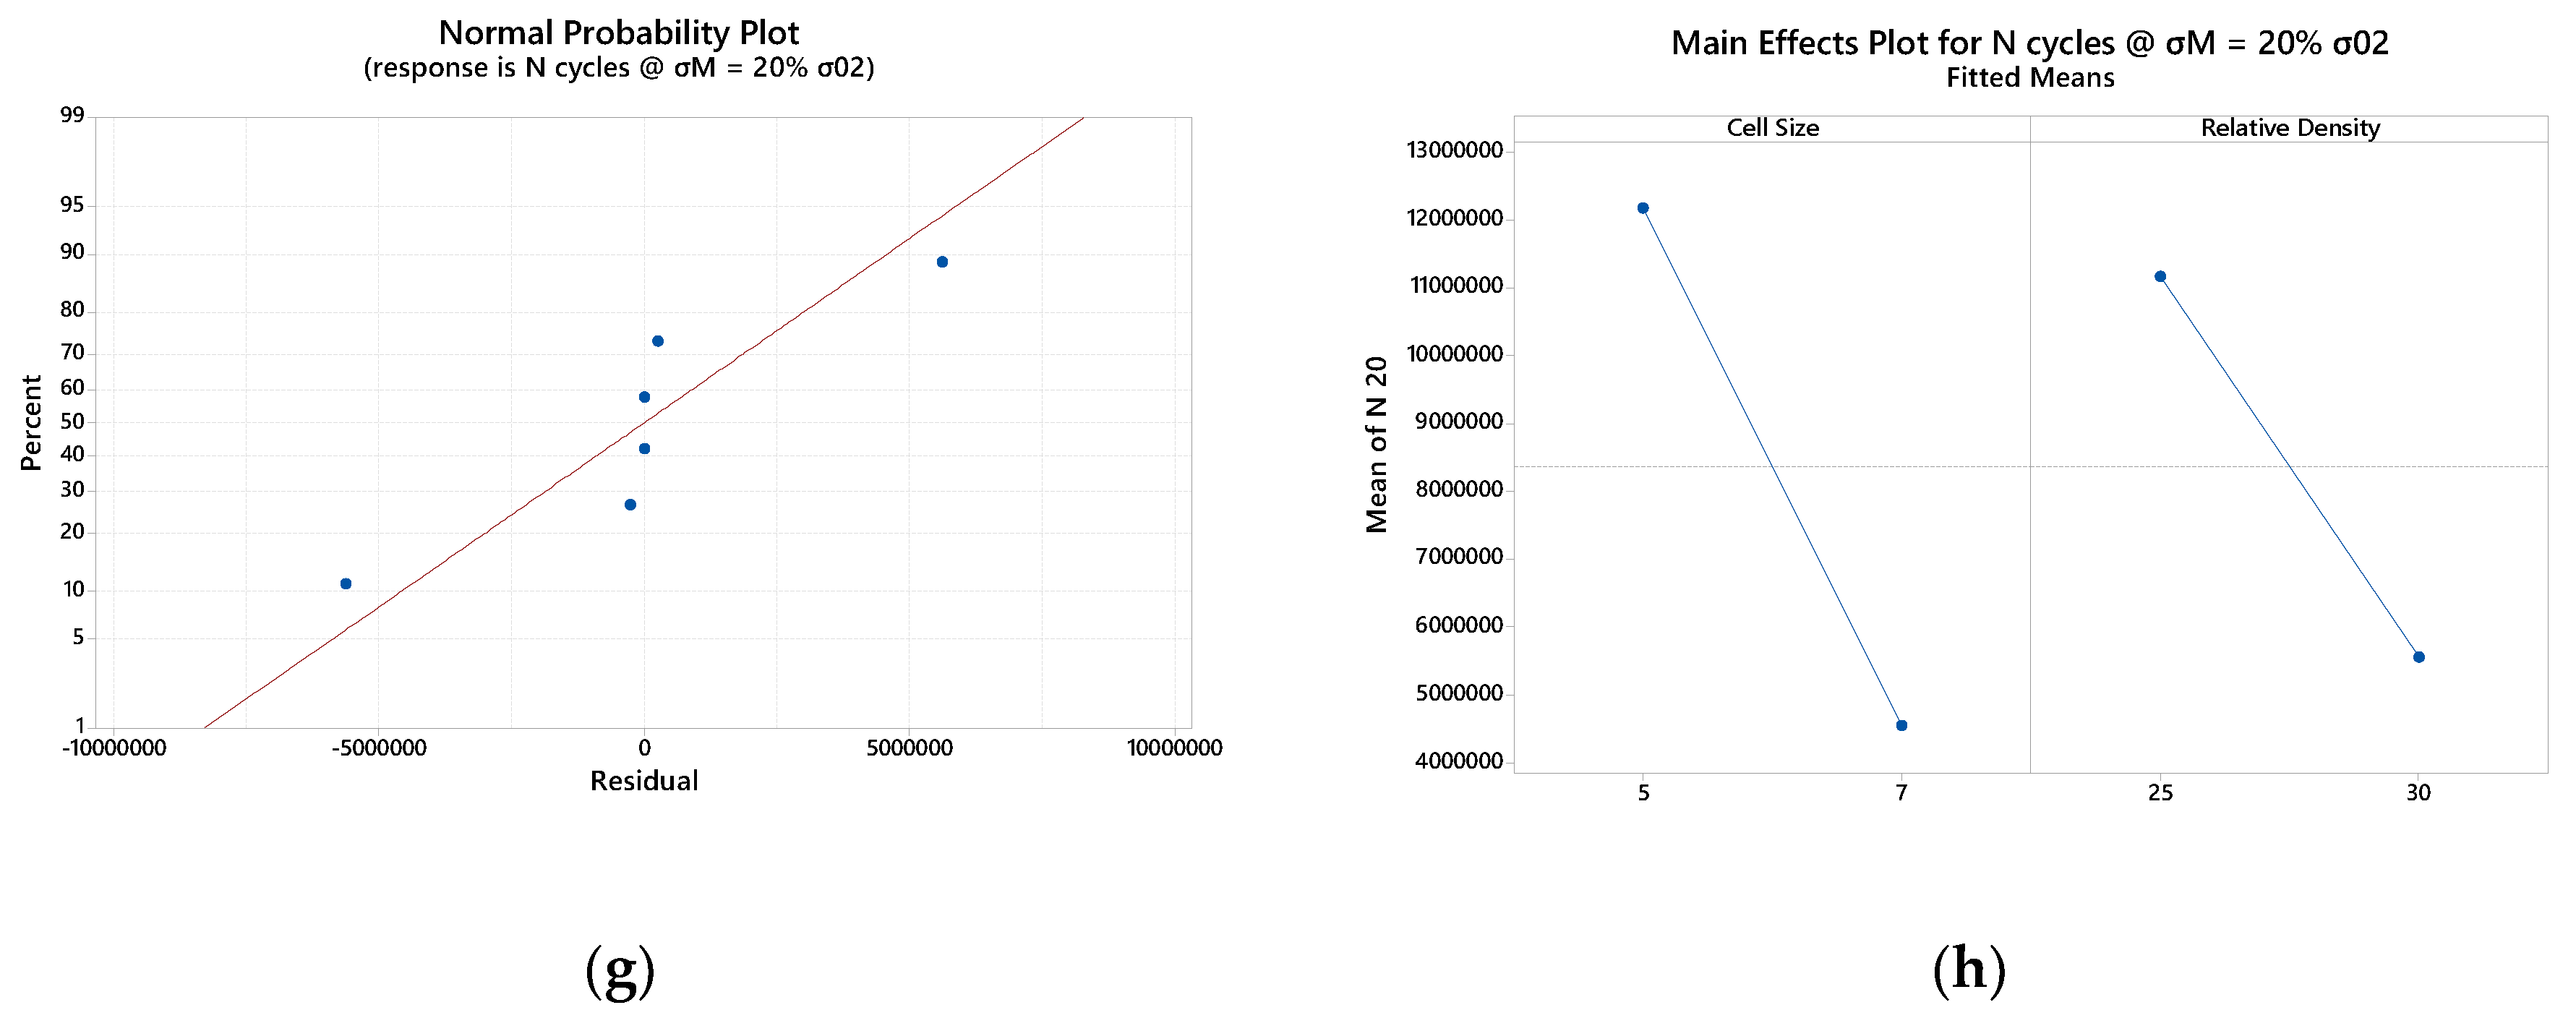
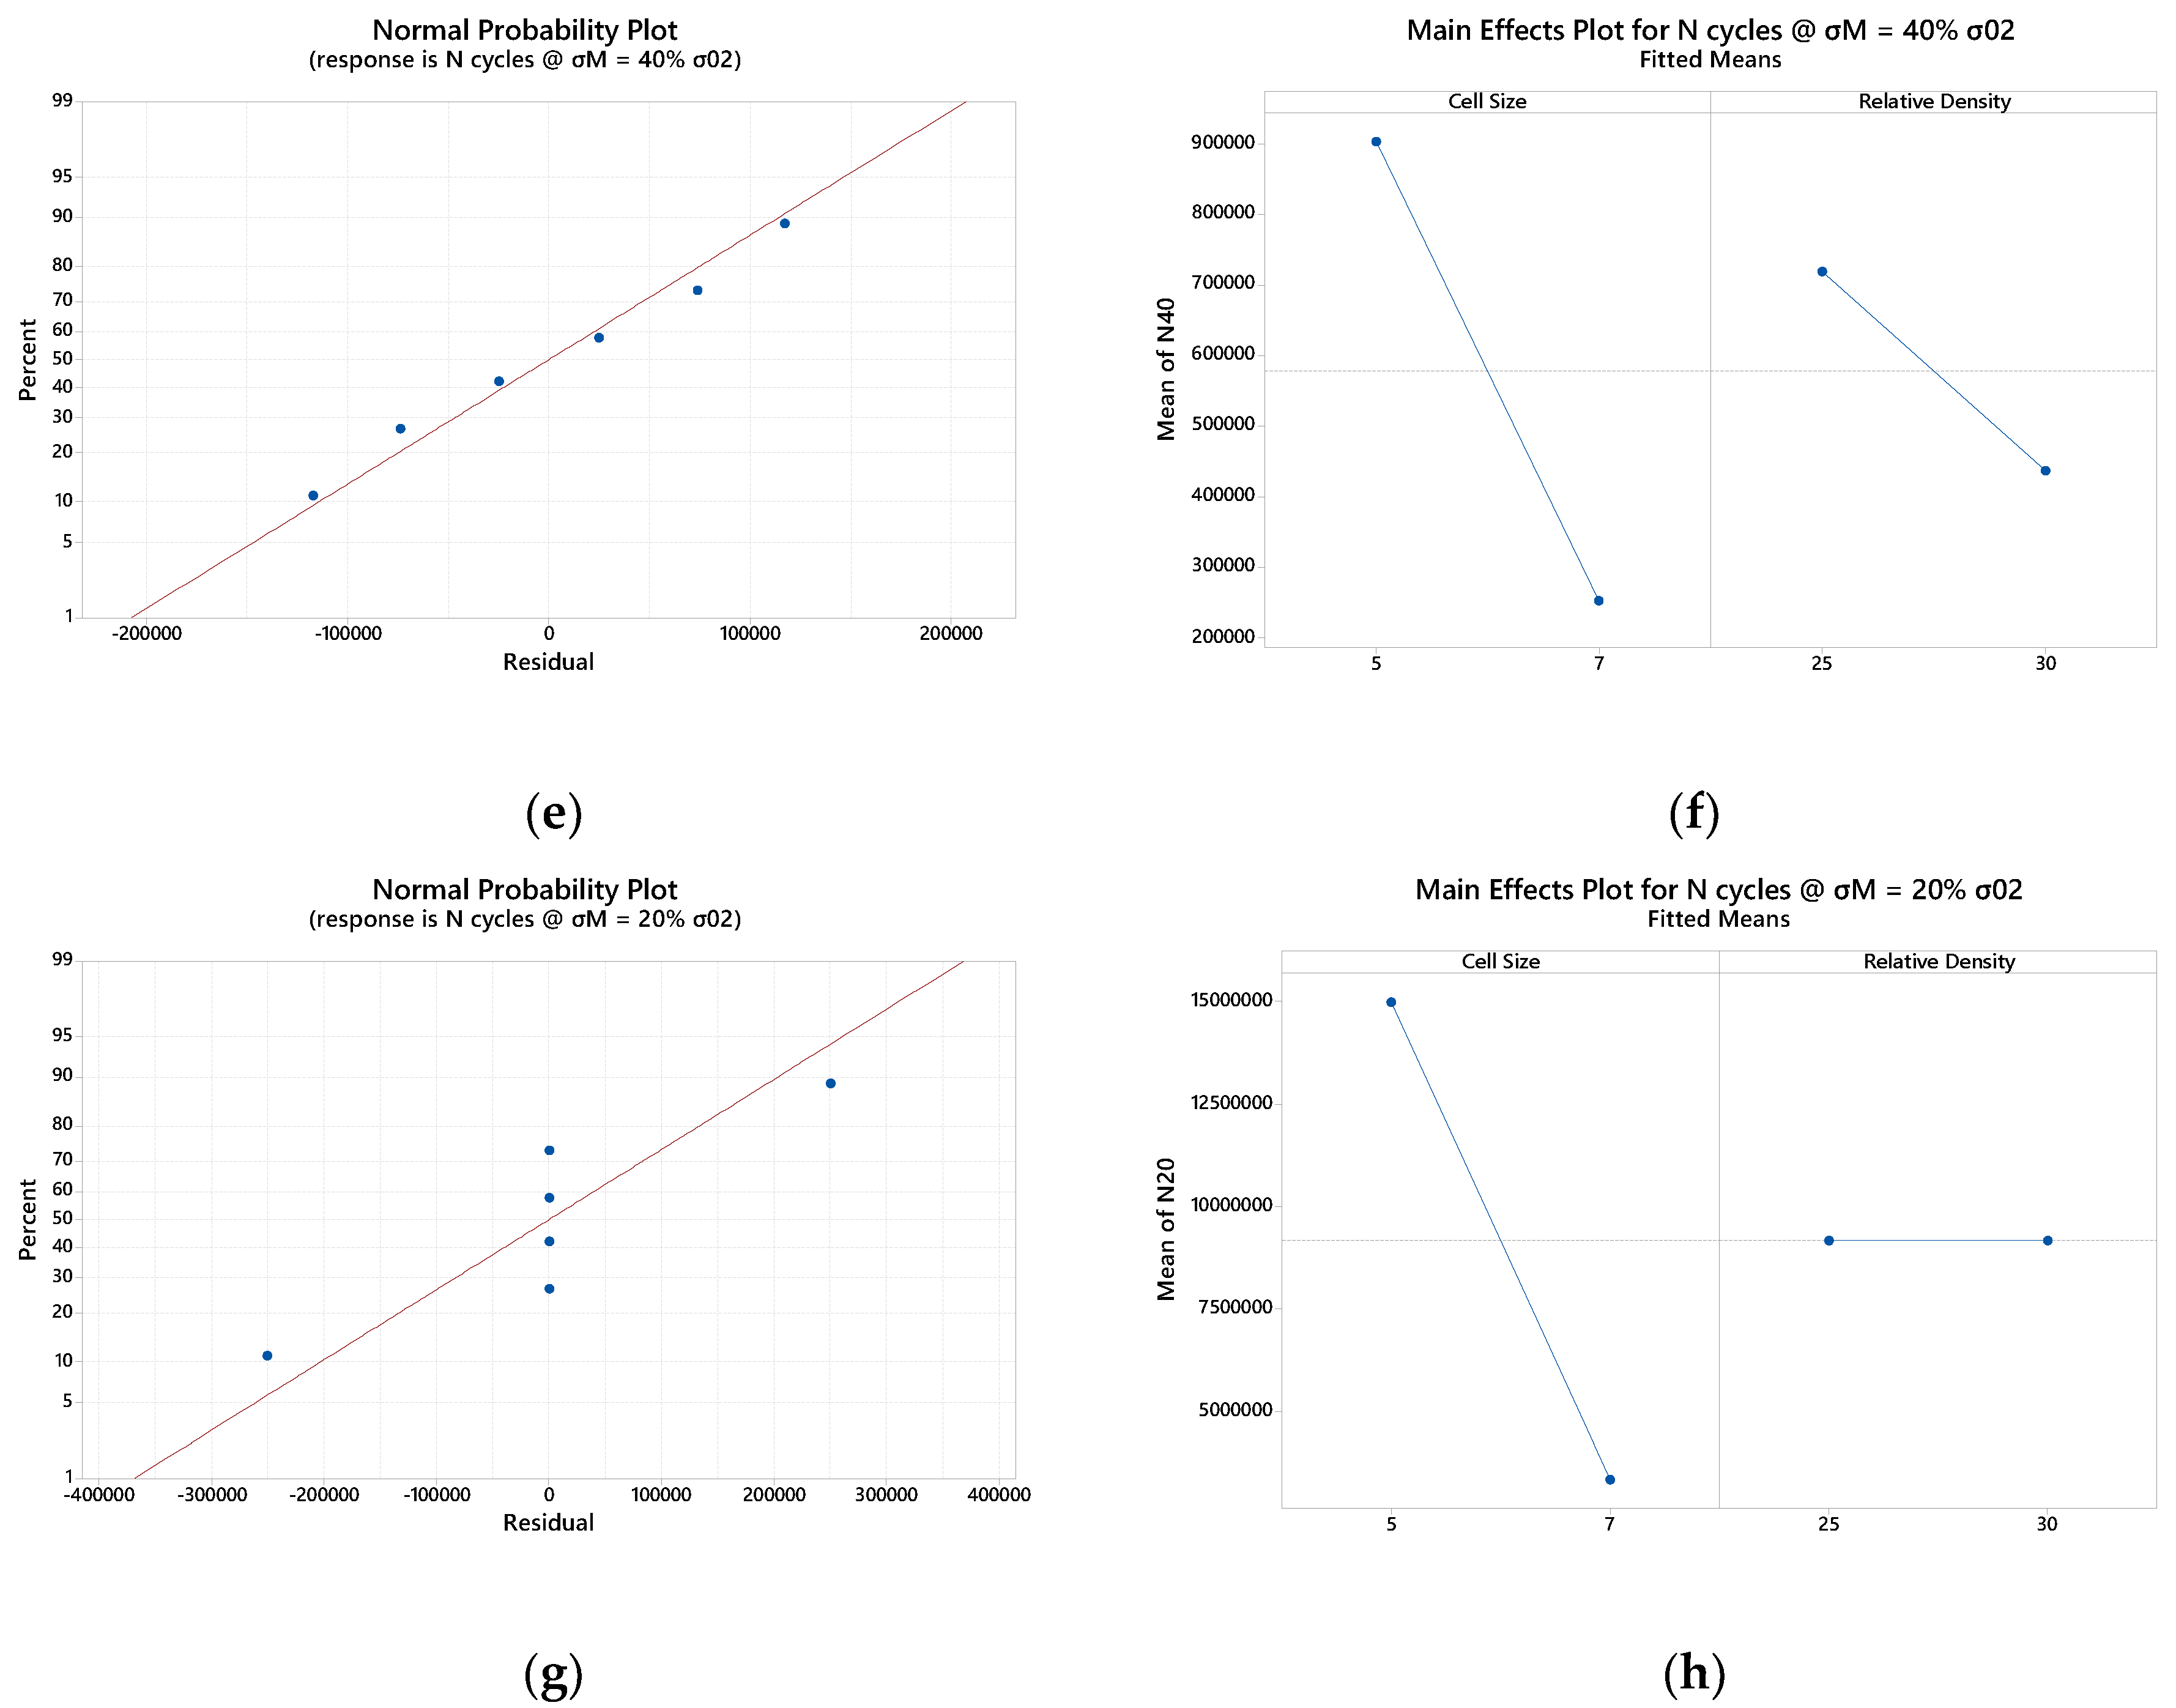
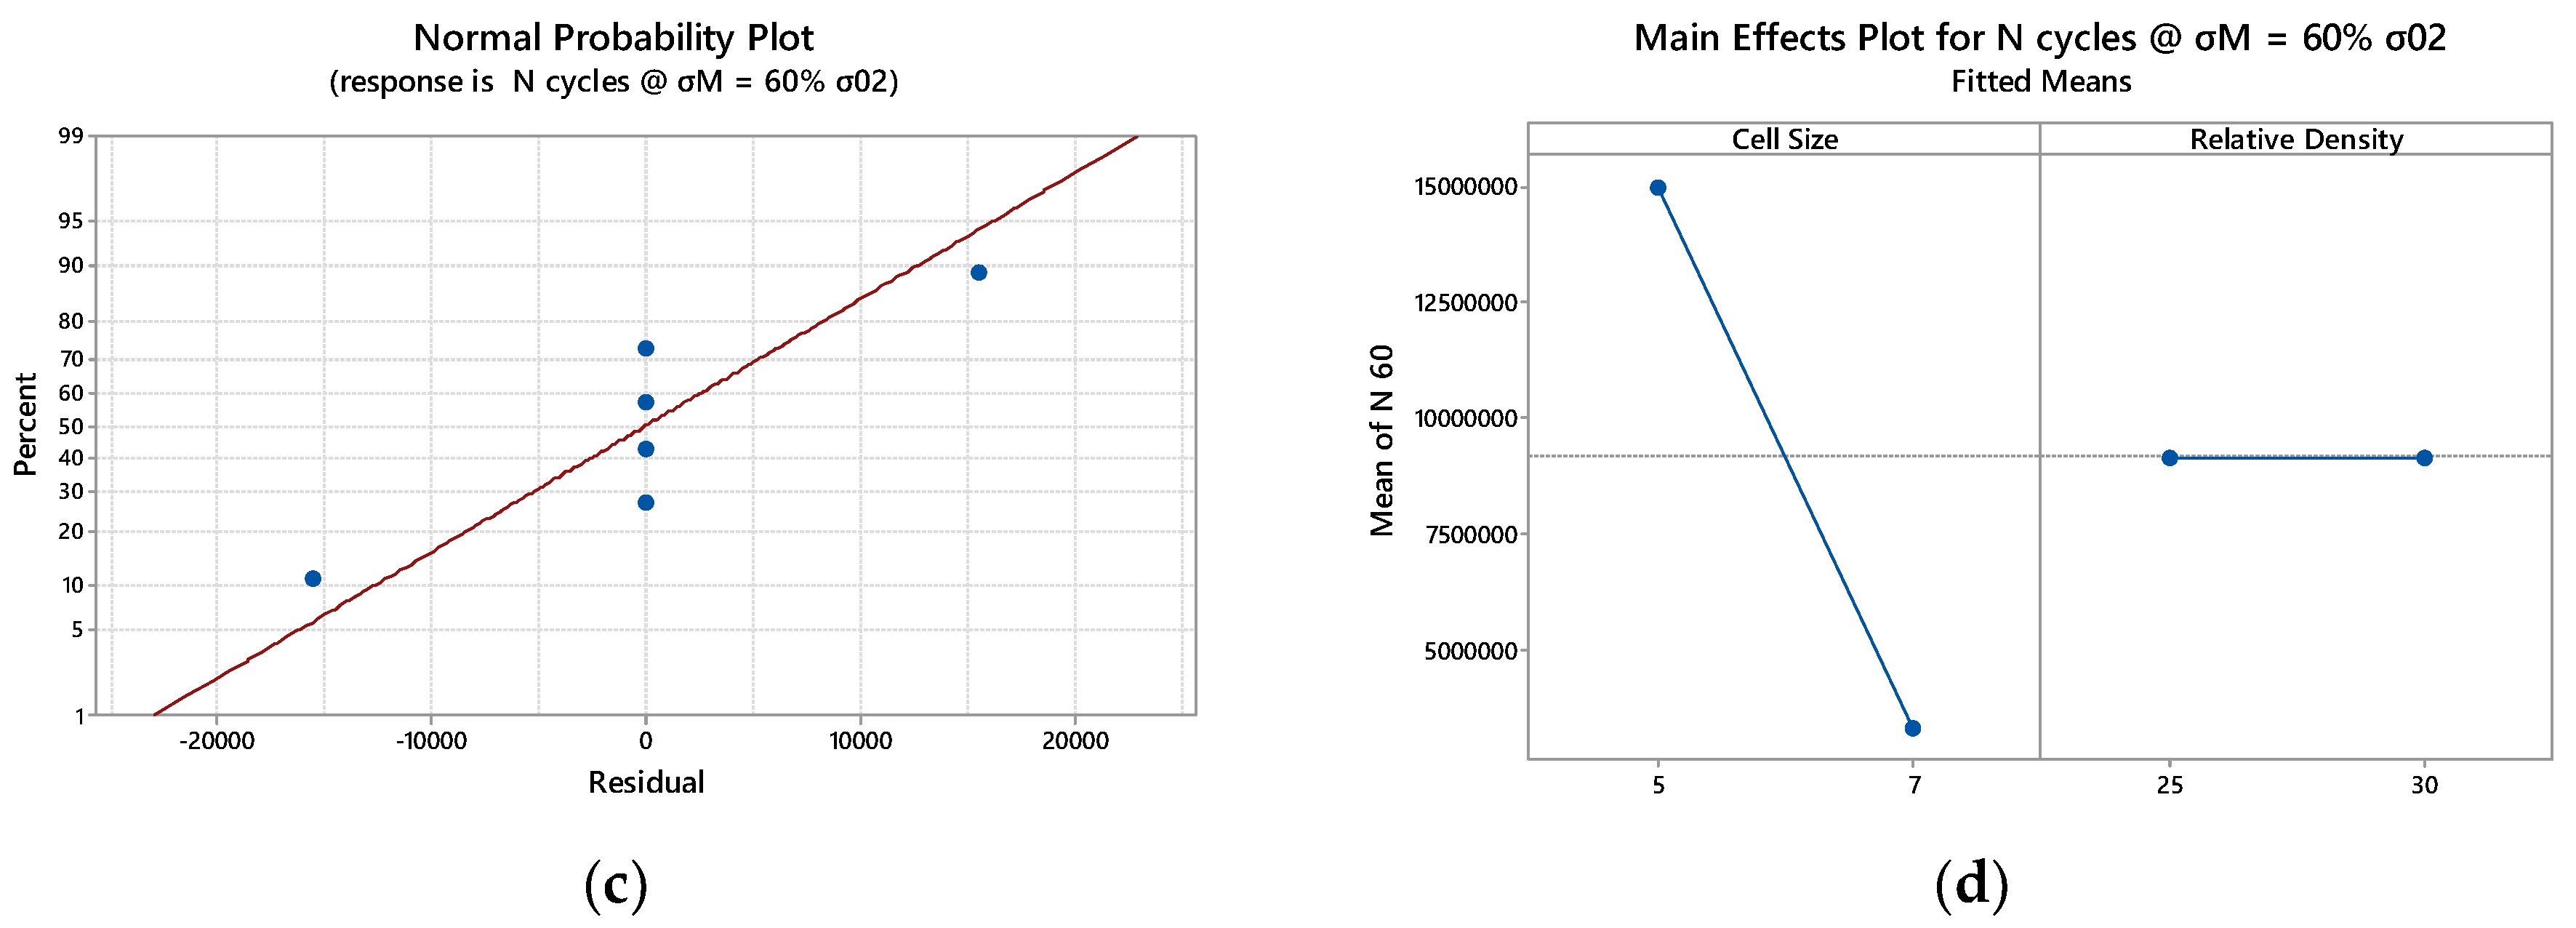
The effect of relative density is less stable in all the stress amplitude tested. As reported in
Appendix B by the Main Effect graph in Figure 11, the effect of the relative density is not monotonous. While at higher loads the increase of the relative density seems to provide a higher fatigue life this is not true for lower loads (60% and 20% of the Yield Stress). This aspect will require further dedicated analysis in the future.
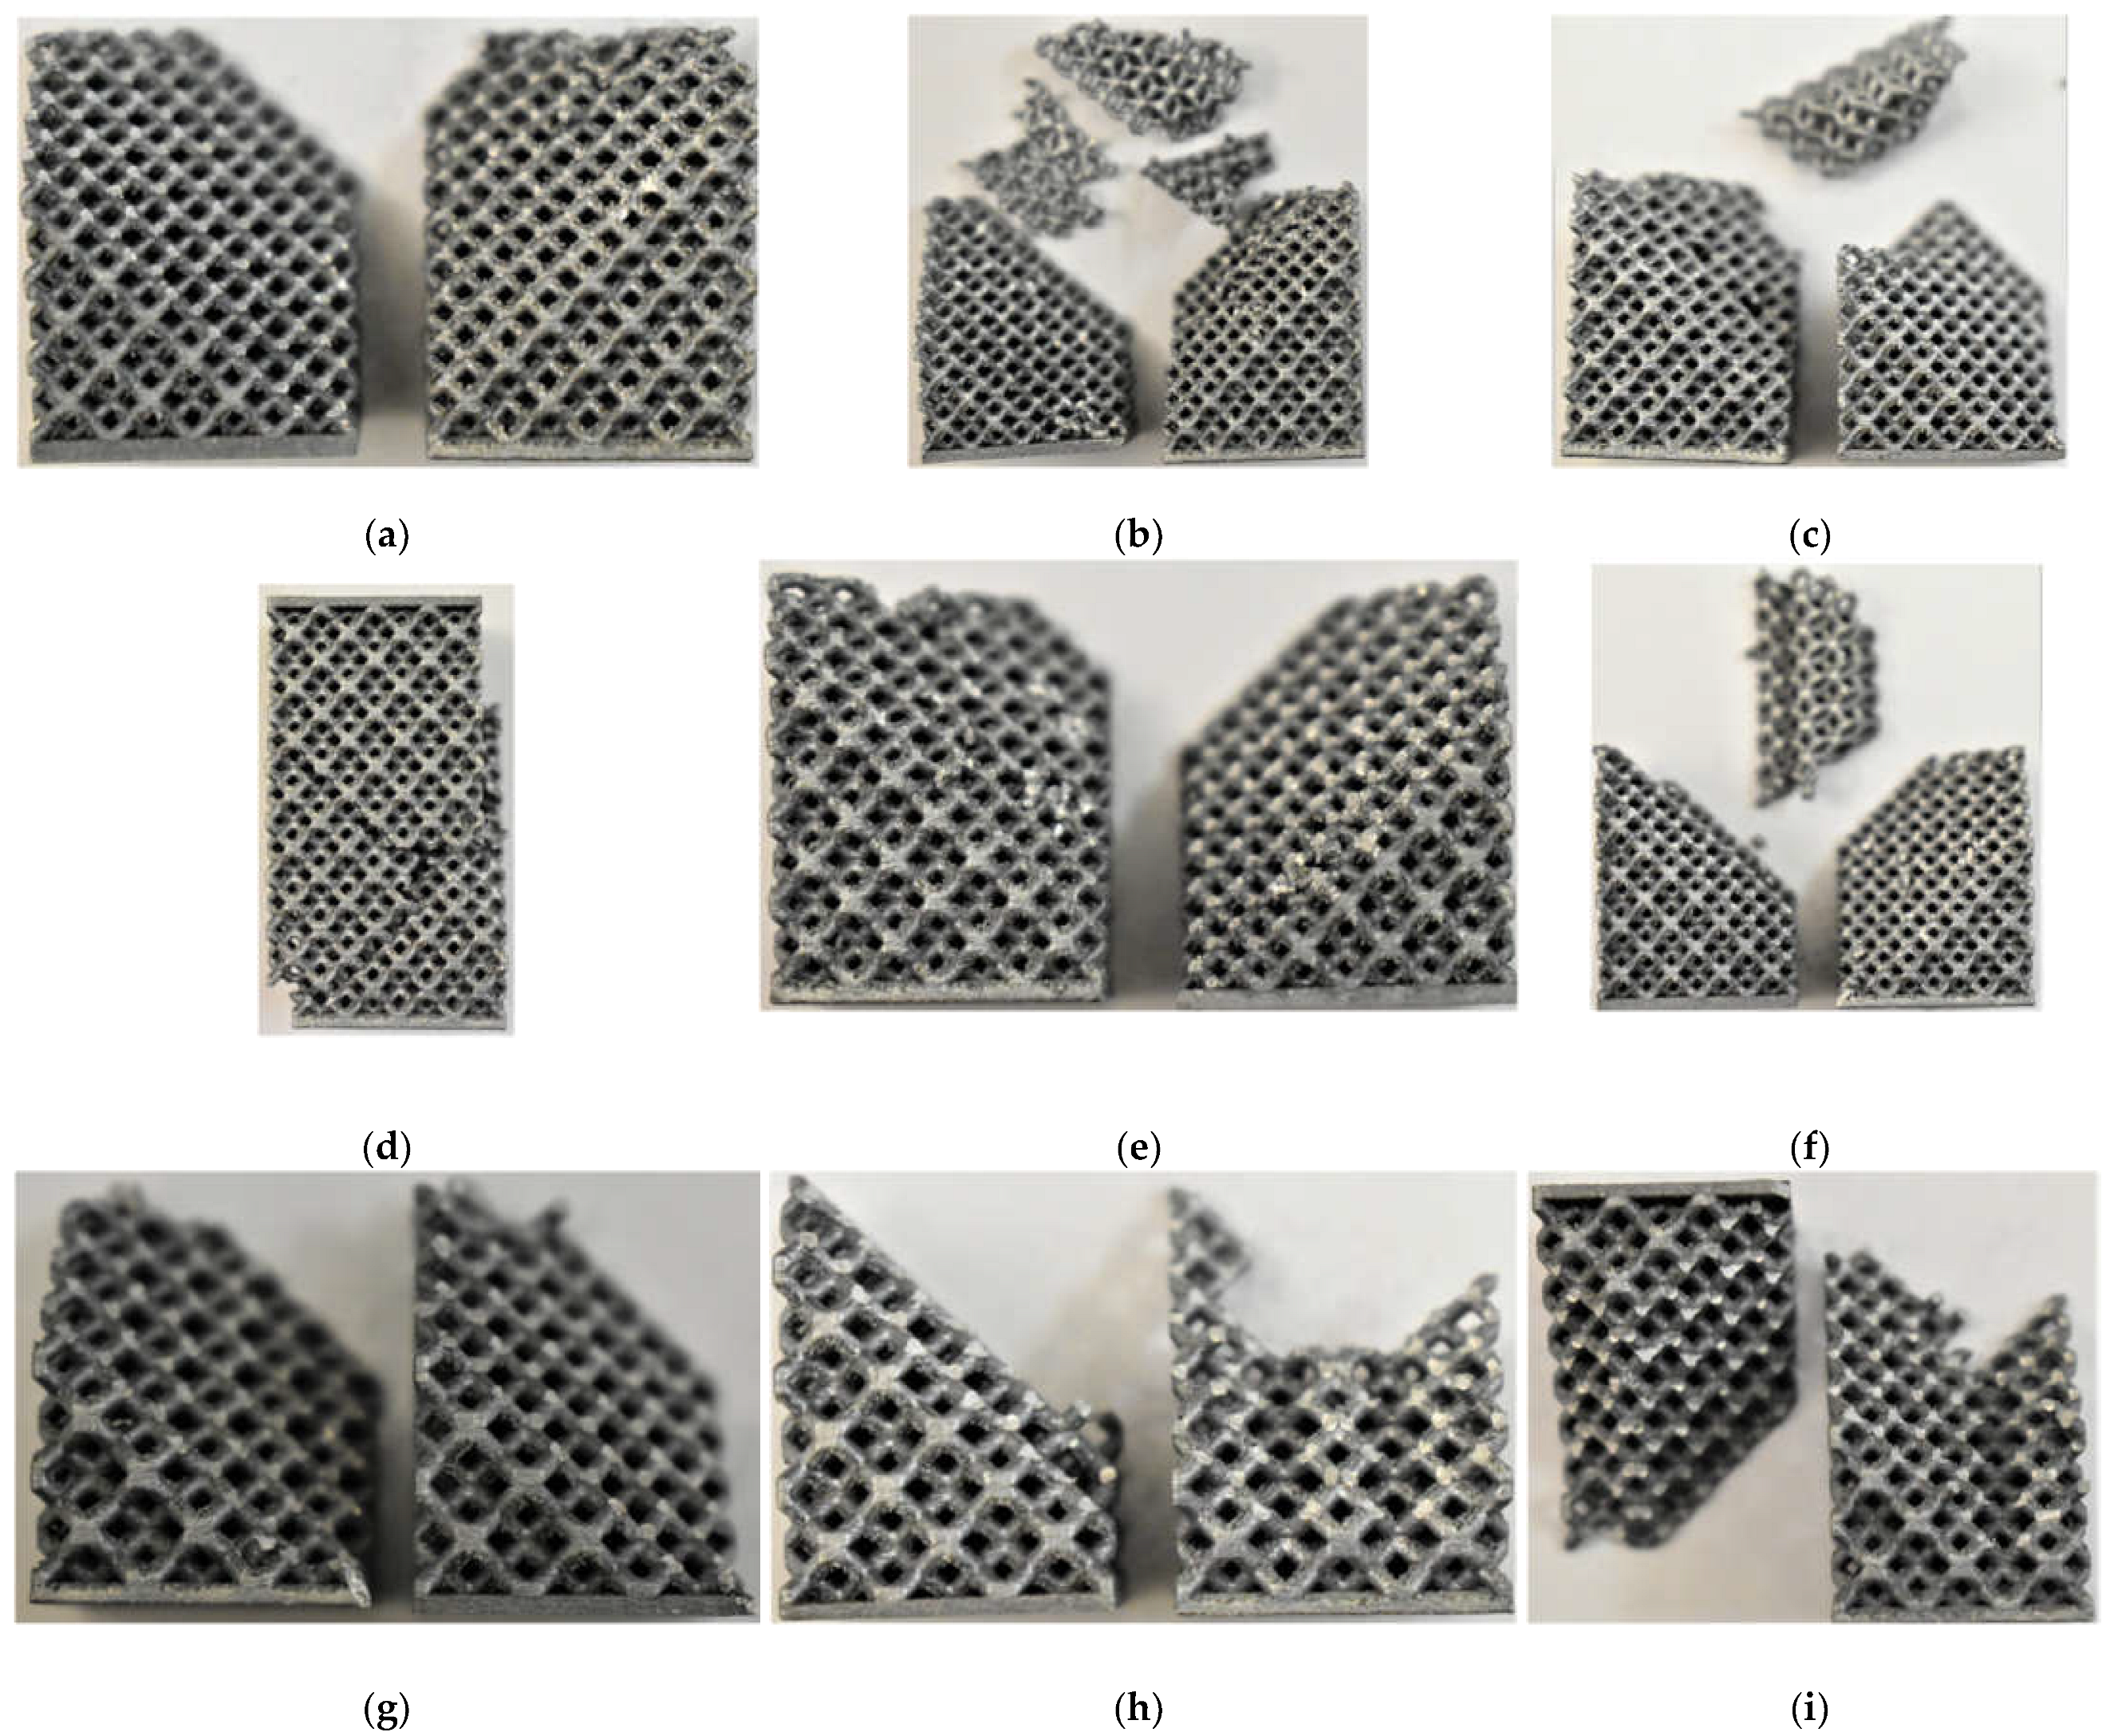
The photos of the rhombic specimens after the fatigue test at different loads are reported in
Figure 5. The failure occurs along a 45° plane in respect to Z axis and often it starts from a corner of the specimen. The deformation evidenced before the failure is almost absent; the connections break one by one along the plane until the resistant section becomes insufficient and causes the collapse of the specimen. From the images, it is possible to see that the breaking of the specimens subjected to higher loads (80% and 60% of σ
02) is clearer and more similar to the one evidenced in the static compression tests. On the other hand, the rupture of the specimens subjected to lower loads (40% and 20% of σ
02) is more irregular and acts on several levels causing the final separation of the specimen into more than two pieces. This difference is particularly marked for the 7mm cells, as visible in the
Figure 5. For cells with lower relative density, such as 5-25, irregular fracture are already present for higher loads, such as 60% of σ
02.
3.2. Octet Truss
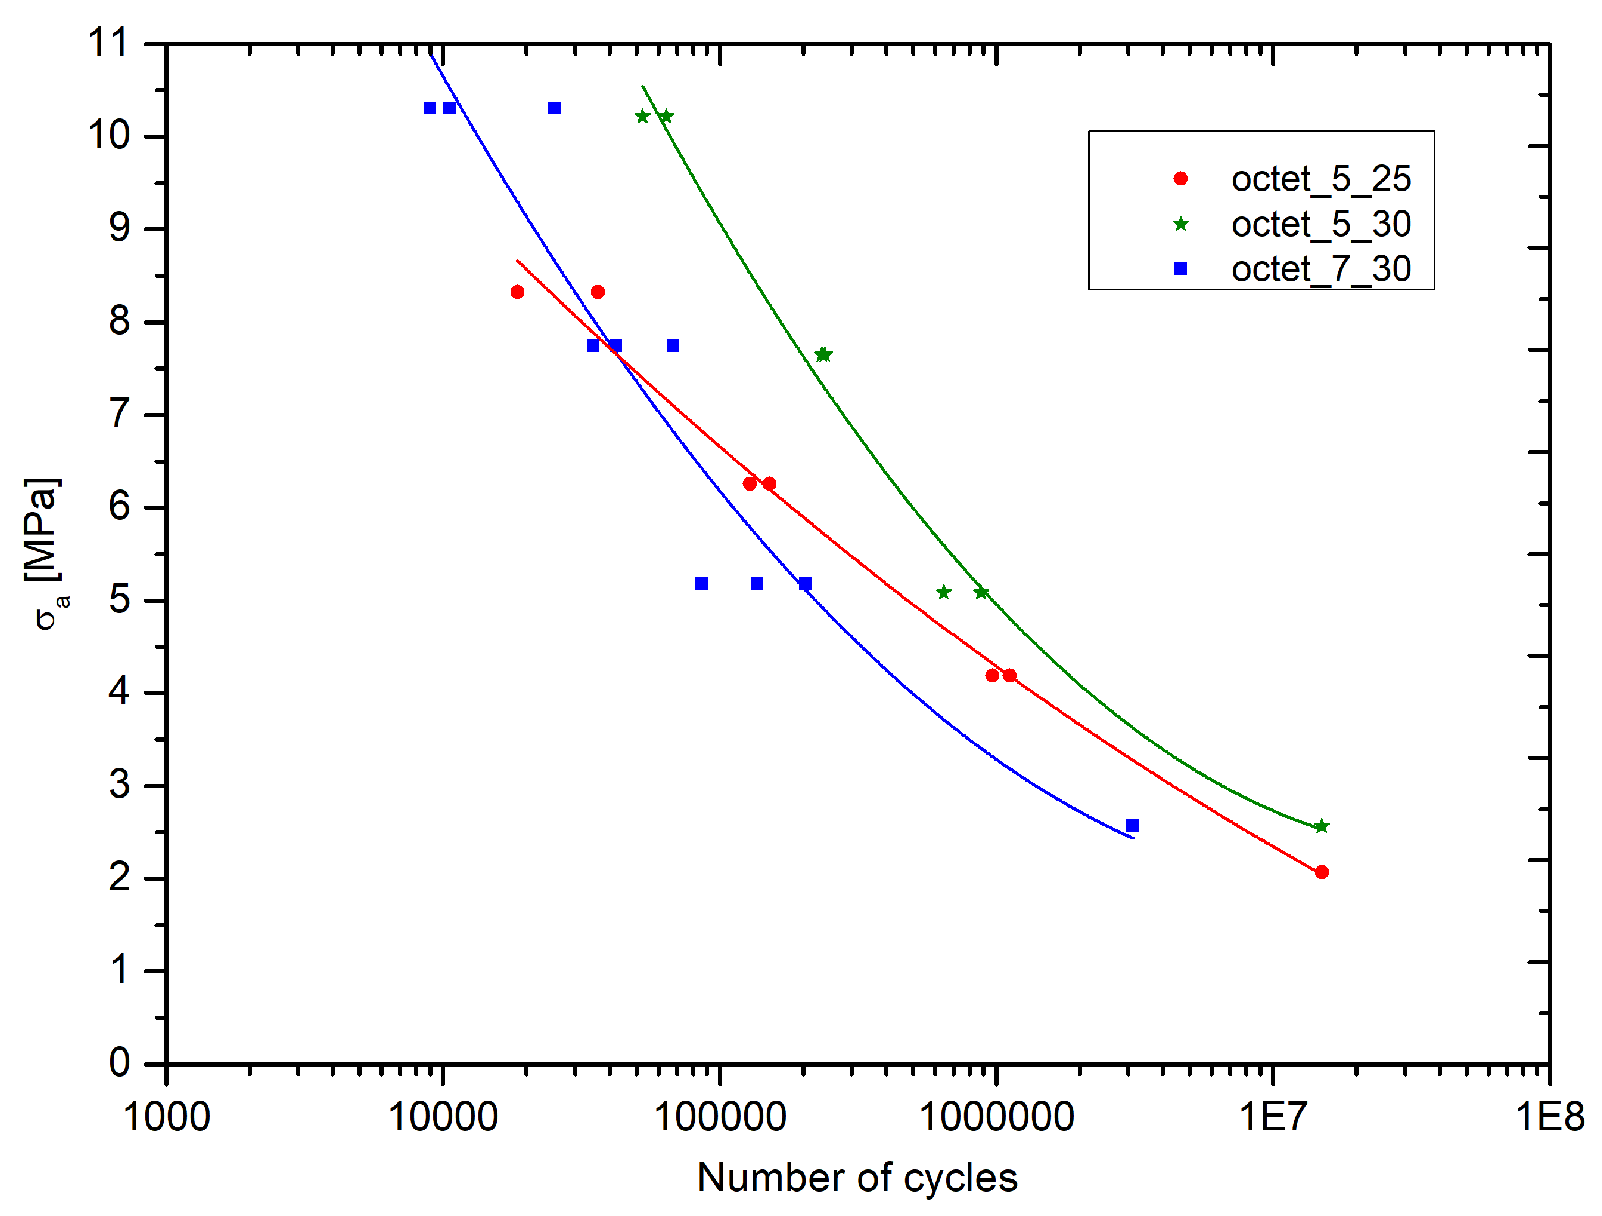
The graph in
Figure 6 reports the Wohler curves for all the Octet-truss specimens tested. In accordance with the present results, the longest fatigue life is that of the 5-30 specimens, followed by the specimens 7-30 and 5-25 with intersecting behavior.
Similarly, to the case of Rhombic also for Octet truss curves of 5-30 and 7-30 are almost parallel to each other, with the 7-30 case shifted to the left at lower cycles. This fact suggests a clear negative effect of the enhancing of the cell size at the same relative density.
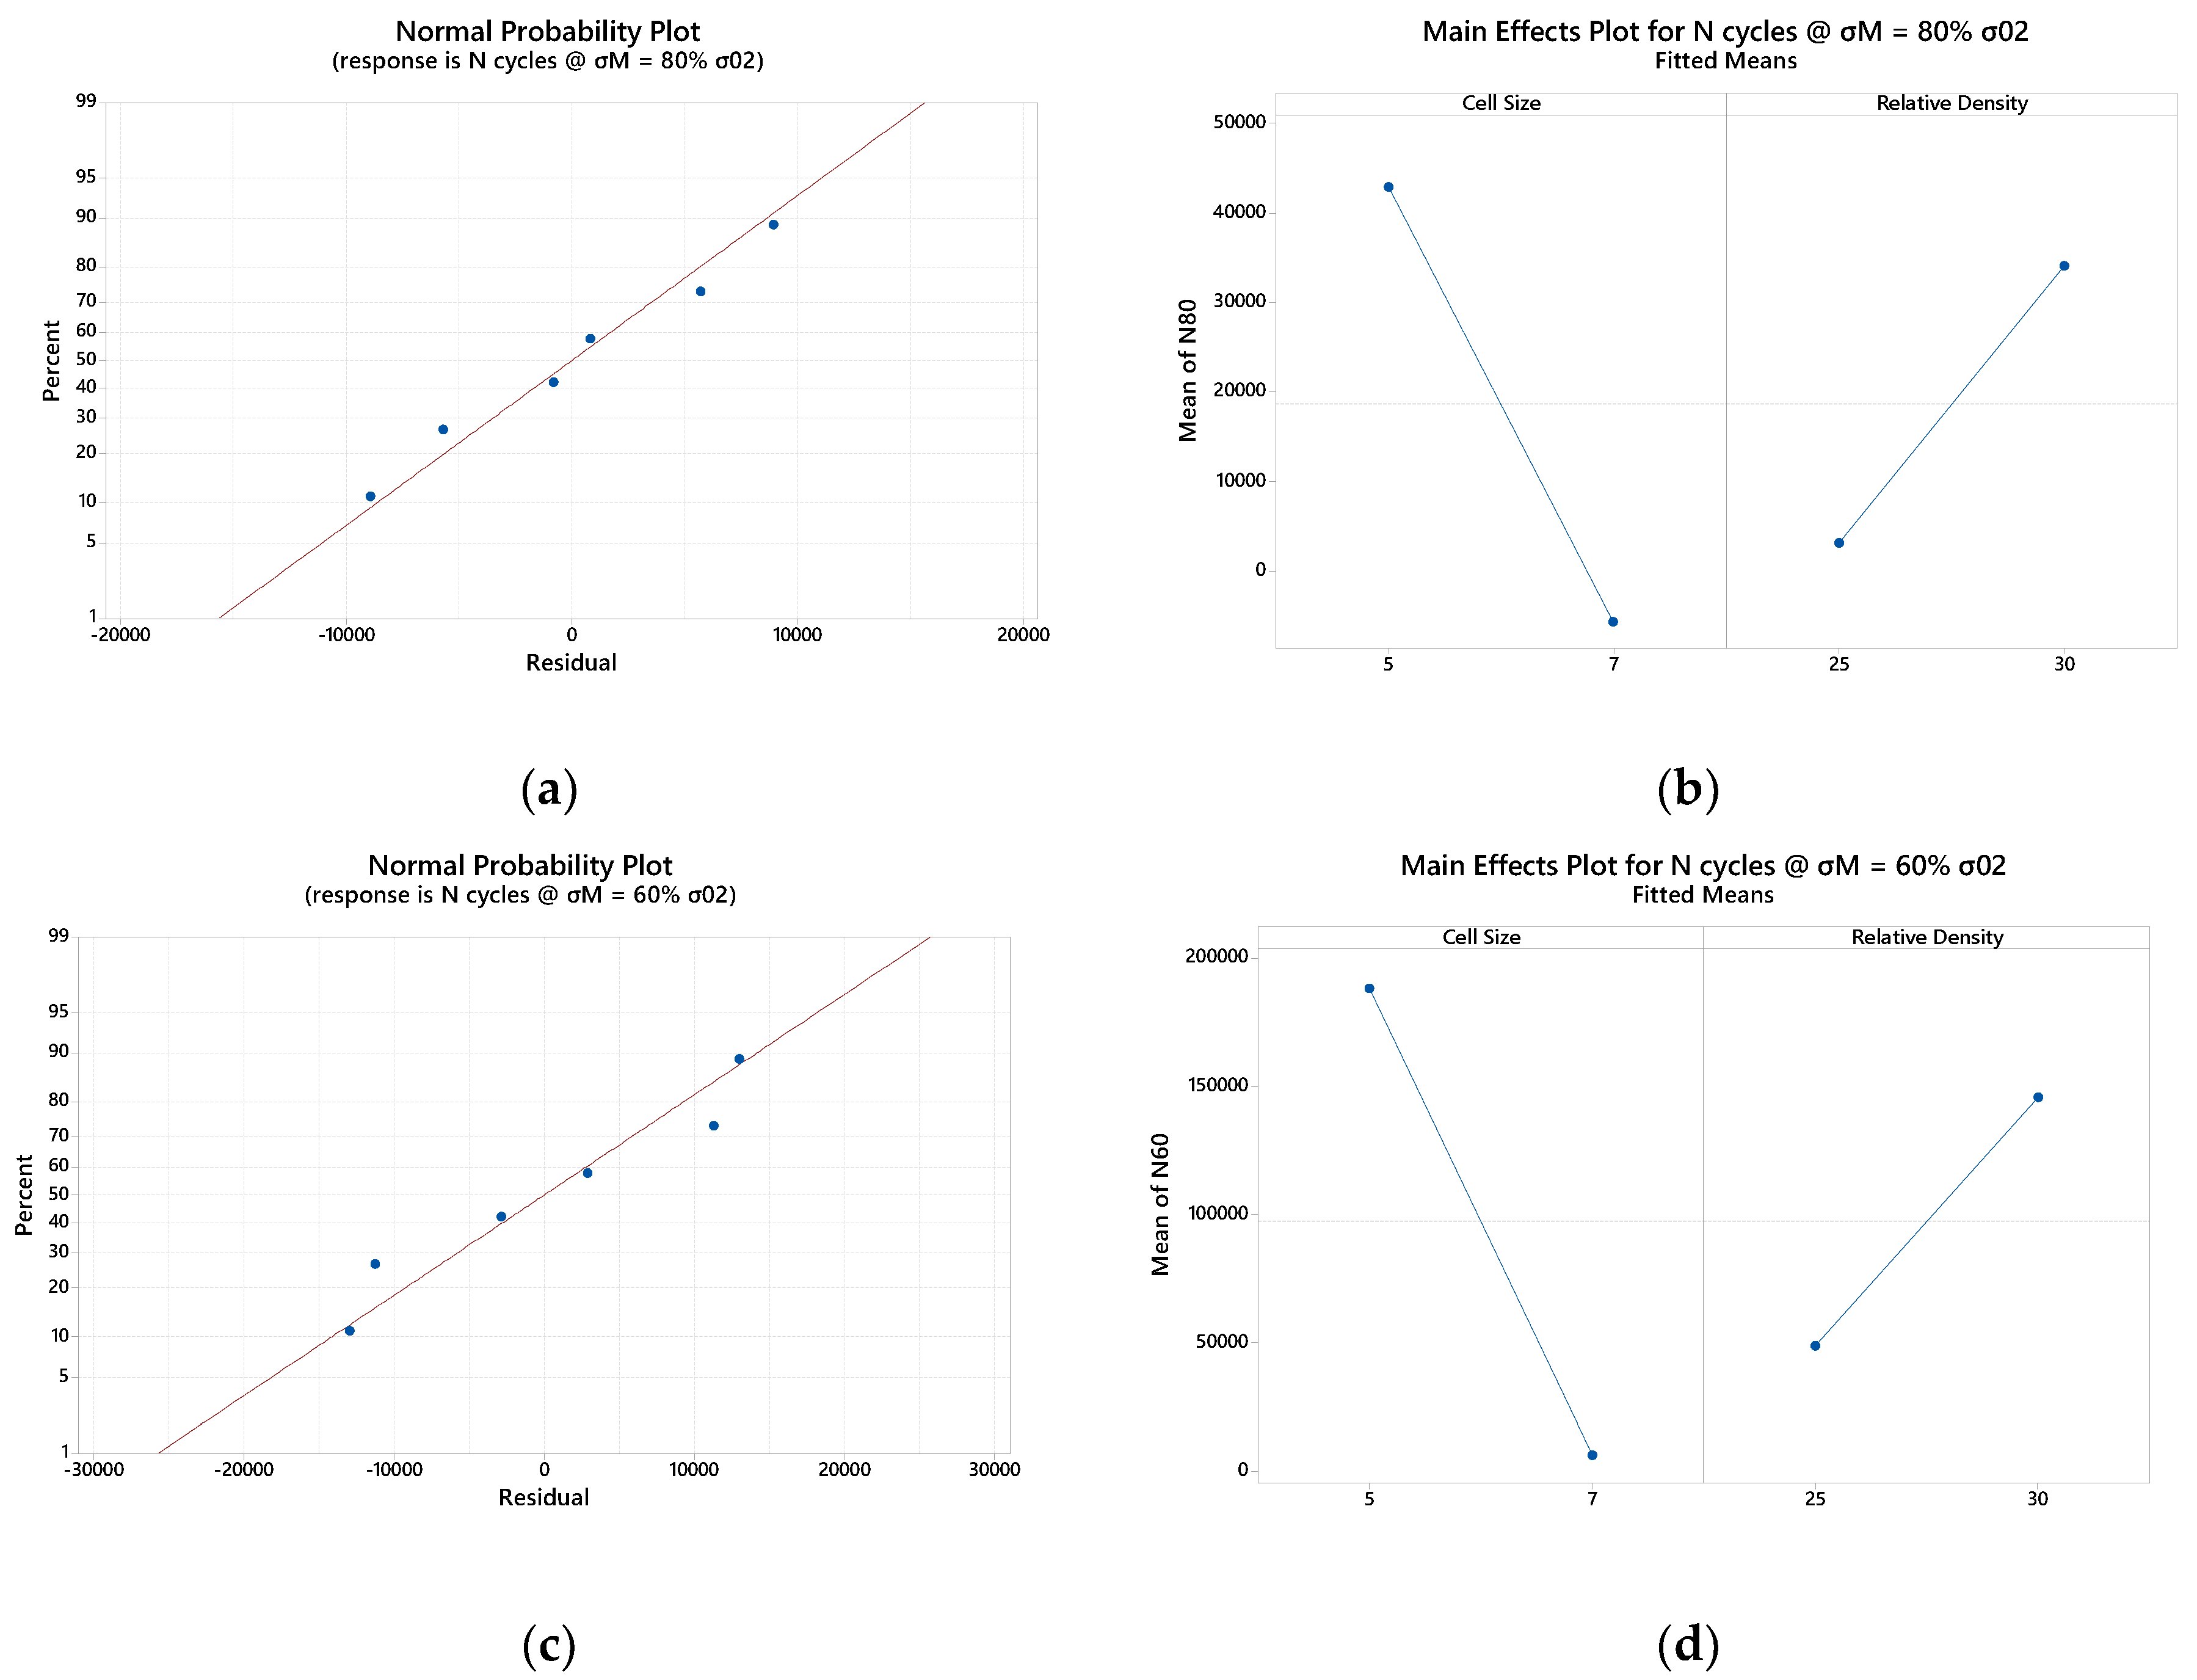
For what concerns the 7-30 vs 5-25 trend, despite the magnitude of the load (proportional to the yield stress) relative density plays a beneficial effect at higher load (80% and 60% of σ02) and report a dissimilar trend at lower load (40% and 20% of yield stress). Also in this scenario further analysis are required to investigate deeply the effect of relative density. The specimens 5-30 and 5-25 reach the imposed fatigue limit (1.5 107 cycles) without breaking with a maximum load equal to the 20 % of yield stress.
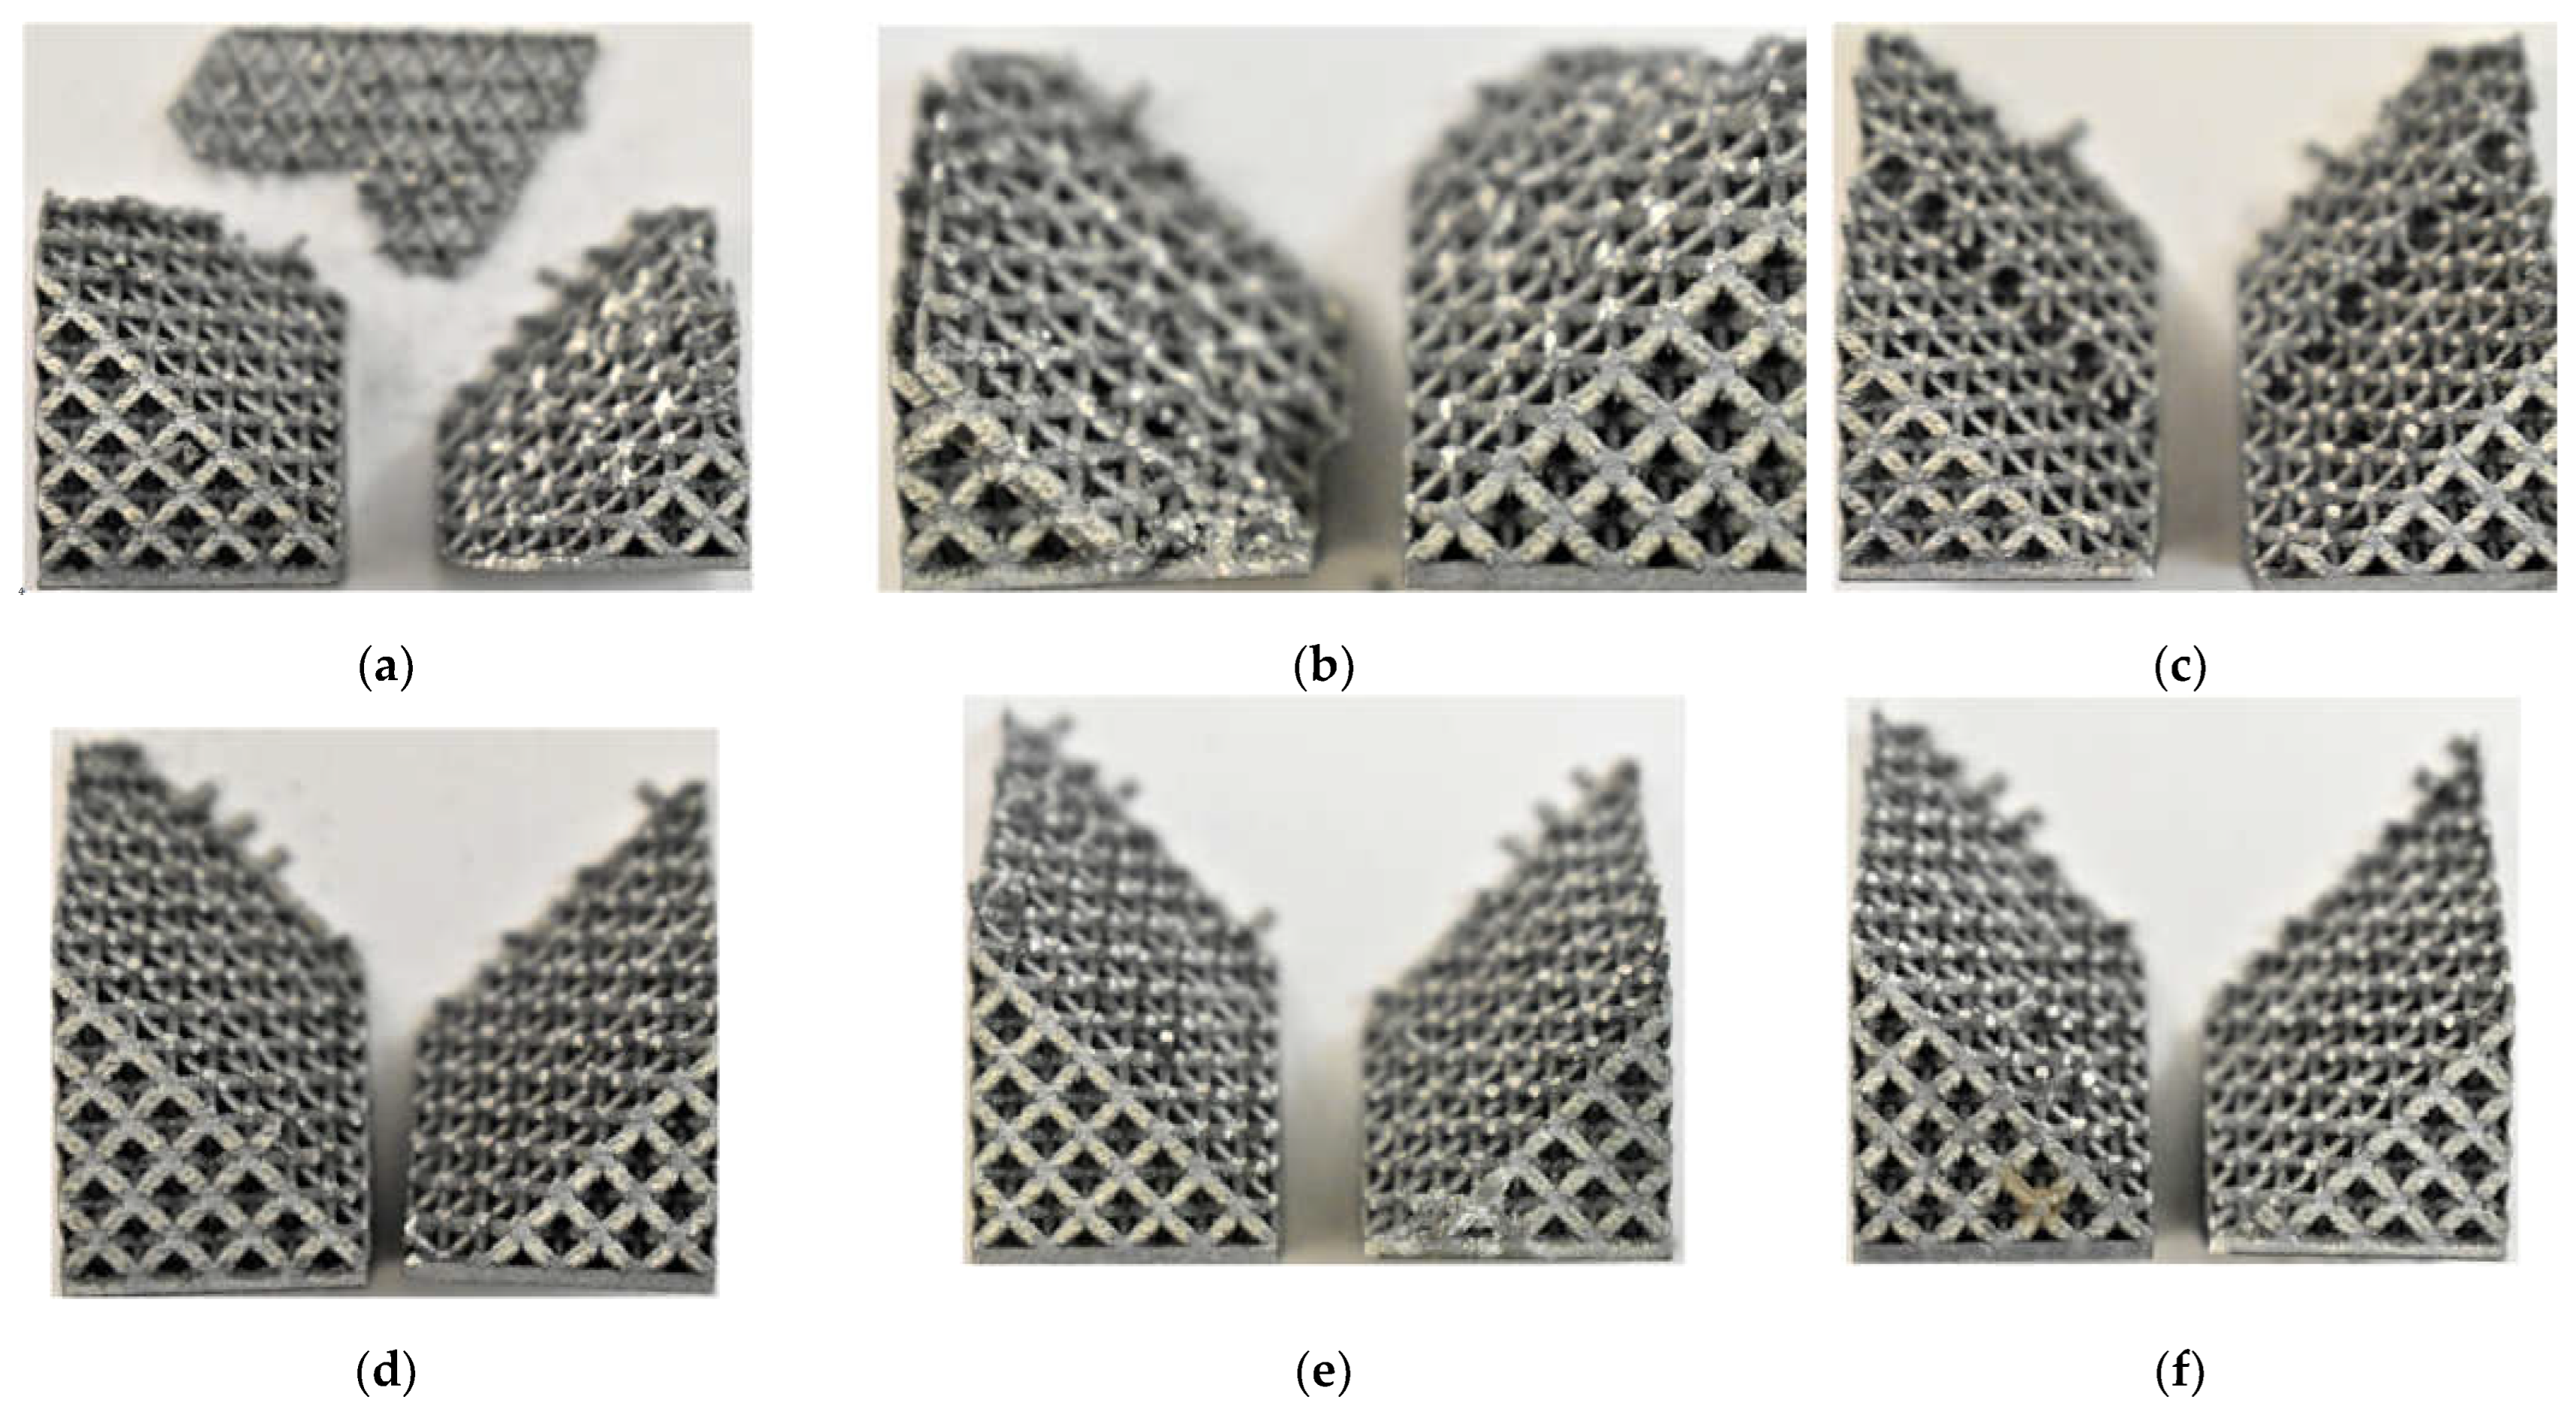
Figure 7 reports images of Octet specimens after the fatigue test at different loads. The fracture of the specimen is in part similar to that seen during compression tests. The failure occurs along a 45° plane in respect to Z axis and starts from a corner of the specimen. The deformation before the failure is almost absent; the connections break one by one along the plane until the resistant section becomes insufficient and causes the collapse of the specimen. Failure mode of 5-25 specimens subjected to all loads is more irregular compared to others and acts simultaneously on several planes causing the final separation of the specimen into more than two pieces. Similarly, to what witnessed also 7-30 specimens subjected to higher loads (80% and 60% of σ
02) fail in similar to that seen for the compression tests; on the other hand, the same cells when subjected to lower loads (40% and 20% of σ
02) is more irregular and acts on several planes at the same time causing final separation of the specimen into more than two pieces.
3.3. Bccz
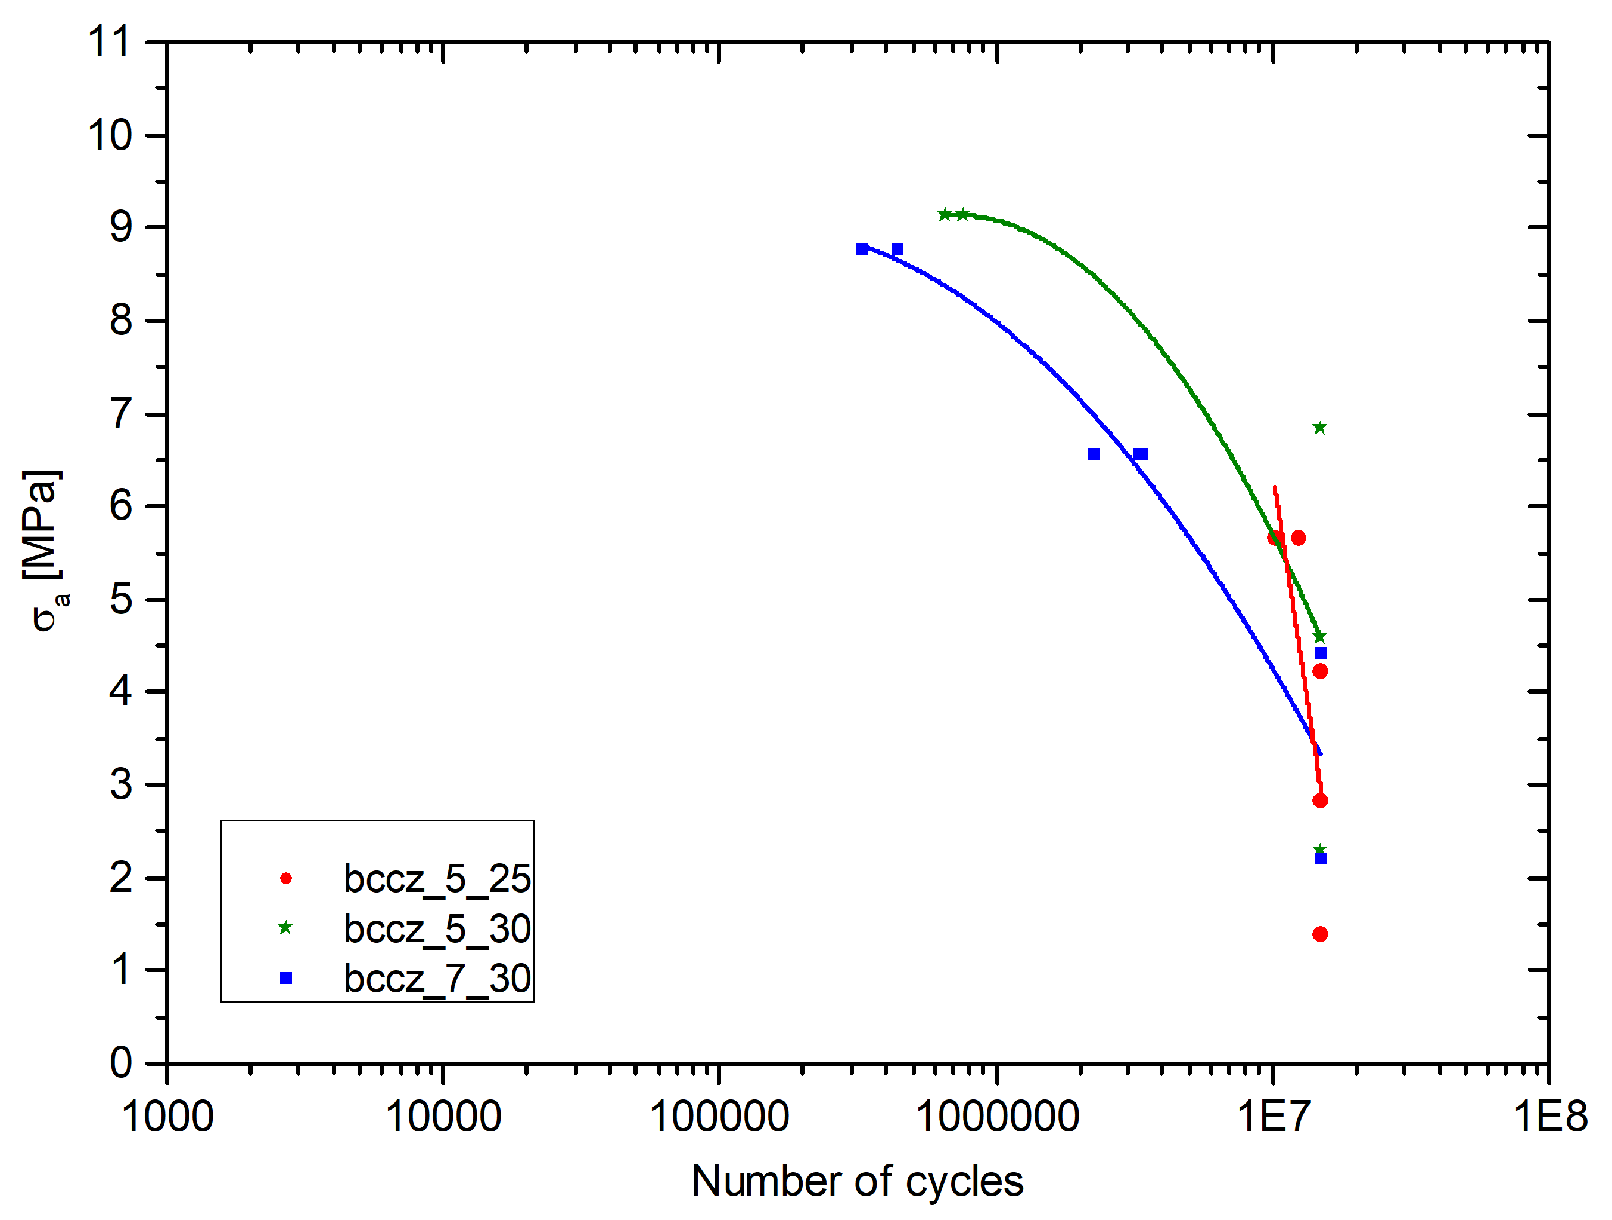
Fatigue Wohler curves on Bccz specimens, presented in
Figure 8, remained partially completed due to the different behavior found. The specimens reach the preset limit of 1.5 10
7 cycles already at 60% of the load for the 5mm cells and 40% for the 7mm cells; for this reason, it was impossible to obtain complete Wohler curves. Further improvements will be the evaluation of the performance between 80% and 100% of the Yield load. The greatest fatigue resistance of Bccz specimens is given by the vertical struts. During the static compression tests the vertical struts deformed and then broke for buckling.
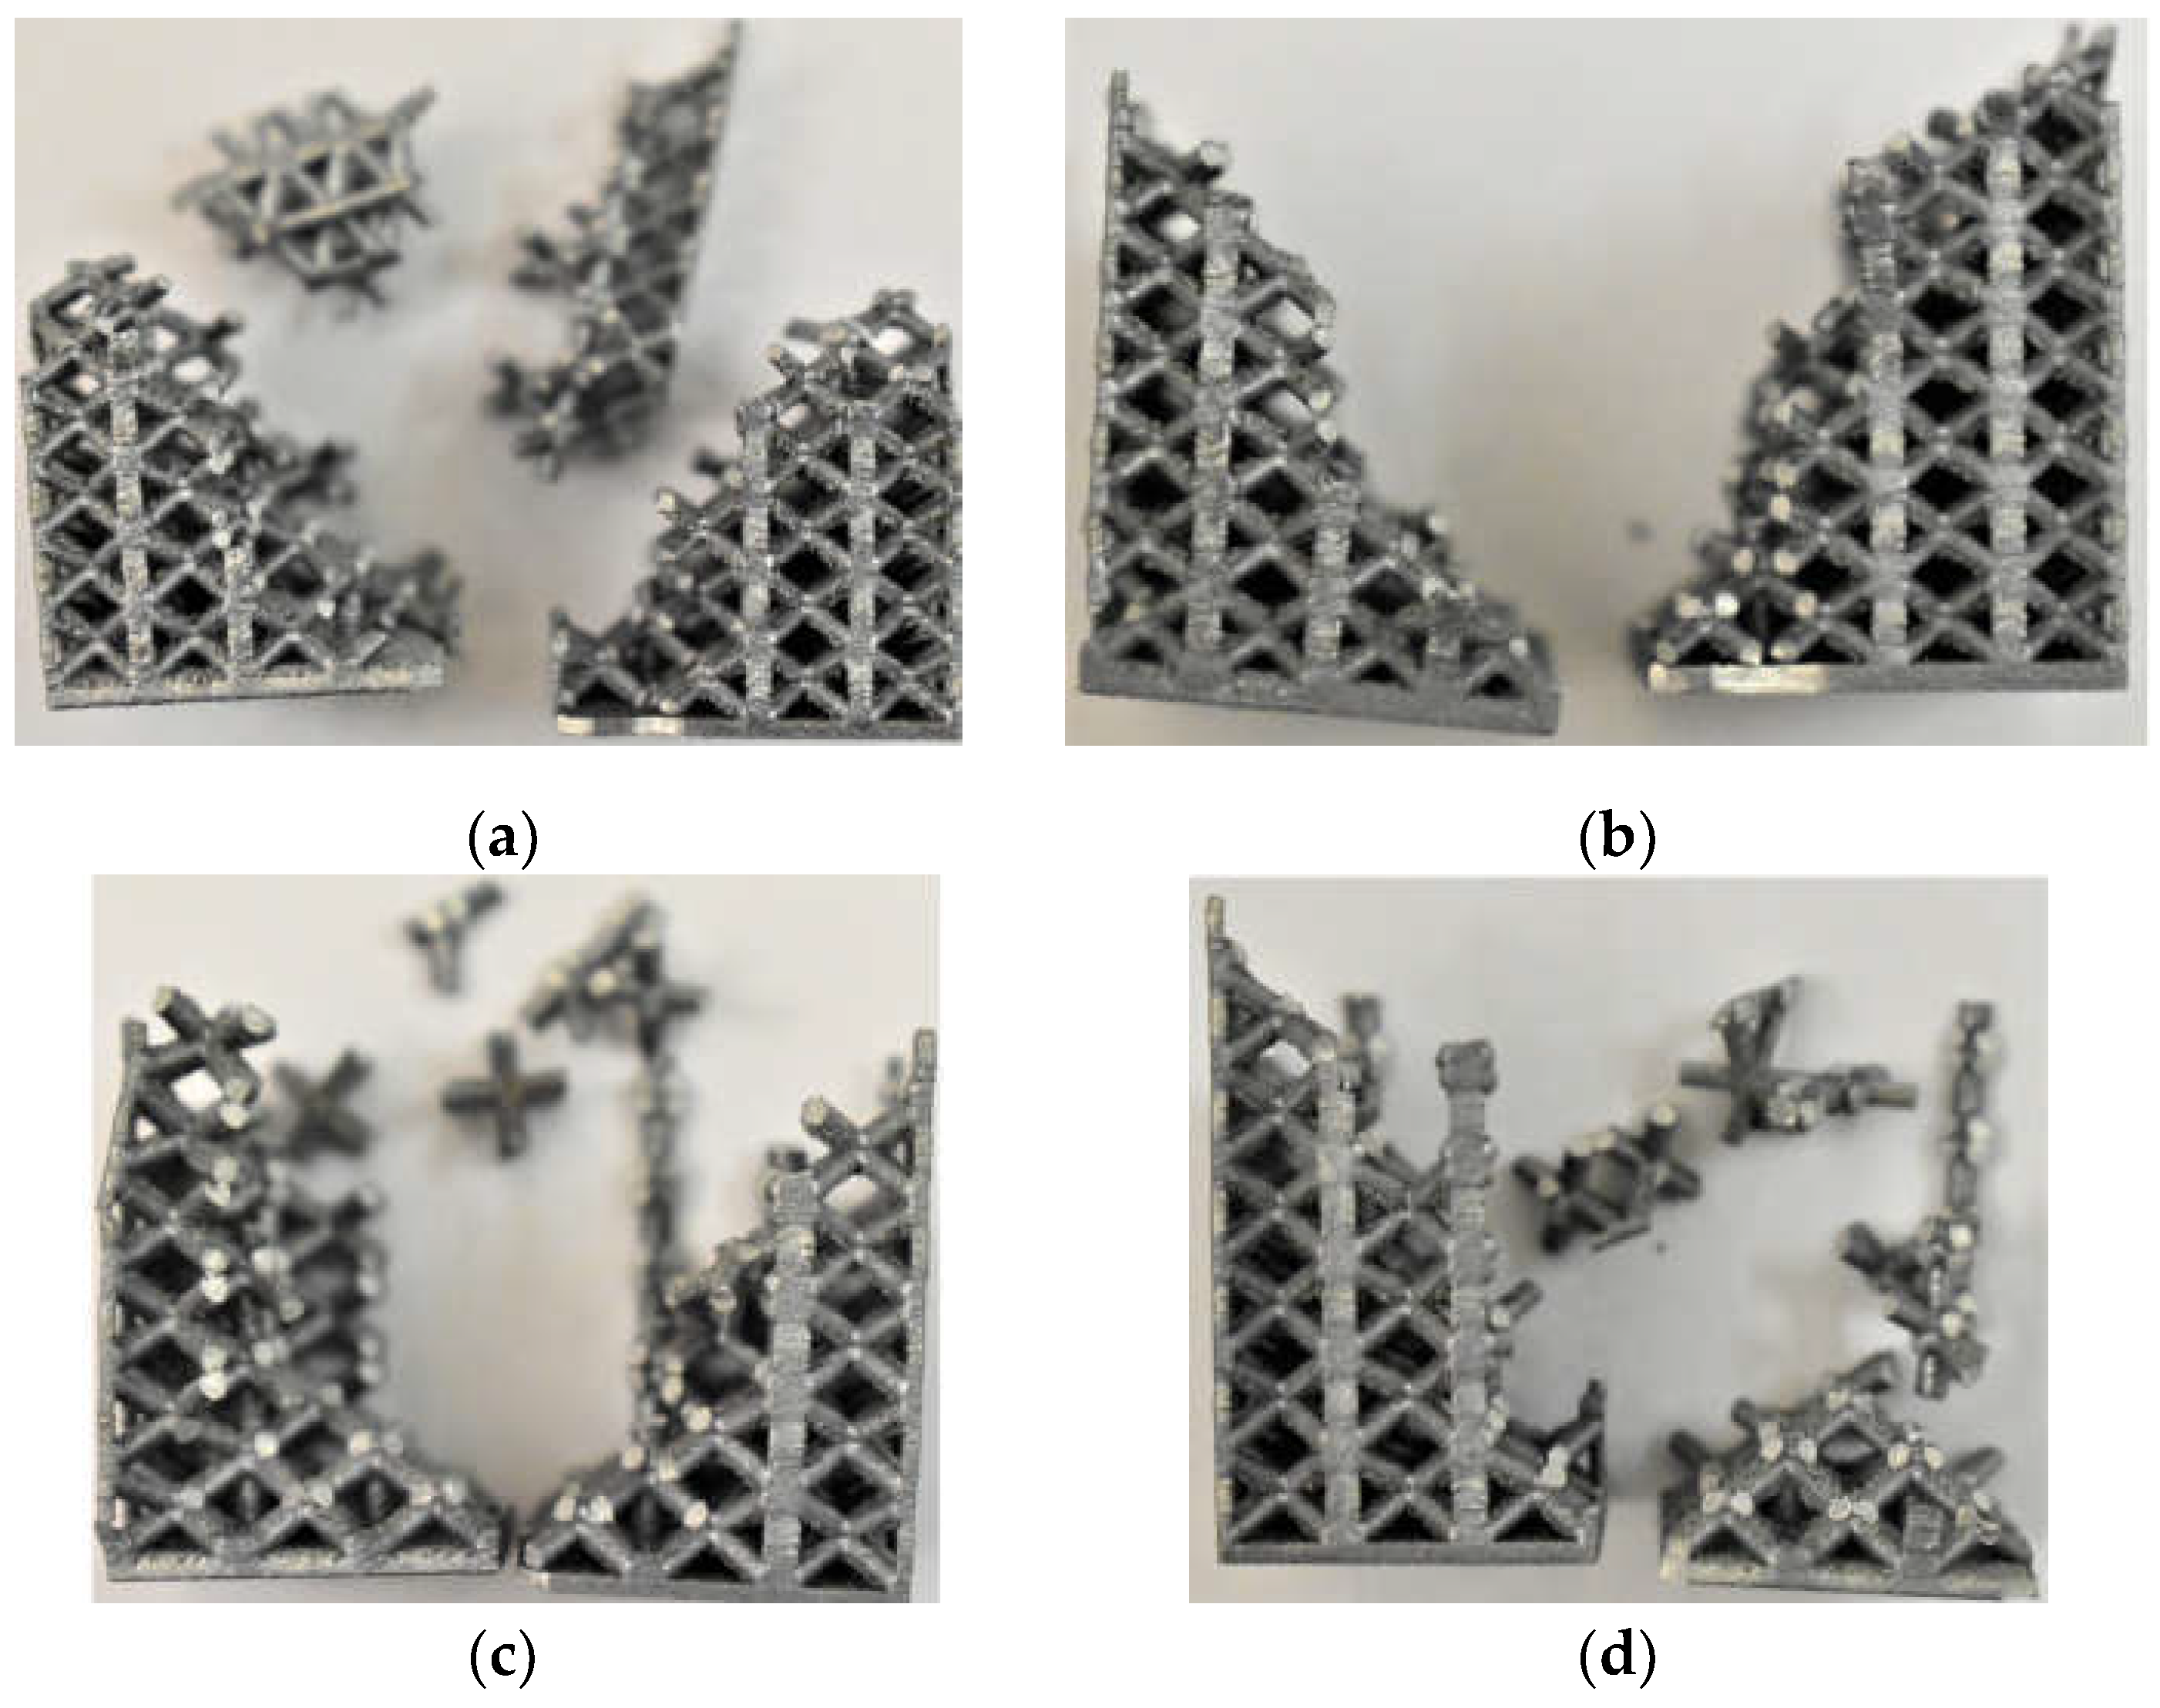
In fatigue tests, the imposed load is not sufficient for the buckling of the vertical struts. In fact, as visible from the
Figure 9, the failure of the specimen, when it occurs, is due to the breaking of the struts at the nodes, as seen for Rhombic and Octet. The fracture follows the angle of 45° only in some points, but in most cases there is a sparse and irregular separation of the cells for all cell sizes and for all solid volume fraction values. Further analysis will be dedicated to higher amplitude load and higher σ
M.
4. Discussion
Several reports [
29,
30] have shown that different cell topology provide different fatigue live behaviour. This section will provide a comparison of the three-architected cells subjected to the same load path (proportional to each Yield strength, as reported in
Section 2.3).
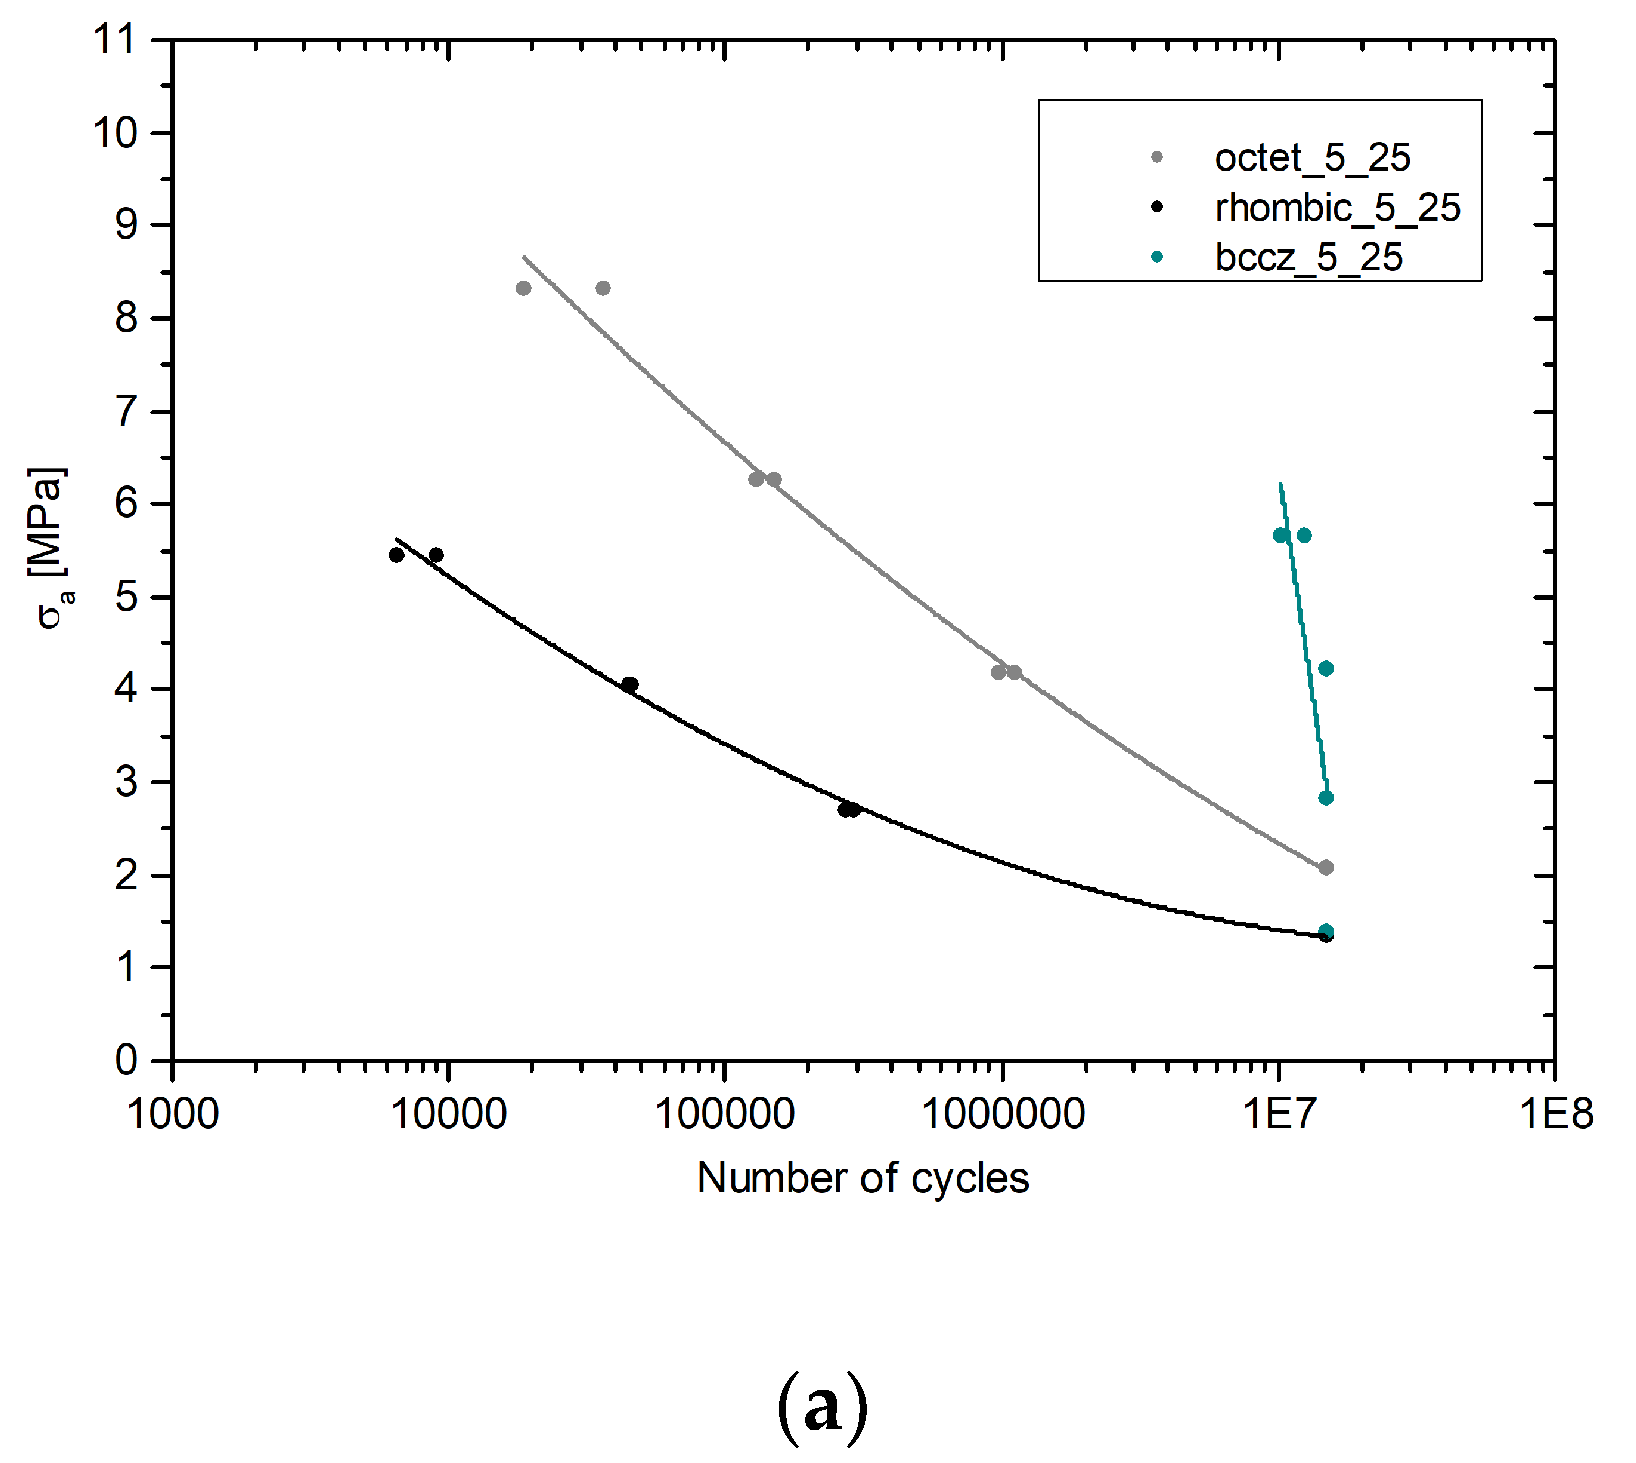
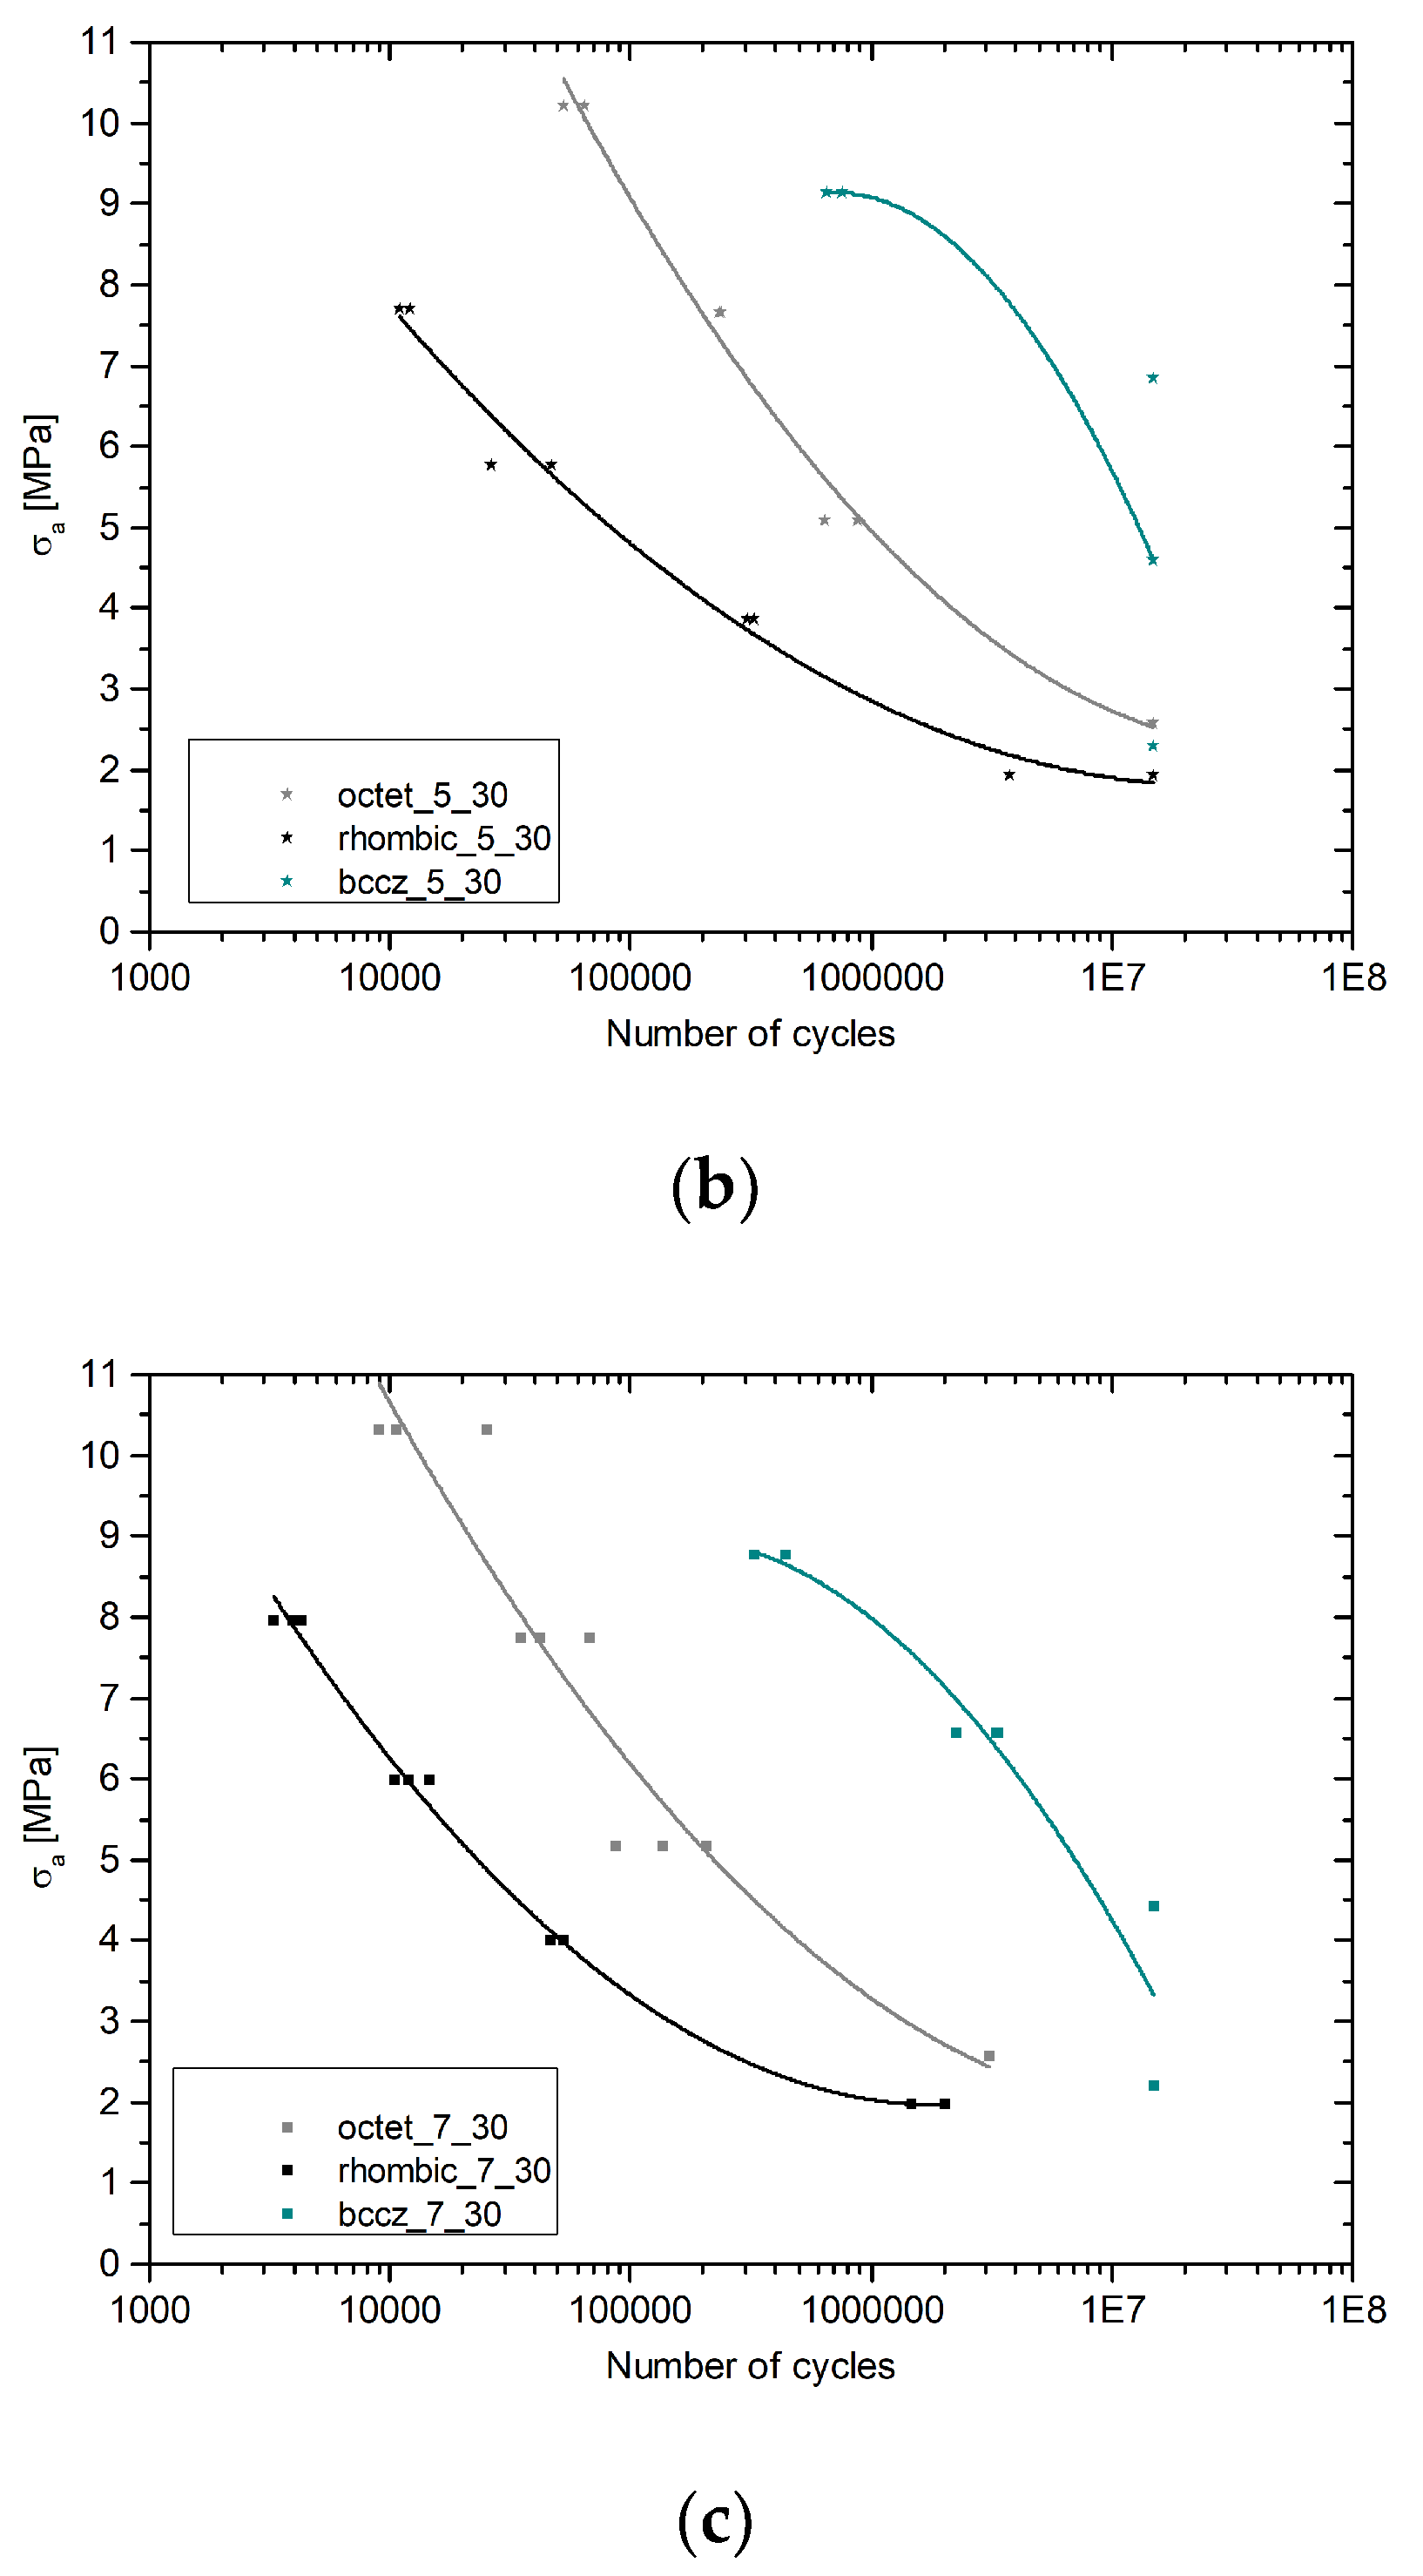
What is striking about the graphs reported in
Figure 10 is the homogeneous trend between all the specimens type. Bccz, as commented above, is always the cells performing better followed by octet cells and lastly rhombic cells. The last two cell’s topology presents similar trend dissimilarly from the trend provided by Bccz cells. A possible explanation for this might be that Rhombic and Octet are bending dominated cells [
31] while Bccz is a stretch dominated cells that provide enormous benefit when the compression load on the vertical cells does not reach the buckling limit.
The results provided are significant in at least two major respects. They provide reliable encouraging data on fatigue life of different cells with various cell size and different relative density. In addition, they establish some useful correlation between design parameters and fatigue life.
Despite these promising results, further work is required to establish the real fatigue limit of Bccz cells and deeply evaluate the effect of relative density on the fatigue performance for bending dominated cells type.
5. Conclusions
The purpose of the current study was to determine Wohler fatigue curves for different type of trabecular structures. This study has identified clear trends for what concerns cells type and cell size effect while further investigation is still needed for what concerns the effect of the relative density. Overall, this study strengthens the idea that lattice structures are a valid resource to exploit in system and structures for aerospace use due to the lightweight, high specific structural performances and high thermal properties. In spite of its limitations, the study certainly adds to our understanding of the fatigue life prediction
6. Patents
In this paper a research work on fatigue life of trabecular structures have been performed. This work is part of the development of the patent of a novel anti-icing system for aircraft use [
3].
Author Contributions
Conceptualization, Carlo Giovanni Ferro; methodology, Carlo Giovanni Ferro; software, Carlo Giovanni Ferro and Sara Varetti; validation, Carlo Giovanni Ferro and Sara Varetti; formal analysis, Carlo Giovanni Ferro and Sara Varetti; investigation, Carlo Giovanni Ferro and Sara Varetti; resources, Paolo Maggiore; data curation, Sara Varetti; writing—original draft preparation, Carlo Giovanni Ferro; writing—review and editing, Sara Varetti; visualization, Paolo Maggiore; supervision, Paolo Maggiore; project administration, Paolo Maggiore; funding acquisition, Paolo Maggiore. All authors have read and agreed to the published version of the manuscript.
Funding
This research received no external funding.
Data Availability Statement
Conflicts of Interest
The authors declare no conflict of interest.
Appendix A
AlSi10Mg specimens for fatigue test with Bccz cell. The identification code of the specimens is: Celle shape - Cell size - Solid volume fraction (nominal) -Serial number.
Table A1.
BCC-Z Fatigue Results.
Table A1.
BCC-Z Fatigue Results.
| Id Code |
σM[MPa] |
σm[MPa] |
σa[MPa] |
N |
| Bccz-5-25-1 |
12.6 |
1.26 |
5.67 |
10178091 |
| Bccz-5-25-2 |
12.6 |
1.26 |
5.67 |
12441038 |
| Bccz-5-25-3 |
12.6 |
1.26 |
5.67 |
- |
| Bccz-5-25-4 |
9.4 |
0.94 |
4.23 |
15000000 |
| Bccz-5-25-5 |
9.4 |
0.94 |
4.23 |
15000000 |
| Bccz-5-25-6 |
9.4 |
0.94 |
4.23 |
- |
| Bccz-5-25-7 |
6.3 |
0.63 |
2.84 |
15000000 |
| Bccz-5-25-8 |
6.3 |
0.63 |
2.84 |
15000000 |
| Bccz-5-25-9 |
6.3 |
0.63 |
2.84 |
- |
| Bccz-5-25-10 |
3.1 |
0.31 |
1.40 |
15000000 |
| Bccz-5-25-11 |
3.1 |
0.31 |
1.40 |
15000000 |
| Bccz-5-25-12 |
3.1 |
0.31 |
1.40 |
- |
| Bccz-5-30-1 |
20.3 |
2.03 |
9.14 |
654563 |
| Bccz-5-30-2 |
20.3 |
2.03 |
9.14 |
762810 |
| Bccz-5-30-3 |
20.3 |
2.03 |
9.14 |
- |
| Bccz-5-30-4 |
15.2 |
1.52 |
6.84 |
15000000 |
| Bccz-5-30-5 |
15.2 |
1.52 |
6.84 |
15000000 |
| Bccz-5-30-6 |
15.2 |
1.52 |
6.84 |
- |
| Bccz-5-30-7 |
10.2 |
1.02 |
4.59 |
15000000 |
| Bccz-5-30-8 |
10.2 |
1.02 |
4.59 |
15000000 |
| Bccz-5-30-9 |
10.2 |
1.02 |
4.59 |
- |
| Bccz-5-30-10 |
5.1 |
0.51 |
2.30 |
15000000 |
| Bccz-5-30-11 |
5.1 |
0.51 |
2.30 |
15000000 |
| Bccz-5-30-12 |
5.1 |
0.51 |
2.30 |
- |
| Bccz-7-30-1 |
19.5 |
1.95 |
8.78 |
326837 |
| Bccz-7-30-2 |
19.5 |
1.95 |
8.78 |
440166 |
| Bccz-7-30-3 |
19.5 |
1.95 |
8.78 |
326161 |
| Bccz-7-30-4 |
14.6 |
1.46 |
6.57 |
3362847 |
| Bccz-7-30-5 |
14.6 |
1.46 |
6.57 |
3331678 |
| Bccz-7-30-6 |
14.6 |
1.46 |
6.57 |
2249586 |
| Bccz-7-30-7 |
9.8 |
0.98 |
4.41 |
15000000 |
| Bccz-7-30-8 |
9.8 |
0.98 |
4.41 |
15000000 |
| Bccz-7-30-9 |
9.8 |
0.98 |
4.41 |
15000000 |
| Bccz-7-30-10 |
4.9 |
0.49 |
2.21 |
15000000 |
| Bccz-7-30-11 |
4.9 |
0.49 |
2.21 |
15000000 |
| Bccz-7-30-12 |
4.9 |
0.49 |
2.21 |
15000000 |
AlSi10Mg specimens for fatigue test with Rhombic dodecahedron cell.
The identification code of the specimens is: Celle shape - Cell size - Solid volume
fraction (nominal) - Serial number.
Table A2.
Rhombic Dodecahedron Fatigue Results.
Table A2.
Rhombic Dodecahedron Fatigue Results.
| Id Code |
σM[MPa] |
σm[MPa] |
σa[MPa] |
N |
| Rhom-5-25-1 |
12.1 |
1.21 |
5.45 |
9044 |
| Rhom-5-25-2 |
12.1 |
1.21 |
5.45 |
6480 |
| Rhom-5-25-3 |
12.1 |
1.21 |
5.45 |
- |
| Rhom-5-25-4 |
9 |
0.9 |
4.05 |
45544 |
| Rhom-5-25-5 |
9 |
0.9 |
4.05 |
45031 |
| Rhom-5-25-6 |
9 |
0.9 |
4.05 |
- |
| Rhom-5-25-7 |
6 |
0.6 |
2.70 |
291522 |
| Rhom-5-25-8 |
6 |
0.6 |
2.70 |
274062 |
| Rhom-5-25-9 |
6 |
0.6 |
2.70 |
- |
| Rhom-5-25-10 |
3 |
0.3 |
1.35 |
15000000 |
| Rhom-5-25-11 |
3 |
0.3 |
1.35 |
15000000 |
| Rhom-5-25-12 |
3 |
0.3 |
1.35 |
- |
| Rhom-5-30-1 |
17.1 |
1.71 |
7.70 |
12100 |
| Rhom-5-30-2 |
17.1 |
1.71 |
7.70 |
10947 |
| Rhom-5-30-3 |
17.1 |
1.71 |
7.70 |
- |
| Rhom-5-30-4 |
12.8 |
1.28 |
5.76 |
47132 |
| Rhom-5-30-5 |
12.8 |
1.28 |
5.76 |
26329 |
| Rhom-5-30-6 |
12.8 |
1.28 |
5.76 |
- |
| Rhom-5-30-7 |
8.6 |
0.86 |
3.87 |
327084 |
| Rhom-5-30-8 |
8.6 |
0.86 |
3.87 |
307454 |
| Rhom-5-30-9 |
8.6 |
0.86 |
3.87 |
- |
| Rhom-5-30-10 |
4.3 |
0.43 |
1.94 |
15000000 |
| Rhom-5-30-11 |
4.3 |
0.43 |
1.94 |
3755825 |
| Rhom-5-30-12 |
4.3 |
0.43 |
1.94 |
- |
| Rhom-7-30-1 |
17.7 |
1.77 |
7.97 |
4281 |
| Rhom-7-30-2 |
17.7 |
1.77 |
7.97 |
3281 |
| Rhom-7-30-3 |
17.7 |
1.77 |
7.97 |
3970 |
| Rhom-7-30-4 |
13.3 |
1.33 |
5.99 |
14484 |
| Rhom-7-30-5 |
13.3 |
1.33 |
5.99 |
12010 |
| Rhom-7-30-6 |
13.3 |
1.33 |
5.99 |
10550 |
| Rhom-7-30-7 |
8.9 |
0.89 |
4.01 |
53097 |
| Rhom-7-30-8 |
8.9 |
0.89 |
4.01 |
46449 |
| Rhom-7-30-9 |
8.9 |
0.89 |
4.01 |
46723 |
| Rhom-7-30-10 |
4.4 |
0.44 |
1.98 |
1471143 |
| Rhom-7-30-11 |
4.4 |
0.44 |
1.98 |
2004674 |
| Rhom-7-30-12 |
4.4 |
0.44 |
1.98 |
- |
AlSi10Mg specimens for fatigue test with Octet-truss cell. The identification
code of the specimens is: Celle shape - Cell size - Solid volume fraction
(nominal) - Serial number.
Table A3.
Octet Truss Fatigue Results.
Table A3.
Octet Truss Fatigue Results.
| Id Code |
σM[MPa] |
σm[MPa] |
σa[MPa] |
N |
| Oct-5-25-1 |
18.5 |
1.85 |
8.33 |
18568 |
| Oct-5-25-2 |
18.5 |
1.85 |
8.33 |
36394 |
| Oct-5-25-3 |
18.5 |
1.85 |
8.33 |
- |
| Oct-5-25-4 |
13.9 |
1.39 |
6.26 |
128641 |
| Oct-5-25-5 |
13.9 |
1.39 |
6.26 |
151236 |
| Oct-5-25-6 |
13.9 |
1.39 |
6.26 |
- |
| Oct-5-25-7 |
9.3 |
0.93 |
4.19 |
971841 |
| Oct-5-25-8 |
9.3 |
0.93 |
4.19 |
1119612 |
| Oct-5-25-9 |
9.3 |
0.93 |
4.19 |
- |
| Oct-5-25-10 |
4.6 |
0.46 |
2.07 |
15000000 |
| Oct-5-25-11 |
4.6 |
0.46 |
2.07 |
15000000 |
| Oct-5-25-12 |
4.6 |
0.46 |
2.07 |
- |
| Oct-5-30-1 |
22.7 |
2.27 |
10.22 |
64099 |
| Oct-5-30-2 |
22.7 |
2.27 |
10.22 |
52684 |
| Oct-5-30-3 |
22.7 |
2.27 |
10.22 |
- |
| Oct-5-30-4 |
17 |
1.7 |
7.65 |
239878 |
| Oct-5-30-5 |
17 |
1.7 |
7.65 |
234151 |
| Oct-5-30-6 |
17 |
1.7 |
7.65 |
- |
| Oct-5-30-7 |
11.3 |
1.13 |
5.09 |
880174 |
| Oct-5-30-8 |
11.3 |
1.13 |
5.09 |
645908 |
| Oct-5-30-9 |
11.3 |
1.13 |
5.09 |
- |
| Oct-5-30-10 |
5.7 |
0.57 |
2.57 |
15000000 |
| Oct-5-30-11 |
5.7 |
0.57 |
2.57 |
15000000 |
| Oct-5-30-12 |
5.7 |
0.57 |
2.57 |
- |
| Oct-7-30-1 |
22.9 |
2.29 |
10.31 |
10607 |
| Oct-7-30-2 |
22.9 |
2.29 |
10.31 |
9009 |
| Oct-7-30-3 |
22.9 |
2.29 |
10.31 |
25343 |
| Oct-7-30-4 |
17.2 |
1.72 |
7.74 |
42201 |
| Oct-7-30-5 |
17.2 |
1.72 |
7.74 |
68178 |
| Oct-7-30-6 |
17.2 |
1.72 |
7.74 |
35084 |
| Oct-7-30-7 |
11.5 |
1.15 |
5.18 |
136536 |
| Oct-7-30-8 |
11.5 |
1.15 |
5.18 |
86464 |
| Oct-7-30-9 |
11.5 |
1.15 |
5.18 |
204722 |
| Oct-7-30-10 |
5.7 |
0.57 |
2.57 |
3108586 |
| Oct-7-30-11 |
5.7 |
0.57 |
2.57 |
- |
| Oct-7-30-12 |
5.7 |
0.57 |
2.57 |
- |
Appendix B
In this section are reported the quality analysis of the outcome provided by the fatigue experiments.
Figure A1.
Rhombic Dodecahedron Cells Statistical Analysis: (a) Normal probability Plot Max Load 80% σ02; (b) Main Effect Plot Max Load 80% σ02; (c) Normal probability Plot Max Load 60% σ02; (d) Main Effect Plot Max Load 60% σ02; (e) Normal probability Plot Max Load 40% σ02; (f) Main Effect Plot Max Load 40% σ02; (c) Normal probability Plot Max Load 20% σ02; (d) Main Effect Plot Max Load 20% σ02.
Figure A2.
Octet Truss Cells Statistical Analysis: (a) Normal probability Plot Max Load 80% σ02; (b) Main Effect Plot Max Load 80% σ02; (c) Normal probability Plot Max Load 60% σ02; (d) Main Effect Plot Max Load 60% σ02; (e) Normal probability Plot Max Load 40% σ02; (f) Main Effect Plot Max Load 40% σ02; (c) Normal probability Plot Max Load 20% σ02; (d) Main Effect Plot Max Load 20% σ02.
Figure A3.
Octet Truss Cells Statistical Analysis: (a) Normal probability Plot Max Load 80% σ02; (b) Main Effect Plot Max Load 80% σ02; (c) Normal probability Plot Max Load 60% σ02; (d) Main Effect Plot Max Load 60% σ02.
Figure A3.
Octet Truss Cells Statistical Analysis: (a) Normal probability Plot Max Load 80% σ02; (b) Main Effect Plot Max Load 80% σ02; (c) Normal probability Plot Max Load 60% σ02; (d) Main Effect Plot Max Load 60% σ02.
References
- C. Ferro, R. Grassi, C. Seclì, and P. Maggiore, “Additive Manufacturing Offers New Opportunities in UAV Research,” in Procedia CIRP, 2016, vol. 41. [CrossRef]
- C. G. Ferro et al., “Design and characterization of trabecular structures for an anti-icing sandwich panel produced by additive manufacturing,” J. Sandw. Struct. Mater., vol. 22, no. 4, 2020. [CrossRef]
- P. Maggiore, Fabio Vitti, C. G. Ferro, and Varetti Sara, “Thermal anti ice system integrated in the structure and method for its fabrication,” 102016000098196, 2016.
- G. Manogharan, “Analysis of Non-Stochastic Lattice Structure Design for Heat Exchanger,” 2009.
- T. Tancogne-Dejean, A. B. Spierings, and D. Mohr, “Additively-manufactured metallic micro-lattice materials for high specific energy absorption under static and dynamic loading,” Acta Mater., vol. 116, pp. 14–28, 2016. [CrossRef]
- L. Hao, D. Raymont, C. Yan, A. Hussein, and P. Young, “Design and additive manufacturing of cellular lattice structures,” Innov. Dev. Virtual Phys. Prototyp., no. May 2016, pp. 249–254, 2011. [CrossRef]
- A. Zargarian, M. Esfahanian, J. Kadkhodapour, S. Ziaei-Rad, and D. Zamani, “On the fatigue behavior of additive manufactured lattice structures,” Theor. Appl. Fract. Mech., vol. 100, 2019. [CrossRef]
- M. Benedetti, A. du Plessis, R. O. Ritchie, M. Dallago, S. M. J. Razavi, and F. Berto, “Architected cellular materials: A review on their mechanical properties towards fatigue-tolerant design and fabrication,” Materials Science and Engineering R: Reports, vol. 144. 2021. [CrossRef]
- A. Burr et al., “A numerical framework to predict the fatigue life of lattice structures built by additive manufacturing,” Int. J. Fatigue, vol. 139, 2020. [CrossRef]
- N. Agenbag and C. McDuling, “Fatigue Life Testing of Locally Additive Manufactured AlSilOMg Test Specimens,” R&D J., vol. 37, 2021. [CrossRef]
- A. Tommasi et al., “Influence of surface preparation and heat treatment on mechanical behavior of hybrid aluminum parts manufactured by a combination of laser powder bed fusion and conventional manufacturing processes,” Metals (Basel)., vol. 11, no. 3, 2021. [CrossRef]
- P. M. Carlo Giovanni Ferro, Sara Varetti, Fabio Vitti, “Thermal anti ice system integrated in the structure and method for its fabrication,” 102016000098196, 2016.
- C. Yan, L. Hao, A. Hussein, S. L. Bubb, P. Young, and D. Raymont, “Evaluation of light-weight AlSi10Mg periodic cellular lattice structures fabricated via direct metal laser sintering,” J. Mater. Process. Technol., vol. 214, no. 4, pp. 856–864, 2014. [CrossRef]
- Matteo Perello, “Numerical simulation and experimental validation of lattice structures for an innovative anti-ice leading edge.,” 2018.
- A. Hussein, L. Hao, C. Yan, R. Everson, and P. Young, “Advanced lattice support structures for metal additive manufacturing,” J. Mater. Process. Technol., vol. 213, no. 7, pp. 1019–1026, 2013. [CrossRef]
- T. Maconachie et al., “SLM lattice structures: Properties, performance, applications and challenges,” Materials and Design, vol. 183. 2019. [CrossRef]
- A. du Plessis et al., “Properties and applications of additively manufactured metallic cellular materials: A review,” Progress in Materials Science, vol. 125. 2022. [CrossRef]
- A. Seharing, A. H. Azman, and S. Abdullah, “A review on integration of lightweight gradient lattice structures in additive manufacturing parts,” Advances in Mechanical Engineering, vol. 12, no. 6. 2020. [CrossRef]
- D. Mahmoud and M. A. Elbestawi, “Lattice structures and functionally graded materials applications in additive manufacturing of orthopedic implants: A review,” Journal of Manufacturing and Materials Processing, vol. 1, no. 2. 2017. [CrossRef]
- M. Muhammad, P. D. Nezhadfar, S. Thompson, A. Saharan, N. Phan, and N. Shamsaei, “A comparative investigation on the microstructure and mechanical properties of additively manufactured aluminum alloys,” Int. J. Fatigue, vol. 146, 2021. [CrossRef]
- D. M. and F. C. Carlo Giovanni Ferro, Sara Varetti, Fabio Vitti, Paolo Maggiore, Mariangela Lombardi, Sara Biamino, Paolo Fino, “DESIGN AND CHARACTERIZATION OF TRABECULAR STRUCTURES FOR A NEW DE-ICING PANEL USING ADDITIVE MANUFACTURING.”.
- C. Zilio and L. Patricelli, “Aircraft anti-ice system: Evaluation of system performance with a new time dependent mathematical model,” Appl. Therm. Eng., vol. 63, no. 1, 2014. [CrossRef]
- D. C. Montgomery, “Design and analysis of experiments.” Jojn Wiley & sons, INC, Arizona, p. 684.
- D. Lambert and M. Adler, “IN718 Additive Manufacturing Properties and Influences,” Addit. Manuf. Consort. Meet., no. June, 2014.
- K. Y. G. McCullough, N. A. Fleck, and M. F. Ashby, “Stress-life fatigue behaviour of aluminum alloy foams,” Fatigue Fract. Eng. Mater. Struct., vol. 23, no. 3, 2000. [CrossRef]
- S. Zhao, S. J. Li, W. T. Hou, Y. L. Hao, R. Yang, and R. D. K. Misra, “The influence of cell morphology on the compressive fatigue behavior of Ti-6Al-4V meshes fabricated by electron beam melting,” J. Mech. Behav. Biomed. Mater., vol. 59, pp. 251–264, 2016. [CrossRef]
- M. DanZenkert, “Tension, compression and shear fatigue of a closed cell polymer foam,” Compos. Sci. Technol., vol. 69, no. 6, pp. 785–792, 2009.
- Y. Z. H. G. D. A.Lados, “Microstructure, static properties, and fatigue crack growth mechanisms in Ti-6Al-4V fabricated by additive manufacturing: LENS and EBM,” Eng. Fail. Anal., vol. 69, pp. 3–14, 2016.
- Y. Li, M. Pavier, and H. Coules, “Compressive fatigue characteristics of octet-truss lattices in different orientations,” Mech. Adv. Mater. Struct., vol. 29, no. 27, pp. 6390–6402, 2022. [CrossRef]
- Y. Li, M. Pavier, and H. Coules, “Experimental study on fatigue crack propagation of octet-truss lattice,” in Procedia Structural Integrity, 2021, vol. 37, no. C. [CrossRef]
- M. F. Ashby, “The properties of foams and lattices,” Philos. Trans. R. Soc. A Math. Phys. Eng. Sci., vol. 364, no. 1838, pp. 15–30, 2006. [CrossRef]
|
Disclaimer/Publisher’s Note: The statements, opinions and data contained in all publications are solely those of the individual author(s) and contributor(s) and not of MDPI and/or the editor(s). MDPI and/or the editor(s) disclaim responsibility for any injury to people or property resulting from any ideas, methods, instructions or products referred to in the content. |
© 2023 by the authors. Licensee MDPI, Basel, Switzerland. This article is an open access article distributed under the terms and conditions of the Creative Commons Attribution (CC BY) license (http://creativecommons.org/licenses/by/4.0/).
